Embed Size (px)
Citation preview
2019-2020 [CLASS OF 2020 CAREER OUTCOMES REPORT]
1
2019-2020
Class of 2020 Career Outcomes
Report

2019-2020 [CLASS OF 2020 CAREER OUTCOMES REPORT]
University of Arkansas | Career Development Center 2
Table of Contents
Contact Information ........................................................................................... 3
Introduction and Methodology ........................................................................... 4
Data Compilations ............................................................................................................................................ 4
Class of 2020 Summary ....................................................................................... 6
Student Career Outcomes by Degrees and Schools ............................................. 6
Knowledge Rates (KR) and Career Outcome Rates (COR) by School and Degree .. 7
In-State Placement, KR and COR by Graduate’s Residency Status ....................... 7
Placement Locations for U of A Class of 2020 Graduates ..................................... 8
Salary Statistics ................................................................................................... 8
Overall Reported Full-time Salary Statistics .......................................................................................... 8
Selected Undergraduate Salary Means and Medians .......................................................................... 8
Continuing Education Fields .............................................................................. 10
Career Outcomes for Different Student Affiliation Groups ................................ 10
KR and COR by Undergraduate Student Ethnicity & Affiliation Groups .................................. 10
KR and COR by Graduate Student Ethnicity & Affiliation Groups ............................................... 11
Program Data for Bachelors’ Degrees Recipients .............................................. 12
Program Data for Masters’ Degrees Recipients ................................................. 16
Program Data for Advanced Certificate Recipients ............................................ 19
Program Data for Doctoral Degree Recipients ................................................... 20
Appendix A ....................................................................................................... 23
Table 1. Undergraduate Survey Response by Student Ethnicity ............................................ 23
Table 2. Undergraduate Survey Response by Student Groups ............................................... 23
Table 3. Graduate Survey Response by Student Ethnicity ........................................................ 24
Table 4. Graduate Survey Response by Student Groups ............................................................ 24
Appendix B ....................................................................................................... 25
Top Schools and Number of Enrolled U of A Class of 2020 Members ....................................... 25
Appendix C ....................................................................................................... 27
Top Employers and Numbers of Hired Class of 2020 Members ................................................. 27
2019-2020 [CLASS OF 2020 CAREER OUTCOMES REPORT]
University of Arkansas | Career Development Center 3
Contact Information
Contacts for further information:
Dr. Angela Williams, Executive Director
Assistant Vice Chancellor for Career Services
University of Arkansas Career Development Center
Arkansas Union Office 607
Phone 479.575.7363
Fax 479.575.6742
Dr. Kuatbay Bektemirov, Career Data Analyst
University of Arkansas Career Development Center
Arkansas Union Office 607
Phone 479.575.7363
2019-2020 [CLASS OF 2020 CAREER OUTCOMES REPORT]
University of Arkansas | Career Development Center 4
Introduction and Methodology
The University of Arkansas Career Outcomes Report series provide insight into the post-graduation pursuits of recent university graduates. These annual reports constitute the only centralized placement data collection for the university and serve as a resource for career planning for current and prospective students, used by colleges/schools, departments, employers and other stakeholders. These data are also reported to various organizations that rank colleges, such as US News and World Report, the College Portrait of Undergraduate Education/Voluntary System of Accountability, National Association of Colleges and Employers (NACE), Princeton Review survey, Peterson’s Undergraduate survey, College Board Survey, and a few others.
University of Arkansas (U of A) measures the career/post-graduation outcomes for its each graduating class through first-destination surveys (FDS). U of A Class of 2020 includes those students who graduated in August 2019, December 2019 and May 2020. The post-graduation outcomes data collection is managed by the University Career Development Center (CDC) following the procedures outlined in the NACE Standards and Protocols for Undergraduate First Destination Surveys and the NACE Standards and Protocols for the Collection and Dissemination of Graduating Student Initial Career Outcome Information for Advanced Degree Candidates. College of Engineering (ENGR) and the School of Law (LAW) used their own surveys in addition to FDS and collected ENGR data was reported to the CDC.
Data collection on student career outcomes takes place from the date of graduation until six months after the end of the class year. A few weeks prior to the graduation date all graduating students receive an invitation from the CDC to participate in the online FDS with a secure no-login required link. Graduating students can access the FDS on Handshake platform multiple times during the data collection period to ensure the most accurate, current data is captured. Students responding to FDS are the primary source of information for career outcomes report prepared by CDC. However, NACE standards also allows for collecting information from a variety of alternative sources (the graduates’ LinkedIn profiles, social media, parents, employers, faculty, staff and, etc.). Additionally, the CDC staff surveyed the December’19 graduating students during the Graduation Salute event at U of A Bookstore, “non-respondent” and “still looking” graduates were contacted by CDC staff, volunteers and National Phone Campaign callers via phone later after graduation.
The deadline for completing data collection for the Class of 2020 was December 30, 2020.
Data Compilations
Summary calculations were developed from the data, as follows:
Knowledge Rate (KR) - This is the percentage of the graduating class for whom an outcome destination is known. It includes the sum of all the employment categories plus service and military plus continuing education plus the number of students still seeking an outcome or not seeking an outcome. It excludes those students for whom no information is available. Mathematically, the knowledge rate can be expressed as:
2019-2020 [CLASS OF 2020 CAREER OUTCOMES REPORT]
University of Arkansas | Career Development Center 5
(# employed + # service + # military + # continuing education + # still seeking employment and continuing education + # not seeking)/total graduates.1
Career Outcome Rate (COR) - This is the number of graduates who have landed in any of the employment categories plus service and military plus continuing education divided by the number of students for whom an outcome is known minus those graduates identified as not seeking an outcome. Expressed mathematically, the career outcomes rate is:
(# employed + # service + # military + # continuing education)/(# employed + # service + # military + # continuing education + # still seeking employment and continuing education)
Additional rates, such as the percentage of graduates in standard full-time employment, were created by taking the number of graduates in a specific category and then dividing by the number of known graduates as identified in the knowledge rate above.
Working - consists of those accepted full time employment or part-time employment.
Continuing Education - those continuing education at graduate or professional schools.
Still Looking - consists of those seeking employment or seeking continuing education or planning to continue education but not enrolled yet.
Not Seeking - consists of those not seeking employment or graduate school acceptance, have other plans after graduation.
1 Detailed methodology of calculations can be seen in NACE, pages 117 - 119.
2019-2020 [CLASS OF 2020 CAREER OUTCOMES REPORT]
University of Arkansas | Career Development Center 6
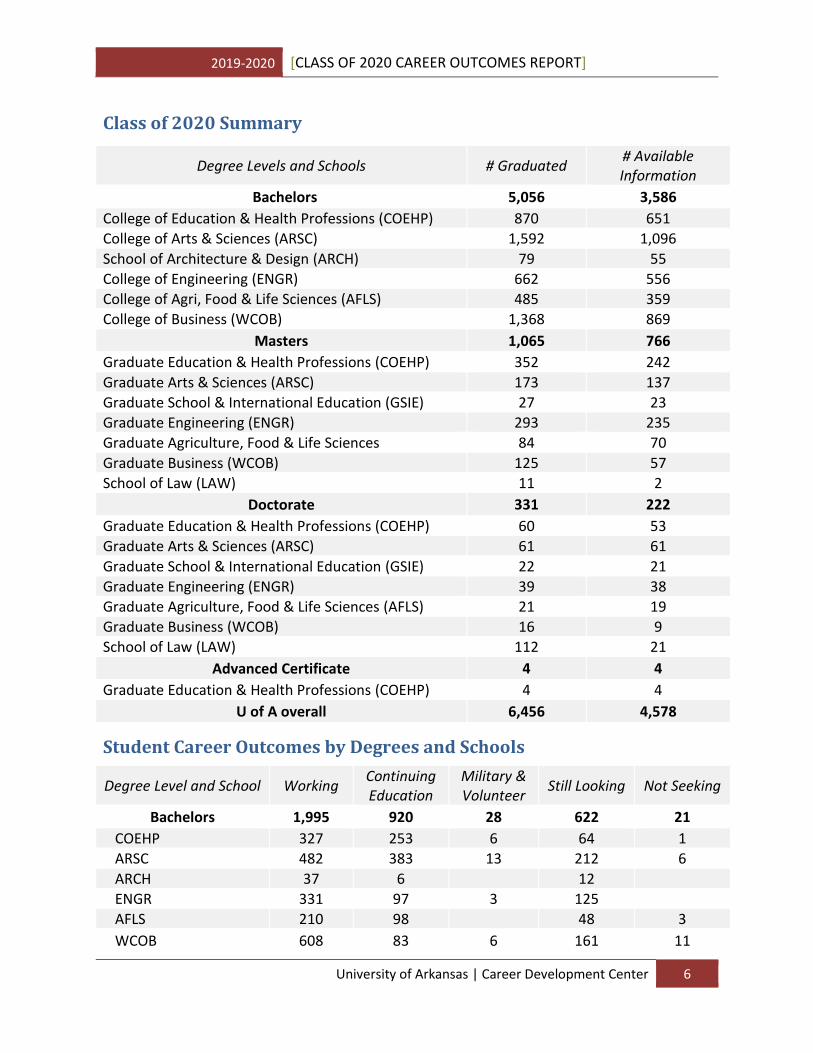
Class of 2020 Summary
Degree Levels and Schools # Graduated # Available Information
Bachelors 5,056 3,586
College of Education & Health Professions (COEHP) 870 651
College of Arts & Sciences (ARSC) 1,592 1,096
School of Architecture & Design (ARCH) 79 55
College of Engineering (ENGR) 662 556
College of Agri, Food & Life Sciences (AFLS) 485 359
College of Business (WCOB) 1,368 869
Masters 1,065 766
Graduate Education & Health Professions (COEHP) 352 242
Graduate Arts & Sciences (ARSC) 173 137
Graduate School & International Education (GSIE) 27 23
Graduate Engineering (ENGR) 293 235
Graduate Agriculture, Food & Life Sciences 84 70
Graduate Business (WCOB) 125 57
School of Law (LAW) 11 2
Doctorate 331 222
Graduate Education & Health Professions (COEHP) 60 53
Graduate Arts & Sciences (ARSC) 61 61
Graduate School & International Education (GSIE) 22 21
Graduate Engineering (ENGR) 39 38
Graduate Agriculture, Food & Life Sciences (AFLS) 21 19
Graduate Business (WCOB) 16 9
School of Law (LAW) 112 21
Advanced Certificate 4 4
Graduate Education & Health Professions (COEHP) 4 4
U of A overall 6,456 4,578
Student Career Outcomes by Degrees and Schools
Degree Level and School Working Continuing Education
Military & Volunteer
Still Looking Not Seeking
Bachelors 1,995 920 28 622 21
COEHP 327 253 6 64 1
ARSC 482 383 13 212 6
ARCH 37 6 12
ENGR 331 97 3 125
AFLS 210 98 48 3
WCOB 608 83 6 161 11
2019-2020 [CLASS OF 2020 CAREER OUTCOMES REPORT]
University of Arkansas | Career Development Center 7
Degree Level and School Working Continuing Education
Military & Volunteer
Still Looking Not Seeking
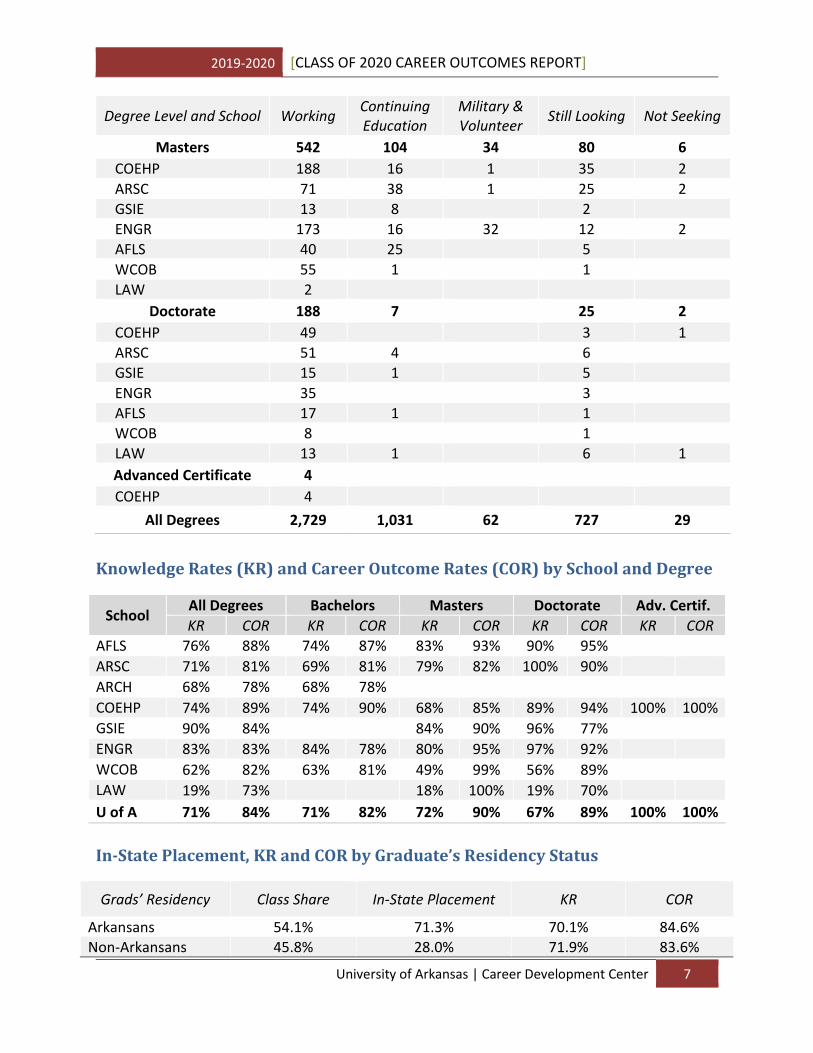
Masters 542 104 34 80 6
COEHP 188 16 1 35 2
ARSC 71 38 1 25 2
GSIE 13 8 2
ENGR 173 16 32 12 2
AFLS 40 25 5
WCOB 55 1 1
LAW 2
Doctorate 188 7 25 2
COEHP 49 3 1
ARSC 51 4 6
GSIE 15 1 5
ENGR 35 3
AFLS 17 1 1
WCOB 8 1
LAW 13 1 6 1
Advanced Certificate 4
COEHP 4
All Degrees 2,729 1,031 62 727 29
Knowledge Rates (KR) and Career Outcome Rates (COR) by School and Degree
School All Degrees Bachelors Masters Doctorate Adv. Certif.
KR COR KR COR KR COR KR COR KR COR
AFLS 76% 88% 74% 87% 83% 93% 90% 95%
ARSC 71% 81% 69% 81% 79% 82% 100% 90%
ARCH 68% 78% 68% 78%
COEHP 74% 89% 74% 90% 68% 85% 89% 94% 100% 100%
GSIE 90% 84% 84% 90% 96% 77%
ENGR 83% 83% 84% 78% 80% 95% 97% 92%
WCOB 62% 82% 63% 81% 49% 99% 56% 89%
LAW 19% 73% 18% 100% 19% 70%
U of A 71% 84% 71% 82% 72% 90% 67% 89% 100% 100%
In-State Placement, KR and COR by Graduate’s Residency Status
Grads’ Residency Class Share In-State Placement KR COR
Arkansans 54.1% 71.3% 70.1% 84.6% Non-Arkansans 45.8% 28.0% 71.9% 83.6%
2019-2020 [CLASS OF 2020 CAREER OUTCOMES REPORT]
University of Arkansas | Career Development Center 8
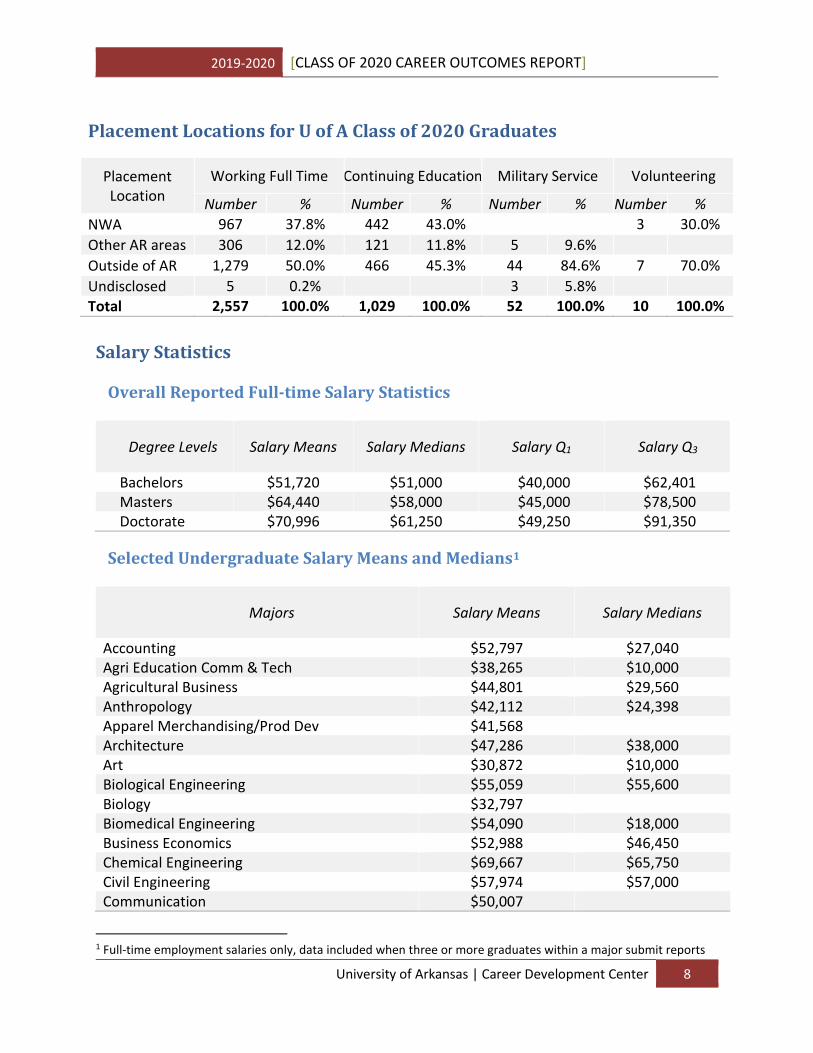
Placement Locations for U of A Class of 2020 Graduates
Placement Location
Working Full Time Continuing Education Military Service Volunteering
Number % Number % Number % Number %
NWA 967 37.8% 442 43.0% 3 30.0%
Other AR areas 306 12.0% 121 11.8% 5 9.6%
Outside of AR 1,279 50.0% 466 45.3% 44 84.6% 7 70.0%
Undisclosed 5 0.2% 3 5.8%
Total 2,557 100.0% 1,029 100.0% 52 100.0% 10 100.0%
Salary Statistics
Overall Reported Full-time Salary Statistics
Degree Levels Salary Means Salary Medians Salary Q1 Salary Q3
Bachelors $51,720 $51,000 $40,000 $62,401 Masters $64,440 $58,000 $45,000 $78,500 Doctorate $70,996 $61,250 $49,250 $91,350
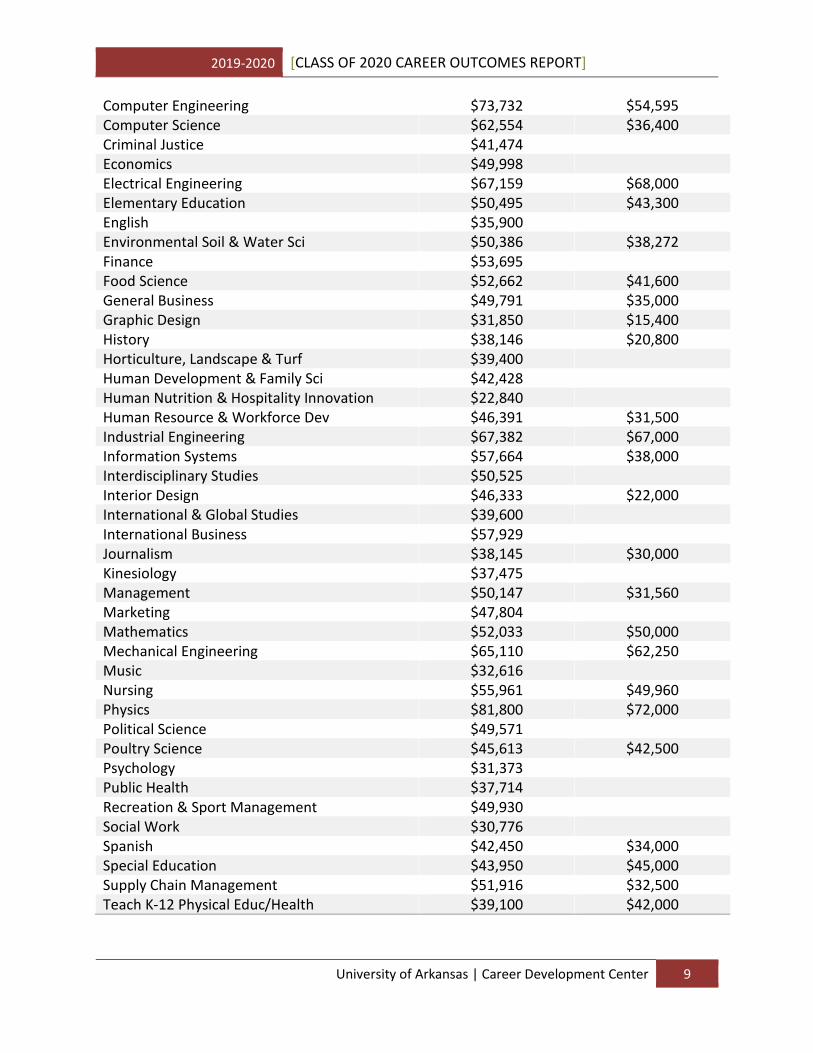
Selected Undergraduate Salary Means and Medians1
Majors Salary Means Salary Medians
Accounting $52,797 $27,040 Agri Education Comm & Tech $38,265 $10,000 Agricultural Business $44,801 $29,560 Anthropology $42,112 $24,398 Apparel Merchandising/Prod Dev $41,568 Architecture $47,286 $38,000 Art $30,872 $10,000 Biological Engineering $55,059 $55,600 Biology $32,797 Biomedical Engineering $54,090 $18,000 Business Economics $52,988 $46,450 Chemical Engineering $69,667 $65,750 Civil Engineering $57,974 $57,000 Communication $50,007
1 Full-time employment salaries only, data included when three or more graduates within a major submit reports
2019-2020 [CLASS OF 2020 CAREER OUTCOMES REPORT]
University of Arkansas | Career Development Center 9
Computer Engineering $73,732 $54,595 Computer Science $62,554 $36,400 Criminal Justice $41,474 Economics $49,998 Electrical Engineering $67,159 $68,000 Elementary Education $50,495 $43,300 English $35,900 Environmental Soil & Water Sci $50,386 $38,272 Finance $53,695 Food Science $52,662 $41,600 General Business $49,791 $35,000 Graphic Design $31,850 $15,400 History $38,146 $20,800 Horticulture, Landscape & Turf $39,400 Human Development & Family Sci $42,428 Human Nutrition & Hospitality Innovation $22,840 Human Resource & Workforce Dev $46,391 $31,500 Industrial Engineering $67,382 $67,000 Information Systems $57,664 $38,000 Interdisciplinary Studies $50,525 Interior Design $46,333 $22,000 International & Global Studies $39,600 International Business $57,929 Journalism $38,145 $30,000 Kinesiology $37,475 Management $50,147 $31,560 Marketing $47,804 Mathematics $52,033 $50,000 Mechanical Engineering $65,110 $62,250 Music $32,616 Nursing $55,961 $49,960 Physics $81,800 $72,000 Political Science $49,571 Poultry Science $45,613 $42,500 Psychology $31,373 Public Health $37,714 Recreation & Sport Management $49,930 Social Work $30,776 Spanish $42,450 $34,000 Special Education $43,950 $45,000 Supply Chain Management $51,916 $32,500 Teach K-12 Physical Educ/Health $39,100 $42,000
2019-2020 [CLASS OF 2020 CAREER OUTCOMES REPORT]
University of Arkansas | Career Development Center 10
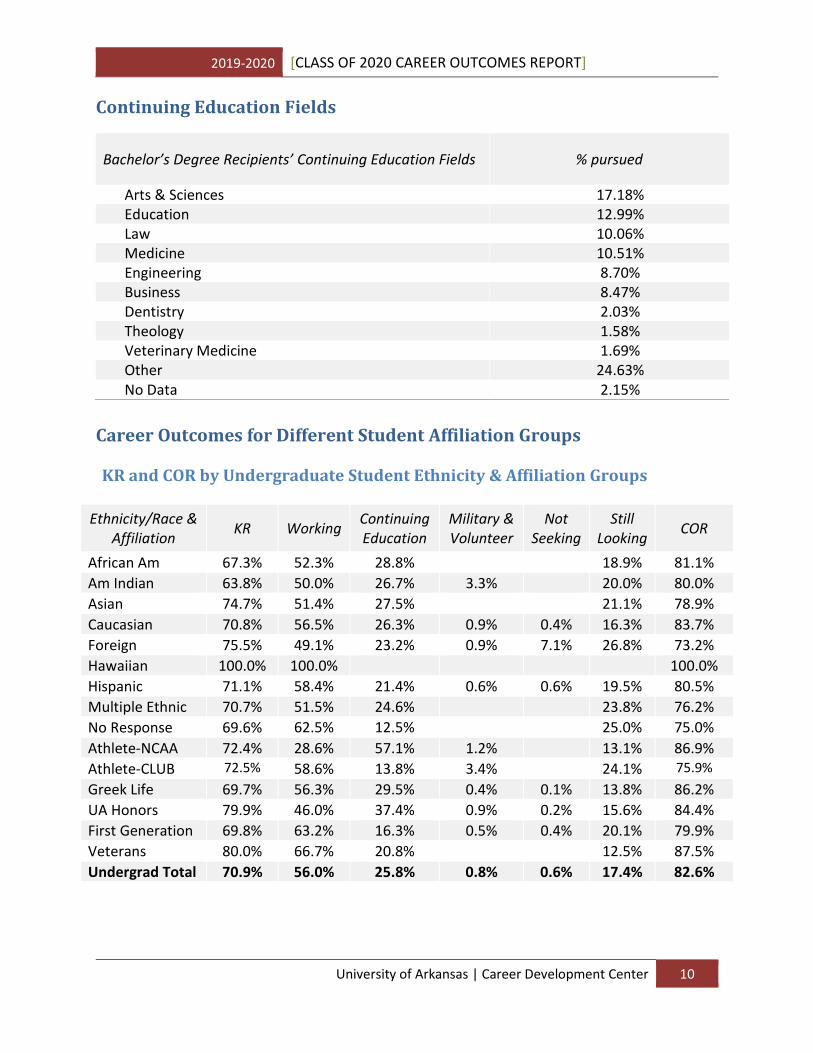
Continuing Education Fields
Bachelor’s Degree Recipients’ Continuing Education Fields % pursued
Arts & Sciences 17.18% Education 12.99% Law 10.06% Medicine 10.51% Engineering 8.70% Business 8.47% Dentistry 2.03% Theology 1.58% Veterinary Medicine 1.69% Other 24.63% No Data 2.15%
Career Outcomes for Different Student Affiliation Groups
KR and COR by Undergraduate Student Ethnicity & Affiliation Groups
Ethnicity/Race & Affiliation
KR Working Continuing Education
Military & Volunteer
Not Seeking
Still Looking
COR
African Am 67.3% 52.3% 28.8% 18.9% 81.1%
Am Indian 63.8% 50.0% 26.7% 3.3% 20.0% 80.0%
Asian 74.7% 51.4% 27.5% 21.1% 78.9%
Caucasian 70.8% 56.5% 26.3% 0.9% 0.4% 16.3% 83.7%
Foreign 75.5% 49.1% 23.2% 0.9% 7.1% 26.8% 73.2%
Hawaiian 100.0% 100.0% 100.0%
Hispanic 71.1% 58.4% 21.4% 0.6% 0.6% 19.5% 80.5%
Multiple Ethnic 70.7% 51.5% 24.6% 23.8% 76.2%
No Response 69.6% 62.5% 12.5% 25.0% 75.0%
Athlete-NCAA 72.4% 28.6% 57.1% 1.2% 13.1% 86.9%
Athlete-CLUB 72.5% 58.6% 13.8% 3.4% 24.1% 75.9%
Greek Life 69.7% 56.3% 29.5% 0.4% 0.1% 13.8% 86.2%
UA Honors 79.9% 46.0% 37.4% 0.9% 0.2% 15.6% 84.4%
First Generation 69.8% 63.2% 16.3% 0.5% 0.4% 20.1% 79.9%
Veterans 80.0% 66.7% 20.8% 12.5% 87.5%
Undergrad Total 70.9% 56.0% 25.8% 0.8% 0.6% 17.4% 82.6%

2019-2020 [CLASS OF 2020 CAREER OUTCOMES REPORT]
University of Arkansas | Career Development Center 11
KR and COR by Graduate Student Ethnicity & Affiliation Groups
Ethnicity/Race & Affiliation
KR Working Continuing Education
Military & Volunteer
Not Seeking
Still Looking
COR
African Am 71.6% 88.5% 3.8% 1.9% 7.7% 92.3% Am Indian 60.0% 88.9% 11.1% 88.9% Asian 57.7% 66.7% 20.0% 6.7% 6.7% 93.3% Caucasian 67.6% 74.0% 10.6% 4.6% 0.6% 10.8% 89.2% Foreign 88.7% 75.4% 15.8% 1.2% 8.8% 91.2% Hawaiian 100.0% 100.0% 100.0% Hispanic 74.7% 66.1% 14.3% 3.6% 16.1% 83.9%
Multiple Ethnic 62.1% 82.4% 5.9% 17.6% 82.4% Race Unknown 50.0% 100.0% 100.0% No Response 75.0% 66.7% 8.3% 8.3% 16.7% 66.7% Athlete-NACE 61.1% 80.0% 10.0% 10.0% 10.0% 90.0% Athlete-CLUB 87.1% 96.3% 3.7% 96.3% First Generation 70.0% 82.2% 6.7% 1.1% 11.1% 88.9% Greeks 56.4% 84.3% 7.2% 1.2% 8.4% 91.6% Veterans 56.4% 84.3% 7.2% 1.2% 8.4% 91.6% Graduate Total 70.9% 74.6% 11.3% 3.5% 0.8% 10.7% 89.3%
2019-2020 [CLASS OF 2020 CAREER OUTCOMES REPORT]
University of Arkansas | Career Development Center 12
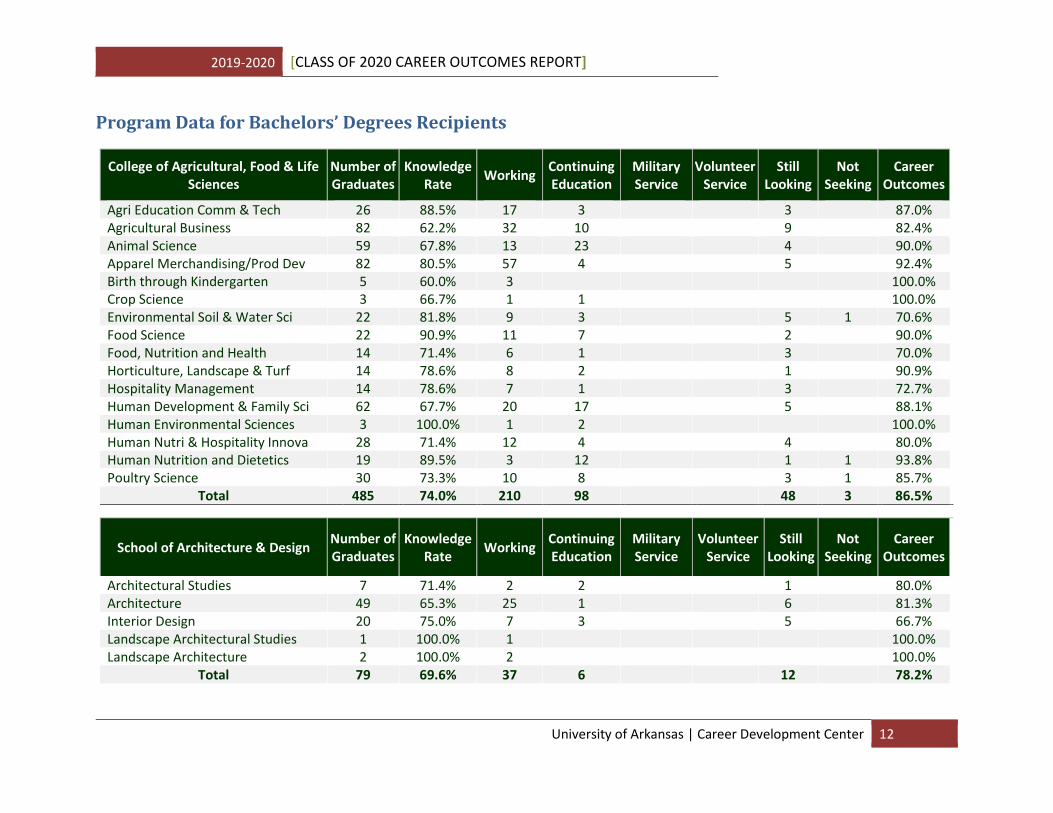
Program Data for Bachelors’ Degrees Recipients
College of Agricultural, Food & Life Sciences
Number of Graduates
Knowledge Rate
Working Continuing Education
Military Service
Volunteer Service
Still Looking
Not Seeking
Career Outcomes
Agri Education Comm & Tech 26 88.5% 17 3 3 87.0% Agricultural Business 82 62.2% 32 10 9 82.4% Animal Science 59 67.8% 13 23 4
90.0%
Apparel Merchandising/Prod Dev 82 80.5% 57 4 5
92.4% Birth through Kindergarten 5 60.0% 3
100.0%
Crop Science 3 66.7% 1 1
100.0% Environmental Soil & Water Sci 22 81.8% 9 3 5 1 70.6% Food Science 22 90.9% 11 7 2
90.0%
Food, Nutrition and Health 14 71.4% 6 1 3
70.0% Horticulture, Landscape & Turf 14 78.6% 8 2 1 90.9% Hospitality Management 14 78.6% 7 1 3 72.7% Human Development & Family Sci 62 67.7% 20 17 5 88.1% Human Environmental Sciences 3 100.0% 1 2 100.0% Human Nutri & Hospitality Innova 28 71.4% 12 4 4 80.0% Human Nutrition and Dietetics 19 89.5% 3 12 1 1 93.8% Poultry Science 30 73.3% 10 8 3 1 85.7%
Total 485 74.0% 210 98 48 3 86.5%
School of Architecture & Design Number of Graduates
Knowledge Rate
Working Continuing Education
Military Service
Volunteer Service
Still Looking
Not Seeking
Career Outcomes
Architectural Studies 7 71.4% 2 2
1
80.0% Architecture 49 65.3% 25 1 6
81.3%
Interior Design 20 75.0% 7 3 5 66.7% Landscape Architectural Studies 1 100.0% 1 100.0% Landscape Architecture 2 100.0% 2 100.0%
Total 79 69.6% 37 6
12
78.2%
2019-2020 [CLASS OF 2020 CAREER OUTCOMES REPORT]
University of Arkansas | Career Development Center 13
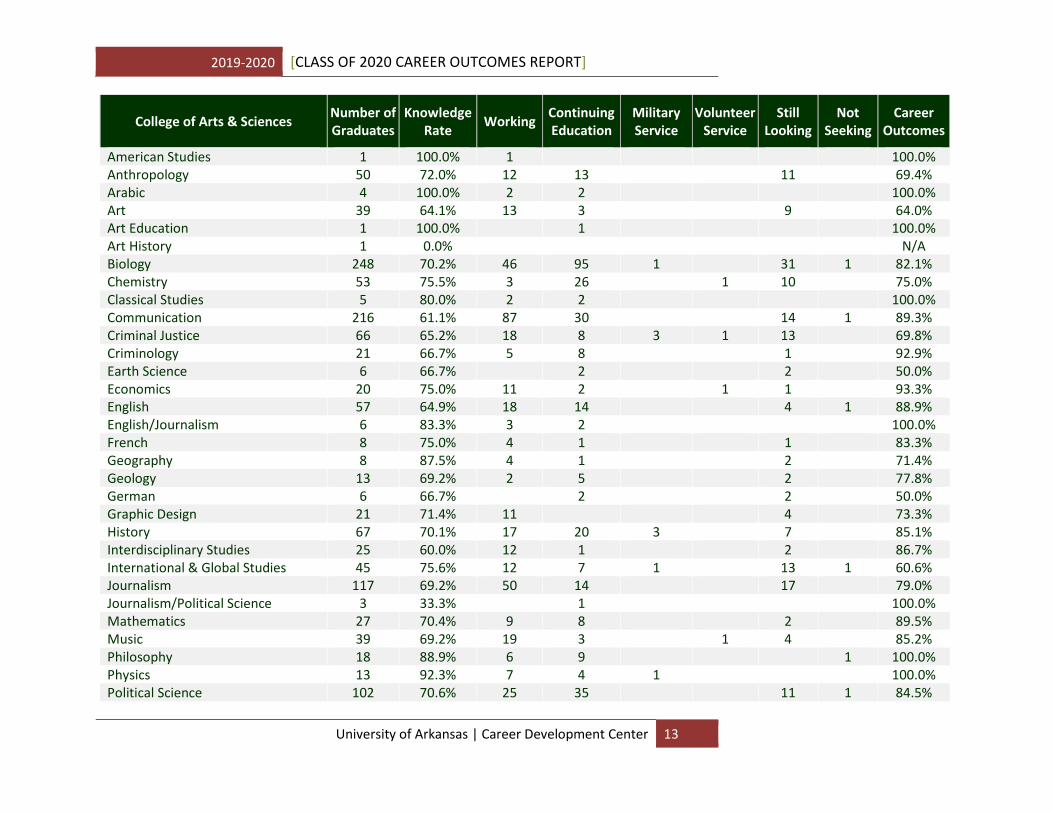
College of Arts & Sciences Number of Graduates
Knowledge Rate
Working Continuing Education
Military Service
Volunteer Service
Still Looking
Not Seeking
Career Outcomes
American Studies 1 100.0% 1 100.0% Anthropology 50 72.0% 12 13
11
69.4%
Arabic 4 100.0% 2 2
100.0% Art 39 64.1% 13 3 9
64.0%
Art Education 1 100.0%
1
100.0% Art History 1 0.0%
N/A
Biology 248 70.2% 46 95 1 31 1 82.1% Chemistry 53 75.5% 3 26
1 10
75.0%
Classical Studies 5 80.0% 2 2
100.0% Communication 216 61.1% 87 30 14 1 89.3% Criminal Justice 66 65.2% 18 8 3 1 13 69.8% Criminology 21 66.7% 5 8
1
92.9%
Earth Science 6 66.7%
2 2 50.0% Economics 20 75.0% 11 2 1 1
93.3%
English 57 64.9% 18 14
4 1 88.9% English/Journalism 6 83.3% 3 2
100.0%
French 8 75.0% 4 1 1 83.3% Geography 8 87.5% 4 1
2
71.4%
Geology 13 69.2% 2 5
2 77.8% German 6 66.7%
2
2 50.0%
Graphic Design 21 71.4% 11
4 73.3% History 67 70.1% 17 20 3 7
85.1%
Interdisciplinary Studies 25 60.0% 12 1 2 86.7% International & Global Studies 45 75.6% 12 7 1 13 1 60.6% Journalism 117 69.2% 50 14 17 79.0% Journalism/Political Science 3 33.3%
1
100.0%
Mathematics 27 70.4% 9 8 2
89.5% Music 39 69.2% 19 3
1 4
85.2%
Philosophy 18 88.9% 6 9
1 100.0% Physics 13 92.3% 7 4 1
100.0%
Political Science 102 70.6% 25 35 11 1 84.5%
2019-2020 [CLASS OF 2020 CAREER OUTCOMES REPORT]
University of Arkansas | Career Development Center 14
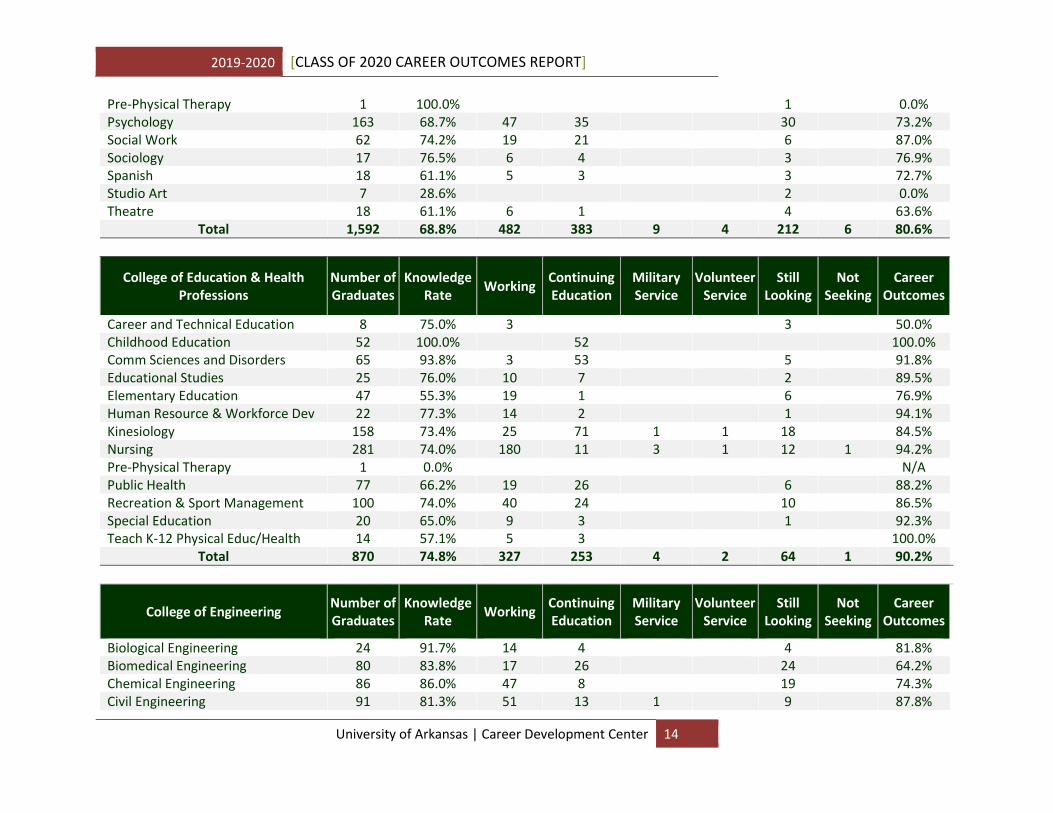
Pre-Physical Therapy 1 100.0%
1 0.0% Psychology 163 68.7% 47 35
30
73.2%
Social Work 62 74.2% 19 21 6 87.0% Sociology 17 76.5% 6 4 3 76.9% Spanish 18 61.1% 5 3 3 72.7% Studio Art 7 28.6% 2 0.0% Theatre 18 61.1% 6 1 4 63.6%
Total 1,592 68.8% 482 383 9 4 212 6 80.6%
College of Education & Health Professions
Number of Graduates
Knowledge Rate
Working Continuing Education
Military Service
Volunteer Service
Still Looking
Not Seeking
Career Outcomes
Career and Technical Education 8 75.0% 3
3 50.0% Childhood Education 52 100.0%
52
100.0%
Comm Sciences and Disorders 65 93.8% 3 53 5 91.8% Educational Studies 25 76.0% 10 7 2 89.5% Elementary Education 47 55.3% 19 1
6
76.9%
Human Resource & Workforce Dev 22 77.3% 14 2 1 94.1% Kinesiology 158 73.4% 25 71 1 1 18 84.5% Nursing 281 74.0% 180 11 3 1 12 1 94.2% Pre-Physical Therapy 1 0.0%
N/A
Public Health 77 66.2% 19 26 6
88.2% Recreation & Sport Management 100 74.0% 40 24 10 86.5% Special Education 20 65.0% 9 3 1 92.3% Teach K-12 Physical Educ/Health 14 57.1% 5 3
100.0%
Total 870 74.8% 327 253 4 2 64 1 90.2%
College of Engineering Number of Graduates
Knowledge Rate
Working Continuing Education
Military Service
Volunteer Service
Still Looking
Not Seeking
Career Outcomes
Biological Engineering 24 91.7% 14 4 4
81.8% Biomedical Engineering 80 83.8% 17 26 24
64.2%
Chemical Engineering 86 86.0% 47 8 19 74.3% Civil Engineering 91 81.3% 51 13 1
9 87.8%
2019-2020 [CLASS OF 2020 CAREER OUTCOMES REPORT]
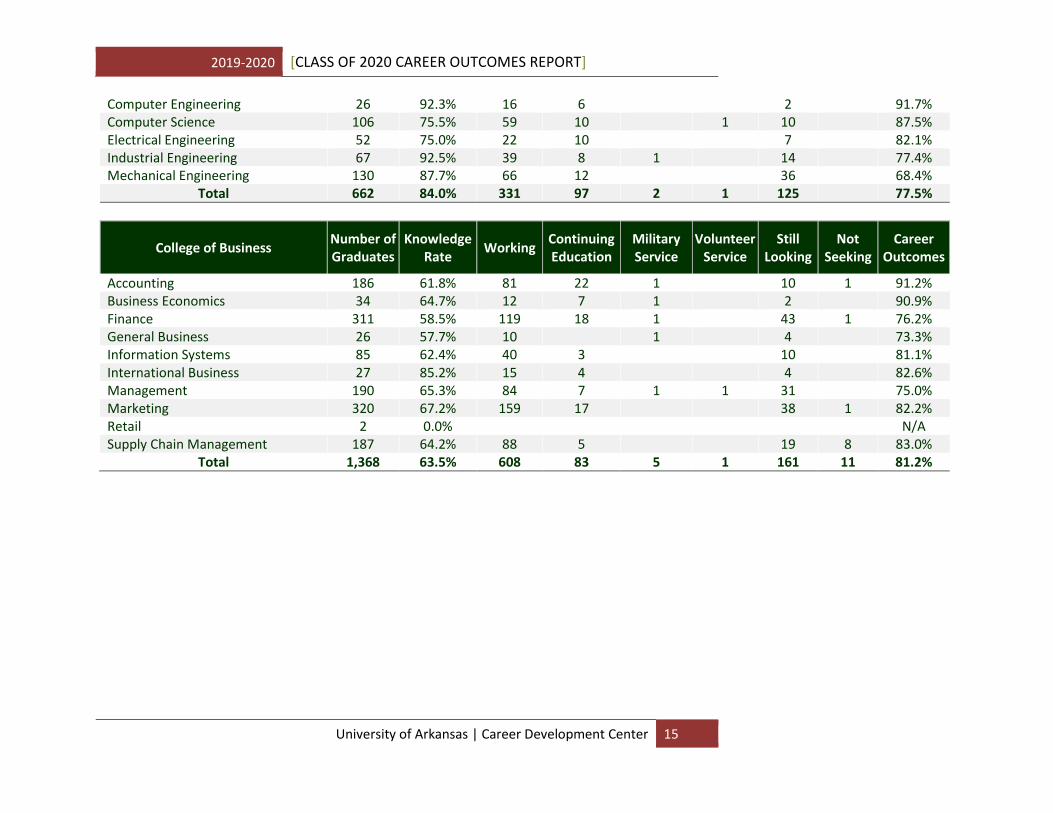
University of Arkansas | Career Development Center 15
Computer Engineering 26 92.3% 16 6 2 91.7% Computer Science 106 75.5% 59 10 1 10 87.5% Electrical Engineering 52 75.0% 22 10 7 82.1% Industrial Engineering 67 92.5% 39 8 1 14 77.4% Mechanical Engineering 130 87.7% 66 12
36 68.4%
Total 662 84.0% 331 97 2 1 125
77.5%
College of Business Number of Graduates
Knowledge Rate
Working Continuing Education
Military Service
Volunteer Service
Still Looking
Not Seeking
Career Outcomes
Accounting 186 61.8% 81 22 1 10 1 91.2% Business Economics 34 64.7% 12 7 1 2 90.9% Finance 311 58.5% 119 18 1 43 1 76.2% General Business 26 57.7% 10 1 4 73.3% Information Systems 85 62.4% 40 3 10 81.1% International Business 27 85.2% 15 4 4 82.6% Management 190 65.3% 84 7 1 1 31 75.0% Marketing 320 67.2% 159 17 38 1 82.2% Retail 2 0.0% N/A Supply Chain Management 187 64.2% 88 5 19 8 83.0%
Total 1,368 63.5% 608 83 5 1 161 11 81.2%
2019-2020 [CLASS OF 2020 CAREER OUTCOMES REPORT]
University of Arkansas | Career Development Center 16
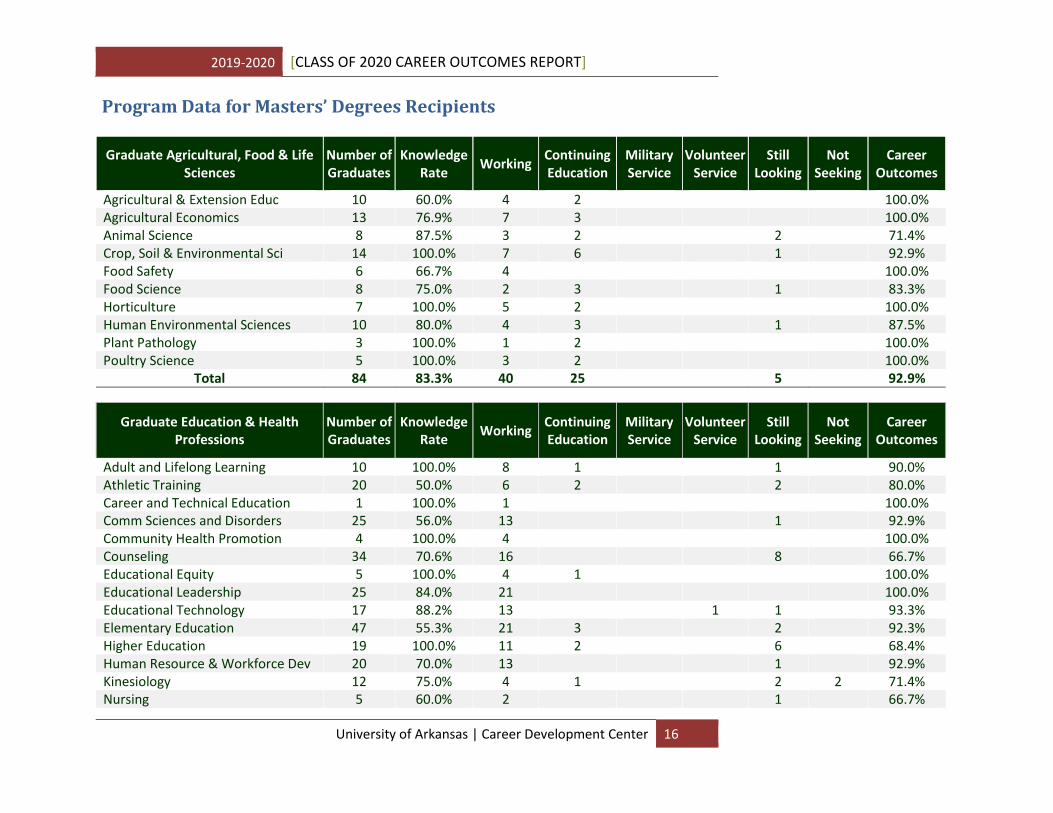
Program Data for Masters’ Degrees Recipients
Graduate Agricultural, Food & Life Sciences
Number of Graduates
Knowledge Rate
Working Continuing Education
Military Service
Volunteer Service
Still Looking
Not Seeking
Career Outcomes
Agricultural & Extension Educ 10 60.0% 4 2 100.0% Agricultural Economics 13 76.9% 7 3 100.0% Animal Science 8 87.5% 3 2 2
71.4%
Crop, Soil & Environmental Sci 14 100.0% 7 6 1
92.9% Food Safety 6 66.7% 4
100.0%
Food Science 8 75.0% 2 3 1
83.3% Horticulture 7 100.0% 5 2 100.0% Human Environmental Sciences 10 80.0% 4 3 1
87.5%
Plant Pathology 3 100.0% 1 2 100.0% Poultry Science 5 100.0% 3 2
100.0%
Total 84 83.3% 40 25 5
92.9%
Graduate Education & Health Professions
Number of Graduates
Knowledge Rate
Working Continuing Education
Military Service
Volunteer Service
Still Looking
Not Seeking
Career Outcomes
Adult and Lifelong Learning 10 100.0% 8 1 1 90.0% Athletic Training 20 50.0% 6 2 2 80.0% Career and Technical Education 1 100.0% 1
100.0%
Comm Sciences and Disorders 25 56.0% 13
1 92.9% Community Health Promotion 4 100.0% 4 100.0% Counseling 34 70.6% 16 8 66.7% Educational Equity 5 100.0% 4 1
100.0%
Educational Leadership 25 84.0% 21
100.0% Educational Technology 17 88.2% 13 1 1 93.3% Elementary Education 47 55.3% 21 3 2 92.3% Higher Education 19 100.0% 11 2 6 68.4% Human Resource & Workforce Dev 20 70.0% 13 1 92.9% Kinesiology 12 75.0% 4 1 2 2 71.4% Nursing 5 60.0% 2 1 66.7%
2019-2020 [CLASS OF 2020 CAREER OUTCOMES REPORT]
University of Arkansas | Career Development Center 17
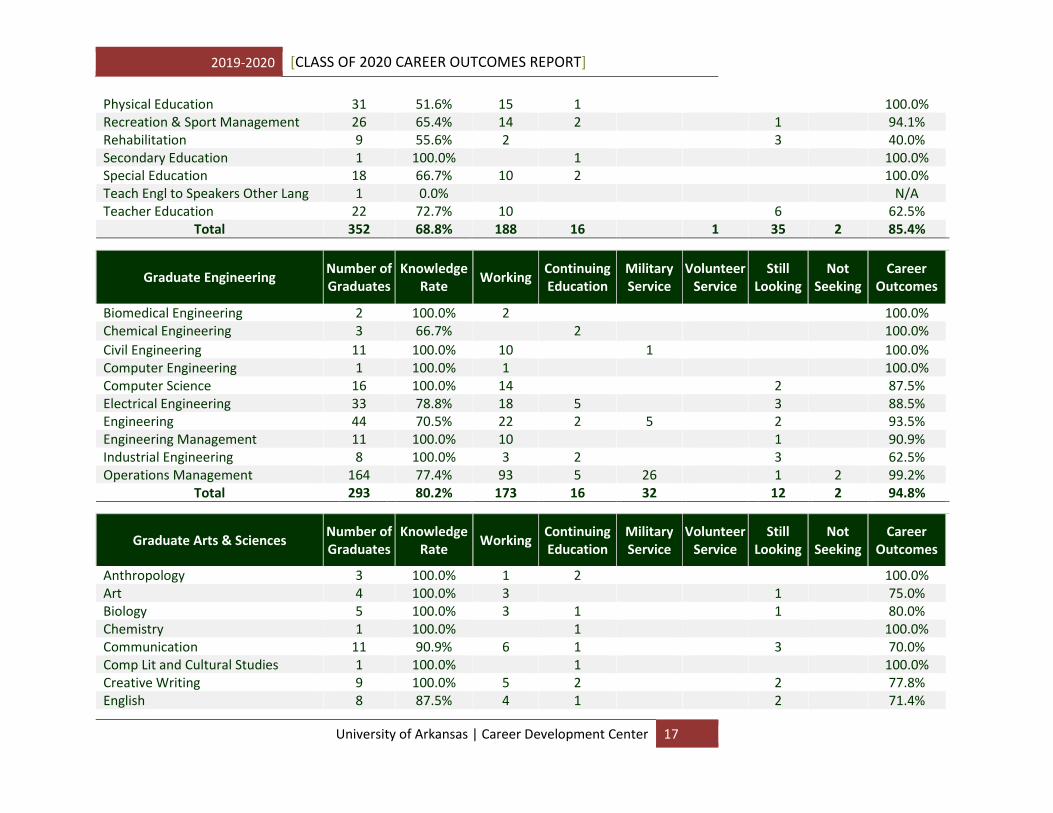
Physical Education 31 51.6% 15 1 100.0% Recreation & Sport Management 26 65.4% 14 2 1 94.1% Rehabilitation 9 55.6% 2 3 40.0% Secondary Education 1 100.0% 1 100.0% Special Education 18 66.7% 10 2 100.0% Teach Engl to Speakers Other Lang 1 0.0% N/A Teacher Education 22 72.7% 10 6 62.5%
Total 352 68.8% 188 16 1 35 2 85.4%
Graduate Engineering Number of Graduates
Knowledge Rate
Working Continuing Education
Military Service
Volunteer Service
Still Looking
Not Seeking
Career Outcomes
Biomedical Engineering 2 100.0% 2 100.0% Chemical Engineering 3 66.7%
2 100.0%
Civil Engineering 11 100.0% 10
1 100.0% Computer Engineering 1 100.0% 1
100.0%
Computer Science 16 100.0% 14
2
87.5% Electrical Engineering 33 78.8% 18 5 3 88.5% Engineering 44 70.5% 22 2 5 2 93.5% Engineering Management 11 100.0% 10
1 90.9%
Industrial Engineering 8 100.0% 3 2 3 62.5% Operations Management 164 77.4% 93 5 26 1 2 99.2%
Total 293 80.2% 173 16 32 12 2 94.8%
Graduate Arts & Sciences Number of Graduates
Knowledge Rate
Working Continuing Education
Military Service
Volunteer Service
Still Looking
Not Seeking
Career Outcomes
Anthropology 3 100.0% 1 2 100.0% Art 4 100.0% 3 1 75.0% Biology 5 100.0% 3 1 1 80.0% Chemistry 1 100.0%
1 100.0%
Communication 11 90.9% 6 1 3 70.0% Comp Lit and Cultural Studies 1 100.0%
1
100.0%
Creative Writing 9 100.0% 5 2 2 77.8% English 8 87.5% 4 1 2 71.4%
2019-2020 [CLASS OF 2020 CAREER OUTCOMES REPORT]
University of Arkansas | Career Development Center 18
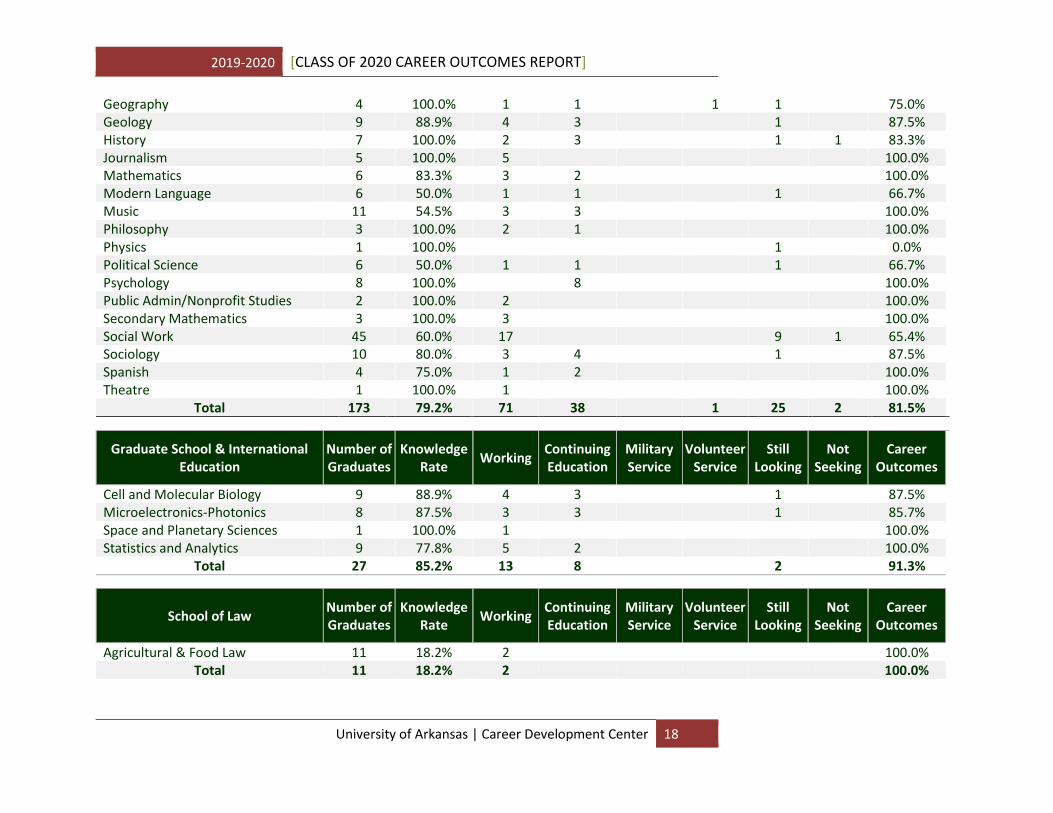
Geography 4 100.0% 1 1 1 1 75.0% Geology 9 88.9% 4 3 1 87.5% History 7 100.0% 2 3 1 1 83.3% Journalism 5 100.0% 5
100.0%
Mathematics 6 83.3% 3 2 100.0% Modern Language 6 50.0% 1 1 1 66.7% Music 11 54.5% 3 3 100.0% Philosophy 3 100.0% 2 1 100.0% Physics 1 100.0%
1 0.0%
Political Science 6 50.0% 1 1 1 66.7% Psychology 8 100.0% 8
100.0%
Public Admin/Nonprofit Studies 2 100.0% 2
100.0% Secondary Mathematics 3 100.0% 3
100.0%
Social Work 45 60.0% 17 9 1 65.4% Sociology 10 80.0% 3 4 1 87.5% Spanish 4 75.0% 1 2
100.0%
Theatre 1 100.0% 1 100.0% Total 173 79.2% 71 38 1 25 2 81.5%
Graduate School & International Education
Number of Graduates
Knowledge Rate
Working Continuing Education
Military Service
Volunteer Service
Still Looking
Not Seeking
Career Outcomes
Cell and Molecular Biology 9 88.9% 4 3 1 87.5% Microelectronics-Photonics 8 87.5% 3 3 1 85.7% Space and Planetary Sciences 1 100.0% 1 100.0% Statistics and Analytics 9 77.8% 5 2 100.0%
Total 27 85.2% 13 8 2 91.3%
School of Law Number of Graduates
Knowledge Rate
Working Continuing Education
Military Service
Volunteer Service
Still Looking
Not Seeking
Career Outcomes
Agricultural & Food Law 11 18.2% 2
100.0% Total 11 18.2% 2
100.0%
2019-2020 [CLASS OF 2020 CAREER OUTCOMES REPORT]
University of Arkansas | Career Development Center 19
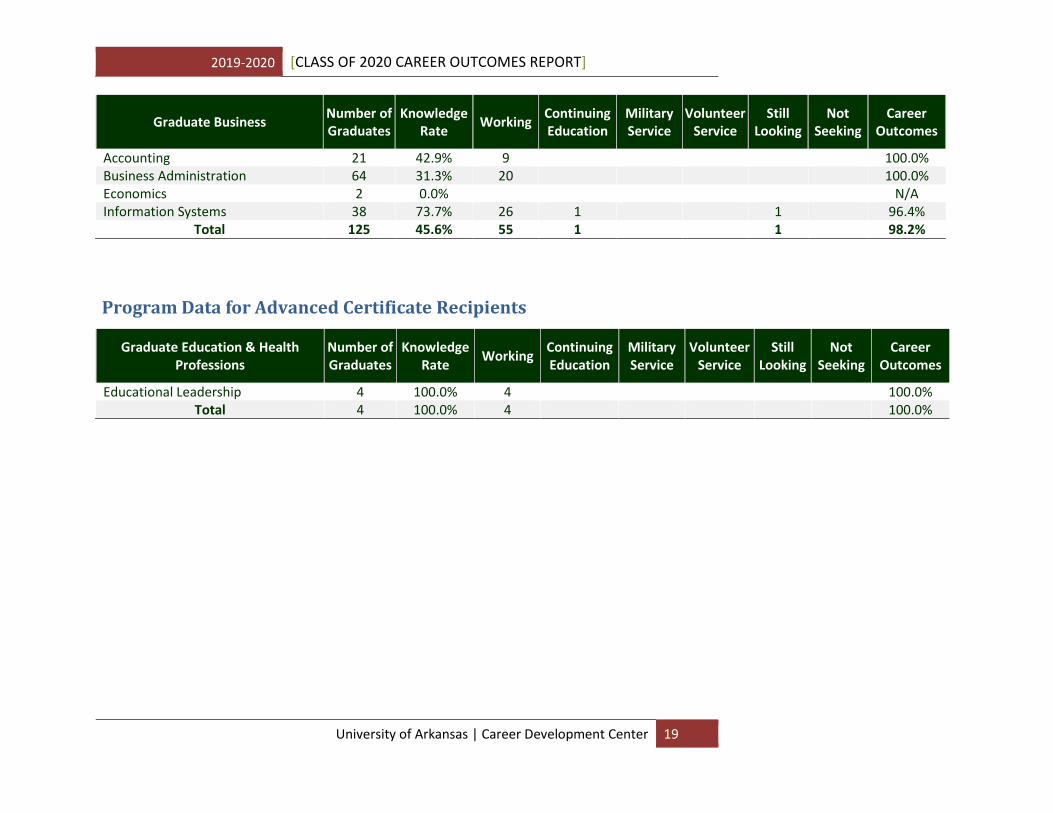
Graduate Business Number of Graduates
Knowledge Rate
Working Continuing Education
Military Service
Volunteer Service
Still Looking
Not Seeking
Career Outcomes
Accounting 21 42.9% 9
100.0% Business Administration 64 31.3% 20
100.0%
Economics 2 0.0% N/A Information Systems 38 73.7% 26 1 1 96.4%
Total 125 45.6% 55 1 1
98.2%
Program Data for Advanced Certificate Recipients
Graduate Education & Health Professions
Number of Graduates
Knowledge Rate
Working Continuing Education
Military Service
Volunteer Service
Still Looking
Not Seeking
Career Outcomes
Educational Leadership 4 100.0% 4
100.0% Total 4 100.0% 4 100.0%
2019-2020 [CLASS OF 2020 CAREER OUTCOMES REPORT]
University of Arkansas | Career Development Center 20
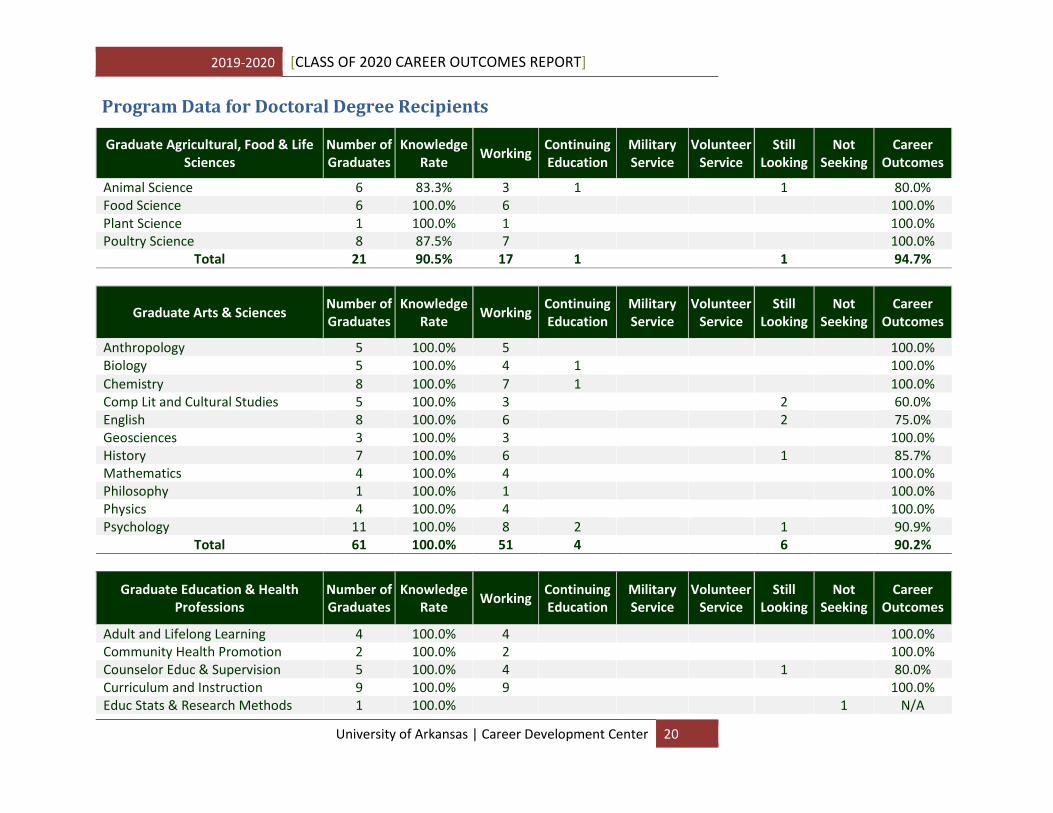
Program Data for Doctoral Degree Recipients
Graduate Agricultural, Food & Life Sciences
Number of Graduates
Knowledge Rate
Working Continuing Education
Military Service
Volunteer Service
Still Looking
Not Seeking
Career Outcomes
Animal Science 6 83.3% 3 1 1 80.0% Food Science 6 100.0% 6 100.0% Plant Science 1 100.0% 1 100.0% Poultry Science 8 87.5% 7 100.0%
Total 21 90.5% 17 1 1 94.7%
Graduate Arts & Sciences Number of Graduates
Knowledge Rate
Working Continuing Education
Military Service
Volunteer Service
Still Looking
Not Seeking
Career Outcomes
Anthropology 5 100.0% 5 100.0% Biology 5 100.0% 4 1 100.0%
Chemistry 8 100.0% 7 1
100.0% Comp Lit and Cultural Studies 5 100.0% 3
2 60.0%
English 8 100.0% 6
2
75.0% Geosciences 3 100.0% 3
100.0%
History 7 100.0% 6
1 85.7% Mathematics 4 100.0% 4
100.0%
Philosophy 1 100.0% 1 100.0% Physics 4 100.0% 4
100.0%
Psychology 11 100.0% 8 2 1 90.9% Total 61 100.0% 51 4 6 90.2%
Graduate Education & Health Professions
Number of Graduates
Knowledge Rate
Working Continuing Education
Military Service
Volunteer Service
Still Looking
Not Seeking
Career Outcomes
Adult and Lifelong Learning 4 100.0% 4 100.0% Community Health Promotion 2 100.0% 2 100.0% Counselor Educ & Supervision 5 100.0% 4 1 80.0% Curriculum and Instruction 9 100.0% 9 100.0% Educ Stats & Research Methods 1 100.0%
1 N/A
2019-2020 [CLASS OF 2020 CAREER OUTCOMES REPORT]
University of Arkansas | Career Development Center 21
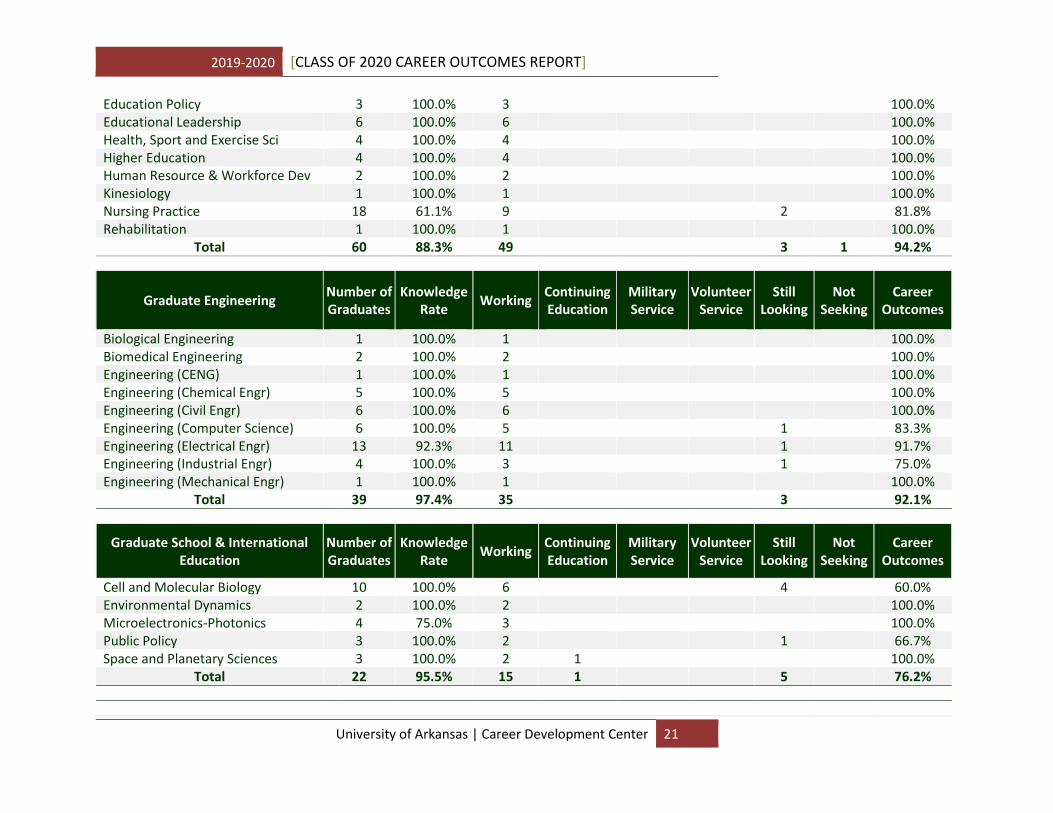
Education Policy 3 100.0% 3 100.0% Educational Leadership 6 100.0% 6 100.0% Health, Sport and Exercise Sci 4 100.0% 4 100.0% Higher Education 4 100.0% 4 100.0% Human Resource & Workforce Dev 2 100.0% 2 100.0% Kinesiology 1 100.0% 1 100.0% Nursing Practice 18 61.1% 9 2 81.8% Rehabilitation 1 100.0% 1 100.0%
Total 60 88.3% 49
3 1 94.2%
Graduate Engineering Number of Graduates
Knowledge Rate
Working Continuing Education
Military Service
Volunteer Service
Still Looking
Not Seeking
Career Outcomes
Biological Engineering 1 100.0% 1 100.0% Biomedical Engineering 2 100.0% 2 100.0% Engineering (CENG) 1 100.0% 1 100.0% Engineering (Chemical Engr) 5 100.0% 5
100.0%
Engineering (Civil Engr) 6 100.0% 6
100.0% Engineering (Computer Science) 6 100.0% 5
1 83.3%
Engineering (Electrical Engr) 13 92.3% 11
1 91.7% Engineering (Industrial Engr) 4 100.0% 3 1 75.0% Engineering (Mechanical Engr) 1 100.0% 1 100.0%
Total 39 97.4% 35 3 92.1%
Graduate School & International Education
Number of Graduates
Knowledge Rate
Working Continuing Education
Military Service
Volunteer Service
Still Looking
Not Seeking
Career Outcomes
Cell and Molecular Biology 10 100.0% 6 4 60.0% Environmental Dynamics 2 100.0% 2 100.0% Microelectronics-Photonics 4 75.0% 3 100.0% Public Policy 3 100.0% 2 1 66.7% Space and Planetary Sciences 3 100.0% 2 1 100.0%
Total 22 95.5% 15 1 5 76.2%
2019-2020 [CLASS OF 2020 CAREER OUTCOMES REPORT]
University of Arkansas | Career Development Center 22
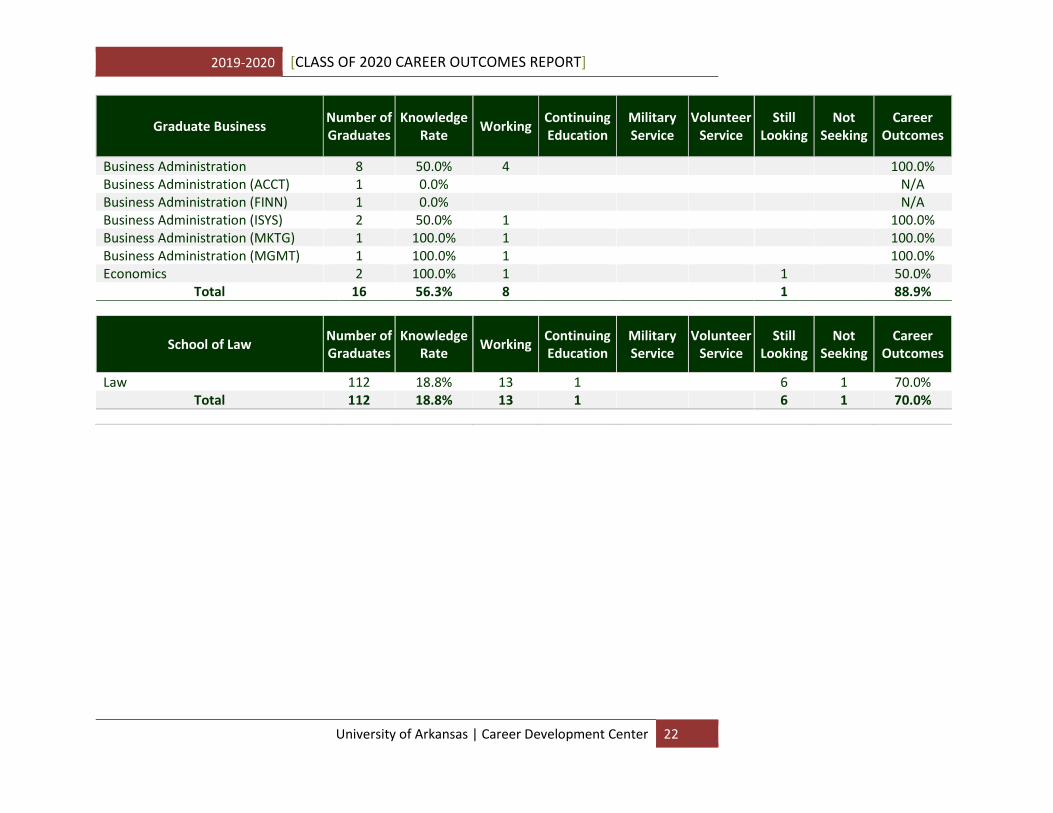
Graduate Business Number of Graduates
Knowledge Rate
Working Continuing Education
Military Service
Volunteer Service
Still Looking
Not Seeking
Career Outcomes
Business Administration 8 50.0% 4 100.0% Business Administration (ACCT) 1 0.0% N/A Business Administration (FINN) 1 0.0% N/A Business Administration (ISYS) 2 50.0% 1 100.0% Business Administration (MKTG) 1 100.0% 1 100.0% Business Administration (MGMT) 1 100.0% 1 100.0% Economics 2 100.0% 1 1 50.0%
Total 16 56.3% 8 1 88.9%
School of Law Number of Graduates
Knowledge Rate
Working Continuing Education
Military Service
Volunteer Service
Still Looking
Not Seeking
Career Outcomes
Law 112 18.8% 13 1 6 1 70.0% Total 112 18.8% 13 1 6 1 70.0%
2019-2020 [CLASS OF 2020 CAREER OUTCOMES REPORT]
University of Arkansas | Career Development Center 23
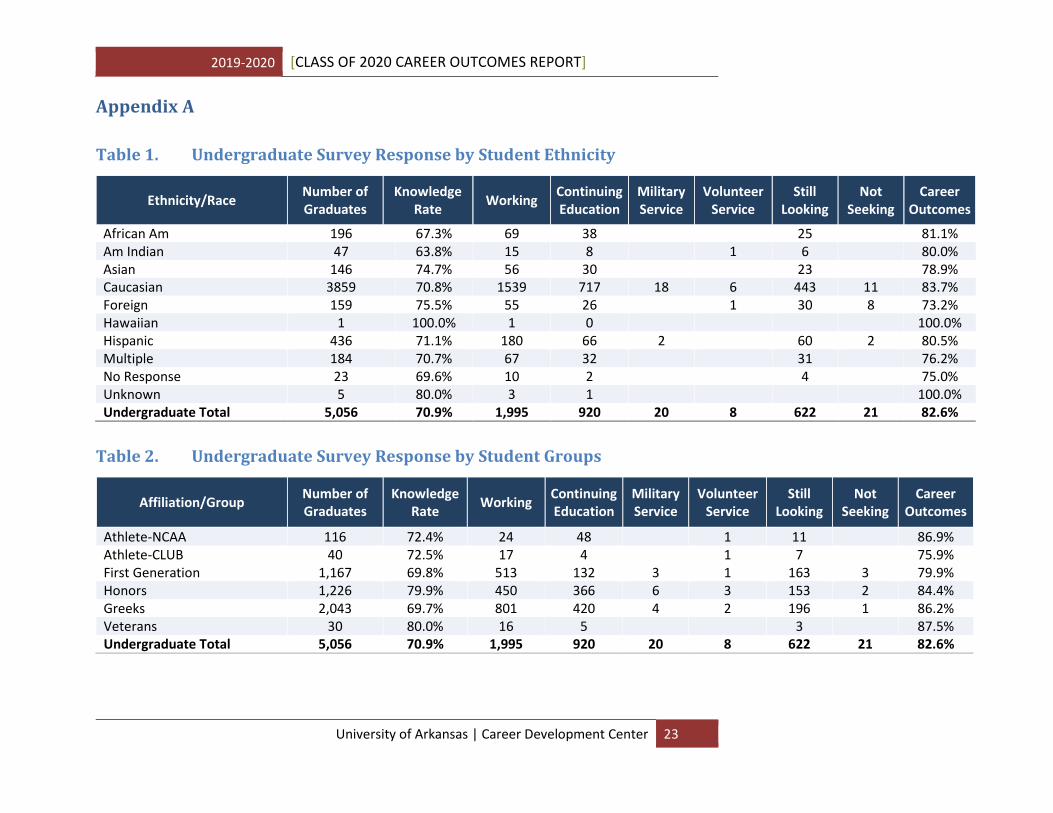
Appendix A
Table 1. Undergraduate Survey Response by Student Ethnicity
Ethnicity/Race Number of Graduates
Knowledge Rate
Working Continuing Education
Military Service
Volunteer Service
Still Looking
Not Seeking
Career Outcomes
African Am 196 67.3% 69 38 25 81.1% Am Indian 47 63.8% 15 8 1 6 80.0% Asian 146 74.7% 56 30 23 78.9% Caucasian 3859 70.8% 1539 717 18 6 443 11 83.7% Foreign 159 75.5% 55 26 1 30 8 73.2% Hawaiian 1 100.0% 1 0 100.0% Hispanic 436 71.1% 180 66 2 60 2 80.5% Multiple 184 70.7% 67 32 31 76.2% No Response 23 69.6% 10 2 4 75.0% Unknown 5 80.0% 3 1 100.0% Undergraduate Total 5,056 70.9% 1,995 920 20 8 622 21 82.6%
Table 2. Undergraduate Survey Response by Student Groups
Affiliation/Group Number of Graduates
Knowledge Rate
Working Continuing Education
Military Service
Volunteer Service
Still Looking
Not Seeking
Career Outcomes
Athlete-NCAA 116 72.4% 24 48 1 11 86.9% Athlete-CLUB 40 72.5% 17 4 1 7 75.9% First Generation 1,167 69.8% 513 132 3 1 163 3 79.9% Honors 1,226 79.9% 450 366 6 3 153 2 84.4% Greeks 2,043 69.7% 801 420 4 2 196 1 86.2% Veterans 30 80.0% 16 5 3 87.5% Undergraduate Total 5,056 70.9% 1,995 920 20 8 622 21 82.6%
2019-2020 [CLASS OF 2020 CAREER OUTCOMES REPORT]
University of Arkansas | Career Development Center 24
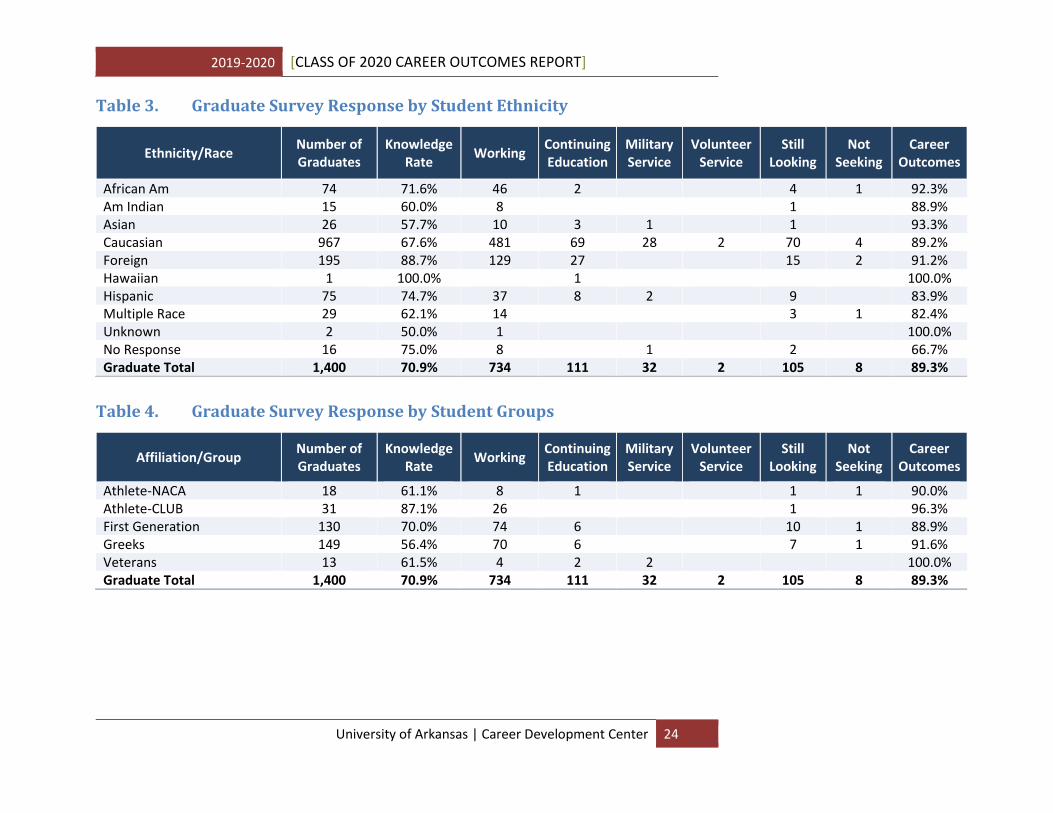
Table 3. Graduate Survey Response by Student Ethnicity
Ethnicity/Race Number of Graduates
Knowledge Rate
Working Continuing Education
Military Service
Volunteer Service
Still Looking
Not Seeking
Career Outcomes
African Am 74 71.6% 46 2 4 1 92.3% Am Indian 15 60.0% 8 1 88.9% Asian 26 57.7% 10 3 1 1 93.3% Caucasian 967 67.6% 481 69 28 2 70 4 89.2% Foreign 195 88.7% 129 27 15 2 91.2% Hawaiian 1 100.0% 1 100.0% Hispanic 75 74.7% 37 8 2 9 83.9% Multiple Race 29 62.1% 14 3 1 82.4% Unknown 2 50.0% 1 100.0% No Response 16 75.0% 8 1 2 66.7% Graduate Total 1,400 70.9% 734 111 32 2 105 8 89.3%
Table 4. Graduate Survey Response by Student Groups
Affiliation/Group Number of Graduates
Knowledge Rate
Working Continuing Education
Military Service
Volunteer Service
Still Looking
Not Seeking
Career Outcomes
Athlete-NACA 18 61.1% 8 1 1 1 90.0% Athlete-CLUB 31 87.1% 26 1 96.3% First Generation 130 70.0% 74 6 10 1 88.9% Greeks 149 56.4% 70 6 7 1 91.6% Veterans 13 61.5% 4 2 2 100.0% Graduate Total 1,400 70.9% 734 111 32 2 105 8 89.3%
2019-2020 [CLASS OF 2020 CAREER OUTCOMES REPORT]
University of Arkansas | Career Development Center 25
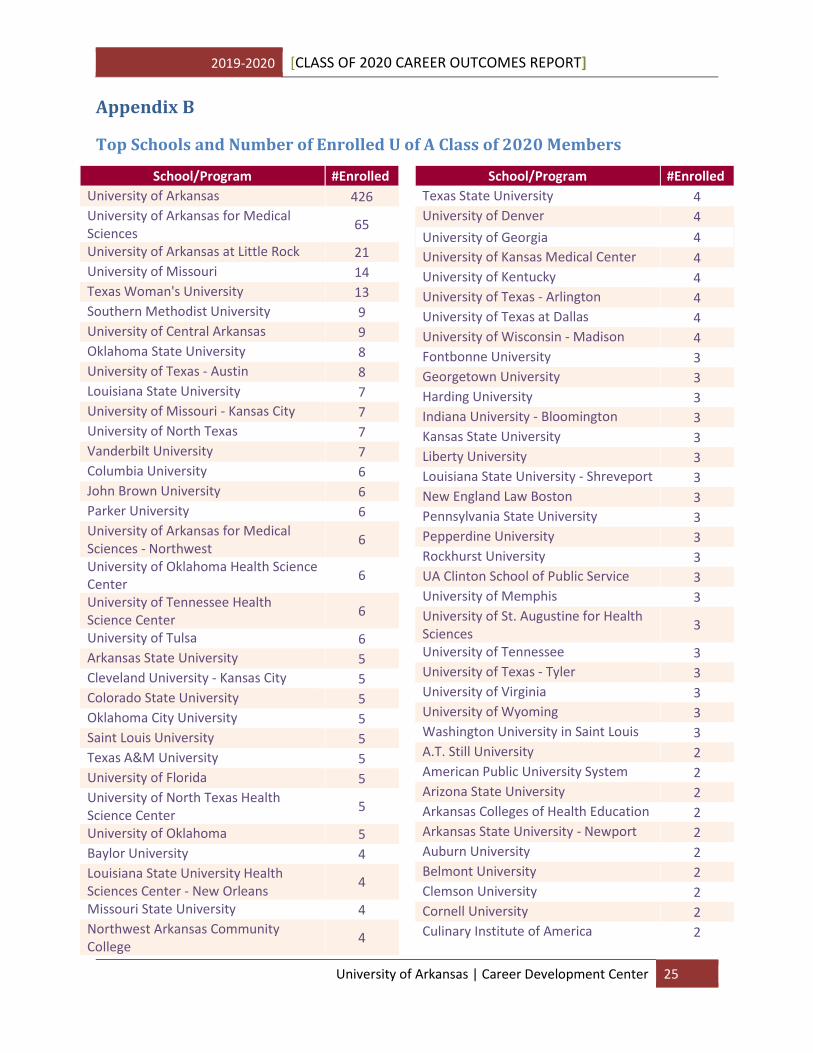
Appendix B
Top Schools and Number of Enrolled U of A Class of 2020 Members
School/Program #Enrolled
University of Arkansas 426
University of Arkansas for Medical Sciences
65
University of Arkansas at Little Rock 21
University of Missouri 14
Texas Woman's University 13
Southern Methodist University 9
University of Central Arkansas 9
Oklahoma State University 8
University of Texas - Austin 8
Louisiana State University 7
University of Missouri - Kansas City 7
University of North Texas 7
Vanderbilt University 7
Columbia University 6
John Brown University 6
Parker University 6
University of Arkansas for Medical Sciences - Northwest
6
University of Oklahoma Health Science Center
6
University of Tennessee Health Science Center
6
University of Tulsa 6
Arkansas State University 5
Cleveland University - Kansas City 5
Colorado State University 5
Oklahoma City University 5
Saint Louis University 5
Texas A&M University 5
University of Florida 5
University of North Texas Health Science Center
5
University of Oklahoma 5
Baylor University 4
Louisiana State University Health Sciences Center - New Orleans
4
Missouri State University 4
Northwest Arkansas Community College
4
School/Program #Enrolled
Texas State University 4
University of Denver 4
University of Georgia 4
University of Kansas Medical Center 4
University of Kentucky 4
University of Texas - Arlington 4
University of Texas at Dallas 4
University of Wisconsin - Madison 4
Fontbonne University 3
Georgetown University 3
Harding University 3
Indiana University - Bloomington 3
Kansas State University 3
Liberty University 3
Louisiana State University - Shreveport 3
New England Law Boston 3
Pennsylvania State University 3
Pepperdine University 3
Rockhurst University 3
UA Clinton School of Public Service 3
University of Memphis 3
University of St. Augustine for Health Sciences
3
University of Tennessee 3
University of Texas - Tyler 3
University of Virginia 3
University of Wyoming 3
Washington University in Saint Louis 3
A.T. Still University 2
American Public University System 2
Arizona State University 2
Arkansas Colleges of Health Education 2
Arkansas State University - Newport 2
Auburn University 2
Belmont University 2
Clemson University 2
Cornell University 2
Culinary Institute of America 2
2019-2020 [CLASS OF 2020 CAREER OUTCOMES REPORT]
University of Arkansas | Career Development Center 26
2019-2020 [CLASS OF 2020 CAREER OUTCOMES REPORT]
University of Arkansas | Career Development Center 27
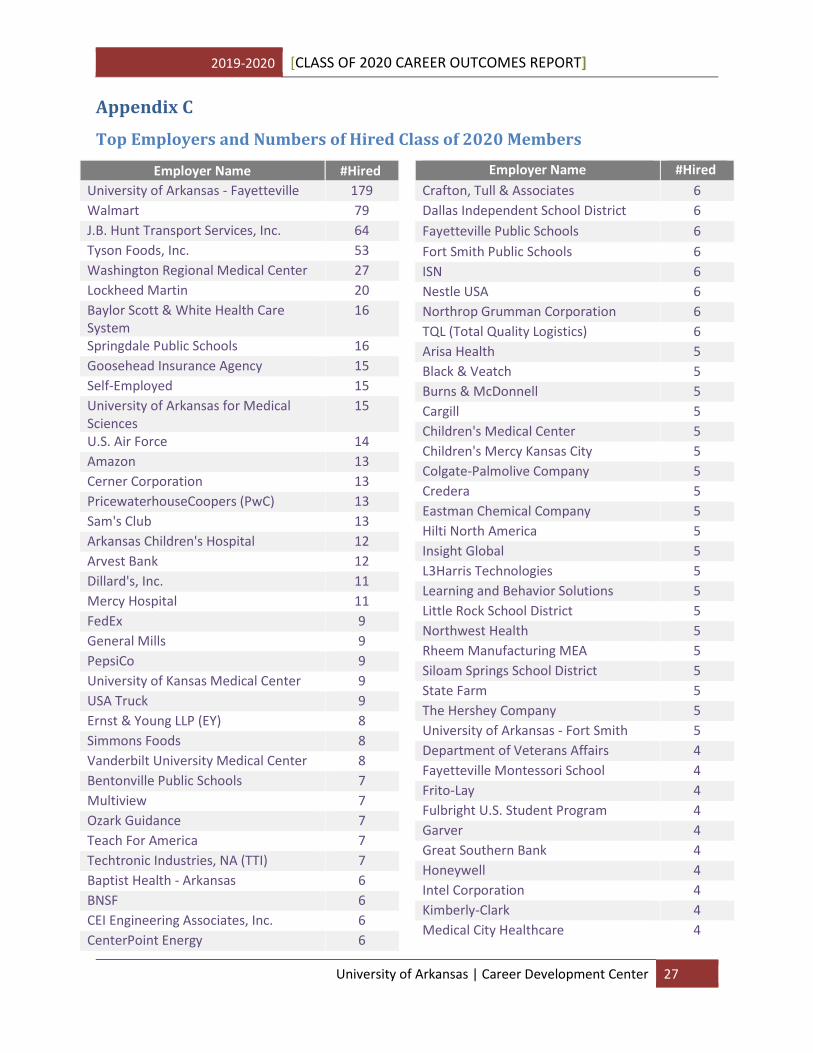
Appendix C
Top Employers and Numbers of Hired Class of 2020 Members
Employer Name #Hired
University of Arkansas - Fayetteville 179
Walmart 79
J.B. Hunt Transport Services, Inc. 64
Tyson Foods, Inc. 53
Washington Regional Medical Center 27
Lockheed Martin 20
Baylor Scott & White Health Care System
16
Springdale Public Schools 16
Goosehead Insurance Agency 15
Self-Employed 15
University of Arkansas for Medical Sciences
15
U.S. Air Force 14
Amazon 13
Cerner Corporation 13
PricewaterhouseCoopers (PwC) 13
Sam's Club 13
Arkansas Children's Hospital 12
Arvest Bank 12
Dillard's, Inc. 11
Mercy Hospital 11
FedEx 9
General Mills 9
PepsiCo 9
University of Kansas Medical Center 9
USA Truck 9
Ernst & Young LLP (EY) 8
Simmons Foods 8
Vanderbilt University Medical Center 8
Bentonville Public Schools 7
Multiview 7
Ozark Guidance 7
Teach For America 7
Techtronic Industries, NA (TTI) 7
Baptist Health - Arkansas 6
BNSF 6
CEI Engineering Associates, Inc. 6
CenterPoint Energy 6
Employer Name #Hired
Crafton, Tull & Associates 6
Dallas Independent School District 6
Fayetteville Public Schools 6
Fort Smith Public Schools 6
ISN 6
Nestle USA 6
Northrop Grumman Corporation 6
TQL (Total Quality Logistics) 6
Arisa Health 5
Black & Veatch 5
Burns & McDonnell 5
Cargill 5
Children's Medical Center 5
Children's Mercy Kansas City 5
Colgate-Palmolive Company 5
Credera 5
Eastman Chemical Company 5
Hilti North America 5
Insight Global 5
L3Harris Technologies 5
Learning and Behavior Solutions 5
Little Rock School District 5
Northwest Health 5
Rheem Manufacturing MEA 5
Siloam Springs School District 5
State Farm 5
The Hershey Company 5
University of Arkansas - Fort Smith 5
Department of Veterans Affairs 4
Fayetteville Montessori School 4
Frito-Lay 4
Fulbright U.S. Student Program 4
Garver 4
Great Southern Bank 4
Honeywell 4
Intel Corporation 4
Kimberly-Clark 4
Medical City Healthcare 4
2019-2020 [CLASS OF 2020 CAREER OUTCOMES REPORT]
University of Arkansas | Career Development Center 28

![Career Outcomes Reportcareer.uark.edu/cdc/aboutus/studentstats/2015-2016...2017/10/11 · 2015-2016 [CAREER OUTCOMES REPORT] University of Arkansas | Career Development Center 5 Master](https://img.pdfslide.us/doc/110x75/5fba46338e5b2255b97f4f07/career-outcomes-20171011-2015-2016-career-outcomes-report-university.jpg)


![Career Outcomes Reportcareer.uark.edu/cdc/students/CareerOutcomes/2014-2015 Outcome… · 2014-2015 [CAREER OUTCOMES REPORT] University of Arkansas | Career Development Center 5 Master](https://img.pdfslide.us/doc/110x75/5fcad18571cc6e09500a7177/career-outcomes-outcome-2014-2015-career-outcomes-report-university-of-arkansas.jpg)

![Career Outcomes Reportcareer.uark.edu/cdc/resources/files/career-outcomes-report-2015-2016.pdf2015-2016 [CAREER OUTCOMES REPORT] University of Arkansas | Career Development Center](https://img.pdfslide.us/doc/110x75/5f519baed31a0000976d5627/career-outcomes-2015-2016-career-outcomes-report-university-of-arkansas-career.jpg)


![Career Outcomes Reportcareer.uark.edu/cdc/resources/files/career-outcomes-report-2015...2015-2016 [CAREER OUTCOMES REPORT] University of Arkansas | Career Development Center 5 Master](https://img.pdfslide.us/doc/110x75/5b03e88d7f8b9a41528bb1c9/career-outcomes-career-outcomes-report-university-of-arkansas-career-development.jpg)


![Career Outcomes Report - Career Development Center · 2016-2017 [CAREER OUTCOMES REPORT] University of Arkansas | Career Development Center 5 Degree Level and School Employed Continuing](https://img.pdfslide.us/doc/110x75/5e61961981cb9c3cda22186e/career-outcomes-report-career-development-center-2016-2017-career-outcomes-report.jpg)