Embed Size (px)
Citation preview

Class I Railroad Annual Report R-1to the Surface Transportation Board for the Year Ending Dec. 31, 2017
OEEAA-R1Union Pacific Railroad • 1400 Douglas, Omaha, NE 68179
NOTICE1. This report is required for every class I railroad operating within the United States. Three copies of this AnnualReport should be completed. Two of the copies must be filed with the Surface Transportation Board, Office ofEconomics, Environmental Analysis, and Administration, 395 E Street, S.W. Suite 1100,Washington, DC 20423, by March 31 of the year following that for which the report is made. One copy should beretained by the carrier.
2. Every inquiry must be definitely answered. Where the word "none" truly and completely states the fact, itshould be given as the answer. If any inquiry is inapplicable, the words "not applicable" should be used.
3. Wherever the space provided in the schedules in insufficient to permit a full and complete statement of therequested information, inserts should be prepared and appropriately identified by the number of the schedule.
4. All entries should be made in a permanent black ink or typed. Those of a contrary character must be indicatedin parenthesis. Items of an unusual character must be indicated by appropriate symbols and explained in footnotes.
5. Money items, except averages, throughout the annual report form should be shown in thousands of dollarsadjusted to accord with footings. Totals for amounts reported in subsidiary accounts included in supportingschedules must be in agreement with related primary accounts. For purposes of rounding, amounts of $500 butless than $1,000 should be raised to the nearest thousand dollars, and amounts of less than $500 should belowered.
6. Except where the context clearly indicates some other meaning, the following terms when used in this Formhave the following meanings:
(a) Board means Surface Transportation Board.
(b) Respondent means the person or corporation in whose behalf the report is made.
(c) Year means the year ended December 31 for which the report is being made.
(d) Close of the Year means the close of business on December 31 for the year in which the report is being made. If the report is made for a shorter period than one year, it means the close of the period covered by the report.
(e) Beginning of the Year means the beginning of business on January 1 of the year for which the report is being made. If the report is made for a shorter period than one year, it means the beginning of that period.
(f) Preceding Year means the year ended December 31 of the year preceding the year for which the report is made.
(g) The Uniform System of Accounts for Railroad Companies means the system of accounts in Part 1201 of Title 49, Code of Federal Regulations, as amended.
7. The ICC Termination Act of 1995 abolished the Interstate Commerce Commission and replaced it withthe Surface Transportation Board. Any references to the Interstate Commerce Commission or Commissioncontained in this report refer to the Surface Transportation Board.
8. Any references to the Bureau of Accounts or the Office of Economics contained in this report refer to the Officeof Economics, Environmental Analysis, and Administration of the Surface Transportation Board.
For Index, See Back of Form

ANNUAL REPORT
OF
UNION PACIFIC RAILROAD COMPANY
To The
SURFACE TRANSPORTATION BOARD
For The
Year Ended December 31, 2017
Name, official title, telephone number, and office address of officer in charge of correspondence with
the Board regarding this report:
(Name) Todd M. Rynaski (Title) Chief Accounting Officer and Controller
(Telephone number) (402) 544-5565 (or contact Erin Sauter at (402) 544-3099)
(Office address) 1400 Douglas Street - Stop 1780, Omaha, Nebraska 68179
Road Initials: UPRR Year: 2017
Railroad Annual Report R-1
NOTES AND REMARKS
(This page intentionally left blank)

Road Initials: UPRR Year: 2017
Railroad Annual Report R-1
Schedule Page
Schedules Omitted by Respondent A 1Identity of Respondent B 2Voting Powers and Elections C 3Comparative Statement of Financial Position 200 6Results of Operations 210 16Consolidated Statement of Comprehensive Income 210A 18Retained Earnings - Unappropriated 220 19Statement of Changes in Financial Position 240 20Working Capital Information 245 22Investments and Advances - Affiliated Companies 310 26Investments in Common Stock of affiliated Companies 310A 30Road Property and Equipment and Improvements to Leased Property and Equipment 330 32Depreciation Base and Rates - Road and Equipment Owned and Used and Leased from Others 332 34Accumulated Depreciation - Road and Equipment Owned and Used 335 35Accumulated Depreciation - Improvements to Road and Equipment Leased from Others 342 36Investment in Railroad Property Used in Transportation Service (By Company) 352A 38Investment in Railroad Property Used in Transportation Service (By Property Accounts) 352B 39Railway Operating Expenses 410 41Way and Structures 412 48Rent for Interchanged Freight Train Cars and Other Freight Carrying Equipment 414 49Supporting Schedule - Equipment 415 52Specialized Service Subschedule - Transportation 417 54Analysis of Taxes 450 55Guaranties and Suretyships 501 57Compensating Balances and Short-Term Borrowing Arrangements 502 58Separation of Debtholdings Between Road Property and Equipment 510 59Transactions Between Respondent and Companies or Persons Affiliated with Respondent for Services Received or Provided 512 61Mileage Operated at Close of Year 700 63Miles of Road at Close of Year - By States and Territories (Single Track) 702 64Inventory of Equipment 710 66Unit Cost of Equipment Installed During the Year 710S 72Track and Traffic Conditions 720 73Consumption of Diesel Fuel 750 74Railroad Operating Statistics 755 78PTC Supplemental Schedules 330, 332, 335, 352B, 410, 700, 710S, 720, and PTC Grants 82Verification 105Memoranda 106Index 107
TABLE OF CONTENTS

Road Initials: UPRR Year: 2017
Railroad Annual Report R-1
SPECIAL NOTICE
Docket No. 38559, Railroad Classification Index, (ICC served January 20, 1983), modified thereporting requirements for Class II, Class III and Switching and Terminal Companies. Thesecarriers will notify the Board only if the calculation results in a different revenue level than its current classification.
The dark border on the schedules represents data that are captured by the Board.
Supplemental Information about the Annual Report (R-1)
The following information is provided in Compliance with OMB requirements and pursuant tothe Paperwork Reduction Act of 1995, 44 U.S.C. §§ 3501-3519 (PRA):
This information collection is mandatory pursuant to 49 U.S.C. § 11145. The estimated hourburden for filing this report is estimated at no more than 800 hours. Information in the Annual Reports is used to monitor and assess railroad industry growth, financial stability, traffic, and operations and to identify industry changes that may affect national transportation policy. In addition, the Board uses data from these reports to more effectively carry out its regulatory responsibilities, such as acting on railroad requests for authority to engage in Board regulated financial transactions (for example, mergers, acquisitions of control, consolidations and abandonments); developing the Uniform Rail Costing System (URCS); conducting rail revenue adequacy proceedings; developing rail cost adjustment factors; and conducting investigations and rulemakings. The information in this report is ordinarily maintained by the agency in hard copy for 10 years, after which it is transferred to the National Archives, where it is maintained as a permanent record. In addition, some of this information is posted on the Board’s website,where it may remain indefinitely. All information collected through this report is available to thepublic. Under the PRA, a federal agency may not conduct or sponsor, and a person is not required to respond to, nor shall a person be subject to a penalty for failure to comply with, acollection of information unless it displays a currently valid OMB control number. Comments and questions about this collection (2140-0009) should be directed to Paperwork ReductionOfficer, Surface Transportation Board, 395 E Street, S.W., Washington, DC 20423-0001.

Road Initials: UPRR Year: 2017 1
Railroad Annual Report R-1
A. SCHEDULES OMITTED BY RESPONDENT
1. The respondent, at its option, may omit pages from this report provided there is nothing to report or the schedules are notapplicable.
2. Show below the pages excluded and indicate the schedule number and title in the space provided below.
3. If no schedules were omitted indicate "NONE".
Page Schedule No. Title
NONE

2 Road Initials: UPRR Year: 2017
Railroad Annual Report R-1
B. IDENTITY OF RESPONDENT
Answers to the questions asked should be made in full, without reference to data returned on the corresponding pageof previous reports. In case any changes of the nature referred to under Inquiry 4 on this page have taken place duringthe year covered by this report, they should be explained in full detail.
1. Give in full the exact name of the respondent. Use the words "The" and "Company" only when they are parts ofthe corporate name. Be careful to distinguish between railroad and railway. The corporate name should begiven uniformly throughout the report, notably on the cover, on the title page, and in the "Verification." If the reportis made by receivers, trustees, a committee of bondholders, or individuals otherwise in possession of theproperty, state names and facts with precision. If the report is for a consolidated group, pursuant to SpecialPermission from the Board, indicate such fact on line 1 below and list the consolidated group on page 4.
2. If incorporated under a special charter, give date of passage of the act; if under a general law, give date of filingcertificate of organization; if a reorganization has been effected, give date of reorganization. If a receivership orother trust, also give date when such receivership or other possession began. If a partnership, give date offormation and also names in full of present partners.
3. State the occasion for the reorganization, whether by reason of foreclosure of mortgage or otherwise, accordingto the fact. Give date of organization of original corporation and refer to laws under which organized.
1. Exact name of common carrier making this report - Union Pacific Railroad Company *
2. Date of incorporation - February 20, 1969
3. Under laws of what Government, State, or Territory organized? If more than one, name all. If in bankruptcy, givecourt of jurisdiction and dates of beginning of receivership or trusteeship and of appointment of receivers ortrustees: Under the General Corporation Law of the State of Delaware. Articles Amended February 24, 1969,June 8, 1987, April 13, 1989, and August 10, 1993, in perpetuity. Name changed from Southern Pacific Transportation Company, February 1, 1998.
4. If the respondent was reorganized during the year, involved in a consolidation or merger, or conducted itsbusiness under a different name, give full particulars: Effective November 1, 2017, Insight Network Logistics, LLC, Streamline, LLC and ShipCarsNow, Inc. were merged with and into Union Pacific Distribution Services Company (UPDS). UPDS was the surviving corporation and changed its name to Loup Logistics Company. Insight Networks Logistics, LLC and its subsidiary, Insight Network Logistics de Mexico, were previously owned by Union Pacific Corporation.
5. The respondent is required to send the Office of Economic and Environmental Analysis, immediately uponpreparation, two copies of its latest annual report to stockholders.
Check appropriate box:
[ ] Two copies are attached to this report.[ X ] Two copies will be submitted on: (date) _______March 29, 2018________________.[ ] No annual report to stockholders is prepared.
* This report for Union Pacific Railroad Company includes Union Pacific Railroad Company and all subsidiaries andaffiliates (collectively, the Company, Railroad, or UPRR). See page 4 for a listing of included companies.
Stockholders' Reports
Road Initials: UPRR Year: 2017 3
Railroad Annual Report R-1
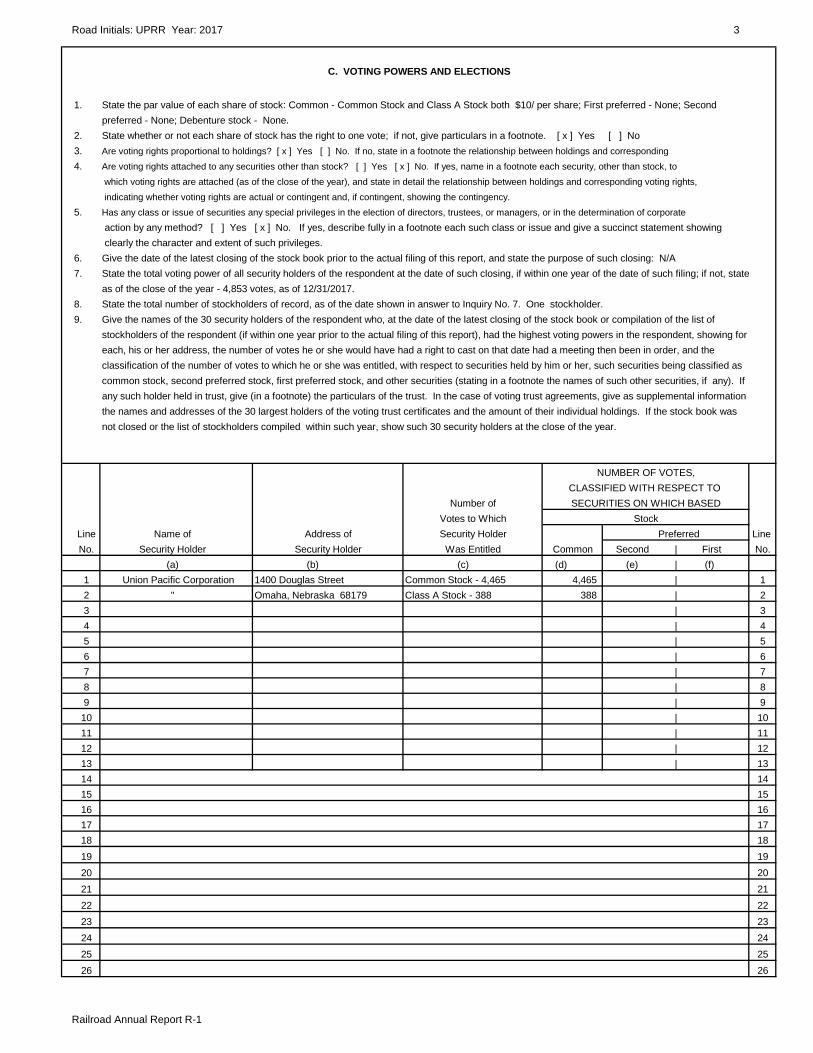
C. VOTING POWERS AND ELECTIONS
1. State the par value of each share of stock: Common - Common Stock and Class A Stock both $10/ per share; First preferred - None; Second preferred - None; Debenture stock - None.
2. State whether or not each share of stock has the right to one vote; if not, give particulars in a footnote. [ x ] Yes [ ] No3. Are voting rights proportional to holdings? [ x ] Yes [ ] No. If no, state in a footnote the relationship between holdings and corresponding4. Are voting rights attached to any securities other than stock? [ ] Yes [ x ] No. If yes, name in a footnote each security, other than stock, to
which voting rights are attached (as of the close of the year), and state in detail the relationship between holdings and corresponding voting rights, indicating whether voting rights are actual or contingent and, if contingent, showing the contingency.
5. Has any class or issue of securities any special privileges in the election of directors, trustees, or managers, or in the determination of corporate action by any method? [ ] Yes [ x ] No. If yes, describe fully in a footnote each such class or issue and give a succinct statement showing clearly the character and extent of such privileges.
6. Give the date of the latest closing of the stock book prior to the actual filing of this report, and state the purpose of such closing: N/A7. State the total voting power of all security holders of the respondent at the date of such closing, if within one year of the date of such filing; if not, state
as of the close of the year - 4,853 votes, as of 12/31/2017. 8. State the total number of stockholders of record, as of the date shown in answer to Inquiry No. 7. One stockholder. 9. Give the names of the 30 security holders of the respondent who, at the date of the latest closing of the stock book or compilation of the list of
stockholders of the respondent (if within one year prior to the actual filing of this report), had the highest voting powers in the respondent, showing for each, his or her address, the number of votes he or she would have had a right to cast on that date had a meeting then been in order, and the classification of the number of votes to which he or she was entitled, with respect to securities held by him or her, such securities being classified as common stock, second preferred stock, first preferred stock, and other securities (stating in a footnote the names of such other securities, if any). If any such holder held in trust, give (in a footnote) the particulars of the trust. In the case of voting trust agreements, give as supplemental information the names and addresses of the 30 largest holders of the voting trust certificates and the amount of their individual holdings. If the stock book was not closed or the list of stockholders compiled within such year, show such 30 security holders at the close of the year.
NUMBER OF VOTES,CLASSIFIED WITH RESPECT TO
Number of SECURITIES ON WHICH BASEDVotes to Which Stock
Line Name of Address of Security Holder Preferred Line No. Security Holder Security Holder Was Entitled Common Second | First No.
(a) (b) (c) (d) (e) | (f)1 Union Pacific Corporation 1400 Douglas Street Common Stock - 4,465 4,465 | 12 " Omaha, Nebraska 68179 Class A Stock - 388 388 | 23 | 34 | 45 | 56 | 67 | 78 | 89 | 910 | 1011 | 1112 | 1213 | 1314 1415 1516 1617 1718 1819 1920 2021 2122 2223 2324 2425 2526 26
4 Road Initials: UPRR Year: 2017
Railroad Annual Report R-1
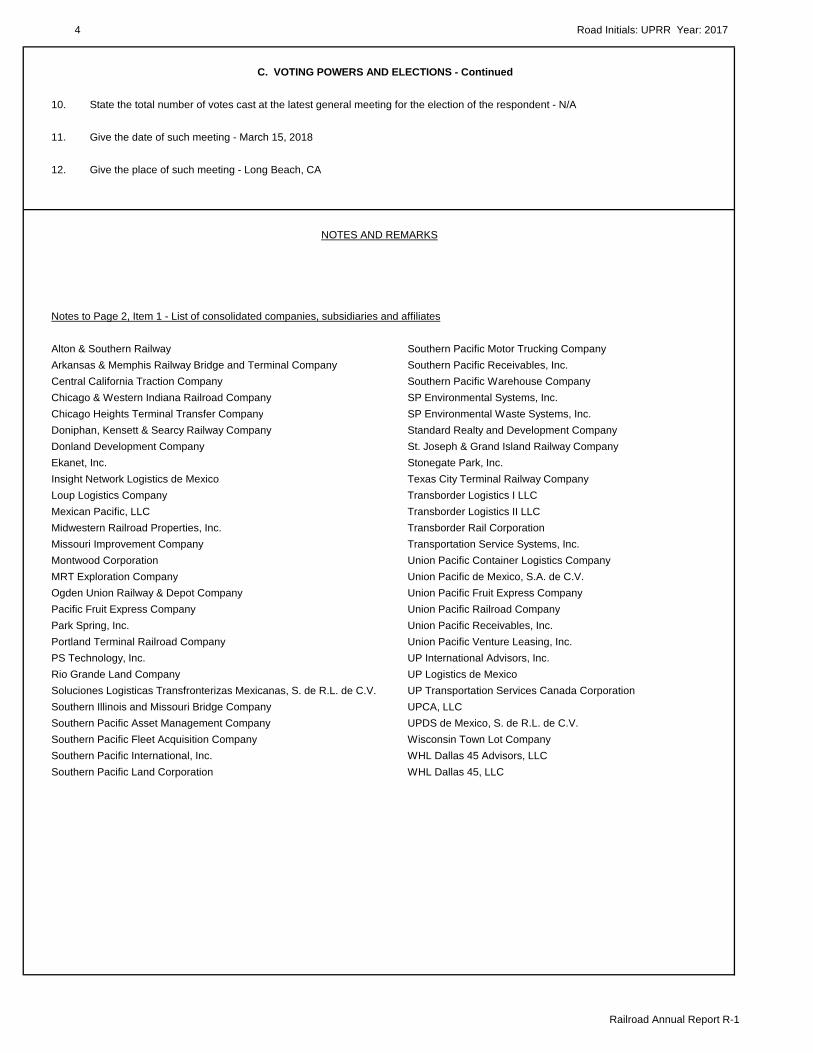
C. VOTING POWERS AND ELECTIONS - Continued
10. State the total number of votes cast at the latest general meeting for the election of the respondent - N/A
11. Give the date of such meeting - March 15, 2018
12. Give the place of such meeting - Long Beach, CA
NOTES AND REMARKS
Notes to Page 2, Item 1 - List of consolidated companies, subsidiaries and affiliates
Alton & Southern Railway Southern Pacific Motor Trucking CompanyArkansas & Memphis Railway Bridge and Terminal Company Southern Pacific Receivables, Inc.Central California Traction Company Southern Pacific Warehouse CompanyChicago & Western Indiana Railroad Company SP Environmental Systems, Inc.Chicago Heights Terminal Transfer Company SP Environmental Waste Systems, Inc.Doniphan, Kensett & Searcy Railway Company Standard Realty and Development CompanyDonland Development Company St. Joseph & Grand Island Railway CompanyEkanet, Inc. Stonegate Park, Inc.Insight Network Logistics de Mexico Texas City Terminal Railway CompanyLoup Logistics Company Transborder Logistics I LLCMexican Pacific, LLC Transborder Logistics II LLCMidwestern Railroad Properties, Inc. Transborder Rail CorporationMissouri Improvement Company Transportation Service Systems, Inc.Montwood Corporation Union Pacific Container Logistics CompanyMRT Exploration Company Union Pacific de Mexico, S.A. de C.V.Ogden Union Railway & Depot Company Union Pacific Fruit Express CompanyPacific Fruit Express Company Union Pacific Railroad CompanyPark Spring, Inc. Union Pacific Receivables, Inc.Portland Terminal Railroad Company Union Pacific Venture Leasing, Inc.PS Technology, Inc. UP International Advisors, Inc.Rio Grande Land Company UP Logistics de MexicoSoluciones Logisticas Transfronterizas Mexicanas, S. de R.L. de C.V. UP Transportation Services Canada CorporationSouthern Illinois and Missouri Bridge Company UPCA, LLCSouthern Pacific Asset Management Company UPDS de Mexico, S. de R.L. de C.V.Southern Pacific Fleet Acquisition Company Wisconsin Town Lot CompanySouthern Pacific International, Inc. WHL Dallas 45 Advisors, LLCSouthern Pacific Land Corporation WHL Dallas 45, LLC

Road Initials: UPRR Year: 2017 5
Railroad Annual Report R-1
NOTES AND REMARKS
(This page intentionally left blank)

6 Road Initials: UPRR Year: 2017
Railroad Annual Report R-1
200. COMPARATIVE STATEMENT OF FINANCIAL POSITION - ASSETS
(Dollars in Thousands)
Line Cross Balance at close Balance at begin- Line
No. Check Account Title of year ning of year No.
(a) (b) (c)
CURRENT ASSETS
1 701 Cash 236,891 86,056 1
2 702 Temporary Cash Investments 42,937 90,406 2
3 703 Special Deposits 16 502 3
Accounts Receivable
4 704 - Loan and Notes 729 4,012 4
5 705 - Interline and Other Balances 88,711 73,794 5
6 706 - Customers 1,184,500 1,044,816 6
7 707 - Other 221,280 209,257 7
8 709,708 - Accrued Accounts Receivables 199,464 148,583 8
9 708.5 - Receivables from Affiliated Companies 9
10 709.5 - Less: Allowance for Uncollectible Accounts (9,091) (8,814) 10
11 710,711,714 Working Funds Prepayments Deferred Income Tax Debits 32,580 33,646 11
12 712 Materials and Supplies 749,560 717,037 12
13713, 713.5, 713.6 Other Current Assets 158,344 37,366 13
14 TOTAL CURRENT ASSETS 2,905,921 2,436,661 14
OTHER ASSETS
15 715, 716, 717 Special Funds 6,511 5,649 15
16 721, 721.5 Investments and Advances Affiliated Companies 12,202,441 9,133,763 16
(Schedules 310 and 310A)
17 722, 723 Other Investments and Advances 1,361 80 17
18 737, 738 Property Used in Other than Carrier Operation 18
(Less Depreciation) 2017-$10,512; 2016-$10,930 368,339 370,457
19 739, 741 Other Assets 384,899 241,885 19
20 743 Other Deferred Debits 5,332 16,043 20
21 744 Accumulated Deferred Income Tax Debits 1,022 21
22 TOTAL OTHER ASSETS 12,968,883 9,768,899 22
ROAD AND EQUIPMENT
23 731, 732 Road (Schedule 330) L-30 Cols. h & b 55,686,252 53,846,864 23
24 731, 732 Equipment (Schedule 330) L-39 Cols. h & b 13,941,025 13,774,173 24
25 731, 732 Unallocated Items 779,116 1,030,245 25
26 733, 735 Accumulated Depreciation and Amortization (20,962,750) (20,425,160) 26
(Schedules 335, 342, 351)
27 Net Road and Equipment 49,443,643 48,226,122 2728 TOTAL ASSETS 65,318,447 60,431,682 28
Road Initials: UPRR Year: 2017 7
Railroad Annual Report R-1
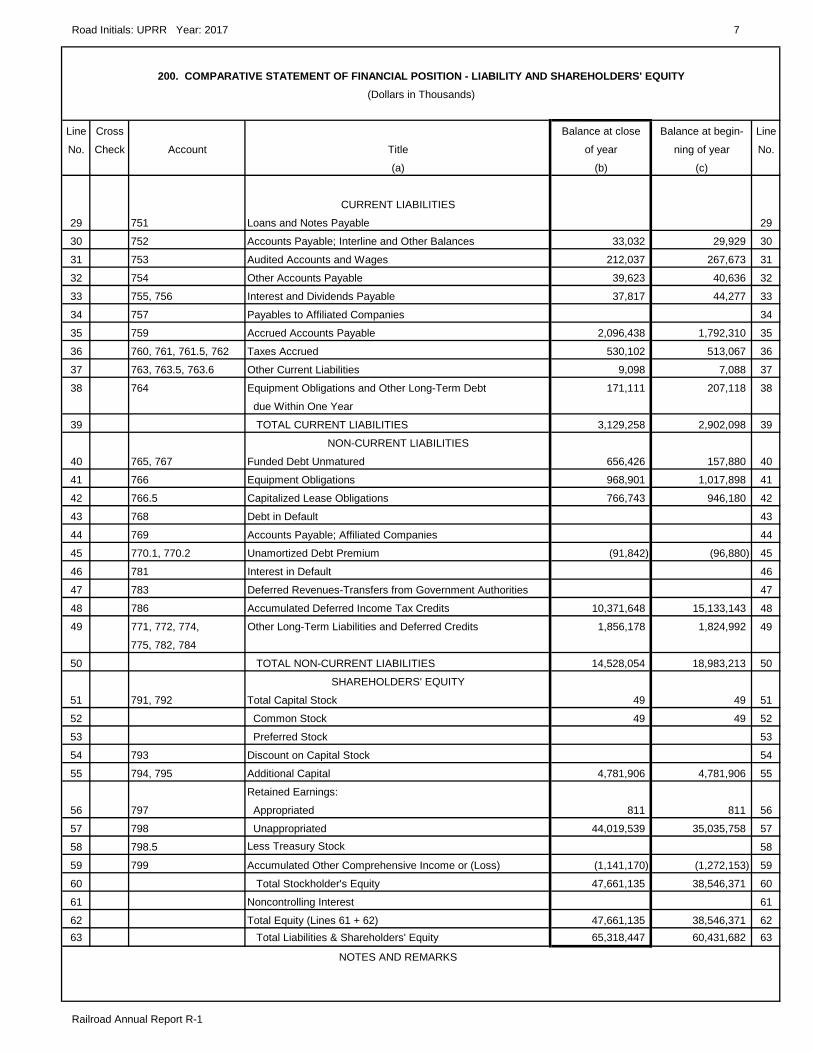
200. COMPARATIVE STATEMENT OF FINANCIAL POSITION - LIABILITY AND SHAREHOLDERS' EQUITY(Dollars in Thousands)
Line Cross Balance at close Balance at begin- Line
No. Check Account Title of year ning of year No.
(a) (b) (c)
CURRENT LIABILITIES
29 751 Loans and Notes Payable 29
30 752 Accounts Payable; Interline and Other Balances 33,032 29,929 30
31 753 Audited Accounts and Wages 212,037 267,673 31
32 754 Other Accounts Payable 39,623 40,636 32
33 755, 756 Interest and Dividends Payable 37,817 44,277 33
34 757 Payables to Affiliated Companies 34
35 759 Accrued Accounts Payable 2,096,438 1,792,310 35
36 760, 761, 761.5, 762 Taxes Accrued 530,102 513,067 36
37 763, 763.5, 763.6 Other Current Liabilities 9,098 7,088 37
38 764 Equipment Obligations and Other Long-Term Debt 171,111 207,118 38
due Within One Year
39 TOTAL CURRENT LIABILITIES 3,129,258 2,902,098 39
NON-CURRENT LIABILITIES
40 765, 767 Funded Debt Unmatured 656,426 157,880 40
41 766 Equipment Obligations 968,901 1,017,898 41
42 766.5 Capitalized Lease Obligations 766,743 946,180 42
43 768 Debt in Default 43
44 769 Accounts Payable; Affiliated Companies 44
45 770.1, 770.2 Unamortized Debt Premium (91,842) (96,880) 45
46 781 Interest in Default 46
47 783 Deferred Revenues-Transfers from Government Authorities 47
48 786 Accumulated Deferred Income Tax Credits 10,371,648 15,133,143 48
49 771, 772, 774, Other Long-Term Liabilities and Deferred Credits 1,856,178 1,824,992 49
775, 782, 784
50 TOTAL NON-CURRENT LIABILITIES 14,528,054 18,983,213 50
SHAREHOLDERS' EQUITY
51 791, 792 Total Capital Stock 49 49 51
52 Common Stock 49 49 52
53 Preferred Stock 53
54 793 Discount on Capital Stock 54
55 794, 795 Additional Capital 4,781,906 4,781,906 55
Retained Earnings:
56 797 Appropriated 811 811 56
57 798 Unappropriated 44,019,539 35,035,758 57
58 798.5 Less Treasury Stock 58
59 799 Accumulated Other Comprehensive Income or (Loss) (1,141,170) (1,272,153) 59
60 Total Stockholder's Equity 47,661,135 38,546,371 60
61 Noncontrolling Interest 61
62 Total Equity (Lines 61 + 62) 47,661,135 38,546,371 6263 Total Liabilities & Shareholders' Equity 65,318,447 60,431,682 63
NOTES AND REMARKS

8 Road Initials: UPRR Year: 2017
Railroad Annual Report R-1
200. COMPARATIVE STATEMENT OF FINANCIAL POSITION -- EXPLANATORY NOTES(Dollars in Thousands)
The notes listed below are provided to disclose supplementary information on matters which have an important effect on the financialcondition of the carrier. The carrier shall give the particulars called for herein and where there is nothing to report, insert the word "none";and in addition thereto shall enter in separate notes with suitable particulars other matters involving material amounts of the charactercommonly disclosed in financial statements under generally accepted accounting and reporting principles, except as shown in otherschedules. This includes statements explaining (1) service interruption insurance policies and indicating the amount of indemnity to whichrespondent will be entitled for work stoppage losses and the maximum amount of additional premium respondent may be obligated to pay inthe event such losses are sustained by other railroads; (2) particulars concerning obligations for stock purchase options granted toofficers and employees; and (3) what entries have been made for net income or retained income restricted under provisions of mortgagesand other arrangements.
1. Amount (estimated, if necessary) of net income or retained income which has to be provided for capital expenditures, and for sinkingand other funds pursuant to provisions of reorganization plans, mortgages, deeds of trust, or other contracts. $811.
2. Estimated amount of future earnings which can be realized before paying Federal income taxes because of unused and available netoperating loss carryover on January 1 of the year following that for which the report is made. None.
3. (a) Explain the procedure in accounting for pension funds and recording in the accounts the current and past service pension costs,indicating whether or not consistent with the prior year ____________________________________________See Explanatory Note 11 beginning on page 10.
(b) State amount, if any, representing the excess of the actuarially computed value of vested benefits over the total of the pensionfund. $__________. See Explanatory Note 11 beginning on page 10.
(c) Is any part of pension plan funded? Specify. Yes X No___(i) If funding is by insurance, give name of insuring company Not Applicable.
If funding is by trust agreement, list trustee(s). The Northern Trust CompanyDate of trust agreement or latest amendment. March 11, 2016If respondent is affiliated in any way with the trustee(s), explain affiliation: Not Applicable.
(d) List affiliated companies which are included in the pension plan funding agreement and describe basis for allocating charges underthe agreement. See Explanatory Note 11 beginning on page 10.
(e) (i) Is any part of the pension plan fund invested in stock or other securities of the respondent or any of its affiliates? Specify. Yes ___ No X If yes, give number of the shares for each class of stock or other security: ________________________________________________________________________________________________________________.
(ii) Are voting rights attached to any securities held by the pension plan? Specify. Yes _X_ No ___ If yes,who determines how stock is voted? Voting rights are delegated to investment managers_________________________________________________________________________________________________________.
4. State whether a segregated political fund has been established as provided by the Federal Election Campaign Act of 1971 (18 U.S.C.610). Yes __X__ No _____ See Note 14 on page 15D.
5. (a) The amount of employers contribution to employee stock ownership plans for the current year was $ NONE.(b) The amount of investment tax credit used to reduce current income tax expense resulting from contributions to qualified employee
stock ownership plans for the current year was NONE.
6. In reference to Docket No. 37465 specify the total amount of business entertainment expenditures charged to the non-operatingexpense account. NONE.
Road Initials: UPRR Year: 2017 9
Railroad Annual Report R-1
200. COMPARATIVE STATEMENT OF FINANCIAL POSITION -- EXPLANATORY NOTES - CONTINUED
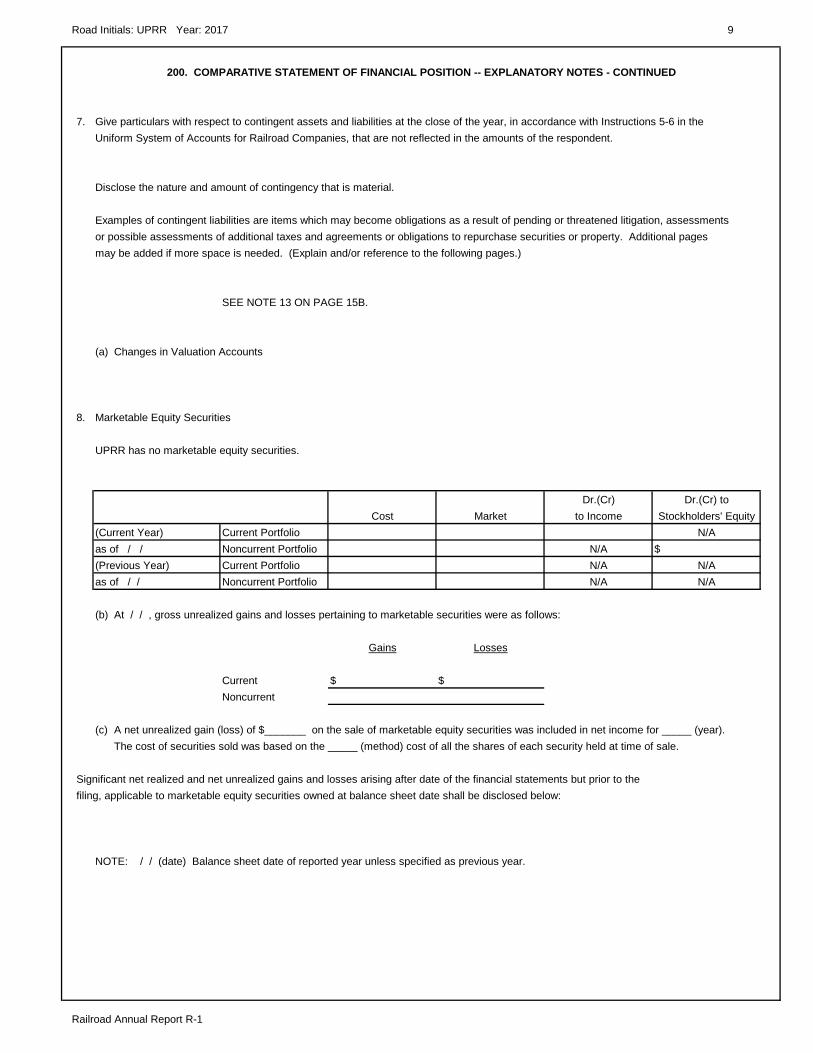
7. Give particulars with respect to contingent assets and liabilities at the close of the year, in accordance with Instructions 5-6 in theUniform System of Accounts for Railroad Companies, that are not reflected in the amounts of the respondent.
Disclose the nature and amount of contingency that is material.
Examples of contingent liabilities are items which may become obligations as a result of pending or threatened litigation, assessmentsor possible assessments of additional taxes and agreements or obligations to repurchase securities or property. Additional pagesmay be added if more space is needed. (Explain and/or reference to the following pages.)
SEE NOTE 13 ON PAGE 15B.
(a) Changes in Valuation Accounts
8. Marketable Equity Securities
UPRR has no marketable equity securities.
Dr.(Cr) Dr.(Cr) toCost Market to Income Stockholders' Equity
(Current Year) Current Portfolio N/Aas of / / Noncurrent Portfolio N/A $(Previous Year) Current Portfolio N/A N/Aas of / / Noncurrent Portfolio N/A N/A
(b) At / / , gross unrealized gains and losses pertaining to marketable securities were as follows:
Gains Losses
Current $ $Noncurrent
(c) A net unrealized gain (loss) of $_______ on the sale of marketable equity securities was included in net income for _____ (year).The cost of securities sold was based on the _____ (method) cost of all the shares of each security held at time of sale.
Significant net realized and net unrealized gains and losses arising after date of the financial statements but prior to thefiling, applicable to marketable equity securities owned at balance sheet date shall be disclosed below:
NOTE: / / (date) Balance sheet date of reported year unless specified as previous year.

10 Road Initials: UPRR Year: 2017
Railroad Annual Report R-1
200. COMPARATIVE STATEMENT OF FINANCIAL POSITION – EXPLANATORY NOTES - CONTINUED
NOTES TO FINANCIAL STATEMENTS
For purposes of this report, unless the context otherwise requires, all references herein to the “Company”, “we”, “us”, and “our” mean Union Pacific Railroad Company. For purposes of this report, unless the context otherwise requires, all references herein to “UPC” and the “Corporation” mean Union Pacific Corporation. All references herein to the “Consolidated Financial Statements“ mean the Comparative Statement of Financial Position, Results of Operations, Retained Earnings, Statement of Cash Flows, and the supplement notes and schedules included in the Class 1 Railroad Annual Report R-1. 9. Transactions with Affiliates We had working capital deficits of $198 million and $460 million at December 31, 2017 and 2016, respectively. Our working capital relates to UPC’s management of our cash position. As part of UPC’s cash management activities, we advance excess cash (cash available after satisfying all of our obligations and paying dividends to UPC) to UPC. We declare and pay dividends to UPC that typically approximate the dividends UPC declares to its shareholders; however, there is no formal requirement to do so. The dividend declaration between us and UPC is determined solely by our Board of Directors. To the extent we require additional cash for use in our operations, UPC makes such funds available to us for borrowing. We treat these transactions as intercompany borrowings in the Consolidated Statements of Financial Position. Intercompany Transactions - In December of 2008, UPC established a borrowing limit based on our borrowing capacity and UPC implemented a market based interest rate. Currently, the annual rate is 3.1% for borrowings either to or from UPC. The annual rate was 2.5% from July 2016 through June 2017 and 3.5% from July 2015 through June 2016. Interest accrues and is payable quarterly. Although payable on demand, we do not expect a payment from UPC within 12 months, or in the event of borrowing from UPC, we do not expect to be required by UPC to pay back the intercompany borrowings within the next 12 months. Intercompany borrowings are unsecured and rank equally with all of our other unsecured indebtedness. At December 31, 2017 and 2016, intercompany lendings to UPC were $10.4 billion and $7.7 billion, respectively. Pursuant to a services agreement, UPC provides us with various services, including strategic planning, legal, treasury, accounting, auditing, insurance, human resources, and corporate affairs. We pay our share of the costs as determined by an independent review. Billings for these services were $62 million, $60 million, and $52 million for the years ended December 31, 2017, 2016, and 2015, respectively. Related Party Transactions – We and other North American railroad companies jointly own TTX Company (TTX). We have a 36.79% economic and voting interest in TTX while the other North American railroads own the remaining interest. In accordance with ASC 323 Investments - Equity Method and Joint Venture, we apply the equity method of accounting to our investment in TTX. TTX is a railcar pooling company that owns railcars and intermodal wells to serve North America’s railroads. TTX assists railroads in meeting the needs of their customers by providing railcars in an efficient, pooled environment. All railroads have the ability to utilize TTX railcars through car hire by renting railcars at stated rates. We had $1.2 billion and $877 million recognized as investments related to TTX in our consolidated statements of financial position as of December 31, 2017 and 2016, respectively. TTX car hire expenses of $388 million in 2017, $368 million in 2016, and $376 million in 2015 are included in equipment and other rents in our Consolidated Statements of Income. In addition, we had accounts payable to TTX of $69 million and $61 million at December 31, 2017, and December 31, 2016, respectively. 10. Financial Instruments Fair Value of Financial Instruments – The fair value of our short- and long-term debt was estimated using a market value price model, which utilizes applicable U.S. Treasury rates along with current market quotes on comparable debt securities. All of the inputs used to determine the fair market value of the Company’s long-term debt are Level 2 inputs and obtained from an independent source. At December 31, 2017, the fair value of total debt was $2.6 billion, approximately $131 million more than the carrying value. At December 31, 2016, the fair value of total debt was $2.4 billion, approximately $177 million more than the carrying value. The fair value of the Company’s debt is a measure of its current value under present market conditions. It does not impact the financial statements under current accounting rules. At both December 31, 2017, and 2016, approximately $155 million of debt securities contained call provisions that allow us to retire the debt instruments prior to final maturity, at par, without the payment of fixed call premiums. The fair value of intercompany lendings to UPC approximates carrying value. The fair value of our cash equivalents approximates their carrying value due to the short-term maturities of these instruments. 11. Retirement Plans Pension and Other Postretirement Benefits Pension Plans – We provide defined benefit retirement income to eligible non-union employees through the Corporation’s qualified and non-qualified (supplemental) pension plans. Qualified and non-qualified pension benefits are based on years of service and the highest compensation during the latest years of employment, with specific reductions made for early retirements. Non-union employees hired on or after January 1, 2018, are no longer eligible for pension benefits, but will be eligible for an enhanced 401(k) plan as described below in other retirement programs. Other Postretirement Benefits (OPEB) – We provide medical and life insurance benefits for eligible retirees through hired before January 1, 2004. These benefits are funded as medical claims and life insurance premiums are paid.

Road Initials: UPRR Year: 2017 11
Railroad Annual Report R-1
200. COMPARATIVE STATEMENT OF FINANCIAL POSITION – EXPLANATORY NOTES - CONTINUED
NOTES TO FINANCIAL STATEMENTS
Funded Status We are required by GAAP to separately recognize the overfunded or underfunded status of our pension and OPEB plans as an asset or liability. The funded status represents the difference between the projected benefit obligation (PBO) and the fair value of the plan assets. Our non-qualified (supplemental) pension plan is unfunded by design. The PBO of the pension plans is the present value of benefits earned to date by plan participants, including the effect of assumed future compensation increases. The PBO of the OPEB plan is equal to the accumulated benefit obligation, as the present value of the OPEB liabilities is not affected by compensation increases. Plan assets are measured at fair value. We use a December 31 measurement date for plan assets and obligations for all our retirement plans. Changes in our PBO and plan assets were as follows for the years ended December 31:
Funded Status Pension OPEB Millions 2017 2016 2017 2016 Projected Benefit Obligation Projected benefit obligation at beginning of year $ 4,110 $ 3,958 $ 334 $ 329 Service cost 90 84 2 1 Interest cost 142 143 10 11 Plan curtailment cost 20 - (1) - Special termination cost 49 - - - Actuarial loss/(gain) 382 124 7 16 Gross benefits paid (264) (199) (22) (23)
Projected benefit obligation at end of year $ 4,529 $ 4,110 $ 330 $ 334
Plan Assets Fair value of plan assets at beginning of year $ 3,748 $ 3,544 $ - $ - Actual return on plan assets 716 279 - - Voluntary funded pension plan contributions - 100 - - Non-qualified plan benefit contributions 24 24 22 23 Gross benefits paid (264) (199) (330) (23)
Fair value of plan assets at end of year $ 4,224 $ 3,748 $ - $ -
Funded status at end of year $ (305) $ (362) $ (330) $ (334)
Amounts recognized in the statement of financial position as of December 31, 2017 and 2016 consist of: Pension OPEB Millions 2017 2016 2017 2016 Noncurrent assets $ 196 $ 67 $ - $ - Current liabilities (27) (24) (23) (24) Noncurrent liabilities (474) (405) (307) (310)
Net amounts recognized at end of year $ (305) $ (362) $ (330) $ (334)
Pre-tax amounts recognized in accumulated other comprehensive income/(loss) as of December 31, 2017 and 2016 consist of: 2017 2016
Millions Pension OPEB Total Pension OPEB Total Prior service (cost)/credit $ - $ (1) $ (1) $ - $ (2) $ (2) Net actuarial loss (1,533) (120) (1,653) (1,681) (123) (1,804)
Total $ (1,533) $ (121) $ (1,654) $ (1,681) $ (125) $ (1,806)

12 Road Initials: UPRR Year: 2017
Railroad Annual Report R-1
200. COMPARATIVE STATEMENT OF FINANCIAL POSITION – EXPLANATORY NOTES - CONTINUED
NOTES TO FINANCIAL STATEMENTS Pre-tax changes recognized in other comprehensive income/(loss) during 2017, 2016 and 2015 were as follows:
Pension OPEB
Millions 2017 2016 2015 2017 2016 2015 Net actuarial (loss)/gain $ 67 $ (112) $ (31) $ (6) $ (16) $ 18 Amortization of: Prior service cost/(credit) - - - 1 (9) (10) Actuarial loss 81 83 106 9 10 13
Total $ 148 $ (29) $ 75 $ 4 $ (15) $ 21
Amounts included in accumulated other comprehensive income/(loss) expected to be amortized into net periodic cost during 2018:
Millions Pension OPEB
Total Prior service credit $ - $ (1) $ (1) Net actuarial loss (90) (9) (99)
Total $ (90) $ (10) $ (100)
Underfunded Accumulated Benefit Obligation – The accumulated benefit obligation (ABO) is the present value of benefits earned to date, assuming no future compensation growth. The underfunded accumulated benefit obligation represents the difference between the ABO and the fair value of plan assets. At December 31, 2017, and 2016, the non-qualified (supplemental) plan ABO was $481 million and $412 million, respectively. The following table discloses only the PBO, ABO, and fair value of plan assets for pension plans where the accumulated benefit obligation is in excess of the fair value of the plan assets as of December 31: Underfunded Accumulated Benefit Obligation Millions 2017 2016 Projected benefit obligation $ 501 $ 428
Accumulated benefit obligation $ 481 $ 412 Fair value of plan assets - -
Underfunded accumulated benefit obligation $ (481) $ (412)
The ABO for all defined benefit pension plans was $4.2 billion and $3.9 billion at December 31, 2017, and 2016, respectively. Assumptions – The weighted-average actuarial assumptions used to determine benefit obligations at December 31: Pension OPEB Percentages 2017 2016 2017 2016 Discount rate 3.62% 4.20% 3.53% 4.00% Compensation increase 4.20% 4.20% N/A N/A Health care cost trend rate (employees under 65) N/A N/A 6.09% 6.31% Ultimate health care cost trend rate N/A N/A 4.50% 4.50% Year ultimate trend rate reached N/A N/A 2038 2038 Expense Both pension and OPEB expense are determined based upon the annual service cost of benefits (the actuarial cost of benefits earned during a period) and the interest cost on those liabilities, less the expected return on plan assets. The expected long-term rate of return on plan assets is applied to a calculated value of plan assets that recognizes changes in fair value over a five-year period. This practice is intended to reduce year-to-year volatility in pension expense, but it can have the effect of delaying the recognition of differences between actual returns on assets and expected returns based on long-term rate of return assumptions. Differences in actual experience in relation to assumptions are not recognized in net income immediately, but are deferred in accumulated other comprehensive income and, if necessary, amortized as pension or OPEB expense.
The workforce reduction plan initiated in the third quarter of 2017 included a curtailment loss of $20 million and a special termination benefit of $49 million as a result of a remeasurement as of September 30, 2017, due to the eliminated future service for approximately 460 management employees. These amounts were recognized in 2017 within compensation and benefits expense in our Consolidated Statements of Income. In connection with this remeasurement, the Company also updated the pension effective discount rate assumption from 4.20% to 3.81%.
Road Initials: UPRR Year: 2017 13
Railroad Annual Report R-1
200. COMPARATIVE STATEMENT OF FINANCIAL POSITION – EXPLANATORY NOTES - CONTINUED
NOTES TO FINANCIAL STATEMENTS
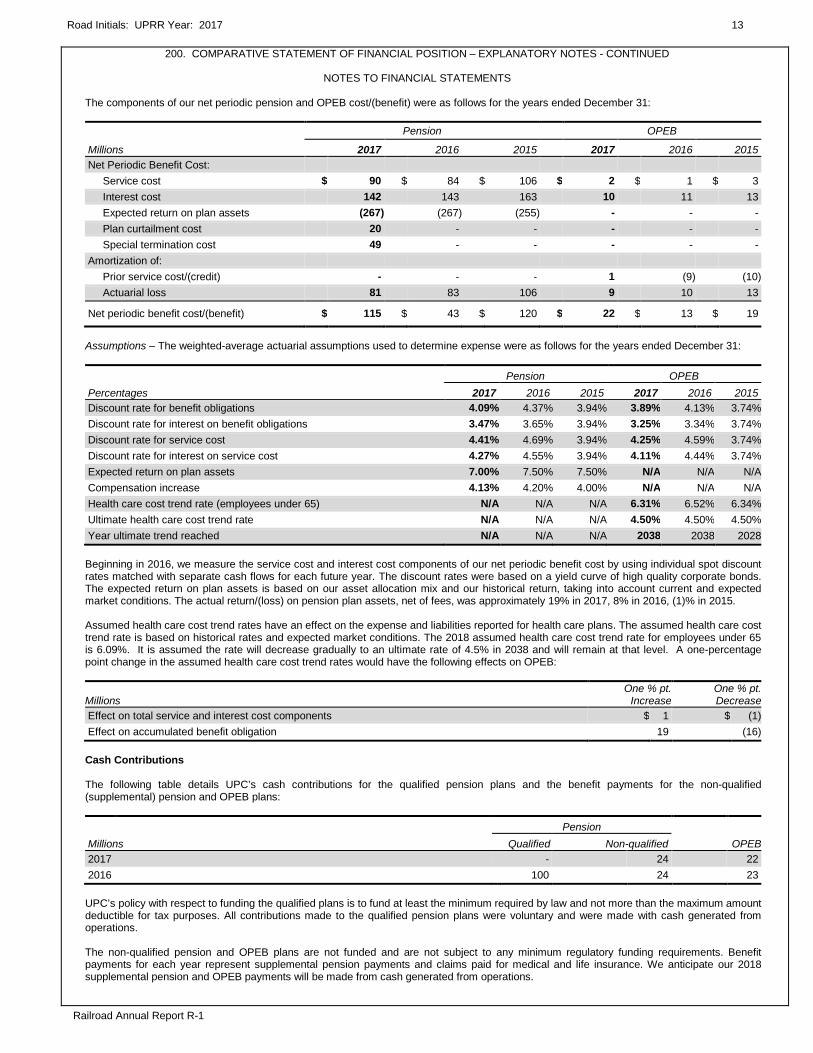
The components of our net periodic pension and OPEB cost/(benefit) were as follows for the years ended December 31:
Pension OPEB
Millions 2017 2016 2015 2017 2016 2015 Net Periodic Benefit Cost: Service cost $ 90 $ 84 $ 106 $ 2 $ 1 $ 3 Interest cost 142 143 163 10 11 13 Expected return on plan assets (267) (267) (255) - - - Plan curtailment cost 20 - - - - - Special termination cost 49 - - - - - Amortization of: Prior service cost/(credit) - - - 1 (9) (10) Actuarial loss 81 83 106 9 10 13
Net periodic benefit cost/(benefit) $ 115 $ 43 $ 120 $ 22 $ 13 $ 19
Assumptions – The weighted-average actuarial assumptions used to determine expense were as follows for the years ended December 31:
Pension OPEB Percentages 2017 2016 2015 2017 2016 2015 Discount rate for benefit obligations 4.09% 4.37% 3.94% 3.89% 4.13% 3.74% Discount rate for interest on benefit obligations 3.47% 3.65% 3.94% 3.25% 3.34% 3.74% Discount rate for service cost 4.41% 4.69% 3.94% 4.25% 4.59% 3.74% Discount rate for interest on service cost 4.27% 4.55% 3.94% 4.11% 4.44% 3.74% Expected return on plan assets 7.00% 7.50% 7.50% N/A N/A N/A Compensation increase 4.13% 4.20% 4.00% N/A N/A N/A Health care cost trend rate (employees under 65) N/A N/A N/A 6.31% 6.52% 6.34% Ultimate health care cost trend rate N/A N/A N/A 4.50% 4.50% 4.50% Year ultimate trend reached N/A N/A N/A 2038 2038 2028
Beginning in 2016, we measure the service cost and interest cost components of our net periodic benefit cost by using individual spot discount rates matched with separate cash flows for each future year. The discount rates were based on a yield curve of high quality corporate bonds. The expected return on plan assets is based on our asset allocation mix and our historical return, taking into account current and expected market conditions. The actual return/(loss) on pension plan assets, net of fees, was approximately 19% in 2017, 8% in 2016, (1)% in 2015. Assumed health care cost trend rates have an effect on the expense and liabilities reported for health care plans. The assumed health care cost trend rate is based on historical rates and expected market conditions. The 2018 assumed health care cost trend rate for employees under 65 is 6.09%. It is assumed the rate will decrease gradually to an ultimate rate of 4.5% in 2038 and will remain at that level. A one-percentage point change in the assumed health care cost trend rates would have the following effects on OPEB:
Millions One % pt.
Increase One % pt. Decrease
Effect on total service and interest cost components $ 1 $ (1) Effect on accumulated benefit obligation 19 (16)
Cash Contributions The following table details UPC’s cash contributions for the qualified pension plans and the benefit payments for the non-qualified (supplemental) pension and OPEB plans: Pension Millions Qualified Non-qualified OPEB 2017 - 24 22 2016 100 24 23
UPC’s policy with respect to funding the qualified plans is to fund at least the minimum required by law and not more than the maximum amount deductible for tax purposes. All contributions made to the qualified pension plans were voluntary and were made with cash generated from operations. The non-qualified pension and OPEB plans are not funded and are not subject to any minimum regulatory funding requirements. Benefit payments for each year represent supplemental pension payments and claims paid for medical and life insurance. We anticipate our 2018 supplemental pension and OPEB payments will be made from cash generated from operations.

14 Road Initials: UPRR Year: 2017
Railroad Annual Report R-1
200. COMPARATIVE STATEMENT OF FINANCIAL POSITION – EXPLANATORY NOTES - CONTINUED
NOTES TO FINANCIAL STATEMENTS
Benefit Payments The following table details expected benefit payments for the years 2018 through 2027: Millions Pension OPEB 2018 212 23 2019 212 22 2020 211 22 2021 212 21 2022 213 20 Years 2023 - 2027 1,101 90 Asset Allocation Strategy UPC’s pension plan asset allocation at December 31, 2017 and 2016, and target allocation for 2018, are as follows:
Target Allocation 2018
Percentage of Plan Assets
December 31, 2017 2016 Equity securities 60% to 70% 69% 68% Debt securities 20% to 30% 22 21 Real estate 2% to 8% 5 6 Commodities 4% to 6% 4 5
Total 100% 100%
The investment strategy for pension plan assets is to maintain a broadly diversified portfolio designed to achieve our target average long-term rate of return of 7.0%. While we believe we can achieve a long-term average rate of return of 7.0%, we cannot be certain that the portfolio will perform to our expectations. Assets are strategically allocated among equity, debt, and other investments in order to achieve a diversification level that reduces fluctuations in investment returns. Asset allocation target ranges for equity, debt, and other portfolios are evaluated at least every three years with the assistance of an independent consulting firm. Actual asset allocations are monitored monthly, and rebalancing actions are executed at least quarterly, if needed. The pension plan investments are held in a Master Trust. The majority of pension plan assets are invested in equity securities because equity portfolios have historically provided higher returns than debt and other asset classes over extended time horizons and are expected to do so in the future. Correspondingly, equity investments also entail greater risks than other investments. Equity risks are balanced by investing a significant portion of the plans’ assets in high quality debt securities. The average credit rating of the debt portfolio exceeded A as of December 31, 2017, and December 31, 2016. The debt portfolio is also broadly diversified and invested primarily in U.S. Treasury, mortgage, and corporate securities. The weighted-average maturity of the debt portfolio was 13 years and 14 years at December 31, 2017 and 2016, respectively. The investment of pension plan assets in securities issued by UPC is explicitly prohibited by the plan for both the equity and debt portfolios, other than through index fund holdings. Fair Value Measurements The pension plan assets are valued at fair value. The following is a description of the valuation methodologies used for the investments measured at fair value, including the general classification of such instruments pursuant to the valuation hierarchy. Temporary Cash Investments – These investments consist of U.S. dollars and foreign currencies held in master trust accounts at The Northern Trust Company (the Trustee). Foreign currencies held are reported in terms of U.S. dollars based on currency exchange rates readily available in active markets. These temporary cash investments are classified as Level 1 investments. Registered Investment Companies – Registered Investment Companies are entities primarily engaged in the business of investing in securities and are registered with the Securities and Exchange Commission. The Plan’s holdings of Registered Investment Companies include both public and private fund vehicles. The public vehicles are mutual funds (real estate) and exchange-traded funds (stocks), which are classified as Level 1 investments. The private vehicles (bonds) do not have published pricing and are valued using Net Asset Value (NAV). Federal Government Securities – Federal Government Securities consist of bills, notes, bonds, and other fixed income securities issued directly by the U.S. Treasury or by government-sponsored enterprises. These assets are valued using a bid evaluation process with bid data provided by independent pricing sources. Federal Government Securities are classified as Level 2 investments. Bonds and Debentures – Bonds and debentures consist of debt securities issued by U.S. and non-U.S. corporations as well as state and local governments. These assets are valued using a bid evaluation process with bid data provided by independent pricing sources. Corporate, state, and municipal bonds and debentures are classified as Level 2 investments. Corporate Stock – This investment category consists of common and preferred stock issued by U.S. and non-U.S. corporations. Most common shares are traded actively on exchanges and price quotes for these shares are readily available. Common stock is classified as a

Road Initials: UPRR Year: 2017 15
Railroad Annual Report R-1
200. COMPARATIVE STATEMENT OF FINANCIAL POSITION – EXPLANATORY NOTES - CONTINUED
NOTES TO FINANCIAL STATEMENTS
Level 1 investment. Preferred shares included in this category are valued using a bid evaluation process with bid data provided by independent pricing sources. Preferred stock is classified as a Level 2 investment. Venture Capital and Buyout Partnerships – This investment category is comprised of interests in limited partnerships that invest primarily in privately-held companies. Due to the private nature of the partnership investments, pricing inputs are not readily observable. Asset valuations are developed by the general partners that manage the partnerships. These valuations are based on the application of public market multiples to private company cash flows, market transactions that provide valuation information for comparable companies, and other methods. The fair value recorded by the Plan is calculated using each partnership’s NAV. Real Estate Partnerships – Most of the Plan’s real estate investments are primarily interests in private real estate investment trusts, partnerships, limited liability companies, and similar structures. Valuations for the holdings in this category are not based on readily observable inputs and are primarily derived from property appraisals. The fair value recorded by the Plan is calculated using the NAV for each investment. Collective Trust and Other Funds – Collective trust and other funds are comprised of shares or units in commingled funds and limited liability companies that are not publicly traded. The underlying assets in these entities (U.S. stock funds, non-U.S. stock funds, commodity funds, hedge funds, and short term investment funds) are publicly traded on exchanges and price quotes for the assets held by these funds are readily available. The fair value recorded by the Plan is calculated using NAV for each investment. This category also includes investments in limited liability companies that invest in publicly-traded securities. The limited liability company investments are funds that invest in both long and short positions in convertible securities, stocks, commodities, and fixed income securities. The underlying securities held by the funds are traded actively on public exchanges and price quotes for these investments are readily available. The fair value recorded by the plan is calculated using the NAV for each investment. As of December 31, 2017, the pension plan assets measured at fair value on a recurring basis were as follows: Quoted Prices Significant in Active Other Significant Markets for Observable Unobservable Identical Inputs Inputs Inputs Millions (Level 1) (Level 2) (Level 3) Total Plan assets: Temporary cash investments $ 27 $ - $ - $ 27 Registered investment companies [a] 4 - - 4 Federal government securities - 182 - 182 Bonds and debentures - 389 - 389 Corporate stock 1,171 8 - 1,179 Total plan assets at fair value $ 1,202 $ 79 $ - 1,781 Plan assets at NAV: Registered investment companies [b] 329 Venture capital and buyout partnerships 358 Real estate partnerships 226 Collective trust and other funds 1,552 Total plan assets at NAV 2,465 Other assets [c] (22)
Total plan assets $ 4,224
[a] Registered investment companies measured at fair value include stock investments. [b] Registered investment companies measured at NAV include bond investments. [c] Other assets include accrued receivables net payables and pending broker settlements.
15A Road Initials: UPRR Year: 2017
Railroad Annual Report R-1
200. COMPARATIVE STATEMENT OF FINANCIAL POSITION – EXPLANATORY NOTES - CONTINUED
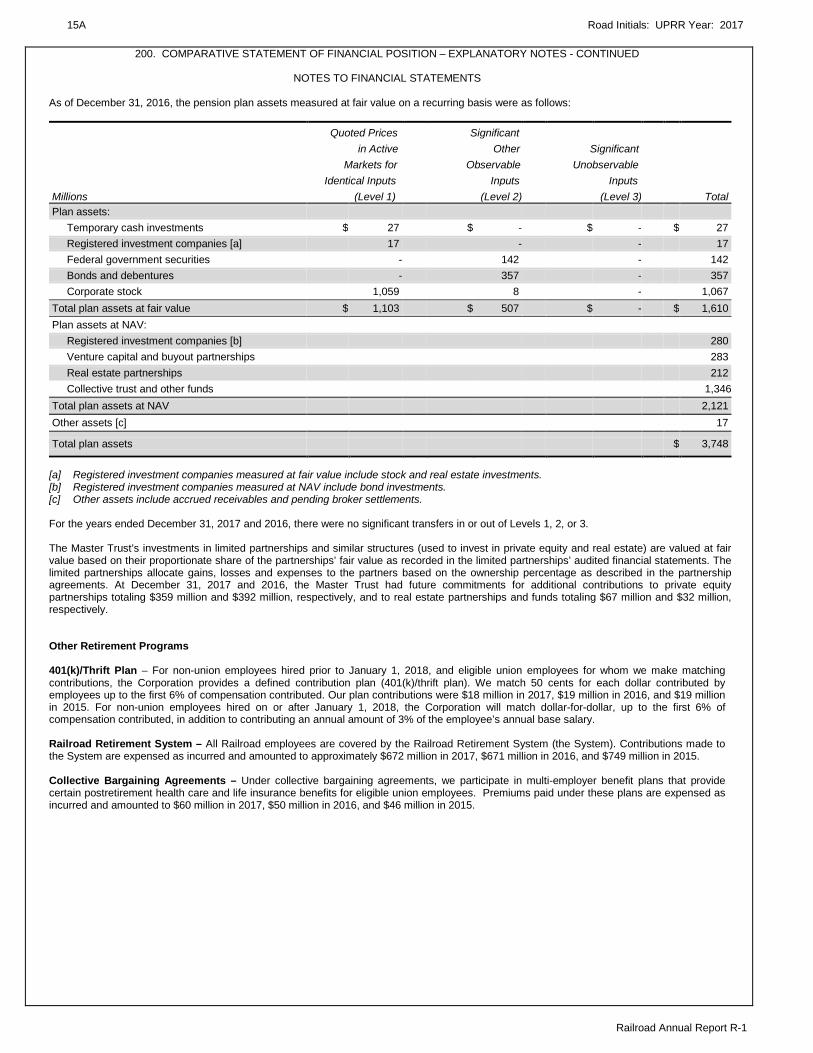
NOTES TO FINANCIAL STATEMENTS As of December 31, 2016, the pension plan assets measured at fair value on a recurring basis were as follows:
Quoted Prices Significant in Active Other Significant Markets for Observable Unobservable Identical Inputs Inputs Inputs Millions (Level 1) (Level 2) (Level 3) Total Plan assets: Temporary cash investments $ 27 $ - $ - $ 27 Registered investment companies [a] 17 - - 17 Federal government securities - 142 - 142 Bonds and debentures - 357 - 357 Corporate stock 1,059 8 - 1,067 Total plan assets at fair value $ 1,103 $ 507 $ - $ 1,610 Plan assets at NAV: Registered investment companies [b] 280 Venture capital and buyout partnerships 283 Real estate partnerships 212 Collective trust and other funds 1,346 Total plan assets at NAV 2,121 Other assets [c] 17
Total plan assets $ 3,748
[a] Registered investment companies measured at fair value include stock and real estate investments. [b] Registered investment companies measured at NAV include bond investments. [c] Other assets include accrued receivables and pending broker settlements.
For the years ended December 31, 2017 and 2016, there were no significant transfers in or out of Levels 1, 2, or 3. The Master Trust’s investments in limited partnerships and similar structures (used to invest in private equity and real estate) are valued at fair value based on their proportionate share of the partnerships’ fair value as recorded in the limited partnerships’ audited financial statements. The limited partnerships allocate gains, losses and expenses to the partners based on the ownership percentage as described in the partnership agreements. At December 31, 2017 and 2016, the Master Trust had future commitments for additional contributions to private equity partnerships totaling $359 million and $392 million, respectively, and to real estate partnerships and funds totaling $67 million and $32 million, respectively. Other Retirement Programs 401(k)/Thrift Plan – For non-union employees hired prior to January 1, 2018, and eligible union employees for whom we make matching contributions, the Corporation provides a defined contribution plan (401(k)/thrift plan). We match 50 cents for each dollar contributed by employees up to the first 6% of compensation contributed. Our plan contributions were $18 million in 2017, $19 million in 2016, and $19 million in 2015. For non-union employees hired on or after January 1, 2018, the Corporation will match dollar-for-dollar, up to the first 6% of compensation contributed, in addition to contributing an annual amount of 3% of the employee’s annual base salary. Railroad Retirement System – All Railroad employees are covered by the Railroad Retirement System (the System). Contributions made to the System are expensed as incurred and amounted to approximately $672 million in 2017, $671 million in 2016, and $749 million in 2015. Collective Bargaining Agreements – Under collective bargaining agreements, we participate in multi-employer benefit plans that provide certain postretirement health care and life insurance benefits for eligible union employees. Premiums paid under these plans are expensed as incurred and amounted to $60 million in 2017, $50 million in 2016, and $46 million in 2015.

Road Initials: UPRR Year: 2017 15B
Railroad Annual Report R-1
200. COMPARATIVE STATEMENT OF FINANCIAL POSITION – EXPLANATORY NOTES - CONTINUED
NOTES TO FINANCIAL STATEMENTS 12. Capital Stock and Dividend Restrictions Our Board of Directors has restricted the availability of retained earnings for payment of dividends by $131 million. This represents (a) the amount by which the estimated fair value of our investment in certain subsidiaries, as determined by our Board of Directors, exceeded the net book value of such investment that was transferred to the Corporation by means of a dividend in June 1971 ($110 million) and (b) the amount by which the fair market value exceeded the book value of certain investment securities that were transferred to the Corporation by means of a dividend in November 1972 ($21 million). Our capital structure consists of Class A Stock and Common Stock. The Class A Stock is entitled to a cash dividend whenever a dividend is declared on the Common Stock, in an amount which equals 8 percent of the sum of the dividends on both the Class A Stock and the Common Stock. All of our Common Stock and our Class A Stock, which constitutes all of the voting capital stock, is owned by the Corporation. Accordingly, there is no market for our capital stock. The number of shares shown in the Statements of Changes in Common Shareholder’s Equity in the Consolidated Financial Statements for the year ended December 31, 2014, excluded 2,665 shares of Common Stock and 232 shares of Class A Stock owned by Southern Pacific Rail Corporation (SPRC), whose results were included in the Consolidated Financial Statements for that year. Effective December 31, 2015, SPRC was dissolved into Union Pacific Railroad Company. 13. Commitments and Contingencies Asserted and Unasserted Claims – Various claims and lawsuits are pending against us and certain of our subsidiaries. We cannot fully determine the effect of all asserted and unasserted claims on our consolidated results of operations, financial condition, or liquidity. To the extent possible, we have recorded a liability where asserted and unasserted claims are considered probable and where such claims can be reasonably estimated. We do not expect that any known lawsuits, claims, environmental costs, commitments, contingent liabilities, or guarantees will have a material adverse effect on our consolidated results of operations, financial condition, or liquidity after taking into account liabilities and insurance recoveries previously recorded for these matters. Personal Injury – The cost of personal injuries to employees and others related to our activities is charged to expense based on estimates of the ultimate cost and number of incidents each year. We use an actuarial analysis to measure the expense and liability, including unasserted claims. The Federal Employers’ Liability Act (FELA) governs compensation for work-related accidents. Under FELA, damages are assessed based on a finding of fault through litigation or out-of-court settlements. We offer a comprehensive variety of services and rehabilitation programs for employees who are injured at work. Our personal injury liability is not discounted to present value due to the uncertainty surrounding the timing of future payments. Approximately 95% of the recorded liability is related to asserted claims and approximately 5% is related to unasserted claims at December 31, 2017. Because of the uncertainty surrounding the ultimate outcome of personal injury claims, it is reasonably possible that future costs to settle these claims may range from approximately $284 million to $310 million. We record an accrual at the low end of the range as no amount of loss within the range is more probable than any other. Estimates can vary over time due to evolving trends in litigation. Our personal injury liability activity was as follows: Millions 2017 2016 2015 Beginning balance $ 290 $ 318 $ 334 Current year accruals 77 75 89 Changes in estimates for prior years (7) (29) (3) Payments (76) (74) (102)
Ending balance at December 31 $ 284 $ 290 $ 318
Current portion, ending balance at December 31 $ 66 $ 61 $ 62
In conjunction with the liability update performed in 2017, we also reassessed our estimated insurance recoveries. We have recognized an asset for estimated insurance recoveries at December 31, 2017, and 2016. Any changes to recorded insurance recoveries are included in the above table in the Changes in estimates for prior years category. Asbestos – We are a defendant in a number of lawsuits in which current and former employees and other parties allege exposure to asbestos. We assess our potential liability using a statistical analysis of resolution costs for asbestos-related claims. This liability is updated annually and excludes future defense and processing costs. The liability for resolving both asserted and unasserted claims was based on the following assumptions:
• The ratio of future claims by alleged disease would be consistent with historical averages adjusted for inflation. • The number of claims filed against us will decline each year. • The average settlement values for asserted and unasserted claims will be equivalent to historical averages. • The percentage of claims dismissed in the future will be equivalent to historical averages.
Our liability for asbestos-related claims is not discounted to present value due to the uncertainty surrounding the timing of future payments. Approximately 16% of the recorded liability related to asserted claims and approximately 84% related to unasserted claims at December 31, 2017. Because of the uncertainty surrounding the ultimate outcome of asbestos-related claims, it is reasonably possible that future costs to

15C Road Initials: UPRR Year: 2017
Railroad Annual Report R-1
200. COMPARATIVE STATEMENT OF FINANCIAL POSITION – EXPLANATORY NOTES - CONTINUED
NOTES TO FINANCIAL STATEMENTS
settle these claims may range from approximately $99 million to $105 million. We record an accrual at the low end of the range as no amount of loss within the range is more probable than any other. Our asbestos-related liability activity was as follows: Millions 2017 2016 2015 Beginning balance $ 111 $ 120 $ 126 Accruals/(Credits) (1) 12 - Payments (11) (21) (6)
Ending balance at December 31 $ 99 $ 111 $ 120
Current portion, ending balance at December 31 $ 9 $ 8 $ 6
In conjunction with the liability update performed in 2017, we also reassessed our estimated insurance recoveries. We have recognized an asset for estimated insurance recoveries at December 31, 2017, and 2016. The amounts recorded for asbestos-related liabilities and related insurance recoveries were based on currently known facts. However, future events, such as the number of new claims filed each year, average settlement costs, and insurance coverage issues, could cause the actual costs and insurance recoveries to be higher or lower than the projected amounts. Estimates also may vary in the future if strategies, activities, and outcomes of asbestos litigation materially change; federal and state laws governing asbestos litigation increase or decrease the probability or amount of compensation of claimants; and there are material changes with respect to payments made to claimants by other defendants. Environmental Costs – We are subject to federal, state, and local environmental laws and regulations. We have identified 315 sites at which we are or may be liable for remediation costs associated with alleged contamination or for violations of environmental requirements. This includes 33 sites that are the subject of actions taken by the U.S. government, 21 of which are currently on the Superfund National Priorities List. Certain federal legislation imposes joint and several liability for the remediation of identified sites; consequently, our ultimate environmental liability may include costs relating to activities of other parties, in addition to costs relating to our own activities at each site. When we identify an environmental issue with respect to property owned, leased, or otherwise used in our business, we perform, with assistance of our consultants, environmental assessments on the property. We expense the cost of the assessments as incurred. We accrue the cost of remediation where our obligation is probable and such costs can be reasonably estimated. Our environmental liability is not discounted to present value due to the uncertainty surrounding the timing of future payments. Our environmental liability activity was as follows: Millions 2017 2016 2015 Beginning balance $ 212 $ 190 $ 182 Accruals 45 84 61 Payments (61) (62) (53)
Ending balance at December 31 $ 196 $ 212 $ 190
Current portion, ending balance at December 31 $ 57 $ 55 $ 52
The environmental liability includes future costs for remediation and restoration of sites, as well as ongoing monitoring costs, but excludes any anticipated recoveries from third parties. Cost estimates are based on information available for each site, financial viability of other potentially responsible parties, and existing technology, laws, and regulations. The ultimate liability for remediation is difficult to determine because of the number of potentially responsible parties, site-specific cost sharing arrangements with other potentially responsible parties, the degree of contamination by various wastes, the scarcity and quality of volumetric data related to many of the sites, and the speculative nature of remediation costs. Estimates of liability may vary over time due to changes in federal, state, and local laws governing environmental remediation. Current obligations are not expected to have a material adverse effect on our consolidated results of operations, financial condition, or liquidity. Insurance – The Corporation has a consolidated, wholly-owned captive insurance subsidiary (the captive), that provides insurance coverage for certain risks including FELA claims and property coverage which are subject to reinsurance. The captive entered into annual reinsurance treaty agreements that insure workers compensation, general liability, auto liability and FELA risk. The captive cedes a portion of its FELA exposure through the treaty and assumes a proportionate share of the entire risk. The captive receives direct premiums, which are netted against the Corporation’s premium costs in other expenses in the Consolidated Statements of Income. The treaty agreements provide for certain protections against the risk of treaty participants’ non-performance, and we do not believe our exposure to treaty participants’ non-performance is material at this time. In the event the Corporation leaves the reinsurance program, the Corporation is not relieved of its primary obligation to the policyholders for activity prior to the termination of the treaty agreements. We record both liabilities and reinsurance receivables using an actuarial analysis based on historical experience in our Consolidated Statements of Financial Position. Guarantees – At December 31, 2017, and 2016, we were contingently liable for $33 million and $43 million in guarantees, respectively. The fair value of these obligations as of both December 31, 2017, and 2016 was $0. We entered into these contingent guarantees in the normal course of business, and they include guaranteed obligations related to our affiliated operations. The final guarantee expires in 2022. We are not aware of any existing event of default that would require us to satisfy these guarantees. We do not expect that these guarantees will have a material adverse effect on our consolidated financial condition, results of operations, or liquidity.
Road Initials: UPRR Year: 2017 15D
Railroad Annual Report R-1
200. COMPARATIVE STATEMENT OF FINANCIAL POSITION – EXPLANATORY NOTES - CONTINUED
NOTES TO FINANCIAL STATEMENTS
Indemnities – We are contingently obligated under a variety of indemnification arrangements, although in some cases the extent of our potential liability is limited, depending on the nature of the transactions and the agreements. Due to uncertainty as to whether claims will be made or how they will be resolved, we cannot reasonably determine the probability of an adverse claim or reasonably estimate any adverse liability or the total maximum exposure under these indemnification arrangements. We do not have any reason to believe that we will be required to make any material payments under these indemnity provisions.
14. Union Pacific Fund for Effective Government The Corporation, UPRR’s parent, is the sponsor of the Union Pacific Fund for Effective Government (the FFEG), a separate segregated fund utilized for political purposes, established and operated in accordance with the Federal Election Campaign Act of 1971, as amended, (the Act). The administrative expenses of the FFEG are paid by the Corporation. UPRR’s executive and administrative personnel are solicited annually by the FFEG within the guidelines of the Act and certain executive officers of UPRR are members of the FFEG’s managing finance committee. 15. Accounts Receivable Accounts receivable includes freight and other receivables reduced by an allowance for doubtful accounts. The allowance is based upon historical losses, credit worthiness of customers, and current economic conditions. At December 31, 2017, and 2016, our accounts receivable were reduced by $3 million and $5 million, respectively. Receivables not expected to be collected in one year and the associated allowances are classified as other assets in our Consolidated Statements of Financial Position. At both December 31, 2017, and 2016, receivables classified as other assets were reduced by allowances of $17 million. Receivables Securitization Facility – We maintain a $650 million, 3-year receivables securitization facility (the Receivables Facility), which now matures in July 2019. Under the Receivables Facility, we sell most of our eligible third-party receivables to Union Pacific Receivables, Inc. (UPRI), a consolidated, wholly-owned, bankruptcy-remote subsidiary that may subsequently transfer, without recourse, an undivided interest in accounts receivable to investors. The investors have no recourse to our other assets except for customary warranty and indemnity claims. Creditors of the Railroad do not have recourse to the assets of UPRI. The amount outstanding under the Receivables Facility was $500 million and $0 million at December 31, 2017, and December 31, 2016, respectively. The Receivables Facility was supported by $1.1 billion and $1.0 billion of accounts receivable as collateral at December 31, 2017, and December 31, 2016, respectively, which, as a retained interest, is included in accounts receivable, net in our Consolidated Statements of Financial Position. The outstanding amount we are allowed to maintain under the Receivables Facility, with a maximum of $650 million, may fluctuate based on the availability of eligible receivables and is directly affected by business volumes and credit risks, including receivables payment quality measures such as default and dilution ratios. If default or dilution ratios increase one percent, the allowable outstanding amount under the Receivables Facility would not materially change. The costs of the Receivables Facility include interest, which will vary based on prevailing benchmark and commercial paper rates, program fees paid to participating banks, commercial paper issuance costs, and fees of participating banks for unused commitment availability. The costs of the Receivables Facility are included in interest expense and were $6 million, $7 million and $5 million for 2017, 2016, and 2015, respectively.

16 Road Initials: UPRR Year: 2017
Railroad Annual Report R-1
210. RESULTS OF OPERATIONS(Dollars in Thousands)
1 Disclose the requested information for respondent pertaining to results of operations for Cross-checks the year.
Schedule 210 Schedule 2102 Report total operating expenses from Schedule 410. Any differences between this Line 15, col b = Line 65, col b
schedule and Schedule 410 must be explained on page 18. Lines 47,48,49 col b = Line 66, col bLine 50, col b = Line 67, col b
3 List dividends from investments accounted for under the cost method on line 19, and list dividends accounted for under the equity method on line 25. Schedule 410
Line 14, col b = Line 620, col h4 All contra entries should be shown in parenthesis. Line 14, col d = Line 620, col f
Line 14, col e = Line 620, col g
Freight-related Passenger-relatedLine Cross Amount for Amount for revenue and revenue and LineNo. Check Item current year preceding year expenses expenses No.
(a) (b) (c) (d) (e)ORDINARY ITEMS
OPERATING INCOMERailway Operating Income
1 (101) Freight 19,837,273 18,600,852 19,837,273 12 (102) Passenger 127,048 121,150 127,048 23 (103) Passenger-Related 1,177 123 1,177 34 (104) Switching 163,634 163,173 163,634 45 (105) Water Transfers 19,875 21,183 19,875 56 (106) Demurrage 114,603 107,120 114,603 67 (110) Incidental 879,991 831,699 879,991 78 (121) Joint Facility-Credit 13,604 11,010 13,604 89 (122) Joint Facility-Debit 9
10 (501) Railway operating revenues (Exclusive of transfers 10 from government authorities-lines 1-9) 21,157,205 19,856,310 21,028,980 128,225
11 (502) Railway operating revenues-transfers from government 11 authorities 82,759 84,121 82,759
12 (503) Railway operating revenues-amortization of deferred 12 transfers from government authorities
13 TOTAL RAILWAY OPERATING REVENUES (lines 10-12) 21,239,964 19,940,431 21,028,980 210,984 1314 * (531) Railway operating expenses 13,551,333 12,752,314 13,344,562 206,771 1415 * Net revenue from railway operations 7,688,631 7,188,117 7,684,418 4,213 15
OTHER INCOME16 (506) Revenue from property used in other than carrier operations 85,887 19,718 1617 (510) Miscellaneous rent income 120,646 106,735 1718 (512) Separately operated properties-Profit 1819 (513) Dividend income (cost method) 213 1920 (514) Interest income 264,461 210,800 2021 (516) Income from sinking and other funds 2122 (517) Release of premiums on funded debt 104 207 2223 (518) Reimbursements received under contracts and agreements 2324 (519) Miscellaneous income 120,270 119,474 24
Income from affiliated companies: 51925 a. Dividends (equity method) 83,230 31,637 2526 b. Equity in undistributed earnings (losses) 308,215 109,618 2627 TOTAL OTHER INCOME (lines 16-26) 982,813 598,402 2728 TOTAL INCOME (lines 15, 27) 8,671,444 7,786,519 28
MISCELLANEOUS DEDUCTIONS FROM INCOME29 (534) Expenses of property used in other than carrier operations 12,569 13,213 2930 (544) Miscellaneous taxes 3031 (545) Separately operated properties-Loss 3132 (549) Maintenance of investment organization 3233 (550) Income transferred under contracts and agreements 3334 (551) Miscellaneous income charges 42,318 52,701 3435 (553) Uncollectible accounts 3536 TOTAL MISCELLANEOUS DEDUCTIONS 54,887 65,914 3637 Income available for fixed charges 8,616,557 7,720,605 37
Road Initials: UPRR Year: 2017 17
Railroad Annual Report R-1
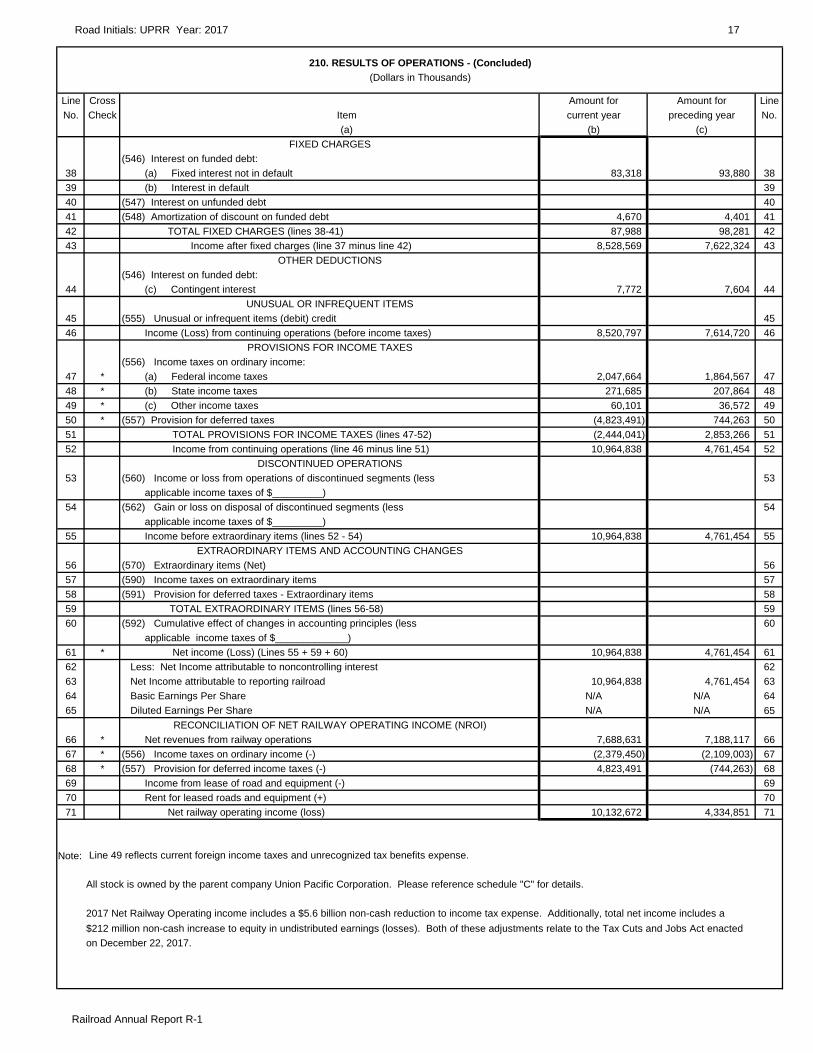
210. RESULTS OF OPERATIONS - (Concluded)(Dollars in Thousands)
Line Cross Amount for Amount for LineNo. Check Item current year preceding year No.
(a) (b) (c)FIXED CHARGES
(546) Interest on funded debt:38 (a) Fixed interest not in default 83,318 93,880 3839 (b) Interest in default 3940 (547) Interest on unfunded debt 4041 (548) Amortization of discount on funded debt 4,670 4,401 4142 TOTAL FIXED CHARGES (lines 38-41) 87,988 98,281 4243 Income after fixed charges (line 37 minus line 42) 8,528,569 7,622,324 43
OTHER DEDUCTIONS(546) Interest on funded debt:
44 (c) Contingent interest 7,772 7,604 44UNUSUAL OR INFREQUENT ITEMS
45 (555) Unusual or infrequent items (debit) credit 4546 Income (Loss) from continuing operations (before income taxes) 8,520,797 7,614,720 46
PROVISIONS FOR INCOME TAXES(556) Income taxes on ordinary income:
47 * (a) Federal income taxes 2,047,664 1,864,567 4748 * (b) State income taxes 271,685 207,864 4849 * (c) Other income taxes 60,101 36,572 4950 * (557) Provision for deferred taxes (4,823,491) 744,263 5051 TOTAL PROVISIONS FOR INCOME TAXES (lines 47-52) (2,444,041) 2,853,266 5152 Income from continuing operations (line 46 minus line 51) 10,964,838 4,761,454 52
DISCONTINUED OPERATIONS53 (560) Income or loss from operations of discontinued segments (less 53
applicable income taxes of $_________)54 (562) Gain or loss on disposal of discontinued segments (less 54
applicable income taxes of $_________)55 Income before extraordinary items (lines 52 - 54) 10,964,838 4,761,454 55
EXTRAORDINARY ITEMS AND ACCOUNTING CHANGES56 (570) Extraordinary items (Net) 5657 (590) Income taxes on extraordinary items 5758 (591) Provision for deferred taxes - Extraordinary items 5859 TOTAL EXTRAORDINARY ITEMS (lines 56-58) 5960 (592) Cumulative effect of changes in accounting principles (less 60
applicable income taxes of $_____________)61 * Net income (Loss) (Lines 55 + 59 + 60) 10,964,838 4,761,454 6162 Less: Net Income attributable to noncontrolling interest 6263 Net Income attributable to reporting railroad 10,964,838 4,761,454 6364 Basic Earnings Per Share N/A N/A 6465 Diluted Earnings Per Share N/A N/A 65
RECONCILIATION OF NET RAILWAY OPERATING INCOME (NROI)66 * Net revenues from railway operations 7,688,631 7,188,117 6667 * (556) Income taxes on ordinary income (-) (2,379,450) (2,109,003) 6768 * (557) Provision for deferred income taxes (-) 4,823,491 (744,263) 6869 Income from lease of road and equipment (-) 6970 Rent for leased roads and equipment (+) 7071 Net railway operating income (loss) 10,132,672 4,334,851 71
Note:
$212 million non-cash increase to equity in undistributed earnings (losses). Both of these adjustments relate to the Tax Cuts and Jobs Act enacted on December 22, 2017.
Line 49 reflects current foreign income taxes and unrecognized tax benefits expense.
All stock is owned by the parent company Union Pacific Corporation. Please reference schedule "C" for details.
2017 Net Railway Operating income includes a $5.6 billion non-cash reduction to income tax expense. Additionally, total net income includes a

18 Road Initials: UPRR Year: 2017
Railroad Annual Report R-1
210 A. CONSOLIDATED STATEMENTS OF COMPREHENSIVE INCOME(Dollars in Thousands)
1 This schedule applies only to entities with items of Other Comprehensive Income (OCI)Schedule 210 Schedule 210 ALine 61, col b = Line 1, col b
2 Entities must present comprehensive income in two separate but consecutive financial statements.
3 Entities must present reclassification adjustments and the effectsof those adjustments on net income and OCI on the face of thefinancial statements.
Line Cross Amount for Amount for LineNo. Check Item current year preceding year No.
(a) (b) (c)1 10,964,838 4,761,454 1
2 (120,422) (48,257) 2
3 Unrealized holding gains arising during period 34 4
Defined benefit pension plans:5 Prior service cost arising during period 469 (5,658) 56 Net loss arising during period 46,670 (79,848) 67 78 Other Comprehensive Income (Loss) 68,149 57,502 89 Comprehensive Income (Loss) 10,959,704 4,685,193 910 1011 10,959,704 4,685,193 11
Notes:
Cross-Checks
Other Comprehensive Income, net of tax: Foreign currency translation adjustments Unrealized gains on securities:
Less: amortization of prior service cost included in net periodic pension cost
Less: comprehensive income attributable to noncontrolling interest Comprehensive Income attributable to reporting railroad (Loss)
Net Income
Less: reclassification adjustment for gains included in net income
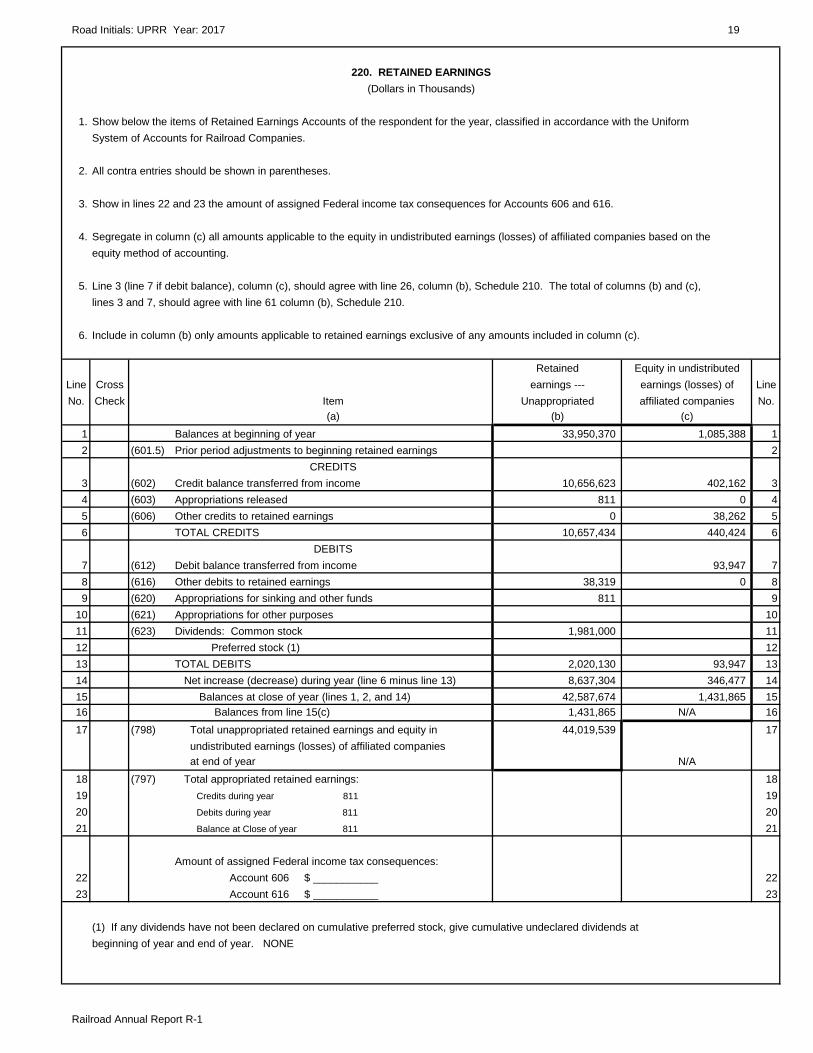
Road Initials: UPRR Year: 2017 19
Railroad Annual Report R-1
220. RETAINED EARNINGS(Dollars in Thousands)
1. Show below the items of Retained Earnings Accounts of the respondent for the year, classified in accordance with the UniformSystem of Accounts for Railroad Companies.
2. All contra entries should be shown in parentheses.
3. Show in lines 22 and 23 the amount of assigned Federal income tax consequences for Accounts 606 and 616.
4. Segregate in column (c) all amounts applicable to the equity in undistributed earnings (losses) of affiliated companies based on theequity method of accounting.
5. Line 3 (line 7 if debit balance), column (c), should agree with line 26, column (b), Schedule 210. The total of columns (b) and (c),lines 3 and 7, should agree with line 61 column (b), Schedule 210.
6. Include in column (b) only amounts applicable to retained earnings exclusive of any amounts included in column (c).
Retained Equity in undistributedLine Cross earnings --- earnings (losses) of LineNo. Check Item Unappropriated affiliated companies No.
(a) (b) (c)1 Balances at beginning of year 33,950,370 1,085,388 12 (601.5) Prior period adjustments to beginning retained earnings 2
CREDITS3 (602) Credit balance transferred from income 10,656,623 402,162 34 (603) Appropriations released 811 0 45 (606) Other credits to retained earnings 0 38,262 56 TOTAL CREDITS 10,657,434 440,424 6
DEBITS7 (612) Debit balance transferred from income 93,947 78 (616) Other debits to retained earnings 38,319 0 89 (620) Appropriations for sinking and other funds 811 9
10 (621) Appropriations for other purposes 1011 (623) Dividends: Common stock 1,981,000 1112 Preferred stock (1) 1213 TOTAL DEBITS 2,020,130 93,947 1314 Net increase (decrease) during year (line 6 minus line 13) 8,637,304 346,477 1415 Balances at close of year (lines 1, 2, and 14) 42,587,674 1,431,865 1516 Balances from line 15(c) 1,431,865 N/A 1617 (798) Total unappropriated retained earnings and equity in 44,019,539 17
undistributed earnings (losses) of affiliated companies at end of year N/A
18 (797) Total appropriated retained earnings: 1819 Credits during year 811 1920 Debits during year 811 2021 Balance at Close of year 811 21
Amount of assigned Federal income tax consequences:22 Account 606 $ ___________ 2223 Account 616 $ ___________ 23
(1) If any dividends have not been declared on cumulative preferred stock, give cumulative undeclared dividends atbeginning of year and end of year. NONE

20 Road Initials: UPRR Year: 2017
Railroad Annual Report R-1
240. STATEMENT OF CASH FLOWS(Dollars in Thousands)
Give the information as requested concerning the cash flows during the year. Either direct or indirect method can be used. The direct method shows as its principal components operating cash receipts and payments, such as cash received from customers and cash paid to suppliers and employees, the sum of which is net cash flow from operating activities. The indirect method starts with net income and adjusts it for revenue and expense items that were not the result of operating cash transactions in the current period to reconcile it to net cash flow from operating activities. If direct method is used complete lines 1-41; indirect method complete lines 10-41. Cash for the purpose of this schedule shall include cash and cash equivalents which are short term, highly liquid investments readily convertible to know amounts of cash and so near their maturity that they present insignificant risk of changes in value because of changes in interest rates. Information about all investing and financing activities which do not directly affect cash shall be separately disclosed in footnotes to this schedule. They shall clearly relate the cash (if any) and noncash aspects of transactions. Examples of noncash investing and transactions include converting debt to equity acquiring assets of assuming directly related liabilities, such as purchasing a building by incurring a mortgage to the seller; obtaining as asset by entering into a capital lease; and exchanging noncash assets or liabilities for other noncash assets or liabilities. Some transactions are part cash and part noncash; only the cash portion shall be reported directly in the statement of cash flows. Refer to FAS Statement No. 95, Statement of Cash Flows, for further details.
CASH FLOWS FROM OPERATING ACTIVITIESLine Cross Description Current Year Prior Year LineNo. Check (a) (b) (c)
1 Cash received from operating revenues 12 Dividends received from affiliates 23 Interest received 34 Other income 45 Cash paid for operating expenses 56 Interest paid (net of amounts capitalized) 67 Income taxes paid 78 Other - net 89 NET CASH PROVIDED BY OPERATING ACTIVITIES (lines 1 through 8) 9
RECONCILIATION OF NET INCOME TO NET CASH PROVIDED BY OPERATING ACTIVITIESLine Cross Description Current Year Prior Year LineNo. Check (a) (b) (c) No.10 Income from continuing operations 10,964,838 4,761,454 10
ADJUSTMENTS TO RECONCILE INCOME FROM CONTINUING OPERATIONS TO NET CASH PROVIDED BY OPERATING ACTIVITIESLine Cross Description Current Year Prior Year LineNo. Check (a) (b) (c) No.
11 Loss (gain) on sale or disposal of tangible property and investments (111,169) (94,733) 1112 Depreciation and amortization expenses 2,197,032 2,116,475 1213 Net increase (decrease) in Provision for Deferred Income Taxes (4,823,491) 744,263 1314 Net decrease (increase) in undistributed earnings (losses) of affiliates (308,215) (109,618) 1415 Decrease (increase) in accounts receivable (213,945) 132,106 1516 Decrease (increase) in material and supplies and other current assets (152,435) 335,923 1617 Increase (decrease) in current liabilities other than debt 263,167 254,141 1718 Increase (decrease) in other - net (129,854) (203,705) 1819 Net cash provided from continuing operations (Lines 10-18) 7,685,928 7,936,306 1920 Add (Subtract) cash generated (paid) by reason of discontinued operations 20
and extraordinary items21 NET CASH PROVIDED FROM OPERATING ACTIVITIES (lines 19 and 20) 7,685,928 7,936,306 21
CASH FLOWS FROM INVESTING ACTIVITIESLine Cross Description Current Year Prior Year LineNo. Check (a) (b) (c) No.
22 Proceeds from sale of property 167,560 128,909 2223 Capital expenditures (3,240,537) (3,505,159) 2324 Net change in temporary cash investments not qualifying as cash equivalents 0 0 2425 Proceeds from sale/repayment of investment and advances 0 0 2526 Purchase price of long-term investment and advances (4,927) (18,236) 2627 Net decrease (increase) in sinking and other special funds (862) (851) 2728 Other - net 26,229 49,948 2829 NET CASH USED IN INVESTING ACTIVITIES (lines 22 through 28) (3,052,537) (3,345,389) 29
(Continued on next page)

Road Initials: UPRR Year: 2017 21
Railroad Annual Report R-1
240. STATEMENT OF CASH FLOWS - Concluded(Dollars in Thousands)
CASH FLOWS FROM OPERATING ACTIVITIESLine Cross Description Current Year Prior Year LineNo. Check (a) (b) (c) No.
CASH FLOWS FROM FINANCING ACTIVITIES
30 Proceeds from issuance of long-term debt 500,000 150,773 3031 Principle payments of long-term debt (284,950) (609,148) 3132 Proceeds from issuance of capital stock 3233 Purchase price of acquiring treasury stock 3334 Cash dividends paid (1,981,000) (1,879,000) 3435 Other - net (2,716,606) (2,382,261) 3536 NET CASH FROM FINANCING ACTIVITIES (lines 30 through 35) (4,482,556) (4,719,636) 3637 NET INCREASE (DECREASE) IN CASH AND CASH EQUIVALENTS (lines 21, 29 & 36) 150,835 (128,719) 3738 Cash and cash equivalents at beginning of the year 86,056 214,775 3839 CASH AND CASH EQUIVALENTS AT END OF THE YEAR (lines 37 & 38) 236,891 86,056 39
Footnotes to Schedule 240Cash paid during the year for:
40 Interest (net of amount capitalized)* (96,000) (106,000) 4041 Income taxes (net of refunds) * (2,438,000) (1,739,000) 41
* Only applies if indirect method is adopted.
NOTES AND REMARKSNon-cash capital investments accrued but not yet paid were $366,000 and $223,000 in 2017 and 2016, respectively.Non-cash capital lease financings were $19,000 and $0 in 2017 and 2016, respectively.

22 Road Initials: UPRR Year: 2017
Railroad Annual Report R-1
245. WORKING CAPITAL(Dollars in Thousands)
1. This schedule should include only data pertaining to railway transportation services.2. Carry out calculation of lines 9, 10, 20 and 21 to the nearest whole number.
Line Item Source Amount LineNo. (a) (b) No.
CURRENT OPERATING ASSETS1 Interline and Other Balances (705) Schedule 200, line 5, column b 88,711 12 Customers (706) Schedule 200, line 6, column b 1,184,500 23 Other (707) Note A 81,934 34 TOTAL CURRENT OPERATING ASSETS Line 1 + 2+ 3 1,355,145 4
OPERATING REVENUE5 Railway Operating Revenue Schedule 210, line 13, column b 21,239,964 56 Rent Income Note B 165,410 67 TOTAL OPERATING REVENUES Lines 5 + 6 21,405,374 78 Average Daily Operating Revenues Line 7 divided by 360 days 59,459 89 Days of Operating Revenue in Current Operating Assets Line 4 divided by line 8 23 9
10 Revenue Delay Days Plus Buffer Line 9 + 15 days 38 10CURRENT OPERATING LIABILITIES
11 Interline and Other Balances (752) Schedule 200, line 30, column b 33,032 1112 Audited Accounts and Wages Payable (753) Note A 212,037 1213 Accounts Payable - Other (754) Note A 39,623 1314 Other Taxes Accrued (761.5) Note A 530,102 1415 TOTAL CURRENT OPERATING LIABILITIES Sum of lines 11 to 14 814,794 15
OPERATING EXPENSES16 Railway Operating Expenses Schedule 210, line 14, column b 13,551,333 1617 Depreciation Schedule 410, lines 136, 137, 138, 2,197,032 17
213, 232, 317, column h18 Cash Related Operating Expenses Line 16 + line 6 - line 17 11,519,711 1819 Average Daily Expenditures Line 18 divided by 360 days 31,999 1920 Days of Operating Expenses in Current Operating Liabilities Line 15 divided by line 19 25 2021 Days of Working Capital Required Line 10 - Line 20 (Note C) 13 2122 Cash Working Capital Required Line 21 x line 19 415,987 2223 Cash and Temporary Cash Balance Schedule 200,line 1 + line 2,column b 279,828 2324 Cash Working Capital Allowed Lesser line 22 and line 23 279,828 24
MATERIALS AND SUPPLIES25 Total Material and Supplies (712) Note A 749,560 2526 Scrap and Obsolete Material included in Acct. 712 Note A 3,359 2627 Materials and Supplies held for Common Carrier Purposes Line 25 - line 26 746,201 2728 TOTAL WORKING CAPITAL Line 24 + line 27 1,026,029 28
NOTES:
(A) Use common carrier portion only. Common carrier refers to railway transportation service.(B) Rent Income is the sum of Schedule 410, column h, lines 121, 122, 123, 127, 128, 129, 133, 134, 135, 208, 210, 212, 227,
229, 231, 312, 314, and 316. Rent income is added to railway operating revenues to produce total revenues. Rent incomeis also added to total operating expenses to exclude the rent revenue items from operating expense.
(C) If result is negative, use zero.

Road Initials: UPRR Year: 2017 23
Railroad Annual Report R-1
NOTES AND REMARKS
(This page intentionally left blank)
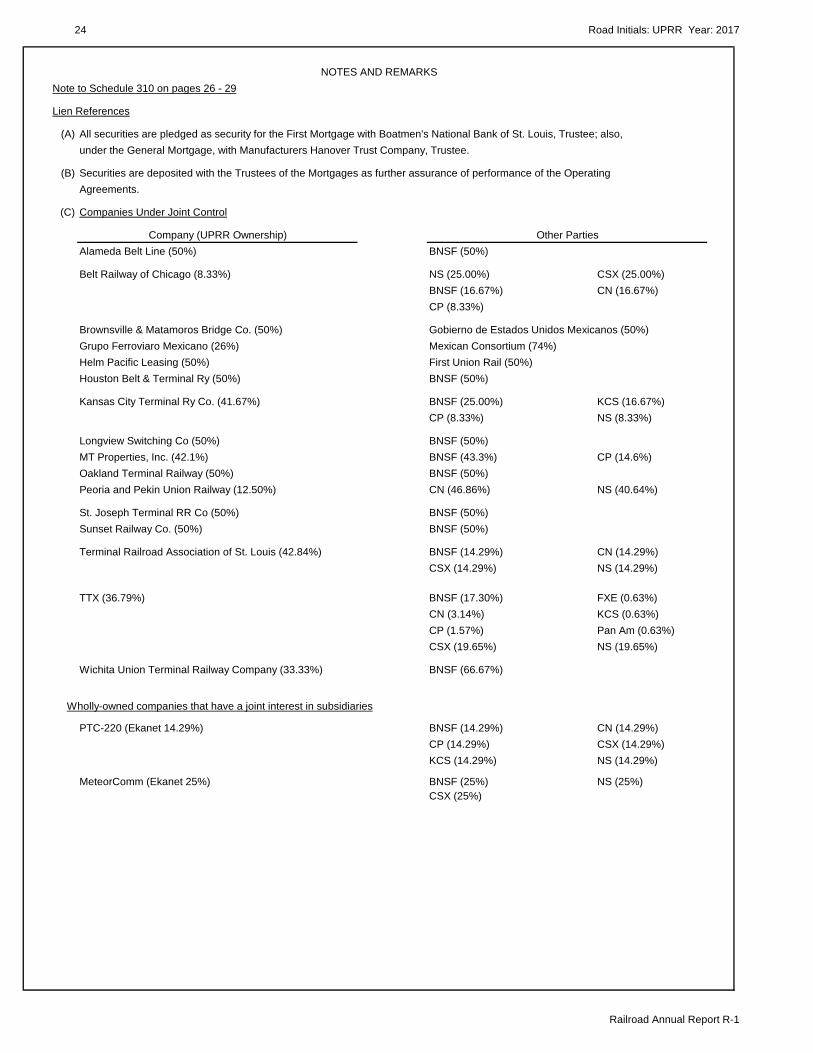
24 Road Initials: UPRR Year: 2017
Railroad Annual Report R-1
NOTES AND REMARKSNote to Schedule 310 on pages 26 - 29
Lien References
(A) All securities are pledged as security for the First Mortgage with Boatmen's National Bank of St. Louis, Trustee; also,under the General Mortgage, with Manufacturers Hanover Trust Company, Trustee.
(B) Securities are deposited with the Trustees of the Mortgages as further assurance of performance of the OperatingAgreements.
(C) Companies Under Joint Control
Company (UPRR Ownership) Other PartiesAlameda Belt Line (50%) BNSF (50%)
Belt Railway of Chicago (8.33%) NS (25.00%) CSX (25.00%)BNSF (16.67%) CN (16.67%)CP (8.33%)
Brownsville & Matamoros Bridge Co. (50%) Gobierno de Estados Unidos Mexicanos (50%)Grupo Ferroviaro Mexicano (26%) Mexican Consortium (74%)Helm Pacific Leasing (50%) First Union Rail (50%)Houston Belt & Terminal Ry (50%) BNSF (50%)
Kansas City Terminal Ry Co. (41.67%) BNSF (25.00%) KCS (16.67%)CP (8.33%) NS (8.33%)
Longview Switching Co (50%) BNSF (50%)MT Properties, Inc. (42.1%) BNSF (43.3%) CP (14.6%)Oakland Terminal Railway (50%) BNSF (50%)Peoria and Pekin Union Railway (12.50%) CN (46.86%) NS (40.64%)
St. Joseph Terminal RR Co (50%) BNSF (50%)Sunset Railway Co. (50%) BNSF (50%)
Terminal Railroad Association of St. Louis (42.84%) BNSF (14.29%) CN (14.29%)CSX (14.29%) NS (14.29%)
TTX (36.79%) BNSF (17.30%) FXE (0.63%)CN (3.14%) KCS (0.63%)CP (1.57%) Pan Am (0.63%)CSX (19.65%) NS (19.65%)
Wichita Union Terminal Railway Company (33.33%) BNSF (66.67%)
Wholly-owned companies that have a joint interest in subsidiaries
PTC-220 (Ekanet 14.29%) BNSF (14.29%) CN (14.29%)CP (14.29%) CSX (14.29%)KCS (14.29%) NS (14.29%)
MeteorComm (Ekanet 25%) BNSF (25%) NS (25%)CSX (25%)
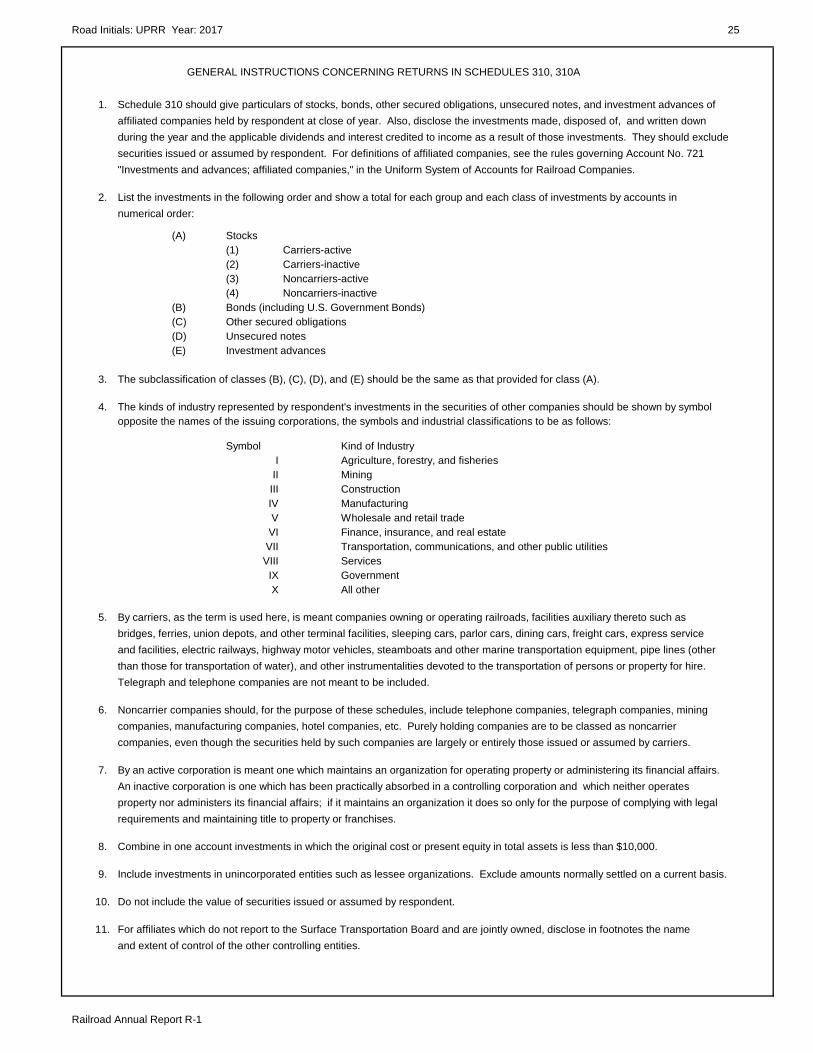
Road Initials: UPRR Year: 2017 25
Railroad Annual Report R-1
GENERAL INSTRUCTIONS CONCERNING RETURNS IN SCHEDULES 310, 310A
1. Schedule 310 should give particulars of stocks, bonds, other secured obligations, unsecured notes, and investment advances ofaffiliated companies held by respondent at close of year. Also, disclose the investments made, disposed of, and written downduring the year and the applicable dividends and interest credited to income as a result of those investments. They should excludesecurities issued or assumed by respondent. For definitions of affiliated companies, see the rules governing Account No. 721"Investments and advances; affiliated companies," in the Uniform System of Accounts for Railroad Companies.
2. List the investments in the following order and show a total for each group and each class of investments by accounts innumerical order:
(A) Stocks(1) Carriers-active(2) Carriers-inactive(3) Noncarriers-active(4) Noncarriers-inactive
(B) Bonds (including U.S. Government Bonds)(C) Other secured obligations(D) Unsecured notes(E) Investment advances
3. The subclassification of classes (B), (C), (D), and (E) should be the same as that provided for class (A).
4. The kinds of industry represented by respondent's investments in the securities of other companies should be shown by symbolopposite the names of the issuing corporations, the symbols and industrial classifications to be as follows:
Symbol Kind of IndustryI Agriculture, forestry, and fisheriesII MiningIII ConstructionIV ManufacturingV Wholesale and retail tradeVI Finance, insurance, and real estateVII Transportation, communications, and other public utilitiesVIII Services
IX GovernmentX All other
5. By carriers, as the term is used here, is meant companies owning or operating railroads, facilities auxiliary thereto such asbridges, ferries, union depots, and other terminal facilities, sleeping cars, parlor cars, dining cars, freight cars, express serviceand facilities, electric railways, highway motor vehicles, steamboats and other marine transportation equipment, pipe lines (otherthan those for transportation of water), and other instrumentalities devoted to the transportation of persons or property for hire.Telegraph and telephone companies are not meant to be included.
6. Noncarrier companies should, for the purpose of these schedules, include telephone companies, telegraph companies, miningcompanies, manufacturing companies, hotel companies, etc. Purely holding companies are to be classed as noncarriercompanies, even though the securities held by such companies are largely or entirely those issued or assumed by carriers.
7. By an active corporation is meant one which maintains an organization for operating property or administering its financial affairs. An inactive corporation is one which has been practically absorbed in a controlling corporation and which neither operatesproperty nor administers its financial affairs; if it maintains an organization it does so only for the purpose of complying with legalrequirements and maintaining title to property or franchises.
8. Combine in one account investments in which the original cost or present equity in total assets is less than $10,000.
9. Include investments in unincorporated entities such as lessee organizations. Exclude amounts normally settled on a current basis.
10. Do not include the value of securities issued or assumed by respondent.
11. For affiliates which do not report to the Surface Transportation Board and are jointly owned, disclose in footnotes the nameand extent of control of the other controlling entities.

26 Road Initials: UPRR Year: 2017
Railroad Annual Report R-1
310. INVESTMENTS AND ADVANCES AFFILIATED COMPANIES(Dollars in Thousands)
1. Give particulars of investments in stocks, bonds, other secured obligations, unsecured notes, and investment advances of companiesaffiliated with respondent, from accounts Nos. 715, (Sinking Funds); 716, (Capital Funds); 721, (Investments and AdvancesAffiliated Companies); and 717, (Other Funds).
2. Entries in this schedule should be made in accordance with the definitions and general instructions given on page 25, classifying theinvestments by means of letters, figures, and symbols in columns (a), (b), and (c).
3. Indicate by means of an arbitrary mark in column (d) the obligation in support of which any security is pledged, mortgaged, or otherwiseencumbered, giving names and other important particulars of such obligations in footnotes.
4. Give totals for each class and for each subclass and a grand total for each account.
5. Entries in column (d) should show date of maturity of bonds and other evidences of indebtedness. In case obligations of the samedesignation mature serially, the date in column (d) may be reported as "Serially _____ to _____." Abbreviations in common use instandard financial publications may be used to conserve space.
Line Account Class Kind of Name of issuing company and also lien reference, if any Extent of LineNo. No. No. Industry (include rate for preferred stocks and bonds) Control No.
(a) (b) (c) (d) (e)1 721 A1 VII STOCKS - CARRIERS ACTIVE 12 23 Belt Railway of Chicago 8.3 34 Brownsville & Matamoros Bridge Co. (A) 50.0 45 Grupo Ferroviario Mexicano 26.0 56 Houston's Belt & Terminal Ry. (A) (B) 50.0 67 Kansas City Terminal Ry. (A) (B) 41.7 78 Longview Switching Co. 50.0 89 MT Properties, Inc. 42.1 9
10 Terminal Railroad Association of St. Louis 42.8 1011 TTX 36.8 1112 1213 1314 1415 1516 721 A3 STOCKS - NONCARRIERS - ACTIVE 1617 1718 VI Helm Pacific Leasing 50.0 1819 X PTC-220, LLC 14.3 1920 X MeteorComm, LLC 25.0 2021 VI AXA Financial Inc. (C) 0.0 2122 2223 2324 TOTAL CLASS A 2425 2526 2627 2728 2829 2930 3031 3132 3233 3334 3435 35
Kind of Industry in Column (c) is VII unless noted.(A) (B) Lien references as described on page 24.(C) Less than 1%.Note: Companies under joint control are listed on pg. 24.

Road Initials: UPRR Year: 2017 27
Railroad Annual Report R-1
310. INVESTMENTS AND ADVANCES AFFILIATED COMPANIES - (Continued)(Dollars in Thousands)
6. In any of the companies included in this schedule are controlled by respondent the percent of control should be shown in column (3). In caseany company listed is controlled other than through actual ownership of securities, give particulars in a footnote. In case of joint control,give names of other parties and particulars of control.
7. If any advances reported are pledged, give particulars in a footnote.
8. Investments in companies in which neither the original cost or present equity in total assets are less than $10,000 may be combined in onefigure.
9. Also include investments in unincorprated entities such as lessee organizations (exclusive of amounts nominally settled on acurrent basis.
10. This schedule should not include securities issued or assumed by respondent.
11. For affiliates which do not report to the Surface Transportation Board and are jointly owned, give names and extent of control by otherentities by footnotes.
Line Opening Deductions (if other Closing Disposed of: Adjustments Dividends or interest LineNo. Balance Additions than sale, explain) Balance profit(loss) Acct. 721.5 credited to income No.
(f) (g) (h) (i) (j) (k) (l)1 12 23 260 260 34 325 325 45 81,688 81,688 56 13 13 67 917 917 78 1 1 89 664 664 9
10 6 6 1011 138,231 138,231 1112 1213 1314 1415 1516 1617 1718 498 498 1819 8,030 600 8,630 1920 73,372 6,500 79,872 2021 26 26 2122 2223 2324 304,031 7,100 0 311,131 2425 2526 2627 2728 2829 2930 3031 3132 3233 3334 3435 3536 3637 3738 3839 3940 40
Investments and Advances

28 Road Initials: UPRR Year: 2017
Railroad Annual Report R-1
310. INVESTMENTS AND ADVANCES AFFILIATED COMPANIES - (Continued)(Dollars in Thousands)
Line Account Class Kind of Name of issuing company and also lien reference, if any Extent of LineNo. No. No. Industry (include rate for preferred stocks and bonds) Control No.
(a) (b) (c) (d) (e)1 372 721 D3 UNSECURED NOTES - NONCARRIERS - ACTIVE 383 394 X Union Pacific Corporation - Net 405 416 TOTAL CLASS D 427 438 449 721 E1 VII INVESTMENT ADVANCES - CARRIERS - ACTIVE 4510 4611 4712 Houston Belt & Terminal Ry. 4813 Kansas City Terminal Ry. Co. 4914 Port Terminal Railroad Association 5015 Wichita Terminal 5116 Longview Switching 5217 TOTAL CLASS E 5318 5419 5520 5621 5722 5823 5924 6025 6126 6227 6328 6429 6530 6631 6732 6833 6934 7035 7136 7237 7338 7439 7540 7641 7742 7843 7944 8045 8146 8247 8348 8449 TOTAL ACCOUNT 721 85
Kind of Industry in Column (c) is VII unless noted otherwise.

Road Initials: UPRR Year: 2017 29
Railroad Annual Report R-1
310. INVESTMENTS AND ADVANCES AFFILIATED COMPANIES - (Concluded)(Dollars in Thousands)
Investments and AdvancesLine Opening Deductions (if other Closing Disposed of: Adjustments Dividends or interest LineNo. Balance Additions than sale, explain) Balance profit (loss) Acct. 721.5 credited to income No.
(f) (g) (h) (i) (j) (k) (l)1 372 383 394 7,676,641 2,717,274 10,393,915 405 416 7,676,641 2,717,274 0 10,393,915 427 438 449 45
10 4611 4712 44,665 (2,706) 41,959 4813 15,302 (57) 15,245 4914 6,885 592 7,477 5015 397 0 397 5116 454 (2) 452 5217 67,703 (2,173) 0 65,530 5318 5419 5520 5621 5722 5823 5924 6025 6126 6227 6328 6429 6530 6631 6732 6833 6934 7035 7136 7237 7338 7439 7540 7641 7742 7843 7944 8045 8146 8247 8348 8449 8,048,375 2,722,201 0 10,770,576 85

30 Road Initials: UPRR Year: 2017
Railroad Annual Report R-1
310A. INVESTMENTS IN COMMON STOCKS OF AFFILIATED COMPANIES(Dollars in Thousands)
Undistributed Earnings From Certain Investments in Affiliated Companies
1. Report below the details of all investments in common stocks included in Account 721, Investments and Advances Affiliated Companies. 2. Enter in column (c) the amount necessary to retroactively adjust those investments. (See instructions 5-2, Uniform System of Accounts.) 3. Enter in column (d) the share of undistributed earnings (i.e., dividends) or losses.4. Enter in column (e) the amortization for the year of the excess of cost over equity in net assets (equity over cost) at date of acquisition. 5. For definitions of "carrier" and "noncarrier," see general instructions.
Equity in Adjustment forAdjustment undistributed investments
Balance at for invest- earnings disposed of or BalanceLine Name of issuing company and beginning ments equity (losses) Amortization written down at close LineNo. description of security held of year method during year during year during year of year No.
(a) (b) (c) (d) (e) (f) (g)CARRIERS: (List specifics for each company)
1 Belt Ry. of Chicago 438 0 0 438 12 Brownsville & Matamoros Bridge Co. 2,589 0 37 2,626 23 Grupo Ferrocarril Mexicano 286,684 38,001 12,205 336,890 34 Houston Belt & Terminal Rwy. 14,066 0 0 14,066 45 Kansas City Terminal Rwy. (6,304) 16 (935) (7,223) 56 MT Properties 739 0 80 819 67 Terminal RR Assn. of St. Louis 48,150 0 9,324 57,474 78 TTX 739,048 192 294,851 1,034,091 89 Sunset Railway 1,009 (23) 986 910 1011 1112 TOTAL CARRIER 1,086,419 38,209 315,539 0 0 1,440,167 1213 1314 1415 1516 1617 NONCARRIER: (List specifics for each company) 1718 Helm Pacific Leasing 44,600 53 2,435 47,088 1819 PTC-220, LLC 734 0 0 734 1920 MeteorComm, LLC (46,365) 0 (9,759) (56,124) 2021 TOTAL NONCARRIER (1,031) 53 (7,324) 0 0 (8,302) 2122 2223 2324 2425 2526 2627 2728 2829 2930 3031 3132 3233 3334 3435 3536 3637 3738 3839 3940 4041 4142 4243 4344 4445 TOTAL EQUITY 1,085,388 38,262 308,215 0 0 1,431,865 45
Road Initials: UPRR Year: 2017 31
Railroad Annual Report R-1
INSTRUCTIONS CONCERNING RETURNS TO BE MADE IN SCHEDULE 330
1. Give particulars of balances at the beginning and close of the year and of all changes during the year in Account No. 731, "Road and EquipmentProperty" and Account No. 732, "Improvements on Leased Property" classified by primary accounts in accordance with the Uniform Systemof Accounts for Railroad Companies. The balances, by primary accounts, should, insofar as known, be stated in column (b) and all changesmade during the year should be analyzed in columns (c) to (f), inclusive. Column (g) should be the net of the amounts in columns (c) through(f). Column (h) is the aggregate of columns (b) through (f), inclusive. Grand totals of columns (b) and (h) should equal the sum of Accounts731 and 732 for the respective periods; if not, a full explanation should be made in a footnote.
2. In column (c), show disbursements made for the specific purpose of purchasing, constructing, and equipping new lines, and for the extensionof old lines, as provided for in Instruction 2-1, "Items to be charged" in the Uniform System of Accounts for Railroad Companies for suchitems.
3. In column (d), show the cost of a railway or portion thereof, acquired as an operating entity or system by purchase, merger, consolidation,reorganization, receivership sale or transfer, or otherwise.
4. Columns (c) and (e) should include all entries covering expenditures for additions and betterments, as defined, whether or not replacingother property.
5. All credits representing property sold, abandoned, or otherwise retires should be shown in column (f).
6. Both the debit and credit involved in each transfer, adjustment, or clearance, between road and equipment accounts, should be included in thecolumn in which the item was initially included. Also, the transfer of prior years' debits or credits from investment in road and equipment tooperating expenses or other accounts, or vice versa, should be included in the column applicable to current items of like nature. Each suchtransfer, adjustment, or clearance should be fully explained when in excess of $100,000.
7. If during the year an individual charge of $100,000 or more was made to Account No. 2, "Land for Transportation Purposes," state the cost,location, area, and other details which will identify the property in a footnote.
8. Report on line 29, amounts not included in the primary road accounts. The items reported should be briefly identified and explained underNotes and Remarks," below. Amounts should be reported on this line only under special circumstances, usually after permission isobtained from the Board for exceptions to prescribed accounting. Reference to such authority should be made when explaining the amountsreported. Respondents must not make arbitrary changes to the printed stub or column headings without specific authority from the Board.
9. If during the year a segment of transportation property was acquired, state in a footnote the name of the vendor, the mileage acquired, andthe date of acquisition, giving location and cost of the property to the respondent. Also furnish a statement of the amount included ineach primary account representing such property acquired, referring to the column or columns in which the entries appear.
10. If an amount of less than $5,000 is used as the minimum for additions and betterments to property investment accounts as provided for inInstruction 2-2 of the Uniform System of Accounts for Railroad Companies, state the amount used in a footnote.
NOTES AND REMARKS

32 Road Initials: UPRR Year: 2017
Railroad Annual Report R-1
330. ROAD PROPERTY AND EQUIPMENT AND IMPROVEMENTS TO LEASED PROPERTY AND EQUIPMENT - Continued(Dollars in Thousands)
Expenditure during the Expenditures during theYear for original road year for purchase of
Line Cross Balance at and equipment and existing lines, lines LineNo. Check Account beginning of year road extensions reorganizations, etc. No.
(a) (b) (c) (d)1 (2) Land for transportation purposes 4,853,208 12 (3) Grading 3,233,310 23 (4) Other, right-of-way expenditures 118,926 34 (5) Tunnels and subways 351,599 45 (6) Bridges, trestles, and culverts 3,809,602 56 (7) Elevated structures 0 67 (8) Ties 9,811,695 78 (9) Rail and other track material 15,844,748 89 (11) Ballast 5,241,856 9
10 (13) Fences, snowsheds and signs 119,393 1011 (16) Station and office buildings 982,031 1112 (17) Roadway buildings 30,930 1213 (18) Water stations 7,251 1314 (19) Fuel stations 361,188 1415 (20) Shops and enginehouses 533,243 1516 (22) Storage warehouses 1,003 1617 (23) Wharves and docks 55,579 1718 (24) Coal and ore wharves 913 1819 (25) TOFC/COFC terminals 1,160,054 1920 (26) Communication systems 747,373 2021 (27) Signals and interlockers 4,388,715 2122 (29) Power plants 0 2223 (31) Power-transmission systems 216,330 2324 (35) Miscellaneous structures 20,137 2425 (37) Roadway machines 734,923 2526 (39) Public improvements-construction 1,022,535 2627 (44) Shop machinery 200,322 2728 (45) Power-plant machinery 0 2829 Other lease/rentals 0 2930 TOTAL EXPENDITURES FOR ROAD 53,846,864 0 0 3031 (52) Locomotives 9,692,561 3132 (53) Freight train cars 2,237,151 3233 (54) Passenger train cars 0 3334 (55) Highway revenue equipment 599,511 3435 (56) Floating equipment 0 3536 (57) Work equipment 193,058 3637 (58) Miscellaneous equipment 112,482 3738 (59) Computer systems and word processing equipment 939,410 3839 TOTAL EXPENDITURES FOR EQUIPMENT 13,774,173 0 0 3940 (76) Interest during construction 43,253 4041 (80) Other elements of investment 0 4142 (90) Construction work in progress 986,992 4243 GRAND TOTAL 68,651,282 0 0 43

Road Initials: UPRR Year: 2017 33
Railroad Annual Report R-1
Line Cross Expenditures for additions Credits for property retired LineNo. Check during the year during the year Net changes during the year Balance at close of year No.
(e) (f) (g) (h)1 69,200 29,833 39,367 4,892,575 12 106,369 27,540 78,829 3,312,139 23 16,144 2,009 14,135 133,061 34 842 2,700 (1,858) 349,741 45 252,843 38,858 213,985 4,023,587 56 0 0 0 0 67 498,867 178,969 319,898 10,131,593 78 723,572 241,362 482,210 16,326,958 89 245,870 81,533 164,337 5,406,193 910 8,283 675 7,608 127,001 1011 53,569 12,871 40,698 1,022,729 1112 21 (1) 22 30,952 1213 472 (4) 476 7,727 1314 17,023 699 16,324 377,512 1415 40,621 4,677 35,944 569,187 1516 0 0 0 1,003 1617 9,170 0 9,170 64,749 1718 0 15 (15) 898 1819 91,604 6,174 85,430 1,245,484 1920 84,051 16,481 67,570 814,943 2021 302,912 146,904 156,008 4,544,723 2122 0 0 0 0 2223 15,670 1,762 13,908 230,238 2324 0 (2) 2 20,139 2425 75,034 21,409 53,625 788,548 2526 46,845 7,923 38,922 1,061,457 2627 4,726 1,933 2,793 203,115 2728 0 0 0 0 2829 0 0 0 0 2930 2,663,708 824,320 1,839,388 55,686,252 3031 875,498 881,995 (6,497) 9,686,064 3132 82,171 70,364 11,807 2,248,958 3233 0 0 0 0 3334 35,606 10,508 25,098 624,609 3435 0 0 0 0 3536 9,427 5,048 4,379 197,437 3637 2,656 1,231 1,425 113,907 3738 195,568 64,928 130,640 1,070,050 3839 1,200,926 1,034,074 166,852 13,941,025 3940 0 2 (2) 43,251 4041 0 0 0 0 4142 (251,127) 0 (251,127) 735,865 4243 3,613,507 1,858,396 1,755,111 70,406,393 43
330. ROAD PROPERTY AND EQUIPMENT AND IMPROVEMENTS TO LEASED PROPERTY AND EQUIPMENT - Concluded(Dollars in Thousands)

34 Road Initials: UPRR Year: 2017
Railroad Annual Report R-1
332. DEPRECIATION BASE AND RATES - ROAD AND EQUIPMENT OWNED AND USED AND LEASED FROM OTHERS(Dollars in Thousands)
1. Show in columns (b) and (e), for each primary account, the depreciation base used to compute depreciation charges for the month of January,and in columns (c) and (f), the depreciation charges for the month of December. In columns (d) and (g) show the composite rates used in computingdepreciation charges for December, and on lines 30 and 39 of these columns show the composite percentage for all road and equipment accounts,respectively, ascertained by applying the primary account composite rates to the depreciation base used in computing the charges for December, anddividing that total by the total depreciation base for the same month. The depreciation base should not include cost of equipment used, but notowned, when the rents are included in rent for equipment and account nos. 31-22-00, 31-23-00, 31-25-00, 31-21-00, 35-21-00, 35-23-00, 35-22-00,and 35-25-00. It should include cost of equipment owned and leased to others when the rents there from are included in the rent for equipment, accounts nos. 32-21-00, 32-22-00, 32-23-00, 32-25-00, 36-21-00, 36-22-00, 36-23-00, and 36-25-00., inclusive. Composite rates used shouldbe those prescribed or authorized by the Board, except that where the use of component rates has been authorized, the composite rates to beshown for the respective primary accounts should be recomputed from the December charges developed by the use of the authorized rates. If anychanges in rates were effective during the year, give particulars in a footnote.
2. All leased property may be combined and one composite rate computed for each primary account, or a separate schedule may be included foreach such property.
3. Show in columns (e), (f), and (g) data applicable to lessor property, when the rent therefore is included in accounts nos. 31-11-00, 31-12-00,31-13-00, 31-21-00, 31-22-00, and 31-23-00, inclusive.
4. If depreciation accruals have been discontinued for any account, the depreciation base should be reported, nevertheless, in support ofdepreciation reserves. Authority for discontinuance of accruals should be shown in a footnote, indicating the effected account(s).
5. Disclosures in the respective sections of this schedule may be omitted if either total road leased from others or total equipment leased fromothers represents less than 5% of total road owned or total equipment owned, respectively.
OWNED AND USED LEASED FROM OTHERSAnnual Annual
1/1 12/1 composite compositeLine At beginning At close rate At beginning At close rate LineNo. Account of year of year (percent) of year of year (percent) No.
(a) (b) (c) (d) (e) (f) (g)ROAD
1 (3) Grading 3,233,177 3,312,549 1.16 12 (4) Other right-of-way expenditures 118,817 130,503 2.38 23 (5) Tunnels and subways 351,599 349,862 0.85 34 (6) Bridges, trestles and culverts 3,808,461 3,998,057 1.41 45 (7) Elevated structures 0 0 0.00 56 (8) Ties 9,802,717 10,100,302 4.07 67 (9) Rail and other track material 15,823,264 16,280,395 2.86 78 (11) Ballast 5,236,826 5,390,868 2.94 89 (13) Fences, snowsheds and signs 119,283 125,840 1.82 910 (16) Station and office buildings 979,670 991,814 3.38 1011 (17) Roadway buildings 30,930 30,937 2.83 1112 (18) Water stations 7,251 7,726 2.63 1213 (19) Fuel stations 361,188 368,527 2.86 1314 (20) Shops and enginehouses 533,213 569,109 2.13 1415 (22) Storage warehouses 1,002 1,002 2.00 1516 (23) Wharves and docks 55,579 63,404 3.03 1617 (24) Coal and ore wharves 913 898 2.56 1718 (25) TOFC/COFC terminals 1,159,661 1,239,777 2.56 1819 (26) Communications systems 744,999 805,211 3.45 1920 (27) Signals and interlockers 4,370,952 4,522,623 3.85 2021 (29) Power plants 0 0 0.00 2122 (31) Power transmission systems 216,292 226,908 2.27 2223 (35) Miscellaneous structures 20,137 20,139 2.33 2324 (37) Roadway machines 734,923 772,960 5.95 2425 (39) Public improvements - construction 1,021,486 1,055,821 2.33 2526 (44) Shop machinery 200,045 203,002 3.27 2627 (45) Power plant machinery 0 0 0 2728 All other road accounts 0 0 0 2829 Amortization (other than def. projects) 0 0 0 2930 TOTAL ROAD 48,932,385 50,568,234 3.05 30
EQUIPMENT31 (52) Locomotives 9,505,766 9,426,529 5.51 3132 (53) Freight train cars 2,227,893 2,232,375 3.55 3233 (54) Passenger train cars 0 0 0.00 3334 (55) Highway revenue equipment 601,374 628,698 6.13 3435 (56) Floating equipment 0 0 0.00 3536 (57) Work equipment 193,023 194,607 2.93 3637 (58) Miscellaneous equipment 112,482 112,811 3.95 3738 (59) Computer systems & WP equipment 928,797 991,039 11.80 3839 TOTAL EQUIPMENT 13,569,335 13,586,059 5.61 3940 GRAND TOTAL 62,501,720 64,154,293 N/A N/A 40
Note: New Equipment depreciation rates were authorized by the Surface Transportation Board effective January 1, 2016.
Depreciation base Depreciation base
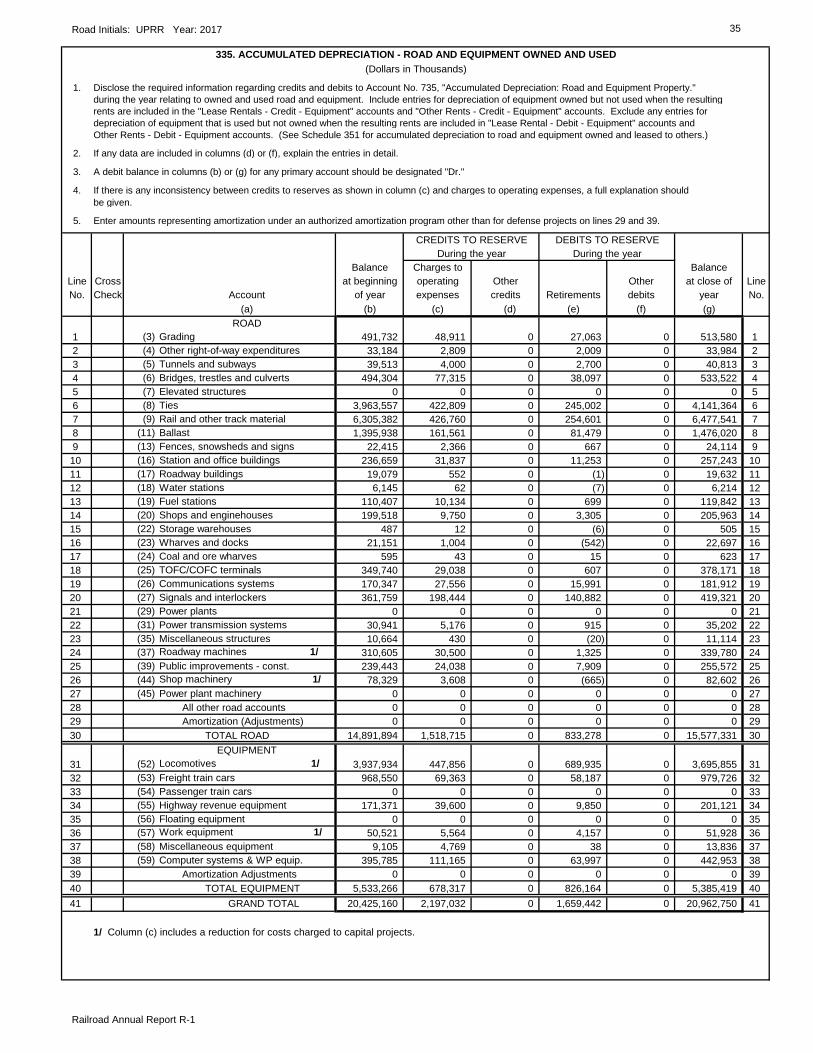
Road Initials: UPRR Year: 2017 35
Railroad Annual Report R-1
335. ACCUMULATED DEPRECIATION - ROAD AND EQUIPMENT OWNED AND USED(Dollars in Thousands)
1. Disclose the required information regarding credits and debits to Account No. 735, "Accumulated Depreciation: Road and Equipment Property."during the year relating to owned and used road and equipment. Include entries for depreciation of equipment owned but not used when the resultingrents are included in the "Lease Rentals - Credit - Equipment" accounts and "Other Rents - Credit - Equipment" accounts. Exclude any entries fordepreciation of equipment that is used but not owned when the resulting rents are included in "Lease Rental - Debit - Equipment" accounts and Other Rents - Debit - Equipment accounts. (See Schedule 351 for accumulated depreciation to road and equipment owned and leased to others.)
2. If any data are included in columns (d) or (f), explain the entries in detail.
3. A debit balance in columns (b) or (g) for any primary account should be designated "Dr."
4. If there is any inconsistency between credits to reserves as shown in column (c) and charges to operating expenses, a full explanation shouldbe given.
5. Enter amounts representing amortization under an authorized amortization program other than for defense projects on lines 29 and 39.
CREDITS TO RESERVE DEBITS TO RESERVEDuring the year During the year
Balance Charges to BalanceLine Cross at beginning operating Other Other at close of LineNo. Check Account of year expenses credits Retirements debits year No.
(a) (b) (c) (d) (e) (f) (g)ROAD
1 (3) Grading 491,732 48,911 0 27,063 0 513,580 12 (4) Other right-of-way expenditures 33,184 2,809 0 2,009 0 33,984 23 (5) Tunnels and subways 39,513 4,000 0 2,700 0 40,813 34 (6) Bridges, trestles and culverts 494,304 77,315 0 38,097 0 533,522 45 (7) Elevated structures 0 0 0 0 0 0 56 (8) Ties 3,963,557 422,809 0 245,002 0 4,141,364 67 (9) Rail and other track material 6,305,382 426,760 0 254,601 0 6,477,541 78 (11) Ballast 1,395,938 161,561 0 81,479 0 1,476,020 89 (13) Fences, snowsheds and signs 22,415 2,366 0 667 0 24,114 910 (16) Station and office buildings 236,659 31,837 0 11,253 0 257,243 1011 (17) Roadway buildings 19,079 552 0 (1) 0 19,632 1112 (18) Water stations 6,145 62 0 (7) 0 6,214 1213 (19) Fuel stations 110,407 10,134 0 699 0 119,842 1314 (20) Shops and enginehouses 199,518 9,750 0 3,305 0 205,963 1415 (22) Storage warehouses 487 12 0 (6) 0 505 1516 (23) Wharves and docks 21,151 1,004 0 (542) 0 22,697 1617 (24) Coal and ore wharves 595 43 0 15 0 623 1718 (25) TOFC/COFC terminals 349,740 29,038 0 607 0 378,171 1819 (26) Communications systems 170,347 27,556 0 15,991 0 181,912 1920 (27) Signals and interlockers 361,759 198,444 0 140,882 0 419,321 2021 (29) Power plants 0 0 0 0 0 0 2122 (31) Power transmission systems 30,941 5,176 0 915 0 35,202 2223 (35) Miscellaneous structures 10,664 430 0 (20) 0 11,114 2324 (37) Roadway machines 1/ 310,605 30,500 0 1,325 0 339,780 2425 (39) Public improvements - const. 239,443 24,038 0 7,909 0 255,572 2526 (44) Shop machinery 1/ 78,329 3,608 0 (665) 0 82,602 2627 (45) Power plant machinery 0 0 0 0 0 0 2728 All other road accounts 0 0 0 0 0 0 2829 Amortization (Adjustments) 0 0 0 0 0 0 2930 TOTAL ROAD 14,891,894 1,518,715 0 833,278 0 15,577,331 30
EQUIPMENT31 (52) Locomotives 1/ 3,937,934 447,856 0 689,935 0 3,695,855 3132 (53) Freight train cars 968,550 69,363 0 58,187 0 979,726 3233 (54) Passenger train cars 0 0 0 0 0 0 3334 (55) Highway revenue equipment 171,371 39,600 0 9,850 0 201,121 3435 (56) Floating equipment 0 0 0 0 0 0 3536 (57) Work equipment 1/ 50,521 5,564 0 4,157 0 51,928 3637 (58) Miscellaneous equipment 9,105 4,769 0 38 0 13,836 3738 (59) Computer systems & WP equip. 395,785 111,165 0 63,997 0 442,953 3839 Amortization Adjustments 0 0 0 0 0 0 3940 TOTAL EQUIPMENT 5,533,266 678,317 0 826,164 0 5,385,419 4041 GRAND TOTAL 20,425,160 2,197,032 0 1,659,442 0 20,962,750 41
1/ Column (c) includes a reduction for costs charged to capital projects.

36 Road Initials: UPRR Year: 2017
Railroad Annual Report R-1
342. ACCUMULATED DEPRECIATION -- IMPROVEMENTS TO ROAD AND EQUIPMENT LEASED FROM OTHERS(Dollars in Thousands)
1. Enter the required information concerning debits and credits to Account 733, "Accumulated Depreciation -- Improvements on Leased Property,"during the year relating to improvements made to road and equipment property leased from others, the depreciation charges for which areincluded in operating expenses of the respondent.
2. If any entries are made for column (d) "Other credits" or column (f) "Other debits," state the facts occasioning such entries on the Notes and Remarks section. A debit balance in columns (b) or (g) for any primary account should be shown in parenthesis or designated "Dr."
3. Any inconsistency between the credits to the reserve as shown in column (c) and the charges to operating expenses should be fully explainedon the Notes and Remarks section.
4. Show in column (e) the debits to the reserve arising from retirements. These debits should not exceed investment, etc.
5. Details in the respective sections of this schedule may be omitted if either total road leased from others or total equipment leased from othersrepresents less than 5% of total road owned or total equipment owned, respectively. However, line 39, Grand Total, should be completed.
CREDITS TO ACCOUNTS DEBITS TO ACCOUNTSDuring the Year During the year
Balance Charges to BalanceLine Cross at beginning operating at close of LineNo. Check Account of year expenses Other credits Retirements Other debits year No.
(a) (b) (c) (d) (e) (f) (g)ROAD
1 (3) Grading 12 (4) Other, right-of-way expenditures 23 (5) Tunnels and subways 34 (6) Bridges, trestles, and culverts 45 (7) Elevated structures 56 (8) Ties 67 (9) Rail and other track material Not Applicable 78 (11) Ballast 89 (13) Fences, snow sheds, and signs 910 (16) Station and office buildings 1011 (17) Roadway buildings 1112 (18) Water stations 1213 (19) Fuel Stations 1314 (20) Shops and enginehouse 1415 (22) Storage warehouses 1516 (23) Wharves and docks 1617 (24) Coal and ore wharves 1718 (25) TOFC/COFC terminals 1819 (26) Communication systems 1920 (27) Signals and interlockers 2021 (29) Power plants 2122 (31) Power-transmission systems 2223 (35) Miscellaneous structures 2324 (37) Roadway machines 2425 (39) Public improvements-Construction 2526 (44) Shop machinery* 2627 (45) Power-plant machinery 2728 All other road accounts 2829 TOTAL ROAD 29
EQUIPMENT30 (52) Locomotives 3031 (53) Freight-train cars 3132 (54) Passenger-train cars 3233 (55) Highway revenue equipment 3334 (56) Floating equipment 3435 (57) Work equipment 3536 (58) Miscellaneous equipment 3637 (59) Computer systems & WP equip. 3738 TOTAL EQUIPMENT 3839 GRAND TOTAL 39
* To be reported with equipment expense rather than W&S expenses.

Road Initials: UPRR Year: 2017 37
Railroad Annual Report R-1
1/ Actual value not known. Amounts reported in lieu of actual value represent results of capitalizingrentals at 6 percent.
2/ Amounts of depreciation and amortization accrued are not known.
3/ As inventoried by ICC as of 12/31/1928, and reported in Land Report dated 3/31/1930, Engineering Report dated 5/09/1931. Includes estimated value based on capitalization of rentals
at 6 percent.
4/ No depreciation reserve is maintained by respondent or by Moffat Tunnel Improvement District.
1/ Amounts on Schedule 352B, Column (c) represents St. Joseph and Grand Island Railway Company,which is included in the respondent's investments in property reported on line 1, column (d) ofSchedule 352A.
2/ Amounts on Schedule 352B, Columns (b) and (c), exclude adjustments to Investment For Property Leased To or From Others, for which the "Actual Value is not Known." These items are shown on Schedule 352A as 1/ "Actual Value Not Known." Amounts so reported on Schedule 352A representresults of capitalizing annual rental at 6 percent.
NOTES AND REMARKS
Notes Referring to Schedule 352A, page 38:
Notes Referring to Schedule 352B, page 39:

38 Road Initials: UPRR Year: 2017
Railroad Annual Report R-1
352A. INVESTMENT IN RAILROAD PROPERTY USED IN TRANSPORTATION SERVICE (By Company)(Dollars in Thousands)
1. Disclose the investment in railway property used in transportation service at the close of the year. This investment represents the aggregateof property owned or leased by respondent and used in respondent's transportation service. Such property includes (a) investment reported inAccounts 731, "Road and Equipment Property" and 732, "improvements on Leased Property" of respondent, less any 731 or 732 property leasedto others for their exclusive use of road, track, or bridges (including equipment or other railway property covered by the contract). Equipmentleased to others under separate distinct contracts shall not be deducted from respondent's 731 or 732 property, and (b) the investment of othercompanies' 731 or 732 property (including operating and lessor railroads) used by respondent when the lease is for exclusive use or control ofroads, tracks, or bridges (including equipment or other railway property covered by the contract). This excludes leased equipment from operatingrailroads under separate distinct contracts and the investment of other carriers in property jointly used by respondent.
2. In column (a), classify each company in this schedule as: "R" for respondent, "L" for lessor railroad, "P" for inactive or proprietary companyor "O" for other leased properties.
3. In columns (a) to (e), inclusive, first show the data requested for respondent (R); next show data for companies whose entire propertiesare used in transportation service of the respondent, divided between lessor (L) and proprietary (P) companies; followed by data for carriersand others (O), portions of whose property are used in transportation service of respondent. Show a total for each class of company incolumns (d) and (e). Then show, as deductions. data for transportation property leased to carriers and others.
4. In column (c), line-haul carriers report the miles of road used in line-haul service. Report miles in whole numbers.
5. In column (d), show the amount applicable to Accounts 731 and 732 on the books of companies whose names appear in column (b). Values of property of other carriers segregated by estimate or otherwise should correspond in amount to deductions made by the owners in their reports.If separate value is not available, an explanation should be provided. Differences between amounts shown in column (d) of this schedule andcolumn (c), line 24, on the asset side of the general balance sheet of each individual railway should be explained in a footnote. Book valuesincluded in Accounts 731 and 732 of the owner should be reported in column (d) in reference to the investment of respondent in securities of theowner unless a good reason can be given for the contrary. Methods of estimating (by capitalizing rentals at 6% or otherwise) value of property ofprivate owners, or portions of property of other carriers, should be explained.
6. In column (e), show the amount of depreciation and amortization accrued as of the close of the year in Accounts 733, 734, 735, 736, and772, that is applicable to the property of the carriers whose names are listed in column (b), regardless of where reserves therefor are recorded.
Depreciation and Miles of road Investments amortization of
Line Class used (See Ins. 4) in property defense projects LineNo. (See Ins. 2) Name of Company (whole number) (See Ins. 5) (See Ins. 6) No.
(a) (b) (c) (d) (e)1 R Union Pacific Railroad 26,023 $70,406,393 $20,962,750 12 23 Add - Leased From Others 34 45 O U.S. Government - Sable to Bunell, CO used under contract 1 56 O City of Kansas City, KS - Tracks 1/ 244 2/ 67 O General Motors 1/ 11 2/ 78 O Louisville & Nashville RR Co.,-SCL 16 2/ 89 O New Orleans Public Belt Railroad Co. 36 2/ 9
10 O Port of Corpus Christi 1/ 581 2/ 1011 O Greater Baton Rouge Port Commission 1/ 2,960 2/ 1112 O Lake Charles Harbor & Terminal District 1/ 104 2/ 1213 O Port of Beaumont 1/ 419 2/ 1314 O City and County of San Francisco (Formerly Ocean 1415 Shore Railway) yard switching tracks 34 2/ 1516 O Medford Corp, Medford, Oregon-Way switching tracks 40 2/ 1617 O Nueces County Navigation Dist. No. 1 Terminal 1718 Properties Corpus Christi, TX 581 2/ 1819 O Moffat Tunnel Improvement District 9 3/ 11,435 4/ 1920 2021 2122 2223 Total Leased From Others 10 16,461 0 2324 2425 Deduct - Leased to Others: 2526 2627 O Houston Belt & Terminal Rwy. Co. 3 1/ 3,798 2/ 0 2728 2829 2930 Net Additions 7 12,663 0 3031 TOTAL 26,030 $70,419,056 $20,962,750 31
See notes on page 37.
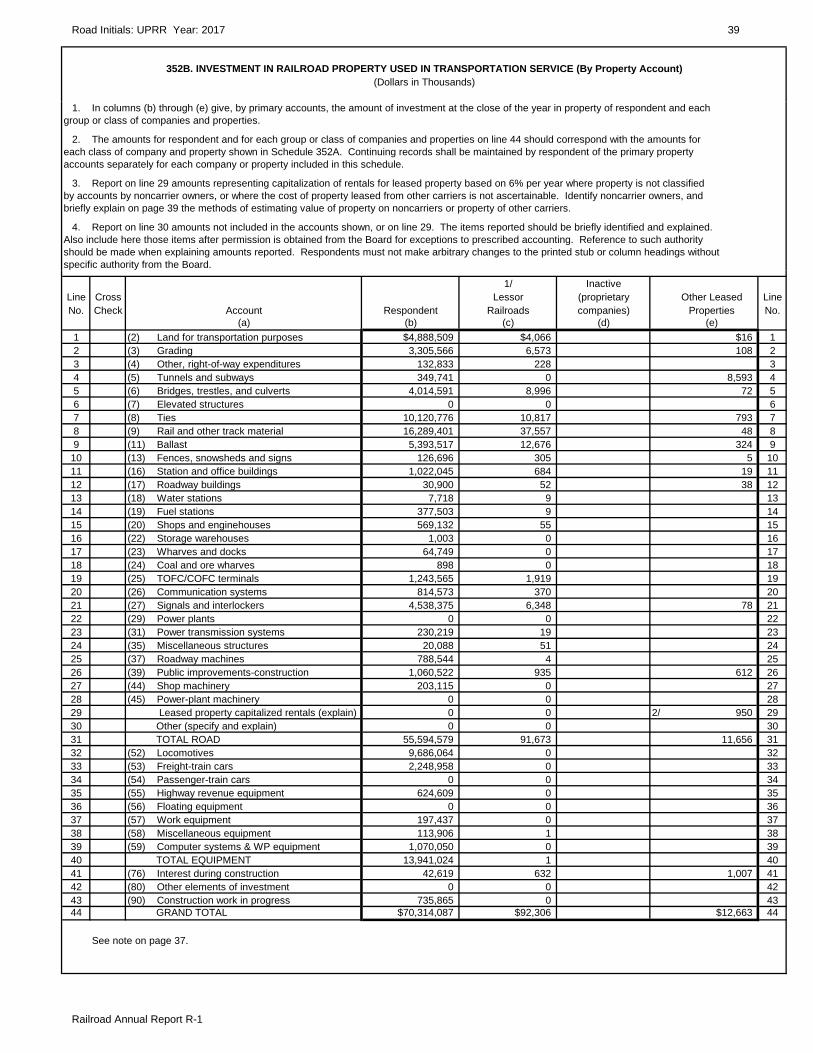
Road Initials: UPRR Year: 2017 39
Railroad Annual Report R-1
352B. INVESTMENT IN RAILROAD PROPERTY USED IN TRANSPORTATION SERVICE (By Property Account)(Dollars in Thousands)
1. In columns (b) through (e) give, by primary accounts, the amount of investment at the close of the year in property of respondent and eachgroup or class of companies and properties.
2. The amounts for respondent and for each group or class of companies and properties on line 44 should correspond with the amounts for each class of company and property shown in Schedule 352A. Continuing records shall be maintained by respondent of the primary propertyaccounts separately for each company or property included in this schedule.
3. Report on line 29 amounts representing capitalization of rentals for leased property based on 6% per year where property is not classifiedby accounts by noncarrier owners, or where the cost of property leased from other carriers is not ascertainable. Identify noncarrier owners, andbriefly explain on page 39 the methods of estimating value of property on noncarriers or property of other carriers.
4. Report on line 30 amounts not included in the accounts shown, or on line 29. The items reported should be briefly identified and explained.Also include here those items after permission is obtained from the Board for exceptions to prescribed accounting. Reference to such authorityshould be made when explaining amounts reported. Respondents must not make arbitrary changes to the printed stub or column headings withoutspecific authority from the Board.
1/ InactiveLine Cross Lessor (proprietary Other Leased LineNo. Check Account Respondent Railroads companies) Properties No.
(a) (b) (c) (d) (e)1 (2) Land for transportation purposes $4,888,509 $4,066 $16 12 (3) Grading 3,305,566 6,573 108 23 (4) Other, right-of-way expenditures 132,833 228 34 (5) Tunnels and subways 349,741 0 8,593 45 (6) Bridges, trestles, and culverts 4,014,591 8,996 72 56 (7) Elevated structures 0 0 67 (8) Ties 10,120,776 10,817 793 78 (9) Rail and other track material 16,289,401 37,557 48 89 (11) Ballast 5,393,517 12,676 324 9
10 (13) Fences, snowsheds and signs 126,696 305 5 1011 (16) Station and office buildings 1,022,045 684 19 1112 (17) Roadway buildings 30,900 52 38 1213 (18) Water stations 7,718 9 1314 (19) Fuel stations 377,503 9 1415 (20) Shops and enginehouses 569,132 55 1516 (22) Storage warehouses 1,003 0 1617 (23) Wharves and docks 64,749 0 1718 (24) Coal and ore wharves 898 0 1819 (25) TOFC/COFC terminals 1,243,565 1,919 1920 (26) Communication systems 814,573 370 2021 (27) Signals and interlockers 4,538,375 6,348 78 2122 (29) Power plants 0 0 2223 (31) Power transmission systems 230,219 19 2324 (35) Miscellaneous structures 20,088 51 2425 (37) Roadway machines 788,544 4 2526 (39) Public improvements-construction 1,060,522 935 612 2627 (44) Shop machinery 203,115 0 2728 (45) Power-plant machinery 0 0 2829 Leased property capitalized rentals (explain) 0 0 2/ 950 2930 Other (specify and explain) 0 0 3031 TOTAL ROAD 55,594,579 91,673 11,656 3132 (52) Locomotives 9,686,064 0 3233 (53) Freight-train cars 2,248,958 0 3334 (54) Passenger-train cars 0 0 3435 (55) Highway revenue equipment 624,609 0 3536 (56) Floating equipment 0 0 3637 (57) Work equipment 197,437 0 3738 (58) Miscellaneous equipment 113,906 1 3839 (59) Computer systems & WP equipment 1,070,050 0 3940 TOTAL EQUIPMENT 13,941,024 1 4041 (76) Interest during construction 42,619 632 1,007 4142 (80) Other elements of investment 0 0 4243 (90) Construction work in progress 735,865 0 4344 GRAND TOTAL $70,314,087 $92,306 $12,663 44
See note on page 37.

40 Road Initials: UPRR Year: 2017
Railroad Annual Report R-1
INSTRUCTIONS CONCERNING RETURNS TO BE MADE IN SCHEDULE 410
Cross-checks
Schedule 410 Schedule 210Line 620, column (h) = Line 14, column (b)Line 620, column (f) = Line 14, column (d)Line 620, column (g) = Line 14, column (e)
Schedule 412Line 136 thru 138 column (f) = Line 29, column (b)Line 118 thru 123, and 130 thru 135 = Line 29, column (c) column (f)
Schedule 414Line 231, column (f) = Line 19, columns (b) thru (d)
Line 230, column (f) = Line 19, columns (e) thru (g)
Schedule 415Lines 207, 208, 211, 212, columns (f) = Lines 5, 38, column (f)
Lines 226, 227, column (f) = Lines 24, 39, column (f)
Lines 311, 312, 315, 316, column (f) = Lines 32, 35, 36, 37, 40, 41, column (f)
And
Schedule 414Minus line 24, columns (b) thru (d) plus line 24, columns (e) thru (g)
Schedule 415Line 213, column (f) = Lines 5, 38, columns (c) and (d)
Line 232, column (f) = Lines 24, 39, columns (c) and (d)Line 317, column (f) = Lines 32, 35, 36, 37, 40, 41, columns (c) and (d)
Lines 202, 203, 216, column (f) (equal Lines 5, 38, column (b) to or greater than, but variance cannot exceed line 216, column (f))
Lines 221, 222, 235, column (f) (equal Lines 24, 39, column (b) to or greater than, but variance cannot exceed line 235, column (f))
Lines 302 thru 307 and 320, column (f) (equal Lines 32, 35, 36, 37, 40, 41, column (b) to or greater than, but variance cannot exceed line 320, column (f))
Schedule 417Line 507, column (f) = Line 1, column (j)Line 508, column (f) = Line 2, column (j)Line 509, column (f) = Line 3, column (j)Line 510, column (f) = Line 4, column (j)Line 511, column (f) = Line 5, column (j)Line 512, column (f) = Line 6, column (j)Line 513, column (f) = Line 7, column (j)Line 514, column (f) = Line 8, column (j)Line 515, column (f) = Line 9, column (j)Line 516, column (f) = Line 10, column (j)Line 517, column (f) = Line 11, column (j)
Schedule 450 Schedule 210Line 4, column (b) = Line 47, column (b)
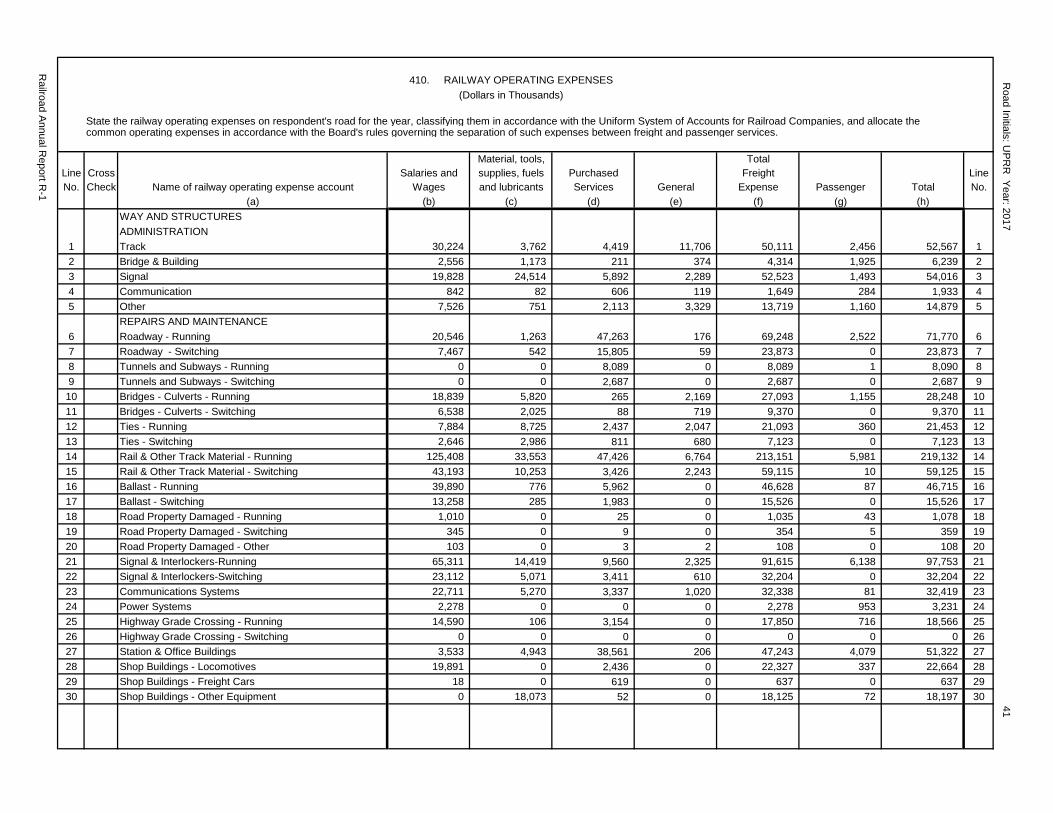
410. RAILWAY OPERATING EXPENSES(Dollars in Thousands)
State the railway operating expenses on respondent's road for the year, classifying them in accordance with the Uniform System of Accounts for Railroad Companies, and allocate the common operating expenses in accordance with the Board's rules governing the separation of such expenses between freight and passenger services.
Material, tools, TotalLine Cross Salaries and supplies, fuels Purchased Freight LineNo. Check Name of railway operating expense account Wages and lubricants Services General Expense Passenger Total No.
(a) (b) (c) (d) (e) (f) (g) (h)WAY AND STRUCTURESADMINISTRATION
1 Track 30,224 3,762 4,419 11,706 50,111 2,456 52,567 12 Bridge & Building 2,556 1,173 211 374 4,314 1,925 6,239 23 Signal 19,828 24,514 5,892 2,289 52,523 1,493 54,016 34 Communication 842 82 606 119 1,649 284 1,933 45 Other 7,526 751 2,113 3,329 13,719 1,160 14,879 5
REPAIRS AND MAINTENANCE6 Roadway - Running 20,546 1,263 47,263 176 69,248 2,522 71,770 67 Roadway - Switching 7,467 542 15,805 59 23,873 0 23,873 78 Tunnels and Subways - Running 0 0 8,089 0 8,089 1 8,090 89 Tunnels and Subways - Switching 0 0 2,687 0 2,687 0 2,687 910 Bridges - Culverts - Running 18,839 5,820 265 2,169 27,093 1,155 28,248 1011 Bridges - Culverts - Switching 6,538 2,025 88 719 9,370 0 9,370 1112 Ties - Running 7,884 8,725 2,437 2,047 21,093 360 21,453 1213 Ties - Switching 2,646 2,986 811 680 7,123 0 7,123 1314 Rail & Other Track Material - Running 125,408 33,553 47,426 6,764 213,151 5,981 219,132 1415 Rail & Other Track Material - Switching 43,193 10,253 3,426 2,243 59,115 10 59,125 1516 Ballast - Running 39,890 776 5,962 0 46,628 87 46,715 1617 Ballast - Switching 13,258 285 1,983 0 15,526 0 15,526 1718 Road Property Damaged - Running 1,010 0 25 0 1,035 43 1,078 1819 Road Property Damaged - Switching 345 0 9 0 354 5 359 1920 Road Property Damaged - Other 103 0 3 2 108 0 108 2021 Signal & Interlockers-Running 65,311 14,419 9,560 2,325 91,615 6,138 97,753 2122 Signal & Interlockers-Switching 23,112 5,071 3,411 610 32,204 0 32,204 2223 Communications Systems 22,711 5,270 3,337 1,020 32,338 81 32,419 2324 Power Systems 2,278 0 0 0 2,278 953 3,231 2425 Highway Grade Crossing - Running 14,590 106 3,154 0 17,850 716 18,566 2526 Highway Grade Crossing - Switching 0 0 0 0 0 0 0 2627 Station & Office Buildings 3,533 4,943 38,561 206 47,243 4,079 51,322 2728 Shop Buildings - Locomotives 19,891 0 2,436 0 22,327 337 22,664 2829 Shop Buildings - Freight Cars 18 0 619 0 637 0 637 2930 Shop Buildings - Other Equipment 0 18,073 52 0 18,125 72 18,197 30 41
Railroad Annual R
eport R-1
Road Initials: U
PRR
Year: 2017

410. RAILWAY OPERATING EXPENSES - Continued(Dollars in Thousands)
State the railway operating expenses on respondent's road for the year, classifying them in accordance with the Uniform System of Accounts for Railroad Companies, and allocate the common operating expenses in accordance with the Board's rules governing the separation of such expenses between freight and passenger services.
Material, tools, TotalLine Cross Salaries and supplies, fuels Purchased Freight LineNo. Check Name of railway operating expense account Wages and lubricants Services General Expense Passenger Total No.
(a) (b) (c) (d) (e) (f) (g) (h)REPAIRS AND MAINTENANCE - (Continued)
101 Locomotive Servicing Facilities 893 529 3,879 104 5,405 229 5,634 101102 Miscellaneous Buildings & Structures 1,602 921 580 28 3,131 591 3,722 102103 Coal Terminals 0 0 0 0 0 0 0 103104 Ore Terminals 0 0 0 0 0 0 0 104105 Other Marine Terminals 0 0 0 0 0 0 0 105106 TOFC/COFC-Terminals 0 0 25,281 0 25,281 0 25,281 106107 Motor Vehicle Loading & Distribution Facilities 0 0 0 0 0 0 0 107108 Facilities for Other Specialized Service Operations 0 0 0 0 0 0 0 108109 Roadway Machines 11,146 12,961 1,344 2,768 28,219 1,456 29,675 109110 Small Tools and Supplies 0 0 0 0 0 0 0 110111 Snow Removal 673 3,912 5,639 0 10,224 607 10,831 111112 Fringe Benefits - Running 0 0 0 147,544 147,544 8,621 156,165 112113 Fringe Benefits - Switching 0 0 0 43,667 43,667 569 44,236 113114 Fringe Benefits - Other 0 0 0 71,878 71,878 1,096 72,974 114115 Casualties & Insurance - Running 0 0 0 8,417 8,417 4 8,421 115116 Casualties & Insurance - Switching 0 0 0 2,763 2,763 0 2,763 116117 Casualties & Insurance - Other 0 0 0 2,024 2,024 0 2,024 117118 Lease Rentals - Debit - Running 0 0 28 0 28 0 28 118119 Lease Rentals - Debit - Switching 0 0 0 0 0 0 0 119120 Lease Rentals - Debit - Other 0 0 35,271 0 35,271 452 35,723 120121 Lease Rentals - (Credit) - Running 0 0 0 0 0 0 0 121122 Lease Rentals - (Credit) - Switching 0 0 0 0 0 0 0 122123 Lease Rentals - (Credit) - Other 0 0 (1,356) 0 (1,356) 0 (1,356) 123124 Joint Facility Rent - Debit - Running 0 0 31,027 0 31,027 0 31,027 124125 Joint Facility Rent - Debit - Switching 0 0 1,094 0 1,094 0 1,094 125126 Joint Facility Rent - Debit - Other 0 0 261 0 261 0 261 126127 Joint Facility Rent - (Credit) - Running 0 0 (8,791) 0 (8,791) 0 (8,791) 127128 Joint Facility Rent - (Credit) - Switching 0 0 (179) 0 (179) 0 (179) 128129 Joint Facility Rent - (Credit) - Other 0 0 (788) 0 (788) 0 (788) 129130 Other Rents - Debit - Running 0 0 0 0 0 0 0 130131 Other Rents - Debit - Switching 0 0 0 0 0 0 0 131132 Other Rents - Debit - Other 0 0 0 0 0 0 0 132133 Other Rents - (Credit) - Running 0 0 0 0 0 0 0 133
42 R
oad Initials: UPR
R Year: 2017
Railroad Annual R
eport R-1

410. RAILWAY OPERATING EXPENSES - Continued(Dollars in Thousands)
State the railway operating expenses on respondent's road for the year, classifying them in accordance with the Uniform System of Accounts for Railroad Companies, and allocate the common operating expenses in accordance with the Board's rules governing the separation of such expenses between freight and passenger services.
Material, tools, TotalLine Cross Salaries and supplies, fuels Purchased Freight LineNo. Check Name of railway operating expense account Wages and lubricants Services General Expense Passenger Total No.
(a) (b) (c) (d) (e) (f) (g) (h)REPAIRS AND MAINTENANCE - (Continued)
134 Other Rents - (Credit) - Switching N/A N/A 0 N/A 0 0 0 134135 Other Rents - (Credit) - Other N/A N/A 0 N/A 0 0 0 135136 Depreciation - Running N/A N/A N/A 1,056,797 1,056,797 2,060 1,058,857 136137 Depreciation - Switching N/A N/A N/A 352,141 352,141 0 352,141 137138 Depreciation - Other N/A N/A N/A 104,109 104,109 0 104,109 138139 Joint Facility - Debit - Running N/A N/A 87,533 N/A 87,533 126 87,659 139140 Joint Facility -Debit - Switching N/A N/A 11,504 N/A 11,504 0 11,504 140141 Joint Facility - Debit - Other N/A N/A 548 N/A 548 0 548 141142 Joint Facility - (Credit) - Running N/A N/A (29,535) N/A (29,535) 0 (29,535) 142143 Joint Facility - (Credit) - Switching N/A N/A (235) N/A (235) 0 (235) 143144 Joint Facility - (Credit) - Other N/A N/A (75) N/A (75) 0 (75) 144145 Dismantling Retired Road Property - Running 2,167 17,987 12,998 7,644 40,796 0 40,796 145146 Dismantling Retired Road Property - Switching 0 0 0 0 0 0 0 146147 Dismantling Retired Road Property - Other 0 0 0 0 0 0 0 147148 Other - Running 0 0 0 0 0 0 0 148149 Other - Switching 0 0 0 0 0 0 0 149150 Other - Other 0 31 0 0 31 1 32 150151 TOTAL WAY & STRUCTURE 516,028 180,733 386,678 1,836,721 2,920,160 45,670 2,965,830 151
EQUIPMENT - LOCOMOTIVES201 Administration 19,013 1,402 6,125 4,338 30,878 2,811 33,689 201202 Repair & Maintenance 188,810 303,547 121,682 4,615 618,654 11,028 629,682 202203 Machinery Repair 0 2,704 3,559 0 6,263 0 6,263 203204 Equipment Damaged 0 49 0 0 49 0 49 204205 Fringe Benefits N/A N/A N/A 106,385 106,385 5,333 111,718 205206 Other Casualties and Insurance N/A N/A N/A 6,288 6,288 0 6,288 206207 Lease Rentals - Debit N/A N/A 213,195 N/A 213,195 0 213,195 207208 Lease Rentals - (Credit) N/A N/A 0 N/A 0 0 0 208209 Joint Facility Rent - Debit N/A N/A 126 N/A 126 0 126 209210 Joint Facility Rent - (Credit) N/A N/A 0 N/A 0 0 0 210211 Other Rents - Debit N/A N/A 0 N/A 0 0 0 211212 Other Rents - (Credit) N/A N/A (4,692) N/A (4,692) 0 (4,692) 212213 Depreciation N/A N/A N/A 450,925 450,925 34 450,959 213214 Joint Facility - Debit N/A N/A 277 N/A 277 0 277 214215 Joint Facility - (Credit) N/A N/A 0 N/A 0 0 0 215216 Repairs Billed to Others - (Credit) N/A N/A 0 N/A 0 0 0 216
Railroad Annual R
eport R-1
Road Initials: U
PRR
Year: 201743

410. RAILWAY OPERATING EXPENSES - Continued(Dollars in Thousands)
State the railway operating expenses on respondent's road for the year, classifying them in accordance with the Uniform System of Accounts for Railroad Companies, and allocate the common operating expenses in accordance with the Board's rules governing the separation of such expenses between freight and passenger services.
Material, tools, TotalLine Cross Salaries and supplies, fuels Purchased Freight LineNo. Check Name of railway operating expense account Wages and lubricants Services General Expense Passenger Total No.
(a) (b) (c) (d) (e) (f) (g) (h)LOCOMOTIVES - (Continued)
217 Dismantling Retired Property 0 0 0 0 0 0 0 217218 Other 3,181 18 1,156 248 4,603 5 4,608 218219 TOTAL LOCOMOTIVES 211,004 307,720 341,428 572,799 1,432,951 19,211 1,452,162 219
FREIGHT CARS220 Administration 7,497 1,422 4,292 741 13,952 N/A 13,952 220221 Repair & Maintenance 141,596 203,672 69,258 1,971 416,497 N/A 416,497 221222 Machinery Repair 0 2,732 1,617 0 4,349 N/A 4,349 222223 Equipment Damaged 0 0 0 0 0 N/A 0 223224 Fringe Benefits N/A N/A N/A 75,424 75,424 N/A 75,424 224225 Other Casualties & Insurance N/A N/A N/A 38,691 38,691 N/A 38,691 225226 Lease Rentals - Debit N/A N/A 157,346 N/A 157,346 N/A 157,346 226227 Lease Rentals - (Credit) N/A N/A (811) N/A (811) N/A (811) 227228 Joint Facility Rent - Debit N/A N/A 0 N/A 0 N/A 0 228229 Joint Facility Rent - (Credit) N/A N/A 0 N/A 0 N/A 0 229230 Other Rents - Debit N/A N/A 772,208 N/A 772,208 N/A 772,208 230231 Other Rents - (Credit) N/A N/A (148,355) N/A (148,355) N/A (148,355) 231232 Depreciation N/A N/A N/A 69,843 69,843 N/A 69,843 232233 Joint Facility - Debit N/A N/A 0 N/A 0 N/A 0 233234 Joint Facility - (Credit) N/A N/A 0 N/A 0 N/A 0 234235 Repairs Billed Other - (Credit) N/A N/A (211,792) N/A (211,792) N/A (211,792) 235236 Dismantling Retired Property 0 0 0 0 0 N/A 0 236237 Others 502 0 0 2 504 N/A 504 237238 TOTAL FREIGHT CARS 149,595 207,826 643,763 186,672 1,187,856 N/A 1,187,856 238
OTHER EQUIPMENT301 Administration 0 0 0 0 0 1,331 1,331 301
Repair and Maintenance:302 Truck, Trailers & Containers - Revenue Service 538 15,134 36,408 113 52,193 N/A 52,193 302303 Floating Equipment - Revenue Services 0 0 0 0 0 N/A 0 303304 Passenger & Other Revenue Equipment 1,229 0 21 0 1,250 17,942 19,192 304305 Computers & Data Process Systems 0 2,752 33,193 0 35,945 39 35,984 305306 Machinery 0 311 555 0 866 44 910 306307 Work & Other Nonrevenue Equipment 1,754 1,703 45,651 0 49,108 1,345 50,453 307308 Equipment Damaged 0 0 0 0 0 0 0 308309 Fringe Benefits N/A N/A N/A 1,967 1,967 7,438 9,405 309310 Other Casualties & Insurance N/A N/A N/A 125 125 1 126 310311 Lease Rentals - Debit N/A N/A 139,980 N/A 139,980 2,247 142,227 311312 Lease Rentals - (Credit) N/A N/A (438) N/A (438) 0 (438) 312
44 R
oad Initials: UPR
R Year: 2017
Railroad Annual R
eport R-1
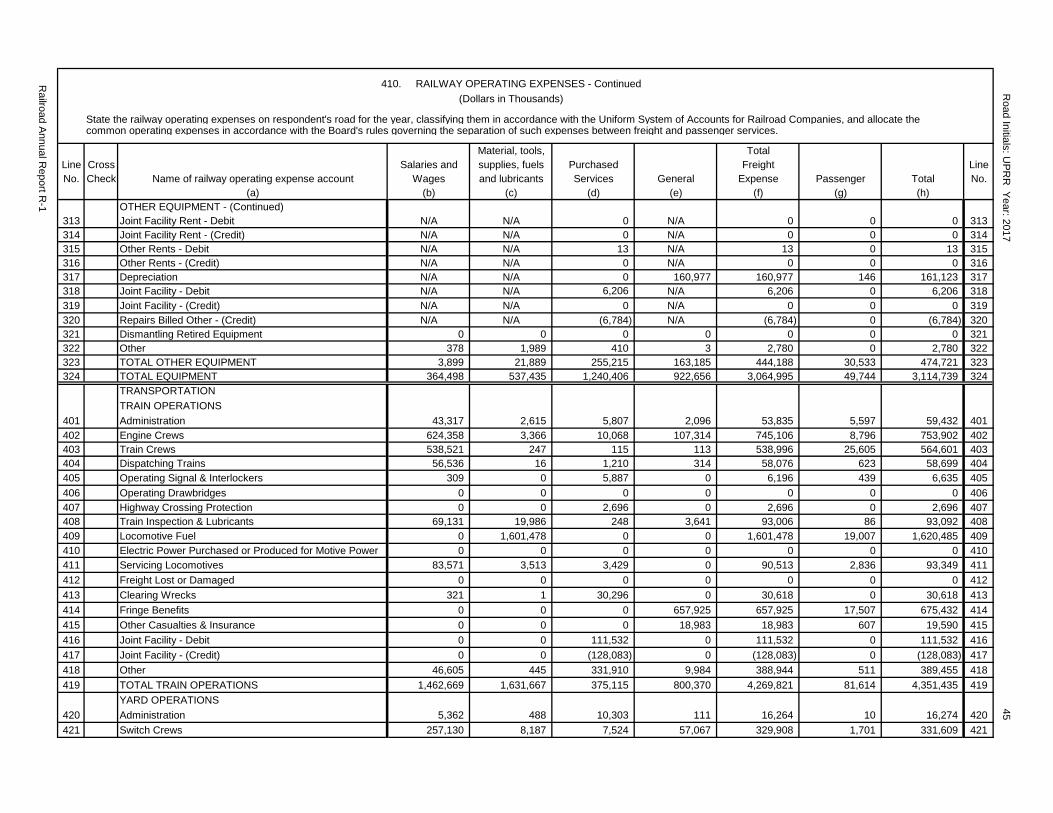
410. RAILWAY OPERATING EXPENSES - Continued(Dollars in Thousands)
State the railway operating expenses on respondent's road for the year, classifying them in accordance with the Uniform System of Accounts for Railroad Companies, and allocate the common operating expenses in accordance with the Board's rules governing the separation of such expenses between freight and passenger services.
Material, tools, TotalLine Cross Salaries and supplies, fuels Purchased Freight LineNo. Check Name of railway operating expense account Wages and lubricants Services General Expense Passenger Total No.
(a) (b) (c) (d) (e) (f) (g) (h)OTHER EQUIPMENT - (Continued)
313 Joint Facility Rent - Debit N/A N/A 0 N/A 0 0 0 313314 Joint Facility Rent - (Credit) N/A N/A 0 N/A 0 0 0 314315 Other Rents - Debit N/A N/A 13 N/A 13 0 13 315316 Other Rents - (Credit) N/A N/A 0 N/A 0 0 0 316317 Depreciation N/A N/A 0 160,977 160,977 146 161,123 317318 Joint Facility - Debit N/A N/A 6,206 N/A 6,206 0 6,206 318319 Joint Facility - (Credit) N/A N/A 0 N/A 0 0 0 319320 Repairs Billed Other - (Credit) N/A N/A (6,784) N/A (6,784) 0 (6,784) 320321 Dismantling Retired Equipment 0 0 0 0 0 0 0 321322 Other 378 1,989 410 3 2,780 0 2,780 322323 TOTAL OTHER EQUIPMENT 3,899 21,889 255,215 163,185 444,188 30,533 474,721 323324 TOTAL EQUIPMENT 364,498 537,435 1,240,406 922,656 3,064,995 49,744 3,114,739 324
TRANSPORTATION TRAIN OPERATIONS
401 Administration 43,317 2,615 5,807 2,096 53,835 5,597 59,432 401402 Engine Crews 624,358 3,366 10,068 107,314 745,106 8,796 753,902 402403 Train Crews 538,521 247 115 113 538,996 25,605 564,601 403404 Dispatching Trains 56,536 16 1,210 314 58,076 623 58,699 404405 Operating Signal & Interlockers 309 0 5,887 0 6,196 439 6,635 405406 Operating Drawbridges 0 0 0 0 0 0 0 406407 Highway Crossing Protection 0 0 2,696 0 2,696 0 2,696 407408 Train Inspection & Lubricants 69,131 19,986 248 3,641 93,006 86 93,092 408409 Locomotive Fuel 0 1,601,478 0 0 1,601,478 19,007 1,620,485 409410 Electric Power Purchased or Produced for Motive Power 0 0 0 0 0 0 0 410411 Servicing Locomotives 83,571 3,513 3,429 0 90,513 2,836 93,349 411412 Freight Lost or Damaged 0 0 0 0 0 0 0 412413 Clearing Wrecks 321 1 30,296 0 30,618 0 30,618 413414 Fringe Benefits 0 0 0 657,925 657,925 17,507 675,432 414415 Other Casualties & Insurance 0 0 0 18,983 18,983 607 19,590 415416 Joint Facility - Debit 0 0 111,532 0 111,532 0 111,532 416417 Joint Facility - (Credit) 0 0 (128,083) 0 (128,083) 0 (128,083) 417418 Other 46,605 445 331,910 9,984 388,944 511 389,455 418419 TOTAL TRAIN OPERATIONS 1,462,669 1,631,667 375,115 800,370 4,269,821 81,614 4,351,435 419
YARD OPERATIONS420 Administration 5,362 488 10,303 111 16,264 10 16,274 420421 Switch Crews 257,130 8,187 7,524 57,067 329,908 1,701 331,609 421
Railroad Annual R
eport R-1
Road Initials: U
PRR
Year: 201745

410. RAILWAY OPERATING EXPENSES - Continued(Dollars in Thousands)
46
State the railway operating expenses on respondent's road for the year, classifying them in accordance with the Uniform System of Accounts for Railroad Companies, and allocate the common operating expenses in accordance with the Board's rules governing the separation of such expenses between freight and passenger services.
Material, tools, TotalLine Cross Salaries and supplies, fuels Purchased Freight LineNo. Check Name of railway operating expense account Wages and lubricants Services General Expense Passenger Total No.
(a) (b) (c) (d) (e) (f) (g) (h)YARD OPERATIONS - (Continued)
422 Controlling Operations 43,519 0 0 0 43,519 1,091 44,610 422423 Yard & Terminal Clerical 8,138 283 0 61 8,482 751 9,233 423424 Operating Switches, Signals, Retarders & Humps 298 0 5,578 1 5,877 146 6,023 424425 Locomotive Fuel 0 208,743 0 0 208,743 0 208,743 425426 Electric Power Purchased or Produced for Motive Power 0 0 0 0 0 0 0 426427 Servicing Locomotives 0 0 0 0 0 0 0 427428 Freight Lost or Damaged - Solely Related N/A N/A N/A 0 0 0 0 428429 Clearing Wrecks 0 0 0 0 0 0 0 429430 Fringe Benefits N/A N/A N/A 141,442 141,442 1,619 143,061 430431 Other Casualties & Insurance N/A N/A N/A 4,140 4,140 0 4,140 431432 Joint Facility - Debit N/A N/A 50,147 N/A 50,147 0 50,147 432433 Joint Facility - (Credit) N/A N/A (3,256) N/A (3,256) 0 (3,256) 433434 Other 0 0 0 0 0 0 0 434435 TOTAL YARD OPERATIONS 314,447 217,701 70,296 202,822 805,266 5,318 810,584 435
TRAIN & YARD OPERATIONS COMMON501 Cleaning Car Interiors 34 766 23,773 N/A 24,573 3,596 28,169 501502 Adjusting & Transferring Loads 14 0 8,663 N/A 8,677 N/A 8,677 502503 Car Loading Devices & Grain Doors 0 298 25,722 N/A 26,020 N/A 26,020 503504 Freight Loss or Damaged - All Other 0 N/A 0 30,219 30,219 0 30,219 504505 Fringe Benefits 0 N/A 0 22 22 2 24 505506 TOTAL TRAIN & YARD OPERATIONS COMMON 48 1,064 58,158 30,241 89,511 3,598 93,109 506
SPECIALIZED SERVICE OPERATIONS507 Administration 10,582 317 6,205 306 17,410 N/A 17,410 507508 Picking & Delivery & Marine Line Haul 0 0 46,014 0 46,014 N/A 46,014 508509 Loading & Unloading Local Marine 27,361 722 284,960 519 313,562 N/A 313,562 509510 Protective Services 0 0 9,981 0 9,981 N/A 9,981 510511 Freight Loss or Damaged - Solely Related N/A N/A N/A 0 0 N/A 0 511512 Fringe Benefits N/A N/A N/A 19,687 19,687 N/A 19,687 512513 Casualties & Insurance N/A N/A N/A 495 495 N/A 495 513514 Joint Facility - Debit N/A N/A 0 0 0 N/A 0 514515 Joint Facility - (Credit) N/A N/A 0 0 0 N/A 0 515516 Other 5,826 347 4,842 210 11,225 N/A 11,225 516517 TOTAL SPECIALIZED SERVICES OPERATIONS 43,769 1,386 352,002 21,217 418,374 N/A 418,374 517
Road Initials: U
PRR
Year: 2017
Railroad Annual R
eport R-1

410. RAILWAY OPERATING EXPENSES - Concluded(Dollars in Thousands)
State the railway operating expenses on respondent's road for the year, classifying them in accordance with the Uniform System of Accounts for Railroad Companies, and allocate the common operating expenses in accordance with the Board's rules governing the separation of such expenses between freight and passenger services.
Material, tools, TotalLine Cross Salaries and supplies, fuels Purchased Freight LineNo. Check Name of railway operating expense account Wages and lubricants Services General Expense Passenger Total No.
(a) (b) (c) (d) (e) (f) (g) (h)ADMINISTRATIVE SUPPORT OPERATIONS
518 Administration 157,845 5,367 9,247 64,773 237,232 1,602 238,834 518519 Employees Performing Clerical & Acctg Functions 4,383 2,919 2,630 193 10,125 7,550 17,675 519520 Communication Systems Operations 5,516 422 10,332 841 17,111 700 17,811 520521 Loss & Damage Claims Process 8,863 77 4,932 651 14,523 0 14,523 521522 Fringe Benefits N/A N/A 0 66,144 66,144 2,961 69,105 522523 Casualties & Insurance N/A N/A 0 2,872 2,872 0 2,872 523524 Joint Facility - Debit N/A N/A 0 N/A 0 0 0 524525 Joint Facility - (Credit) N/A N/A (258) N/A (258) 0 (258) 525526 Other 3,452 1 217 221 3,891 0 3,891 526527 TOTAL ADMINISTRATION SUPPORT OPERATIONS 180,059 8,786 27,100 135,695 351,640 12,813 364,453 527528 TOTAL TRANSPORTATION 2,000,992 1,860,604 882,671 1,190,345 5,934,612 103,343 6,037,955 528
GENERAL & ADMINISTRATIVE601 Officers General & Administration 58,333 5,714 52,076 27,509 143,632 175 143,807 601602 Accounting, Auditing & Finance 32,694 53 10,404 112 43,263 225 43,488 602603 Management Services & Data Processing 66,833 2,807 9,870 2,530 82,040 515 82,555 603604 Marketing 47,825 3,819 20,720 7,019 79,383 37 79,420 604605 Sales 0 0 775 0 775 0 775 605606 Industrial Development 4,439 233 107 350 5,129 0 5,129 606607 Personnel & Labor Relations 35,562 1,797 2,964 10,822 51,145 2,486 53,631 607608 Legal & Secretarial 17,934 135 58,583 2,953 79,605 983 80,588 608609 Public Relations & Advertising 3,984 81 2,316 9,267 15,648 56 15,704 609610 Research & Development 0 0 0 0 0 0 0 610611 Fringe Benefits N/A N/A N/A 234,358 234,358 1,145 235,503 611612 Casualties & Insurance N/A N/A N/A 51,825 51,825 12 51,837 612613 Writedown of Uncollectible Accounts N/A N/A N/A 942 942 8 950 613614 Property Taxes N/A N/A N/A 480,711 480,711 2,163 482,874 614615 Other Taxes N/A N/A N/A 22,109 22,109 182 22,291 615616 Joint Facility - Debit N/A N/A 4,434 N/A 4,434 0 4,434 616617 Joint Facility - (Credit) N/A N/A (50) N/A (50) 0 (50) 617618 Other 33,718 6,242 49,844 40,042 129,846 27 129,873 618619 TOTAL GENERAL & ADMINISTRATIVE 301,322 20,881 212,043 890,549 1,424,795 8,014 1,432,809 619
620 TOTAL OPERATING EXPENSE 3,182,840 2,599,653 2,721,798 4,840,271 13,344,562 206,771 13,551,333 620
47
Railroad Annual R
eport R-1
Road Initials: U
PRR
Year: 2017
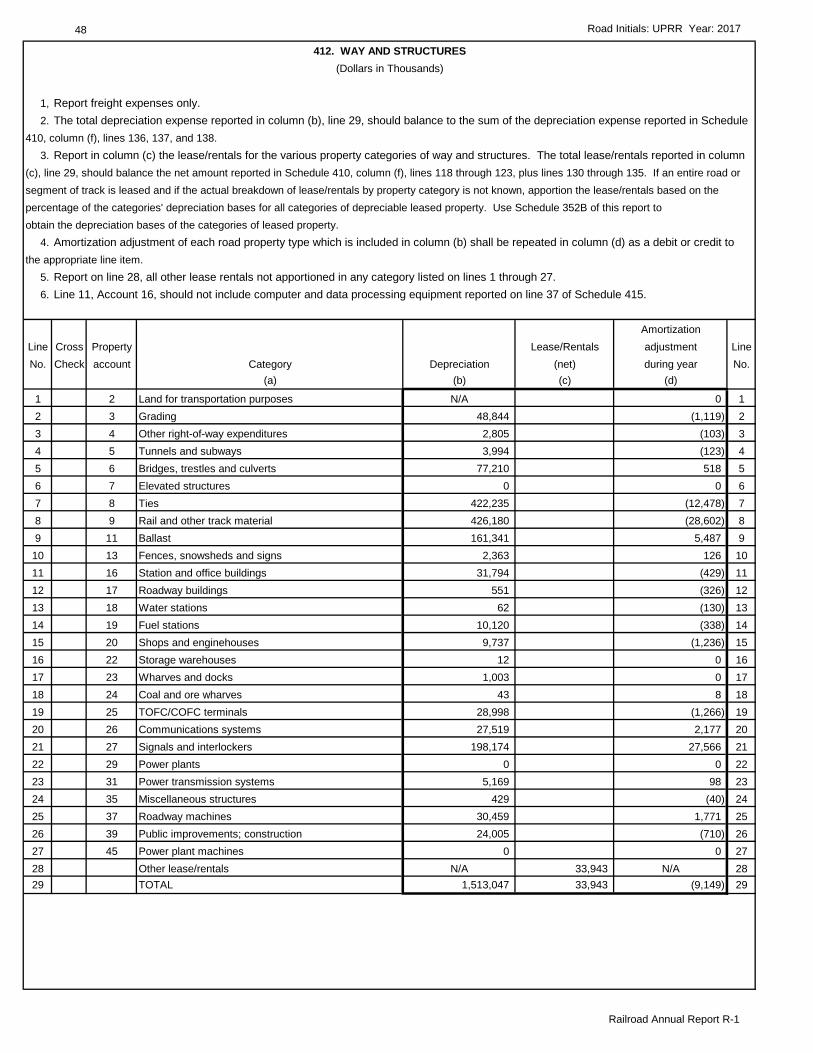
48 Road Initials: UPRR Year: 2017
Railroad Annual Report R-1
412. WAY AND STRUCTURES(Dollars in Thousands)
1, Report freight expenses only.2. The total depreciation expense reported in column (b), line 29, should balance to the sum of the depreciation expense reported in Schedule
410, column (f), lines 136, 137, and 138.3. Report in column (c) the lease/rentals for the various property categories of way and structures. The total lease/rentals reported in column
(c), line 29, should balance the net amount reported in Schedule 410, column (f), lines 118 through 123, plus lines 130 through 135. If an entire road orsegment of track is leased and if the actual breakdown of lease/rentals by property category is not known, apportion the lease/rentals based on thepercentage of the categories' depreciation bases for all categories of depreciable leased property. Use Schedule 352B of this report toobtain the depreciation bases of the categories of leased property.
4. Amortization adjustment of each road property type which is included in column (b) shall be repeated in column (d) as a debit or credit tothe appropriate line item.
5. Report on line 28, all other lease rentals not apportioned in any category listed on lines 1 through 27.6. Line 11, Account 16, should not include computer and data processing equipment reported on line 37 of Schedule 415.
AmortizationLine Cross Property Lease/Rentals adjustment LineNo. Check account Category Depreciation (net) during year No.
(a) (b) (c) (d)
1 2 Land for transportation purposes N/A 0 12 3 Grading 48,844 (1,119) 23 4 Other right-of-way expenditures 2,805 (103) 34 5 Tunnels and subways 3,994 (123) 45 6 Bridges, trestles and culverts 77,210 518 56 7 Elevated structures 0 0 67 8 Ties 422,235 (12,478) 78 9 Rail and other track material 426,180 (28,602) 89 11 Ballast 161,341 5,487 9
10 13 Fences, snowsheds and signs 2,363 126 1011 16 Station and office buildings 31,794 (429) 1112 17 Roadway buildings 551 (326) 1213 18 Water stations 62 (130) 1314 19 Fuel stations 10,120 (338) 1415 20 Shops and enginehouses 9,737 (1,236) 1516 22 Storage warehouses 12 0 1617 23 Wharves and docks 1,003 0 1718 24 Coal and ore wharves 43 8 1819 25 TOFC/COFC terminals 28,998 (1,266) 1920 26 Communications systems 27,519 2,177 2021 27 Signals and interlockers 198,174 27,566 2122 29 Power plants 0 0 2223 31 Power transmission systems 5,169 98 2324 35 Miscellaneous structures 429 (40) 2425 37 Roadway machines 30,459 1,771 2526 39 Public improvements; construction 24,005 (710) 2627 45 Power plant machines 0 0 2728 Other lease/rentals N/A 33,943 N/A 2829 TOTAL 1,513,047 33,943 (9,149) 29

414. RENTS FOR INTERCHANGED FREIGHT TRAIN CARS AND OTHER FREIGHT-CARRYING EQUIPMENT(Dollars in Thousands)
1. Report freight expenses only.2. Report in this supporting schedule rental information by car type and other freight-carrying equipment relating to the interchange of railroad owned or leased equipment and privately owned
equipment. (Reporting for leased equipment covers equipment with the carrier's own railroad markings.)3. The gross amounts receivable and payable for freight-train cars (line 19, columns (b) through (d), and line 19, columns (e) through (g), respectively) should balance with Schedule 410, column (f)
lines 231 (credits) and 230 (debits). Trailer and container rentals in this schedule are included in Schedule 410, column (f) lines 315 and 316. However, the trailer and container rentals in thisschedule will not balance to lines 315 and 316 of Schedule 410 because those lines include rents for "Other Equipment" which is reported in Schedule 415, column (e). The balancing of Schedules410, 414, and 415 "Other Equipment" is outlined in note 6 to Schedule 415.
4. Report in columns (b) and (e) rentals for private-line cars (whether under railroad control or not) and shipper owned cars.5. Report in columns (c), (d), (f), and (g) rentals for railroad owned cars prescribed by the Board in Ex Parte No. 334, for which rentals are settled on a combination mileage and time basis (basic
per diem). Include railroad owned per diem tank cars on line 17.NOTE: Mechanical designations for each car type are shown in Schedule 710.
GROSS AMOUNTS RECEIVABLE GROSS AMOUNTS PAYABLEPer diem basis Per diem basis
Line Cross Private Private LineNo. Check Type of Equipment line cars Mileage Time line cars Mileage Time No.
(a) (b) (c) (d) (e) (f) (g)CAR TYPES
1 Box - Plain 40 Foot 0 0 0 0 0 12 Box - Plain 50 Foot and Longer 290 1,155 13,821 1,348 3,093 23 Box - Equipped 5,821 23,647 43,902 17,412 38,078 34 Gondola - Plain 151 809 9,684 1,342 3,346 45 Gondola - Equipped 905 5,966 0 5,833 12,613 56 Hopper - Covered 6,129 20,305 74,170 7,398 19,578 67 Hopper - Open Top - General Service 411 2,178 0 122 370 78 Hopper - Open Top - Special Service 93 1,027 0 11 24 89 Refrigerator - Mechanical 4,172 14,614 28 2 144 9
10 Refrigerator - Non-Mechanical 454 1,861 0 118 310 1011 Flat - TOFC/COFC 0 5 186,138 17,371 39,916 1112 Flat - Multi-Level 1,751 5,283 95,786 5,093 20,913 1213 Flat - General Service 0 1 0 47 115 1314 Flat - Other 533 4,048 51,529 6,969 19,993 1415 Tank - Under 22,000 Gallons 0 0 492 0 0 1516 Tank - 22,000 Gallons and Over 0 0 147 0 0 1617 All Other Freight Cars 0 4 0 20 166 1718 Auto Racks 0 46,742 0 0 74,766 1819 TOTAL FREIGHT TRAIN CARS 20,710 127,645 475,697 63,086 233,425 19
OTHER FREIGHT-CARRYING EQUIPMENT20 Refrigerated Trailers 2021 Other Trailers 0 6 2122 Refrigerated Containers 2223 Other Containers 0 7 2324 * TOTAL TRAILERS AND CONTAINERS 0 0 0 0 0 13 2425 GRAND TOTAL (Lines 19 and 24) 0 20,710 127,645 475,697 63,086 233,438 25
Railroad Annual R
eport R-1
Road Initials: U
PRR
Year: 201749

50 Road Initials: UPRR Year: 2017
Railroad Annual Report R-1
NOTES AND REMARKS
(This page intentionally left blank)

Road Initials: UPRR Year: 2017 51
Railroad Annual Report R-1
GENERAL INSTRUCTIONS CONCERNING RETURNS TO BE MADE TO SCHEDULE 415
1. Report freight expenses only.
2. Report by type of equipment all natural expenses relating to equipment functions (salaries and wages, materials, tools, supplies, fuels andlubricants, purchased services, and general).
3. Report in column (b) net repair expense, excluding the cost to repair damaged equipment.Schedule 415, column (b) will balance to Schedule 410, column (f) as follows:(a) Locomotives, line 5 plus line 38, compared to the sum of Schedule 410, lines 202, 203, and 216 (excluding wreck repairs). Do not report in Schedule 415, Equipment Damaged from Schedule 410, line 204.(b) Freight cars, line 24 plus line 39, compared to the sum of Schedule 410, lines 221, 222, and 235 (excluding wreck repairs). Do not report in Schedule 415, Equipment Damaged from Schedule 410, line 223.(c) Sum of highway equipment (line 32), floating equipment (line 35), passenger and other revenue equipment (line 36), computer and data processing equipment (line 37), machinery-other equipment (line 40), and work and other non-revenue equipment (line 41), compared to Schedule 410, the sum of lines 302 through 307, plus line 320 (excluding wreck repairs). Do not report in Schedule 415, equipment damaged from Schedule 410, line 308.Note: Lines 216, 235, and 320 of Schedule 410 are credit amounts.The allocation of freight car repair expenses reportable on Schedule 415 by car types shall be in accordance with Instruction 2-21, Freighttrain repair costing, 49 CFR 1201.
4. Depreciation expense for each class of equipment by car type shall be reported in columns (c) and (d). For improvements on leasedproperty, Accounts 732 and 733, use a supplementary Schedule 415, which will relate to Schedules 340 and 342.Depreciation charges reported in columns (c) and (d) will balance to Schedule 410, column (f) as follows:(a) Locomotives, lines 5 and 38, compared to Schedule 410, line 213.(b) Freight cars, lines 24 and 39, compared to Schedule 410, line 232.(c) Sum of highway equipment (line 32), floating equipment (line 35), passenger and other revenue equipment (line 36), computer and data processing equipment (line 37), machinery-other equipment (line 40), and work and other non-revenue equipment (line 41), compared to Schedule 410, line 317.
5. Amortization adjustment of each equipment type which is included in column (c) shall be reported in column (e) as a debit or credit to theappropriate line item.
6. Lease/rentals reported in column (f) should balance to column (f) of Schedule 410 as follows:(a) Locomotives, lines 5 and 38, compared to Schedule 410, lines 207, 208, 211, and 212.(b) Freight cars, lines 24 and 39, compared to Schedule 410, lines 226 and 227 (note that Schedule 410, lines 230 and 231, are reported inSchedule 415, and are not included in Schedule 415).(c) Sum of lease/rentals for all other equipment, lines 32, 35, 36, 37, 40, and 41, will balance to Schedule 410, lines 311, 312, 315, and 316, except for the interchange rental on trailers and containers which is reported in Schedule 414. Therefore, both Schedules 414 and 415 should be used when balancing lease/rentals other equipment to Schedule 410. Do not report in Schedule 415, the trailer and container rentals reported in Schedule 414.
7. Investment base by types of equipment shall be reported in columns (g) and (h) and should not include the cost of equipment used but notowned when rents therefore are included in the rent for equipment and Account Nos. 31-21-00, 31-22-00, 31-23-00, 35-21-00, 35-22-00,and 35-23-00. It should include the cost of equipment owned and leased to others when the rents are included in the rent for EquipmentAccount Nos. 32-21-00, 32-22-00, 32-23-00, 36-21-00, 36-22-00, and 36-23-00.Property used but not owned should also be included when the rent is included in Account Nos. 31-12-00, 31-13-00, 31-21-00, 31-22-00,and 31-23-00, inclusive.The grand total of each equipment account in column (h) of Schedule 330 should equal the totals of line items constituting theequipment account totals of columns (g) and (h) of Schedule 415.
8. Accumulated depreciation for each class of equipment shall be reported in columns (i) and (j). The grand total of each equipment reserveaccount in column (g), Schedule 335, shall equal the combined aggregate total accumulated depreciation for line items constituting thecorresponding equipment accounts reported in columns (i) and (j), on Schedule 415.
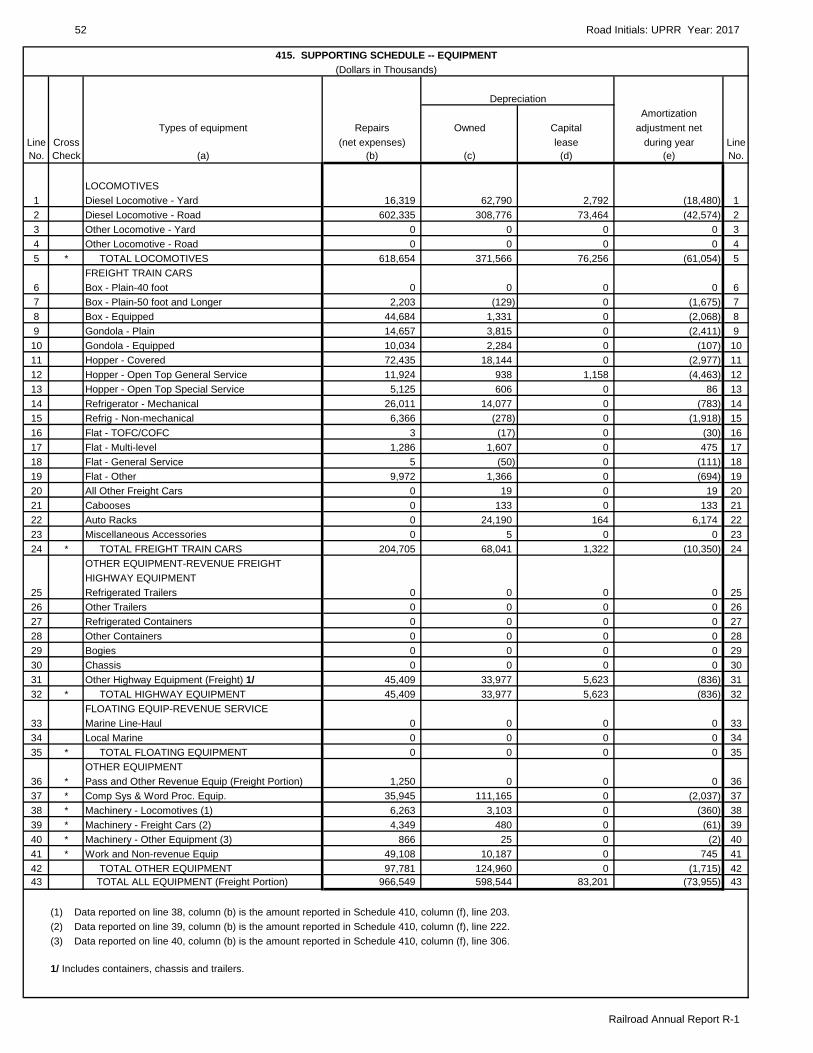
52 Road Initials: UPRR Year: 2017
Railroad Annual Report R-1
415. SUPPORTING SCHEDULE -- EQUIPMENT(Dollars in Thousands)
Depreciation
AmortizationTypes of equipment Repairs Owned Capital adjustment net
Line Cross (net expenses) lease during year LineNo. Check (a) (b) (c) (d) (e) No.
LOCOMOTIVES1 Diesel Locomotive - Yard 16,319 62,790 2,792 (18,480) 12 Diesel Locomotive - Road 602,335 308,776 73,464 (42,574) 23 Other Locomotive - Yard 0 0 0 0 34 Other Locomotive - Road 0 0 0 0 45 * TOTAL LOCOMOTIVES 618,654 371,566 76,256 (61,054) 5
FREIGHT TRAIN CARS6 Box - Plain-40 foot 0 0 0 0 67 Box - Plain-50 foot and Longer 2,203 (129) 0 (1,675) 78 Box - Equipped 44,684 1,331 0 (2,068) 89 Gondola - Plain 14,657 3,815 0 (2,411) 910 Gondola - Equipped 10,034 2,284 0 (107) 1011 Hopper - Covered 72,435 18,144 0 (2,977) 1112 Hopper - Open Top General Service 11,924 938 1,158 (4,463) 1213 Hopper - Open Top Special Service 5,125 606 0 86 1314 Refrigerator - Mechanical 26,011 14,077 0 (783) 1415 Refrig - Non-mechanical 6,366 (278) 0 (1,918) 1516 Flat - TOFC/COFC 3 (17) 0 (30) 1617 Flat - Multi-level 1,286 1,607 0 475 1718 Flat - General Service 5 (50) 0 (111) 1819 Flat - Other 9,972 1,366 0 (694) 1920 All Other Freight Cars 0 19 0 19 2021 Cabooses 0 133 0 133 2122 Auto Racks 0 24,190 164 6,174 2223 Miscellaneous Accessories 0 5 0 0 2324 * TOTAL FREIGHT TRAIN CARS 204,705 68,041 1,322 (10,350) 24
OTHER EQUIPMENT-REVENUE FREIGHTHIGHWAY EQUIPMENT
25 Refrigerated Trailers 0 0 0 0 2526 Other Trailers 0 0 0 0 2627 Refrigerated Containers 0 0 0 0 2728 Other Containers 0 0 0 0 2829 Bogies 0 0 0 0 2930 Chassis 0 0 0 0 3031 Other Highway Equipment (Freight) 1/ 45,409 33,977 5,623 (836) 3132 * TOTAL HIGHWAY EQUIPMENT 45,409 33,977 5,623 (836) 32
FLOATING EQUIP-REVENUE SERVICE33 Marine Line-Haul 0 0 0 0 3334 Local Marine 0 0 0 0 3435 * TOTAL FLOATING EQUIPMENT 0 0 0 0 35
OTHER EQUIPMENT36 * Pass and Other Revenue Equip (Freight Portion) 1,250 0 0 0 3637 * Comp Sys & Word Proc. Equip. 35,945 111,165 0 (2,037) 3738 * Machinery - Locomotives (1) 6,263 3,103 0 (360) 3839 * Machinery - Freight Cars (2) 4,349 480 0 (61) 3940 * Machinery - Other Equipment (3) 866 25 0 (2) 4041 * Work and Non-revenue Equip 49,108 10,187 0 745 4142 TOTAL OTHER EQUIPMENT 97,781 124,960 0 (1,715) 4243 TOTAL ALL EQUIPMENT (Freight Portion) 966,549 598,544 83,201 (73,955) 43
(1) Data reported on line 38, column (b) is the amount reported in Schedule 410, column (f), line 203.(2) Data reported on line 39, column (b) is the amount reported in Schedule 410, column (f), line 222.(3) Data reported on line 40, column (b) is the amount reported in Schedule 410, column (f), line 306.
1/ Includes containers, chassis and trailers.
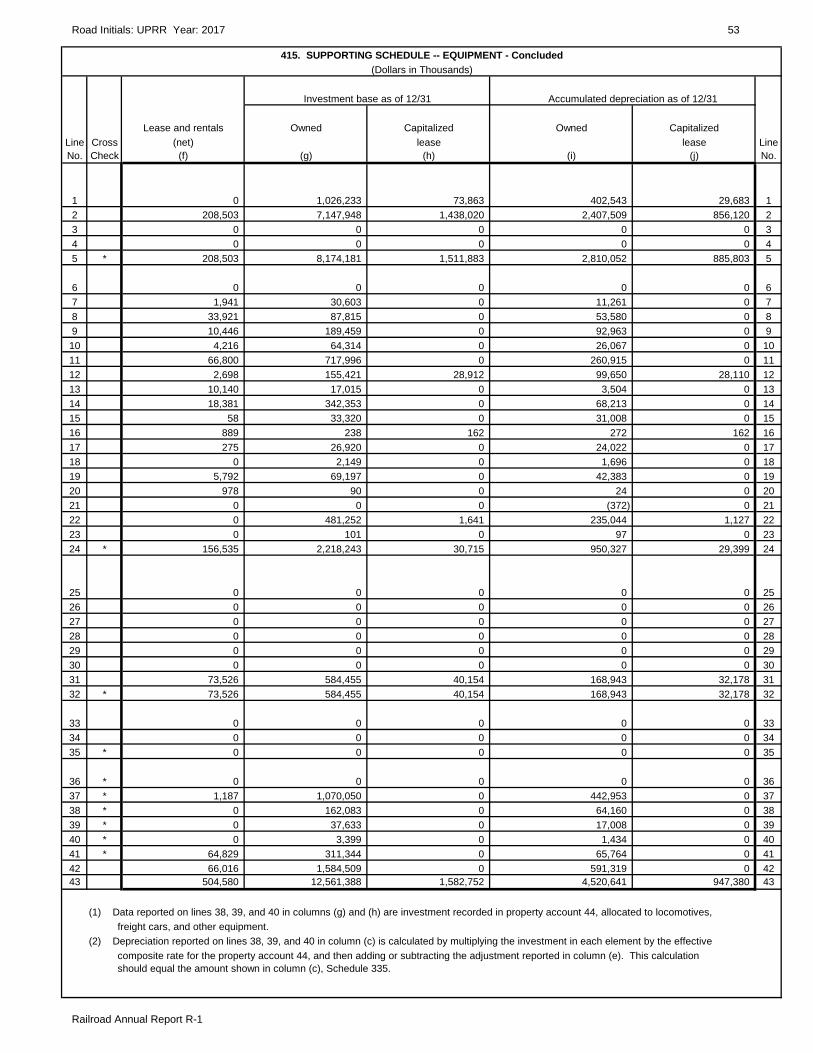
Road Initials: UPRR Year: 2017 53
Railroad Annual Report R-1
415. SUPPORTING SCHEDULE -- EQUIPMENT - Concluded(Dollars in Thousands)
Investment base as of 12/31 Accumulated depreciation as of 12/31
Lease and rentals Owned Capitalized Owned CapitalizedLine Cross (net) lease lease LineNo. Check (f) (g) (h) (i) (j) No.
1 0 1,026,233 73,863 402,543 29,683 12 208,503 7,147,948 1,438,020 2,407,509 856,120 23 0 0 0 0 0 34 0 0 0 0 0 45 * 208,503 8,174,181 1,511,883 2,810,052 885,803 5
6 0 0 0 0 0 67 1,941 30,603 0 11,261 0 78 33,921 87,815 0 53,580 0 89 10,446 189,459 0 92,963 0 910 4,216 64,314 0 26,067 0 1011 66,800 717,996 0 260,915 0 1112 2,698 155,421 28,912 99,650 28,110 1213 10,140 17,015 0 3,504 0 1314 18,381 342,353 0 68,213 0 1415 58 33,320 0 31,008 0 1516 889 238 162 272 162 1617 275 26,920 0 24,022 0 1718 0 2,149 0 1,696 0 1819 5,792 69,197 0 42,383 0 1920 978 90 0 24 0 2021 0 0 0 (372) 0 2122 0 481,252 1,641 235,044 1,127 2223 0 101 0 97 0 2324 * 156,535 2,218,243 30,715 950,327 29,399 24
25 0 0 0 0 0 2526 0 0 0 0 0 2627 0 0 0 0 0 2728 0 0 0 0 0 2829 0 0 0 0 0 2930 0 0 0 0 0 3031 73,526 584,455 40,154 168,943 32,178 3132 * 73,526 584,455 40,154 168,943 32,178 32
33 0 0 0 0 0 3334 0 0 0 0 0 3435 * 0 0 0 0 0 35
36 * 0 0 0 0 0 3637 * 1,187 1,070,050 0 442,953 0 3738 * 0 162,083 0 64,160 0 3839 * 0 37,633 0 17,008 0 3940 * 0 3,399 0 1,434 0 4041 * 64,829 311,344 0 65,764 0 4142 66,016 1,584,509 0 591,319 0 4243 504,580 12,561,388 1,582,752 4,520,641 947,380 43
(1) Data reported on lines 38, 39, and 40 in columns (g) and (h) are investment recorded in property account 44, allocated to locomotives, freight cars, and other equipment.(2) Depreciation reported on lines 38, 39, and 40 in column (c) is calculated by multiplying the investment in each element by the effective composite rate for the property account 44, and then adding or subtracting the adjustment reported in column (e). This calculation should equal the amount shown in column (c), Schedule 335.

417. SPECIALIZED SERVICE SUBSCHEDULE -- TRANSPORTATION(Dollars in Thousands)
1. Report freight expenses only.2. Report in lines 1, 2, 3, 4, and 10 the total of those natural expenses (salaries and wages, material, tools, supplies, fuels and lubricants, purchased services, and general) incurred
in the operation of each type of specialized service facility. This schedule does not include switching services performed by train and yard crews in connection with or withinspecialized service facilities.
3. When it is necessary to apportion expenses, such as administrative expenses to two or more services, they shall be apportioned on the most equitable basis available to therespondent and only to the services they support. The total expenses in column (j) should balance with the respective line items in Schedule 410, Railway Operating Expenses.
4. Report in column (b), line 2, the expenses incurred in highway movements of trailers and containers performed at the expense of the reporting railroad within a terminal area for thepurpose of pick-up, delivery, or highway interchange service. Report in column (b), line 3, the expenses incurred in operating facilities for handling trailers and/or containers,including storage expenses. See Schedule 755, Note R.
5. The operation of floating equipment in line-haul service (between distinct terminals) should be reported in column (c) on line 2. Floating operations conducted within a generalterminal or harbor area should be reported in column (c), line 3.
6. Report in column (g), line 3, the expenses incurred by the railroad in loading and unloading automobiles, trucks, etc., to and from bi-level and tri-level auto rack cars. Report on line2, column (g), the expense incurred by the railroad in moving automobiles, etc., between bi-level and tri-level loading and unloading facilities over the highway to shippers,receivers, or connecting carriers. Report in column (f) operating expenses for land facilities in support of floating operations, including the operation of docks and wharves.
7. Report on line 4, column (b), the expenses related to heating and refrigeration of TOFC/COFC trailers and containers (total debits and credits). The expenses on line 4, column (h),relate to refrigerator cars only.
8. Report in column (i) total expenses incurred in performing rail substitute service, other highway revenue service, LCL terminal operations, warehouse operations, freight cartransloading, and grain elevator terminal operations and livestock feeding operations only.
MotorOther Vehicle Protective Total
Line Cross TOFC/COFC Floating Coal Marine Ore Marine Marine Load and Services Other Special Columns LineNo. Check Items Terminal Equipment Terminal Terminal Terminal Distribution Refrigerator Car Services (b-i) No.
(a) (b) (c) (d) (e) (f) (g) (h) (i) (j)1 * Administration 17,410 0 0 17,410 12 * Pick up and delivery, marine line haul 45,166 848 0 46,014 23 * Loading and unloading and local marine 274,299 1,106 38,157 N/A 313,562 34 * Protective services, total debit and credits 2,462 7,519 N/A 9,981 45 * Freight lost or damaged-solely related 0 0 0 0 56 * Fringe benefits 19,687 0 0 19,687 67 * Casualty and insurance 433 2 60 0 495 78 * Joint facility - Debit 0 0 0 0 89 * Joint facility - Credit 0 0 0 0 910 * Other 11,225 0 0 11,225 1011 * TOTAL 370,682 1,108 46,584 0 418,374 11
Railroad Annual R
eport R-1
54 R
oad Initials: UPR
R Year: 2017
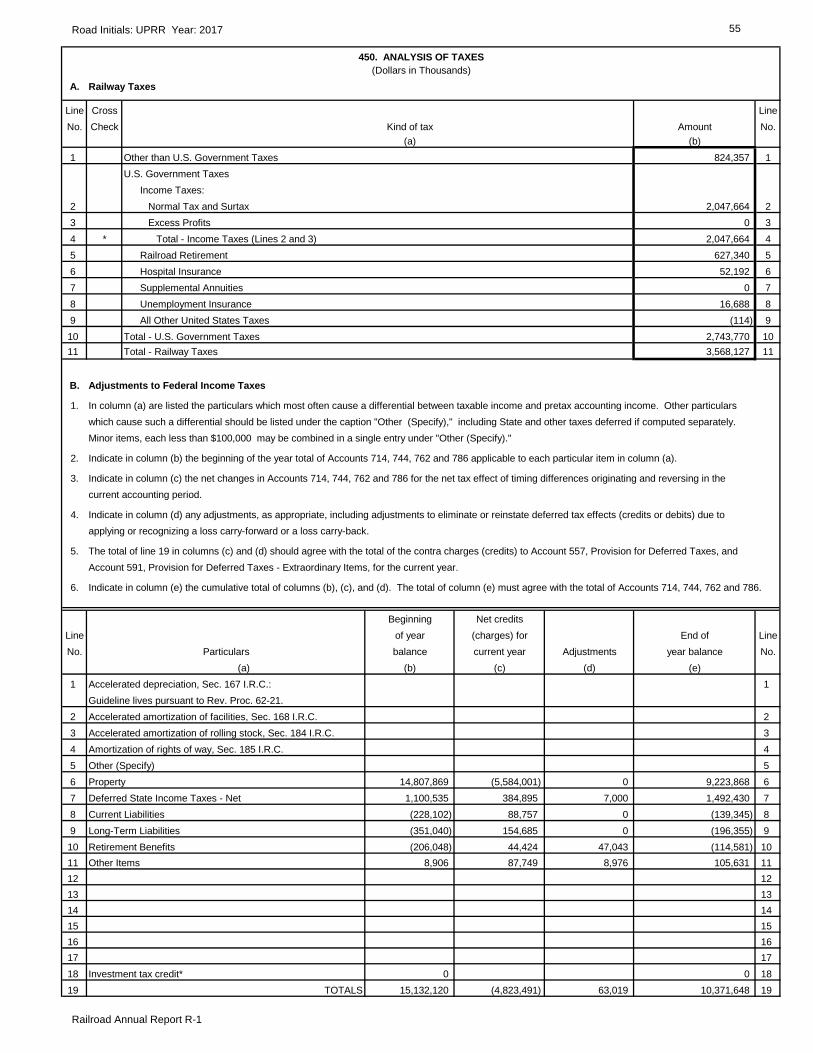
Road Initials: UPRR Year: 2017 55
Railroad Annual Report R-1
450. ANALYSIS OF TAXES(Dollars in Thousands)
A. Railway Taxes
Line Cross LineNo. Check Kind of tax Amount No.
(a) (b)1 Other than U.S. Government Taxes 824,357 1
U.S. Government Taxes Income Taxes:
2 Normal Tax and Surtax 2,047,664 23 Excess Profits 0 34 * Total - Income Taxes (Lines 2 and 3) 2,047,664 45 Railroad Retirement 627,340 56 Hospital Insurance 52,192 67 Supplemental Annuities 0 78 Unemployment Insurance 16,688 89 All Other United States Taxes (114) 910 Total - U.S. Government Taxes 2,743,770 1011 Total - Railway Taxes 3,568,127 11
B. Adjustments to Federal Income Taxes
1. In column (a) are listed the particulars which most often cause a differential between taxable income and pretax accounting income. Other particularswhich cause such a differential should be listed under the caption "Other (Specify)," including State and other taxes deferred if computed separately. Minor items, each less than $100,000 may be combined in a single entry under "Other (Specify)."
2. Indicate in column (b) the beginning of the year total of Accounts 714, 744, 762 and 786 applicable to each particular item in column (a).
3. Indicate in column (c) the net changes in Accounts 714, 744, 762 and 786 for the net tax effect of timing differences originating and reversing in thecurrent accounting period.
4. Indicate in column (d) any adjustments, as appropriate, including adjustments to eliminate or reinstate deferred tax effects (credits or debits) due toapplying or recognizing a loss carry-forward or a loss carry-back.
5. The total of line 19 in columns (c) and (d) should agree with the total of the contra charges (credits) to Account 557, Provision for Deferred Taxes, andAccount 591, Provision for Deferred Taxes - Extraordinary Items, for the current year.
6. Indicate in column (e) the cumulative total of columns (b), (c), and (d). The total of column (e) must agree with the total of Accounts 714, 744, 762 and 786.
Beginning Net creditsLine of year (charges) for End of LineNo. Particulars balance current year Adjustments year balance No.
(a) (b) (c) (d) (e)1 Accelerated depreciation, Sec. 167 I.R.C.: 1
Guideline lives pursuant to Rev. Proc. 62-21.2 Accelerated amortization of facilities, Sec. 168 I.R.C. 23 Accelerated amortization of rolling stock, Sec. 184 I.R.C. 34 Amortization of rights of way, Sec. 185 I.R.C. 45 Other (Specify) 56 Property 14,807,869 (5,584,001) 0 9,223,868 67 Deferred State Income Taxes - Net 1,100,535 384,895 7,000 1,492,430 78 Current Liabilities (228,102) 88,757 0 (139,345) 89 Long-Term Liabilities (351,040) 154,685 0 (196,355) 910 Retirement Benefits (206,048) 44,424 47,043 (114,581) 1011 Other Items 8,906 87,749 8,976 105,631 1112 1213 1314 1415 1516 1617 1718 Investment tax credit* 0 0 1819 TOTALS 15,132,120 (4,823,491) 63,019 10,371,648 19

56 Road Initials: UPRR Year: 2017
Railroad Annual Report R-1
450. ANALYSIS OF TAXES - Concluded(Dollars in Thousands)
* Footnotes:
1. If flow-through method was elected, indicate net decrease (or increase) in tax accrual because ofinvestment tax credit.
If deferral method for investment tax credit was elected:(1) Indicate amount of credit utilized as a reduction of tax liability for current year.(2) Deduct amount of current year's credit applied to reduction of tax liability but deferred for
accounting purposes. (3) Balance of current year's credit used to reduce current year's tax accrual. (4) Add amount of prior year's deferred credits being amortized to reduce current year's tax
accrual. (5) Total decrease in current year's tax accrual resulting from use of investment tax credits.
2. Estimated amount of future earnings which can be realized before paying Federal income taxes becauseof unused and available net operating loss carryover on January 1 of the year following that for which thereport is made. 0
NOTES AND REMARKS

Road Initials: UPRR Year: 2017 57
Railroad Annual Report R-1
501. GUARANTEES AND SURETYSHIPS(Dollars in Thousands)
1. If the respondent was under obligation as guarantor or surety for the performance by any other corporation or other association of any agreement or obligation, show the particulars of each contract of guaranty or suretyship in effect at the close of the year or entered into and expired during the year. This inquiry does not cover the case of ordinary commercial paper maturing on demand or not later than 2 years after the date of issue. Items of less than $50,000 may be shown as one total.
Line Names of all parties Amount of contingent Sole or joint LineNo. principally and primary liable Description liability contingent liability No.
(a) (b) (c) (d)1 Terminal RR Association of St. Louis 12 Union Pacific Railroad Company Sinking Fund & Int. on RFT & Mtge 3,006 Joint 23 Burlington Northern Santa Fe Railway Co. Bonds Series C due 7-1-2019 34 CSX Transportation, Inc. (FD 14553) 45 Canadian National 56 Norfolk Southern Railway Co. 67 78 89 Kansas City Terminal Flyover 9
10 Union Pacific Railroad Company 6.8884% Railway Bridge System Bond 6,923 Joint 1011 Burlington Northern Santa Fe Railway Co. 1112 1213 1314 Union Pacific Railroad Company Kansas and Missouri Highline Project 22,800 Sole 1415 1516 1617 1718 1819 1920 2021 2122 2223 2324 2425 2526 2627 2728 2829 2930 3031 3132 3233 3334 3435 3536 3637 3738 38
2. If any corporation or other association was under obligation as guarantor or surety for the performance by the respondent of any agreement or obligation, show the particulars called for hereunder for each such contract of guaranty or suretyship in effect at the close of the year or entered into and expired during the year. This inquiry does not cover the case of ordinary commercial paper maturing on demand or not later than 2 years after the date of issue, nor does itinclude ordinary surety bonds or undertakings on appeals in court proceedings.
Finance Docket number, title, maturity date and
Line concise description of Name of all Amount contingent Sole or joint LineNo. agreement or obligation guarantors and sureties liability of guarantors contingent liability No.
(a) (b) (c) (d)1 12 23 34 45 56 67 78 89 9

58 Road Initials: UPRR Year: 2017
Railroad Annual Report R-1
502. COMPENSATING BALANCES AND SHORT-TERM BORROWING ARRANGEMENTS(Dollars in Thousands)
Using the following notes as a guideline, show the requirements compensating balances and short-term borrowingarrangements. Footnote disclosure is required even though the arrangements is not reduced to writing.
1. Disclose compensating balances not legally restricted, lines of credit used and unused, average interest rate of short-termborrowings outstanding at balance sheet date, maximum amount of outstanding borrowings during the period and the weightedaverage rate of those borrowings.
2. Time deposits and certificates of deposit constituting compensating balances not legally restricted should be disclosed.
3. Compensating balance arrangements need only be disclosed for the latest fiscal year.
4. Compensating balances included in Account 703, Special Deposits, and in Account 717, Other funds, should also beseparately disclosed below.
5. Compensating balance arrangements are sufficiently material to require disclosure in footnotes when the aggregate of writtenand oral agreement balances amount to 15 percent or more of liquid assets (current cash balances, restricted and unrestrictedplus marketable securities).
6. When a carrier is not in compliance with a compensating balance requirement, that fact should be disclosed along with statedand possible sanctions whenever such possible sanctions may be immediate (not vague or unpredictable) and material.
The Company has outstanding letters of credit in the amount of $ 9.1 million with various banksunder which no borrowings were outstanding at December 31, 2017.
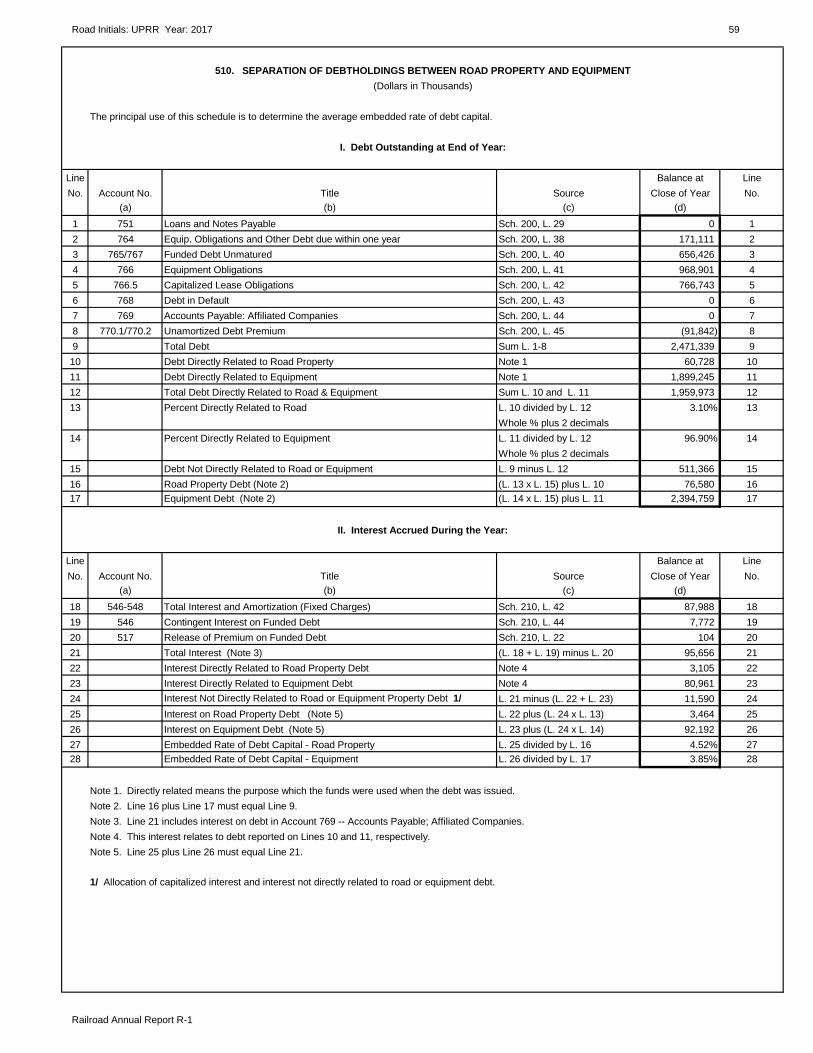
Road Initials: UPRR Year: 2017 59
Railroad Annual Report R-1
510. SEPARATION OF DEBTHOLDINGS BETWEEN ROAD PROPERTY AND EQUIPMENT(Dollars in Thousands)
The principal use of this schedule is to determine the average embedded rate of debt capital.
I. Debt Outstanding at End of Year:
Line Balance at LineNo. Account No. Title Source Close of Year No.
(a) (b) (c) (d)1 751 Loans and Notes Payable Sch. 200, L. 29 0 12 764 Equip. Obligations and Other Debt due within one year Sch. 200, L. 38 171,111 23 765/767 Funded Debt Unmatured Sch. 200, L. 40 656,426 34 766 Equipment Obligations Sch. 200, L. 41 968,901 45 766.5 Capitalized Lease Obligations Sch. 200, L. 42 766,743 56 768 Debt in Default Sch. 200, L. 43 0 67 769 Accounts Payable: Affiliated Companies Sch. 200, L. 44 0 78 770.1/770.2 Unamortized Debt Premium Sch. 200, L. 45 (91,842) 89 Total Debt Sum L. 1-8 2,471,339 910 Debt Directly Related to Road Property Note 1 60,728 1011 Debt Directly Related to Equipment Note 1 1,899,245 1112 Total Debt Directly Related to Road & Equipment Sum L. 10 and L. 11 1,959,973 1213 Percent Directly Related to Road L. 10 divided by L. 12 3.10% 13
Whole % plus 2 decimals14 Percent Directly Related to Equipment L. 11 divided by L. 12 96.90% 14
Whole % plus 2 decimals15 Debt Not Directly Related to Road or Equipment L. 9 minus L. 12 511,366 1516 Road Property Debt (Note 2) (L. 13 x L. 15) plus L. 10 76,580 1617 Equipment Debt (Note 2) (L. 14 x L. 15) plus L. 11 2,394,759 17
II. Interest Accrued During the Year:
Line Balance at LineNo. Account No. Title Source Close of Year No.
(a) (b) (c) (d)18 546-548 Total Interest and Amortization (Fixed Charges) Sch. 210, L. 42 87,988 1819 546 Contingent Interest on Funded Debt Sch. 210, L. 44 7,772 1920 517 Release of Premium on Funded Debt Sch. 210, L. 22 104 2021 Total Interest (Note 3) (L. 18 + L. 19) minus L. 20 95,656 2122 Interest Directly Related to Road Property Debt Note 4 3,105 2223 Interest Directly Related to Equipment Debt Note 4 80,961 2324 Interest Not Directly Related to Road or Equipment Property Debt 1/ L. 21 minus (L. 22 + L. 23) 11,590 2425 Interest on Road Property Debt (Note 5) L. 22 plus (L. 24 x L. 13) 3,464 2526 Interest on Equipment Debt (Note 5) L. 23 plus (L. 24 x L. 14) 92,192 2627 Embedded Rate of Debt Capital - Road Property L. 25 divided by L. 16 4.52% 2728 Embedded Rate of Debt Capital - Equipment L. 26 divided by L. 17 3.85% 28
Note 1. Directly related means the purpose which the funds were used when the debt was issued.Note 2. Line 16 plus Line 17 must equal Line 9.Note 3. Line 21 includes interest on debt in Account 769 -- Accounts Payable; Affiliated Companies.Note 4. This interest relates to debt reported on Lines 10 and 11, respectively.Note 5. Line 25 plus Line 26 must equal Line 21.
1/ Allocation of capitalized interest and interest not directly related to road or equipment debt.

INSTRUCTIONS CONCERNING RETURNS TO BE MADE IN SCHEDULE 512
1. Furnish the information called for below between the respondent and the affiliated companies 3. In column (b) indicate the nature of the relationship or control between the respondent and the or persons affiliated with the respondent, including officers, directors, stockholders, owners, company or person identified in column (a) as follows: partners, or their wives and other close relatives, or their agents. Examples of transactions are, but are not restricted to, management, legal, accounting, purchasing, or other types of service (a) If respondent directly controls the affiliate, insert the word "direct." including the furnishing of materials, supplies, purchase of equipment, leasing of structures, land and equipment, and agreements relating to allocation of officers' salaries and other common costs (b) If respondent controls through another company, insert the word "indirect." between affiliated companies.
(c) If respondent is under common control with affiliate, insert the word "common."To be excluded are payments for the following types of services:
(d) If respondent is controlled directly or indirectly by the company listed in column (a), (a) Lawful tariff charges for transportation services. insert the word "controlled."
(b) Payments to or from other carriers for interline services and interchange of equipment. (e) If control is exercised by other means, such as a management contract or other
arrangement of whatever kind, insert the word "other" and provide a footnote to describe (c) Payment to or from other carriers which may reasonably be regarded as ordinarily such arrangements.connected with routine operation or maintenance, but any special or unusual transactions
should be reported. 4. In column (c), fully describe the transactions involved such as management fees, lease of building, purchase of material, etc. When the affiliate listed in column (a) provides more than one
(d) Payments to public utility companies for rates or charges fixed in conformity with type of service in column (c), list each type of service separately and show the total for the
government authority. affiliate. When services are both provided and received between respondent and an affiliate they should be listed separately and the amounts shown separately in column (e).
2. In column (a) enter the name of the affiliated company, person, or agent with which respondent
received or provided services aggregating $50,000 or more during the year. If an affiliated 5. In column (d), report the dollar amounts of transactions shown and the effect of any change company provides services to more than one affiliate, and the aggregate compensation amounts in the method of establishing the terms from that used in the preceding period. to $50,000 or more for the year, list all the affiliates included in the agreement and describe the allocation of charges. If the respondent provides services to more than one affiliate, and the 6. In column (e), report the dollar amounts due from or to related parties and, if not otherwise aggregate compensation amounts to $50,000 or more for the year, reference to this fact should apparent, the terms and manner of settlement. Insert (P) for paid or (R) for received by the be made and the detail as to the allocation of charges should be stated. For those affiliates amount in column (e). providing services to the respondent, also enter in column (a) the percent of affiliate's gross income derived from transactions with respondent.
The respondent may be required to furnish as an attachment to Schedule 512 a balance sheet
and income statement for each affiliate with which respondent carrier had reportable
transactions during the year, or alternatively, attach a "Pro Forma" balance sheet and income
statement for that portion or entity of each affiliate which furnished the agreed to services,
equipment, or other reportable transaction. The statements, if required, should be prepared
on a calendar year basis in conformity with the prescribed schedules for the balance sheet and income statement in this Annual Report Form R-1, and should be noted (1) to indicate the method used for depreciating equipment or other property furnished to the carrier, and (2) whether the affiliate's Federal income tax return for the year was filed on a consolidated basis with the
respondent carrier.
60
Railroad Annual R
eport R-1
Road Initials: U
PRR
Year: 2017

512. Transactions Between Respondent and Companies or Persons Affiliated with Respondent for Services Received or Provided(Dollars in Thousands)
Name of company or related Amount dueLine party with percent Nature of Description of Dollar amounts from or to LineNo. of gross income % relationship transactions of transactions related parties No.
(a) (b) (c) (d) (e)1 Union Pacific Corporation - net Controlled Various (see below) (2,717,274) (10,393,915) (R) 12 Wasatch Insurance Ltd. Common Insurance 36,445 23 Transcontinental Surety 34 of Vermont Common Insurance 40,175 45 56 67 78 89 9
10 1011 1112 1213 1314 1415 1516 1617 1718 1819 1920 2021 2122 2223 2324 2425 25
Balance 12-31-16 (7,676,641)$ Interest Expense/Income- Net (261,306)Dividends 1,981,000Financing & Other (4,436,968)Balance 12-31-17 (10,393,915)$
Road Initials: U
PRR
Year: 201761
Railroad Annual R
eport R-1
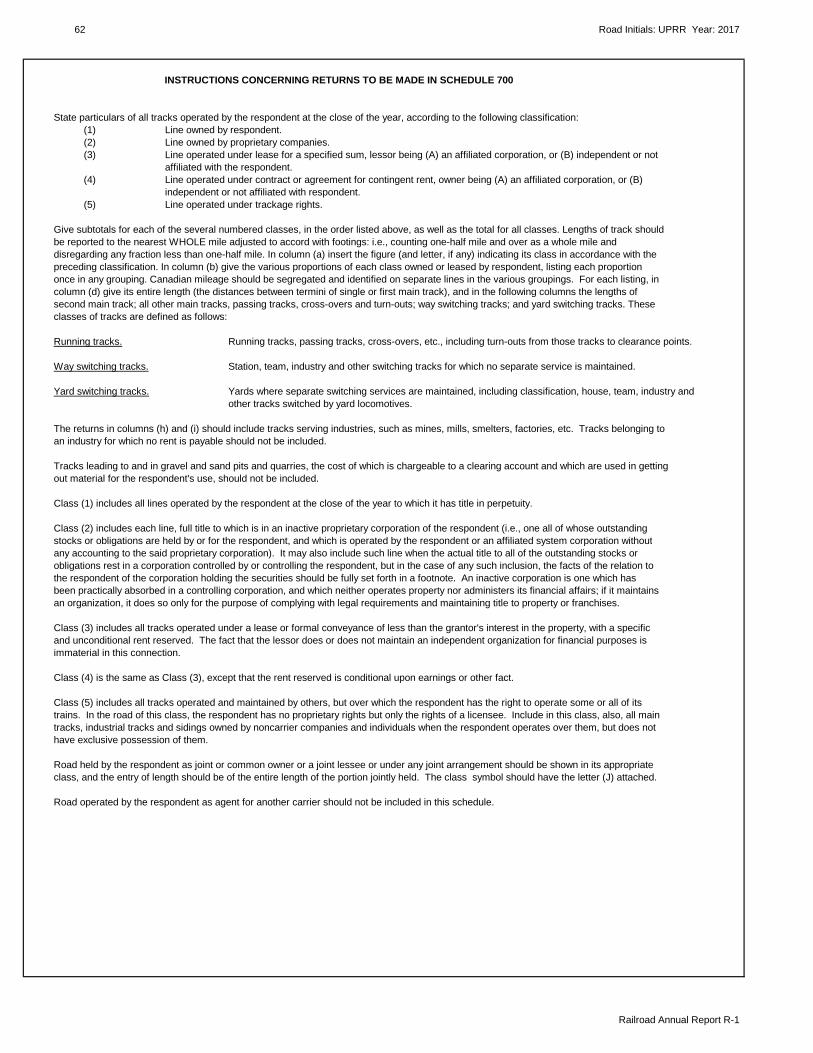
62 Road Initials: UPRR Year: 2017
Railroad Annual Report R-1
INSTRUCTIONS CONCERNING RETURNS TO BE MADE IN SCHEDULE 700
State particulars of all tracks operated by the respondent at the close of the year, according to the following classification:(1) Line owned by respondent.(2) Line owned by proprietary companies.(3) Line operated under lease for a specified sum, lessor being (A) an affiliated corporation, or (B) independent or not
affiliated with the respondent. (4) Line operated under contract or agreement for contingent rent, owner being (A) an affiliated corporation, or (B)
independent or not affiliated with respondent. (5) Line operated under trackage rights.
Give subtotals for each of the several numbered classes, in the order listed above, as well as the total for all classes. Lengths of track shouldbe reported to the nearest WHOLE mile adjusted to accord with footings: i.e., counting one-half mile and over as a whole mile anddisregarding any fraction less than one-half mile. In column (a) insert the figure (and letter, if any) indicating its class in accordance with thepreceding classification. In column (b) give the various proportions of each class owned or leased by respondent, listing each proportiononce in any grouping. Canadian mileage should be segregated and identified on separate lines in the various groupings. For each listing, incolumn (d) give its entire length (the distances between termini of single or first main track), and in the following columns the lengths ofsecond main track; all other main tracks, passing tracks, cross-overs and turn-outs; way switching tracks; and yard switching tracks. Theseclasses of tracks are defined as follows:
Running tracks. Running tracks, passing tracks, cross-overs, etc., including turn-outs from those tracks to clearance points.
Way switching tracks. Station, team, industry and other switching tracks for which no separate service is maintained.
Yard switching tracks. Yards where separate switching services are maintained, including classification, house, team, industry andother tracks switched by yard locomotives.
The returns in columns (h) and (i) should include tracks serving industries, such as mines, mills, smelters, factories, etc. Tracks belonging toan industry for which no rent is payable should not be included.
Tracks leading to and in gravel and sand pits and quarries, the cost of which is chargeable to a clearing account and which are used in gettingout material for the respondent's use, should not be included.
Class (1) includes all lines operated by the respondent at the close of the year to which it has title in perpetuity.
Class (2) includes each line, full title to which is in an inactive proprietary corporation of the respondent (i.e., one all of whose outstandingstocks or obligations are held by or for the respondent, and which is operated by the respondent or an affiliated system corporation withoutany accounting to the said proprietary corporation). It may also include such line when the actual title to all of the outstanding stocks orobligations rest in a corporation controlled by or controlling the respondent, but in the case of any such inclusion, the facts of the relation tothe respondent of the corporation holding the securities should be fully set forth in a footnote. An inactive corporation is one which hasbeen practically absorbed in a controlling corporation, and which neither operates property nor administers its financial affairs; if it maintainsan organization, it does so only for the purpose of complying with legal requirements and maintaining title to property or franchises.
Class (3) includes all tracks operated under a lease or formal conveyance of less than the grantor's interest in the property, with a specificand unconditional rent reserved. The fact that the lessor does or does not maintain an independent organization for financial purposes isimmaterial in this connection.
Class (4) is the same as Class (3), except that the rent reserved is conditional upon earnings or other fact.
Class (5) includes all tracks operated and maintained by others, but over which the respondent has the right to operate some or all of itstrains. In the road of this class, the respondent has no proprietary rights but only the rights of a licensee. Include in this class, also, all maintracks, industrial tracks and sidings owned by noncarrier companies and individuals when the respondent operates over them, but does nothave exclusive possession of them.
Road held by the respondent as joint or common owner or a joint lessee or under any joint arrangement should be shown in its appropriateclass, and the entry of length should be of the entire length of the portion jointly held. The class symbol should have the letter (J) attached.
Road operated by the respondent as agent for another carrier should not be included in this schedule.

Road Initials: UPRR Year: 2017 63
Railroad Annual Report R-1
700. MILEAGE OPERATED AT CLOSE OF YEAR
Running tracks, passing tracks, cross-overs, etc.Miles of
Miles of Miles of passing tracks Miles of way Miles of yardLine Proportion owned second main all other cross-overs, switching switching LineNo. Class or leased by Respondent Miles of road track main tracks and turnouts tracks tracks Total No.
(a) (b) (c) (d) (e) (f) (g) (h) (i)1 1 100% 25,397 4,451 361 3,045 1,756 6,670 41,680 12 23 1J 12.5% - - - - - - - 34 1J 23.0% - - - - - - - 45 1J 25.0% 14 - - 1 4 49 68 56 1J 33.3% 8 1 1 - 7 9 26 67 1J 37.5% - - - - - - - 78 1J 40.0% - - - - - - - 89 1J 44.0% - - - - - - - 9
10 1J 50.0% 604 240 124 78 31 171 1,248 1011 1J 62.5% - - - - - - - 1112 1J 66.7% - - - - - - - 1213 Total 1J 626 241 125 79 42 229 1,342 1314 1415 Total 1 and 1J 26,023 4,692 486 3,124 1,798 6,899 43,022 1516 1617 2 A&S 19 12 - 3 - 103 137 1718 2 - - - - - - - 1819 Total 2 19 12 - 3 - 103 137 1920 2021 3A - - - - - - - 2122 3B 317 - - 17 14 50 398 2223 Total 3 317 - - 17 14 50 398 2324 2425 2526 2627 4B - - - - - - - 2728 Total 4 - - - - - - - 2829 2930 3031 3132 5 5,763 1,681 236 111 46 289 8,126 3233 5J - - - - - - - 3334 Total 5 5,763 1,681 236 111 46 289 8,126 3435 3536 3637 3738 3839 3940 4041 4142 4243 4344 4445 4546 4647 4748 4849 4950 5051 5152 5253 5354 5455 5556 5657 TOTAL 32,122 6,385 722 3,255 1,858 7,341 51,683 57
Miles of electrified roador track included in
58 preceding grand total N/A 58

702. MILES OF ROAD AT CLOSE OF YEAR - BY STATES AND TERRITORIES (SINGLE TRACK)
Give particulars, as of the close of the year, of all road operated and of all owned but not operated. The respondent's proportion of operated road held by it as joint or commonowner, or under a joint lease, or under any joint arrangement, should be shown in columns (b), (c), (d), or (e), as may be appropriate. The remainder of jointly operated mileageshould be shown in column (f). Respondent's proportion of road jointly owned but not operated should be shown in column (h), as may be appropriate. Mileage which has beenpermanently abandoned should not be included in column (h).
Mileage should be reported to the nearest WHOLE mile adjusted to accord with footings, i.e., counting one-half mile and over as a whole mile and disregarding any fraction less thanone-half mile.
Line operated Line operated Line owned, New lineLine Cross Line of proprie- Line operated under contract, under trackage Total mileage not operated constructed LineNo. Check State or Territory Line owned tary companies under lease etc. rights operated by respondent during year No.
(a) (b) (c) (d) (e) (f) (g) (h) (i)1 Arizona 691 - - - - 691 0 - 12 Arkansas 1,316 - 6 - 5 1,327 149 - 23 California 2,750 - - - 541 3,291 674 - 34 Colorado 1,152 - - - 354 1,506 172 - 45 Idaho 843 - - - 4 847 43 - 56 Illinois 1,542 19 4 - 744 2,309 11 - 67 Indiana - - - - 19 19 - - 78 Iowa 1,288 - - - 95 1,383 6 - 89 Kansas 1,563 - - - 635 2,198 313 - 9
10 Kentucky - - - - 12 12 - - 1011 Louisiana 1,086 - - - 56 1,142 31 - 1112 Minnesota 418 - - - 226 644 16 - 1213 Missouri 973 - - - 568 1,541 360 - 1314 Montana 125 - - - - 125 52 - 1415 Nebraska 976 - - - 91 1,067 254 - 1516 Nevada 1,193 - - - - 1,193 - - 1617 New Mexico 535 - - - 83 618 - - 1718 Oklahoma 513 - 307 - 412 1,232 73 - 1819 Oregon 868 - - - 205 1,073 396 - 1920 Tennessee 9 - - - 3 12 - - 2021 Texas 5,192 - - - 1,115 6,307 288 - 2122 Utah 1,248 - - - - 1,248 60 - 2223 Washington 273 - - - 260 533 86 - 2324 Wisconsin 595 - - - 335 930 107 - 2425 Wyoming 874 - - - - 874 - - 2526 2627 2728 2829 2930 3031 TOTAL MILEAGE 26,023 19 317 - 5,763 32,122 3,091 - 3132 (single track) 32
Road Initials: U
PRR
Year: 2017
Railroad Annual R
eport R-1
64

INSTRUCTIONS CONCERNING RETURNS TO BE MADE IN SCHEDULE 710
Instructions for reporting locomotive and passenger-train car data.
1. Give particulars of each of the various classes of equipment which respondent owned or leased 7. Column (k) should show aggregate capacity for all units reported in column (j), as follows: during the year. For locomotive units, report the manufacturer's rated horsepower (the maximum continuous
power output from the diesel engines or engines delivered to the main generator or generators2. In column (c), give the number of units purchased new or built in company shops. In column (d), for tractive purposes). Exclude capacity data for steam locomotives. For passenger-train cars, give the number of new units leased from others. The term "new" means a unit placed in service report the number of passenger seats available for revenue service, counting one passenger to for the first time on any railroad. each berth in sleeping cars.
3. Units leased to others for a period of one year or more are reportable in column (l). Units 8. Passenger-train car types and service equipment car types correspond to AAR Mechanical temporarily out of respondent's service and rented to others for less than one year are to be Division designations. Descriptions of car codes and designations are published in The included in column (h). Units rented from others for a period less than one year should not be Official Railway Equipment Register. included in column (i).
9. Cross-checks4. For reporting purposes, a "locomotive unit" is a self-propelled vehicle generating or converting energy into motion, and designed solely for moving other equipment. An "A" unit is the least Schedule 710 Schedule 710 number of wheel bases with superstructure designed for use singly or as a lead locomotive unit in combination with other locomotive units. A "B" unit is similar to an "A" unit but it is not equipped Line 5, column (j) = Line 11, column (l) for use singly or as a lead locomotive unit. A "B" unit may be equipped with hostler controls for Line 6, column (j) = Line 12, column (l) independent operation at terminals. Line 7, column (j) = Line 13, column (l)
Line 8, column (j) = Line 14, column (l)5. A "self-propelled" car is a rail motor car propelled by electric motors receiving power from a Line 9, column (j) = Line 15, column (l) third rail or overhead, or internal combustion engines located on the car itself. Trailers equipped Line 10, column (j) = Line 16, column (l) for use only in trains of cars that are self-propelled are to be included as self-propelled equipment.
When data appear in column (j), lines 1 through 8, column (k) should have data on the same lines.6. A "diesel" unit includes all units propelled by diesel internal combustion engines regardless of final drive or whether power may at times be supplied from an external conductor. Units other than When data appear in columns (k) or (l), lines 36 through 53, and 55, column (m) should have diesel-electric, e.g., diesel-hydraulic, should be identified in a footnote, giving the number and a data on the same lines. brief description.. An "electric" unit includes all units which receive electric power from a third rail or overhead contact wire, and use the power to drive one or more electric motors that propel the vehicle. An "other self-powered unit" includes all units other than diesel or electric, e.g., gas turbine, steam. Show the type of unit, service, and number, as appropriate, in a brief description sufficient for positive identification. An "Auxiliary unit" includes all units used in conjunction with locomotives, but which draw their power from the "mother" unit, e.g., boosters, slugs, etc. For reporting purposes, indicate radio-controlled self-powered diesel units on lines 1 through 8, as appropriate. Radio-controlled units that are not self-propelled, i.e., those without a diesel, should be reported on line 13 under "auxiliary units."
Railroad Annual R
eport R-1
Road Initials: U
PRR
Year: 2017 65

710. INVENTORY OF EQUIPMENT - Continued
UNITS OWNED, INCLUDED IN INVESTMENT ACCOUNT, AND LEASED FROM OTHERS
Changes During the Year Units installed Units at Close of Year
All other units Units retiredincluding from service
Rebuilt units reclassification of respondent AggregateUnits in acquired and and second whether capacity of
service of New units rebuilt units hand units owned or Total in unitsrespondent New units leased rewritten purchased or leased Owned Leased service of reported
Line Cross at beginning purchased from into property or leased from including and from respondent in col. (j) Leased LineNo. Check Type of design of units of year or built others accounts others reclassification used others [col. (h)&(i)] (see ins. 7) to others No.
(a) (b) (c) (d) (e) (f) (g) (h) (i) (j) (k) (l)
LOCOMOTIVE UNITS (H.P.)1 Diesel-freight units 12 Diesel-passenger units 61 0 0 0 0 0 4 57 61 195,000 0 23 Diesel-multiple purpose units 8,205 66 0 218 0 245 6,392 1,852 8,244 31,987,935 0 34 Diesel-switching units 226 0 0 2 0 3 213 12 225 306,600 0 45 * TOTAL (lines 1 to 4) units 8,492 66 0 220 0 248 6,609 1,921 8,530 32,489,535 0 56 * Electric-locomotives 0 0 0 0 0 0 0 0 0 0 0 67 * Other self-powered units (steam) 3 0 0 0 0 0 3 0 3 6,000 0 78 * TOTAL (lines 5, 6 and 7) 8,495 66 0 220 0 248 6,612 1,921 8,533 32,495,535 0 89 * Auxiliary units 44 0 0 0 0 4 40 0 40 N/A 0 9
TOTAL LOCOMOTIVE UNITS10 * (lines 8 and 9) 8,539 66 0 220 0 252 6,652 1,921 8,573 32,495,535 0 10
DISTRIBUTION OF LOCOMOTIVE UNITS IN SERVICE OF RESPONDENT AT CLOSE OF YEAR BUILT, DISREGARDING YEAR OF REBUILDING
During Calendar YearBetween Between Between Between
Jan. 1, 1995 Jan. 1, 2000 Jan. 1, 2005 Jan. 1, 2010Line Cross Before and and and and Line No. Check Type of design of units Jan. 1, 1995 Dec. 31, 1999 Dec. 31, 2004 Dec. 31, 2009 Dec. 31, 2014 2015 2016 2017 2018 2019 TOTAL No.
(a) (b) (c) (d) (e) (f) (g) (h) (i) (j) (k) (l)11 * Diesel 2,850 1,171 2,093 1,271 734 164 213 34 N/A N/A 8,530 1112 * Electric 0 0 0 0 0 0 0 0 N/A N/A 0 1213 * Other self-powered units (steam) 3 0 0 0 0 0 0 0 N/A N/A 3 1314 * TOTAL (lines 11 to 13) 2,853 1,171 2,093 1,271 734 164 213 34 0 0 8,533 1415 * Auxiliary units 37 3 0 0 0 0 0 0 N/A N/A 40 15
* TOTAL LOCOMOTIVE UNITS16 * (lines 14 and 15) 2,890 1,174 2,093 1,271 734 164 16
Road Initials: U
PRR
Year: 2017 66
8,573 Railroad Annual R
eport R-1
213 34 0 0
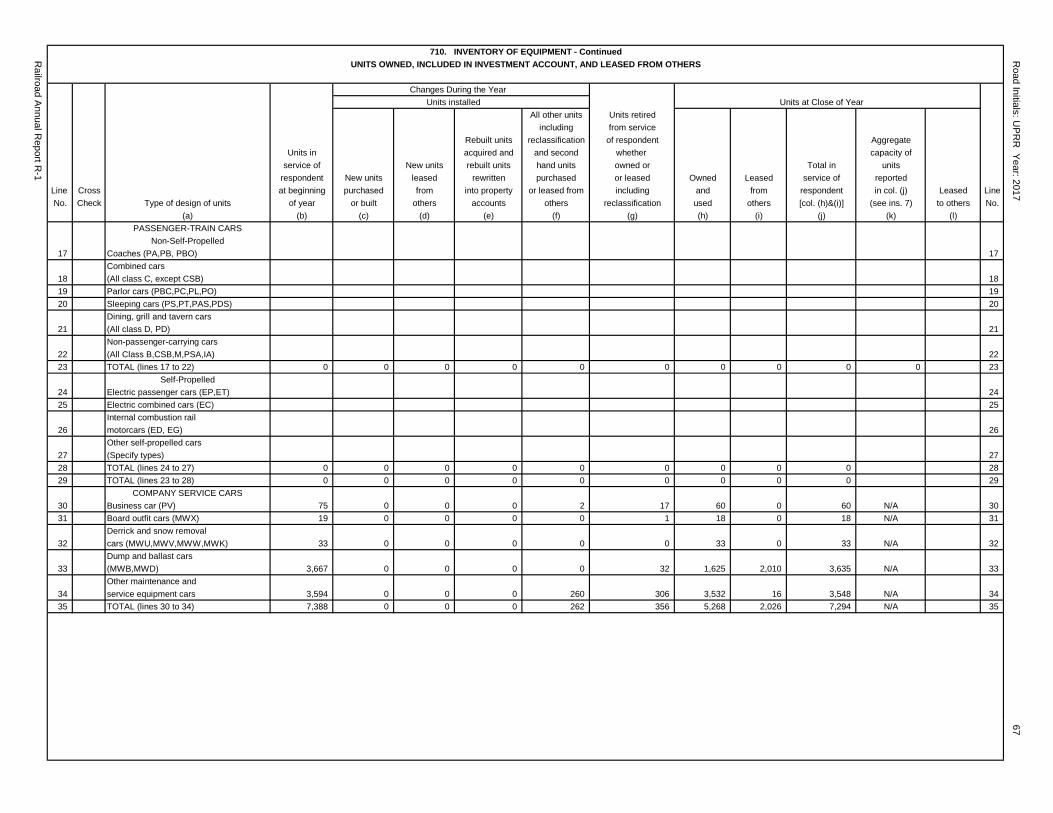
710. INVENTORY OF EQUIPMENT - ContinuedUNITS OWNED, INCLUDED IN INVESTMENT ACCOUNT, AND LEASED FROM OTHERS
Changes During the Year Units installed Units at Close of Year
All other units Units retiredincluding from service
Rebuilt units reclassification of respondent AggregateUnits in acquired and and second whether capacity of
service of New units rebuilt units hand units owned or Total in unitsrespondent New units leased rewritten purchased or leased Owned Leased service of reported
Line Cross at beginning purchased from into property or leased from including and from respondent in col. (j) Leased LineNo. Check Type of design of units of year or built others accounts others reclassification used others [col. (h)&(i)] (see ins. 7) to others No.
(a) (b) (c) (d) (e) (f) (g) (h) (i) (j) (k) (l)PASSENGER-TRAIN CARS
Non-Self-Propelled17 Coaches (PA,PB, PBO) 17
Combined cars18 (All class C, except CSB) 1819 Parlor cars (PBC,PC,PL,PO) 1920 Sleeping cars (PS,PT,PAS,PDS) 20
Dining, grill and tavern cars21 (All class D, PD) 21
Non-passenger-carrying cars22 (All Class B,CSB,M,PSA,IA) 2223 TOTAL (lines 17 to 22) 0 0 0 0 0 0 0 0 0 0 23
Self-Propelled24 Electric passenger cars (EP,ET) 2425 Electric combined cars (EC) 25
Internal combustion rail26 motorcars (ED, EG) 26
Other self-propelled cars27 (Specify types) 2728 TOTAL (lines 24 to 27) 0 0 0 0 0 0 0 0 0 2829 TOTAL (lines 23 to 28) 0 0 0 0 0 0 0 0 0 29
COMPANY SERVICE CARS30 Business car (PV) 75 0 0 0 2 17 60 0 60 N/A 3031 Board outfit cars (MWX) 19 0 0 0 0 1 18 0 18 N/A 31
Derrick and snow removal32 cars (MWU,MWV,MWW,MWK) 33 0 0 0 0 0 33 0 33 N/A 32
Dump and ballast cars33 (MWB,MWD) 3,667 0 0 0 0 32 1,625 2,010 3,635 N/A 33
Other maintenance and34 service equipment cars 3,594 0 0 0 260 306 3,532 16 3,548 N/A 3435 TOTAL (lines 30 to 34) 7,388 0 0 0 262 356 5,268 2,026 7,294 N/A 35
Railroad Annual R
eport R-1
Road Initials: U
PRR
Year: 2017 67

68 Road Initials: UPRR Year: 2017
Railroad Annual Report R-1
710. INVENTORY OF EQUIPMENT - Continued
Instructions for reporting freight-train car data.
1. Give particulars of each of the various classes of equipment which respondent owned or leased during the year.
2. In column (d) give the number of units purchased or built in company shops. In column (e) give the number of new units leased from others. The term "new" meansa unit placed in service for the first time on any railroad.
3. Units leased to others for a period of one year or more are reportable in column (n). Units temporarily out of respondent's service and rented to others for less thanone year are to be included in column (i). Units rented from others for a period less than one year should not be included in column (j).
UNITS OWNED, INCLUDED IN INVESTMENT ACCOUNT, AND LEASED FROM OTHERSUnits in service of respondent Changes during the year
at beginning of year Units installed All other units
including Rebuilt units reclassification
New or acquired and and secondNew units rebuilt units rebuilt units hand units
Line Cross Class of equipment Time-mileage purchased leased from rewritten into purchased or LineNo. Check and car designations cars All others or built others property accounts leased from others No.
(a) (b) (c) (d) (e) (f) (g)FREIGHT TRAIN CARS
Plain box cars - 40' 36 (B1__, B2__) 0 36
Plain box cars - 50' longer (B3_0-7, B4_0-7, B5__, B6__,
37 B7__, B8__) 468 14 37Equipped box cars
38 (All Code A, Except A_5_) 9,279 55 38Plain gondola cars
39 (All Codes, G & J__1,J__2,J__3,J__4) 3,489 87 39Equipped gondola cars
40 (All Code E) 5,296 26 40Covered hopper cars
41 (C__1, C__2, C__3, C__4) 27,118 656 281 1,315 41Open top hopper cars--general service
42 (All Code H) 7,353 70 42Open top hopper cars--special service
43 (J__0,J__5, J__6, J__7, J__8, J__9, and K) 2,454 92 43Refrigerator cars -- mechanical
44 (R_5_, R_6_, R_7_, R_8_, R_9_) 4,674 0 68 44Refrigerator cars -- non-mechanical
45 (R_0_, R_1_, R_2_) 1,468 11 45Flat cars -- TOFC/COFC
46 (All Code P, Q and S, Except Q8__) 169 7 46Flat cars -- multi-level
47 (All Code V) 1,066 2 47Flat cars -- general service
48 (F10_, F20_, F30_) 6 48Flat cars -- other (F_1_, F_2_, F_3_, F_4_, F_5_, F_6)
49 (F_8_, F40_) 2,908 20 49Tank cars -- under 22,000 gallons
50 (T__0, T__1, T__2, T__3, T__4, T__5) 0 50Tank cars -- 22,000 gallons and over
51 (T__6, T__7, T__8, T__9) 183 37 51All other freight cars
52 (A_5_, F_7_, All Code L and Q8__) 0 5253 TOTAL (lines 36 to 52) 65,931 0 656 281 0 1,804 5354 Caboose (All Code M-930) 0 0 0 0 0 0 5455 TOTAL (lines 53 and 54) 65,931 0 656 281 0 1,804 55

Road Initials: UPRR Year: 2017 69
Railroad Annual Report R-1
710. INVENTORY OF EQUIPMENT - Continued
4. Column (m) should show aggregate capacity for all units reported in columns (k) and (l), as follows. For freight-train cars, report the nominal capacity (intons of 2,000 lbs.) as provided for in Rule 86 of the AAR Code of Rules Governing Cars in Interchange. Convert the capacity of tank cars to capacity in tonsof the commodity which the car is intended to carry customarily.
5. Time-mileage cars refers to freight cars, other than cabooses, owned or held under lease arrangement, whose interline rental is settled on a per diem and line haul mileage basis under "Code of Car Hire Rules" or would be so settled if used by another railroad.
UNITS OWNED, INCLUDED IN INVESTMENT ACCOUNT, AND LEASED FROM OTHERSChanges during the year Units at Close of Year
(concluded) Total in service of respondentcol. (i) & (j)
Units retired fromservice respondent Aggregate capacity
whether owned of units reportedLine or leased, including Leased from Time-mileage in cols. (k) & (l) LineNo. reclassification Owned and used others cars All other (see ins. 4) Leased to others No.
(h) (i) (j) (k) (l) (m) (n)
36 0 0 0 0 0 0 0 36
37 0 115 367 482 0 39,297 0 37
38 79 2,842 6,413 9,255 0 760,048 0 38
39 16 1,585 1,975 3,560 0 420,909 0 39
40 312 4,213 797 5,010 0 506,501 0 40
41 2,937 13,804 12,629 26,433 0 2,868,861 0 41
42 482 6,431 510 6,941 0 745,776 0 42
43 163 466 1,917 2,383 0 277,354 0 43
44 89 1,178 3,475 4,653 0 392,412 0 44
45 46 1,422 11 1,433 0 114,840 0 45
46 0 8 168 176 0 48,379 0 46
47 56 960 52 1,012 0 38,932 0 47
48 1 5 0 5 0 310 0 48
49 265 1,568 1,095 2,663 0 271,161 0 49
50 0 0 0 0 0 0 0 50
51 35 0 185 185 0 18,066 0 51
52 0 0 0 0 0 0 0 5253 4,481 34,597 29,594 64,191 0 6,502,846 0 5354 0 0 0 0 0 0 0 5455 4,481 34,597 29,594 64,191 0 6,502,846 0 55

70 Road Initials: UPRR Year: 2017
Railroad Annual Report R-1
710. INVENTORY OF EQUIPMENT - Continued
UNITS OWNED, INCLUDED IN INVESTMENT ACCOUNT, AND LEASED FROM OTHERSUnits in service of responden Changes during the year
at beginning of year Units installed All other units
including Rebuilt units reclassificationacquired and and second
New units New units rebuilt units hand unitsLine Cross Class of equipment purchased leased from rewritten into purchased or LineNo. Check and car designations Per diem All others or built others property accounts leased from others No.
(a) (b) (c) (d) (e) (f) (g)
FLOATING EQUIPMENTSelf-propelled vessels
56 (Tugboats, car ferries, etc.) 56Non-self-propelled vessels
57 (Car floats, lighters, etc.) 5758 TOTAL (lines 56 and 57) 58
HIGHWAY REVENUE EQUIPMENT59 Chassis Z1__, Z67_, Z68_, Z69_ 45,580 0 1,404 66 5960 Dry van U2__, Z__, Z6_, 1-6 6061 Flat bed U3__, Z3__ 6162 Open bed U4__, Z4__ 6263 Mechanical refrigerator U5__, Z5__ 6364 Bulk hopper U0__, Z0__ 6465 Insulated U7__, Z7__ 6566 Tank Z0__, U6__ (See Note) 66
Other trailer and container (Special67 equipped dry van U9__,Z8__,Z9__) 55,205 0 2,000 0 0 3,654 6770 TOTAL (lines 59 and 69) 100,785 0 3,404 66 0 3,654 70
NOTES AND REMARKS
Note: Line 66 (Tank) must have fitting code "CN" to qualify as a tank otherwise it is a bulk hopper.

Road Initials: UPRR Year: 2017 71
Railroad Annual Report R-1
710. INVENTORY OF EQUIPMENT - Concluded
UNITS OWNED, INCLUDED IN INVESTMENT ACCOUNT, AND LEASED FROM OTHERSChanges during the year Units at Close of Year
(Concluded) Total in service of respondent
[col. (i) & (j)]Units retired from
service of respondent Aggregate capacitywhether owned of units reported
Line Cross or leased, including Leased from in cols. (k) & (l) LineNo. Check reclassification Owned and used others Per diem All other (see ins. 4) Leased to others No.
(h) (i) (j) (k) (l) (m) (n)
56 56
57 57
58 58
59 1,568 23,711 21,771 45,482 1,387,201 5960 6061 6162 6263 6364 6465 6566 66
67 6,877 38,655 15,327 53,982 1,533,089 6770 8,445 62,366 37,098 99,464 2,920,290 70
NOTES AND REMARKS
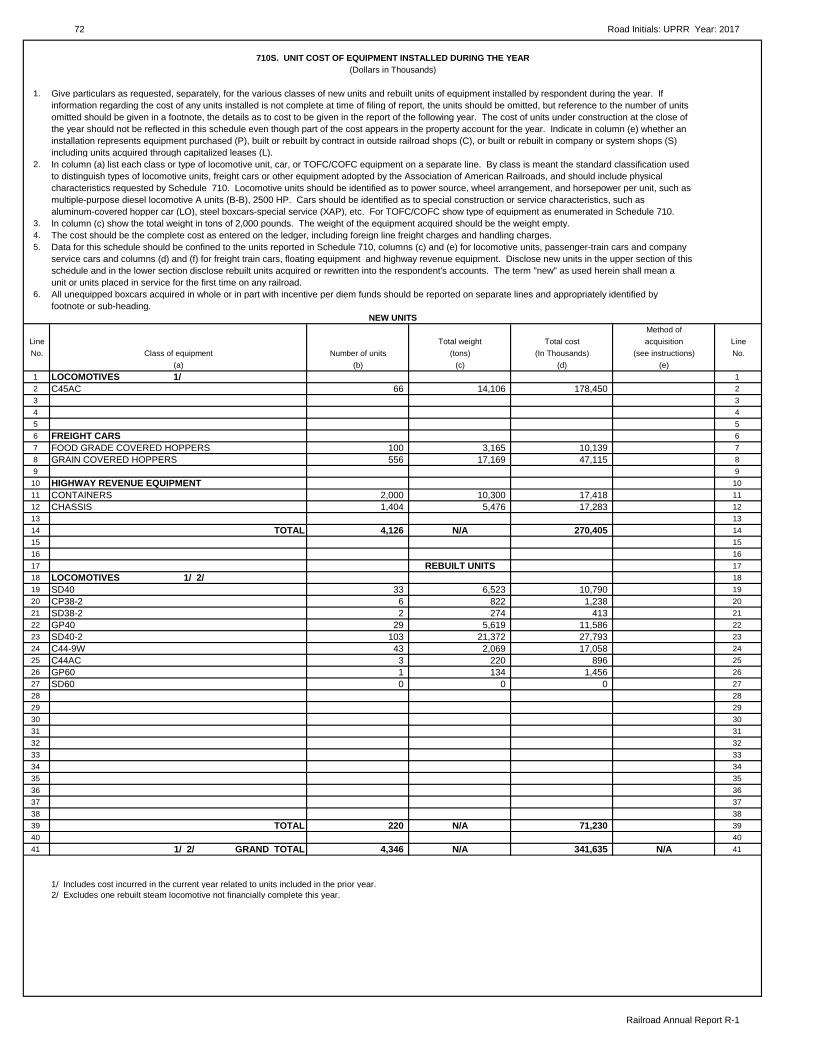
72 Road Initials: UPRR Year: 2017
Railroad Annual Report R-1
710S. UNIT COST OF EQUIPMENT INSTALLED DURING THE YEAR(Dollars in Thousands)
1. Give particulars as requested, separately, for the various classes of new units and rebuilt units of equipment installed by respondent during the year. Ifinformation regarding the cost of any units installed is not complete at time of filing of report, the units should be omitted, but reference to the number of unitsomitted should be given in a footnote, the details as to cost to be given in the report of the following year. The cost of units under construction at the close ofthe year should not be reflected in this schedule even though part of the cost appears in the property account for the year. Indicate in column (e) whether aninstallation represents equipment purchased (P), built or rebuilt by contract in outside railroad shops (C), or built or rebuilt in company or system shops (S)including units acquired through capitalized leases (L).
2. In column (a) list each class or type of locomotive unit, car, or TOFC/COFC equipment on a separate line. By class is meant the standard classification usedto distinguish types of locomotive units, freight cars or other equipment adopted by the Association of American Railroads, and should include physicalcharacteristics requested by Schedule 710. Locomotive units should be identified as to power source, wheel arrangement, and horsepower per unit, such asmultiple-purpose diesel locomotive A units (B-B), 2500 HP. Cars should be identified as to special construction or service characteristics, such asaluminum-covered hopper car (LO), steel boxcars-special service (XAP), etc. For TOFC/COFC show type of equipment as enumerated in Schedule 710.
3. In column (c) show the total weight in tons of 2,000 pounds. The weight of the equipment acquired should be the weight empty.4. The cost should be the complete cost as entered on the ledger, including foreign line freight charges and handling charges.5. Data for this schedule should be confined to the units reported in Schedule 710, columns (c) and (e) for locomotive units, passenger-train cars and company
service cars and columns (d) and (f) for freight train cars, floating equipment and highway revenue equipment. Disclose new units in the upper section of thisschedule and in the lower section disclose rebuilt units acquired or rewritten into the respondent's accounts. The term "new" as used herein shall mean aunit or units placed in service for the first time on any railroad.
6. All unequipped boxcars acquired in whole or in part with incentive per diem funds should be reported on separate lines and appropriately identified byfootnote or sub-heading.
NEW UNITSMethod of
Line Total weight Total cost acquisition LineNo. Class of equipment Number of units (tons) (In Thousands) (see instructions) No.
(a) (b) (c) (d) (e)1 LOCOMOTIVES 1/ 12 C45AC 66 14,106 178,450 23 34 0 0 0 0 45 56 FREIGHT CARS 67 FOOD GRADE COVERED HOPPERS 100 3,165 10,139 78 GRAIN COVERED HOPPERS 556 17,169 47,115 89 9
10 HIGHWAY REVENUE EQUIPMENT 1011 CONTAINERS 2,000 10,300 17,418 1112 CHASSIS 1,404 5,476 17,283 1213 1314 TOTAL 4,126 N/A 270,405 1415 1516 1617 REBUILT UNITS 1718 LOCOMOTIVES 1/ 2/ 1819 SD40 33 6,523 10,790 1920 CP38-2 6 822 1,238 2021 SD38-2 2 274 413 2122 GP40 29 5,619 11,586 2223 SD40-2 103 21,372 27,793 2324 C44-9W 43 2,069 17,058 2425 C44AC 3 220 896 2526 GP60 1 134 1,456 2627 SD60 0 0 0 2728 GP40-2 0 0 0 2829 GP60 0 0 0 2930 MP15AC 0 0 0 3031 SD38-2 0 0 0 3132 SD40 0 0 0 3233 SD40N 2/ 0 0 0 3334 SD60 0 0 0 3435 SD60M 0 0 0 3536 SD62 0 0 0 3637 SD9043AC 0 0 0 3738 3839 TOTAL 220 N/A 71,230 3940 4041 1/ 2/ GRAND TOTAL 4,346 N/A 341,635 N/A 41
1/ Includes cost incurred in the current year related to units included in the prior year. 2/ Excludes one rebuilt steam locomotive not financially complete this year.

GENERAL INSTRUCTIONS CONCERNING RETURNS TO BE MADE IN SCHEDULES 720
1. For purposes of these schedules, the track categories are defined as follows:Track category (1)A - Freight density of 20 million or more gross ton miles per track mile per year (including passing tracks, turnouts and crossovers).
B - Freight density of less than 20 million gross ton miles per track mile per year, but at least 5 million (including passing tracks, turnouts and crossovers).
C - Freight density of less than 5 million gross ton miles per track mile per year, but at least 1 million (including passing tracks, turnouts and crossovers).
D - Freight density of less than 1 million gross ton miles per track mile per year (including passing tracks, turnouts and crossovers).
E - Way and yard switching tracks (passing tracks, turnouts, and crossovers shall be included in category A, B, C, D, F, and Potential abandonments, as appropriate.)
F - Track over which any passenger service is provided (other than potential abandonments). Mileage should be included within track categories A through E unless it is dedicatedentirely to passenger service, category F.
Potential abandonments -- Route segments identified by railroads as potentially subject to abandonment as required by Section 10903 of the ICC Termination Act of 1995.
2. This schedule should include all class 1, 2, 3, or 4 track from Schedule 700 that is maintained by the respondent (class 5 is assumed to be maintained by others). 3. If, for two consecutive years, a line segment classified in one track category maintains a traffic density which would place it in another, it shall be reclassified into that category
as of the beginning of the second year. 4. Traffic density related to passenger service shall not be included in the determination of the track category of a line segment.
720. TRACK AND TRAFFIC CONDITIONS
1. Disclose the requested information pertaining to track and traffic conditions.
Mileage of tracks Average annual traffic density in Average runningLine at end of period millions of gross ton-miles per track-mile* speed limit Track miles under slowNo. Track category (whole numbers) (use two decimal places) (use two decimal places) orders at end of period
(a) (b) (c) (d) (e)1 A 18,161 47.94 N/A 2682 B 7,533 12.64 N/A 2133 C 3,141 2.63 N/A 904 D 5,858 0.22 N/A 195 E 8,864 N/A N/A 26 TOTAL 43,557 22.61 N/A 5927 F 9,871 N/A N/A N/A8 Potential abandonments 44 N/A N/A N/A
* To determine average density, total track miles (route miles times number of tracks), rather than route miles, shall be used.
N/A - Information is not available.
73
Railroad Annual R
eport R-1
Road Initials: U
PRR
Year: 2017
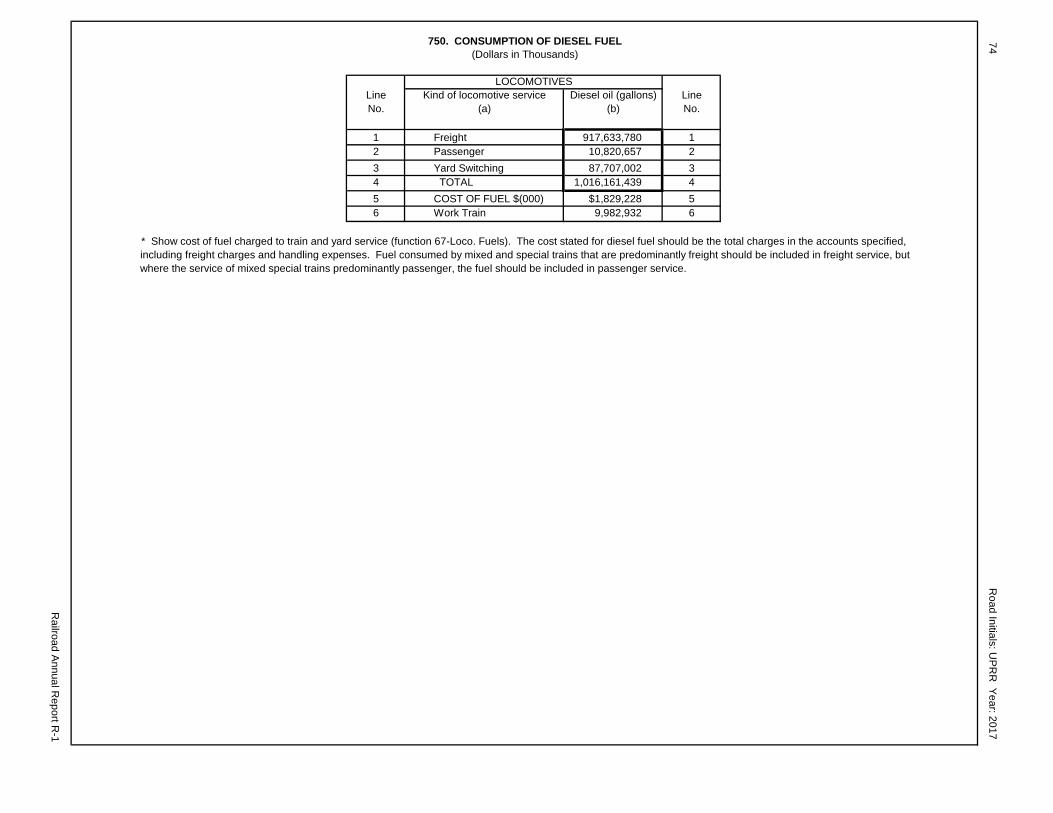
Line Kind of locomotive service Diesel oil (gallons) LineNo. (a) (b) No.
1 Freight 917,633,780 12 Passenger 10,820,657 23 Yard Switching 87,707,002 34 TOTAL 1,016,161,439 45 COST OF FUEL $(000) $1,829,228 56 Work Train 9,982,932 6
including freight charges and handling expenses. Fuel consumed by mixed and special trains that are predominantly freight should be included in freight service, but where the service of mixed special trains predominantly passenger, the fuel should be included in passenger service.
74
Railroad Annual R
eport R-1
Road Initials: U
PRR
Year: 2017750. CONSUMPTION OF DIESEL FUEL
(Dollars in Thousands)
LOCOMOTIVES
* Show cost of fuel charged to train and yard service (function 67-Loco. Fuels). The cost stated for diesel fuel should be the total charges in the accounts specified,
Road Initials: UPRR Year: 2017 75
Railroad Annual Report R-1
NOTES AND REMARKS
(This page intentionally left blank)
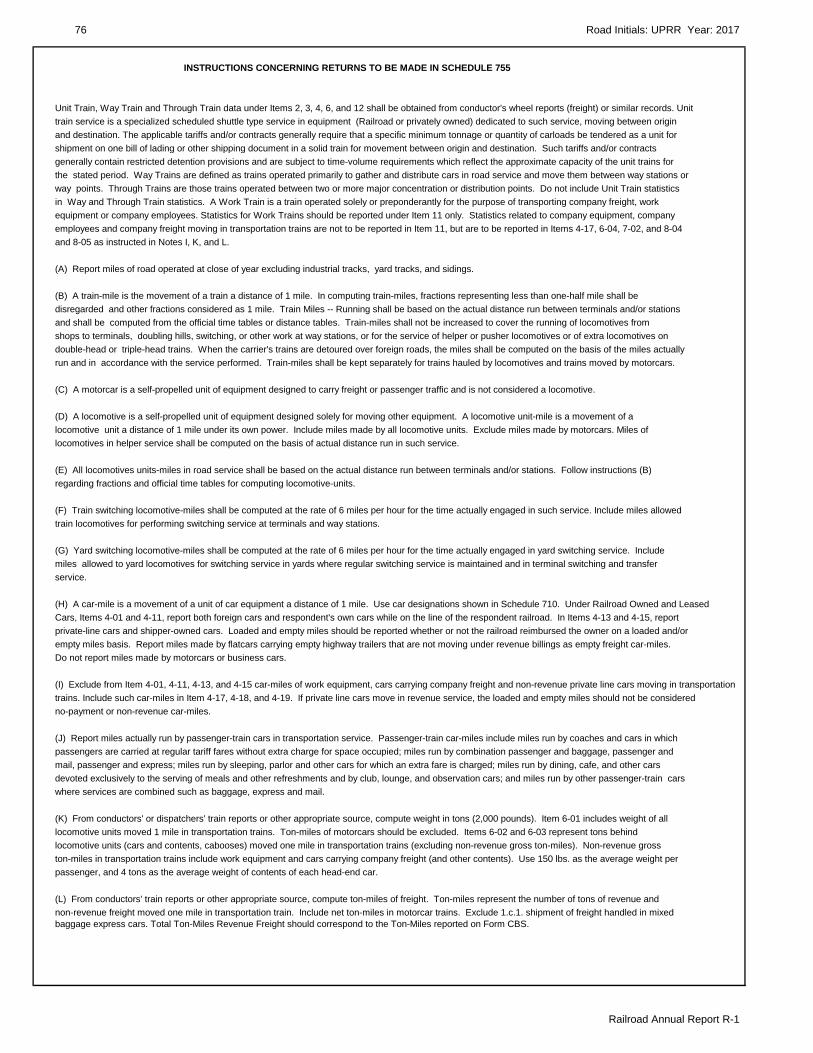
76 Road Initials: UPRR Year: 2017
Railroad Annual Report R-1
INSTRUCTIONS CONCERNING RETURNS TO BE MADE IN SCHEDULE 755
Unit Train, Way Train and Through Train data under Items 2, 3, 4, 6, and 12 shall be obtained from conductor's wheel reports (freight) or similar records. Unittrain service is a specialized scheduled shuttle type service in equipment (Railroad or privately owned) dedicated to such service, moving between origin and destination. The applicable tariffs and/or contracts generally require that a specific minimum tonnage or quantity of carloads be tendered as a unit for shipment on one bill of lading or other shipping document in a solid train for movement between origin and destination. Such tariffs and/or contracts generally contain restricted detention provisions and are subject to time-volume requirements which reflect the approximate capacity of the unit trains forthe stated period. Way Trains are defined as trains operated primarily to gather and distribute cars in road service and move them between way stations orway points. Through Trains are those trains operated between two or more major concentration or distribution points. Do not include Unit Train statisticsin Way and Through Train statistics. A Work Train is a train operated solely or preponderantly for the purpose of transporting company freight, work equipment or company employees. Statistics for Work Trains should be reported under Item 11 only. Statistics related to company equipment, company employees and company freight moving in transportation trains are not to be reported in Item 11, but are to be reported in Items 4-17, 6-04, 7-02, and 8-04and 8-05 as instructed in Notes I, K, and L.
(A) Report miles of road operated at close of year excluding industrial tracks, yard tracks, and sidings.
(B) A train-mile is the movement of a train a distance of 1 mile. In computing train-miles, fractions representing less than one-half mile shall bedisregarded and other fractions considered as 1 mile. Train Miles -- Running shall be based on the actual distance run between terminals and/or stationsand shall be computed from the official time tables or distance tables. Train-miles shall not be increased to cover the running of locomotives fromshops to terminals, doubling hills, switching, or other work at way stations, or for the service of helper or pusher locomotives or of extra locomotives ondouble-head or triple-head trains. When the carrier's trains are detoured over foreign roads, the miles shall be computed on the basis of the miles actuallyrun and in accordance with the service performed. Train-miles shall be kept separately for trains hauled by locomotives and trains moved by motorcars.
(C) A motorcar is a self-propelled unit of equipment designed to carry freight or passenger traffic and is not considered a locomotive.
(D) A locomotive is a self-propelled unit of equipment designed solely for moving other equipment. A locomotive unit-mile is a movement of alocomotive unit a distance of 1 mile under its own power. Include miles made by all locomotive units. Exclude miles made by motorcars. Miles oflocomotives in helper service shall be computed on the basis of actual distance run in such service.
(E) All locomotives units-miles in road service shall be based on the actual distance run between terminals and/or stations. Follow instructions (B)regarding fractions and official time tables for computing locomotive-units.
(F) Train switching locomotive-miles shall be computed at the rate of 6 miles per hour for the time actually engaged in such service. Include miles allowed train locomotives for performing switching service at terminals and way stations.
(G) Yard switching locomotive-miles shall be computed at the rate of 6 miles per hour for the time actually engaged in yard switching service. Includemiles allowed to yard locomotives for switching service in yards where regular switching service is maintained and in terminal switching and transferservice.
(H) A car-mile is a movement of a unit of car equipment a distance of 1 mile. Use car designations shown in Schedule 710. Under Railroad Owned and LeasedCars, Items 4-01 and 4-11, report both foreign cars and respondent's own cars while on the line of the respondent railroad. In Items 4-13 and 4-15, reportprivate-line cars and shipper-owned cars. Loaded and empty miles should be reported whether or not the railroad reimbursed the owner on a loaded and/or empty miles basis. Report miles made by flatcars carrying empty highway trailers that are not moving under revenue billings as empty freight car-miles.Do not report miles made by motorcars or business cars.
(I) Exclude from Item 4-01, 4-11, 4-13, and 4-15 car-miles of work equipment, cars carrying company freight and non-revenue private line cars moving in transportation trains. Include such car-miles in Item 4-17, 4-18, and 4-19. If private line cars move in revenue service, the loaded and empty miles should not be considered no-payment or non-revenue car-miles.
(J) Report miles actually run by passenger-train cars in transportation service. Passenger-train car-miles include miles run by coaches and cars in whichpassengers are carried at regular tariff fares without extra charge for space occupied; miles run by combination passenger and baggage, passenger andmail, passenger and express; miles run by sleeping, parlor and other cars for which an extra fare is charged; miles run by dining, cafe, and other cars devoted exclusively to the serving of meals and other refreshments and by club, lounge, and observation cars; and miles run by other passenger-train carswhere services are combined such as baggage, express and mail.
(K) From conductors' or dispatchers' train reports or other appropriate source, compute weight in tons (2,000 pounds). Item 6-01 includes weight of alllocomotive units moved 1 mile in transportation trains. Ton-miles of motorcars should be excluded. Items 6-02 and 6-03 represent tons behindlocomotive units (cars and contents, cabooses) moved one mile in transportation trains (excluding non-revenue gross ton-miles). Non-revenue grosston-miles in transportation trains include work equipment and cars carrying company freight (and other contents). Use 150 lbs. as the average weight per passenger, and 4 tons as the average weight of contents of each head-end car.
(L) From conductors' train reports or other appropriate source, compute ton-miles of freight. Ton-miles represent the number of tons of revenue andnon-revenue freight moved one mile in transportation train. Include net ton-miles in motorcar trains. Exclude 1.c.1. shipment of freight handled in mixedbaggage express cars. Total Ton-Miles Revenue Freight should correspond to the Ton-Miles reported on Form CBS.

Road Initials: UPRR Year: 2017 77
Railroad Annual Report R-1
INSTRUCTIONS CONCERNING RETURNS TO BE MADE IN SCHEDULE 755 - Concluded
(M) Road service represents elapsed time of transportation trains (both ordinary and light) between the time of leaving the initial terminals and the time atthe final terminals, including trains switching at way stations and delays on road as shown by conductors' or dispatchers' train reports. Include time ofmotorcar service performed by train locomotives at terminals and way stations. Report in Item 9-02 train switching hours included in Item 9-01. Trainswitching is the time spent by the train while performing switching service at terminals and way stations where no regular yard service is maintained. A trainhour is independent of the number of locomotives in the train.
(N) Yard switching hours are hours expended in switching service performed by yard crews in yards where regular switching service is maintained, including switching and transfer service in connection with the transportation of revenue and incidentally of company freight. Hours in yard switching are independent of the number of locomotives used.
(O) Work-train miles inside the miles run by trains engaged in company service such as official inspection; inspection trains for railway Commissioners forwhich no revenue is received; trains running special with fire apparatus to save carrier's property from destruction; trains run for transporting the carrier'semployees to and from work when no transportation charge is made, wrecking trains; trains run solely for the purpose of transporting company material;trains run for distributing material and supplies for use in connection with operations; and all other trains used in work-train services. Exclude miles run bylocomotives while engaged incidentally in switching company materials in company shops or material yards in connection with regular yard switchingservice or in switching equipment for repairs between yards and shops.
(P) The number of loaded freight cars shall be obtained from the conductors' wheel report and shall be the sum of all loaded cars handled by each train.For example, if a car moves loaded (1) in a way train from the origination points, (2) in two through trains, and (3) in a way train to the destination point, thetotal count of loaded cars would be four: two counts for the movements in the way trains and two counts for the movements in through trains. Therefore,each car originated or received from a connecting carrier receives an initial count, plus one count for each subsequent physical transfer between trains onrespondent lines. No additional count is given because of crew change or changes in track identification number unless there is a physical transfer of thecar between trains. Each car moving under revenue billing shall be considered as a loaded car.
(Q) Report vehicle (TOFC trailers/containers, automobiles and trucks) loaded and unloaded to and from TOFC and multiple level freight cars when thework is performed at the railroad's expense.
(R) Report the number of loaded revenue trailers/containers picked up, plus revenue trailers/containers delivered in TOFC/COFC and in highwayinterchange service, when the work is performed at the railroads' expense. (Performed at railroads' expense means that railroad employees perform theservice or that the railroad hires a subsidiary or outside contractor to perform the service.) Do not include those trailers/containers which are picked upor delivered by a shipper or motor carrier, etc., when a tariff provision requires the shipper-motor carrier, etc., and not the railroad to perform that service. Note: The count should reflect the trailers/containers for which expenses is reported in Schedule 417, Line 2, Column (b).
(S) Report under Marine Terminals, Item 16, the tons loaded onto and unloaded from marine vessels at the expense of the reporting railroad.
(T) Report the total number of foreign railroad cars on line at the end of the year (except surplus cars, see below). Foreign railroad cars refer to freightcars owned by other railroads whose interline rental is settled on time (by hour) and actual line-haul mileage charges under the Code of Car Hire Rules.
Carriers will be governed by local conditions in determining whether a car at an interchange point should be considered "on line." Unserviceable carsinclude cars on repair tracks undergoing or awaiting repairs. They include cars on repair tracks repaired and awaiting switching, cars on repair tracksundergoing or awaiting repairs switching, cars awaiting movement to repair tracks held in train yard (excluding cars which are to be repaired in train yardwithout loss of time), car moving empty in trains en route to shop, and cars stored awaiting disposition.
Surplus cars are cars which are in serviceable condition for loading on the last day of the year, but have not been placed for loading within 48 hours. Thiscount can be an annual average based on weekly count of cars that have not been placed for loading within 48 hours.
(U) Flat-ToFC/COFC Car-miles reported in lines 25 (4-020), 41 (4-140), and 75 (4-160) will be computed using cars rather than constructed container platforms.For example, an articulated car consisting of five platforms moved one mile will be counted as on car-mile, not five car-miles.
(V) The intermodal Load Factor reported on Line 134 will be calculated for the average number of intermodal (TOFC/COFC) units loaded on the averageintermodal car. Units are to be calculated in the same manner as Line 123 (13 TOFC/COFC - No. of Revenue Trailers & Containers Loaded and Unloaded(Q)). Intermodal cars will be calculated in accordance with instruction U for reporting Flat-(TOFC/COFC Car-miles. Both intermodal (TOFC/COFC) unitsand intermodal cars are to be calculated using actual units and not constructed intermodal (TOFC/COFC) units or cars.
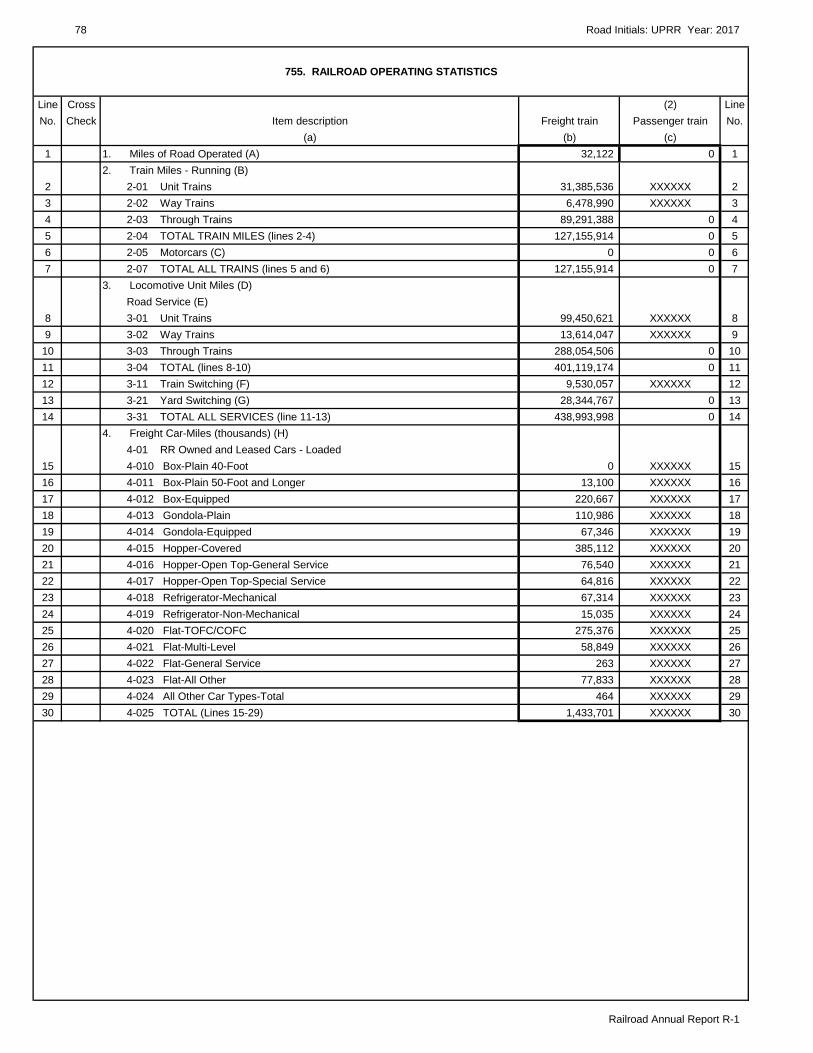
78 Road Initials: UPRR Year: 2017
Railroad Annual Report R-1
755. RAILROAD OPERATING STATISTICS
Line Cross (2) LineNo. Check Item description Freight train Passenger train No.
(a) (b) (c)1 1. Miles of Road Operated (A) 32,122 0 1
2. Train Miles - Running (B)2 2-01 Unit Trains 31,385,536 XXXXXX 23 2-02 Way Trains 6,478,990 XXXXXX 34 2-03 Through Trains 89,291,388 0 45 2-04 TOTAL TRAIN MILES (lines 2-4) 127,155,914 0 56 2-05 Motorcars (C) 0 0 67 2-07 TOTAL ALL TRAINS (lines 5 and 6) 127,155,914 0 7
3. Locomotive Unit Miles (D) Road Service (E)
8 3-01 Unit Trains 99,450,621 XXXXXX 89 3-02 Way Trains 13,614,047 XXXXXX 9
10 3-03 Through Trains 288,054,506 0 1011 3-04 TOTAL (lines 8-10) 401,119,174 0 1112 3-11 Train Switching (F) 9,530,057 XXXXXX 1213 3-21 Yard Switching (G) 28,344,767 0 1314 3-31 TOTAL ALL SERVICES (line 11-13) 438,993,998 0 14
4. Freight Car-Miles (thousands) (H) 4-01 RR Owned and Leased Cars - Loaded
15 4-010 Box-Plain 40-Foot 0 XXXXXX 1516 4-011 Box-Plain 50-Foot and Longer 13,100 XXXXXX 1617 4-012 Box-Equipped 220,667 XXXXXX 1718 4-013 Gondola-Plain 110,986 XXXXXX 1819 4-014 Gondola-Equipped 67,346 XXXXXX 1920 4-015 Hopper-Covered 385,112 XXXXXX 2021 4-016 Hopper-Open Top-General Service 76,540 XXXXXX 2122 4-017 Hopper-Open Top-Special Service 64,816 XXXXXX 2223 4-018 Refrigerator-Mechanical 67,314 XXXXXX 2324 4-019 Refrigerator-Non-Mechanical 15,035 XXXXXX 2425 4-020 Flat-TOFC/COFC 275,376 XXXXXX 2526 4-021 Flat-Multi-Level 58,849 XXXXXX 2627 4-022 Flat-General Service 263 XXXXXX 2728 4-023 Flat-All Other 77,833 XXXXXX 2829 4-024 All Other Car Types-Total 464 XXXXXX 2930 4-025 TOTAL (Lines 15-29) 1,433,701 XXXXXX 30
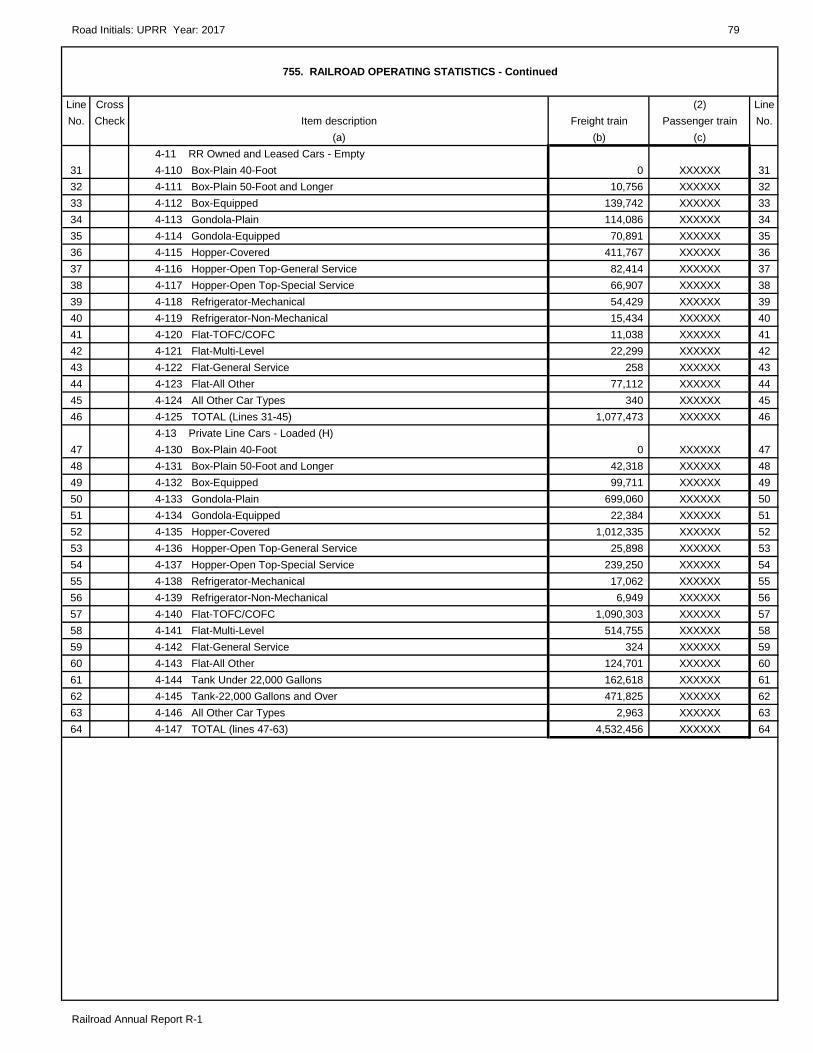
Road Initials: UPRR Year: 2017 79
Railroad Annual Report R-1
755. RAILROAD OPERATING STATISTICS - Continued
Line Cross (2) LineNo. Check Item description Freight train Passenger train No.
(a) (b) (c) 4-11 RR Owned and Leased Cars - Empty
31 4-110 Box-Plain 40-Foot 0 XXXXXX 3132 4-111 Box-Plain 50-Foot and Longer 10,756 XXXXXX 3233 4-112 Box-Equipped 139,742 XXXXXX 3334 4-113 Gondola-Plain 114,086 XXXXXX 3435 4-114 Gondola-Equipped 70,891 XXXXXX 3536 4-115 Hopper-Covered 411,767 XXXXXX 3637 4-116 Hopper-Open Top-General Service 82,414 XXXXXX 3738 4-117 Hopper-Open Top-Special Service 66,907 XXXXXX 3839 4-118 Refrigerator-Mechanical 54,429 XXXXXX 3940 4-119 Refrigerator-Non-Mechanical 15,434 XXXXXX 4041 4-120 Flat-TOFC/COFC 11,038 XXXXXX 4142 4-121 Flat-Multi-Level 22,299 XXXXXX 4243 4-122 Flat-General Service 258 XXXXXX 4344 4-123 Flat-All Other 77,112 XXXXXX 4445 4-124 All Other Car Types 340 XXXXXX 4546 4-125 TOTAL (Lines 31-45) 1,077,473 XXXXXX 46
4-13 Private Line Cars - Loaded (H)47 4-130 Box-Plain 40-Foot 0 XXXXXX 4748 4-131 Box-Plain 50-Foot and Longer 42,318 XXXXXX 4849 4-132 Box-Equipped 99,711 XXXXXX 4950 4-133 Gondola-Plain 699,060 XXXXXX 5051 4-134 Gondola-Equipped 22,384 XXXXXX 5152 4-135 Hopper-Covered 1,012,335 XXXXXX 5253 4-136 Hopper-Open Top-General Service 25,898 XXXXXX 5354 4-137 Hopper-Open Top-Special Service 239,250 XXXXXX 5455 4-138 Refrigerator-Mechanical 17,062 XXXXXX 5556 4-139 Refrigerator-Non-Mechanical 6,949 XXXXXX 5657 4-140 Flat-TOFC/COFC 1,090,303 XXXXXX 5758 4-141 Flat-Multi-Level 514,755 XXXXXX 5859 4-142 Flat-General Service 324 XXXXXX 5960 4-143 Flat-All Other 124,701 XXXXXX 6061 4-144 Tank Under 22,000 Gallons 162,618 XXXXXX 6162 4-145 Tank-22,000 Gallons and Over 471,825 XXXXXX 6263 4-146 All Other Car Types 2,963 XXXXXX 6364 4-147 TOTAL (lines 47-63) 4,532,456 XXXXXX 64
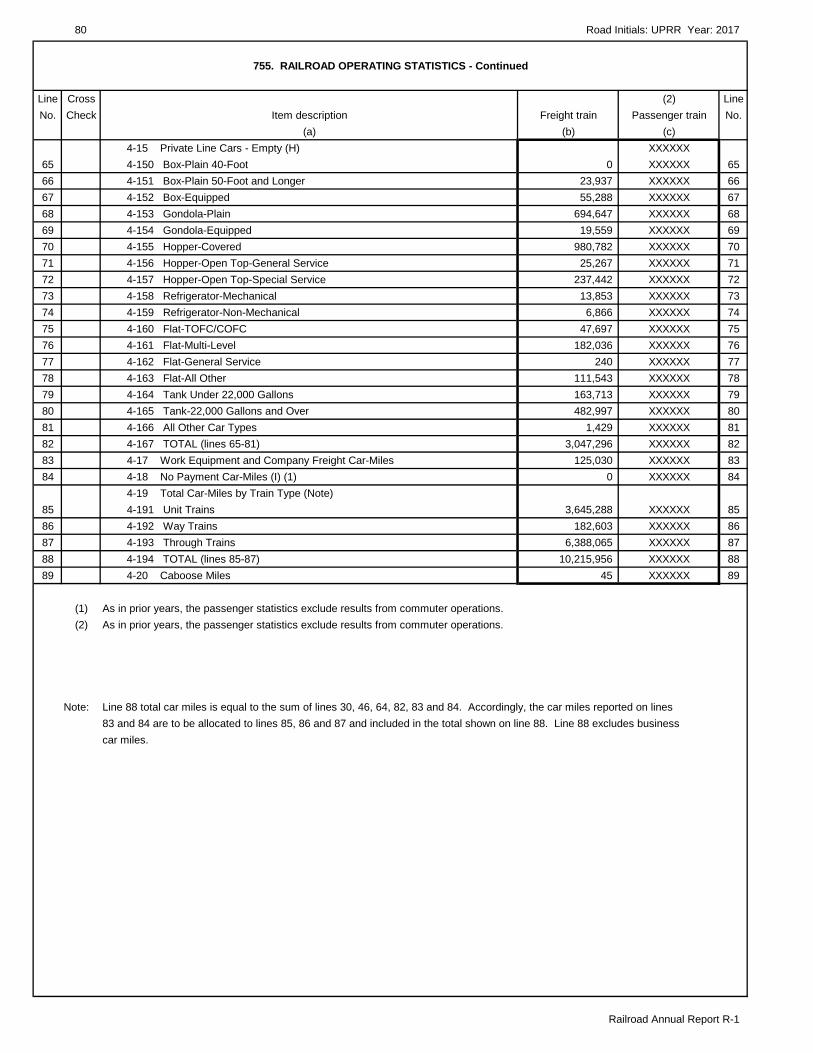
80 Road Initials: UPRR Year: 2017
Railroad Annual Report R-1
755. RAILROAD OPERATING STATISTICS - Continued
Line Cross (2) LineNo. Check Item description Freight train Passenger train No.
(a) (b) (c) 4-15 Private Line Cars - Empty (H) XXXXXX
65 4-150 Box-Plain 40-Foot 0 XXXXXX 6566 4-151 Box-Plain 50-Foot and Longer 23,937 XXXXXX 6667 4-152 Box-Equipped 55,288 XXXXXX 6768 4-153 Gondola-Plain 694,647 XXXXXX 6869 4-154 Gondola-Equipped 19,559 XXXXXX 6970 4-155 Hopper-Covered 980,782 XXXXXX 7071 4-156 Hopper-Open Top-General Service 25,267 XXXXXX 7172 4-157 Hopper-Open Top-Special Service 237,442 XXXXXX 7273 4-158 Refrigerator-Mechanical 13,853 XXXXXX 7374 4-159 Refrigerator-Non-Mechanical 6,866 XXXXXX 7475 4-160 Flat-TOFC/COFC 47,697 XXXXXX 7576 4-161 Flat-Multi-Level 182,036 XXXXXX 7677 4-162 Flat-General Service 240 XXXXXX 7778 4-163 Flat-All Other 111,543 XXXXXX 7879 4-164 Tank Under 22,000 Gallons 163,713 XXXXXX 7980 4-165 Tank-22,000 Gallons and Over 482,997 XXXXXX 8081 4-166 All Other Car Types 1,429 XXXXXX 8182 4-167 TOTAL (lines 65-81) 3,047,296 XXXXXX 8283 4-17 Work Equipment and Company Freight Car-Miles 125,030 XXXXXX 8384 4-18 No Payment Car-Miles (I) (1) 0 XXXXXX 84
4-19 Total Car-Miles by Train Type (Note)85 4-191 Unit Trains 3,645,288 XXXXXX 8586 4-192 Way Trains 182,603 XXXXXX 8687 4-193 Through Trains 6,388,065 XXXXXX 8788 4-194 TOTAL (lines 85-87) 10,215,956 XXXXXX 8889 4-20 Caboose Miles 45 XXXXXX 89
(1) As in prior years, the passenger statistics exclude results from commuter operations.(2) As in prior years, the passenger statistics exclude results from commuter operations.
Note: Line 88 total car miles is equal to the sum of lines 30, 46, 64, 82, 83 and 84. Accordingly, the car miles reported on lines83 and 84 are to be allocated to lines 85, 86 and 87 and included in the total shown on line 88. Line 88 excludes businesscar miles.

Road Initials: UPRR Year: 2017 81
Railroad Annual Report R-1
755. RAILROAD OPERATING STATISTICS - Concluded
Line Cross (2) LineNo. Check Item description Freight train Passenger train No.
(a) (b) (c)6. Gross Ton-Miles (thousands) (K)
98 6-01 Road Locomotives 82,706,200 XXXXXX 98 6-02 Freight Trains, Cars, Cnts., and Caboose
99 6-020 Unit Trains 303,218,815 XXXXXX 99100 6-021 Way Trains 13,875,940 XXXXXX 100101 6-022 Through Trains 571,956,197 XXXXXX 101102 6-03 Passenger-Trains, Cars, and Cnts. 0 0 102103 6-04 Non-Revenue 9,694,778 XXXXXX 103104 6-05 TOTAL (lines 98-103) 981,451,930 0 104
7. Tons of Freight (thousands)105 7-01 Revenue 497,116 XXXXXX 105106 7-02 Non-Revenue 8,925 XXXXXX 106107 7-03 TOTAL (lines 105 and 106) 506,041 XXXXXX 107
8. Ton-Miles of Freight (thousands) (L)108 8-01 Revenue-Road Service 466,721,215 XXXXXX 108109 8-02 Revenue-Lake Transfer Service 0 XXXXXX 109110 8-03 TOTAL (lines 108, 109) 466,721,215 XXXXXX 110111 8-04 Non-Revenue-Road Service 4,570,502 XXXXXX 111112 8-05 Non-Revenue-Lake Transfer Service 0 XXXXXX 112113 8-06 TOTAL (lines 111 and 112) 4,570,502 XXXXXX 113114 8-07 TOTAL-REVENUE AND NON-REVENUE (lines 110 and 113) 471,291,717 XXXXXX 114
9. Train Hours (M)115 9-01 Road Service 5,730,829 XXXXXX 115116 9-02 Train Switching 751,950 XXXXXX 116117 10. TOTAL YARD-SWITCHING HOURS (N) 2,334,444 XXXXXX 117
11. Train-Miles Work Trains (O)118 11-01 Locomotives 1,896,740 XXXXXX 118119 11-02 Motorcars 0 XXXXXX 119
12. Number of Loaded Freight Cars (P)120 12-01 Unit Trains 2,328,038 XXXXXX 120121 12-02 Way Trains 2,662,962 XXXXXX 121122 12-03 Through Trains 7,618,328 XXXXXX 122123 13. TOFC/COFC-No. of Rev. Trailers and Containers Loaded and Unloaded (Q) 6,231,618 XXXXXX 123124 14. Multi-Level Cars-No. of Motor Vehicles Loaded and Unloaded (Q) 3,880,047 XXXXXX 124125 15. TOFC/COFC-No. of Rev. Trailers Picked Up and Delivered (R) 171,509 XXXXXX 125
16. Revenue Tons-Marine Terminal (S)126 16-01 Marine Terminals-Coal 0 XXXXXX 126127 16-02 Marine Terminals-Ore 0 XXXXXX 127128 16-03 Marine Terminals-Other 53,458,869 XXXXXX 128129 16-04 TOTAL (lines 126-128) 53,458,869 XXXXXX 129
17. Number of Foreign Per Diem Cars on Line (T)130 17-01 Serviceable 38,325 XXXXXX 130131 17-02 Unserviceable 0 XXXXXX 131132 17-03 Surplus 0 XXXXXX 132133 17-04 TOTAL (lines 130-132) 38,325 XXXXXX 133134 TOFC/COFC - Average No. of Units Loaded Per Car 4.5 XXXXXX 134

82
PTC Supplement Schedules 330, 332, 335, 352B, 410, 700, 710, 710S, and 720
TO THE
SURFACE TRANSPORTATION BOARD
FOR THE
YEAR ENDED DECEMBER 31, 2017

Road Initials: UPRR Year: 2017 83
PTC Supplement to Railroad Annual Report R-1
PTC 330. ROAD PROPERTY AND EQUIPMENT AND IMPROVEMENTS TO LEASED PROPERTY AND EQUIPMENT(Dollars in Thousands)
Expenditure during the Expenditures during theYear for original road year for purchase of
Line Cross Balance at and equipment and existing lines, lines LineNo. Check Account beginning of year road extensions reorganizations, etc. No.
(a) (b) (c) (d)1 (2) Land for transportation purposes 275 0 0 12 (3) Grading 0 0 0 23 (4) Other, right-of-way expenditures 0 0 0 34 (5) Tunnels and subways 0 0 0 45 (6) Bridges, trestles, and culverts 40 0 0 56 (7) Elevated structures 0 0 0 67 (8) Ties 53 0 0 78 (9) Rail and other track material 31,181 0 0 89 (11) Ballast 167 0 0 9
10 (13) Fences, snowsheds and signs 0 0 0 1011 (16) Station and office buildings 0 0 0 1112 (17) Roadway buildings 0 0 0 1213 (18) Water stations 0 0 0 1314 (19) Fuel stations 0 0 0 1415 (20) Shops and enginehouses 0 0 0 1516 (22) Storage warehouses 0 0 0 1617 (23) Wharves and docks 0 0 0 1718 (24) Coal and ore wharves 0 0 0 1819 (25) TOFC/COFC terminals 0 0 0 1920 (26) Communication systems 273,799 0 0 2021 (27) Signals and interlockers 1,113,372 0 0 2122 (29) Power plants 0 0 0 2223 (31) Power-transmission systems 95,496 0 0 2324 (35) Miscellaneous structures 0 0 0 2425 (37) Roadway machines 0 0 0 2526 (39) Public improvements-construction 0 0 0 2627 (44) Shop machinery 0 0 0 2728 (45) Power-plant machinery 0 0 0 2829 Other lease/rentals 0 0 0 2930 TOTAL EXPENDITURES FOR ROAD 1,514,383 0 0 3031 (52) Locomotives 528,544 0 0 3132 (53) Freight train cars 0 0 0 3233 (54) Passenger train cars 0 0 0 3334 (55) Highway revenue equipment 0 0 0 3435 (56) Floating equipment 0 0 0 3536 (57) Work equipment 2,400 0 0 3637 (58) Miscellaneous equipment 1,029 0 0 3738 (59) Computer systems and word processing equipment 179,043 0 0 3839 TOTAL EXPENDITURES FOR EQUIPMENT 711,016 0 0 3940 (76) Interest during construction 0 0 0 4041 (80) Other elements of investment 0 0 0 4142 (90) Construction work in progress 42,817 0 0 4243 GRAND TOTAL 2,268,216 0 0 43
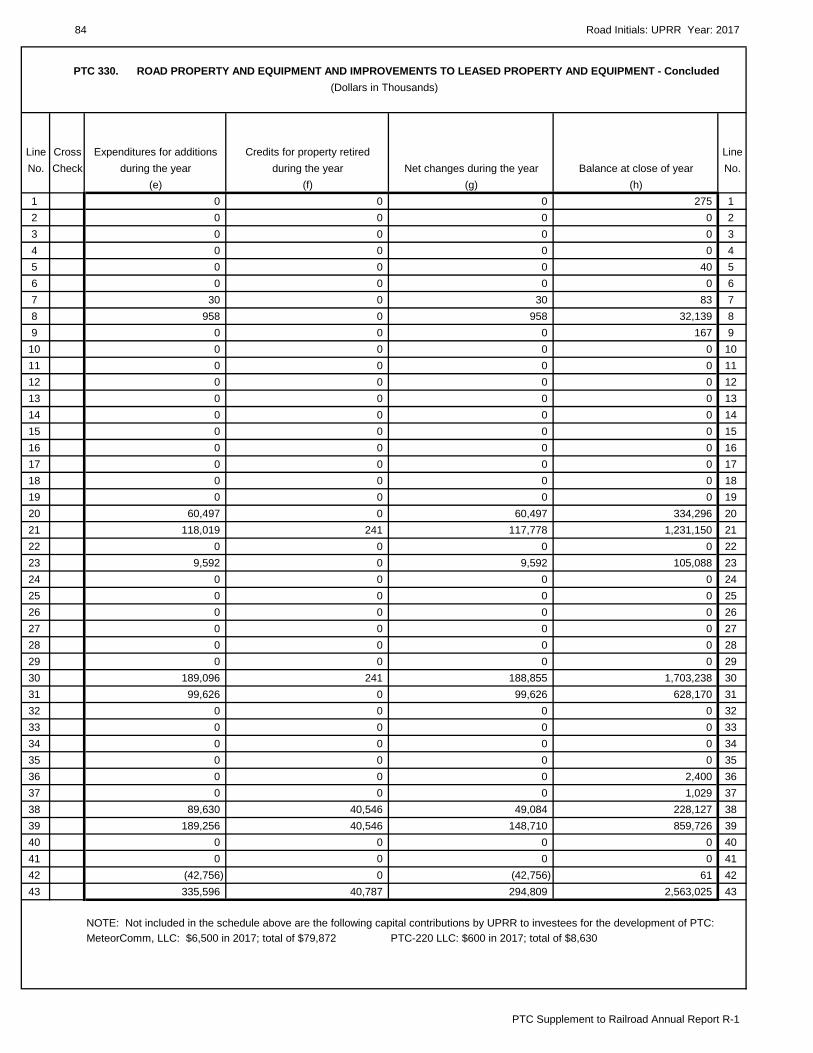
84 Road Initials: UPRR Year: 2017
PTC Supplement to Railroad Annual Report R-1
Line Cross Expenditures for additions Credits for property retired LineNo. Check during the year during the year Net changes during the year Balance at close of year No.
(e) (f) (g) (h)1 0 0 0 275 12 0 0 0 0 23 0 0 0 0 34 0 0 0 0 45 0 0 0 40 56 0 0 0 0 67 30 0 30 83 78 958 0 958 32,139 89 0 0 0 167 9
10 0 0 0 0 1011 0 0 0 0 1112 0 0 0 0 1213 0 0 0 0 1314 0 0 0 0 1415 0 0 0 0 1516 0 0 0 0 1617 0 0 0 0 1718 0 0 0 0 1819 0 0 0 0 1920 60,497 0 60,497 334,296 2021 118,019 241 117,778 1,231,150 2122 0 0 0 0 2223 9,592 0 9,592 105,088 2324 0 0 0 0 2425 0 0 0 0 2526 0 0 0 0 2627 0 0 0 0 2728 0 0 0 0 2829 0 0 0 0 2930 189,096 241 188,855 1,703,238 3031 99,626 0 99,626 628,170 3132 0 0 0 0 3233 0 0 0 0 3334 0 0 0 0 3435 0 0 0 0 3536 0 0 0 2,400 3637 0 0 0 1,029 3738 89,630 40,546 49,084 228,127 3839 189,256 40,546 148,710 859,726 3940 0 0 0 0 4041 0 0 0 0 4142 (42,756) 0 (42,756) 61 4243 335,596 40,787 294,809 2,563,025 43
MeteorComm, LLC: $6,500 in 2017; total of $79,872 PTC-220 LLC: $600 in 2017; total of $8,630
PTC 330. ROAD PROPERTY AND EQUIPMENT AND IMPROVEMENTS TO LEASED PROPERTY AND EQUIPMENT - Concluded(Dollars in Thousands)
NOTE: Not included in the schedule above are the following capital contributions by UPRR to investees for the development of PTC:

Road Initials: UPRR Year: 2017 85
PTC Supplement to Railroad Annual Report R-1
PTC 332. DEPRECIATION BASE AND RATES - ROAD AND EQUIPMENT OWNED AND USED AND LEASED FROM OTHERS(Dollars in Thousands)
1. Show in columns (b) and (e), for each primary account, the depreciation base used to compute depreciation charges for the month of January,and in columns (c) and (f), the depreciation charges for the month of December. In columns (d) and (g) show the composite rates used in computingdepreciation charges for December, and on lines 30 and 39 of these columns show the composite percentage for all road and equipment accounts,respectively, ascertained by applying the primary account composite rates to the depreciation base used in computing the charges for December, anddividing that total by the total depreciation base for the same month. The depreciation base should not include cost of equipment used, but notowned, when the rents are included in rent for equipment and account nos. 31-22-00, 31-23-00, 31-25-00, 31-21-00, 35-21-00, 35-23-00, 35-22-00,and 35-25-00. It should include cost of equipment owned and leased to others when the rents there from are included in the rent for equipment, accounts nos. 32-21-00, 32-22-00, 32-23-00, 32-25-00, 36-21-00, 36-22-00, 36-23-00, and 36-25-00., inclusive. Composite rates used shouldbe those prescribed or authorized by the Board, except that where the use of component rates has been authorized, the composite rates to beshown for the respective primary accounts should be recomputed from the December charges developed by the use of the authorized rates. If anychanges in rates were effective during the year, give particulars in a footnote.
2. All leased property may be combined and one composite rate computed for each primary account, or a separate schedule may be included foreach such property.
3. Show in columns (e), (f), and (g) data applicable to lessor property, when the rent therefore is included in accounts nos. 31-11-00, 31-12-00,31-13-00, 31-21-00, 31-22-00, and 31-23-00, inclusive.
4. If depreciation accruals have been discontinued for any account, the depreciation base should be reported, nevertheless, in support ofdepreciation reserves. Authority for discontinuance of accruals should be shown in a footnote, indicating the effected account(s).
5. Disclosures in the respective sections of this schedule may be omitted if either total road leased from others or total equipment leased fromothers represents less than 5% of total road owned or total equipment owned, respectively.
OWNED AND USED LEASED FROM OTHERSAnnual Annual
1/1 12/1 composite compositeLine At beginning At close rate At beginning At close rate LineNo. Account of year of year (percent) of year of year (percent) No.
(a) (b) (c) (d) (e) (f) (g)ROAD
1 (3) Grading 0 0 0.00 12 (4) Other right-of-way expenditures 0 0 0.00 23 (5) Tunnels and subways 0 0 0.00 34 (6) Bridges, trestles and culverts 40 40 1.41 45 (7) Elevated structures 0 0 0.00 56 (8) Ties 53 80 4.22 67 (9) Rail and other track material 31,181 32,057 2.76 78 (11) Ballast 167 167 2.94 89 (13) Fences, snowsheds and signs 0 0 0.00 910 (16) Station and office buildings 0 0 0.00 1011 (17) Roadway buildings 0 0 0.00 1112 (18) Water stations 0 0 0.00 1213 (19) Fuel stations 0 0 0.00 1314 (20) Shops and enginehouses 0 0 0.00 1415 (22) Storage warehouses 0 0 0.00 1516 (23) Wharves and docks 0 0 0.00 1617 (24) Coal and ore wharves 0 0 0.00 1718 (25) TOFC/COFC terminals 0 0 0.00 1819 (26) Communications systems 273,799 328,689 3.45 1920 (27) Signals and interlockers 1,113,372 1,227,608 3.85 2021 (29) Power plants 0 0 0.00 2122 (31) Power transmission systems 95,496 104,391 2.27 2223 (35) Miscellaneous structures 0 0 0.00 2324 (37) Roadway machines 0 0 0.00 2425 (39) Public improvements - construction 0 0 0.00 2526 (44) Shop machinery 0 0 0.00 2627 (45) Power plant machinery 0 0 0.00 2728 All other road accounts 0 0 0.00 2829 Amortization (other than def. projects) 0 0 0.00 2930 TOTAL ROAD 1,514,108 1,693,032 3.65 30
EQUIPMENT31 (52) Locomotives 528,544 620,190 7.94 3132 (53) Freight train cars 0 0 0.00 3233 (54) Passenger train cars 0 0 0.00 3334 (55) Highway revenue equipment 0 0 0.00 3435 (56) Floating equipment 0 0 0.00 3536 (57) Work equipment 2,400 2,400 2.93 3637 (58) Miscellaneous equipment 1,029 1,029 5.78 3738 (59) Computer systems & WP equipment 179,043 185,872 12.20 3839 TOTAL EQUIPMENT 711,016 809,491 8.90 3940 GRAND TOTAL 2,225,124 2,502,523 N/A N/A 40
Note: New Equipment depreciation rates were authorized by the Surface Transportation Board effective January 1, 2016.
Depreciation base Depreciation base

86 Road Initials: UPRR Year: 2017
PTC Supplement to Railroad Annual Report R-1
PTC 335. ACCUMULATED DEPRECIATION - ROAD AND EQUIPMENT OWNED AND USED(Dollars in Thousands)
1. Disclose the required information regarding credits and debits to Account No. 735, "Accumulated Depreciation: Road and Equipment Property."during the year relating to owned and used road and equipment. Include entries for depreciation of equipment owned but not used when the resultingrents are included in the "Lease Rentals - Credit - Equipment" accounts and "Other Rents - Credit - Equipment" accounts. Exclude any entries fordepreciation of equipment that is used but not owned when the resulting rents are included in "Lease Rental - Debit - Equipment" accounts and Other Rents - Debit - Equipment accounts. (See Schedule 351 for accumulated depreciation to road and equipment owned and leased to others.)
2. If any data are included in columns (d) or (f), explain the entries in detail.
3. A debit balance in columns (b) or (g) for any primary account should be designated "Dr."
4. If there is any inconsistency between credits to reserves as shown in column (c) and charges to operating expenses, a full explanation shouldbe given.
5. Enter amounts representing amortization under an authorized amortization program other than for defense projects on lines 29 and 39
CREDITS TO RESERVE DEBITS TO RESERVEDuring the year During the year
Balance Charges to BalanceLine Cross at beginning operating Other Other at close of LineNo. Check Account of year expenses credits Retirements debits year No.
(a) (b) (c) (d) (e) (f) (g)ROAD
1 (3) Grading 0 0 0 0 0 0 12 (4) Other right-of-way expenditures 0 0 0 0 0 0 23 (5) Tunnels and subways 0 0 0 0 0 0 34 (6) Bridges, trestles and culverts 4 0 0 0 0 4 45 (7) Elevated structures 0 0 0 0 0 0 56 (8) Ties 3 3 0 0 0 6 67 (9) Rail and other track material 3,192 870 0 0 0 4,062 78 (11) Ballast 16 5 0 0 0 21 89 (13) Fences, snowsheds and signs 0 0 0 0 0 0 9
10 (16) Station and office buildings 0 0 0 0 0 0 1011 (17) Roadway buildings 0 0 0 0 0 0 1112 (18) Water stations 0 0 0 0 0 0 1213 (19) Fuel stations 0 0 0 0 0 0 1314 (20) Shops and enginehouses 0 0 0 0 0 0 1415 (22) Storage warehouses 0 0 0 0 0 0 1516 (23) Wharves and docks 0 0 0 0 0 0 1617 (24) Coal and ore wharves 0 0 0 0 0 0 1718 (25) TOFC/COFC terminals 0 0 0 0 0 0 1819 (26) Communications systems 19,482 10,414 0 0 0 29,896 1920 (27) Signals and interlockers 138,435 45,221 0 241 0 183,415 2021 (29) Power plants 0 0 0 0 0 0 2122 (31) Power transmission systems 5,060 2,267 0 0 0 7,327 2223 (35) Miscellaneous structures 0 0 0 0 0 0 2324 (37) Roadway machines 0 0 0 0 0 0 2425 (39) Public improvements - const. 0 0 0 0 0 0 2526 (44) Shop machinery 0 0 0 0 0 0 2627 (45) Power plant machinery 0 0 0 0 0 0 2728 All other road accounts 0 0 0 0 0 0 2829 Amortization (Adjustments) 0 0 0 0 0 0 2930 TOTAL ROAD 166,192 58,780 0 241 0 224,731 30
EQUIPMENT31 (52) Locomotives 134,861 45,600 0 0 0 180,461 3132 (53) Freight train cars 0 0 0 0 0 0 3233 (54) Passenger train cars 0 0 0 0 0 0 3334 (55) Highway revenue equipment 0 0 0 0 0 0 3435 (56) Floating equipment 0 0 0 0 0 0 3536 (57) Work equipment 274 70 0 0 0 344 3637 (58) Miscellaneous equipment 203 59 0 0 0 262 3738 (59) Computer systems & WP equip. 95,137 22,408 0 40,546 0 76,999 3839 Amortization Adjustments 0 0 0 0 0 0 3940 TOTAL EQUIPMENT 230,475 68,137 0 40,546 0 258,066 4041 GRAND TOTAL 396,667 126,917 0 40,787 0 482,797 41
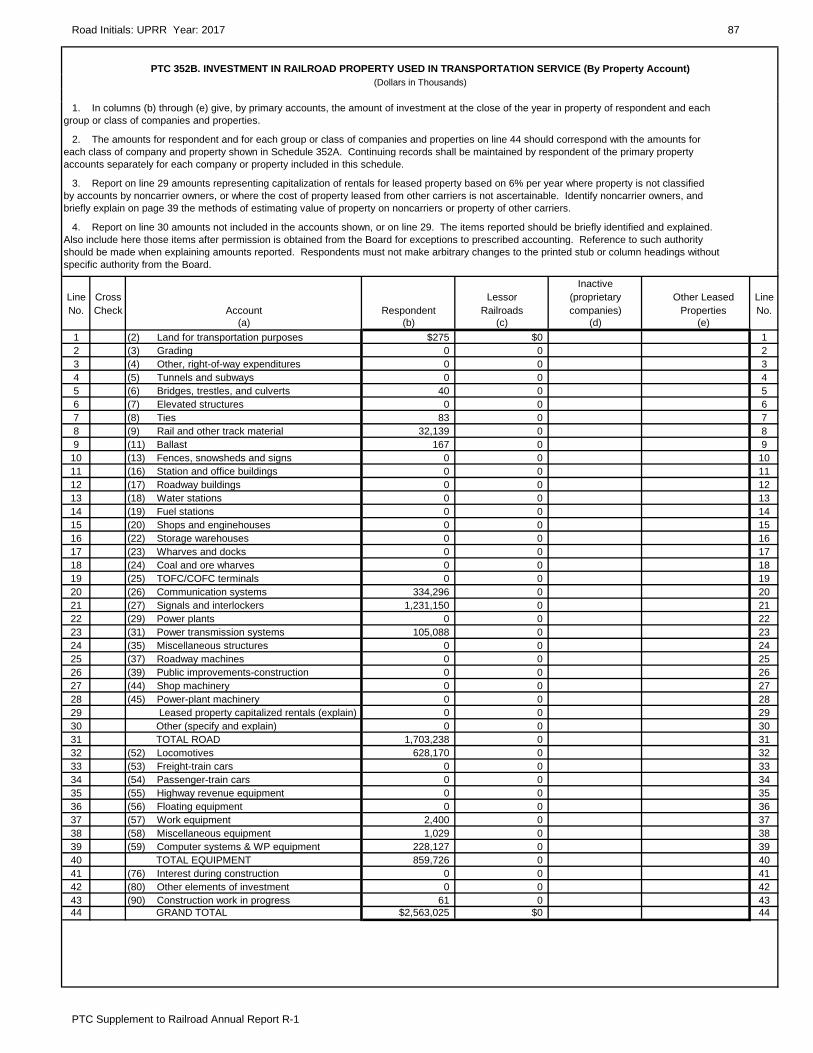
Road Initials: UPRR Year: 2017 87
PTC Supplement to Railroad Annual Report R-1
PTC 352B. INVESTMENT IN RAILROAD PROPERTY USED IN TRANSPORTATION SERVICE (By Property Account)(Dollars in Thousands)
1. In columns (b) through (e) give, by primary accounts, the amount of investment at the close of the year in property of respondent and eachgroup or class of companies and properties.
2. The amounts for respondent and for each group or class of companies and properties on line 44 should correspond with the amounts for each class of company and property shown in Schedule 352A. Continuing records shall be maintained by respondent of the primary propertyaccounts separately for each company or property included in this schedule.
3. Report on line 29 amounts representing capitalization of rentals for leased property based on 6% per year where property is not classifiedby accounts by noncarrier owners, or where the cost of property leased from other carriers is not ascertainable. Identify noncarrier owners, andbriefly explain on page 39 the methods of estimating value of property on noncarriers or property of other carriers.
4. Report on line 30 amounts not included in the accounts shown, or on line 29. The items reported should be briefly identified and explained.Also include here those items after permission is obtained from the Board for exceptions to prescribed accounting. Reference to such authorityshould be made when explaining amounts reported. Respondents must not make arbitrary changes to the printed stub or column headings withoutspecific authority from the Board.
InactiveLine Cross Lessor (proprietary Other Leased LineNo. Check Account Respondent Railroads companies) Properties No.
(a) (b) (c) (d) (e)1 (2) Land for transportation purposes $275 $0 12 (3) Grading 0 0 23 (4) Other, right-of-way expenditures 0 0 34 (5) Tunnels and subways 0 0 45 (6) Bridges, trestles, and culverts 40 0 56 (7) Elevated structures 0 0 67 (8) Ties 83 0 78 (9) Rail and other track material 32,139 0 89 (11) Ballast 167 0 9
10 (13) Fences, snowsheds and signs 0 0 1011 (16) Station and office buildings 0 0 1112 (17) Roadway buildings 0 0 1213 (18) Water stations 0 0 1314 (19) Fuel stations 0 0 1415 (20) Shops and enginehouses 0 0 1516 (22) Storage warehouses 0 0 1617 (23) Wharves and docks 0 0 1718 (24) Coal and ore wharves 0 0 1819 (25) TOFC/COFC terminals 0 0 1920 (26) Communication systems 334,296 0 2021 (27) Signals and interlockers 1,231,150 0 2122 (29) Power plants 0 0 2223 (31) Power transmission systems 105,088 0 2324 (35) Miscellaneous structures 0 0 2425 (37) Roadway machines 0 0 2526 (39) Public improvements-construction 0 0 2627 (44) Shop machinery 0 0 2728 (45) Power-plant machinery 0 0 2829 Leased property capitalized rentals (explain) 0 0 2930 Other (specify and explain) 0 0 3031 TOTAL ROAD 1,703,238 0 3132 (52) Locomotives 628,170 0 3233 (53) Freight-train cars 0 0 3334 (54) Passenger-train cars 0 0 3435 (55) Highway revenue equipment 0 0 3536 (56) Floating equipment 0 0 3637 (57) Work equipment 2,400 0 3738 (58) Miscellaneous equipment 1,029 0 3839 (59) Computer systems & WP equipment 228,127 0 3940 TOTAL EQUIPMENT 859,726 0 4041 (76) Interest during construction 0 0 4142 (80) Other elements of investment 0 0 4243 (90) Construction work in progress 61 0 4344 GRAND TOTAL $2,563,025 $0 44

PTC 410. RAILWAY OPERATING EXPENSES(Dollars in Thousands)
State the railway operating expenses on respondent's road for the year, classifying them in accordance with the Uniform System of Accounts for Railroad Companies, and allocate the common operating expenses in accordance with the Board's rules governing the separation of such expenses between freight and passenger services.
Material, tools, TotalLine Cross Salaries and supplies, fuels Purchased Freight LineNo. Check Name of railway operating expense account Wages and lubricants Services General Expense Passenger Total No.
(a) (b) (c) (d) (e) (f) (g) (h)WAY AND STRUCTURESADMINISTRATION
1 Track 0 0 0 0 0 0 0 12 Bridge & Building 0 0 0 0 0 0 0 23 Signal 3,048 10,972 3,245 563 17,828 0 17,828 34 Communication 0 0 0 0 0 0 0 45 Other 0 0 0 0 0 0 0 5
REPAIR AND MAINTENANCE6 Roadway - Running 0 0 0 0 0 0 0 67 Roadway - Switching 0 0 0 0 0 0 0 78 Tunnels and Subways - Running 0 0 0 0 0 0 0 89 Tunnels and Subways - Switching 0 0 0 0 0 0 0 9
10 Bridges - Culverts - Running 0 0 0 0 0 0 0 1011 Bridges - Culverts - Switching 0 0 0 0 0 0 0 1112 Ties - Running 0 0 0 0 0 0 0 1213 Ties - Switching 0 0 0 0 0 0 0 1314 Rail & Other Track Material - Running 25 6 0 0 31 0 31 1415 Rail & Other Track Material - Switching 8 2 0 0 10 0 10 1516 Ballast - Running 0 0 0 0 0 0 0 1617 Ballast - Switching 0 0 0 0 0 0 0 1718 Road Property Damaged - Running 0 0 0 0 0 0 0 1819 Road Property Damaged - Switching 0 0 0 0 0 0 0 1920 Road Property Damaged - Other 0 0 0 0 0 0 0 2021 Signal & Interlockers-Running 33 143 1 0 177 0 177 2122 Signal & Interlockers-Switching 11 48 0 0 59 0 59 2223 Communications Systems 10 0 0 0 10 0 10 2324 Power Systems 0 0 0 0 0 0 0 2425 Highway Grade Crossing - Running 9 0 0 0 9 0 9 2526 Highway Grade Crossing - Switching 3 0 0 0 3 0 3 2627 Station & Office Buildings 0 0 0 0 0 0 0 2728 Shop Buildings - Locomotives 0 0 0 0 0 0 0 2829 Shop Buildings - Freight Cars 0 0 0 0 0 0 0 2930 Shop Buildings - Other Equipment 0 0 0 0 0 0 0 30
88
PTC Supplem
ent to Railroad Annual R
eport R-1
Road Initials: U
PRR
Year: 2017
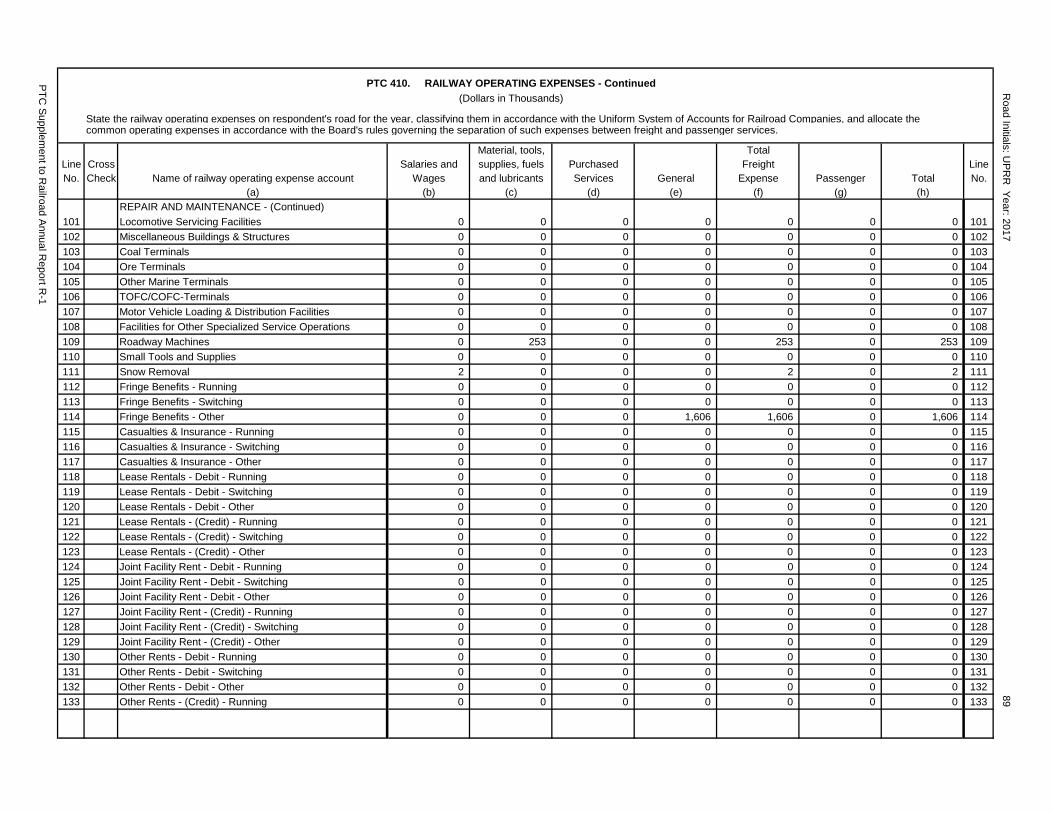
PTC 410. RAILWAY OPERATING EXPENSES - Continued(Dollars in Thousands)
State the railway operating expenses on respondent's road for the year, classifying them in accordance with the Uniform System of Accounts for Railroad Companies, and allocate the common operating expenses in accordance with the Board's rules governing the separation of such expenses between freight and passenger services.
Material, tools, TotalLine Cross Salaries and supplies, fuels Purchased Freight LineNo. Check Name of railway operating expense account Wages and lubricants Services General Expense Passenger Total No.
(a) (b) (c) (d) (e) (f) (g) (h)REPAIR AND MAINTENANCE - (Continued)
101 Locomotive Servicing Facilities 0 0 0 0 0 0 0 101102 Miscellaneous Buildings & Structures 0 0 0 0 0 0 0 102103 Coal Terminals 0 0 0 0 0 0 0 103104 Ore Terminals 0 0 0 0 0 0 0 104105 Other Marine Terminals 0 0 0 0 0 0 0 105106 TOFC/COFC-Terminals 0 0 0 0 0 0 0 106107 Motor Vehicle Loading & Distribution Facilities 0 0 0 0 0 0 0 107108 Facilities for Other Specialized Service Operations 0 0 0 0 0 0 0 108109 Roadway Machines 0 253 0 0 253 0 253 109110 Small Tools and Supplies 0 0 0 0 0 0 0 110111 Snow Removal 2 0 0 0 2 0 2 111112 Fringe Benefits - Running 0 0 0 0 0 0 0 112113 Fringe Benefits - Switching 0 0 0 0 0 0 0 113114 Fringe Benefits - Other 0 0 0 1,606 1,606 0 1,606 114115 Casualties & Insurance - Running 0 0 0 0 0 0 0 115116 Casualties & Insurance - Switching 0 0 0 0 0 0 0 116117 Casualties & Insurance - Other 0 0 0 0 0 0 0 117118 Lease Rentals - Debit - Running 0 0 0 0 0 0 0 118119 Lease Rentals - Debit - Switching 0 0 0 0 0 0 0 119120 Lease Rentals - Debit - Other 0 0 0 0 0 0 0 120121 Lease Rentals - (Credit) - Running 0 0 0 0 0 0 0 121122 Lease Rentals - (Credit) - Switching 0 0 0 0 0 0 0 122123 Lease Rentals - (Credit) - Other 0 0 0 0 0 0 0 123124 Joint Facility Rent - Debit - Running 0 0 0 0 0 0 0 124125 Joint Facility Rent - Debit - Switching 0 0 0 0 0 0 0 125126 Joint Facility Rent - Debit - Other 0 0 0 0 0 0 0 126127 Joint Facility Rent - (Credit) - Running 0 0 0 0 0 0 0 127128 Joint Facility Rent - (Credit) - Switching 0 0 0 0 0 0 0 128129 Joint Facility Rent - (Credit) - Other 0 0 0 0 0 0 0 129130 Other Rents - Debit - Running 0 0 0 0 0 0 0 130131 Other Rents - Debit - Switching 0 0 0 0 0 0 0 131132 Other Rents - Debit - Other 0 0 0 0 0 0 0 132133 Other Rents - (Credit) - Running 0 0 0 0 0 0 0 133
PTC Supplem
ent to Railroad Annual R
eport R-1
Road Initials: U
PRR
Year: 201789
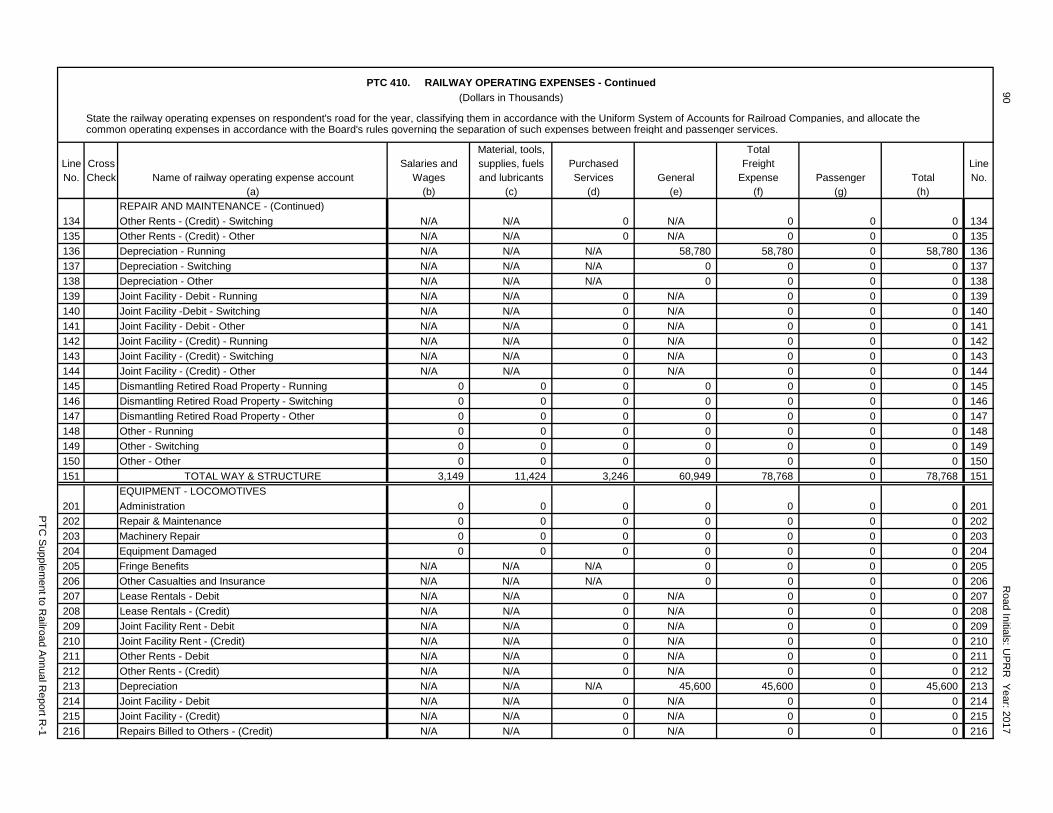
PTC 410. RAILWAY OPERATING EXPENSES - Continued(Dollars in Thousands)
State the railway operating expenses on respondent's road for the year, classifying them in accordance with the Uniform System of Accounts for Railroad Companies, and allocate the common operating expenses in accordance with the Board's rules governing the separation of such expenses between freight and passenger services.
Material, tools, TotalLine Cross Salaries and supplies, fuels Purchased Freight LineNo. Check Name of railway operating expense account Wages and lubricants Services General Expense Passenger Total No.
(a) (b) (c) (d) (e) (f) (g) (h)REPAIR AND MAINTENANCE - (Continued)
134 Other Rents - (Credit) - Switching N/A N/A 0 N/A 0 0 0 134135 Other Rents - (Credit) - Other N/A N/A 0 N/A 0 0 0 135136 Depreciation - Running N/A N/A N/A 58,780 58,780 0 58,780 136137 Depreciation - Switching N/A N/A N/A 0 0 0 0 137138 Depreciation - Other N/A N/A N/A 0 0 0 0 138139 Joint Facility - Debit - Running N/A N/A 0 N/A 0 0 0 139140 Joint Facility -Debit - Switching N/A N/A 0 N/A 0 0 0 140141 Joint Facility - Debit - Other N/A N/A 0 N/A 0 0 0 141142 Joint Facility - (Credit) - Running N/A N/A 0 N/A 0 0 0 142143 Joint Facility - (Credit) - Switching N/A N/A 0 N/A 0 0 0 143144 Joint Facility - (Credit) - Other N/A N/A 0 N/A 0 0 0 144145 Dismantling Retired Road Property - Running 0 0 0 0 0 0 0 145146 Dismantling Retired Road Property - Switching 0 0 0 0 0 0 0 146147 Dismantling Retired Road Property - Other 0 0 0 0 0 0 0 147148 Other - Running 0 0 0 0 0 0 0 148149 Other - Switching 0 0 0 0 0 0 0 149150 Other - Other 0 0 0 0 0 0 0 150151 TOTAL WAY & STRUCTURE 3,149 11,424 3,246 60,949 78,768 0 78,768 151
EQUIPMENT - LOCOMOTIVES201 Administration 0 0 0 0 0 0 0 201202 Repair & Maintenance 0 0 0 0 0 0 0 202203 Machinery Repair 0 0 0 0 0 0 0 203204 Equipment Damaged 0 0 0 0 0 0 0 204205 Fringe Benefits N/A N/A N/A 0 0 0 0 205206 Other Casualties and Insurance N/A N/A N/A 0 0 0 0 206207 Lease Rentals - Debit N/A N/A 0 N/A 0 0 0 207208 Lease Rentals - (Credit) N/A N/A 0 N/A 0 0 0 208209 Joint Facility Rent - Debit N/A N/A 0 N/A 0 0 0 209210 Joint Facility Rent - (Credit) N/A N/A 0 N/A 0 0 0 210211 Other Rents - Debit N/A N/A 0 N/A 0 0 0 211212 Other Rents - (Credit) N/A N/A 0 N/A 0 0 0 212213 Depreciation N/A N/A N/A 45,600 45,600 0 45,600 213214 Joint Facility - Debit N/A N/A 0 N/A 0 0 0 214215 Joint Facility - (Credit) N/A N/A 0 N/A 0 0 0 215216 Repairs Billed to Others - (Credit) N/A N/A 0 N/A 0 0 0 216
90
PTC Supplem
ent to Railroad Annual R
eport R-1
Road Initials: U
PRR
Year: 2017

PTC 410. RAILWAY OPERATING EXPENSES - Continued(Dollars in Thousands)
State the railway operating expenses on respondent's road for the year, classifying them in accordance with the Uniform System of Accounts for Railroad Companies, and allocate the common operating expenses in accordance with the Board's rules governing the separation of such expenses between freight and passenger services.
Material, tools, TotalLine Cross Salaries and supplies, fuels Purchased Freight LineNo. Check Name of railway operating expense account Wages and lubricants Services General Expense Passenger Total No.
(a) (b) (c) (d) (e) (f) (g) (h)LOCOMOTIVES - (Continued)
217 Dismantling Retired Property 0 0 0 0 0 0 0 217218 Other 0 0 0 0 0 0 0 218219 TOTAL LOCOMOTIVES 0 0 0 45,600 45,600 0 45,600 219
FREIGHT CARS220 Administration 0 0 0 0 0 N/A 0 220221 Repair & Maintenance 0 0 0 0 0 N/A 0 221222 Machinery Repair 0 0 0 0 0 N/A 0 222223 Equipment Damaged 0 0 0 0 0 N/A 0 223224 Fringe Benefits N/A N/A N/A 0 0 N/A 0 224225 Other Casualties & Insurance N/A N/A N/A 0 0 N/A 0 225226 Lease Rentals - Debit N/A N/A 0 N/A 0 N/A 0 226227 Lease Rentals - (Credit) N/A N/A 0 N/A 0 N/A 0 227228 Joint Facility Rent - Debit N/A N/A 0 N/A 0 N/A 0 228229 Joint Facility Rent - (Credit) N/A N/A 0 N/A 0 N/A 0 229230 Other Rents - Debit N/A N/A 0 N/A 0 N/A 0 230231 Other Rents - (Credit) N/A N/A 0 N/A 0 N/A 0 231232 Depreciation N/A N/A N/A 0 0 N/A 0 232233 Joint Facility - Debit N/A N/A 0 N/A 0 N/A 0 233234 Joint Facility - (Credit) N/A N/A 0 N/A 0 N/A 0 234235 Repairs Billed Other - (Credit) N/A N/A 0 N/A 0 N/A 0 235236 Dismantling Retired Property 0 0 0 0 0 N/A 0 236237 Others 0 0 0 0 0 N/A 0 237238 TOTAL FREIGHT CARS 0 0 0 0 0 N/A 0 238
OTHER EQUIPMENT301 Administration 0 0 0 0 0 0 0 301
Repair and Maintenance: 0 0 0 0 0302 Truck, Trailers & Containers - Revenue Service 0 0 0 0 0 N/A 0 302303 Floating Equipment - Revenue Services 0 0 0 0 0 N/A 0 303304 Passenger & Other Revenue Equipment 0 0 0 0 0 0 0 304305 Computers & Data Process Systems 0 0 95 0 95 0 95 305306 Machinery 0 0 0 0 0 0 0 306307 Work & Other Nonrevenue Equipment 0 0 0 0 0 0 0 307308 Equipment Damaged 0 0 0 0 0 0 0 308309 Fringe Benefits N/A N/A N/A 0 0 0 0 309310 Other Casualties & Insurance N/A N/A N/A 0 0 0 0 310311 Lease Rentals - Debit N/A N/A 0 N/A 0 0 0 311312 Lease Rentals - (Credit) N/A N/A 0 N/A 0 0 0 312
PTC Supplem
ent to Railroad Annual R
eport R-1
Road Initials: U
PRR
Year: 201791

PTC 410. RAILWAY OPERATING EXPENSES - Continued(Dollars in Thousands)
State the railway operating expenses on respondent's road for the year, classifying them in accordance with the Uniform System of Accounts for Railroad Companies, and allocate the common operating expenses in accordance with the Board's rules governing the separation of such expenses between freight and passenger services.
Material, tools, TotalLine Cross Salaries and supplies, fuels Purchased Freight LineNo. Check Name of railway operating expense account Wages and lubricants Services General Expense Passenger Total No.
(a) (b) (c) (d) (e) (f) (g) (h)OTHER EQUIPMENT - (Continued)
313 Joint Facility Rent - Debit N/A N/A 0 N/A 0 0 0 313314 Joint Facility Rent - (Credit) N/A N/A 0 N/A 0 0 0 314315 Other Rents - Debit N/A N/A 0 N/A 0 0 0 315316 Other Rents - (Credit) N/A N/A 0 N/A 0 0 0 316317 Depreciation N/A N/A 0 22,537 22,537 0 22,537 317318 Joint Facility - Debit N/A N/A 0 N/A 0 0 0 318319 Joint Facility - (Credit) N/A N/A 0 N/A 0 0 0 319320 Repairs Billed Other - (Credit) N/A N/A 0 N/A 0 0 0 320321 Dismantling Retired Equipment 0 0 0 0 0 0 0 321322 Other 0 0 0 0 0 0 0 322323 TOTAL OTHER EQUIPMENT 0 0 95 22,537 22,632 0 22,632 323324 TOTAL EQUIPMENT 0 0 95 68,137 68,232 0 68,232 324
TRANSPORTATIONTRAIN OPERATIONS
401 Administration 0 0 0 0 0 0 0 401402 Engine Crews 0 0 0 0 0 0 0 402403 Train Crews 0 0 0 0 0 0 0 403404 Dispatching Trains 0 0 0 0 0 0 0 404405 Operating Signal & Interlockers 0 0 0 0 0 0 0 405406 Operating Drawbridges 0 0 0 0 0 0 0 406407 Highway Crossing Protection 0 0 0 0 0 0 0 407408 Train Inspection & Lubricants 0 0 0 0 0 0 0 408409 Locomotive Fuel 0 0 0 0 0 0 0 409410 Electric Power Purchased or Produced for Motive Power 0 0 0 0 0 0 0 410411 Servicing Locomotives 0 0 0 0 0 0 0 411412 Freight Lost or Damaged 0 0 0 0 0 0 0 412413 Clearing Wrecks 0 0 0 0 0 0 0 413414 Fringe Benefits 0 0 0 0 0 0 0 414415 Other Casualties & Insurance 0 0 0 0 0 0 0 415416 Joint Facility - Debit 0 0 0 0 0 0 0 416417 Joint Facility - (Credit) 0 0 0 0 0 0 0 417418 Other 0 0 0 0 0 0 0 418419 TOTAL TRAIN OPERATIONS 0 0 0 0 0 0 0 419
YARD OPERATIONS420 Administration 0 0 0 0 0 0 0 420421 Switch Crews 0 0 0 0 0 0 0 421
92
PTC Supplem
ent to Railroad Annual R
eport R-1
Road Initials: U
PRR
Year: 2017

PTC 410. RAILWAY OPERATING EXPENSES - Continued(Dollars in Thousands)
State the railway operating expenses on respondent's road for the year, classifying them in accordance with the Uniform System of Accounts for Railroad Companies, and allocate the common operating expenses in accordance with the Board's rules governing the separation of such expenses between freight and passenger services.
Material, tools, TotalLine Cross Salaries and supplies, fuels Purchased Freight LineNo. Check Name of railway operating expense account Wages and lubricants Services General Expense Passenger Total No.
(a) (b) (c) (d) (e) (f) (g) (h)YARD OPERATIONS - (Continued)
422 Controlling Operations 0 0 0 0 0 0 0 422423 Yard & Terminal Clerical 0 0 0 0 0 0 0 423424 Operating Switches, Signals, Retarders & Humps 0 0 0 0 0 0 0 424425 Locomotive Fuel 0 0 0 0 0 0 0 425426 Electric Power Purchased or Produced for Motive Power 0 0 0 0 0 0 0 426427 Servicing Locomotives 0 0 0 0 0 0 0 427428 Freight Lost or Damaged - Solely Related N/A N/A N/A 0 0 0 0 428429 Clearing Wrecks 0 0 0 0 0 0 0 429430 Fringe Benefits N/A N/A N/A 0 0 0 0 430431 Other Casualties & Insurance N/A N/A N/A 0 0 0 0 431432 Joint Facility - Debit N/A N/A 0 N/A 0 0 0 432433 Joint Facility - (Credit) N/A N/A 0 N/A 0 0 0 433434 Other 0 0 0 0 0 0 0 434435 TOTAL YARD OPERATION 0 0 0 0 0 0 0 435
TRAIN & YARD OPERATIONS COMMON501 Cleaning Car Interiors 0 0 0 N/A 0 0 0 501502 Adjusting & Transferring Loads 0 0 0 N/A 0 N/A 0 502503 Car Loading Devices & Grain Doors 0 0 0 N/A 0 N/A 0 503504 Freight Loss or Damaged - All Other 0 N/A 0 0 0 0 0 504505 Fringe Benefits 0 N/A 0 0 0 0 0 505506 TOTAL TRAIN & YARD OPERATIONS COMMON 0 0 0 0 0 0 0 506
SPECIALIZED SERVICE OPERATIONS507 Administration 0 0 0 0 0 N/A 0 507508 Picking & Delivery & Marine Line Haul 0 0 0 0 0 N/A 0 508509 Loading & Unloading Local Marine 0 0 0 0 0 N/A 0 509510 Protective Services 0 0 0 0 0 N/A 0 510511 Freight Loss or Damaged - Solely Related N/A N/A N/A 0 0 N/A 0 511512 Fringe Benefits N/A N/A N/A 0 0 N/A 0 512513 Casualties & Insurance N/A N/A N/A 0 0 N/A 0 513514 Joint Facility - Debit N/A N/A 0 0 0 N/A 0 514515 Joint Facility - (Credit) N/A N/A 0 0 0 N/A 0 515516 Others 0 0 0 0 0 N/A 0 516517 TOTAL SPECIALIZED SERVICES OPERATIONS 0 0 0 0 0 N/A 0 517
PTC Supplem
ent to Railroad Annual R
eport R-1
Road Initials: U
PRR
Year: 201793

PTC 410. RAILWAY OPERATING EXPENSES - Concluded(Dollars in Thousands)
State the railway operating expenses on respondent's road for the year, classifying them in accordance with the Uniform System of Accounts for Railroad Companies, and allocate the common operating expenses in accordance with the Board's rules governing the separation of such expenses between freight and passenger services.
Material, tools, TotalLine Cross Salaries and supplies, fuels Purchased Freight LineNo. Check Name of railway operating expense account Wages and lubricants Services General Expense Passenger Total No.
(a) (b) (c) (d) (e) (f) (g) (h)ADMINISTRATIVE SUPPORT OPERATIONS
518 Administration 0 0 0 0 0 0 0 518519 Employees Performing Clerical & Acctg Functions 0 0 0 0 0 0 0 519520 Communication Systems Operations 0 0 1 0 1 0 1 520521 Loss & Damage Claims Process 0 0 0 0 0 0 0 521522 Fringe Benefits N/A N/A 0 0 0 0 0 522523 Casualties & Insurance N/A N/A 0 0 0 0 0 523524 Joint Facility - Debit N/A N/A 0 N/A 0 0 0 524525 Joint Facility - (Credit) N/A N/A 0 N/A 0 0 0 525526 Other 0 0 0 0 0 0 0 526527 TOTAL ADMINISTRATION SUPPORT OPERATIONS 0 0 1 0 1 0 1 527528 TOTAL TRANSPORTATION 0 0 1 0 1 0 1 528
GENERAL & ADMINISTRATIVE601 Officers General & Administration 0 0 0 0 0 0 0 601602 Accounting, Auditing & Finance 0 0 0 0 0 0 0 602603 Management Services & Data Processing 0 0 0 0 0 0 0 603604 Marketing 0 0 0 0 0 0 0 604605 Sales 0 0 0 0 0 0 0 605606 Industrial Development 0 0 0 0 0 0 0 606607 Personnel & Labor Relations 0 0 0 0 0 0 0 607608 Legal & Secretarial 0 0 0 0 0 0 0 608609 Public Relations & Advertising 0 0 0 0 0 0 0 609610 Research & Development 0 0 0 0 0 0 0 610611 Fringe Benefits N/A N/A N/A 1,895 1,895 0 1,895 611612 Casualties & Insurance N/A N/A N/A 0 0 0 0 612613 Writedown of Uncollectible Accounts N/A N/A N/A 0 0 0 0 613614 Property Taxes N/A N/A N/A 0 0 0 0 614615 Other Taxes N/A N/A N/A 0 0 0 0 615616 Joint Facility - Debit N/A N/A 0 N/A 0 0 0 616617 Joint Facility - (Credit) N/A N/A 0 N/A 0 0 0 617618 Other 4,309 46 33 146 4,534 0 4,534 618619 TOTAL GENERAL & ADMINISTRATIVE 4,309 46 33 2,041 6,429 0 6,429 619
620 TOTAL OPERATING EXPENSE 7,458 11,470 3,375 131,127 153,430 0 153,430 620
94
PTC Supplem
ent to Railroad Annual R
eport R-1
Road Initials: U
PRR
Year: 2017

Road Initials: UPRR Year: 2017 95
PTC Supplement to Railroad Annual Report R-1
PTC 700. MILEAGE OPERATED AT CLOSE OF YEAR
Running tracks, passing tracks, cross-overs, etc.Miles of
Miles of Miles of passing tracks Miles of way Miles of yardLine Proportion owned second main all other cross-overs, switching switching LineNo. Class or leased by Respondent Miles of road track main tracks and turnouts tracks tracks Total No.
(a) (b) (c) (d) (e) (f) (g) (h) (i)1 1 100% - - - - - - - 12 23 1J 12.5% - - - - - - - 34 1J 23.0% - - - - - - - 45 1J 25.0% - - - - - - - 56 1J 33.3% - - - - - - - 67 1J 37.5% - - - - - - - 78 1J 40.0% - - - - - - - 89 1J 44.0% - - - - - - - 9
10 1J 50.0% - - - - - - - 1011 1J 62.5% - - - - - - - 1112 1J 66.7% - - - - - - - 1213 Total 1J - - - - - - - 1314 1415 Total 1 and 1J - - - - - - - 1516 1617 2 A&S - - - - - - - 1718 2 - - - - - - - 1819 Total 2 - - - - - - - 1920 2021 3A - - - - - - - 2122 3B - - - - - - - 2223 Total 3 - - - - - - - 2324 2425 2526 2627 4B - - - - - - - 2728 Total 4 - - - - - - - 2829 - - - - - - - 2930 3031 3132 5 - - - - - - - 3233 5J - - - - - - - 3334 Total 5 - - - - - - - 3435 3536 3637 3738 3839 3940 4041 4142 4243 4344 4445 4546 4647 4748 4849 4950 5051 5152 5253 5354 5455 5556 5657 TOTAL 0 0 0 0 0 0 0 57
Miles of electrified roador track included in
58 preceding grand total N/A 58
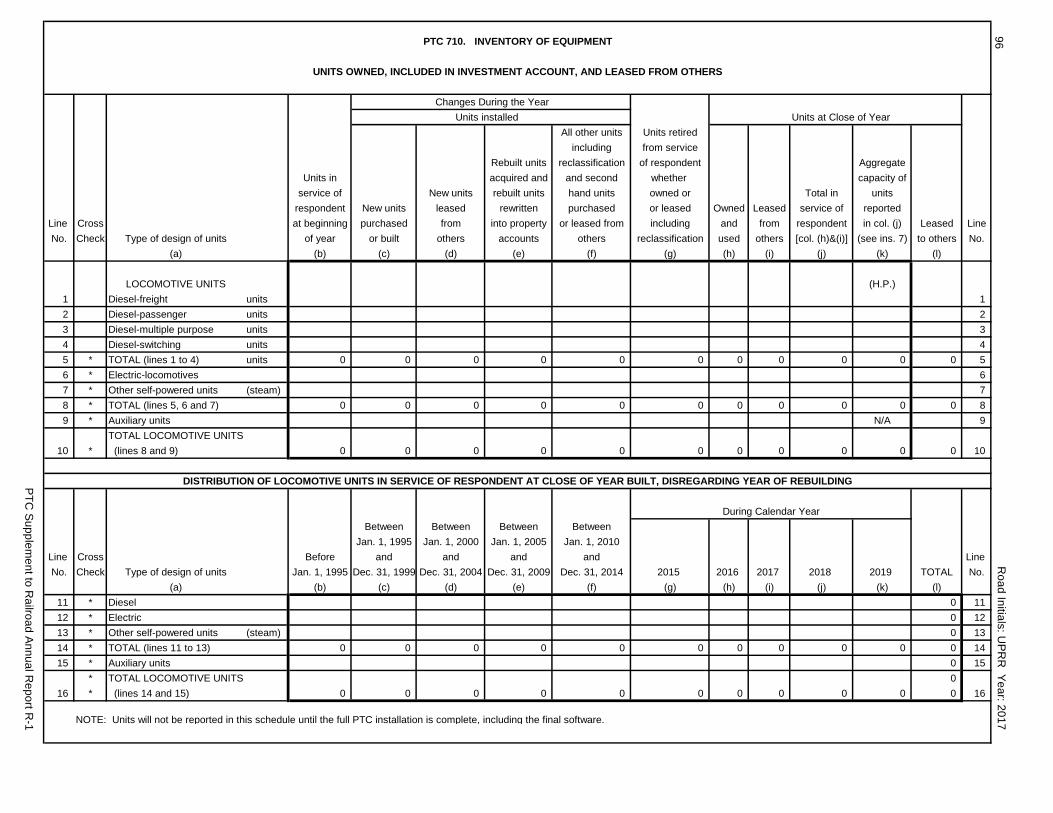
PTC 710. INVENTORY OF EQUIPMENT
UNITS OWNED, INCLUDED IN INVESTMENT ACCOUNT, AND LEASED FROM OTHERS
Changes During the Year Units installed Units at Close of Year
All other units Units retiredincluding from service
Rebuilt units reclassification of respondent AggregateUnits in acquired and and second whether capacity of
service of New units rebuilt units hand units owned or Total in unitsrespondent New units leased rewritten purchased or leased Owned Leased service of reported
Line Cross at beginning purchased from into property or leased from including and from respondent in col. (j) Leased LineNo. Check Type of design of units of year or built others accounts others reclassification used others [col. (h)&(i)] (see ins. 7) to others No.
(a) (b) (c) (d) (e) (f) (g) (h) (i) (j) (k) (l)
LOCOMOTIVE UNITS (H.P.)1 Diesel-freight units 12 Diesel-passenger units 23 Diesel-multiple purpose units 34 Diesel-switching units 45 * TOTAL (lines 1 to 4) units 0 0 0 0 0 0 0 0 0 0 0 56 * Electric-locomotives 67 * Other self-powered units (steam) 78 * TOTAL (lines 5, 6 and 7) 0 0 0 0 0 0 0 0 0 0 0 89 * Auxiliary units N/A 9
TOTAL LOCOMOTIVE UNITS10 * (lines 8 and 9) 0 0 0 0 0 0 0 0 0 0 0 10
DISTRIBUTION OF LOCOMOTIVE UNITS IN SERVICE OF RESPONDENT AT CLOSE OF YEAR BUILT, DISREGARDING YEAR OF REBUILDING
During Calendar YearBetween Between Between Between
Jan. 1, 1995 Jan. 1, 2000 Jan. 1, 2005 Jan. 1, 2010Line Cross Before and and and and Line No. Check Type of design of units Jan. 1, 1995 Dec. 31, 1999 Dec. 31, 2004 Dec. 31, 2009 Dec. 31, 2014 2015 2016 2017 2018 2019 TOTAL No.
(a) (b) (c) (d) (e) (f) (g) (h) (i) (j) (k) (l)11 * Diesel 0 1112 * Electric 0 1213 * Other self-powered units (steam) 0 1314 * TOTAL (lines 11 to 13) 0 0 0 0 0 0 0 0 0 0 0 1415 * Auxiliary units 0 15
* TOTAL LOCOMOTIVE UNITS 016 * (lines 14 and 15) 0 0 0 0 0 0 0 0 0 0 0 16
NOTE: Units will not be reported in this schedule until the full PTC installation is complete, including the final software.
96
PTC Supplem
ent to Railroad Annual R
eport R-1
Road Initials: U
PRR
Year: 2017

PTC 710. INVENTORY OF EQUIPMENT - ContinuedUNITS OWNED, INCLUDED IN INVESTMENT ACCOUNT, AND LEASED FROM OTHERS
Changes During the Year Units installed Units at Close of Year
All other units Units retiredincluding from service
Rebuilt units reclassification of respondent AggregateUnits in acquired and and second whether capacity of
service of New units rebuilt units hand units owned or Total in unitsrespondent New units leased rewritten purchased or leased Owned Leased service of reported
Line Cross at beginning purchased from into property or leased from including and from respondent in col. (j) Leased LineNo. Check Type of design of units of year or built others accounts others reclassification used others [col. (h)&(i)] (see ins. 7) to others No.
(a) (b) (c) (d) (e) (f) (g) (h) (i) (j) (k) (l)PASSENGER-TRAIN CARS
Non-Self-Propelled17 Coaches (PA,PB, PBO) 17
Combined cars18 (All class C, except CSB) 1819 Parlor cars (PBC,PC,PL,PO) 1920 Sleeping cars (PS,PT,PAS,PDS) 20
Dining, grill and tavern cars21 (All class D, PD) 21
Non-passenger-carrying cars22 (All Class B,CSB,M,PSA,IA) 2223 TOTAL (lines 17 to 22) 0 0 0 0 0 0 0 0 0 23
Self-Propelled24 Electric passenger cars (EP,ET) 2425 Electric combined cars (EC) 25
Internal combustion rail26 motorcars (ED, EG) 26
Other self-propelled cars27 (Specify types) 2728 TOTAL (lines 24 to 27) 0 0 0 0 0 0 0 0 0 2829 TOTAL (lines 23 to 28) 0 0 0 0 0 0 0 0 0 29
COMPANY SERVICE CARS30 Business car (PV) N/A 3031 Board outfit cars (MWX) N/A 31
Derrick and snow removal32 cars (MWU,MWV,MWW,MWK) N/A 32
Dump and ballast cars33 (MWB,MWD) N/A 33
Other maintenance and34 service equipment cars N/A 3435 TOTAL (lines 30 to 34) 0 0 0 0 0 0 0 0 0 N/A 35
PTC Supplem
ent to Railroad Annual R
eport R-1
Road Initials: U
PRR
Year: 201797

98 'Road Initials: UPRR Year: 2017
PTC Supplement to Railroad Annual Report R-1
PTC 710. INVENTORY OF EQUIPMENT - Continued
Instructions for reporting freight-train car data.
1. Give particulars of each of the various classes of equipment which respondent owned or leased during the year.
2. In column (d) give the number of units purchased or built in company shops. In column (e) give the number of new units leased from others. The term "new" meansa unit placed in service for the first time on any railroad.
3. Units leased to others for a period of one year or more are reportable in column (n). Units temporarily out of respondent's service and rented to others for less thanone year are to be included in column (i). Units rented from others for a period less than one year should not be included in column (j).
UNITS OWNED, INCLUDED IN INVESTMENT ACCOUNT, AND LEASED FROM OTHERSUnits in service of respondent Changes during the year
at beginning of year Units installed All other units
including Rebuilt units reclassification
New or acquired and and secondNew units rebuilt units rebuilt units hand units
Line Cross Class of equipment Time-mileage purchased leased from rewritten into purchased or LineNo. Check and car designations cars All others or built others property accounts leased from others No.
(a) (b) (c) (d) (e) (f) (g)FREIGHT TRAIN CARS
Plain box cars - 40' 36 (B1__, B2__) 36
Plain box cars - 50' longer (B3_0-7, B4_0-7, B5__, B6__,
37 B7__, B8__) 37Equipped box cars
38 (All Code A, Except A_5_) 38Plain gondola cars
39 (All Codes, G & J__1,J__2,J__3,J__4) 39Equipped gondola cars
40 (All Code E) 40Covered hopper cars
41 (C__1, C__2, C__3, C__4) 41Open top hopper cars--general service
42 (All Code H) 42Open top hopper cars--special service
43 (J__0,J__5, J__6, J__7, J__8, J__9, and K) 43Refrigerator cars -- mechanical
44 (R_5_, R_6_, R_7_, R_8_, R_9_) 44Refrigerator cars -- non-mechanical
45 (R_0_, R_1_, R_2_) 45Flat cars -- TOFC/COFC
46 (All Code P, Q and S, Except Q8__) 46Flat cars -- multi-level
47 (All Code V) 47Flat cars -- general service
48 (F10_, F20_, F30_) 48Flat cars -- other (F_1_, F_2_, F_3_, F_4_, F_5_, F_6)
49 (F_8_, F40_) 49Tank cars -- under 22,000 gallons
50 (T__0, T__1, T__2, T__3, T__4, T__5) 50Tank cars -- 22,000 gallons and over
51 (T__6, T__7, T__8, T__9) 51All other freight cars
52 (A_5_, F_7_, All Code L and Q8__) 5253 TOTAL (lines 36 to 52) 0 0 0 0 0 0 5354 Caboose (All Code M-930) 5455 TOTAL (lines 53 and 54) 0 0 0 0 0 0 55

Road Initials: UPRR Year: 2017 99
PTC Supplement to Railroad Annual Report R-1
PTC 710. INVENTORY OF EQUIPMENT - Continued
4. Column (m) should show aggregate capacity for all units reported in Columns (k) and (l), as follows. For freight-train cars,report the nominal capacity (in tons of 2,000 lbs) as provided for in Rule 86 of the AAR Code of Rules Governing Cars inInterchange. Convert the capacity of tank cars to capacity in tons of the commodity which the car is intended to customarily carry.
5. Time-mileage cars refers to freight cars, other than cabooses, owned or held under lease arrangement, whose interline rentalis settled on a per diem and line haul mileage basis under "Code of Car Hire Rules" or would be so settled if used by another railroad.
UNITS OWNED, INCLUDED IN INVESTMENT ACCOUNT, AND LEASED FROM OTHERSChanges during the year Units at Close of Year
(concluded) Total in service of respondentcol. (i) & (j)
Units retired fromservice respondent Aggregate capacity
whether owned of units reportedLine or leased, including Leased from Time-mileage in cols. (k) & (l) LineNo. reclassification Owned and used others cars All other (see ins. 4) Leased to others No.
(h) (i) (j) (k) (l) (m) (n)
36 36
37 37
38 38
39 39
40 40
41 41
42 42
43 43
44 44
45 45
46 46
47 47
48 48
49 49
50 50
51 51
52 5253 0 0 0 0 0 0 0 5354 5455 0 0 0 0 0 0 0 55

100 Road Initials: UPRR Year: 2017
PTC Supplement to Railroad Annual Report R-1
PTC 710. INVENTORY OF EQUIPMENT - Continued
UNITS OWNED, INCLUDED IN INVESTMENT ACCOUNT, AND LEASED FROM OTHERSUnits in service of respondent Changes during the year
at beginning of year Units installedAll other units
including Rebuilt units reclassificationacquired and and second
New units New units rebuilt units hand unitsLine Cross Class of equipment purchased leased from rewritten into purchased or LineNo. Check and car designations Per diem All others or built others property accounts leased from others No.
(a) (b) (c) (d) (e) (f) (g)
FLOATING EQUIPMENT56 Self-propelled vessels 56
(Tugboats, car ferries, etc.)57 Non-self-propelled vessels 57
(Car floats, lighters, etc.)58 TOTAL (lines 56 and 57) 58
HIGHWAY REVENUE EQUIPMENT59 Chassis Z1__, Z67_, Z68_, Z69_ 5960 Dry van U2__, Z__, Z6_, 1-6 6061 Flat bed U3__, Z3__ 6162 Open bed U4__, Z4__ 6263 Mechanical refrigerator U5__, Z5__ 6364 Bulk hopper U0__, Z0__ 6465 Insulated U7__, Z7__ 6566 Tank Z0__, U6__ (See Note) 66
Other trailer and container (Special67 equipped dry van U9__,Z8__,Z9__) 6770 TOTAL (lines 59 and 69) 0 0 0 0 0 0 70
NOTES AND REMARKS
Note: Line 66 (Tank) must have fitting code "CN" to qualify as a tank otherwise it is a bulk hopper.

Road Initials: UPRR Year: 2017 101
PTC Supplement to Railroad Annual Report R-1
PTC 710. INVENTORY OF EQUIPMENT - Concluded
UNITS OWNED, INCLUDED IN INVESTMENT ACCOUNT, AND LEASED FROM OTHERSChanges during the year Units at Close of Year
(Concluded)Total in service of respondent
[col. (i) & (j)]Units retired from
service of respondent Aggregate capacitywhether owned of units reported
Line Cross or leased, including Leased from in cols. (k) & (l) LineNo. Check reclassification Owned and used others Per diem All other (see ins. 4) Leased to others No.
(h) (i) (j) (k) (l) (m) (n)
56 56
57 57
58 58
59 5960 6061 6162 6263 6364 6465 6566 66
67 6770 0 0 0 0 0 0 0 70
NOTES AND REMARKS

102 Railroad Initials: UPRR Year: 2017
PTC Supplement to Railroad Annual Report R-1
PTC 710S. UNIT COST OF EQUIPMENT INSTALLED DURING THE YEAR(Dollars in Thousands)
1. Give particulars as requested, separately, for the various classes of new units and rebuilt units of equipment installed by respondent during the year. Ifinformation regarding the cost of any units installed is not complete at time of filing of report, the units should be omitted, but reference to the number of unitsomitted should be given in a footnote, the details as to cost to be given in the report of the following year. The cost of units under construction at the close ofthe year should not be reflected in this schedule even though part of the cost appears in the property account for the year. Indicate in column (e) whether aninstallation represents equipment purchased (P), built or rebuilt by contract in outside railroad shops (C), or built or rebuilt in company or system shops (S)including units acquired through capitalized leases (L).
2. In column (a) list each class or type of locomotive unit, car, or TOFC/COFC equipment on a separate line. By class is meant the standard classification usedto distinguish types of locomotive units, freight cars or other equipment adopted by the Association of American Railroads, and should include physicalcharacteristics requested by Schedule 710. Locomotive units should be identified as to power source, wheel arrangement, and horsepower per unit, such asmultiple-purpose diesel locomotive A units (B-B), 2500 HP. Cars should be identified as to special construction or service characteristics, such asaluminum-covered hopper car (LO), steel boxcars-special service (XAP), etc. For TOFC/COFC show type of equipment as enumerated in Schedule 710.
3. In column (c) show the total weight in tons of 2,000 pounds. The weight of the equipment acquired should be the weight empty.4. The cost should be the complete cost as entered on the ledger, including foreign line freight charges and handling charges.5. Data for this schedule should be confined to the units reported in Schedule 710, columns (c) and (e) for locomotive units, passenger-train cars and company
service cars and columns (d) and (f) for freight train cars, floating equipment and highway revenue equipment. Disclose new units in the upper section of thisschedule and in the lower section disclose rebuilt units acquired or rewritten into the respondent's accounts. The term "new" as used herein shall mean aunit or units placed in service for the first time on any railroad.
6. All unequipped boxcars acquired in whole or in part with incentive per diem funds should be reported on separate lines and appropriately identified byfootnote or sub-heading.
NEW UNITSMethod of
Line Total weight acquisition LineNo. Class of equipment Number of units (tons) Total cost (see instructions) No.
(a) (b) (c) (d) (e)1 LOCOMOTIVES 12 - - - - 23 - - - - 34 - - - - 45 - - - - 56 FREIGHT CARS 67 - - - - 78 - - - - 89 - - - - 910 - - - - 1011 HIGHWAY REVENUE EQUIPMENT 1112 - - - - 1213 - - - - 1314 - - - - 1415 WORK EQUIPMENT 1516 - - - - 1617 - - - - 1718 - - - - 1819 TOTAL - N/A - - 19
REBUILT UNITS20 LOCOMOTIVES 2021 - - - - 2122 - - - - 2223 - - - - 2324 - - - - 2425 - - - - 2526 - - - - 2627 - - - - 2728 - - - - 2829 - - - - 2930 - - - - 3031 FREIGHT CARS - - - - 3132 - - - - 3233 WORK EQUIPMENT - - - - 3334 - - - - 3435 - - - - 3536 - - - - 3637 TOTAL - N/A - - 3738 - - - - 3839 GRAND TOTAL - N/A - N/A 39
NOTE: Units and dollars will not be reported in this schedule until the full PTC installation is complete, including the final software.
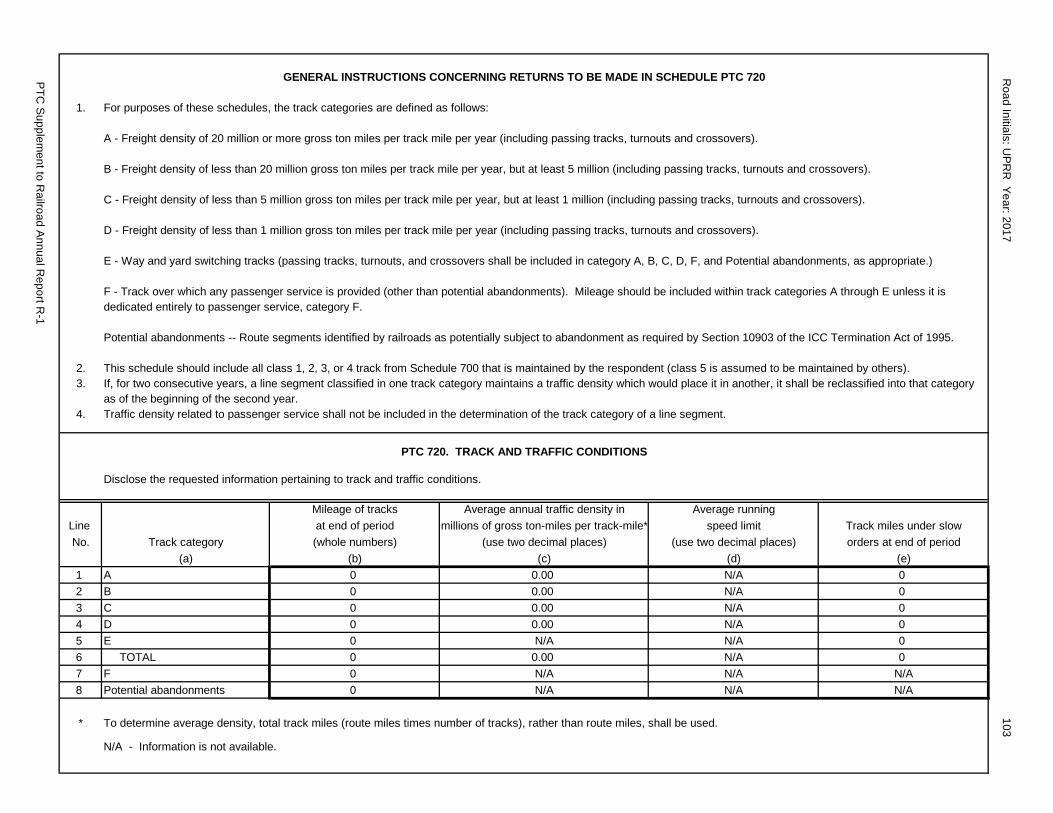
GENERAL INSTRUCTIONS CONCERNING RETURNS TO BE MADE IN SCHEDULE PTC 720
1. For purposes of these schedules, the track categories are defined as follows:
A - Freight density of 20 million or more gross ton miles per track mile per year (including passing tracks, turnouts and crossovers).
B - Freight density of less than 20 million gross ton miles per track mile per year, but at least 5 million (including passing tracks, turnouts and crossovers).
C - Freight density of less than 5 million gross ton miles per track mile per year, but at least 1 million (including passing tracks, turnouts and crossovers).
D - Freight density of less than 1 million gross ton miles per track mile per year (including passing tracks, turnouts and crossovers).
E - Way and yard switching tracks (passing tracks, turnouts, and crossovers shall be included in category A, B, C, D, F, and Potential abandonments, as appropriate.)
F - Track over which any passenger service is provided (other than potential abandonments). Mileage should be included within track categories A through E unless it isdedicated entirely to passenger service, category F.
Potential abandonments -- Route segments identified by railroads as potentially subject to abandonment as required by Section 10903 of the ICC Termination Act of 1995.
2. This schedule should include all class 1, 2, 3, or 4 track from Schedule 700 that is maintained by the respondent (class 5 is assumed to be maintained by others).3. If, for two consecutive years, a line segment classified in one track category maintains a traffic density which would place it in another, it shall be reclassified into that category
as of the beginning of the second year.4. Traffic density related to passenger service shall not be included in the determination of the track category of a line segment.
PTC 720. TRACK AND TRAFFIC CONDITIONS
Disclose the requested information pertaining to track and traffic conditions.
Mileage of tracks Average annual traffic density in Average runningLine at end of period millions of gross ton-miles per track-mile* speed limit Track miles under slowNo. Track category (whole numbers) (use two decimal places) (use two decimal places) orders at end of period
(a) (b) (c) (d) (e)1 A 0 0.00 N/A 02 B 0 0.00 N/A 03 C 0 0.00 N/A 04 D 0 0.00 N/A 05 E 0 N/A N/A 06 TOTAL 0 0.00 N/A 07 F 0 N/A N/A N/A8 Potential abandonments 0 N/A N/A N/A
* To determine average density, total track miles (route miles times number of tracks), rather than route miles, shall be used.
N/A - Information is not available.
PTC Supplem
ent to Railroad Annual R
eport R-1
Road Initials: U
PRR
Year: 2017103
104 Railroad Initials: UPRR Year: 2017
PTC Supplement to Railroad Annual Report R-1
In addition to separating capital expenses and operating expenses incurred by the railroad for PTC the respondent entity shall include by footnotedisclosure here the value of funds received from non-governmental and government transfers to include grants, subsidies, and other contributions or reimbursements that the respondent entity used to purchase or create PTC assets or to offset PTC costs. These amounts represent non-railroad monies that the respondent entity used or designated for PTC and would provide for full disclosure of PTC costs on an annual basis. This disclosure shallidentify the nature and location of the project by FRA identification, if applicable. If FRA identification is not applicable, the disclosure shall identifythe location at the state or regional level.
Line Name of Program Location(s) of the Amount of LineNo. Entity Receiving Funds Entity Dispensing Funds Providing Funding Project Funded Funding Received No.
1 12 23 34 45 56 67 78 89 910 1011 1112 1213 1314 1415 1516 1617 1718 1819 1920 2021 2122 2223 2324 24
NONE
Footnote: PTC Grants(Dollars in Thousands)


106 Road Initials: UPRR Year: 2017
Railroad Annual Report R-1
MEMORANDA(FOR USE OF BOARD ONLY)
CORRESPONDENCE
Date of AnswerLetter, Fax or Date of File Number
Office Addressed Telegram of Subject Answer Letter, Fax, or ofNeeded Telegram Letter, Fax, or
Name Title Month Day Year Page Month Day Year Telegram
CORRECTIONS
Date of Authority ClerkDate Correction Letter, Fax or Officer sending letter, fax or Board Making
Page Telegram of telegram File CorrectionMonth Day Year Month Day Year Name Title Number Name
EXPLANATORY REMARKS

Road Initials: UPRR Year: 2017 107
Railroad Annual Report R-1
Page PageNo. No.
Accumulated depreciation Mileage - Average of road operated 73Road and equipment leased Motorcar car miles 78
From others 36 Motor rail cars owned or leased 66Improvements to 36 Net income 17Owned and used 35 Oath 105
Accumulated Other Comprehensive Income 7 Operating expenses (see Expenses)Accruals - railway tax 55 Revenues (see Revenues)Analysis of taxes 55 Statistics (see Statistics)Application of funds - source 20 Ordinary income 16Balance sheet 6-15D Other Comprehensive Income 17Car, locomotive, and floating equipment - classification 66-71 Private line cars loaded 79Statement of Cash Flows 20-21 Private line cars empty 79Company service equipment 67 PTC Supplement 82-104Compensating balances and short-term borrowing arrangements 58 RailsConsumption of fuel by motive power units 76 Charges to operating expenses 41Contingent assets and liabilities 9 Railway - Operating expenses 41-47Crossties (see Ties) Railway - Operating revenues 16Debt holdings 59 Results of operations 16-17Depreciation base and rates Retained income unappropriated 19
Road and equipment leased Miscellaneous items in accounts for year 12From others 34 RevenuesImprovements to 32-33 Freight 16
Owned and used 34 Passenger 16Electric locomotive equipment at close of year 68 Road and Equipment - Investment in 32-33Equipment - classified 66-71 Improvements to leased property 32-33
Company service 67 Reserve 36Floating 70-71 Owned - Depreciated base and rates 34Freight-train cars 68-69 Reserve 35Highway revenue equipment 70-71 Used - Depreciated base and rates 34Passenger-train cars 66-67 Reserve 35Inventory 66-71 Road - Mileage operated at close of year 63Owned-Not in service of respondent 66 By states and territories 64
Equipment leased, depreciation base and rate Securities (see Investments)
From others 34 Short-term borrowings arrangements - compensating balances and 57
Reserve 36 Sinking funds 7Equipment owned, depreciation base rates 34 Sources and application of working capital 20-21
Reserve 35 Specialized service subschedule 54Expenses - railway operating 41-47 Statement of changes in financial position 20-21Extraordinary items 17 StockFederal income taxes 55 Number of security holders 3Financial position - changes in 20-21 Total voting power 3-4Floating equipment 68-69 Value per share 3Freight cars loaded 78 Voting rights 3Freight-train cars 68-69 Suretyships - Guaranties and 57Freight car-miles 78 Tracks operated at close of year 63Fuel consumed - diesel 76 Miles of, at close of year 66
Cost 76 Track and traffic conditions 73Funded debt (see Debt holdings) Train hours, yard switching 81Guaranties and suretyships 57 Train miles 78Identity of respondent 2 Tons of freight 81Investments in common stock of affiliated companies 30 Ton-miles of freight 81Investments and advances of affiliated companies 26-29 TOFC/COFC number of revenue trailers and containers - loaded 81Railway property used in transportation service 38-39 Voting powers and elections 3Road and equipment 32-33
Changes during year 32-33Leased property - improvements made during the year 32-33
Locomotive equipment 66Electric and other 66Consumption of diesel fuel 66
Locomotive unit miles 78
INDEX