Embed Size (px)
Citation preview
BNSF Railway Company Leased Lines and Wholly-Owned Subsidiaries
2550 Lou Menk Drive AGAA - R1
Fort Worth, Texas 76131
RA/LVVAY
Class I Railroad Annual Report
To The Surface Transportation Board For the Year Ending December 31, 2005

NOTICE
1. This report is required for every class I railroad operating within the United States. Three copies of this Annual Report should be completed. Two of the copies must be filed with the Surface Transportation Board, Office of Economics, Environmental Analysis, and Administration, The Mercury Building, 1925 K St. N.W., Suite 500, Washington, DC 20423, by March 31 of the year following that for which the report is made. One copy should be retained by the carrier.
2. Every inquiry must be definitely answered. Where the word "none" truly and completely states the fact, it should be given as the answer. If any inquiry is inapplicable, the words "not applicable" should be used.
3. Wherever the space provided in the schedules in insufficient to permit a full and complete statement of the requested information, inserts should be prepared and appropriately identified by the number of the schedule.
4. All entries should be made in a permanent black ink or typed. Those of a contrary character must be indicated in parenthesis. Items of an unusual character must be indicated by appropriate symbols and explained in footnotes.
5. Money items, except averages, throughout the annual report form should be shown in thousands of dollars adjusted to accord with footings. Totals for amounts reported in subsidiary accounts included in supporting schedules must be in agreement with related primary accounts. For purposes of rounding, amounts of'$500 but less than $1,000 should be raised to the nearest thousand dollars, and amounts ofless than $500 should be lowered.
6. Except where the context clearly indicates some other meaning, the following terms when used in this Form have the following meanings:
(a) Board means Surface Transportation Board. (b) Respondent means the person or corporation in whose behalf the report is made. ( c ) Year means the year ended December 31 for which the report is being made. (d) Close of the Year means the close of business on December 3lfor the year in which the report is being
made. If the report is made for a shorter period than one year, it means the close of the period covered by the report. ( e) Beginning of the Year means the beginning of business on January 1 of the year for which the report is
being made. If the report is made for a shorter period than one year, it means the beginning of that period. (I) Preceding Year means the year ended December 31 of the year preceding the year for which the report
is made. (g) The Uniform System of Accounts for Railroad Companies means the system of accounts in Part I 201 of
Title 49, Code of Federal Regulations. as amended.
7. The ICC Termination Act of 1995 abolished the Interstate Commerce Commission and replaced it with the Surface Transportation Board. Any references to the Interstate Commerce Commission or Commission contained in this report refer to the Surface Transportation Board.
8. Any references to the Bureau of Accounts or the Office of Economics contained in this report refer to the Office of Economics, Environmental Analysis, and Administration of the Surface Transportation Board.
9. NOTE - An additional line has been added to Schedule 755 (Line 134) effective with the 2004 R-1. Also note that the instructions for completion of Schedule 755 now have two additional items (Instructions U and V).
10. NOTE - The columns in Schedule 710-Distribution of Locomotive Units In Service of Respondent At Close Of Year, Disregarding Year Of Rebuilding have been revised to reflect new five year periods.
11. NOTE - The following supplemental information about STB information collections is provided in compliance with OMB requirements and pursuant to the Paperwork Reduction Act of 1995, 44 U.S.C. 3501et seq.:
Supplemental Information about the Annual Report (R-1)

This information collection is mandatory pursuant to 49 U.S.C. 11145.
The estimated hour burden for filing this report is less than 800 hours.
Information in the Annual Reports is used to monitor and assess railroad industry growth, financial stability, traffic, and operations and to identify industry changes that may affect national transportation policy. In addition, the Board uses data from these reports to more effectively carry out regulatory responsibilities, such as acting on railroad requests for authority to engage in Board regulated financial transactions (for example, mergers, acquisitions of control, consolidations, and abandonments); conducting investigations and rulemakings; conducting rail revenue adequacy proceedings; developing rail cost adjustment factors; and developing the URCS, which is a cost measurement methodology. URCS was developed by the Board pursuant to 49 U .S.C. 11161 and is used as a tool in rail rate proceedings to calculate the variable costs associated with providing a particular service in accordance with 49 U.S.C. 10707(d). The Board also uses URCS to analyze the information that it obtains through the annual railroad industry waybill sample, see 49 CFR 1244, and in railroad abandonment proceedings to measure off-branch costs, pursuant to 49 U.S.C. 10904(a) and in accordance with 49 CFR 1152.32(n).
The information in this report is ordinarily maintained by the agency in hard copy for 10 years, after which it is transferred to the National Archives, where it is maintained as a permanent record. These reports are also maintained by the agency indefinitely on microfiche. In addition, some of this information is posted on the Board's website, www.stb.dot.gov, where it may remain indefinitely. All information collected through this report is available to the public.
The OMB control number for this collection is 2140-0009. The display of a currently valid OMB control number is required by law.
Supplemental Information about the Quarterly Condensed Balance Sheet (CBS)
This information collection is mandatory under 49 CFR 1243.2.
The estimated hour burden for filing this report is six hours per report.
The Board uses the information in this report to ensure competitive, efficient, and safe transportation through general oversight programs that monitor and forecast the financial and operating condition of railroads, and through specific regulation of railroad-rate and service issues and rail-restructuring proposals, including railroad mergers, consolidations, acquisitions of control, and abandonments. Information from the reports is used by the Board, other Federal agencies, and industry groups, including the Association of American Railroads, to assess industry growth and operations, detect changes in carrier financial stability, and identify trends that may affect the national transportation system.
Information from these reports is compiled by the Board and published on its website, www.stb.dot.gov, where it may be maintained indefinitely. The compilation report is entitled Class I Railroads. Selected Earning Data. In addition, paper copies of individual reports are maintained by the Board for ten years, after which they are destroyed. All information collected through this report is available to the public.
The display of a currently valid OMB control number for this collection is required by law.
Supplemental Information about the Quarterly Report of Revenues, Expenses, and Income (Form RE&I)
This information collection is mandatory pursuant to 49 U.S.C. 11164 and 49 CFR 1243.1.
The estimated hour burden for fl ling this report is six hours per report.

The Board uses the information in this report to ensure competitive, efficient, and safe transportation through general oversight programs that monitor and forecast the financial and operating condition of railroads, and through regulation of railroad rate and service issues and rail restructuring proposals, including railroad mergers, consolidations, acquisitions of control and abandonments. Information from the reports is used by the Board, other Federal agencies and industry groups to monitor and assess industry growth and operations, detect changes in carrier financial stability, and identify trends that may affect the national transportation system. Individual and aggregate carrier information is needed in our decision making process.
Information from these reports is compiled by the Board and published on its website.www.stb.dot.gov. where it may be maintained indefinitely. The compilation report is entitled Class I Railroads. Selected Earnings Data. In addition, paper copies of individual reports are maintained by the Board for ten years, after which they are destroyed. All information collected through this report is available to the public.
The display of a currently valid OMB control number for this collection is required by law.
Supplemental Information about the Report of Railroad Employees, Service, and Compensation (Wage Forms A& B)
This information collection is mandatory pursuant to 49 D.S.C. 11145 and 49 CFR 1245.2.
The estimated hour burden for filing this report is 30 hours per quarterly report and 40 hours per annual report.
The Board uses information in this report to forecast labor costs and measure the efficiency of the reporting railroads. The information is also used by the Board to evaluate proposed regulated transactions that may impact rail employees. These transactions include mergers and consolidations, acquisitions of control, purchases, and abandonments. Other Federal agencies and industry groups, including the Railroad Retirement Board, the Bureau of Labor Statistics, and the Association of American Railroads, depend on the information contained in the reports to monitor railroad operations.
Certain information from the reports is compiled and published on the Board's website,www.stb.dot.gov. where it may be maintained indefinitely. In addition, paper copies of individual reports are maintained by the Board for ten years, after which they are destroyed. All information collected through this report is available to the public.
The OMB control number for this collection is 2140-0004. The display of a currently valid OMB control number is required by law.
Supplemental Information about the Monthly Report of Number of Employees of Class I Railroads (Wage FormC)
This information collection is mandatory pursuant to 49 D.S.C. 11145 and 49 CFR 1246.1.
The estimated hour burden for filing this report is 1.25 hours per monthly report.
The Board uses information in this report to forecast labor costs and measure the efficiency of the reporting railroads. The information is also used by the Board to evaluate proposed regulated transactions that may impact rail employees, including mergers and consolidations, acquisitions of control, purchases, and abandonments. Other Federal agencies and industry groups, including the Railroad Retirement Board, the Bureau of Labor Statistics, and the Association of American Railroads, depend on the information contained in the reports to monitor railroad operations.

The information in this report is compiled and published on the Board's website, www .stb.dot.gov, where it may be maintained indefinitely. In addition, paper copies of individual reports are maintained by the Board for ten years, after which they are destroyed. All information collected through this report is available to the public.
The OMB control number for this collection is 2140-0007. The display ofa currently valid OMB 'Control number is required by law.
Supplemental Information about the Annual Report of Cars Loaded and Cars Terminated (Form STB-54)
This information collection is mandatory pursuant to 49 U.S.C. 11162 and 49 CFR 1247.
The estimated hour burden for filing this report is four hours per report.
The Board uses information in this report to forecast labor costs and measure the efficiency of the reporting railroads. Information in this report is entered into the Board's URCS. In addition, many other Federal agencies and industry groups, including the Department of Transportation and the Association of American Railroads (AAR), depend on Form STB-54 for information regarding the number of cars loaded and terminated on the reporting carrier's line.
All information collected through this report is available to the public. Paper copies of individual reports are maintained by the Board for ten years, after which they are destroyed.
The OMB control number for this collection is 2140-0011. The display of a currently valid OMB control number is required by law.
Supplemental Information about the Quarterly Report of Freight Commodity Statistics (Form QCS)
This information collection is mandatory pursuant to 49 U.S.C. 11145 and 49 CFR 1248.
The estimated hour burden for filing this report is 217 hours per report.
Information in this report is entered into the Board's URCS.
All information collected through this report is available to the public. Paper copies of individual reports are maintained by the Board for ten years, after which they are destroyed.
The OMB control number for this collection is 2140-0001. The display ofa currently valid OMB control number is required by law.
For Index, See Back of Form
Road Initials· BNSF Year 2005
ANNUAL REPORT
OF
BNSF RAILWAY COMPANY
TO THE
SURFACE TRANSPORTATION BOARD
FOR THE
YEAR ENDED DECEMBER 31, 2005
Name, official title, telephone number, and office address of officer in charge of correspondence with the Board regarding this report.
(Name) Paul W. Bischler (Title) Assistant Vice President & Controller
(Telephone number) -..,..,~<8_1_7)~,..---------,,,,,.....,...-35.,....2_-4_9_4_0____,,____,.---(Area code) (Telephone number)
(Office address) 2500 Lou Menk Dr- 2nd Floor, Fort Worth, Texas 76131 (Street and number, City, State, and ZIP code)

THIS PAGE INTENTIONALLY LEFT BLANK

Road Initials: BNSF Year2005
Schedules Omitted by Respondent Identity of Respondent Voting Powers and Elections Comparative Statement of Financial Position Results of Operations Retained Earnings - Unappropriated Capital Stock Statement of Changes in Financial Position Working Capital Information
Investments and Advances Affiliated Companies Investments in Common Stocks of Affiliated Companies
TABLE OF CONTENTS
Road Property and Equipment and Improvements to Leased Property and Equipment Depreciation Base and Rates-Road and Equipment Owned and Used and Leased from Others Accumulated Depreciation - Road and Equipment Owned and Used Accrued Liability - Leased Property Depreciation Base and Rates - Improvements to Road and Equipment Leased from Others Accumulated Depreciation - Improvements to Road and Equipment Leased from Others Depreciation Base and Rates - Road and Equipment Leased to Others Accumulated Depreciation - Road and Equipment Leased to Others Investment in Railroad Property Used in Transportation Service (By Company) Investment in Railway Property Used in Transportation Service (By Property Accounts)
Railway Operating Expenses Way and Structures Rents for Interchanged Freight Train Cars and Other Freight - Carrying Equipment Supporting Schedule - Equipment Supporting Schedule - Road Specialized Service Subschedule -Transportation Supporting Schedule -Capital Leases Analysis of Taxes Items in Selected Income and Retained Earnings Accounts for the Year
Guaranties and Suretyships Compensating Balances and Short-Term Borrowing Arrangements Separation of Debtholdings between Road Property and Equipment Transactions Between Respondent and Companies or Persons Affiliated with Respondent for Services
Received or Provided
Mileage Operated at Close of Year Miles of Road at Close of Year - By States and Territories (Single Track) Inventory of Equipment Unit Cost of Equipment Installed During the Year Track and Traffic Conditions Ties Laid in Replacement Ties Laid in Additional Tracks and in New Lines and Extensions Rails Laid in Replacement Rails Laid in Additional Tracks and in New Lines and Extensions Weight of Rail Summary of Track Replacements Consumption of Fuel by Motive - Powered Units Railroad Operating Statistics
Verification Memoranda Index
Railroad Annual Report R-1
SCHEDULE PAGE
A 1 B 2 c 3
200 5 210 16 220 19 230 20 240 21 245 23
310 26 310A 30 330 32 332 34 335 35 339 36 340 37 342 38 350 40 351 41
352A 42 352B 43
410 45 412 52 414 53 415 56 416 58 417 60 418 61 450 63 460 65
501 66 502 67 510 69
512 72
700 74 702 75 710 78
710S 84 720 85 721 86 722 87 723 88 724 89 725 90 726 91 750 91 755 94
98 99
100

THIS PAGE INTENTIONALLY LEFT BLANK

Road Initials: BNSF Year2005
SPECIAL NOTICE
Docket No. 38559 Railroad Classification Index, (ICC served January 20, 1983), modified the reporting requirements for Class II, Class Ill and Switching and Terminal Companies. These carriers will notify the Board only if the calculation results in a different revenue level than its current classification.
The dark borders on the schedules represents data that are captured by the Board.
It is estimated that an average of 800 burden hours per response are required to complete this collection of information. This estimate includes time for reviewing instructions, searching existing data sources, gathering and maintaining the data needed, and completing and reviewing the collection of information. Comments concerning the accuracy of this burden estimate or suggestions for reducing this burden should be directed to the Office of the Secretary, Surface Transportation Board.
Railroad Annual Report R-1

Road Initials· BNSF Year2005
A. SCHEDULES OMITTED BY RESPONDENT
1. The respondent, at its option, may omit pages from this report provided there is nothing to report or the schedules are not applicable.
2. Show below the pages excluded, as well as the schedule number and title, in the space provided below. 3. If no schedules were omitted indicate "NONE."
Paae Schedule No. Title
NONE
Railroad Annual Report R-1

2 Road Initials· BNSF
B. IDENTITY OF RESPONDENT
Answers to the questions asked should be made in full, without reference to data returned on the corresponding page of previous reports. In
case any changes of the nature referred to under Inquiry 4 on this page have taken place during the year covered by this report, they should be
explained in full detail.
1. Give the exact name of the respondent in full. Use the words, "The" and "Company" only when they are parts of the corporate name. Be careful
to distinguish between railroad and railway. The corporate name should be given uniformly throughout the report, notably on the cover, on the tiUe
page, and in the "Verification.• If the report is made by receivers, trustees, a committee of bondholders, or Individuals otherwise in possession of
the property, state names and facts with precision. If the report is for a consolidated group, pursuant to Special Permission from the Board,
indicate such fact on line 1 below and list the consolidated group on page 4.
2. If incorporated under a special charter, give date of passage of the act; if under a general law, give date of filing certificate of organization; if a
reorganization has been effected, give date of reorganization. If a receivership or other trust, also give date when such receivership or other
possession began. If a partnership, give date of formation and also names in full of present partners.
3. State the occasion for the reorganization, whether by reason of foreclosure of mortgage or otherwise, according to the fact. Give date of
organization of original corporation and refer to laws under which organized.
1. Exact Name of common carrier making this report:
BNSF Railwav Comoanv
2. Date of Incorporation:
January 13, 1961
3. Under laws of what Government, State or Territory organized? If more than one, name all. If in bankruptcy, give court of jurisdiction and dates
of beginning of receivership and of appointment of receivers or trustees:
Oroanized under the orovisions of the General Comoration Law of the State of Delaware.
4. If the respondent was reorganized during the year, involved in a consolidation or merger, or conducted Its business under a different name, give
full particulars:
STOCKHOLDERS' REPORTS
5. The respondent is required to send the Office of Economic and Environmental Analysis, immediately upon preparation, two copies of its latest
annual report to stockholders.
Check appropriate box:
( ) Two copies are attached to this report.
( ) Two copies will be submitted on: -----------------------------------(date)
(X) No annual report to stockholders is prepared.
Two copies of the Burlington Northern Santa Fe Corporation Annual Report to Shareholders are attached.
Two copies of BNSF Railway Company SEC Form 10-K are attached.
Year2005
Railroad Annual Report R-1
Road Initials· BNSF Year2005 3
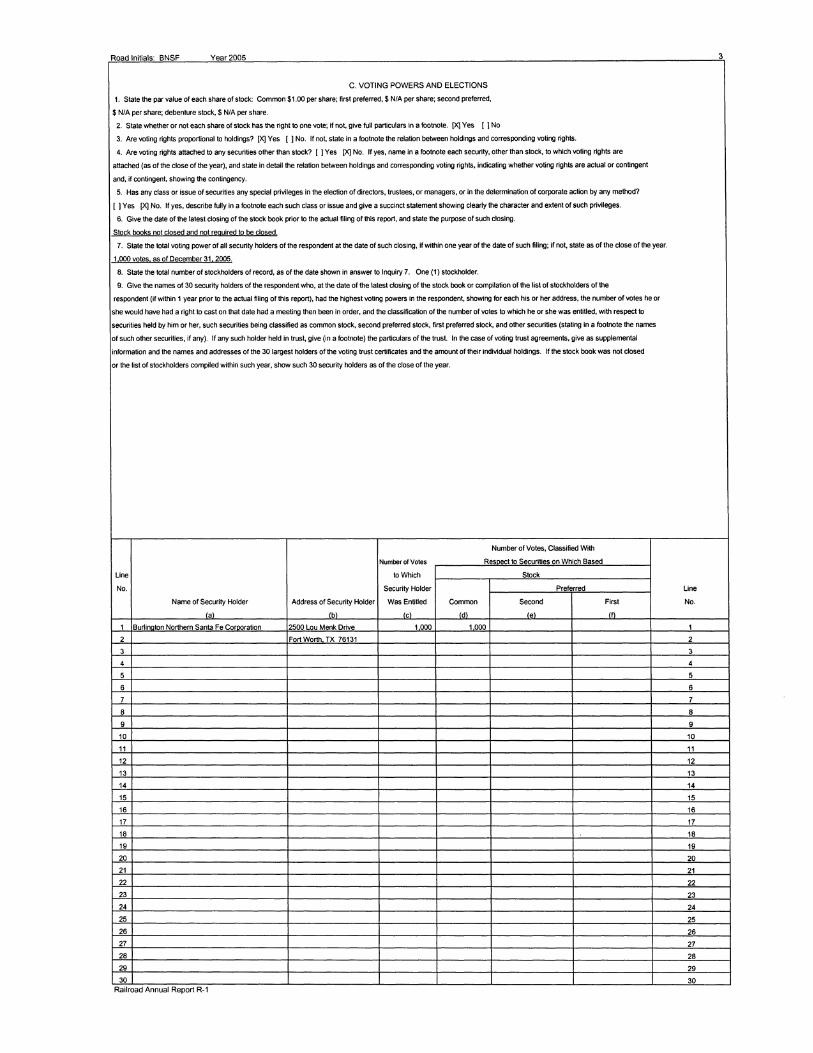
C. VOTING POWERS AND ELECTIONS
1. State the par value of each share of stock: Common $1.00 per share; first preferred,$ NIA per share; second preferred,
S NIA per share; debenture stock, $ NIA per share.
2. State whether or not each share of stock has the right to pne vote; If not, give lull particulars In a footnote. [X] Yes [ JNo
3. Are voting rights proportional to holdings? [X) Yes [ J No. If not, state in a footnote the relation between holdings and corresponding voting rights.
4. Are voting rights attached to any securities other than stock? [ J Yes [X] No. If yes, name In a footnote each security, other than stock, to which voting rights are
attached (as of the close of the year), and state in detail the relation between holdings and corresponding voting rights, Indicating whether voting rights are actual or contingent
and, if contingent, showing the contingency.
5. Has any class or issue of securities any special privileges in the election of directors, trustees, or managers, or in the determination of corporate action by any method?
[ J Yes [X] No. If yes, describe fully In a footnote each such class or issue and give a succinct statement showing cleariy the character and extent of such privileges.
6. Give the date of the latest closing of the stock book prior to the actual filing of this report, and state the purpose of such closing.
S!Q~k ~~ DQt dos~ and !]Qt reguir~d to ~ dosed.
7. State the total voting power of all security holders of the respondent at the date of such closing, if within one year of the date of such ftllng; If not, stale as of the close of the year.
1 000 vol§ i!li gf0!!£~mb~r 31, 2005.
8. State the total number of stockholders of record, as of the date shown in answer to Inquiry 7. One (1) stockholder.
9. Give the names of 30 security holders of the respondent who, at the date of the latest closing of the stock book or compilation of the list of stockholders of the
respondent (If within 1 year prior to the actual filing of this report), had the highest voting powers in the respondent, showing for each his or her address, the number of votes he or
she would have had a right to cast on that date had a meeting then been in order, and the classification of the number of votes to which he or she was entitied, with respect lo
securities held by him or her, such securities being classified as common stock, second preferred stock, first preferred stock, and other securities (stating In a footnote the names
of such other securities, If any). If any such holder held in trust, give (in a footnote) the particulars of the trust. In the case of voting trust agreements, give as supplemental
information and the names and addresses of the 30 largest holders of the voting trust certificates and the amount of their individual holdings. If the stock book was not closed
or the list of stockholders compiled within such year, show such 30 security holders as of the close of the year.
Number of Votes, Classified With
Number of Votes Res--~ to Securities on Which Based
Line to Which Stock
No. Security Holder Preferred Line
Name of Security Holder Address of Security Holder WasEntitied Common Second First No.
la\ lb\ ic1 Id\ 'e' If\
1 Burilnoton Northern Santa Fe Cornoration 2500 Lou Menk Drive 1 000 1000 1
2 Fort Worth TX 76131 2
3 3
4 4
5 5
6 6
7 7
8 8
9 9
10 10
11 11
12 12
13 13
14 14
15 15
16 16
17 17
18 18
19 19
20 20
21 21
22 22
23 23
24 24
25 25
26 26
27 27
28 28
29 29
30 30 Railroad Annual Report R-1

4
C. VOTING POWERS AND ELECTIONS -Continued
10. State the total number of votes cast at the latest general meeting for the election of directors of the respondent: "Not Applicable"
Refer to note shown under inquiry 9.
11. Give the date of such meeting: "Not Applicable" - Refer to note shown under inquiry 9.
12. Give the place of such meeting: "Not Applicable" - Refer to note shown under inquiry 9.
NOTES AND REMARKS
Consolidated Subsidiaries:
BNSF Railway Company
Dodge City & Cimarron Valley Railroad
Rio Grande, El Paso and Santa Fe Railroad
Santa Fe Terminal Services, Inc.
Los Angeles Junction Railroad
Oklahoma City Junction Railway Company
Star Lake Railroad Company
Santa Fe Receivables Corp
Transportation Group Management, Inc
The Zia Company
Sunset Communications Company
Santa Fe Pacific Pipeline Holdings, Inc.
BNSF Manitoba, Inc.
BNSF de Mexico SA de CV
Pine Canyon Land Company
Santa Fe Pacific Insurance Company
Santa Fe Pacific Railroad Company
BNSF British Columbia, Ltd
BNSF Properties
BN Manitoba, Ltd
Western Fruit Express Company
BN Dock Corporation
BNRR Holdings
Winona Bridge Railway Company
Burlington Northern International Serlvces, Inc.
Buriington Nor1hem Leasing Corp, Inc.
INB Corporation
Midwest Northwest Property Inc.
BNSF Equipment Acquisition Co. LLC
Bayrail, LLC
Bayport Systems, Inc.
Inactive Subsidiaries:
Electro Northern, Inc.
M-R Holdings Acquisition Company
Nor1hem Radio Limited (British Columbia)
Road Initials: BNSF Year2005
Railroad Annual Report R-1

Road Initials: BNSF Year2005 5 200. COMPARATIVE STATEMENT OF FINANCIAL POSITION· ASSETS
(Dollars in Thousands)
Line Cross Account Title Balance at close Balance at begin- Line
No. Check of year ing of year No.
(a) (b) (c)
Current Assets
1 701 Cash 24,245 321,442 1
2 702 Temporarv cash investments - - 2
3 703 Special deposits - - 3
Accounts receivable - -4 704 - Loan and notes - - 4
5 705 - Interline and other balances 104,543 54,024 5
6 706 -Customers 506,901 168,663 6
7 707 -Other 44,026 4,256 7
8 709, 708 - Accrued accounts receivables 43,935 24,016 8
9 708.5 - Receivables from affiliated companies - - 9
10 709.5 - Less: Allowance for uncollectible accounts (41,739) (85,639) 10
11 710, 711, 714 Working funds prepavments deferred income tax debits 234,164 326,080 11
12 712 Materials and supplies 396,293 338,527 12
13 713 Other current assets 593,554 521,424 13
14 TOTAL CURRENT ASSETS 1,905,922 1,672,793 14
Other Assets
15 715, 716, 717 Special funds 17,569 11,332 15
16 721, 721.5 Investments and advances affiliated companies 16
(Schs. 310 and 310A) 2,903,079 2,127,759
17 722, 723 Other investments and advances 17
18 724 Allowances for net unrealized loss on noncurrent 18
marketable equitv securities - Cr. - -19 737, 738 Property used in other than carrier operation 19
(Less depreciation) 65,532 65,577
20 739, 741 Other assets 412,324 420,531 20
21 743 Other deferred debits 1,252,946 1,067,930 21
22 744 Accumulated deferred income tax debits - - 22
23 TOTAL OTHER ASSETS 4,651,450 3,693,129 23
Road and Equipment
24 731,732 Road (Sch. 330) L-30Col h &b 27,314,996 25,872,606 24
25 731, 732 Equipment (Sch 330) L-39Col h &b 5,718,804 5,693,291 25
26 731, 732 Unallocated items 534,877 430,052 26
27 733, 735 Accumulated depreciation and amortization 27
(Schs.335,342,351) (7,350,734) (6,587,481)
28 Net Road and Equipment 26,217,943 25,408,468 28
29 * TOTAL ASSETS 32,775,315 30,774,390 29
NOTES AND REMARKS
Railroad Annual Report R-1

6 Road Initials: BNSF Year2005
200. COMPARATIVE STATEMENT OF FINANCIAL POSITION· LIABILITIES AND SHAREHOLDERS' EQUITY
(Dollars in Thousands)
Line Cross Account Title Balance at close Balance at begin- Line
No. Check of year ing of year No.
(a) (b) (c)
Current Liabilities
30 751 Loans and notes payable 30
31 752 Accounts payable: interline and other balances 83,736 80,034 31
32 753 Audited accounts and wages 223,073 193,033 32
33 754 Other accounts oavable 151,425 123,648 33
34 755, 756 Interest and dividends payable 29,842 29,347 34
35 757 Payables to affiliated companies 22,855 1,313 35
36 759 Accrued accounts payable 1,647,157 1,471,446 36
37 760, 761, 761.5 37
762 Taxes accrued 643,604 423,330
38 763 Other current liabilities 72,986 21,832 38 39 764 Equipment obligations and other long-term debt 39
due within one year 456,129 159,595
40 TOTAL CURRENT LIABILITIES 3,330,807 2,503,578 40 Non-Current Liabilities
41 765,767 Funded debt unmatured 456,401 741,751 41
42 766 Equipment obliaations 357,367 421,300 42
43 766.5 Capitalized lease obliaations 495,240 538,147 43
44 768 Debt in default - - 44
45 769 Accounts payable: affiliated companies - - 45
46 770.1, 770.2 Unamortized debt premium (30,233 (31,793) 46
47 781 Interest in default - - 47
48 783 Deferred revenues - transfers from govt. authorities 376,577 350,520 48
49 786 Accumulated deferred income tax credits 7,814,728 7,754,987 49 50 771, 772, 774, 50
775,782, 784 Other long-term liabilities and deferred credits 2,558,952 2,763,088
51 TOTAL NON-CURRENT LIABILITIES 12,029,032 12,538,000 51 Shareholders' Equity
52 791, 792 Total capital stock 1 1 52
53 Common stock 1 1 53
54 Preferred stock - - 54
55 Discount on caoital stock - - 55
56 794, 795 Additional capital 6,285,726 6,285,726 56 Retained earnings:
57 797 Appropriated - - 57
58 798 Unappropriated 11,129,749 9,447,085 58 59 798.1 Net unrealized loss on noncurrent marketable 59
eauity securities - -60 798.5 Less treasurv stock - - 60
61 Net stockholders equitv 17,415,476 15,732,812 61 62 TOTAL LIABILITIES AND SHAREHOLDERS EQUITY 32,775,315 30,774,390 62
NOTES AND REMARKS
Railroad Annual Report R-1

Road Initials: BNSF Year2005 200. COMPARATIVE STATEMENT OF FINANCIAL POSITION - EXPLANATORY NOTES
(Dollars in Thousands)
The notes listed below are provided to disclose supplementary information on matters which have an important effect on the financial condition of the carrier. The carrier shall give the particulars called for herein and where there is nothing to report, insert the word "none"; and in addition thereto shall enter in separate notes with suitable particulars other matters involving material amounts of the character commonly disclosed in financial statements under generally accepted accounting principles, except as shown in other schedules. This includes statements explaining (1) service interruption insurance policies and indicating the amount of indemnity to which respondent will be entitled for work stoppage losses and the maximum amount of additional premium respondent may be obligated to pay in the event such losses are sustained by other railroads; (2) particulars concerning obligations for stock purchase options granted to officers and employees; and (3) what entries have been made for net income or retained income restricted under provisions of mort!la!les and other arran!lements.
1. Amount (estimated, if necessary) of net income or retained income which has to be provided for capital expenditures, and for sinking funds, pursuant to provisions of reorganization plans, mortgages, deeds of trust, or other contracts. $ None
2. Estimated amount of future earnings which can be realized before paying Federal income taxes because of unused and available net operating loss carryover on January 1 of the year following that for which the report is made. $ None
3. (a) Explain the procedure in accounting for pension funds and recording in the accounts the current and past service pension costs, indicating whether or not consistent with the prior year.
See Note 2 on page 9 - 13
(b) State amount, if any, representing the excess of the actuarially computed value of vested benefits over the total of the pension fund. See Note 2 on page 9 -13
(c) Is any part of the pension plan funded? Specify. Yes x No
If funding is by insurance, give name of insuring company None
If funding is by trust agreement, list trustee(s) Northern Trust Company Date of trust agreement or latest amendment June 21, 1996 If respondent is affiliated in any way with the trustee(s), explain affiliation: Not Affiliated See Note 1 on page 9
(d) List affiliated companies which are included in the pension plan funding agreement and describe basis for allocating charges under the agreement.
See Note 2 on page 9- 13
(e) Is any part of the pension plan fund invested in stock or other securities of the respondent or its affiliates? Specify Yes If yes, give number of the shares for each class of stock or other security.
Are voting rights attached to any securities held by the pension plan? Specify Yes If yes, who determines how stock is voted?
No X
No X
4. State whether a segregated political fund has been established as provided by the Federal Election Campaign Act of 1971 (18 U.S.C. 610). Yes X No
5. (a) The amount of employer's contribution to employee stock ownership plans for the current year was $ None
(b) The amount of investment tax credit used to reduce current income tax expense resulting from contributions to qualified employee stock ownership plans for the current year was $ None
6. In reference to Docket 37 465, specify the total amount of business entertainment expenditures charged to the non-operating expense account. $ None
Continued on following page Railroad Annual Report R-1
7

8 Road Initials: BNSF Year 2005 200. COMPARATIVE STATEMENT OF FINANCIAL POSITION - EXPLANATORY NOTES - Continued
7. Give particulars with respect to contingent assets and liabilities at the close of the year, in accordance with instruction 5-6 in the Uniform
System of Accounts tor Railroad Companies, that are not reflected in the amounts of the respondent.
Disclose the nature and amount of contingency that is material.
Examples of contingent liabilities are items which may become obligations as a result of pending or threatened litigation, assessments or
possible assessments of additional taxes, and agreements or obligations to repurchase securities or property. Additional pages may be
added if more space is needed. (Explain and/or reference to the following pages.)
See Note 3 on pages 13 -15 and Note 5 on pages 15D -15J
(a) Changes in valuation accounts.
8. Marketable equity securities.
None
Dr. (Cr.) Dr. (Cr.) to
Cost Market to Income Stockholder's Equity
(Current Yr.) Current Portfolio N/A N/A N/A N/A
as of I I Noncurrent Portfolio N/A NIA N/A N/A
(Previous Yr.) Current Portfolio N/A N/A N/A N/A
as of I I Noncurrent Portfolio N/A NIA N/A N/A
(b) At 12/31/05, gross unrealized gains and losses pertaining to marketable equity securities were as follows:
Gains Losses
Current $0 $0
Noncurrent $0 $0
(c) A net unrealized gain (loss) of$ 0 on the sale of marketable equity securities was included in net income tor 2005.
The cost of securities was based on the N/A (method) cost of all the shares of each security held at time of sale.
Significant net realized and net unrealized gains and losses arising after date of the financial statements but prior to the filing, applicable to
marketable equity securities owned at balance sheet date shall be disclosed below: None
NOTE: 12 / 31 I 05 Balance sheet date of reported year unless specified as previous year.
Railroad Annual Report R-1

Note 1
The Company
200. COMPARATIVE STATEMENT OF FINANCIAL POSITION-EXPLANTORY NOTES-Continued
NOTES TO FINANCIAL STATEMENTS
BNSF Railway Company and its majority-owned subsidiaries, (collectively, BNSF Railway or Company) is a wholly-owned
subsidiary of Burlington Northern Santa Fe Corporation (BNSF). BNSF Railway operates one of the largest railroad networks in
North America with approximately 32,000 route miles covering 28 states and two Canadian provinces. Through one operating
transportation services segment, BNSF Railway transports a wide range of products and commodities including Consumer
Products, Industrial Products, Coal and Agricultural Products.
BNSF Railway was formerly known as the Burlington Northern Railroad Company (BNRR). On December 31, 1996, The
Atchison, Topeka and Santa Fe Railway Company (ATSF) merged with and into BNRR and the name of the surviving entity, BNRR,
was changed to The Burlington Northern and Santa Fe Railway Company. On January 2, 1998, BNSF Railway's parent, Santa Fe
Pacific Corporation (SFP), merged with and into BNSF Railway. On January 20, 2005, The Burlington Northern and Santa Fe
Railway Company changed its name to BNSF Railway Company.
Note 2
Retirement Plans and Other Post-Employment Benefit Plans
BNSF sponsors a funded, noncontributory qualified BNSF Retirement Plan, which covers substantially all non-union
employees, and an unfunded BNSF Supplemental Retirement Plan, which covers certain officers and other employees. The benefits
under these pension plans are based on years of credited service and the highest consecutive sixty months of compensation for the
last ten years of salaried employment with BNSF. BNSF's funding policy is to contribute annually not less than the regulatory
minimum and not more than the maximum amount deductible for income tax purposes with respect to the funded plan.
Certain salaried employees of BNSF Railway that have met age and years of service requirements are eligible for life
insurance coverage and medical benefits, including prescription drug coverage, during retirement. The retiree medical plan is
contributory and provides benefits to retirees, their covered dependents and beneficiaries. Retiree contributions are adjusted
annually. The plan also contains fixed deductibles, coinsurance and out-of-pocket limitations. The basic life insurance plan is
noncontributory and covers retirees only. Optional life insurance coverage is available for some retirees; however, the retiree is
responsible for the full cost. BNSF Railway's policy is to fund benefits payable under the medical and life insurance plans as they
come due. Generally, employees beginning salaried employment with BNSF Railway subsequent to September 22, 1995, are not
eligible for medical benefits during retirement.
Components of the net cost (benefit) for these plans were as follows (in millions):
Pension Benefits Health and Welfare Benefits
Year Ended December 31, 2005 2004 2003 2005 2004 2003
Service cost $ 20 $ 19 $ 17 $ 2 $ 3 $ 4
Interest cost 95 97 100 17 20 22
Expected return on plan assets (102) (113) (123)
Actuarial loss 25 12 3 5 8
Net amortization and deferred amounts (8) (4) (2)
Net cost (benefit) recognized $ 38 $ 15 $ (3) $ 11 $ 24 $ 32
Railroad Annual Report R-1
200. COMPARATIVE STATEMENT OF FINANCIAL POSITION-EXPLANTORY NOTES-Continued
NOTES TO FINANCIAL STATEMENTS
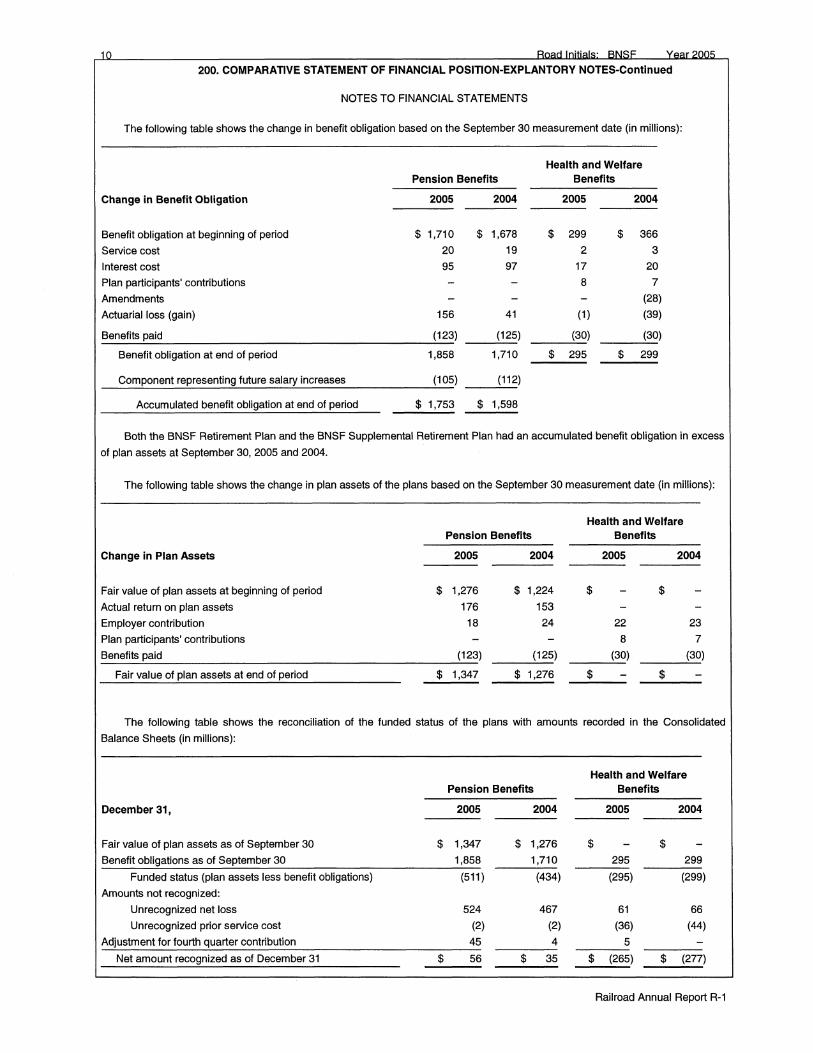
The following table shows the change in benefit obligation based on the September 30 measurement date (in millions):
Health and Welfare Pension Benefits Benefits
Change in Benefit Obligation 2005 2004 2005 2004
Benefit obligation at beginning of period $ 1,710 $ 1,678 $ 299 $ 366
Service cost 20 19 2 3
Interest cost 95 97 17 20
Plan participants' contributions 8 7
Amendments (28)
Actuarial loss (gain) 156 41 (1) (39)
Benefits paid (123) (125) (30) (30)
Benefit obligation at end of period 1,858 1,710 $ 295 $ 299
Component representing future salary increases (105) (112)
Accumulated benefit obligation at end of period $ 1,753 $ 1,598
Both the BNSF Retirement Plan and the BNSF Supplemental Retirement Plan had an accumulated benefit obligation in excess
of plan assets at September 30, 2005 and 2004.
The following table shows the change in plan assets of the plans based on the September 30 measurement date (in millions):
Health and Welfare Pension Benefits Benefits
Change In Plan Assets 2005 2004 2005 2004
Fair value of plan assets at beginning of period $ 1,276 $ 1,224 $ $ Actual return on plan assets 176 153
Employer contribution 18 24 22 23
Plan participants' contributions 8 7
Benefits paid (123) (125) (30) (30)
Fair value of plan assets at end of period $ 1,347 $ 1,276 $ $
The following table shows the reconciliation of the funded status of the plans with amounts recorded in the Consolidated
Balance Sheets (in millions):
Health and Welfare Pension Benefits Benefits
December 31, 2005 2004 2005 2004
Fair value of plan assets as of September 30 $ 1,347 $ 1,276 $ $ Benefit obligations as of September 30 1,858 1,710 295 299
Funded status (plan assets less benefit obligations) (511) (434) (295) (299)
Amounts not recognized:
Unrecognized net loss 524 467 61 66
Unrecognized prior service cost (2) (2) (36) (44)
Adjustment for fourth quarter contribution 45 4 5
Net amount recognized as of December 31 $ 56 $ 35 $ (265) $ (277)
Railroad Annual Report R-1

11
200. COMPARATIVE STATEMENT OF FINANCIAL POSITION-EXPLANTORY NOTES-Continued
NOTES TO FINANCIAL STATEMENTS
The following table shows the amounts recognized in the Consolidated Balance Sheets (in millions):
Health and Welfare Pension Benefits Benefits
December 31, 2005 2004 2005 2004
Accrued benefit cost $ (361) $ (318) $ (265) $ (277)
Accumulated other comprehensive income 417 353
Net amount recognized $ 56 $ 35 $ (265) $ (277)
Health and Welfare Pension Benefits Benefits
December 31, 2005 2004 2005 2004
Increase (decrease) in minimum liability included in other comprehensive income $ 64 $ (6) $ $
The expected long-term rate of return is the return the Company anticipates earning, net of plan expenses, over the period that
benefits are paid. It reflects the rate of return on present investments and on expected contributions. In determining the expected
long-term rate of return, BNSF Railway considered: 1) forward looking capital market forecasts, 2) historical returns for individual
asset classes and 3) the impact of active portfolio management.
The assumptions used in accounting for the BNSF plans were as follows:
Assumptions used to determine net cost Pension Benefits Health and Welfare Benefits
(benefit) for fiscal years ended December 31, 2005 2004 2003 2005 2004 2003
Discount rate 5.75% 6.00% 6.50% 5.75% 6.00% 6.50%
Expected long-term rate of return on plan assets 8.00% 8.25% 8.50%
Rate of compensation increase 3.90% 3.90% 3.90% 3.90% 3.90% 3.90%
Pension Benefits Health and Welfare
Assumptions used to determine benefit Benefits
obligations at September 30, 2005 2004 2005 2004
Discount rate 5.25% 5.75% 5.25% 5.75%
Rate of compensation increase 3.90% 3.90% 3.90% 3.90%
The following table presents assumed health care cost trend rates:
December 31, 2005 2004 2003
Assumed health care cost trend rate for next year 10.50% 10.00% 11.00%
Rate to which health care cost trend rate is expected to decline and remain 5.00% 5.00% 5.00%
Year that the rate reaches the ultimate trend rate 2012 2010 2010
Railroad Annual Report R-1

200. COMPARATIVE STATEMENT OF FINANCIAL POSITION-EXPLANTORV NOTES-Continued
NOTES TO FINANCIAL STATEMENTS
Assumed health care cost trend rates have a significant effect on the amounts reported for the health care plans. A one
percentage-point change in assumed health care cost trend rates would have the following effects:
Effect on total service and interest cost
Effect on post retirement benefit obligation
One Percentage-
Point Increase
$ 2
$ 24
One Percentage-
Point Decrease
$ (2)
$ (20)
The qualified BNSF Retirement Plan asset allocation at September 30, 2005 and 2004 and the target allocation for 2005 by
asset category are as follows:
Target Percentage of Pension Plan Allocation Assets at September 30,
Plan Asset Allocation 2005 2005 2004
Equity Securities 45-75% 64% 60%
Fixed Income Securities 20-40 28 33
Real Estate 5-15 8 7
Total 100% 100%
The general investment objective of the BNSF Retirement Plan is to grow the Plan assets in relation to the Plan liabilities while
prudently managing the risk of a decrease in the Plan's assets relative to those liabilities. To meet this objective, the Employee
Benefits Committee has adopted the above asset allocation ranges. This allows flexibility to accommodate market changes in the
asset classes within defined parameters.
The Company contributed $40 million to the BNSF Retirement Plan in December 2005. The Company is not required to make
any contributions to this plan in 2006. Additionally, the Company expects to make benefit payments in 2006 of approximately $21
million and $7 million from its OPEB and non-qualified defined benefit plans, respectively. The following table shows expected
benefit payments and Medicare Part D subsidy receipts for the next five fiscal years and the aggregate five years thereafter from the
defined benefit pension plans and OPEB (in millions):
Expected Pension Plan Expected Expected
Benefit OPEB Medicare Fiscal Vear Payments" Payments Subsidy
2006 $ 126 $ 21 $ (3)
2007 126 22 (3)
2008 127 23 (3)
2009 129 24 (3)
2010 130 24 (3)
2011-2015 674 131 (20)
a Primarily consists of Qualified Defined Benefit Plan payments which are made from the Plan Trust and do not represent an immediate cash outflow to the Company.
Railroad Annual Report R-1

200. COMPARATIVE STATEMENT OF FINANCIAL POSITION-EXPLANTORY NOTES-Continued
NOTES TO FINANCIAL STATEMENTS
Defined Contribution Plans
BNSF and BNSF Railway sponsor qualified 401 (k) plans which cover substantially all employees and a non-qualified defined
contribution plan which covers certain officers and other employees. The Company matches 50 percent of the first six percent of
non-union employees' contributions and matches 25 percent on the first four percent of a limited number of union employees'
contributions, which are subject to certain percentage limits of the employees' earnings, at each pay period. Non-union employees
are eligible to receive an annual discretionary matching contribution of up to 30 percent of the first six percent of their contributions.
Employer contributions for all non-union employees are subject to a five-year length of service vesting schedule. The Company's
401 (k) matching expense was $20 million, $17 million and $16 million in 2005, 2004 and 2003, respectively.
Other
Under collective bargaining agreements, BNSF Railway participates in multi-employer benefit plans which provide certain post
retirement health care and life insurance benefits for eligible union employees. Insurance premiums paid attributable to retirees,
which are generally expensed as incurred, were $43 million, $33 million and $31 million, in 2005, 2004 and 2003.
Note3
Contingent Assets And Liabilities
Guarantees
Debt and other obligations of non-consolidated entities guaranteed by the Company as of December 31, 2005 are as follows
(dollars in millions):
Guarantees
BNSF Railway Principal Maximum Maximum Remainin
Ownership Amount Future Recourse gTerm Capitalized Percentage Guaranteed Payments Amount a (in years) Obligationsb
Termination of
Kinder Morgan Energy Partners, LP. 0.5% $ 190 $ 190 $ Ownership $
Kansas City Terminal lntermodal Transportation Corporation 0.0% $ 62 $ 96 $ 96 13 $ 34
Westside lntermodal Transportation Corporation 0.0% $ 43 $ 69 $ 18 $ 36
The Unified Government of Wyandotte County/Kansas City, Kansas 0.0% $ 14 $ 21 $ 18 $ 11
Various lessors
(Residual value guarantees) 0.0% N/A $ 298 $ 298 Various $ 68°
All other 0.0% $ 8 $ 9 $ 4 Various $
a Reflects the maximum amount the Company could recover from a third party other than the counterparty.
b Reflects capitalized obligations that are recorded on the Company's Consolidated Balance Sheets.
c Reflects the FIN 45 asset and corresponding liability for the fair value of the residual value guarantees on the Company's Consolidated Balance Sheet.
Railroad Annual Report R-1

14 Rn"'rl Initials· RN~F Vear ~:>n()I:;
200. COMPARATIVE STATEMENT OF FINANCIAL POSITION-EXPLANTORY NOTES-Continued
NOTES TO FINANCIAL STATEMENTS
Kinder Morgan Energy Partners, LP.
Santa Fe Pacific Pipelines, Inc. (SFPP), an indirect, wholly owned subsidiary of BNSF Railway, has a guarantee in connection with its remaining special limited partnership interest in SFPP, L.P., a subsidiary of Kinder Morgan Energy Partners, L.P. to be paid only upon default by the partnership. All obligations with respect to the guarantee will cease upon termination of ownership rights which would occur upon a put notice issued by BNSF Railway or the exercise of the call rights by the general partners of SFPP, L.P
Kansas City Terminal lntermodal Transportation Corporation
BNSF Railway and another major railroad jointly and severally guarantee $62 million of debt of Kansas City Terminal
lntermodal Transportation Corporation, the proceeds of which were used to finance construction of a double track grade separation
bridge in Kansas City, Missouri, which is operated and used by Kansas City Terminal Railway Company (KCTRC). BNSF Railway
has a 25 percent ownership in KCTRC, accounts for its interest using the equity method of accounting, and will be required to fund a
portion of the remaining obligation upon default by the original debtor.
Westside lntermodal Transportation Corporation And The Unified Government Of Wyandotte County/Kansas City, Kansas
BNSF Railway has guaranteed $57 million of debt, the proceeds of which were used to finance construction of a bridge that
connects BNSF Railway's Argentine Yard in Kansas City, Kansas, with the KCTRC mainline tracks in Kansas City, Missouri. The
bridge is operated by KCTRC, and payments related to BNSF Railway's guarantee of this obligation will only be called for upon
default by the original debtor.
Residual Value Guarantees (RVG)
In the normal course of business, the Company enters into leases in which it guarantees the residual value of certain leased
equipment. Some of these leases have renewal or purchase options, or both, that the Company may exercise at the end of the
lease term. If the Company elects not to exercise these options, it may be required to pay the lessor an amount not exceeding the
RVG. The amount of any payment is contingent upon the actual residual value of the leased equipment. Some of these leases also
require the lessor to pay the Company any surplus in the actual residual value of the leased equipment over the RVG. These
guarantees will expire between 2006 and 2011.
The maximum future payments, as disclosed in the Guarantees table above, represent the undiscounted maximum amount
that BNSF Railway could be required to pay in the event the Company did not exercise its renewal option and the fair market value
of the equipment had significantly declined. BNSF Railway does not anticipate such a large reduction in the fair market value of the
leased equipment. As of December 31, 2005, the Company has recorded a $68 million asset and corresponding liability for the fair
value of the RVGs.
All Other
As of December 31, 2005, BNSF Railway guarantees $8 million of other debt and leases. BNSF Railway holds a performance
bond and has the option to sub-lease property to recover up to $4 million of the $8 million of guarantees. These guarantees expire
between 2006 and 2014.
Other than as discussed above, there is no collateral held by a third party which the Company could obtain and liquidate to
recover any amounts paid under the above guarantees.
Other than as discussed above, none of the guarantees are recorded in the Consolidated Financial Statements of the
Company. The Company does not expect performance under these guarantees to have a material effect on the Company in the
foreseeable future.
Railroad Annual Report R-1

J:ln<>rl Initial!:' J:IN!=;F Year ?nni:; 1<;
200. COMPARATIVE STATEMENT OF FINANCIAL POSITION-EXPLANTORY NOTES-Continued
NOTES TO FINANCIAL STATEMENTS
Indemnities
In the ordinary course of business, BNSF Railway enters into agreements with third parties that include indemnification
clauses. In general, these clauses are customary for the types of agreements in which they are included. At times, these clauses
may involve indemnification for the acts of the Company, its employees and agents, indemnification for another party's acts,
indemnification for future events, indemnification based upon a certain standard of performance, indemnification for liabilities arising
out of the Company's use of leased equipment or other property, or other types of indemnification. Due to the uncertainty of whether
events which would trigger the indemnification obligations would ever occur, the Company does not believe that these indemnity
agreements will have a material adverse effect on the Company's results of operations, financial position or liquidity. Additionally, the
Company believes that due to lack of historical payment experience, the fair value of indemnities cannot be estimated with any
amount of certainty and that the fair value of any such amount would be immaterial to the financial statements. Accordingly, no fair
value liability related to indemnities has been recorded in the financial statements.
Note 4
Hedging Activities
The Company uses derivatives to hedge against increases in diesel fuel prices. The Company formally documents the
relationship between the hedging instrument and the hedged item, as well as the risk management objective and strategy for the
use of the hedging instrument. This documentation includes linking the derivatives that are designated as cash flow hedges to
specific assets or liabilities on the balance sheet, commitments or forecasted transactions. The Company assesses at the time a
derivative contract is entered into, and at least quarterly thereafter, whether the derivative item is effective in offsetting the changes
in cash flows. For derivative instruments that are designated and qualify as cash flow hedges, the effective portion of the gain or loss
on the derivative instrument is recorded in accumulated other comprehensive income (AOCI) as a separate component of
stockholder's equity and reclassified into earnings in the period during which the hedge transaction affects earnings.
BNSF Railway monitors its hedging positions and credit ratings of its counterparties and does not anticipate losses due to
counterparty nonperfonnance.
Fuel
Fuel costs represented 20, 15 and 14 percent of total operating expenses during the years 2005, 2004 and 2003, respectively.
Due to the significance of diesel fuel expenses to the operations of BNSF Railway and the historical volatility of fuel prices, the
Company has entered into hedges to partially mitigate the risk of fluctuations in the price of its diesel fuel purchases. The fuel
hedges include the use of derivatives that are accounted for as cash flow hedges. The hedging is intended to protect the Company's
operating margins and overall profitability from adverse fuel price changes by entering into fuel-hedge instruments based on
management's evaluation of current and expected diesel fuel price trends. However, to the extent the Company hedges portions of
its fuel purchases, it may not realize the impact of decreases in fuel prices. Conversely, to the extent the Company does not hedge
portions of its fuel purchases, it may be adversely affected by increases in fuel prices. Based on fuel consumption during 2005 and
excluding the impact of the hedges, each one-cent increase in the price of fuel would result in approximately $14 million of additional
fuel expense on an annual basis.
Total Fuel-Hedging Activities
As of December 31, 2005, BNSF Railway's total fuel hedging activities covered approximately 26 percent and 3 percent of
estimated fuel purchases for 2006 and 2007, respectively. Hedge positions are closely monitored to ensure that they will not exceed
actual fuel requirements in any period.
Railroad Annual Report R-1

200. COMPARATIVE STATEMENT OF FINANCIAL POSITION-EXPLANTORY NOTES-Continued
NOTES TO FINANCIAL STATEMENTS
The amounts recorded in the Consolidated Statements of Income for fuel-hedge transactions were as follows (in millions):
Year Ended December 31, 2005 2004 2003
Hedge benefit $ 535 $ 337 $ 65
Ineffective portion of unexpired hedges (4) 1 3
Tax effect (203) (130) (26)
Hedge benefit, net of tax $ 328 $ 208 $ 42
The amounts recorded in the Consolidated Balance Sheets for fuel hedge transactions were as follows (in millions):
December 31,
Short-term fuel-hedging asset
Long-term fuel-hedging asset
Ineffective portion of unexpired hedges
Tax effect
Amount included in AOCI, net of tax
Settled fuel-hedging contracts receivable
$
$
$
2005
303
33
(129)
207
143
$
$
$
2004
264
105
(4)
(140)
225
131
BNSF Railway measures the fair value of hedges from data provided by various external counterparties. To value a swap, the
Company uses the forward commodity price for the period hedged. The fair values of costless collars are calculated and provided by
the corresponding counterparties.
Nymex #2 Heating Oil Hedges
As of December 31, 2005, BNSF Railway had entered into fuel swap and costless collar agreements utilizing New York
Mercantile Exchange (NYMEX) #2 heating oil (HO). The hedge prices do not include taxes, transportation costs, certain other fuel
handling costs and any differences which may occur between the prices of HO and the purchase price of BNSF Railway's diesel
fuel. Over the twelve months ended December 31, 2005, the sum of all such costs averaged approximately 16 cents per gallon.
During 2005, the Company converted approximately 19 million gallons of 2006 West Texas Intermediate (WTI) collars into HO
swaps at an average price of $1.08 per gallon. The following table provides fuel hedge data based upon the quarter being hedged
for all HO fuel hedges outstanding at December 31, 2005.
Railroad Annual Report R-1

c,....,..i lniti .. I<>· Cl\l~F' y,,,,.. ?nm; 1 cc
200. COMPARATIVE STATEMENT OF FINANCIAL POSITION-EXPLANTORY NOTES-Continued
NOTES TO FINANCIAL STATEMENTS
Quarter Ending
2006 March 31, June30, September 30, December 31, Annual
HO Swaps
Gallons hedged (in millions) 18.90 18.90
Average swap price (per gallon) 1.08 1.08 Fair value (in millions) $ 13 $ $ $ $ 13 HO Collars
Gallons hedged (in millions) 15.75 22.05 28.35 31.50 97.65
Average cap price (per gallon) $ 0.97 $ 0.92 $ 0.91 $ 0.94 $ 0.93
Average floor price (per gallon) $ 0.90 $ 0.84 $ 0.84 $ 0.87 $ 0.86
Fair value (in millions) $ 12 $ 18 $ 24 $ 28 $ 82
Quarter Ending
2007 March 31, June30, September 30, December 31, Annual
HO Collars
Gallons hedged (in millions) 31.50 31.50
Average cap price (per gallon) $ 0.93 $ $ $ $ 0.93
Average floor price (per gallon) $ 0.86 $ $ $ $ 0.86
Fair value (in millions) $ 28 $ $ $ $ 28
WTI Crude Oil Hedges
In addition, BNSF Railway enters into fuel swap and costless collar agreements utilizing WTI crude oil. The hedge prices do not
include taxes, transportation costs, certain other fuel handling costs, and any differences which may occur between the prices of
WTI and the purchase price of BNSF Railway's diesel fuel, including refining costs. Over the twelve months ended December 31,
2005, the sum of all such costs averaged approximately 45 cents per gallon.
No additional WTI hedges were entered into during 2005. However, the Company converted approximately 19 million
gallons of WTI collars into HO swaps as stated in the NYMEX #2 Heating Oil Hedges section. The following tables provide fuel
hedge data based upon the quarter being hedged for all WTI fuel hedges outstanding at December 31, 2005.
Quarter Ending
2006 March 31, June 30, September 30, December 31, Annual
WTISwaps
Barrels hedged (in thousands) 1,350 675 375 2,400 Equivalent gallons hedged (in millions) 56.70 28.35 15.75 100.80 Average swap price (per barrel) $ 24.43 $ 25.16 $ 25.69 $ $ 24.83 Fair value (in millions) $ 50 $ 25 $ 14 $ $ 89 WTI Collars
Barrels hedged (in thousands) 1,050 1,500 825 525 3,900 Equivalent gallons hedged (in millions) 44.10 63.00 34.65 22.05 163.80 Average cap price (per barrel) $ 29.23 $ 30.20 $ 30.81 $ 31.93 $ 30.30 Average floor price (per barrel) $ 24.73 $ 25.79 $ 26.32 $ 27.42 $ 25.84 Fair value (in millions) $ 34 $ 47 $ 26 $ 16 $ 123
Railroad Annual Report R-1

1 <;f' i:ln"ri lnifo~I,::· i:lll.IC::~ Vp,::ir ?nni:;
200. COMPARATIVE STATEMENT OF FINANCIAL POSITION-EXPLANTORY NOTES-Continued
NOTES TO FINANCIAL STATEMENTS
2007
Wll Collars
Barrels hedged (in thousands)
Equivalent gallons hedged (in millions)
Average cap price (per barrel)
Average floor price (per barrel)
Fair value (in millions)
Nymex #2 Heating Oil Refining Spread Hedges
March 31,
150
6.30
$ 33.00
$ 29.00
$ 5
Quarter Ending
June 30, September 30,
- -- -
$ - $ -$ - $ -$ - $ -
December 31, Annual
- 150
- 6.30
$ - $ 33.00
$ - $ 29.00
$ - $ 5
During 2005, the Company entered into fuel swap agreements utilizing the HO refining spread (HO-WTI) to hedge the
equivalent of approximately 57 million gallons of fuel with an average swap price $15.69 per barrel. HO-WTI is the difference in price
between HO and WTI; therefore, a HO-WTI swap in combination with a WTI swap is equivalent to a HO swap. The following table
provides fuel hedge data based upon the quarter being hedged for all HO-WTI fuel hedges outstanding as of December 31, 2005.
2006
HO-WTI Swaps Barrels hedged (in thousands)
Equivalent gallons hedged (in millions)
Average swap price (per barrel)
Fair value (in millions) $ $
Summarized Comparative Prior Year Information
Quarter Ending
March 31,
1,350
56.70
15.69
(4)
The following table provides summarized comparative information for hedge transactions as of December 31, 2004.
Year ending,
HO Swaps Gallons hedged (in millions)
Average swap price (per gallon)
Fair value (in millions)
HO Collars Gallons hedged (in millions)
Average cap price (per gallon)
Average floor price (per gallon)
Fair value (in millions)
WTISwaps Barrels hedged (in thousands)
Equivalent gallons hedged (in millions)
Average swap price (per barrel)
Fair value (in millions)
Wll Collars Barrels hedged (in thousands)
Equivalent gallons hedged (in millions)
Average cap price (per barrel)
Average floor price (per barrel)
Fair value (in millions)
$
$
$
$
$
$
$
$
$
$
2005
69.30
0.93
15
40.95
0.97
0.89
8
3,750
157.50
24.52
66
10,950
459.90
26.69
22.11
175
December 31,
$ $
$ $ $
$
$
$
$
$
2006
97.65
0.93
0.86
17
2,400
100.80
24.83
36
4,350
182.70
30.47
26.04
45
$ $
$ $ $
$
$
$
$
$
2007
31.50
0.93
0.86
6
----
150
6.30
33.00
29.00
1
Railroad Annual Report R-1

200. COMPARATIVE STATEMENT OF FINANCIAL POSITION-EXPLANTORY NOTES-Continued
NOTES TO FINANCIAL STATEMENTS
Notes
Commitments and Contingencies
Lease Commitments
BNSF Railway has substantial lease commitments for locomotives, freight cars, trailers and containers, office buildings and
other property, and many of these leases provide the option to purchase the leased item at fair market value at the end of the lease.
However, some provide fixed price purchase options. Future minimum lease payments as of December 31, 2005 are summarized as
follows (in millions):
Capital Operating December 31, Leases Leases•
2006 $ 145 $ 461
2007 135 536
2008 123 495
2009 95 461
2010 61 436
Thereafter 161 3,754
Total 720 $ 6,143
Less amount representing interest (116)
Present value of minimum lease payments $ 604
a Excludes leases having non-cancelable lease terms of less than one year and per diem leases.
Lease rental expense for all operating leases was $565 million, $496 million and $462 million for the years ended December
31, 2005, 2004 and 2003, respectively. Contingent rentals and sublease rentals were not significant.
Other Commitments
In the normal course of business, the Company enters into long-term contractual requirements for future goods and services
needed for the operations of the business. Such commitments are not in excess of expected requirements and are not reasonably
likely to result in performance penalties or payments that would have a material adverse effect on the Company's liquidity.
Personal Injury And Environmental Costs
Charge For Asbestos And Environmental Costs
During 2004, BNSF Railway recorded a $465 million pre-tax charge to reflect changes in its estimate of unasserted asbestos
liabilities and environmental liabilities. Of this amount, $293 million and $172 million were related to unasserted asbestos and
environmental liabilities, respectively. The $465 million pre-tax charge was recorded in materials and other expense and reduced net
income by $288 million during 2004.
Personal Injury
Personal injury claims, including asbestos claims and employee work-related injuries and third party injuries (collectively,
other personal injury), are a significant expense for the railroad industry. Personal injury claims by BNSF Railway employees are
subject to the provisions of the Federal Employers' Liability Act (FELA) rather than state workers' compensation laws. FELA's
system of requiring the finding of fault, coupled with unscheduled awards and reliance on the jury system, contributed to increased
expenses in past years. Other proceedings include claims by non-employees for punitive as well as compensatory damages. A few
proceedings purport to be class actions. The variability present in settling these claims, including non-employee personal injury and
matters in which punitive damages are alleged, could result in increased expenses in future years. BNSF Railway has implemented
a number of safety programs designed to reduce the number of personal injuries as well as the associated claims and personal
injury expense.
Railroad Annual Report R-1

200. COMPARATIVE STATEMENT OF FINANCIAL POSITION-EXPLANTORV NOTES-Continued
NOTES TO FINANCIAL STATEMENTS
BNSF Railway records a liability for personal injury claims when the expected loss is both probable and reasonably estimable.
The liability and ultimate expense projections are estimated using standard actuarial methodologies. Liabilities recorded for
unasserted personal injury claims are based on information currently available. Due to the inherent uncertainty involved in projecting
future events such as the number of claims filed each year, developments in judicial and legislative standards, and the average
costs to settle projected claims, actual costs may differ from amounts recorded. BNSF Railway has obtained insurance coverage for
certain claims, as discussed under the heading "BNSF Insurance Company."
Asbestos
The Company is party to a number of personal injury claims by employees and non-employees who may have been exposed
to asbestos. The heaviest exposure for BNSF Railway employees was due to work conducted in and around the use of steam
locomotive engines that were phased out between the years of 1950 and 1967. However, other types of exposures, including
exposure from locomotive component parts and building materials, continued after 1967, until it was substantially eliminated by
1985.
Prior to 2000, claim filings against the Company for asbestos were not numerous and were sporadic. Accordingly, while the
Company had concluded that a probable loss had occurred, it did not believe it could estimate the range of reasonably possible loss
because of the lack of experience with such claims and the lack of detailed employment records for the population of exposed
employees. The Company believed, however, that the low end of the range of reasonably possible loss, as that term is used in
FASB Interpretation No. 14 (FIN 14), Reasonable Estimation of the Amount of a Loss, was immaterial. Subsequent to this period,
claim filings increased and, when they continued into 2004, the Company concluded that the low end of the range of reasonably
possible loss would be material and that an estimate for unasserted asbestos exposure liability needed to be recorded. BNSF
Railway then engaged a third party with extensive experience in performing asbestos studies to assist in assessing the unasserted
liability exposure. The objective of the assessment was to determine the number of estimated unasserted asbestos claims and the
estimated average cost per claim. The Company, with the assistance of the third party, first determined its exposed population from
which it was able to derive the estimated number of unasserted claims. The estimated average cost per claim was then determined
utilizing recent actual average cost per claim data.
Based on the assessment, the Company recorded an undiscounted $293 million pre-tax charge for unasserted asbestos claims
in the third quarter of 2004. The $293 million pre-tax charge was recorded in materials and other expense and reduced net income
by $182 million for the year ended December 31, 2004.
During the third quarter of 2005, the Company obtained an update of this study which concluded that the original September
2004 study continues to represent a reasonable estimate of BNSF Railway's future asbestos exposure. Therefore, management
recorded no additional expense as a result of this update. The Company plans to update the study in the third quarter of 2006. On a
quarterly basis, BNSF Railway monitors actual experience against the number of forecasted claims and expected claim payments.
Adjustments to the Company's estimates will be recorded when necessary.
The following table summarizes the activity in the Company's accrued obligations for both asserted and unasserted asbestos
matters (in millions):
2005
Beginning balance $ 345
Accruals
Payments (19)
Ending balance at December 31, $ 326
$
$
2004
60
308
(23)
345
$
$
2003
55
25
(20)
60
Railroad Annual Report R-1

200. COMPARATIVE STATEMENT OF FINANCIAL POSITION-EXPLANTORY NOTES-Continued
NOTES TO FINANCIAL STATEMENTS
Of the obligations at December 31, 2005, $266 million is related to unasserted claims and $60 million is related to asserted
claims. At December 31, 2005 and 2004, $21 and $18 million are included in current liabilities, respectively. The recorded liability is
not discounted. In addition, defense and processing costs, which are recorded on an as-reported basis, are not included in the
recorded liability. The Company is presently self-insured for asbestos-related claims.
The following table summarizes information regarding the number of asserted asbestos claims filed against BNSF Railway:
Claims unresolved at January 1,
Claims filed
Claims settled, dismissed or otherwise resolved
Claims unresolved at December 31,
2005
1,926
835
(640)
2,121
2004
1,985
712
(771)
1,926
Based on BNSF Railway's estimate of the potentially exposed employees and related mortality assumptions, it is anticipated
that unasserted claims will continue to be filed through the year 2050. The Company recorded an amount for the full estimated filing
period through 2050 because it had a relatively finite exposed population (former and current employees hired prior to 1985) which it
was able to identify and reasonably estimate and about which it had obtained reliable demographic data (including age, hire date
and occupation) derived from industry or BNSF Railway specific.data that was the basis for the study. BNSF Railway projects that
approximately 50, 70, and 90 percent of the future unasserted asbestos claims will be incurred within the next 10, 15 and 25 years,
respectively.
Because of the uncertainty surrounding the factors used in the study, it is reasonably possible that future costs to settle
asbestos claims may range from approximately $225 million to $425 million. However, BNSF Railway believes that the $326 million
recorded at December 31, 2005, is the best estimate of the Company's future obligation for the settlement of asbestos claims.
The amounts recorded by BNSF Railway for the asbestos-related liability were based upon currently known facts. Future
events, such as the number of new claims to be filed each year, the average cost of disposing of claims, as well as the numerous
uncertainties surrounding asbestos litigation in the United States, could cause the actual costs to be higher or lower than projected.
While the final outcome of asbestos-related matters cannot be predicted with certainty, considering among other things the
meritorious legal defenses available and liabilities that have been recorded, it is the opinion of BNSF Railway that none of these
items, when finally resolved, will have a material adverse effect on the Company's financial position or liquidity. However, should a
number of these items occur in the same period, it could have a material adverse effect on the results of operations in a particular
quarter or fiscal year.
Other Personal Injury
BNSF Railway uses a third party actuary to assist the Company in estimating its other personal injury liability claims and
expense. These estimates are based on the covered population, activity levels and trends in frequency, and the costs of covered
injuries. These actuarial estimates include unasserted claims except for certain repetitive stress and other occupational trauma
claims that result from prolonged repeated events or exposure. Such claims are estimated on an as-reported basis because, while
the Company has concluded that a probable loss has occurred, it cannot estimate the range of reasonably possible loss due to
other contributing causes of such injuries and the fact that continued exposure is required for the potential injury to manifest itself as
a claim. The Company believes that the low end of the range of reasonably possible loss, as that term is used in FIN 14, is
immaterial for these other occupational trauma claims.
BNSF Railway obtains quarterly actuarial updates for other personal injury liabilities and monitors actual experience against the
number of forecasted claims to be received, the forecasted number of claims closing with payment and expected claims payments.
Adjustments to the Company's estimates are recorded quarterly as necessary or more frequently as new events or revised
estimates develop.
Railroad Annual Report R-1

On<>rl lniti::1li>· 011.IC:i::
200. COMPARATIVE STATEMENT OF FINANCIAL POSITION-EXPLANTORY NOTES-Continued
NOTES TO FINANCIAL STATEMENTS
The following table summarizes the activity in the Company's accrued obligations for other personal injury matters (in millions):
2005 2004 2003
Beginning balance $ 459 $ 453 $ 441
Accruals 181 194 190
Payments (218) (188) (178)
Ending balance at December 31, $ 422 $ 459 $ 453
At December 31, 2005 and 2004, $164 million and $170 million are included in current liabilities, respectively. BNSF Railway's
liabilities for other personal injury claims are undiscounted. In addition, defense and processing costs, which are recorded on an as
reported basis, are not included in the recorded liability. The Company is substantially self-insured for other personal injury claims.
The following table summarizes information regarding the number of personal injury claims, other than asbestos, filed against
BNSF Railway:
2005 2004
Claims unresolved at January 1, 4,116 4,393
Claims filed 3,758 3,632
Claims settled, dismissed or otherwise resolved (4,257) (3,909)
Claims unresolved at December 31, 3,617 4,116
Because of the uncertainty surrounding the ultimate outcome of other personal injury claims, it is reasonably possible that
future costs to settle other personal injury claims may range from approximately $375 million to $525 million. However, BNSF
Railway believes that the $422 million recorded at December 31, 2005, is the best estimate of the Company's future obligation for
the settlement of other personal injury claims.
The amounts recorded by BNSF Railway for other personal injury claims were based upon currently known facts. Future
events, such as the number of new claims to be filed each year, the average cost of disposing of claims, as well as the numerous
uncertainties surrounding personal injury litigation in the United States, could cause the actual costs to be higher or lower than
projected.
While the final outcome of these other personal injury matters cannot be predicted with certainty, considering among other
things the meritorious legal defenses available and liabilities that have been recorded, it is the opinion of BNSF Railway that none of
these items, when finally resolved, will have a material adverse effect on the Company's financial position or liquidity. However,
should a number of these items occur in the same period, it could have a material adverse effect on the results of operations in a
particular quarter or fiscal year.
BNSF Insurance Company
Burlington Northern Santa Fe Insurance Company, Ltd. (BNSF IC), a wholly owned subsidiary of BNSF, provides insurance
coverage for certain risks incurred after April 1, 1998, FELA claims, railroad protective and force account insurance claims incurred
after January 1, 2002, and certain other claims which are subject to reinsurance. During the years ended December 31, 2005, 2004
and 2003, BNSF Railway paid and expensed premiums of $140 million, respectively to BNSF IC for such coverage. At December
31, 2005 and 2004 there was no unamortized premium remaining on the Consolidated Balance Sheets. During 2005, 2004 and
2003, BNSF IC made claim payments totaling $132 million, $82 million, and $33 million, respectively, for settlement of covered
claims.
Railroad Annual Report R-1

200. COMPARATIVE STATEMENT OF FINANCIAL POSITION-EXPLANTORY NOTES-Continued
NOTES TO FINANCIAL STATEMENTS
Environmental
The Company's operations, as well as those of its competitors, are subject to extensive federal, state and local environmental
regulation. BNSF Railway's operating procedures include practices to protect the environment from the risks inherent in railroad
operations, which frequently involve transporting chemicals and other hazardous materials. Additionally, many of BNSF Railway's
land holdings are and have been used for industrial or transportation-related purposes or leased to commercial or industrial
companies whose activities may have resulted in discharges onto the property. As a result, BNSF Railway is subject to
environmental cleanup and enforcement actions. In particular, the Federal Comprehensive Environmental Response, Compensation
and Liability Act of 1980 (CERCLA), also known as the Superfund law, as well as similar state laws generally impose joint and
several liability for cleanup and enforcement costs on current and former owners and operators of a site without regard to fault or the
legality of the original conduct. BNSF Railway has been notified that it is a potentially responsible party (PRP) for study and cleanup
costs at Superfund sites for which investigation and remediation payments are or will be made or are yet to be determined (the
Superfund sites) and, in many instances, is one of several PRPs. In addition, BNSF Railway may be considered a PRP under
certain other laws. Accordingly, under CERCLA and other federal and state statutes, BNSF Railway may be held jointly and
severally liable for all environmental costs associated with a particular site. If there are other PRPs, BNSF Railway generally
participates in the cleanup of these sites through cost-sharing agreements with terms that vary from site to site. Costs are typically
allocated based on such factors as relative volumetric contribution of material, the amount of time the site was owned or operated,
and/or the portion of the total site owned or operated by each PRP.
Liabilities for environmental cleanup costs are recorded when BNSF Railway's liability for environmental cleanup is both
probable and reasonably estimable. Subsequent adjustments to initial estimates are recorded as necessary based upon additional
information developed in subsequent periods. Environmental costs include initial site surveys and environmental studies as well as
costs for remediation of sites determined to be contaminated.
During the first half of 2004, the Company experienced a significant increase in expense relating to environmental remediation
developments at known sites for which the majority of the contamination occurred decades ago. Because of these and other
developments, the Company performed an assessment in 2004 to determine if it was feasible to better estimate developments at its
known sites. The Company determined that a third party actuary had proprietary data that included information from the
Environmental Protection Agency (EPA) and other governmental agencies as well as information accumulated from public sources
and work performed for other clients. Because of its determination that a better estimate of future development could be made with
this data, BNSF Railway engaged this third party actuary, which has an extensive background in performing various studies for large
companies, including environmental matters, to assist BNSF Railway in determining the Company's potential future environmental
exposure at known sites. As a result of this study, the Company revised its estimate of its probable environmental losses and its
accrued liabilities.
Consequently, during the third quarter of 2004, BNSF Railway recorded an undiscounted $172 million pre-tax charge related to
its change in estimated environmental liabilities on a site by site basis. The $172 million pre-tax charge was recorded in materials
and other expense and reduced net income by $106 million for 2004. The charge did not include (i) contaminated sites of which the
Company is not aware, or (ii) additional amounts for third party claims, which arise out of contaminants allegedly migrating from
BNSF Railway property, due to a limited number of sites. BNSF Railway continues to estimate third party claims on a site by site
basis when the liability for such claims is probable and reasonably estimable. BNSF Railway's recorded liability for third party claims
as of December 31, 2005 is approximately $24 million.
During the third quarter of 2005, the Company obtained an update of this study. Based on the results of the study, management
recorded additional expense of approximately $12 million. The Company plans to update the study in the third quarter of 2006. On a
quarterly basis, BNSF Railway monitors actual experience against the forecasted remediation and related payments made on
existing sites. Adjustments to the Company's estimates will continue to be recorded when necessary based on developments in
subsequent pe.riods. Additionally, environmental accruals include amounts for newly identified sites or contaminants, third-party
claims and legal fees incurred for defense of third-party claims and recovery efforts.
Railroad Annual Report R-1

1 !>I i:ln<irf lniti::il!=:" Rl\IC::I=
200. COMPARATIVE STATEMENT OF FINANCIAL POSITION-EXPLANTORY NOTES-Continued
NOTES TO FINANCIAL STATEMENTS
The Company's estimate of ultimate cost for cleanup efforts at its known environmental sites utilizes BNSF Railway's historical
payment patterns, its current estimated percentage to closure ratios, and the actuary's proprietary benchmark patterns developed
from data accumulated from public sources and work performed by it for other clients, including the EPA and other governmental
agencies. These factors incorporate experience gained from cleanup efforts at other similar sites into the estimates for which
remediation and restoration efforts are still in progress. BNSF Railway also conducts an ongoing environmental contingency
analysis, which considers a combination of factors including independent consulting reports, site visits, legal reviews and analysis of
the likelihood of participation in, and the ability to pay for, cleanup of other PRPs.
BNSF Railway is involved in a number of administrative and judicial proceedings and other mandatory cleanup efforts for 369
sites, including Superfund sites, at which it is participating in the study or cleanup, or both, of alleged environmental contamination.
The following table summarizes the activity in the Company's accrued obligations for environmental matters (in millions):
2005 2004 2003
Beginning balance $ 385 $ 199 $ 196
Accruals 33 258 59
Payments (48) (72) (56)
Ending balance at December 31, $ 370 $ 385 $ 199
At December 31, 2005 and 2004, $55 million and $60 million are included in current liabilities, respectively. BNSF Railway's
environmental liabilities are not discounted. BNSF Railway anticipates that the majority of the accrued costs at December 31, 2005
will be paid over the next ten years and no individual site is considered to be material.
The following table summarizes the environmental sites:
BNSF Railway sites
2005 2004
Number of sites at January 1, 384 402
Sites added during the period 24 34
Sites closed during the Eeriod (39) (52)
Number of sites at December 31, 369 384
Superfund sites
2005
24
(4)
20
2004
22
5
(3)
24
Liabilities recorded for environmental costs represent BNSF Railway's best estimate of its probable future obligation for the
remediation and settlement of these sites and include both asserted and unasserted claims. Unasserted claims are not a material
component of the liability. Although recorded liabilities include BNSF Railway's best estimate of all probable costs, without reduction
for anticipated recoveries from third parties, BNSF Railway's total cleanup costs at these sites cannot be predicted with certainty due
to various factors such as the extent of corrective actions that may be required, evolving environmental laws and regulations,
advances in environmental technology, the extent of other parties' participation in cleanup efforts, developments in ongoing
environmental analyses related to sites determined to be contaminated, and developments in environmental surveys and studies of
contaminated sites.
Because of the uncertainty surrounding these factors, it is reasonably possible that future costs for environmental liabilities may
range from approximately $300 million to $600 million. However, BNSF Railway believes that the $370 million recorded at
December 31, 2005, is the best estimate of the Company's future obligation for environmental costs.
While the final outcome of these environmental matters cannot be predicted with certainty, it is the opinion of BNSF Railway
that none of these items, when finally resolved, will have a material adverse effect on the Company's financial position or liquidity.
However, an unexpected adverse resolution of one or more of these items could have a material adverse effect on the results of
operations in a particular quarter or fiscal year.
Railroad Annual Report R-1

200. COMPARATIVE STATEMENT OF FINANCIAL POSITION-EXPLANTORY NOTES-Continued
NOTES TO FINANCIAL STATEMENTS
Other Claims And Litigation
In addition to asbestos, other personal injury, and environmental matters discussed above, BNSF Railway and its subsidiaries
are also parties to a number of other legal actions and claims, various governmental proceedings and private civil suits arising in the
ordinary course of business, including those related to disputes and complaints involving certain transportation rates and charges
(including complaints seeking refunds of prior charges paid for coal transportation and the prescription of future rates for such
movements). Some of the legal proceedings include claims for punitive as well as compensatory damages, and a few proceedings
purport to be class actions. While the final outcome of these matters cannot be predicted with certainty, considering among other
things the meritorious legal defenses available and liabilities that have been recorded along with applicable insurance, it is the
opinion of BNSF Railway that none of these items, when finally resolved, will have a material adverse effect on the Company's
financial position or liquidity. However, an unexpected adverse resolution of one or more of these items could have a material
adverse effect on the results of operations in a particular quarter or fiscal year.
Note 6
Stock Plans
On April 15, 1999, BNSF shareholders approved the BNSF 1999 Stock Incentive Plan and authorized 20 million shares of
BNSF common stock to be issued in connection with stock options, restricted stock, restricted stock units and performance stock.
On April 18, 2001, April 17, 2002, and April 21, 2004, BNSF shareholders approved the amended BNSF 1999 Stock Incentive Plan,
which authorized additional awards not to exceed 29 million, 35 million and 42 million shares, respectively, of BNSF common stock
to be issued in connection with stock options, restricted stock, restricted stock units and performance stock. Approximately three
million common shares were available for future grant at December 31, 2005.
Additionally, on April 18, 1996, BNSF shareholders approved the non-employee director's stock plan and authorized 900,000
shares of BNSF common stock to be issued in connection with this plan. Approximately 500,000 common shares were available for
future grant at December 31, 2005.
Stock Options
Under BNSF's stock plans, options may be granted to directors, officers and salaried employees at the fair market value of the
Company's common stock on the date of grant. Stock option grants awarded after April 2001 generally vest ratably over three years
and expire within ten years after the date of grant. Shares issued upon exercise of options may be issued from treasury shares or
from authorized but unissued shares.
The Company applies APB Opinion 25 and related interpretations in accounting for its stock options (see Note 8 for the
Company's pro forma net income determined based on the fair value at grant dates consistent with SFAS No. 123).
Railroad Annual Report R-1
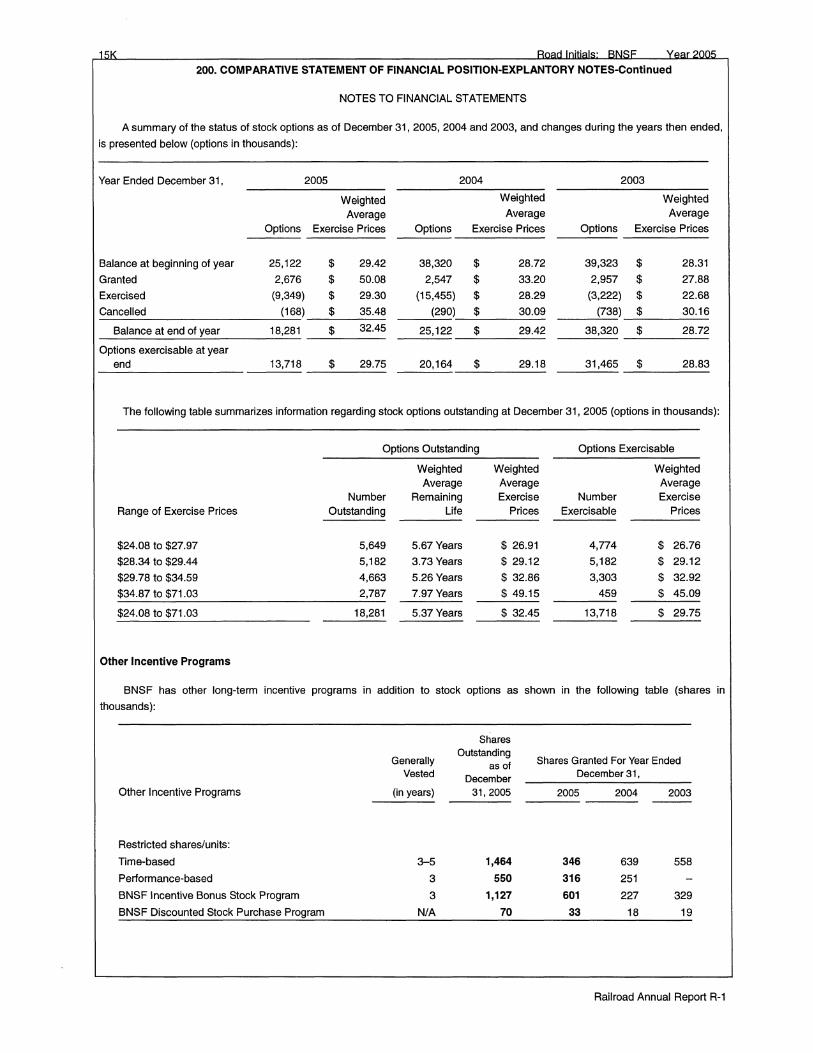
200. COMPARATIVE STATEMENT OF FINANCIAL POSITION-EXPLANTORY NOTES-Continued
NOTES TO FINANCIAL STATEMENTS
A summary of the status of stock options as of December 31, 2005, 2004 and 2003, and changes during the years then ended,
is presented below (options in thousands):
Year Ended December 31,
Balance at beginning of year
Granted
Exercised
Cancelled
Balance at end of year
Options exercisable at year end
2005
Weighted Average
Options Exercise Prices
25,122 $ 29.42
2,676 $ 50.08
(9,349) $ 29.30
(168) $ 35.48
18,281 $ 32.45
13,718 $ 29.75
Options
38,320
2,547
(15,455)
(290)
25,122
20,164
2004 2003
Weighted Weighted Average Average
Exercise Prices Options Exercise Prices
$ 28.72 39,323 $ 28.31
$ 33.20 2,957 $ 27.88
$ 28.29 (3,222) $ 22.68
$ 30.09 (738) $ 30.16
$ 29.42 38,320 $ 28.72
$ 29.18 31,465 $ 28.83
The following table summarizes information regarding stock options outstanding at December 31, 2005 (options in thousands):
Range of Exercise Prices
$24.08 to $27.97
$28.34 to $29.44
$29.78 to $34.59
$34.87 to $71.03
$24.08 to $71.03
Other Incentive Programs
Options Outstanding
Weighted Average
Number Remaining Outstanding Life
5,649 5.67Years
5,182 3.73Years
4,663 5.26Years
2,787 7.97Years
18,281 5.37Years
Options Exercisable
Weighted Weighted Average Average Exercise Number Exercise
Prices Exercisable Prices
$ 26.91 4,774 $ 26.76
$ 29.12 5,182 $ 29.12
$ 32.86 3,303 $ 32.92
$ 49.15 459 $ 45.09
$ 32.45 13,718 $ 29.75
BNSF has other long-term incentive programs in addition to stock options as shown in the following table (shares in
thousands):
Other Incentive Programs
Restricted shares/units:
Time-based
Performance-based
BNSF Incentive Bonus Stock Program
BNSF Discounted Stock Purchase Program
Generally Vested
(in years)
3-5
3
3
N/A
Shares Outstanding
as of December
31,2005
1,464
550
1,127
70
Shares Granted For Year Ended December 31,
2005 2004 2003
346 639 558
316 251
601 227 329
33 18 19
Railroad Annual Report R-1

200. COMPARATIVE STATEMENT OF FINANCIAL POSITION-EXPLANTORY NOTES-Continued
NOTES TO FINANCIAL STATEMENTS
Time-based awards are granted to senior managers within BNSF primarily as a retention tool and to encourage ownership in
the Company and generally vest over three years and are contingent on continued salaried employment. The weighted-average
grant date fair market values of time-based awards granted in 2005, 2004 and 2003 was $49.23, $32.72 and $27.88, respectively.
Performance-based awards are granted to senior managers within BNSF to encourage ownership in the Company and to align
management's interest with those of shareholders. Performance-based awards generally vest over three years and are contingent
on the achievement of certain predetermined corporate performance goals (e.g., return on invested capital (ROIG)) and continued
salaried employment. The weighted-average grant date fair market values of performance-based awards granted in 2005 and 2004
was $49.21 and $32.72, respectively, with no performance-based awards granted in 2003.
Additionally, related to the 2005 performance-based grant, eligible employees may also earn performance stock that will be
granted in 2008 contingent upon achievement of higher ROIG goals and continued salaried employment. The Company has
committed to a maximum grant of approximately 316,000 shares.
Certain eligible employees may exchange through the BNSF Incentive Bonus Stock Program (IBSP) the cash payment of their
bonus for restricted stock. The grant date fair market values of IBSP awards granted in 2005, 2004 and 2003 was $47.58, $31.97
and $25.52, respectively. In September 2005, the program was amended so that no awards will be granted after 2006.
Salaried employees not eligible to participate in the IBSP may participate in the BNSF Discounted Stock Purchase Program
(DSPP) and use their bonus to purchase BNSF common stock at a discount from the market price. These shares immediately vest
but are restricted for a three-year period. The grant date fair market values of DSPP awards granted in 2005, 2004 and 2003 was
$46.91, $31.84 and $25.38, respectively.
Shares awarded under the plans may not be sold or used as collateral and are generally not transferable by the holder until the
shares awarded become free of restrictions. Compensation expense, net of tax, recorded under the BNSF Stock Incentive Programs
in accordance with APB Opinion 25 is shown in the following table (in millions):
2005 2004 2003
Awards vesting based on service conditions 15 12 11
Awards vesting based on performance
and service conditions 8 7
Total 23 19 11
Note 7
Accounting Pronouncements
Stock-Based Compensation
The FASB issued SFAS No. 123R, Share-Based Payment, which originally required implementation for interim or annual
reporting periods beginning after June 15, 2005. However, in April 2005, the Securities and Exchange Commission adopted a new
rule to amend the compliance date to the beginning of the Company's next fiscal year (January 1, 2006, for the Company). SFAS
No. 123R requires the Company to recognize the cost of employee services received in exchange for the Company's equity
instruments. Currently, in accordance with APB Opinion 25, the Company records the intrinsic value of stock based compensation
as expense. Accordingly, no compensation expense is currently recognized for fixed stock option plans as the exercise price equals
Railroad Annual Report R-1
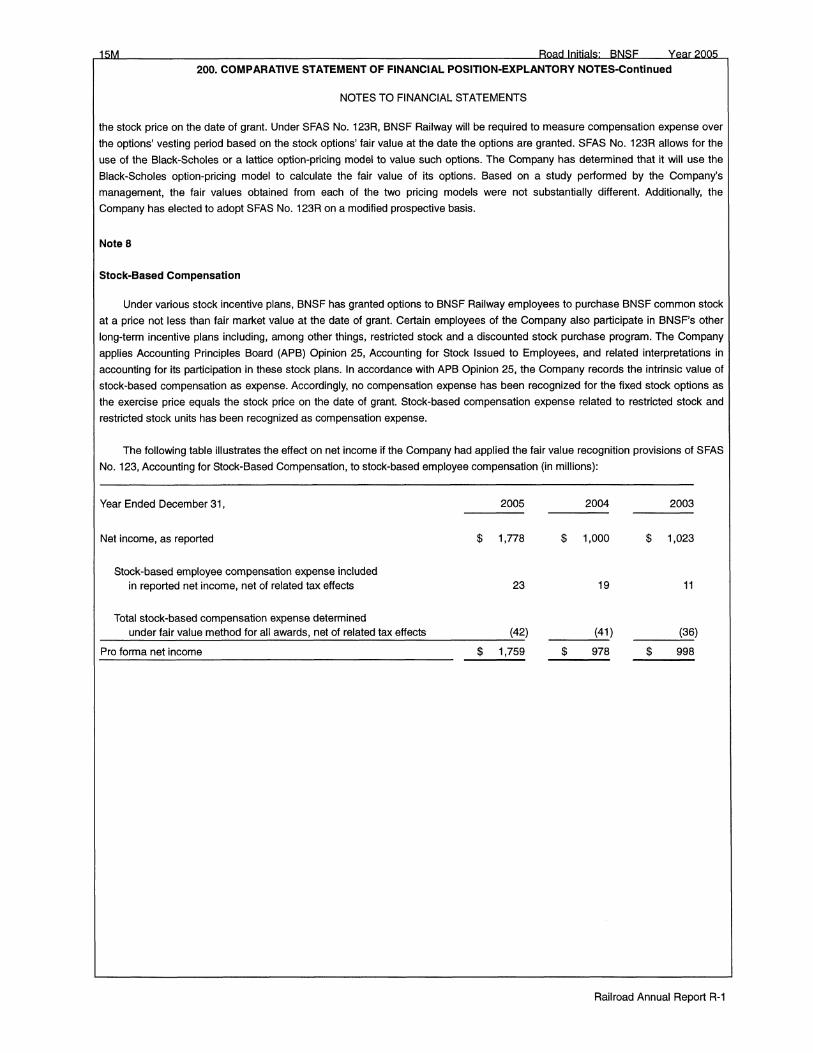
200. COMPARATIVE STATEMENT OF FINANCIAL POSITION-EXPLANTORY NOTES-Continued
NOTES TO FINANCIAL STATEMENTS
the stock price on the date of grant. Under SFAS No. 123R, BNSF Railway will be required to measure compensation expense over
the options' vesting period based on the stock options' fair value at the date the options are granted. SFAS No. 123R allows for the
use of the Black-Scholes or a lattice option-pricing model to value such options. The Company has determined that it will use the
Black-Scholes option-pricing model to calculate the fair value of its options. Based on a study performed by the Company's
management, the fair values obtained from each of the two pricing models were not substantially different. Additionally, the
Company has elected to adopt SFAS No. 123R on a modified prospective basis.
Note 8
Stock-Based Compensation
Under various stock incentive plans, BNSF has granted options to BNSF Railway employees to purchase BNSF common stock
at a price not less than fair market value at the date of grant. Certain employees of the Company also participate in BNSF's other
long-term incentive plans including, among other things, restricted stock and a discounted stock purchase program. The Company
applies Accounting Principles Board (APB) Opinion 25, Accounting for Stock Issued to Employees, and related interpretations in
accounting for its participation in these stock plans. In accordance with APB Opinion 25, the Company records the intrinsic value of
stock-based compensation as expense. Accordingly, no compensation expense has been recognized for the fixed stock options as
the exercise price equals the stock price on the date of grant. Stock-based compensation expense related to restricted stock and
restricted stock units has been recognized as compensation expense.
The following table illustrates the effect on net income if the Company had applied the fair value recognition provisions of SFAS
No. 123, Accounting for Stock-Based Compensation, to stock-based employee compensation (in millions):
Year Ended December 31, 2005 2004 2003
Net income, as reported $ 1,778 $ 1,000 $ 1,023
Stock-based employee compensation expense included in reported net income, net of related tax effects 23 19 11
Total stock-based compensation expense determined under fair value method for all awards, net of related tax effects (42) (41) (36)
Pro forma net income $ 1,759 $ 978 $ 998
Railroad Annual Report R-1
THIS PAGE INTENTIONALLY LEFT BLANK
Railroad Annual Report R-1
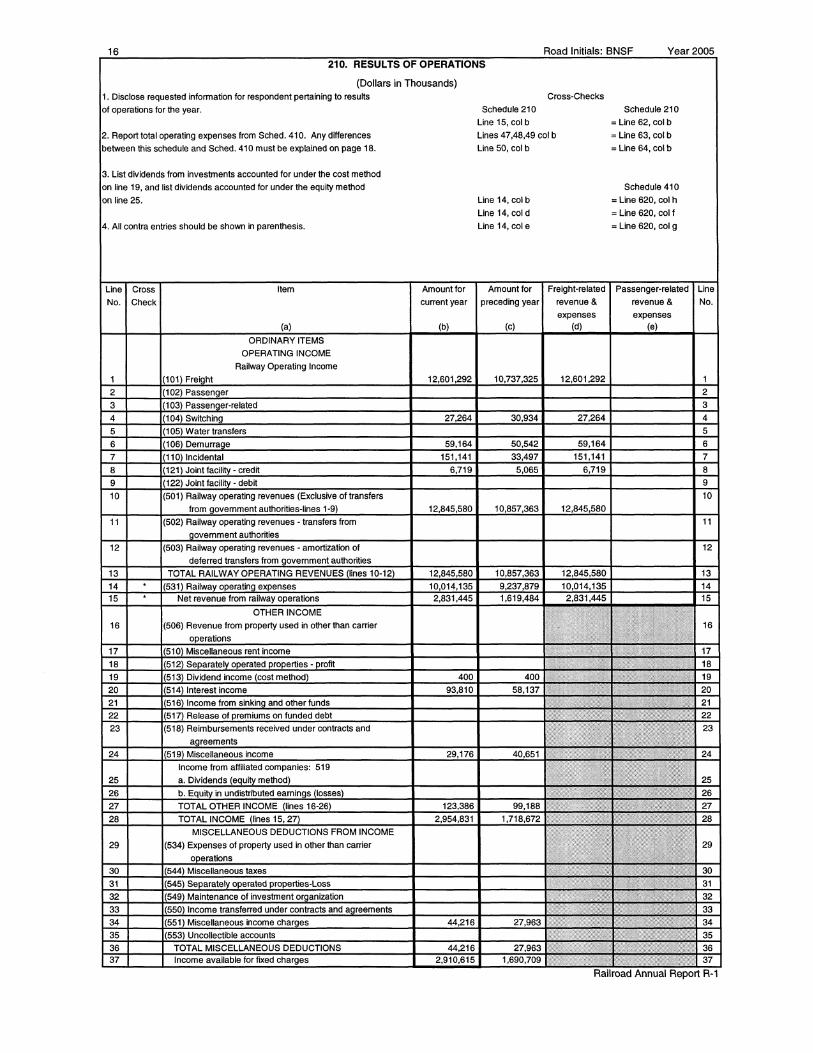
16 Road Initials: BNSF Year2005 210. RESULTS OF OPERATIONS
(Dollars in Thousands) 1. Disclose requested information for respondent pertaining to results
of operations for the year.
2. Report total operating expenses from Sched. 410. Any differences
between this schedule and Sched. 41 O must be explained on page 18.
3. List dividends from investments accounted for under the cost method
on line 19, and list dividends accounted for under the equity method
on line 25.
4. All contra entries should be shown in parenthesis.
Line Cross Item
No. Check
(a)
ORDINARY ITEMS
OPERATING INCOME
Railway Operating Income
1 (101 Freight
2 (102) Passen er
3
4
5
6 (106) Demurra e
7 (110) Incidental
8 (121) Joint facility - credit
9 (122) Joint facili -debit
10 (501) Railway operating revenues (Exclusive of transfers
from government authorities-lines 1-9)
11 (502) Railway operating revenues - transfers from
ovemment authorities
12 (503) Railway operating revenues - amortization of
deferred transfers from overnment authorities
13 TOTAL RAILWAY OPERATING REVENUES (lines 10-12)
14 (531) Railwa operatin expenses 15 Net revenue from railway operations
OTHER INCOME
16 (506) Revenue from property used in other than carrier
operations
17 (510) Miscellaneous rent income
18 (512 Separate! operated properties - profit
19 (513) Dividend income (cost method)
20 514) Interest income
21 (516 Income from sinkin and other funds
22 517) Release of premiums on funded debt
23 (518) Reimbursements received under contracts and
a reements
24 (519 Miscellaneous income
25
26 b. Equ· in undistributed eamin s (losses)
27 TOTAL OTHER INCOME (lines 16-26)
28 TOTAL INCOME (lines 15, 27)
MISCELLANEOUS DEDUCTIONS FROM INCOME
29 (534) Expenses of property used in other than carrier
operations
30 (544) Miscellaneous taxes
31 (545) Se aratel operated properties-Loss
32 (549) Maintenance of investment organization
33 (550) Income transferred under contracts and a reements
34 (551) Miscellaneous income char es
35 (553) Uncolleciible accounts
36 TOTAL MISCELLANEOUS DEDUCTIONS 37 Income available for fixed charges
Amount for
current year
(b)
12,601,292
27,264
59,164
151,141
6,719
12,845,580
12,845,580
10,014,135 2,831,445
400
93,810
29,176
123,386
2,954,831
44,216
44,216 2,910,615
Schedule 21 O
Line 15, col b
Cross-Checks
Lines 47,48,49 col b
Line 50, col b
Line 14, col b
Line 14, col d
Line 14, col e
Amount for
preceding year
(c)
10,737,325
30,934
50,542
33,497
5,065
10,857,363
10,857,363
9,237,879 1,619,484
400
58,137
40,651
99,188
1,718,672
27,963
27,963 1,690,709
Freight-related
revenue &
expenses (d)
12,601,292
27,264
59,164
151,141
6,719
12,845,580
12,845,580
Schedule 210
= Line 62, col b
= Line 63, col b
= Line 64, col b
Schedule 41 O
= Line 620, col h
= Line 620, col f
= Line 620, col g
Passenger-related
revenue &
expenses (e)
Line
No.
2
3
4
5
6
7
8
9
10
11
12
13
14
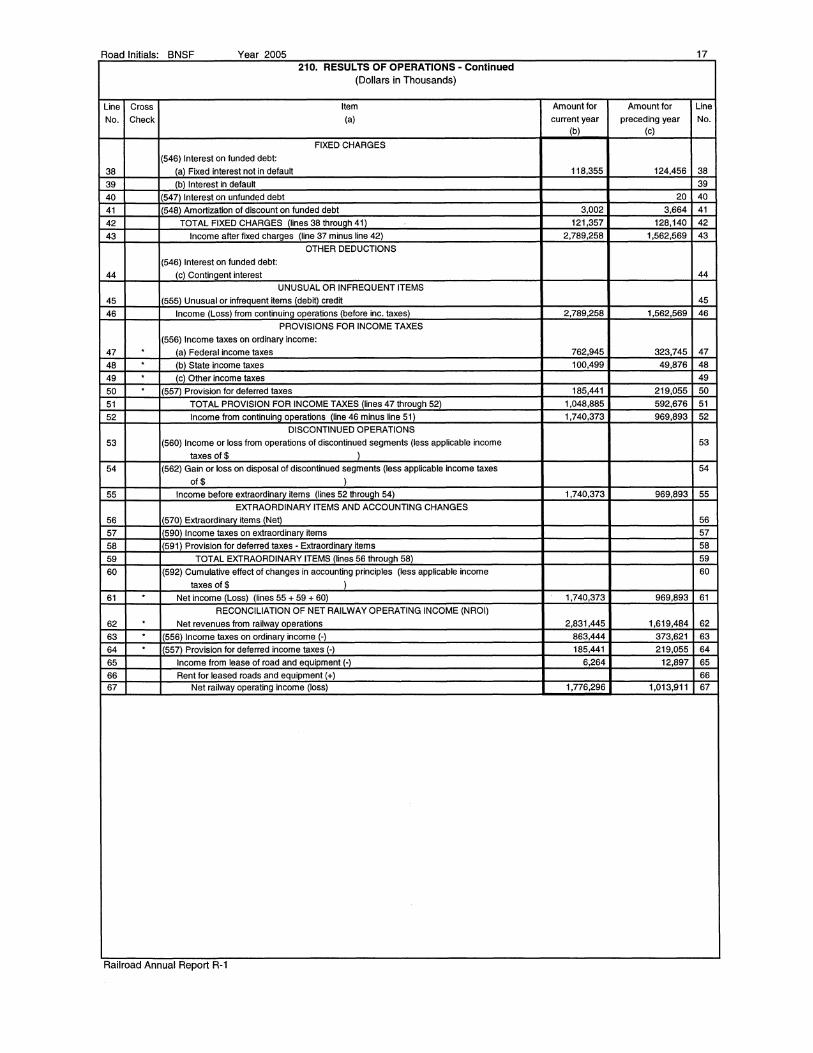
Road Initials: BNSF Year 2005 17 210. RESULTS OF OPERATIONS- Continued
(Dollars in Thousands)
Line Cross Item Amount for Amount for Line
No. Check (a) current year preceding year No. (b) (c)
FIXED CHARGES
(546) Interest on funded debt:
38 (a) Fixed interest not in default 118,355 124,456 38
39 lb) Interest in default 39
40 (547) Interest on unfunded debt 20 40
41 11548) Amortization of discount on funded debt 3,002 3,664 41
42 TOTAL FIXED CHARGES (lines 38 through 41) 121,357 128,140 42
43 Income after fixed charges (line 37 minus line 42) 2,789,258 1,562,569 43 OTHER DEDUCTIONS
(546) Interest on funded debt:
44 (c) Continoent interest 44 UNUSUAL OR INFREQUENT ITEMS
45 (555) Unusual or infrequent items (debit) credit 45
46 Income (Loss) from continuina operations (before inc. taxes) 2,789,258 1,562,569 46 PROVISIONS FOR INCOME TAXES
(556) Income taxes on ordinary income:
47 . (al Federal income taxes 762,945 323,745 47
48 . (b) State income taxes 100,499 49,876 48
49 . (cl Other income taxes 49
50 . 11557) Provision for deferred taxes 185,441 219,055 50
51 TOTAL PROVISION FOR INCOME TAXES (lines 47 through 52) 1,048,885 592,676 51
52 Income from continuina ooerations (line 46 minus line 51) 1,740,373 969,893 52 DISCONTINUED OPERATIONS
53 (560) Income or loss from operations of discontinued segments (less applicable income 53
taxes of$ )
54 (562) Gain or loss on disposal of discontinued segments (less applicable income taxes 54
of$ )
55 Income before extraordinarv Items (lines 52 throuah 54) 1,740,373 969,893 55 EXTRAORDINARY ITEMS AND ACCOUNTING CHANGES
56 (570) Extraordinarv Items (Net) 56 57 (590) Income taxes on extraordinarv items 57
58 (591) Provision for deferred taxes - Extraordinarv items 58
59 TOTAL EXTRAORDINARY ITEMS !lines 56 lhrough 58) 59
60 (592) Cumulative effect of changes in accounting principles (less applicable income 60 taxes of$ )
61 . Net income (Loss) (lines 55 + 59 + 60) 1,740,373 969,893 61 RECONCILIATION OF NET RAILWAY OPERATING INCOME (NROI)
62 . Net revenues from railwav operations 2,831,445 1,619,484 62
63 . (556) Income taxes on ordinary income (-) 863,444 373,621 63 64 . (557) Provision for deferred income taxes(-) 185,441 219,055 64
65 Income from lease of road and equipment(-) 6,264 12,897 65
66 Rent for leased roads and equipment(+) 66 67 Net railway operating income (loss) 1,776,296 1,013,911 67
Railroad Annual Report R-1

18 Road Initials: BNSF Year2005
NOTES AND REMARKS FOR SCHEDULE 210 AND 220
THIS PAGE INTENTIONALLY LEFT BLANK
Railroad Annual Report R-1
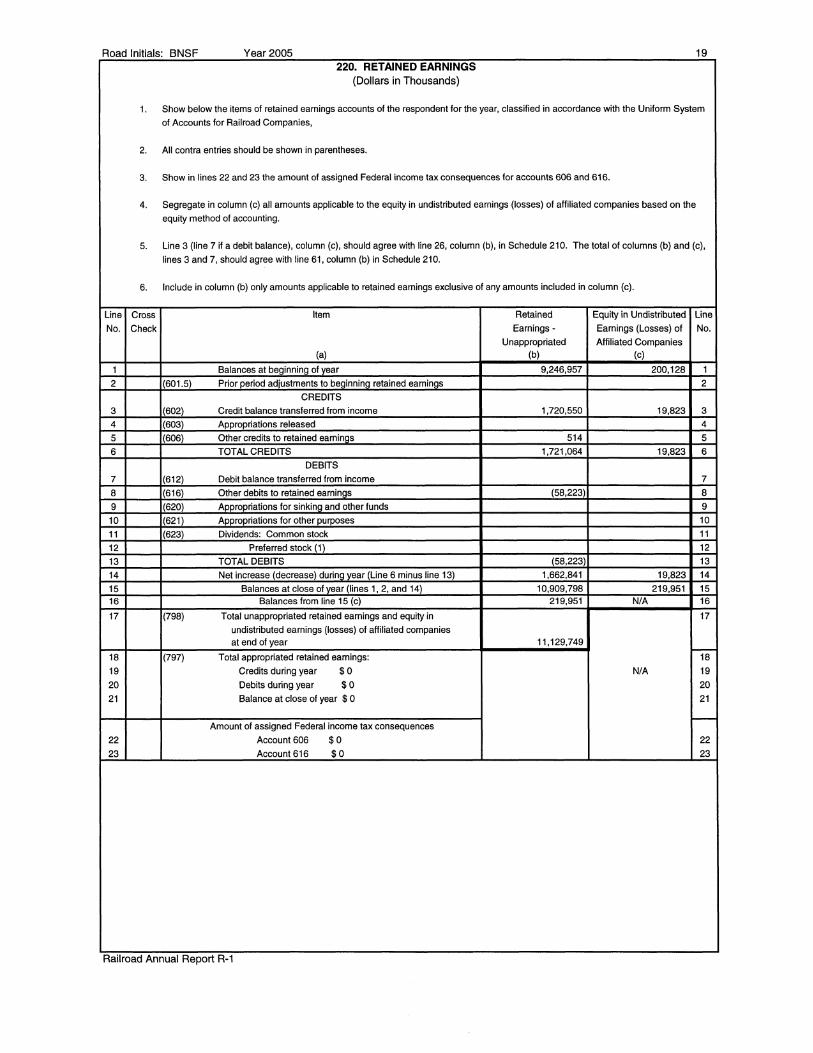
Road Initials: BNSF Year2005 19 220. RETAINED EARNINGS
(Dollars in Thousands)
1. Show below the items of retained earnings accounts of the respondent for the year, classified in accordance with the Uniform System
of Accounts for Railroad Companies,
2. All contra entries should be shown in parentheses.
3. Show in lines 22 and 23 the amount of assigned Federal income tax consequences for accounts 606 and 616.
4. Segregate in column (c) all amounts applicable to the equity in undistributed earnings (losses) of affiliated companies based on the
equity method of accounting.
5. Line 3 (line 7 if a debit balance), column (c), should agree with line 26, column (b), in Schedule 210. The total of columns (b) and (c),
lines 3 and 7, should agree with line 61, column (b) in Schedule 210.
6. Include in column (b) only amounts applicable to retained earnings exclusive of any amounts included in column (c).
Line Cross Item Retained Equity in Undistributed Line
No. Check Earnings- Earnings (Losses) of No.
Unappropriated Affiliated Companies (a) (b) (c)
1 Balances at beginning of year 9,246,957 200,128 1
2 (601.5) Prior oeriod adiustments to beainnina retained eaminas 2
CREDITS
3 (602) Credit balance transferred from income 1,720,550 19,823 3
4 (603) Appropriations released 4
5 (606) Other credits to retained earnings 514 5
6 TOTAL CREDITS 1,721,064 19,823 6
DEBITS
7 (612) Debit balance transferred from income 7
8 (616) Other debits to retained earnings (58,223) 8
9 (620) Appropriations for sinking and other funds 9
10 (621) Appropriations for other purposes 10
11 (623) Dividends: Common stock 11
12 Preferred stock (1) 12
13 TOTAL DEBITS (58,223) 13
14 Net increase (decrease) during year (Line 6 minus line 13) 1,662,841 19,823 14
15 Balances at close of vear (lines 1, 2, and 14) 10,909,798 219,951 15 16 Balances from line 15 (c) 219,951 N/A 16
17 (798) Total unappropriated retained earnings and equity in 17
undistributed earnings (losses) of affiliated companies at end of year 11,129,749 -18 (797) Total appropriated retained earnings: 18
19 Credits during year $0 N/A 19
20 Debits during year $0 20
21 Balance at close of year $ O 21
-Amount of assigned Federal income tax consequences
22 Account 606 $0 22
23 Account 616 $0 23
Railroad Annual Report R-1

I JJ !!!. a ~ )> :J :J c !!!. JJ CD
"O 0 ;::i.
:!:
1 2 3 4
Line No. 1 2 3 4 5 6 7 8 9 10
1 2 3 4 5 6
Line No. 11 12 13 14 15 16 17
230. CAPITAL STOCK PART I. CAPITAL STOCK
{Dollars in Thousands) Disclose in column {a) the particulars of the various issues of capital stock of the respondent, distinguishing separate issues of any general class, if different in any respect. Present in column {b) the par or stated value of each issue. If none, so state. Disclose in columns {c), {d), {e), and {f) the required information concerning the number of shares authorized, issued, in treasury, and outstanding for the various issues.
For the purposes of this report, capital stock and other securities are considered to be nominally issued when certificates are signed and sealed and placed with the proper officer for sale and delivery or are pledged or otherwise placed in some special fund of the respondent. They are considered to be actually issued when sold to a bona fide purchaser who holds them free from control by the respondent. All securities actually issued and not reacquired by or for the respondent are considered to be actually outstanding. If reacquired by or for the respondent, and not canceled or retired, they are considered to be nominally outstanding.
Number of Shares Book Value at End of Year Class of Stock Par Value Authorized Issued In Treasury Outstanding Outstanding In Treasury
{a) {b) {c) {d) {e) (f) {g) {h) Common - BNSF 1,000.00 1,000 1,000 NONE 1,000 1 NONE
1,000.00 1,000 1,000 NONE 1,000 1 NONE PART II. SUMMARY OF CAPITAL STOCK CHANGES DURING YEAR
{Dollars in Thousands) The purpose of this part is to disclose capital stock changes during the year. Column {a) presents the items to be disclosed. Columns {b), {d), and {f) require disclosure of the number of shares of preferred, common, and treasury stock applicable to the items in column {a). Columns {c), {e), and {g) require the disclosure of the book value of preferred, common, and treasury stock. Disclose in column {h) the additional paid-in capital realized from changes in capital stock during the year. Unusual circumstances arising from changes in capital stock shall be fully explained in footnotes to this schedule.
Preferred Stock Common Stock Treasury Stock Additional Item No. of Shares $Amount No. of Shares $Amount No. of Shares $Amount Capital$ {a) {b) {c) {d) {e) {f) {g) {h)
Balance at beoinning of year NONE NONE 1,000 1 NONE NONE 6,285,726 Capital stock sold Capital stock reacquired Capital stock cancelled
Balance at close of year NONE NONE 1,000 1 NONE NONE 6,285,726
Line No. 1 2 3 4 5 6 7 8 9
10
Line No. 11 12 13 14 15 17 18
1: l\J 0
JJ 0
~ 3" ;::;:
2!.: !'? CD z (J) ,.,
~ ~ l\J
8 (11

Road Initials· BNSF Year 2005 21 240. STATEMENT OF CASH FLOWS
(Dollars in Thousands)
Give the information as requested concerning the cash flows during the year. Either the direct or indirect method can be used. The direct
method shows as its principal components operating cash receipts and payments, such as cash received from customers and cash paid to
suppliers and employees, the sum of which is net cash flow from operating activities. The indirect method starts with net income and adjusts it
for revenues and expense items that were not the result of operating cash transactions in the current period to reconcile it to net cash flow from
operating activities If the direct method is used, complete lines 1 through 41. If the indirect method is used complete lines 1 O through 41. Cash,
for the purpose of this schedule, shall include cash and cash equivalents which are short-term, highly liquid investments readily convertible to
known amounts of cash and so near their maturity that they present insignificant risk of changes in value because of changes in interest rates.
Information about all investing and finance activities which do not directly affect cash shall be separately disclosed in footnotes to this schedule.
They shall clearly relate the cash (ii any) and noncash aspects of transactions. Examples of noncash investing and transactions include
converting debt to equity, acquiring assets by assuming directly related liabilities, such as purchasing a building by incurring a mortgage to the
seller; obtaining an asset by entering into a capital lease; and exchanging noncash assets or liabilities for other noncash assets or liabilities.
Some transactions are part cash and part noncash; only the cash portion shall be reported directly in the statement of cash flows. Refer to FAS
Statement No. 95, Statement of Cash Flows, for further details.
CASH FLOWS FROM OPERATING ACTIVITIES
Line Cross Description Current Year Previous Year Line No. Check (a) (b) (c) No.
1 Cash received from operating revenues 1
2 Dividends received from affiliates 2
3 Interest received 3
4 Other income 4
5 Cash paid for operating expenses 5
6 Interest paid (net of amounts capitalized) 6
7 Income taxes paid 7
8 Other- net 8 9 NET CASH PROVIDED BY OPERATING ACTIVITIES (lines 1 through 8) 9
RECONCILIATION OF NET INCOME TO NET CASH PROVIDED BY OPERATING ACTIVITIES
Line Cross Description Current Year Previous Year Line No. Check (a) (b) (c) No.
10 Income from continuing operations 1,740,373 969,893 10
ADJUSTMENTS TO RECONCILE INCOME FROM CONTINUING OPERATIONS TO NET CASH PROVIDED BY OPERATING ACTIVITIES
Line Cross Description Current Year Previous Year Line No. Check (a) (b) (c) No.
11 Loss (aain) on sale or disposal of tanaible propertv and investments (34,506) (40,618) 11
12 Depreciation and amortization expenses 1,115,867 1,037,948 12
13 Net increase (decrease) in provision for Deferred Income Taxes 185,441 219,055 13
14 Net decrease (increase) in undistributed earnings (losses) of affiliates 19,823 11,517 14
15 Decrease (increase) in accounts receivable (491,170) (37,220) 15
16 Decrease (increase) in material and supplies and other current assets (44,996) (196,235) 16
17 Increase (decrease) in current liabilities other than debt 432,904 268,156 17
18 Increase (decrease) in other - net (345,492) 299,401 18
19 Net cash provided from continuina operations (lines 10 throuah 18) 2,578,244 2,531,897 19
20 Add (Subtract) cash generated (paid) by reason of discontinued 20
operations and extraordinary items 21 NET CASH PROVIDED FROM OPERATING ACTIVITIES (lines 19 and 20) 2,578,244 2,531,897 21
CASH FLOWS FROM INVESTING ACTIVITIES
Line Cross Description Current Year Previous Year Line No. Check (a) (b) (c) No.
22 Proceeds from sale of property 34,506 40,618 22
23 Capital expenditures (1,717,294) (1,496,415) 23
24 Net change in temporary cash investments not qualifying as cash 24
equivalents
25 Proceeds from sale/repayment of investment and advances 25
26 Purchase price of long-term investment and advances 26
27 Net decrease (increase) in sinkin!I and other special funds 27
28 Other- net (271,324 (65,277) 28 29 NET CASH USED IN INVESTING ACTIVITIES (lines 22 through 28) (1,954, 112) (1,521,074) 29
(Continued on next page)
Railroad Annual Report R-1

22 Road Initials· BNSF Year2005 240. STATEMENT OF CASH FLOWS (Concluded)
(Dollars in Thousands)
CASH FLOWS FROM FINANCING ACTIVITIES
Line Cross Description Current Year Previous Year Line
No. Check (a) (b) (c) No.
30 Proceeds from issuance of long-term debt 30
31 Principal payments of long-term debt (163,504 (304,983) 31
32 Proceeds from issuance of capital stock 32
33 Purchase price of acQuiring treasury stock 33
34 Cash dividends paid 34
35 Other- net (757,825) (402,350) 35
36 NET CASH FROM FINANCING ACTIVITIES (lines 30 through 35) (921,329) (707,333) 36
37 NET INCREASE (DECREASE) IN CASH AND CASH EQUIVALENTS 37
(lines 21, 29, and 36) (297,197) 303,490
38 Cash and cash equivalents at beginning of the vear 321,442 17,952 38
39 CASH AND CASH EQUIVALENTS AT END OF THE YEAR (lines 37 & 38) 24,245 321,442 39
Footnotes to Schedule
Cash paid during the year for:
40 Interest (net of amount capitalized) * 125,237 161, 149 40 41 Income taxes (net) * 635,879 254,513 41
* Only applies if indirect method is adopted
NOTES AND REMARKS
.
Railroad Annual Report R-1

Road Initials: BNSF Year 2005 23 245. WORKING CAPITAL
(Dollars in Thousands)
1 This schedule should include only data pertaining to railway transportation services.
2 Carry out calculations of lines 9, 10, 20, and 21 to the nearest whole number.
Line Item Source Amount Line
No. (a) (b) No.
CURRENT OPERATING ASSETS
1 Interline and other balances (705) Sched. 200, line 5, col. b 104,543 1
2 Customers (706) Sched. 200, line 6, col. b 506,901 2
3 Other (707) Note A 39,184 3
4 TOTAL CURRENT OPERATING ASSETS Lines 1 +2+3 650,628 4
OPERATING REVENUE
5 Railway operating revenue Schad. 210, line 13, col. b 12,845,580 5
6 Rent income NoteB (181,055) 6
7 TOTAL OPERATING REVENUES Lines 5 + 6 12,664,525 7
8 AveraQe daily operatin!l revenues Line 7 + 360 days 35,179 8
9 Days of operating revenue in current 9
operatina assets Line 4 +line 8 18
10 Revenue delav davs plus buffer Line 9 + 15 davs 33 10
CURRENT OPERATING LIABILITIES
11 Interline and other balances (752) Sched. 200, line 31, col. b 83,736 11
12 Audited accounts and waaes payable (753) Sched. 200, line 32, col. b 223,074 12
13 Accounts pavable - other (754) Sched. 200, line 33, col. b 151,425 13
14 Other taxes accrued (761.5) Note A 153,687 14
15 TOTAL CURRENT OPERATING LIABILITIES Sum of lines 11 throuah 14 611,922 15
OPERATING EXPENSES
16 Railway operating expenses Sched. 210, line 14, col. b 10,014,135 16
17 Depreciation Sched 410, lines 136, 137, 138, 213, 232, 317, col. h 1,115,867 17
18 Cash related operatinQ expenses Line 16 +line 6 - line 17 8,717,213 18
19 Average daily expenditures Line 18 + 360 days 24,214 19
20 Days of operating expenses in current 20
operalin!l liabillties Line 15 +line 19 25
21 Days of workina capita! reauired Line 1 O - line 20 (Note C) 8 21
22 Cash workina capita! required Line 21xline19 193,716 22
23 Cash and temporary cash balance Sched. 200, line 1 +line 2, col. b 24,245 23
24 Cash workina capita! allowed Lesser of line 22 or line 23 24,245 24
MATERIALS AND SUPPLIES
25 Total materials and supplies (712) Schad. 200, line 12, col. b 396,293 25
26 Scrap and obsolete material included in account 712 Note A 26
27 Materials and supplies held for common carrier 27
purposes Line 25 • line 26 396,293
28 TOTAL WORKING CAPITAL Line 24 + line 27 420,538 28
NOTES:
(A) Use common carrier portion only. Common carrier refers to railway transportation service
(B) Rent income is the sum of Schedule 410, column h, lines 121, 122, 123, 127, 128, 129, 133, 134, 135, 208, 210, 212, 227, 229, 231, 312, 314,
and 316. Rent income is added to railway operating revenues to produce total revenues. Rent income is also added to total operating
expenses to exclude the rent revenue Items from operating expense.
(C) If result is negative, use zero.
Railroad Annual Report R-1

24 Road Initials: BNSF Year2005
NOTES AND REMARKS
THIS PAGE INTENTIONALLY LEFT BLANK
Railroad Annual Report R-1

Road Initials: BNSF Year2005
GENERAL INSTRUCTIONS CONCERNING RETURNS IN SCHEDULES 310, 310A
1. Schedule 31 O should give particulars of stocks, bonds, other secured obligations, unsecured notes, and investment advances of affiliated companies held by respondent at close of year. Also, disclose the investments made, disposed of, and written down during the year and the applicable dividends and interest credited to income as a result of those investments. They should exclude securities issued or assumed by respondent. For definition of affiliated companies, see the rules governing Account No. 721 "Investments and Advances; Affiliated Companies', in the Uniform System os Accounts for Railroad Companies.
2. List the investments in the following order and show a total for each group and each class of investments by accounts in numerical order:
(A) Stocks
(1) Carriers-active
(2) Carriers-inactive
(3) Noncarriers-active
(4) Noncarriers-inactive
(B) Bonds (including US government bonds)
(C) Other secured obligations
(D) Unsecured notes
(E) Investment advances
3. The subclassification of classes (B), (C), (D), and (E) should be the same as that provided for class (A).
4. The kinds of industry represented by respondent's investments in the securities of other companies should be shown by symbol opposite the the names of the issuing corporations, the symbols and industrial classHications to be as follows:
Symbol Kind of Industry
Agriculture, forestry, and fisheries
II Mining
Ill Construction
IV Manufacuring
V Wholesale and retail trade
VI Finance, insurance, and real estate
VII Transportation, communications, and other public utillties
VIII Services
IX Government
X All other
5. By carriers, as the term is used here, is meant companies owning or operating railroads, facilities auxiliary thereto such as bridges, ferries, union deposts, and other terminal facilities, sleeping cars, parlor cars, dining cars, freight cars, express service and facillties, electric railways, highway motor vehicles, steamboats and other marine transportation equipment, pipe lines (other than those for transportation of water), and other instrumentalities devoted to the transportation of persons or property for hire. Telegraph and telephone companies are not meant to be included.
6. Noncarrier companies should, for the purpose of these schedules, include telephone companies, telegraph companies, mining companies, manufacturing companies, hotel companies, etc. Purely "holding companies" are to be classed as noncarrier companies, even though the securities held by such companies are largely or entirely those issued or assumed by carriers.
7. By an active corporation is meant one which maintains an organization for operating property or administering Its financial affairs. An inactive corporation is one which has been practically absorbed in a controlling corporation and which neither operates property nor administers its financial affairs. If It maintains an organization it does so only for the purpose of complying with legal requirements and maintaining title to property or franchises.
8. Combine, in one amount, investments in which the original cost or present equity in total assets is less than $10,000.
9. Include investments in unincorporated entities such as lessee organizations. Exclude amounts normally settled on a current basis.
10. Do not include the value of securities issued or assumed by respondent.
11. For affiliates which do not report to the Surface Transportation Board and are jointly owned, disclose in footnotes the name and extent of control of the other controlling entities.
Railroad Annual Report R-1
25
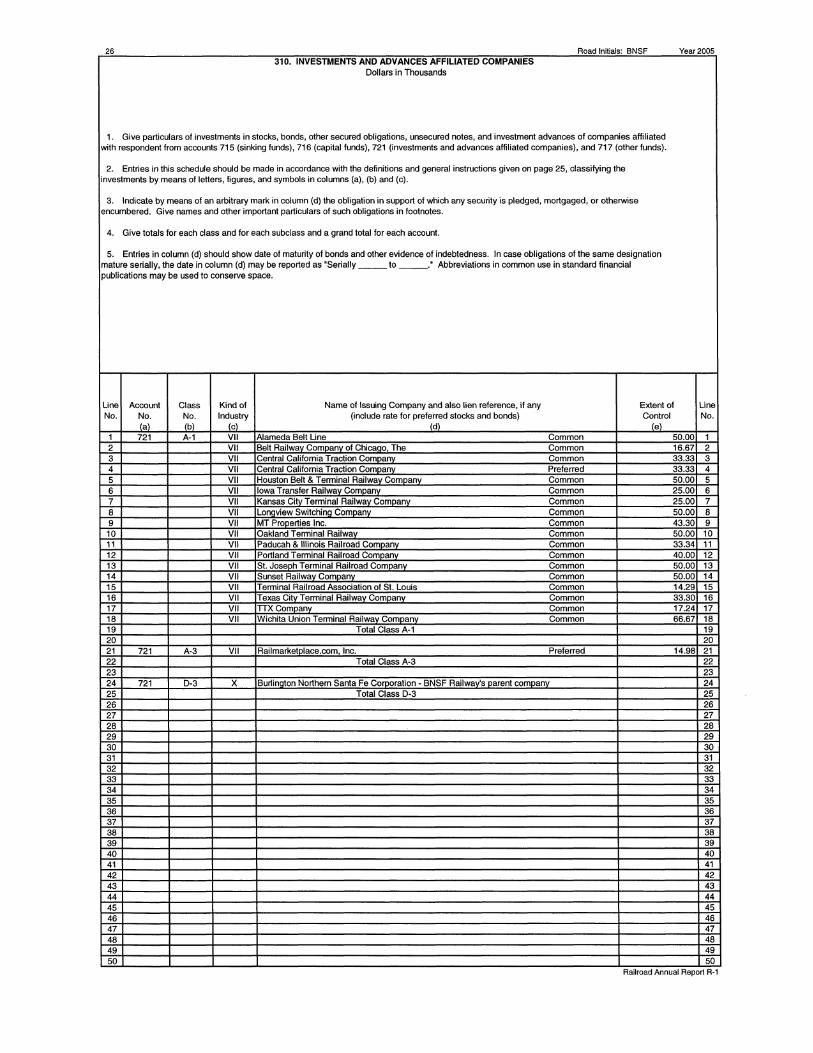
26 R dl"til BNSF oa mas: y 2005 ear 310. INVESTMENTS AND ADVANCES AFFILIATED COMPANIES
Dollars in Thousands
1. Give particulars of investments in stocks, bonds, other secured obligations, unsecured notes, and investment advances of companies affiliated with respondent from accounts 71 S (sinking funds), 716 (capital funds), 721 (investments and advances affiliated companies), and 717 (other funds).
2. Entries in this schedule should be made in accordance with the definitions and general instructions given on page 2S, classifying the investments by means of letters, figures, and symbols in columns (a), (b) and (c).
3. Indicate by means of an arbitrary mark in column (d) the obligation in support of which any security is pledged, mortgaged, or otherwise encumbered. Give names and other important particulars of such obligations in footnotes.
4. Give totals for each class and for each subclass and a grand total for each account.
s. Entries in column (d) should show date of maturity of bonds and other evidence of indebtedness. In case obligations of the same designation mature serially, the date in column (d) may be reported as 'Serially ___ to ___ . • Abbreviations in common use in standard financial publications may be used to conserve space.
Line Account Class Kine! of Name of Issuing Company ancl also lien reference, if any Extent of Line No. No. No. Industry (include rate for preferred stocks and bonds) Control No.
la) (bl le\ Id\ le\ 1 721 A-1 VII Alameda Belt Line Common S0.00 1 2 VII Belt Railwav Comoanv of Chicaao The Common 16.67 2 3 VII Central California Traction Comoanv Common 33.33 3 4 VII Central California Traction Comoanv Preferred 33.33 4 s VII Houston Belt & Terminal Railwav Comoanv Common SO.OD s 6 VII Iowa Transfer Railway Comoany Common 2S.OO 6 7 VII Kansas Citv Terminal Railwav Comoanv Common 2S.OO 7 8 VII Lonoview Switchino Company Common SO.OD 8 9 VII MT Prooerties Inc. Common 43.30 9 10 VII Oakland Terminal Railwav Common SO.OD 10 11 VII Paducah & Illinois Railroad Comoanv Common 33.34 11 12 VII Portland Terminal Railroad Comoanv Common 40.00 12 13 VII St. Joseph Terminal Railroad Company Common SO.OD 13 14 VII Sunset Railwav Comoanv Common SO.OD 14 1S VII Terminal Railroad Association of St. Louis Common 14.29 1S 16 VII Texas Citv Terminal Railway Company Common 33.30 16 17 VII nxcomoanv Common 17.24 17 18 VII Wichita Union Terminal Railwav Comoanv Common 66.67 18 19 Total Class A-1 19 20 20 21 721 A-3 VII Railmarketolace.com, Inc. Preferred 14.98 21 22 Total Class A-3 22 23 23 24 721 0-3 x Burlinaton Northern Santa Fe Corooration - BNSF Railwav's oarent comoanv 24 2S Total Class D-3 2S 26 26 27 27 28 28 29 29 30 30 31 31 32 32 33 33 34 34 35 3S 36 36 37 37 38 38 39 39 40 40 41 41 42 42 43 43 44 44 45 45 46 46 47 47 48 48 49 49 50 so
Railroad Annual Report R-1
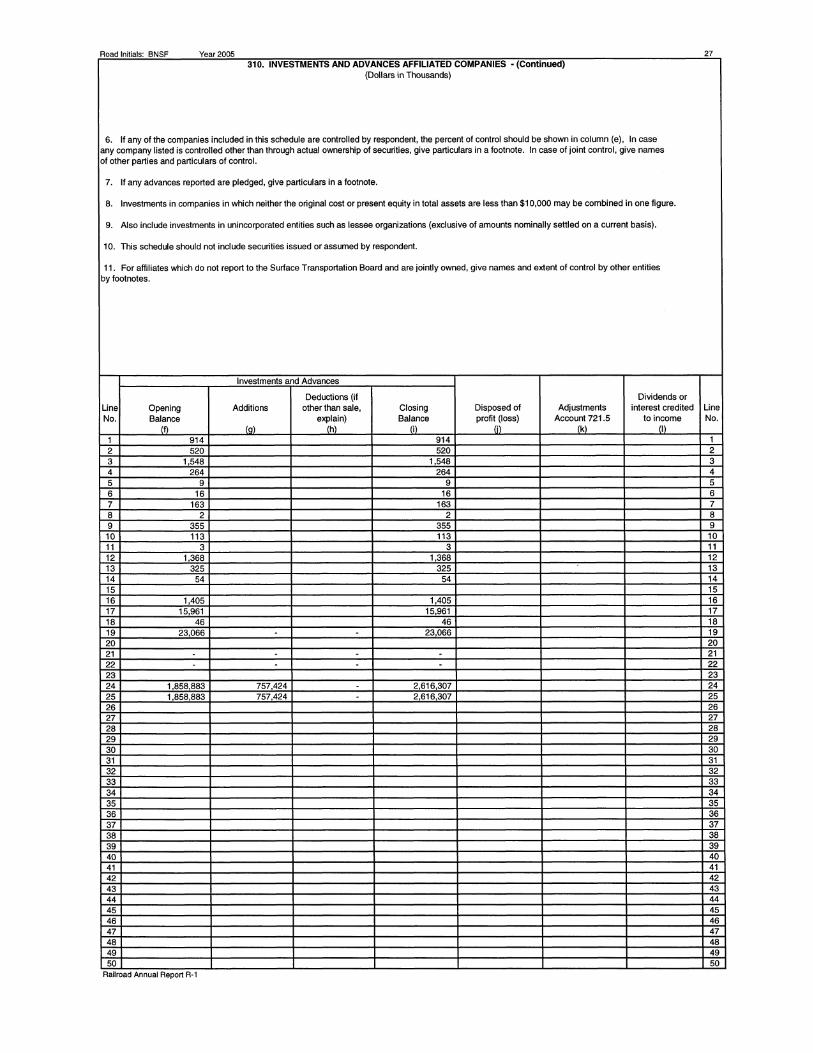
Road Initials· BNSF Year2005 27
310. INVESTMENTS AND ADVANCES AFFILIATED COMPANIES - (Continued) (Dollars in Thousands)
6. If any of the companies included in this schedule are controlled by respondent, the percent of control should be shown in column (e), In case any company listed is controlled other than through actual ownership of securities, give particulars in a footnote. In case of joint control, give names of other parties and particulars of control.
7. If any advances reported are pledged, give particulars in a footnote.
8. Investments in companies in which neither the original cost or present equity in total assets are less than $10,000 may be combined in one figure.
9. Also include investments in unincorporated entities such as lessee organizations (exclusive of amounts nominally settled on a current basis).
10. This schedule should not include securities issued or assumed by respondent.
11. For affiliates which do not report to the Surface Transportation Board and are jointly owned, give names and extent of control by other entities by footnotes.
Investments and Advances
Deductions (if Dividends or Line Opening Additions other than sale, Closing Disposed of Adjustments interest credited Line No. Balance explain) Balance profit (loss) Account 721.5 to income No.
m Cal lhl lil lil lkl (I\
1 914 914 1 2 520 520 2 3 1,548 1 548 3 4 264 264 4 5 9 9 5 6 16 16 6 7 163 163 7 8 2 2 8 9 355 355 9 10 113 113 10 11 3 3 11 12 1,368 1,368 12 13 325 325 13 14 54 54 14 15 15 16 1,405 1 405 16 17 15,961 15,961 17 18 46 46 18 19 23,066 - 23 066 19 20 20 21 - - - - 21 22 - - - - 22 23 23 24 1,858 883 757,424 - 2,616,307 24 25 1 858,883 757,424 - 2 616 307 25 26 26 27 27 28 28 29 29 30 30 31 31 32 32 33 33 34 34 35 35 36 36 37 37 38 38 39 39 40 40 41 41 42 42 43 43 44 44 45 45 46 46 47 47 48 48 49 49 50 so
Railroad Annual Report R-1

28 Road Initials· BNSF Year2005 310. INVESTMENTS AND ADVANCES AFFILIATED COMPANIES· (Continued)
(Dollars in Thousands)
Line Account Class Kind of Name of Issuing Company and also lien reference, if any Extent of Line No. No. No. Industry (include rate for preferred stocks and bonds) Control No.
(al (b) (cl (d) (el 1 721 E-1 VII Alameda Belt Line 1 2 VII Central California Traction Company 2 3 VII Houston Belt & Tenninal Railwav Comoanv 3 4 VII Kansas Citv Tenninal Railwav Comoanv 4 5 VII Lonoview Switchino Comoanv 5 6 VII MT Prooerties Inc. 6 7 VII Paducah & Illinois Railroad Comoanv 7 8 VII Port Tenninal Railroad Association 8 9 VII St. Joseoh Tenninal Railroad Comoanv 9
10 VII Sunset Railway Comoanv 10 11 VII Tenninal Railroad Association of St. Louis 11 12 VII Texas Citv Tenninal Railwav Comoanv 12 13 VII Wichita Tenninal Association 13 14 VII Wichita Union Tenninal Railwav Comoanv 14 15 Total Class E-1 15 16 16 17 721 E-3 x Kinder Moraan Enerav Partners L. P. 0.05 17 18 721 E-3 x Montauk Svfuels LLC 50.00 18 19 Total Class E-3 X 19 20 20 21 Eauitv Eamina ILoss) - Schedule 310A 21 22 22 23 Grand Total Account 721 23 24 24 25 25 26 26 27 27 28 28 29 29 30 30 31 31 32 32 33 33 34 34 35 35 36 36 37 37
Railroad Annual Report R-1

Road lnltials· BNSF Year2005 29 310. INVESTMENTS AND ADVANCES AFFILIATED COMPANIES ·(Concluded)
(Dollars in Thousands)
Investments and Advances Deductions (if Dividends or
Line Opening Additions other than sale, Closing Disposed of Adjustments interest credited Line No. Balance explain) Balance profit (loss) Account 721.5 to income No.
(f) la\ lh\ Ii\ Ii\ Ck\ II\ 1 15001 (500 1 2 1,494 1 494 2 3 16865 1 223 18088 3 4 8,982 8,982 4 5 63 63 5 6 (369) (369 6 7 575 575 7 8 1,100 1,100 8 9 191 191 9 10 845 845 10 11 11 12 30 30 12 13 4 4 13 14 844 844 14 15 30,124 1,223 - 31,347 15 16 16 17 4500 4500 17 18 11,700 12,737 11 037 18 19 2,800 12,737 11 037 4500 19 20 20 21 212,886 14,973 227 859 21 22 22 23 2 127 759 786 357 11,037 2 903,079 23 24 24 25 25 26 26 27 27 28 28 29 29 30 30 31 31 32 32 33 33 34 34 35 35 36 36 37 37
(h). Mantauk Synfuels LLC loss; 11,037
Railroad Annual Report R-1

29A
310. NOTES AND REMARKS
(1) ALAMEDA BELT LINE BNSF Railway Company Union Pacific Railroad Company
(2) BELT RAILWAY COMPANY OF CHICAGO, THE CSX Transportation, Inc. Norfolk Southern Company BNSF Railway Company Grand Trunk Western Railroad and Illinois Central Railroad Company Soo Line Railroad Company Union Pacific Railroad Company
5, 198 shares are held by U.S. Bank, N.A., Trustee, as collateral under the BNI Consolidated Mortgage.
(3) CENTRAL CALIFORNIA TRACTION COMPANY Union Pacific Railroad Company BNSF Railway Company
(4) HOUSTON BELT & TERMINAL RAILWAY COMPANY BNSF Railway Company Union Pacific Railroad Company
121 shares are held by U.S. Bank, N.A., Trustee, as collateral under the BNI Consolidated Mortgage.
(5) IOWA TRANSFER RAILWAY COMPANY BNSF Railway Company Union Pacific Railroad Company Heartland Rail Norfolk and Western Railway Company
161 shares are held by U.S. Bank, N. A., Trustee, as collateral under the BNI Consolidated Mortgage.
(6) KANSAS CITY TERMINAL RAILWAY COMPANY
(7)
(8)
Union Pacific Railroad Company BNSF Railway Company Kansas City Southern Railway Company Iowa & Missouri Railway Company Norfolk Southern Railway Company
5,485 shares are held by UMB of Kansas City, Missouri, Trustee, under Stock Trust Agreement dated June 12, 1909, and 5 shares are held by U.S. Bank, N.A., Trustee, as collateral under the BNI Consolidated Mortgage.
LONGVIEW SWITCHING COMPANY BNSF Railway Company Union Pacific Railroad Company
MT PROPERTIES INC. BNSF Railway Company Union Pacific Railroad Company Soo Line Railroad Company
30,498 shares are subject to the liens of the BNI Consolidated Mortgage and the NP General Lien Mortgage and held as collateral by U.S. Bank, N.A., Trustee, of the BNI Consolidated Mortgage and Citibank, N.A., Trustee under the NP General Lien Mortgage.
Road Initials: BNSF Year 2005
%Ownership
50.00 50.00
100.00
25.00 25.00 16.67 16.67 8.33 8.33
100.00
66.67 33.33
100.00
50.00 50.00
100.00
25.00 25.00 25.00 25.00
100.00
41.67 25.00 16.67 8.33 8.33
100.00
50.00 50.00
100.00
43.30 42.09 14.61
100.00
Railroad Annual Report R-1

Road Initials: BNSF Year2005
(9) OAKLAND TERMINAL RAILWAY BNSF Railway Company Union Pacific Railroad Company
(10) PADUCAH & ILLINOIS RAILROAD COMPANY BNSF Railway Company Paducah & Louisville Railroad Company Canadian National Railroad Company
310. NOTES AND REMARKS
33 1/3 shares are held by U.S. Bank, N.A., Trustee, as collateral under the BNI Consolidated Mortgage.
(11)
(12)
(13)
(14)
PORTLAND TERMINAL RAILROAD COMPANY Union Pacific Railroad Company BNSF Railway Company
ST JOSEPH TERMINAL RAILROAD COMPANY BNSF Railway Company Union Pacific Railroad Company
SUNSET RAILWAY COMPANY BNSF Railway Company Union Pacific Railroad Company
TERMINAL RAILROAD ASSOCIATION OF ST. LOUIS Missouri Pacific Railroad Company CSX Transportation, Inc. Illinois Central Railroad Company BNSF Railway Company St. Louis Southwestern Railway Company Norfolk Southern Railway Company
2,058 shares are held by U.S. Bank, N.A., Trustee, as collateral under the BNI Consolidated Mortgage.
(15) TEXAS CITY TERMINAL RAILWAY COMPANY Union Pacific Railroad Company BNSF Railway Company Texas City Terminal Railway Company
(16) TIX COMPANY Union Pacific Railroad Company CSX Transportation, Inc. Norfolk Southern Railway Company BNSF Railway Company Canadian National Railway Company Canadian Pacific Limited Florida East Coast Railway Company Boston and Main Corporation Kansas City Southern Railway Company
250 voting shares are held by TIX Company.
Railroad Annual Report R-1
% Ownership
50.00 50.00
100.00
33.34 33.33 33.33
100.00
60.00 40.00
100.00
50.00 50.00
100.00
50.00 50.00
100.00
28.57 14.28 14.29 14.29 14.29 14.28
100.00
66.60 33.30
0.10 100.00
36.68 19.59 19.59 17.24 3.13 1.57 0.94 0.63 0.63
100.00
298
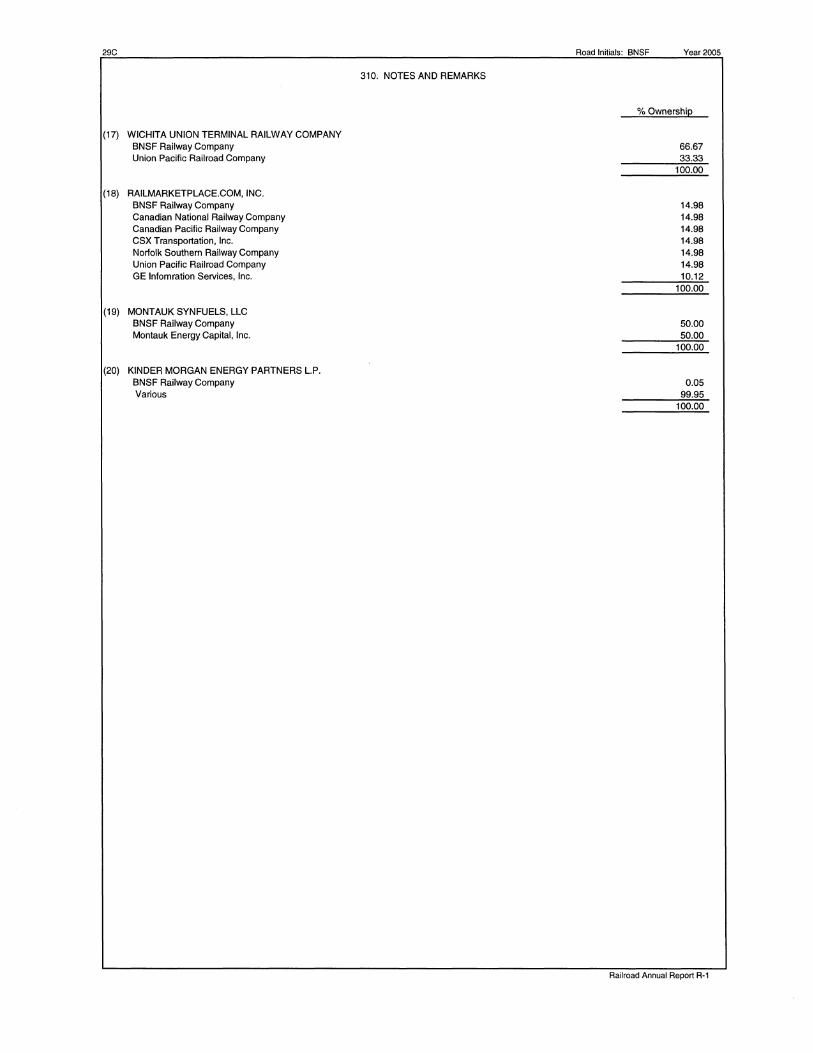
29C
(17) WICHITA UNION TERMINAL RAILWAY COMPANY BNSF Railway Company Union Pacific Railroad Company
(18) RAILMARKETPLACE.COM, INC. BNSF Railway Company Canadian National Railway Company Canadian Pacific Railway Company CSX Transportation, Inc. Norfolk Southern Railway Company Union Pacific Railroad Company GE lnfomration Services, Inc.
(19) MONTAUK SYNFUELS, LLC BNSF Railway Company Montauk Energy Capital, Inc.
(20) KINDER MORGAN ENERGY PARTNERS LP. BNSF Railway Company Various
310. NOTES AND REMARKS
Road Initials: BNSF Year 2005
%Ownership
66.67 33.33
100.00
14.98 14.98 14.98 14.98 14.98 14.98 10.12
100.00
50.00 50.00
100.00
0.05 99.95
100.00
Railroad Annual Report R-1
Road Initials: BNSF Year2005 290
THIS PAGE INTENTIONALLY LEFT BLANK
Railroad Annual Report R-1
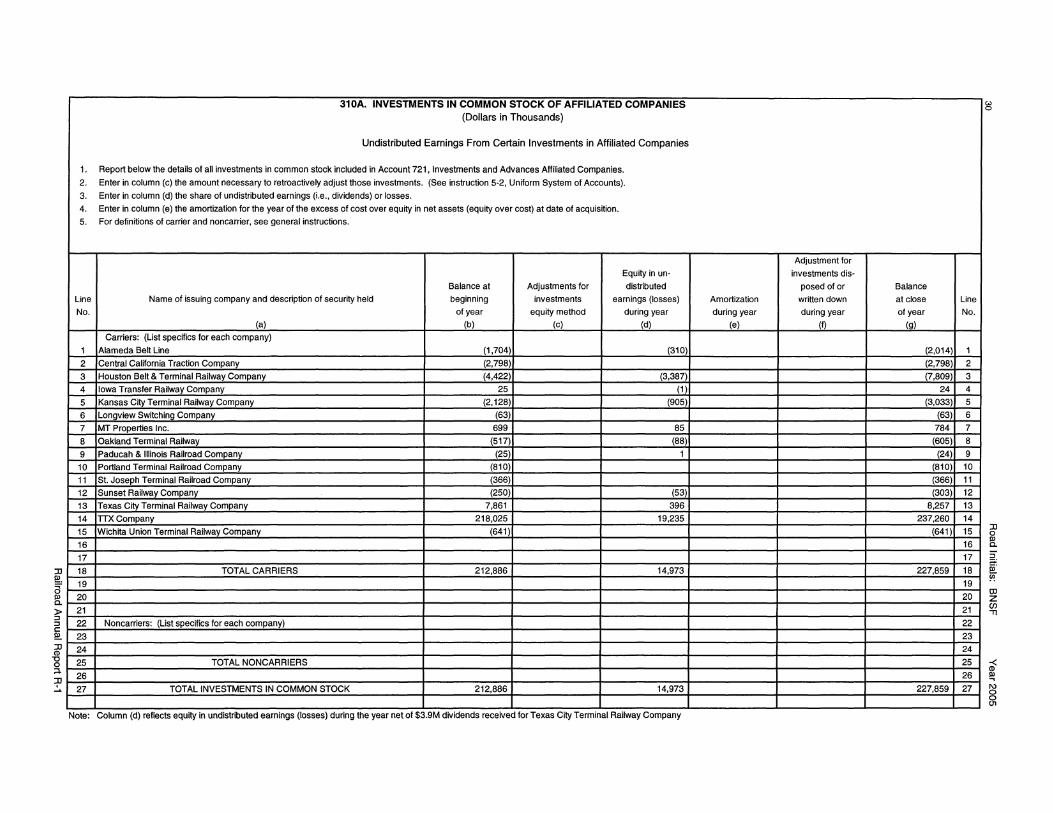
:a !!!. a ~ )> :;;J :;;J c: !!!. :a <D
"O 0 ;::i.
-::p ~
310A. INVESTMENTS IN COMMON STOCK OF AFFILIATED COMPANIES (Dollars in Thousands)
Undistributed Earnings From Certain Investments in Affiliated Companies
1. Report below the details of all investments in common stock included in Account 721, Investments and Advances Affiliated Companies.
2. Enter in column (c) the amount necessary to retroactively adjust those investments. (See instruction 5-2, Uniform System of Accounts).
3. Enter in column (d) the share of undistributed earnings (i.e., dividends) or losses.
4. Enter in column (e) the amortization for the year of the excess of cost over equity in net assets (equity over cost) at date of acquisition.
5. For definitions of carrier and noncarrier, see general instructions.
Equity in un-
Balance at Adjustments for distributed
Line Name of issuing company and description of security held beginning investments earnings (losses)
No. of year equity method during year
(a) (b) (c) (d)
Carriers: (List specffics for each company)
1 Alameda Belt Line (1,704) (310)
2 Central California Traction Company (2,798)
3 Houston Belt & Terminal Railway Company (4,422) (3,387)
4 Iowa Transfer Railway Company 25 (1)
5 Kansas City Terminal Railway Company (2,128) (905)
6 Longview Switching Company (63)
7 MT Properties Inc. 699 85
8 Oakland Terminal Railway (517) (88)
9 Paducah & Illinois Railroad Company (25) 1
10 Portland Terminal Railroad Company (810)
11 St. Joseph Terminal Railroad Company (366)
12 Sunset Railway Company (250) (53)
13 Texas City Terminal Railway Company 7,861 396
14 TIX Company 218,025 19,235
15 Wichita Union Terminal Railway Company (641)
16
17
18 TOTAL CARRIERS 212,886 14,973
19
20
21
22 Noncarriers: (List specifics for each company)
23
24
25 TOTAL NONCARRIERS
26
27 TOTAL INVESTMENTS IN COMMON STOCK 212,886 14,973
Note: Column (d) reflects equity in undistributed earnings (losses) during the year net of $3.9M dividends received for Texas City Terminal Railway Company
Adjustment for
investments dis-
posed of or Balance
Amortization written down at close
during year during year of year
(e) (f) (g)
(2,014)
(2,798)
(7,809)
24
(3,033)
(63)
784
(605)
(24)
(810)
(366)
(303)
8,257
237,260
(641)
227,859
227,859
Line
No.
1
2
3
4
5
6
7
8
9
10
11
12
13
14
15
16
17
18
19
20
21
22
23
24
25
26
27
"' 0
:a 0
~ [ iii' ~ OJ z en "Tl
-< <D ~
g (.11

Road Initials: BNSF Year 2005 31 INSTRUCTIONS CONCERNING RETURNS TO BE MADE IN SCHEDULE 330
1. Give particulars of balances at the beginning and close of the year and of all changes during the year in Account No. 731, Road and Equipment Property" and Account No. 732, "Improvements on Leased Property" classified by primary accounts in accordance with the Uniform System of Accounts for Railroad Companies. The balances, by primary accounts, should, insofar as known, be stated in column (b) and all changes made during the year should be analyzed in columns (c) to (f), inclusive. Column (g) should be the net of the amounts in columns (c) through (!). Column (h) is the aggregate of columns (b) through (!), inclusive. Grand totals of columns (b) and (h) should equal the sum of Accounts 731 and 732 for the respective periods; if not, a full explanation should be made in a footnote.
2. In column (c), show disbursements made for the specific purpose of purchasing, constructing, and equipping new lines, and for the extension of old lines, as provided for in Instruction 2-1, :Items to be charged' in the Uniform System of Accounts for Railroad Companies for such items.
3. In column (d), show the cost of a railway or portion thereof, acquired as an operating entity or system by purchase, merger, consolidation, reorganization, receivership sale or transfer, or otherwise.
4. Columns (c) and (e) should include all entries covering expenditures for additions and betterments, as defined, whether or not replacing other property.
5. All credits representing property sold, abandoned, or otherwise retires should be shown in column (f).
6. Both the debit and credit involved in each transfer, adjustment, or clearance, between road and equipment accounts, should be included in the column in which the item was initially included. Also, the transfer of prior years' debits or credits from investment in road and equipment to operating expenses or other accounts, or vice versa, should be included in the column applicable to current items of like nature. Each such transfer, adjustment, or clearance should be fully explained when in excess of $100,000.
7. If during the year an individual charge of $100,000 or more was made to Account No. 2, "Land for Transportation Purposes," state the cost, location, area, and other details which will identify the property in a footnote.
8. Report on line 29, amounts not included in the primary road accounts. The items reported should be briefly identified and explained under Notes and Remarks," below. Amounts should be reported on this line only under special circumstances, usually after permission is obtained from the Board for exceptions to prescribed accounting. Reference to such authority should be made when explaining the amounts reported. Respondents must not make arbitrary changes to the printed stub or column headings without specific authority from the Board.
9. If during the year a segment of transportation property was acquired, state in a footnote the name of the vendor, the mileage acquired, and the date of acquisition, giving location and cost of the property to the respondent. Also furnish a statement of the amount included in each primary account representing such property acquired, referring to the column or columns in which the entries appear.
10. If an amount of less than $5,000 is used as the minimum for additions and betterments to property investment accounts as provided for in Instruction 2-2 of the Uniform System of Accounts for Railroad Companies, state the amount used in a footnote.
NOTES AND REMARKS
Railroad Annual Report R-1

32 Road Initials· BNSF Year2005
330. ROAD PROPERTY AND EQUIPMENT AND IMPROVEMENTS TO LEASED PROPERTY AND EQUIPMENT
(Dollars in Thousands)
Expenditures during Expenditures during
Balance at the year for original the year for purchase
Line Cross Beginning road & equipment of existing lines, Line
No. No. Account of year & road extensions reorganizations, etc. No.
(a) (b) (c) (d)
1 (2) Land for transportation purposes 1,545,378 1
2 (3) Grading 1,950,441 2
3 14) Other riaht-of-wav expenditures 37,094 3
4 (5) Tunnels and subwavs 97,064 4
5 (6) Bridges, trestles and culverts 1,813,443 5
6 (7) Elevated structures 6
7 (8) Ties 3,781,797 7
8 (9) Rail and other track material 8,033,986 8
9 (11) Ballast 2,843,779 9
10 (13) Fences, snowsheds and sians 58,798 10
11 (16) Station and office bulldinas 601,455 11
12 (17) Roadway buildings 38,436 12
13 (18) Water stations 5,864 13
14 (19) Fuel stations 215,442 14
15 (20) Shops and enginehouses 540,669 15
16 (22) Storage warehouses 16
17 (23) Wharves and docks 13,498 17
18 (24) Coal and ore wharves 12,252 18
19 (25) TOFC/COFC tennlnals 592,147 19
20 (26) Communications systems 778,493 20
21 (27) Signals and interlockers 1,965,577 21
22 (29) Power plants 2,625 22
23 (31) Power transmission systems 26,744 23
24 (35) Miscellaneous structures 34,329 24
25 (37) Roadway machines 313,196 25
26 (39) Public improvements - construction 391,640 26
27 (44) Shop machinery 175,429 27
28 (45) Power plant machinery 3,030 28
29 Other lease/rentals 29
30 TOTAL EXPENDITURES FOR ROAD 25,872,606 30
31 (52) Locomotives 3,403,699 31
32 (53) Freight train cars 1,422,109 32
33 (54) Passenger train cars 33
34 (55) Hlahwav revenue equipment 13,451 34
35 156) Floatina equipment 35
36 (57) Work equipment 146,429 36
37 (58) Miscellaneous equipment 291,194 37
38 (59) Computer svstems & word processing equipment 416,409 38
39 TOTAL EXPENDITURES FOR EQUIPMENT 5,693,291 39
40 (76) Interest durina construction 74,985 40
41 (80) Other elements of Investment 7,347 41
42 (90) Construction work in progress 347,720 42
43 GRAND TOTAL 31,995,949 43
Railroad Annual Report R-1

Road Initials· BNSF Year2005 33
330. ROAD PROPERTY AND EQUIPMENT AND IMPROVEMENTS TO LEASED PROPERTY AND EQUIPMENT - (Continued)
(Dollars in Thousands)
Line Cross Expenditures for additions Credits for property retired Net changes Balance at Line
No. No. during the year during the year during the year close of year No.
(e) (f) (g) (h)
1 106,561 4,729 101,832 1,647,210 1
2 78,647 19,793 58,854 2,009,295 2
3 13,412 137 13,275 50,369 3
4 1,426 704 722 97,786 4
5 101,236 20,345 80,891 1,894,334 5
6 6
7 262,061 28,548 233,513 4,015,310 7
8 490,675 104,682 385,993 8,419,979 8
9 226,226 18,982 207,244 3,051,023 9
10 5,423 (783) 6,206 65,004 10
11 16,555 3,990 12,565 614,020 11
12 1,294 870 424 38,860 12
13 33 16 17 5,881 13
14 22,455 121 22,334 237,776 14
15 31,171 313 30,858 571,527 15
16 16
17 739 739 14,237 17
18 12,252 18
19 31,660 (741) 32,401 624,548 19
20 62,803 (470) 63,273 841,766 20
21 148,117 28,452 119,665 2,085,242 21
22 15 23 (8) 2,617 22
23 2,401 108 2,293 29,037 23
24 292 (12) 304 34,633 24
25 37,273 5,368 31,905 345,101 25
26 32,295 1,171 31,124 422,764 26
27 7,886 1,832 6,054 181,483 27
28 88 (88) 2,942 28
29 29
30 1,680,656 238,266 1,442,390 27,314,996 30
31 76,368 87,943 (11,575) 3,392,124 31
32 49,468 52,759 (3,291) 1,418,818 32
33 33
34 13,451 34
35 35
36 8,324 2,181 6,143 152,572 36
37 42,902 14,702 28,200 319,394 37
38 71,629 65,593 6,036 422,445 38
39 248,691 223,178 25,513 5,718,804 39
40 12,611 6,115 6,496 81,481 40
41 354 (354) 6,993 41
42 98,683 98,683 446,403 42
43 2,040,641 467,913 1,572,728 33,568,677 43
Railroad Annual Report R-1

34 Road Initials: BNSF Year 2005 332. DEPRECIATION BASE AND RATES - ROAD AND EQUIPMENT OWNED AND LEASED FROM OTHERS
(Dollars in Thousandsl
1. Show in columns (b} and (e}, for each primary account, the depreciation base used to compute depreciation charges for the month of January, and in columns (c} and (f}, the depreciation charges for the month of December. In columns (d} and (g} show the composite rates used in computing depreciation charges for December, and on lines 30 and 39 of these columns show the composite percentage for all road and equipment accounts, respectively, ascertained by applying the primary account composite rates to the depreciation base used in computing the charges for December, and dividing that total by the total depreciation base for the same month. The depreciation base should not include cost of equipment used, but not owned, when the rents are included in rent for equipment and account nos. 31-22-00, 31-23-00, 31-25-00, 31-21-00, 35-21-00, 35-23-00, 35-22-00, and 35-25-00. It should include cost of equipment owned and leased to others when the rents therefrom are included in the rent for equipment, accounts nos. 32-21-00, 32-22-00, 32-23-00, 32-25-00, 36-21-00, 36-22-00, 36-23-00, and 36-25-00., inclusive. Composite rates used should be those prescribed or authorized by the Board, except that where the use of component rates has been authorized, the composite rates to be shown for the respective primary accounts should be recomputed from the December charges developed by the use of the authorized rates. If any changes in rates were effective during the year, give particulars in a footnote.
2. All leased property may be combined and one composite rate computed for each primary account, or a separate schedule may be included for each such property.
3. Show in columns (e}, (f}, and (g} data applicable to lessor property, when the rent therefore is included in accounts nos. 31-11-00, 31-12-00, 31-13-00, 31-21-00, 31-22-00, and 31-23-00, inclusive.
4. If depreciation accruals have been discontinued for any account, the depreciation base should be reported, nevertheless, in support of depreciation reserves. Authority for discontinuance of accruals should be shown in a footnote, indicating the effected account(s}.
5. Disclosures in the respective sections of this schedule may be omitted if either total road leased from others or total equipment leased from others represents less than 5% of total road owned or total equipment owned, respectively.
OWNED AND USED LEASED FROM OTHERS
Depreciation Base Annual Depreciation Base Annual
1/1 12/1 composite composite
Line Account At beginning At close rate At beginning At close rate Line
No. of year of year % of year of year % No.
(a} (b} (c} (d} (e} (f} (g}
ROAD
1 (3l Gradina 1,950,441 1,997,679 1.11% 1
2 (4) Other riaht-of-wav expenditures 37,094 48,529 1.97% 2
3 (5) Tunnels and subways 97,064 97,794 1.10% 3
4 (6) Bridaes, trestles and culverts 1,813,443 1,884,460 1.35% 4
5 (7) Elevated structures 5
6 (8) Ties 3,781,797 3,995,564 5.13% TOTAL ROAD AND 6
7 (9) Rail and other track material 8,033,986 8,392,834 3.47% 7
8 (11) Ballast 2,843,n9 3,035,590 3.61% EQUIPMENT LEASED FROM 8
9 (13) Fences, snowsheds and signs 58,798 64,561 1.48% 9
10 (16) Station and office buildings 601,455 614,150 2.95% OTHERS IS LESS THAN 5% 10
11 (17) Roadway buildings 38,436 38,840 3.69% 11
12 (18) Water stations 5,864 5,856 1.67% OF TOTAL OWNED 12
13 (19) Fuel stations 215,442 237,455 3.38% 13
14 (20) Shops and enginehouses 540,669 567,030 2.07% 14
15 (22) Storage warehouses 15
16 (23) Wharves and docks 13,498 14,237 1.98% 16
17 (24 l Coal and ore wharves 12,252 12,252 1.67% 17
18 (25) TOFC/COFC terminals 592,147 618,832 2.93% 18
19 (261 Communications svstems 778,493 830,993 4.55% 19
20 (27) Sianals and interlockers 1,965,577 2,066,390 3.29% 20
21 (29) Power olants 2,625 2,618 5.52% 21
22 (31} Power transmission systems 26,744 28,856 2.69% 22
23 (35} Miscellaneous structures 34,329 34,663 2.76% 23
24 (37} Roadwav machines 313,196 343,609 6.13% 24
25 (39) Public improvements - construction 391,640 417,280 1.97% 25
26 (44) Shop machinery 175,429 179,696 4.38% 26
27 (45} Power plant machinery 3,030 2,953 3.89% 27
28 All other road accounts 28
29 Amortization (other than def. orojects} 29
30 TOTAL ROAD 24,327,228 25,532,721 3.37% 30
EQUIPMENT
31 (52) Locomotives 3,403,699 3,385,258 4.93% 31
32 (53) Freiaht train cars 1,422,109 1,427,337 2.92% 32
33 (54) Passenaer train cars 33
34 (551 Hiahwav revenue equipment 13,451 13,451 5.95% 34
35 (56) Floatina equipment 35
36 (57) Work equipment 146,429 151,839 4.78% 36
37 158) Miscellaneous equipment 291,194 310,110 13.62% 37
38 (59) Computer svstems & WP equipment 416,409 433,607 13.41% 38
39 TOTAL EQUIPMENT 5,693,291 5,721,602 5.54% 39
40 GRAND TOTAL 30,020,519 31,254,323 NA NA 40
Note: Annual comoosite rate excludes impact of reserve adjustments resultina from the last depreciation reserve study.
Railroad Annual Report R-1
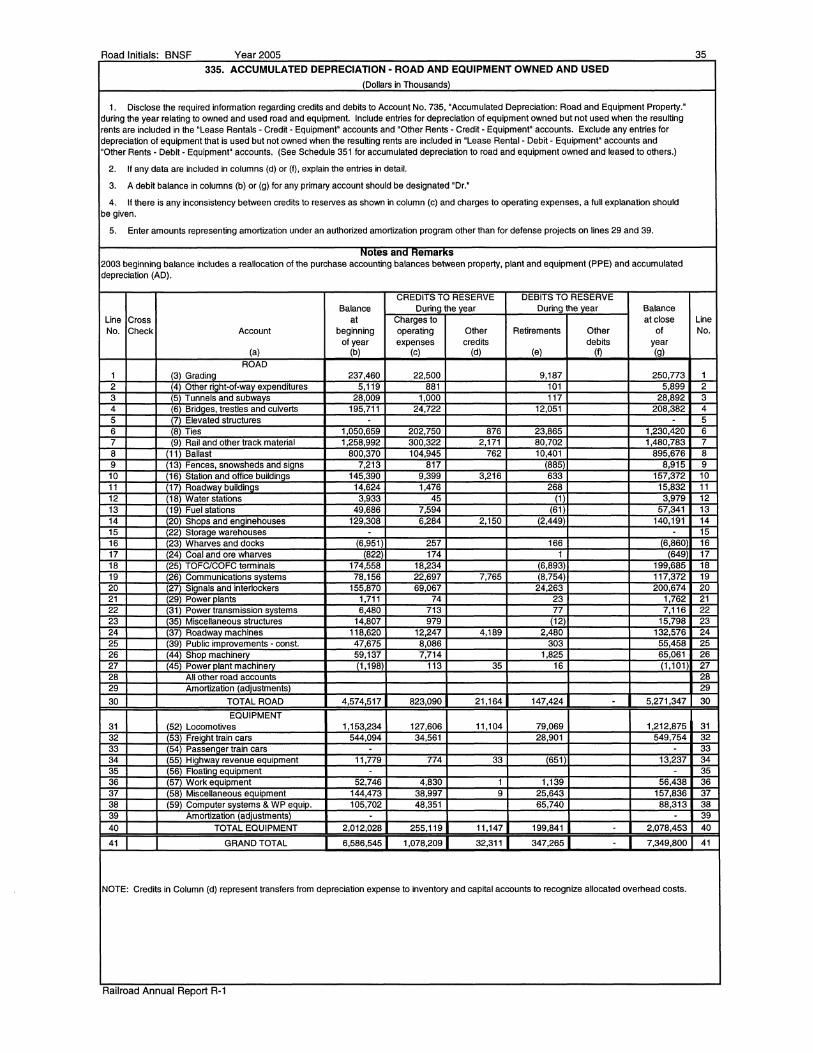
Road Initials· BNSF Year2005 35
335. ACCUMULATED DEPRECIATION· ROAD AND EQUIPMENT OWNED AND USED
(Dollars in Thousands)
1. Disclose the required information regarding credits and debits to Account No. 735, 'Accumulated Depreciation: Road and Equipment Property." during the year relating to owned and used road and equipment. Include entries for depreciation of equipment owned but not used when the resulting rents are included in the "Lease Rentals - Credit - Equipment• accounts and "Other Rents - Credit - Equipment" accounts. Exclude any entries for depreciation of equipment that is used but not owned when the resulting rents are included in "Lease Rental - Debit - Equipment" accounts and "Other Rents - Debit - Equipment" accounts. (See Schedule 351 for accumulated depreciation to road and equipment owned and leased to others.)
2. If any data are included in columns (d) or (f), explain the entries in detail.
3. A debit balance in columns (b) or (g) for any primary account should be designated "Dr."
4. If there is any inconsistency between credits to reserves as shown in column (c) and charges to operating expenses, a full explanation should be given.
5. Enter amounts representing amortization under an authorized amortization program other than for defense projects on lines 29 and 39.
Notes ana Remarks 2003 beginning balance includes a reallocation of the purchase accounting balances between property, plant and equipment (PPE) and accumulated depreciation (AD).
CREDITS TO RESERVE DEBITS TO RESERVE Balance Durina the vear Durina the vear Balance
Line Cross at Charges to at close Line No. Check Account beginning operating Other Retirements Other of No.
of year expenses credits debits year (a) (b) (c) (d) (e) (f) (g)
ROAD 1 (3) Gradina 237,460 22,500 9,187 250,773 1 2 (4) Other right-of-way expenditures 5,119 881 101 5,899 2 3 (5) Tunnels and subwavs 28,009 1,000 117 28,892 3 4 (6) Bridaes, trestles and culverts 195,711 24,722 12,051 208,382 4 5 (7) Elevated structures - 5 6 (8) Ties 1,050,659 202,750 876 23,865 1,230,420 6 7 (9) Rall and other track material 1,258,992 300,322 2,171 80,702 1,480,783 7 8 (11) Ballast 800,370 104,945 762 10,401 895,676 8 9 (13) Fences, snowsheds and sians 7,213 817 (885) 8,915 9
10 (16) Station and office buildings 145,390 9,399 3,216 633 157,372 10 11 (17) Roadway buildings 14,624 1,476 268 15,832 11 12 (18) Water stations 3,933 45 (1) 3,979 12 13 !19) Fuel stations 49,686 7,594 (61) 57,341 13 14 (20) Shops and enainehouses 129,308 6,284 2,150 (2,449) 140,191 14 15 (22) Storage warehouses - - 15 16 (23) Wharves and docks (6,951) 257 166 (6,860) 16 17 (24) Coal and ore wharves (822) 174 1 (649 17 18 (25) TOFC/COFC terminals 174,558 18,234 (6,893) 199,685 18 19 (26) Communications systems 78,156 22,697 7,765 (8,754) 117,372 19 20 (27) Signals and interlockers 155,870 69,067 24,263 200,674 20 21 !29) Power plants 1,711 74 23 1,762 21 22 (31) Power transmission systems 6,480 713 77 7,116 22 23 (35) Miscellaneous structures 14,807 979 (12) 15,798 23 24 (37) Roadwav machines 118,620 12,247 4,189 2,480 132,576 24 25 (39) Public improvements - cons!. 47,675 8,086 303 55,458 25 26 (44) Shop machinery 59,137 7,714 1,825 65,061 26 27 (45) Power plant machinerv (1,198) 113 35 16 (1,101) 27 28 All other road accounts 28 29 Amortization (adjustments) 29
30 TOTAL ROAD 4,574,517 823,090 21,164 147,424 - 5,271,347 30
EQUIPMENT 31 (52) Locomotives 1,153,234 127,606 11,104 79,069 1,212,875 31 32 (53) Freight train cars 544,094 34,561 28,901 549,754 32 33 154) Passenaer train cars - - 33 34 1551 Hiahwav revenue equipment 11,779 774 33 (651) 13,237 34 35 (56) Floating equipment - - 35 36 (57) Work equipment 52,746 4,830 1 1,139 56,438 36 37 (58) Miscellaneous eauipment 144,473 38,997 9 25,643 157,836 37 38 (59) Computer systems & WP equip. 105,702 48,351 65,740 88,313 38 39 Amortization (adjustments) - - 39
40 TOTAL EQUIPMENT 2,012,028 255,119 11,147 199,841 - 2,078,453 40
41 GRAND TOTAL 6,586,545 1,078,209 32,311 347,265 - 7,349,800 41
NOTE: Credits in Column (d) represent transfers from depreciation expense to inventory and capltal accounts to recognize allocated overhead costs.
Railroad Annual Report R-1

36 Road Initials· BNSF Year2005 339. ACCRUED LIABILITY - LEASED PROPERTY
(Dollars in Thousands)
1. Disclose the required information relating to credits and debits of Account 772, 'Accrued Liability Leased Property,' during the year
concerning road and equipment leased from others.
2. In column (c), enter amounts charged to operating expenses. In column (e), enter debits to accounts arising from retirements. In column (I), enter amounts paid to lessor.
3. Any inconsistencies between credits to account, charges to operating expenses, and payment to lessors should be fully explained.
4. Required disclosure may be omitted if leased road and equipment property represents 5% or less of total property owned and used.
5. If settlement for depreciation is made currently between lessee and lessor, and no debits or credits to Account No. 772 are made by the
accounting company, show in column (c) the charges to operating expenses, and in column (I) show payments made to the lessor in settlement
thereof.
CREDITS TO ACCOUNTS DEBITS TO ACCOUNTS Balance During the year During the year Balance
Line Cross at Charges to at close Line No. Check Account beginning operating Other Retirements Other of No.
of year expenses credits debits year (a) (b) (c) (d) (e) (I) (g)
ROAD 1 3 Gradina 1 2 4 Other riaht-of-way exoenditures 2 3 5 Tunnels and subways 3 4 6 Bridges, trestles and culverts 4 5 7 Elevated structures 5 6 8 Ties 6 7 9 Rail and other track material 7 8 11 Ballast 8 9 13 Fences, snowsheds and sians 9 10 16 Station and office buildings 10 11 17 Roadway buildings 11 12 18 Water stations 12 13 19 Fuel stations NIA BASED ON 5% RULE 13 14 20 Shops and enginehouses 14 15 22 Storaae warehouses 15 16 23 Wharves and docks 16 17 24 Coal and ore wharves 17 18 (25 TOFC/COFC terminals 18 19 (26 Communications systems 19 20 27 Signals and interlockers 20 21 29 Power plants 21 22 31 Power transmission systems 22 23 35 Miscellaneous structures 23 24 (37) Roadway machines 24 25 (39) Public improvements - canst. 25 26 (44) Shop machinerv * 26 27 145) Power olant machinerv 27 28 All other road accounts 28 29 Amortization (adjustments) 29 30 I u I AL HUAlJ 30
" II
31 52 Locomotives 31 32 53 Freight train cars 32 33 54 Passenger train cars 33 34 55 Hiahwav revenue eauioment 34 35 56 Floatina eauioment 35 36 57 Work equipment 36 37 58 Miscellaneous equipment 37 38 59 Computer systems & WP equip. 38 39 Amortization (adiustmentsl 39 4u IV l'\L~111 II 40 41 None None 41
*To be reported with equipment expenses rather than W&S expenses.
Railroad Annual Report R-1

Road Initials· BNSF Year2005 37
340. DEPRECIATION BASE AND RATES-IMPROVEMENTS TO ROAD AND EQUIPMENT LEASED FROM OTHERS
(Dollars in Thousands)
1. Show in column (b) for each primary account the depreciation base used in computing the depreciation charges for the month of January, and in column (c) show the depreciation base used in computing the depreciation charges for the month of December, in column (d) show the composite rates used in computing the depreciation charges for the month of December, and on lines 30 and 40 of these columns show the composite percentage of all road and equipment accounts,
respectively, ascertained by applying the primary account composite rates to the depreciation base used in computing the charges for December and dividing the
total so computed by the total depreciation base for the same month. This schedule should include only improvements to leased property charged to Account 732,
'Improvements on Leased Property.• The composite rates used should be those prescribed or otherwise authorized by the Commission, except that where the use
of component rates has been authorized, the composite rates to be shown for the respective primary accounts should be recomputed from the December charges
developed by the use of authorized rates. If any charges in rates were effective during the year, give full particulars in a footnote.
2. All improvements to leased properties may be combined and one composite rate computed for each primary account, or a separate schedule may be included
for each such property.
3. If depreciation accruals have been discontinued for any account, the depreciation base should be reported, nevertheless, in support of depreciation reserves.
Authority for the discontinuance of accruals should be shown in a footnote indicating the account(s) affected.
4. Disclosures in the respective sections of this schedule may be omitted if either total road leased from others or total equipment leased from others represents less than 5% of total road owned or total equipment owned, respectively. However, line 41, Grand Total, should be completed.
Depreciation base Annual composite
Line rate Line
No. Account At beginning of year At close of year (percent) No.
Cal (bl (cl (dl
ROAD 1 (31 Gradina 1
2 141 Other riaht-of-wav exoenditures 2
3 151 Tunnels and subwavs 3
4 (6l Bridaes trestles and culverts 4
5 C7l Elevated structures 5
6 181 Ties 6
7 191 Rall and other track material 7
8 111 l Ballast 8
9 1131 Fences, snow sheds, and slans 9
10 116) Station and office buildinas 10
11 (171 Roadwav buildinas 11
12 11181 Water stations N/A BASED ON 5% RULE 12
13 1119) Fuel stations 13
14 il20l Shoos and enainehouses 14
15 1(221 Storaae warehouses 15
16 I 123) Wharves and docks 16
17 1124) Coal and ore wharves 17
18 I 125l TOFC/COFC terminals 18
19 I 126) Communication svstems 19
20 I (27) Slanals and lntertockers 20
21 I 1291 Power olants 21
22 ll31l Power-transmission svstems 22
23 I 1351 Miscellaneous structures 23
24 I 1371 Roadwav machines 24
25 I (39) Public Improvements - Construction 25
26 11441 Shoo machlnerv • 26
27 11451 Power-clan! machinerv 27
28 All other road accounts 28
29 Amortization IAdiustmentsl 29
30 TOTAL ROAD 30
EQUIPMENT
31 11521 Locomotives 31
32 11531 Frelaht-traln cars 32
33 54) Passenner-train cars 33
34 '551 Hlahwav revenue eauioment 34
35 56) Floatlna eauipment 35
36 '571 Work eauioment 36
37 '581 Miscellaneous eaulpment 37
38 '591 Comouter svstems and word orocessina eauio. 38
39 Amortization Adiustments 39 40 TOTAL EQUIPMENT 40
41 GRAND TOTAL 76,250 77,702 41
'To be reoorted with eauioment expenses rather than W&S expenses.
Railroad Annual Report R-1

38 Road Initials: BNSF Year2005 342. ACCUMULATED DEPRECIATION - IMPROVEMENTS TO ROAD AND EQUIPMENT LEASED FROM OTHERS
(Dollars in Thousands)
1. Enter the required information concerning debits and credits to Account 733, "Accumulated Depreciation - Improvements on Leased Property,•
during the year relating to improvements made to road and equipment property leased from others, the depreciation charges for which are included
in operating expenses of the respondent.
2. If any entries are made for column (d) "Other credits" or column (I) "Other debits," state the facts occasioning such entries on page 39. A
debit balance in columns (b) or (g) for any primary account should be shown in parenthesis or designated "Dr."
3. Any inconsistency between credits to the reserve as shown in column (c) and charges to operating expenses should be fully explained on page 39.
4. Show in column (e) the debits to the reserve arising from retirements. These debits should not exceed investment, etc.
5. Disclosures in the respective sections of this schedule may be omitted if either total road leased from others or total equipment leased from
others represents less than 5% of total road owned or total equipment owned, respectiVely. However, line 39, Grand Total, should be completed.
CREDITS TO RESERVE DEBITS TO RESERVE
Balance During the year During the year Balance
Line Cross at Charges to at close Line
No. Check Account beginning operating Other Retirements Other of No.
of year expenses credits debits year (a) (b) (c) (d) (e) (I) (g)
ROAD
1 (3) Grading 1
2 (4) Other riaht-of-way expenditures 2
3 (5) Tunnels and subways TOTAL IMPROVEMENTS TO ROAD LEASED FROM OTHERS IS LESS THAN 5% 3
4 (6) Bridges, trestles and culverts OF TOTAL ROAD OWNED 4
5 (7) Elevated structures 5
6 (8) Ties 6
7 (9) Rail and other track material 7
8 (11) Ballast 8
9 (13) Fences, snowsheds and signs 9
10 (16) Station and office buildinos 10
11 (17) Roadway buildings 11
12 (18) Water stations 12
13 (19) Fuel stations 13
14 (20) Shops and enginehouses 14
15 (22) Storaoe warehouses 15
16 (23) Wharves and docks 16
17 (24) Coal and ore wharves 17
18 (25) TOFC/COFC terminals 18
19 (26) Communications systems 19
20 (27) Signals and lnterlockers 20
21 (29) Power plants 21
22 (31) Power transmission systems 22
23 (35) Miscellaneous structures 23
24 (37) Roadway machines 24
25 139) Public imorovements - const. 25
26 (44) Shop machinery• 26
27 (45) Power plant machinery 27
28 All other road accounts 28 29 TOTAL ROAD 29
EQUIPMENT
30 (52) Locomotives 30
31 (53) Freight train cars TOTAL IMPROVEMENTS TO EQUIPMENT LEASED FROM OTHERS IS LESS THAN 31
32 (54) Passenger train cars 5% OF TOTAL EQUIPMENT OWNED 32
33 (55) Hiohway revenue equipment 33
34 (56) Floating equipment 34
35 (57) Work equipment 35
36 (58) Miscellaneous equipment 36
37 (59) Computer systems & WP equip. 37 38 TOTAL EQUIPMENT 38
39 GRAND TOTAL 3,629 3,598 606 - 6,621 39
•To be reported with equipment expenses rather than W&S expenses.
Railroad Annual Report R-1
Road Initials: BNSF Year2005 39 NOTES AND REMARKS FOR SCHEDULE 342
(THIS PAGE INTENTIONALLY LEFT BLANK)
Railroad Annual Report R-1
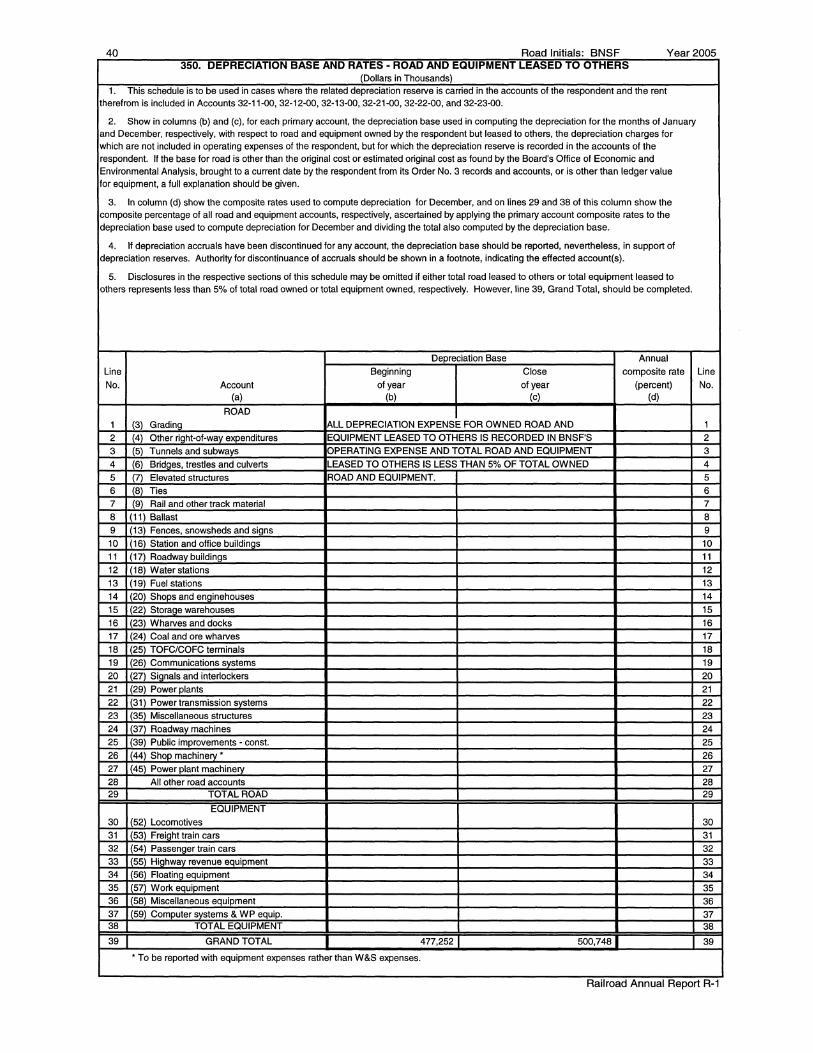
40 Road Initials: BNSF Year2005 350. DEPRECIATION BASE AND RATES· ROAD AND EQUIPMENT LEASED TO OTHERS
(Dollars in Thousands) 1. This schedule is to be used in cases where the related depreciation reserve is carried in the accounts of the respondent and the rent
therefrom is included in Accounts 32-11-00, 32-12-00, 32-13-00, 32-21-00, 32-22-00, and 32-23-00.
2. Show in columns (b) and (c), for each primary account, the depreciation base used in computing the depreciation for the months of January and December, respectively, with respect to road and equipment owned by the respondent but leased to others, the depreciation charges for which are not included in operating expenses of the respondent, but for which the depreciation reserve is recorded in the accounts of the respondent. If the base for road is other than the original cost or estimated original cost as found by the Board's Office of Economic and Environmental Analysis, brought to a current date by the respondent from its Order No. 3 records and accounts, or is other than ledger value for equipment, a full explanation should be given.
3. In column (d) show the composite rates used to compute depreciation for December, and on lines 29 and 38 of this column show the composite percentage of all road and equipment accounts, respectively, ascertained by applying the primary account composite rates to the depreciation base used to compute depreciation for December and dividing the total also computed by the depreciation base.
4. If depreciation accruals have been discontinued for any account, the depreciation base should be reported, nevertheless, in support of depreciation reserves. Authority for discontinuance of accruals should be shown in a footnote, indicating the effected account(s).
5. Disclosures in the respective sections of this schedule may be omitted if either total road leased to others or total equipment leased to others represents less than 5% of total road owned or total equipment owned, respectively. However, line 39, Grand Total, should be completed.
Depreciation Base Annual Line Beginning Close composite rate Line No. Account of year of year (percent) No.
(a) (b) (c) (d)
ROAD 1 (3) Grading ~LL DEPRECIATION EXPENSE FOR OWNED ROAD AND 1
2 (4) Other riaht-of-way expenditures EQUIPMENT LEASED TO OTHERS IS RECORDED IN BNSF'S 2
3 (5) Tunnels and subways OPERATING EXPENSE AND TOTAL ROAD AND EQUIPMENT 3
4 (6) Bridges, trestles and culverts LEASED TO OTHERS IS LESS THAN 5% OF TOTAL OWNED 4
5 (7) Elevated structures ROAD AND EQUIPMENT. 5
6 (8) Ties 6
7 (9) Rail and other track material 7
8 (11) Ballast 8
9 (13) Fences, snowsheds and sians 9
10 (16) Station and office buildings 10
11 (17) Roadway buildings 11
12 (18) Waterstations 12
13 (19) Fuel stations 13
14 (20) Shoos and enainehouses 14
15 (22) Storage warehouses 15
16 (23) Wharves and docks 16
17 (24) Coal and ore wharves 17
18 (25) TOFC/COFC terminals 18
19 (26) Communications svstems 19
20 (27) Signals and interlockers 20
21 (29) Power plants 21
22 (31) Power transmission systems 22 23 (35) Miscellaneous structures 23
24 (37) Roadway machines 24
25 (39) Public improvements - cons!. 25
26 (44) Shop machinery* 26
27 (45) Power plant machinery 27
28 All other road accounts 28 29 TOTAL ROAD 29
EQUIPMENT 30 (52) Locomotives 30
31 (53) Freiaht train cars 31 32 (54) Passenger train cars 32
33 (55) Highway revenue equipment 33 34 (56) Floating equipment 34
35 (57) Work equipment 35 36 (58) Miscellaneous equipment 36 37 (59) Computer systems & WP equip. 37 38 TOTAL EQUIPMENT 38
39 GRAND TOTAL 477,252 500,748 39
*To be reported with equipment expenses rather than W&S expenses.
Railroad Annual Report R-1

Road Initials: BNSF Year2005 41 351. ACCUMULATED DEPRECIATION - ROAD AND EQUIPMENT LEASED TO OTHERS
(Dollars in Thousands)
1. This schedule is to be used in cases where the related depreciation reserve is carried in the accounts of the respondent and the rent therefrom is included in Accounts 32-11-00, 32-12-00, 32-13-00, 32-21-00, 32-22-00, and 32-23-00.
2. Disclose credits and debits to Account 735, "Accumulated Depreciation - Road and Equipment Property," during the year relating to road and equipment leased to others, the depreciation charges for which are not included in operating expenses of the respondent. (See Schedule 330
for the reserve relating to road and equipment owned and used by the respondent.
3. If any entries are made for column (d) 'Other credits' or column (f) 'Other debits," state the facts occasioning such entries on page 39. A debit balance in columns (b) or (g) for any primary account should be shown in parenthesis or designated 'Dr."
4. Disclosures in the respective sections of this schedule may be omitted if either total road leased to others or total equipment leased to others represents less than 5% of total road owned or total equipment owned, respectively. However, line 39, Grand Total, should be completed.
CREDITS TO RESERVE DEBITS TO RESERVE Balance During the year During the year Balance
Line Cross at Charges to at close Line No. Check Account beginning operating Other Retirements Other of No.
of year expenses credits debits year (a) (b) (c) (d) (e) (f) (g)
ROAD 1 (3) Grading 1 2 (4) Other right-of-way expenditures TOTAL ROAD LEASED TO OTHERS IS LESS THAN 5% 2 3 (5) Tunnels and subways OF TOTAL ROAD OWNED. 3 4 (6) Bridges, trestles and culverts 4
5 (7) Elevated structures 5 6 (8) Ties 6 7 (9) Rail and other track material 7
8 (11) Ballast 8 9 (13) Fences, snowsheds and siQns 9 10 (16) Station and office buildinQs 10 11 (17) Roadway buildings 11 12 (18) Water stations 12 13 (19) Fuel stations 13 14 (20) Shops and enainehouses 14 15 (22) Storaae warehouses 15 16 (23) Wharves and docks 16 17 (24) Coal and ore wharves 17
18 (25) TOFC/COFC terminals 18
19 (26) Communications systems 19
20 (27) Signals and interlockers 20 21 (29) Power plants 21 22 (31) Power transmission systems 22 23 (35) Miscellaneous structures 23 24 (37) Roadwav machines 24 25 (39) Public improvements - const. 25 26 (44) Shop machinery• 26 27 (45) Power plant machinery 27 28 All other road accounts 28 29 TOTAL ROAD 29
EQUIPMENT 30 (52) Locomotives 30 31 (53) Freiaht train cars TOTAL EQUIPMENT LEASED TO OTHERS IS LESS THAN 5% 31
32 (54) PassenQer train cars OF TOTAL EQUIPMENT OWNED. 32
33 (55) HiQhway revenue equipment 33 34 (56) FloatinQ equipment 34 35 (57) Work equipment 35
36 (58) Miscellaneous equipment 36 37 (59) Computer systems & WP equip. 37 38 1uTALEUUIPMENT 38
39 GRAND TOTAL (312,296) (337,374) 39
•To be reported with equipment expenses ratherthan W&S expenses.
Railroad Annual Report R-1

42 Road Initials· BNSF Year2005 352A. INVESTMENT IN RAILROAD PROPERTY USED IN TRANSPORTATION SERVICE (By Company)
(Dollars In Thousands)
1. Disclose the investment In railway property used in transportation service at the close of the year. This Investment represents the aggregate of property owned or leased by respondent and used In respondent's transportation service. Such property includes (a) Investment reported in Accounts 731, "Road and Equipment Property" and 732, "improvements on Leased Property" of respondent, less any 731 or 732 property leased to others for their exclusive use of road, track, or bridges (including equipment or other railway property covered by the contract). Equipment leased to others under separate distinct contracts shall not be deducted from respondenfs 731 or 732 property, and (b) the Investment of other companies' 731 or 732 property (including operating and lessor railroads) used by respondent when the lease is for exclusive use or control of roads, tracks, or bridges (including equipment or other railway property covered by the contract). This excludes leased equipment from operating
railroads under separate distinct contracts and the investment of other carriers In property jointly used by respondent.
2. In column (a), classify each company in this schedule as: "R' for respondent, 'L" for lessor railroad, •p• for inactive or proprietary company or 'O" for other leased properties.
3. In columns (a) to (e), inclusive, first show the data requested for respondent (R); next show data for companies whose entire properties are used in transportation service of the respondent, divided between lessor (L) and proprietary (P) companies; followed by data for carriers and others (0), portions of whose property are used in transportation service of respondent. Show a total for each class of company in columns (d) and (e). Then show, as deductions. data for transportation property leased to· carriers and others.
4. In column (c), line-haul carriers report the miles of road used in line-haul service. Report miles In whole numbers.
5. In column (d), show the amount applicable to Accounts 731 and 732 on the books of companies whose names appear In column (b). Values of property of other carriers segregated by estimate or otherwise should correspond In amount to deductions made by the owners In their reports. If separate value is not available, an explanation should be provided. Differences between amounts shown In column (d) of this schedule and column (c), line 24, on the asset side of the general balance sheet of each individual railway should be explained in a footnote. Book values Included in Accounts 731 and 732 of the owner should be reported in column (d) in reference to the investment of respondent in securities of the owner unless a good reason can be given for the contrary. Methods of estimating (by capitalizing rentals at 6% or otherwise) value of property of private owners, or portions of property of other carriers, should be explained.
6. In column (e), show the amount of depreciation and amortization accrued as of the close of the year In Accounts 733, 734, 735, 736, and 772, that Is applicable to the property of the carriers whose names are listed in column (b), regardless of where reserves therelor are recorded.
Depreciation
Class Miles of road Investments & amortization of Line (See Name of company used (See Ins. 4) in property defense projects Line No. (lns.2) (whole number) (See Ins. 5) (See Ins. 6) No.
la) lb) (cl (d) lel 1 R The Buriington Northern and Santa Fe Rallwav Comoanv 23,595 33,56B,677 7,350,734 1 2 2 3 Add Leased from Others: 3 4 0 SP- Klamath Falls, OR - Switch Track & Track .. . 4
5 0 sn.sw - Rio to Hampton, TX - 2nd Track .. . 5 6 0 U.S. Government - Shelton to Banaor & Bremerton, WA-Track 49 .. . 6 7 0 City of Pueblo, CO - Way Switching Tracks at Devine, CO .. . 7 B 0 Conrail - Turnouts and Yard Tracks at Chlcaao .. . B
9 Total Leased lrom Others 49 9 10 10 11 Deduct Leased to Others: 11
12 0 Montana Rail Link 621 16B,4B3 1B1,199 12
13 0 MKT - Rosedale, KS - Driveway 2 1 13 14 0 DMIR - Hibbing, MN Turnout (4th Ave. West) 5 4 14 15 0 Brandon Corp. - S. Omaha, NE - Yard 33 22 15 16 0 Timber Rock Railroad - Beaumont to Tenaha and Dobbin to Silsbee, TX 246 99,72B 35,506 16 17 0 South Kansas and Oklahoma Railroad - Cherokee to Pittsbera, KS 6 279 52 17 1B 0 Portland & Western Railroad - Quinaby to Bethel, OR 77 14,462 7,904 1B 19 0 Burlinaton Junction - Quincy to Marblehead, IL 5 363 31B 19 20 0 Rail America - Mobile to Saraland, AL & Columbus to Whitburv, MS 27 1,471 655 20 21 0 Southwestern - Carisbad to Lovlna, NM 263 47,330 20,B43 21 22 0 North American RailNet - Culbertson to Imperial 49 4,507 4,140 22 23 0 OmniTrax - Kettle Falls, WA/BC BB 19,212 B,43B 23 24 0 Watco - Wheatland to Oklahoma Citv 13 313 176 24 25 0 Mission Mountain Railroad - Columbia Falls to Kallsoell, MT 16 1,841 1,209 25 26 0 Columbia Basin - Yakima, WA 40 1,754 B46 26 27 0 Northern Lines - St. Cloud to St. Joseph & St. Cloud to Cold Springs, MN 17 23B 143 27 2B 0 Southwestern - Rincon to Demina, NM 55 7,351 3,069 2B
29 0 Watco - Birminaham to Kearnev, MO 16 3,469 2,70B 29
30 0 Yellowstone Valley RR - Bainville to Scobey & Glendive to Snowden, MT 172 13,B60 7,991 30
31 0 R.J. Corman - Tennessee Yard, Airport Park, Olive Branch Park 50,106 12,172 31
32 0 Dakota Northern - Grafton to Walhalla & Grafton to Glasston, ND 71 B,B5B 6,755 32 33 Total Leased to Others 1,7B2 443,665 294,151 33 34 34 35 Deduct Operated by Others: 35 36 0 Grainbelt Corporation 1B9 15,254 9,B3B 36 37 0 Red River Vallev & Western 650 40,739 33,3B5 37 3B Total Operated bv Others B39 55,993 43,223 3B
39 Net Deductions (2,572 l499,65B (337,374 39
40 TOTAL 21,023 33,069,019 7,013,360 40 • Depreciation not available to respondent.
•• Investment not available to respondent.
Railroad Annual Report R-1

Road Initials: BNSF Year2005 43 3528. INVESTMENT IN RAILROAD PROPERTY USED IN TRANSPORTATION SERVICE (By Property Account)
(Dollars in Thousands)
1. In columns (b) through (e) give, by primary accounts, the amount of investment at the close of the year in property of respondent and each
group or class of companies and properties.
2. The amounts for respondent and for each group or class of companies and properties on line 44 should correspond with the amounts for
each class of company and property shown in Schedule 352A. Continuing records shall be maintained by respondent of the primary property
accounts separately for each company or property included in this schedule.
3. Report on line 29 amounts representing capitalization of rentals for leased property based on 6% per year where property is not classified
by accounts by noncarrier owners, or where the cost of property leased from other carriers is not ascertainable. Identify noncarrier owners, and
briefly explain on page 39 the methods of estimating value of property on noncarriers or property of other carriers.
4. Report on line 30 amounts not included in the accounts shown, or on line 29. The items reported should be briefly identified and explained.
Also include here those items after permission is obtained from the Board for exceptions to prescribed accounting. Reference to such authority
should be made when explaining amounts reported. Respondents must not make arbitrary changes to the printed stub or column headings without
specific authority from the Board.
Line Cross Account Respondent Lessor Inactive (proprie- Other leased Line No. Check Railroads tary companies) properties No.
(a) (b) (c) (d) (e)*
1 (2) Land for transportation ou rposes 1,647,210 (7,428) 1 2 (3) Gradina 2,009,295 (35,917 2 3 (4) Other riaht-of-way expenditures 50,369 (403 3 4 (5) Tunnels and subways 97,786 (4,460) 4 5 (6) Bridges, trestles and culverts 1,894,334 (46,361) 5 6 (7) Elevated structures 6 7 (8) Ties 4,015,310 (114,511) 7 8 (9) Rail and other track material 8,419,979 (174,864 8 9 (11) Ballast 3,051,023 (63,241) 9 10 (13) Fences, snowsheds and sians 65,004 (1,227) 10 11 (16) Station and office buildinas 614,020 (3,560) 11 12 (17) Roadway buildinas 38,860 (417) 12 13 (18) Water stations 5,881 (33) 13 14 {19) Fuel stations 237,776 (6,401) 14 15 (20) Shops and enginehouses 571,527 (5,076) 15 16 (22) Storaae warehouses 16 17 (23) Wharves and docks 14,237 17 18 (24) Coal and ore wharves 12,252 18 19 (25) TOFC/COFC terminals 624,548 (8,505) 19 20 (26) Communications systems 841,766 (3,078) 20 21 (27) Signals and interlockers . 2,085,242 (16,592) 21 22 (29) Power plants 2,617 22 23 (31) Power transmission svstems 29,037 (551) 23 24 (35) Miscellaneous structures 34,633 (176) 24 25 (37) Roadway machines 345,101 (167) 25 26 (39) Public improvements - construction 422,764 (5,420) 26 27 (44) Shop machinerv 181,483 (1,270) 27 28 (45) Power olant machinerv 2,942 28 29 Leased property (capitalized rentals) 29 30 Other (specify and explain) 30 31 TOTAL ROAD 27,314,996 (499,658) 31 32 (52) Locomotives 3,392,124 32 33 (53) Freiaht train cars 1,418,818 33 34 (54) Passenaer train cars 34 35 (55) Hiahway revenue equipment 13,451 35 36 (56) Floating equipment 36 37 (57) Work equipment 152,572 37 38 (58) Miscellaneous equipment 319,394 38 39 (59) Computer svstems & WP equipment 422,445 39 40 TOTAL EQUIPMENT 5,718,804 40 41 (76) Interest durina construction 81,481 41 42 (80) Other elements of investment 6,993 42 43 (90) Construction work in oroaress 446,403 43 44 GRAND 1u1AL 33,568,677 (499,658 44
* Includes property leased to and operated by others.
Railroad Annual Report R-1
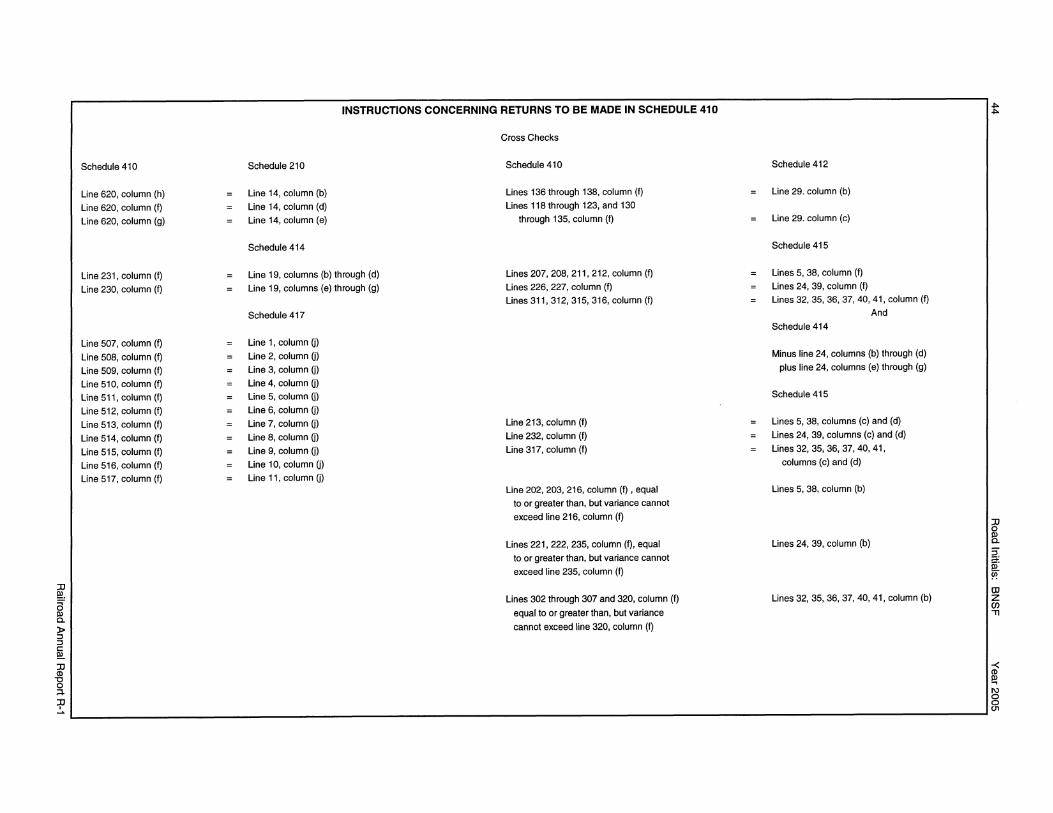
~
i
Schedule 41 O
Line 620, column (h) Line 620, column (f)
Line 620, column (g)
Line 231, column (f)
Line 230, column (f)
Line 507, column (f)
Line 508, column (f)
Line 509, column (f) Line 510, column (f) Line 511, column (f)
Line 512, column (I) Line 513, column (f)
Line 514, column (f)
Line 515, column (f) Line 516, column (f) Line 517, column (f)
INSTRUCTIONS CONCERNING RETURNS TO BE MADE IN SCHEDULE 410
Schedule 210
Line 14, column (b) Line 14, column (d) Line 14, column (e)
Schedule 414
Line 19, columns (b) through (d) Line 19, columns (e) through (g)
Schedule 417
Line 1, column Ol Line 2, column Ol Line 3, column Ol Line 4, column Ol Line 5, column (j)
Line 6, column Ol Line 7, column (j)
Line 8, column (j)
Line 9, column (j)
Line 10, column (j) Line 11, column (j)
Cross Checks
Schedule 410
Lines 136 through 138, column (f)
Lines 118 through 123, and 130 through 135, column (f)
Lines 207, 208, 211, 212, column (f)
Lines 226, 227, column (f)
Lines 311, 312, 315, 316, column (f)
Line 213, column (f)
Line 232, column (f) Line 317, column (f)
Line 202, 203, 216, column (f), equal to or greater than, but variance cannot
exceed line 216, column (f)
Lines 221, 222, 235, column (f), equal
to or greater than, but variance cannot exceed line 235, column (f)
Schedule 412
Line 29. column (b)
Line 29. column (c)
Schedule 415
Lines 5, 38, column (f) Lines 24, 39, column (f)
Lines 32, 35, 36, 37, 40, 41, column (f)
And
Schedule 414
Minus line 24, columns (b) through (d)
plus line 24, columns (e) through (g)
Schedule 415
Lines 5, 38, columns (c) and (d)
Lines 24, 39, columns (c) and (d)
Lines 32, 35, 36, 37, 40, 41, columns (c) and (d)
Lines 5, 38, column (b)
Lines 24, 39, column (b)
Lines 32, 35, 36, 37, 40, 41, column (b)
t
"t1 ~ 5"
~ !'! m z (/) "'Tl
~ ~ ~ m ~ ~ c ~ ~ ~ ~ 0
Lines 302 through 307 and 320, column (f) equal to or greater than, but variance
cannot exceed line 320, column (f)
m ~ 1S l~~~~~~~~~~~~~~~~~~~~~~~~~~~~~~~~~~~~~~~~~~~~~~~~~~~~~~~~~~~~~~~~~~~~~~~~~~~~~~~~~~~~ ~

:D ~-a ~ )> ::J ::J c: !!!. :D <D
"C 0 ;:::i.
~
410. RAILWAY OPERATING EXPENSES (Dollars in Thousands)
State the railway operating expenses on respondent's road for the year, classifying them in accordance with the Uniform System of Accounts for Railroad Companies, and allocate the common operating expenses in accordance with the Board's rules governing the separation of such expenses between freight and passenger services.
Material, tools, Total Line Cross Name of railway operating expense account Salaries supplies, fuels, Purchased General freight Passenger No. Check &Wages & lubricants services expense
(a) (b) (c) (d) (e) (f) (g)
WAYS & STRUCTURES ADMINISTRATION
1 Track 38,117 6,558 (10,473) 2,484 36,686 2 Bridge & building 17,918 2,989 (5,598) 1,137 16,446 3 Signal 19,462 3,278 (5,862) 1,245 18,123 4 Communication 6,972 1,146 (2,301) 439 6,256 5 Other 39,161 6,511 (12,396) 2,482 35,758
REPAIRS AND MAINTENANCE 6 Roadway - running 26,939 826 20,333 2,928 51,026 7 Roadway - switching 7,236 302 5,463 789 13,790 8 Tunnels & subways - running (1) 39 122 5 165 9 Tunnels & subways - switching 10 33 1 44 10 Bridges & culverts - running 13,110 2,179 2,761 2,807 20,857
11 Bridges & culverts - switching 3,550 588 750 757 5,645 12 Ties - running 4,739 985 4,687 4,082 14,493 13 Ties - switching 1,941 271 1,404 1,091 4,707 14 Rail & other track material - running 61,220 18,562 13,237 5,173 98,192 15 Rail & other track material - switching 16,452 5,025 4,569 1,376 27,422 16 Ballast - running 3,148 591 1,121 146 5,006
17 Ballast - switching 891 166 299 38 1,394
18 Road property damaged - running (1) 3 2 19 Road property damaged - switching 1 1 20 Road property damaged - other 21 Signals & interlockers - running 42,446 6,924 5,479 1,642 56,491 22 Signals & interlockers - switching 11,368 2,114 1,529 435 15,446
23 Communications systems 18,746 8,948 27,694
24 Power systems 2 1,159 636 229 2,026 25 Highway grade crossings - running 1,736 476 601 348 3,161 26 Highway grade crossings - switching 481 182 161 93 917 27 Station & office buildings 507 1,925 12,469 3,400 18,301 28 Shop buildings - locomotives 2,052 2,070 5,949 272 10,343 29 Shop buildings - freii:iht cars 532 537 1,545 70 2,684 N/A 30 Shop buildings - other equipment 1,514 1,524 4,400 201 7,639
Total
(h)
36,686 16,446 18,123 6,256
35,758
51,026 13,790
165 44
20,857 5,645
14,493 4,707
98,192 27,422
5,006 1,394
2 1
56,491 15,446 27,694
2,026 3,161
917 18,301 10,343 2,684 7,639
Line
No.
1 2 3 4 5
6 7 8 9 10 11 12 13 14 15 16 17 18 19 20 21 22 23 24 25 26 27 28 29 30
:D 0
~ 2. i' !ii' CD z en "Tl
-< <D
~ l\J 0 0 U1
""' U1

~ a ~ ?;' ::J c: !!!. :Il CD
"'C 0 :::I.
~
Line
No.
101
102
103
104
105
106
107
108
109
110
111
112
113
114
115
116
117
118
119
120
121
122
123
124
125
126
127
128
129
130
131
132 133
Cross
Check
. . . . . .
. . . .
Name of railway operating expense account
(a)
REPAIRS AND MAINTENANCE - (Continued)
Locomotive servicing facilities
Miscellaneous buildings & structures
Coal terminals
Ore terminals
Other marine terminals
TOFC/COFC terminals
Motor vehicle loading & distribution facilities
Facilities for other specialized service operations
Roadway machines
Small tools & supplies
Snow removal
Fringe benefits - running
Fringe benefits - switching
Fringe benefits - other
Casualties & insurance - running
Casualties & insurance - switching
Casualties & insurance - other
Lease rentals - debit -running
Lease rentals - debit -switching
Lease rentals - debit -other
Lease rentals - (credit) - running
Lease rentals - (credit) - switchina
Lease rentals - (credit) - other
Joint facility rent - debit - running
Joint facility rent - debit - switching
Joint facility rent - debit - other
Joint facility rent - (credit) - running
Joint facility rent - (credit) - switching Joint facility rent - (credit) - other
Other rents - debit - running
Other rents - debit - switching
Other rents - debit - other Other rents - (credit) - running
410. RAILWAY OPERATING EXPENSES-(Continued) (Dollars in Thousands)
Material, tools,
Salaries supplies, fuels, Purchased General
& Wages & lubricants services (b) (c) (d) (e)
922 1,886 11,549 496
7,998 1,801 4,135 393
345 60 1,549 397
3,292 595
140 18,565 2,107
999 6,094 1,248 17
6 22,264 851 1,536
4,444 292 4,010 942
N/A N/A N/A 91,316
N/A N/A N/A 27,431
N/A N/A N/A 12,420
N/A N/A N/A 40,721
N/A N/A N/A 11,565
N/A N/A N/A 10,493
N/A N/A 1,630 N/A
N/A N/A 448 N/A
N/A N/A 81 N/A
N/A N/A (15) N/A
N/A N/A (5) N/A
N/A N/A N/A
N/A N/A 3,541 N/A
N/A N/A 929 N/A
N/A N/A 1,335 N/A
N/A N/A (7,786) N/A
N/A N/A (2,042) N/A
N/A N/A (2,936) N/A
N/A N/A 840 N/A
N/A N/A 224 N/A
N/A N/A 1,920 N/A N/A N/A N/A
Total
freight Passenger
expense (f) (g)
14,853
14,327
N/A
2,351 N/A
3,887 N/A
20,812 N/A
N/A
N/A
8,358
24,657
9,688
91,316
27,431
12,420
40,721
11,565
10,493
1,630
448
81
(15)
(5)
3,541
929
1,335
(7,786)
(2,042)
(2,936)
840
224
1,920
Total
(h)
14,853
14,327
2,351
3,887
20,812
8,358
24,657
9,688
91,316
27,431
12,420
40,721
11,565
10,493
1,630
448
81
(15)
(5)
3,541
929
1,335
(7,786)
(2,042)
(2,936)
840
224
1,920
Line
No.
101
102
103
104
105
106
107
108
109
110
111
112
113
114
115
116
117
118
119
120
121
122
123
124
125
126
127
128
129
130
131
132 133
~
"l] ~ 2. i" iif CD z en "11
~ ~ I\) 0 0 01

:Il !!!. a ~ ~ :I c: !!!. :Il CD "O 0 ;:+
~
Line No.
134
135
136
137
138
139
140
141
142
143
144
145
146
147
148
149
150
151
201
202
203
204
205
206
207
208
209
210
211
212
213
214
215 216
Cross Check
. . . . .
. .
. .
. . .
.
Name of railway operating expense account
(a)
REPAIRS AND MAINTENANCE - (Continued) Other rents - (credit) - switching Other rents - (credit) - other Depreciation - running Depreciation - switching Depreciation - other Joint facility - debit - running Joint facility - debit - switching Joint facility - debit - other Joint facility - (credit) - running Joint facility - (credit) - switching Joint facility - (credit) - other Dismantling retired road property - running Dismantling retired road property - switching Dismantlina retired road property - other Other - running Other - switching Other - other
TOTAL WAY AND STRUCTURES EQUIPMENT LOCOMOTIVES
Administration Repair & maintenance Machinery repair Equipment damaged Fringe benefits Other casualties & insurance Lease rentals - debit Lease rentals - (credit) Joint facility rent - debit Joint facility rent - (credit) Other rents - debit Other rents - (credit) Depreciation Joint facility - debit Joint facility - (credit) Repairs billed to others - (credit)
410. RAILWAY OPERATING EXPENSES· (Continued) (Dollars in Thousands}
Material, tools, Salaries supplies, fuels, Purchased General &Wages & lubricants services
(b) (c) (d) (e)
NIA NIA NIA
NIA NIA NIA
NIA NIA 524,516
NIA NIA 138,663
NIA NIA 175,769
NIA NIA 69,372 NIA
NIA NIA 17,980 NIA
NIA NIA NIA
NIA NIA (39,973) NIA
NIA NIA (10,628) NIA
NIA NIA NIA
86 13 13
23 4
53 309 585 10,747
15 91 160 3,026
7 43 82 1,511
358,428 108,869 129,179 1,087,749
8,913 6,058 8,427 5,347
141,417 100,391 306,292 38,073
109 1,473 505 302
366 (96) (532)
NIA NIA NIA 67,659
NIA NIA NIA 14,207
NIA NIA 239,269 NIA
NIA NIA (876) NIA
NIA NIA NIA
NIA NIA NIA
NIA NIA NIA
NIA NIA NIA
NIA NIA 143,493
NIA NIA 3,241 NIA
NIA NIA NIA NIA (68,692) NIA
Total freight Passenger
expense (f) (g)
524,516
138,663
175,769
69,372
17,980
(39,973)
(10,628)
112
27
11,694
3,292
1,643
1,684,225
28,745
586,173
2,389
(262)
67,659
14,207
239,269
(876)
143,493
3,241
(68,692)
Total
(h)
524,516
138,663
175,769
69,372
17,980
(39,973)
(10,628)
112
27
11,694
3,292
1,643
1,684,225
28,745
586,173
2,389
(262)
67,659
14,207
239,269
(876)
143,493
3,241
(68,692)
Line No.
134
135
136
137
138
139
140
141
142
143
144
145
146
147
148
149
150
151
201
202
203
204
205
206
207
208
209
210
211
212
213
214
215 216
"!] ~ 2. ~ !ii" CD z en "Tl
-< CD !!? I\) 0
~
..,. --1

JJ !!!. a Ill c. )> :l :l c: !!!. JJ CD
"O 0 ;:i.
~
Line
No.
217
218
219
220
221
222
223
224
225
226
227
228
229
230
231
232
233
234
235
236
237
238
301
302
303
304
305
306
307
308
309
310
311 312
Cross
Check
*
*
*
*
*
*
*
*
*
*
*
*
*
*
* *
Name of railway operating expense account
(a)
LOCOMOTIVES - (Continued)
Dismantling retired property
Other
TOTAL LOCOMOTIVES
FREIGHT CARS
Administration
Repair & maintenance
Machinery repair
Equipment damaged
Fringe benefits
Other casualties & insurance
Lease rentals - debit
Lease rentals - (credit)
Joint facility rent - debit
Joint facility rent - (credit)
Other rents - debit
Other rents - (credit)
Depreciation
Joint facility - debit
Joint facility - (credit)
Repairs billed to others - (credit)
Dismantling retired property
Other
TOT AL FREIGHT CARS
OTHER EQUIPMENT
Administration
Repair & maintenance:
Trucks, trailers, & containers - revenue service
Floating equipment - revenue service
Passenger & other revenue equipment
Computers and data processing equipment
Machinery
Work & other non-revenue equipment
Equipment damaged
Fringe benefits
Other casualties & insurance
Lease rentals - debit Lease rentals - (credit)
410. RAILWAY OPERATING EXPENSES -(Continued) (Dollars in Thousands)
Material, tools,
Salaries supplies, fuels, Purchased General
& Wages & lubricants services (b) (c) (d) (e)
637 275
150,805 108,463 488,166 268,824
5,177 3,521 4,896 3,104
93,417 111,948 99,784 45,718
63 856 293 175
158 (95) (335) 41,089
N/A N/A N/A 44,163
N/A N/A N/A 9,360
N/A N/A 239,680
N/A N/A (3,224) N/A
N/A N/A N/A
N/A N/A N/A
N/A N/A 488,631 N/A
N/A N/A (131,474) N/A
N/A N/A N/A 37,780
N/A N/A N/A
N/A N/A N/A
N/A N/A (121,292) N/A
377
98,815 116,607 576,959 181,389
206 (49) (84) 175
82 185 23,368
3,166 2,271 (132)
23 1 297
4 45 7 10
2,229 5,721 (628)
579 35,381
N/A N/A N/A 2,545
N/A N/A N/A 842
N/A N/A 50,715 N/A N/A
Total
freight Passenger
expense (I) (g)
912
1,016,258
16,698 N/A
350,867 N/A
1,387 N/A
40,817 N/A
44,163 N/A
9,360 N/A
239,680 N/A
(3,224) N/A
N/A
N/A
488,631 N/A
(131,474) N/A
37,780 N/A
N/A
N/A
(121,292) N/A
N/A
377 N/A
973,770 N/A
248
23,635 N/A
N/A
5,305
321
66
7,322
35,960
2,545
842
50,715
Total
(h)
912
1,016,258
16,698
350,867
1,387
40,817
44,163
9,360
239,680
(3,224)
488,631
(131,474)
37,780
(121,292)
377
973,770
248
23,635
5,305
321
66
7,322
35,960
2,545
842
50,715
Line
No.
217
218
219
220
221
222
223
224
225
226
227
228
229
230
231
232
233
234
235
236
237
238
301
302
303
304
305
306
307
308
309
310
311 312
.j:>. CXl
JJ 0
~ S" ;::;: iii" ii!" IJ) z Ul "TI
-< CD
~ I\) 0 0 (J1

:rJ !!1. a ~ )> :J :J c: !!!. :rJ CD
"O 0 ;:i.
!:.
Line Cross No. Check
313 314 315 316 317 318 319 320 321 322 323 324
401 402 403 404 405 406 407 408 409 410
411 412 413 414 415 416 417 418 419
420 421
Name of railway operating expense account
(a)
OTHER EQUIPMENT (Continued) Joint facility rent - debit Joint facility rent - (credit) Other rents - debit Other rents - (credit) Depreciation Joint facility - debit Joint facility - (credit) Repairs billed to others - (credit) Dismantling retired property Other
TOTAL OTHER EQUIPMENT TOTAL EQUIPMENT TRANSPORTATION TRAIN OPERATIONS
Administration Engine crews Train crews Dispatching trains Operating signals & inter!ockers Operating drawbridges Highway crossin!l protection Train inspection & lubrication Locomotive fuel Electric power produced or
purchased for motive power Servicing locomotives Freight lost or damaged - solely related Clearing wrecks Fringe benefits Other casualties & insurance Joint facility - debit Joint facilitv- (credit) Other
TOTAL TRAIN OPERATIONS YARD OPERATIONS
Administration ~witch crews
410. RAILWAY OPERATING EXPENSES· (Continued) (Dollars in Thousands)
Material, tools, Salaries supplies, fuels, Purchased General &Wages & lubricants services
(b) (c) (d) (e)
N/A NIA N/A N/A N/A N/A N/A N/A 32,440 N/A N/A N/A (32,697) N/A N/A N/A N/A 95,646 N/A N/A 401 N/A N/A N/A (12) N/A N/A N/A (383) N/A
20 17 5,687 3,074 114,858 98,772
255,307 228,144 1,179,983 548,985
90,763 10,441 21,067 22,000 581,512 52,675 5 517,952 57,646 289 40,469 (295)
(11) 4,387 1 3,029 3 9 27
2 5,428 2 49,860 430 7 117
1,891,297
39,503 4,059 (8,842) 70 N/A N/A N/A
1 5 18 N/A N/A N/A 438,034 N/A N/A N/A 96,635 N/A NIA 5,106 N/A N/A N/A (5,950) N/A
2,855 1,490 174,024 (3,220) 1,325,944 1,907,716 305,262 553,978
3,925 447 902 942 251,287 28,061
Total freight Passenger
expense (f) (g)
32,440 (32,697) 95,646
401 (12)
(383)
37 222,391
2,212,419
.. 144,271 634,192 575,887 40,174
4,377 3,068 5,432
50,414 1,891,297
34,790
24 438,034
96,635 5,106
(5,950) 175,149
4,092,900
6,216 279,348
Total
(h)
32,440 (32,697) 95,646
401 (12)
(383)
37 222,391
2,212,419
144,271 634,192 575,887 40,174
4,377 3,068 5,432
50,414 1,891,297
34,790
24 438,034
96,635 5,106
(5,950) 175, 149
4,092,900
6,216 279,348
Line No.
313 314 315 316 317 318 319 320 321 322 323 324
401 402 403 404 405 406 407 408 409 410
411 412 413 414 415 416 417 418 419
420 421
:rJ 0
~ 2. ~ !ii" CD z (/) "Tl
m I\) 0 0 en
.... (C)
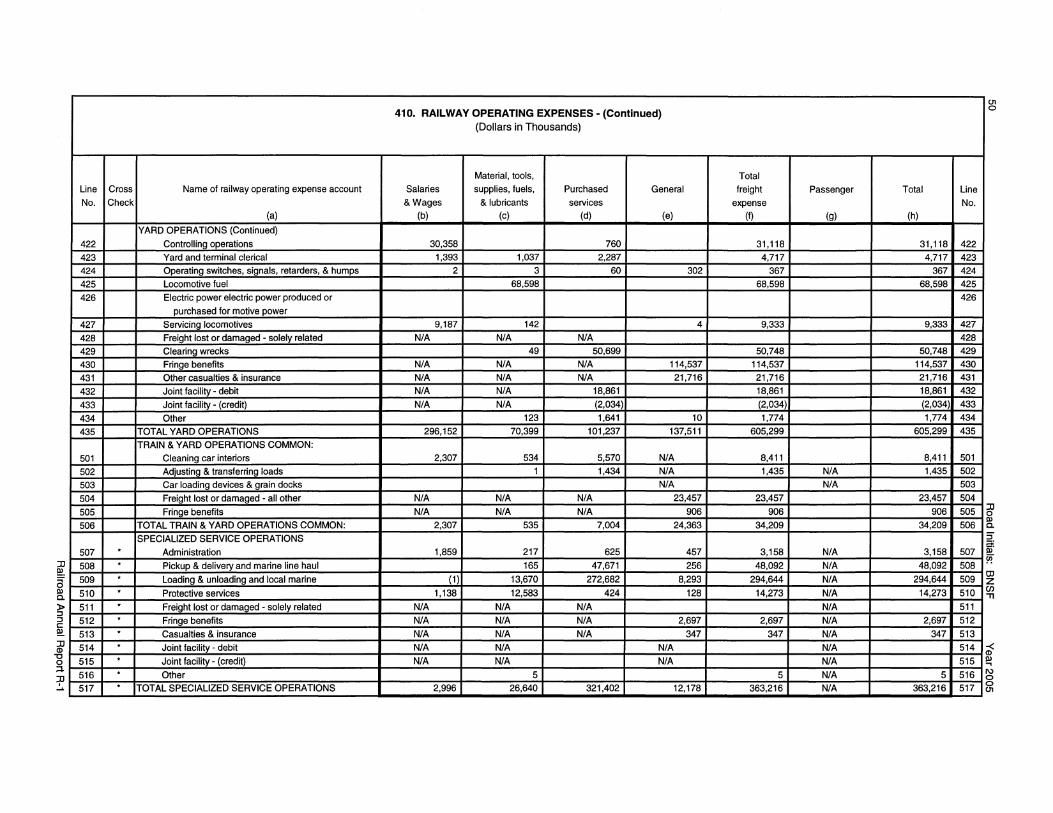
::D !!?. a ~ )> :::J :::J c: !!!.
"ie "O 0 ;:::i.
~
Line No.
422 423 424 425 426
427 428 429 430 431 432
433 434 435
501 502 503
504 505 506
507
508
509
510 511 512
513 514
515
516 517
Cross Check
. . . . . . . . . . .
Name of railway operating expense account
(a)
YARD OPERATIONS (Continued) Controlling operations Yard and terminal clerical Operating switches, signals, retarders, & humps Locomotive fuel Electric power electric power produced or
purchased for motive power Servicing locomotives Freight lost or damaged - solely related Clearing wrecks Fringe benefits Other casualties & insurance Joint facility - debit Joint facility - (credit) Other
TOTAL YARD OPERATIONS TRAIN & YARD OPERATIONS COMMON:
Cleaning car interiors Adjusting & transferring loads Car loading devices & grain docks Freight lost or damaged - all other Fringe benefits
TOTAL TRAIN & YARD OPERATIONS COMMON: SPECIALIZED SERVICE OPERATIONS
Administration Pickup & deliverv and marine line haul Loading & unloading and local marine Protective services Freight lost or damaged - solely related Fringe benefits Casualties & insurance Joint facility - debit Joint facility - (credit) Other
TOTAL SPECIALIZED SERVICE OPERATIONS
410. RAILWAY OPERATING EXPENSES· (Continued) (Dollars in Thousands)
Material, tools, Salaries supplies, fuels, Purchased General &Wages & lubricants services
(b) (c) (d) (e)
30,358 760 1,393 1,037 2,287
2 3 60 302 68,598
9,187 142 4 N/A N/A N/A
49 50,699
N/A N/A N/A 114,537 N/A N/A N/A 21,716 N/A N/A 18,861
N/A N/A (2,034)
123 1,641 10 296,152 70,399 101,237 137,511
2,307 534 5,570 N/A 1 1,434 N/A
N/A N/A N/A N/A 23,457 NIA N/A N/A 906
2,307 535 7,004 24,363
1,859 217 625 457
165 47,671 256 (1) 13,670 272,682 8,293
1,138 12,583 424 128
N/A N/A N/A N/A N/A N/A 2,697
N/A N/A N/A 347
N/A N/A N/A N/A N/A N/A
5 2,996 26,640 321,402 12,178
Total freight Passenger
expense (f) (g)
31,118 4,717
367 68,598
9,333
50,748 114,537 21,716 18,861
(2,034) 1,774
605,299
8,411 1,435 N/A
N/A 23,457
906 34,209
3,158 N/A 48,092 N/A
294,644 N/A 14,273 N/A
N/A 2,697 N/A
347 N/A N/A N/A
5 N/A 363,216 N/A
Total
(h)
31,118 4,717
367 68,598
9,333
50,748 114,537 21,716 18,861 (2,034) 1,774
605,299
8,411 1,435
23,457
906 34,209
3,158 48,092
294,644
14,273
2,697
347
5 363,216
Line No.
422 423 424 425 426
427 428 429 430 431 432
433 434 435
501 502 503 504
505
506
507
508
509
510 511 512 513
01 0
~ ~ 5" i!i!" CD z en "Tl
514 ' -< ~ 515 :
516 I
517 :
I\) 0 0 01

:D ~a ~
I
:
)> ::::i ::::i c !!!. :D CD -0 0 ;:::i.
:p ~
Line Cross
No. Check
518 519 520 521 522
523 524 525 526 527 528
601 602 603 604 605
606 607
608 609 610 611
612
613
614
615
616 617 618 619 620 *
Name of railway operating expense account
(a)
ADMINISTRATIVE support OPERATIONS:
Administration
Employees performing clerical & accounting functiom
Communication systems operations
Loss & damage claims processing
Fringe benefits
Casualties & insurance
Joint facility - debit
Joint facility - (credit)
Other
TOTAL ADMINISTRATIVE support OPERATIONS
TOTAL TRANSPORTATION
GENERAL AND ADMINISTRATIVE
Officers - general administration
Accounting, auditing, & finance
Management services & data processing
Marketing
Sales
Industrial development
Personnel & labor relations
Legal & secretarial
Public relations & advertising
Research & development
Fringe benefits
Casualties & insurance
Writedown of uncollectible accounts
Property taxes
Other taxes except on corporate income or payroll
Joint facility - debit
Joint facility - (credit)
Other
TOTAL GENERAL AND ADMINISTRATIVE
TOTAL CARRIER OPERATING EXPENSE
410. RAILWAY OPERATING EXPENSES - (Continued) (Dollars in Thousands)
Material, tools,
Salaries supplies, fuels, Purchased General
& Wages & lubricants services
(b) (c) (d) (e)
92,199 10,622 21,433 25,584 19,592 566 6,256
606 155 24,071 735
N/A N/A N/A 23,290 N/A N/A N/A 7,934 N/A N/A N/A
N/A N/A N/A
286 112,397 11,629 51,760 57,543
1,739,796 2,016,919 786,665 785,573
11,000 5,318 37,311 32,047 51,844 1,379 2,551 3,717 32,727 3,030 96,368 1,481 38,527 1,054 12,362 3,693 38,527 1,054 12,363 3,693
1,949 18 1,173 537 25,800 39 1,063 244 19,947 432 37,097 2,101 2,253 674 835 1,144
N/A N/A N/A 98,448 N/A N/A N/A 1,769
N/A N/A N/A 3,904
N/A N/A N/A 145,671
N/A N/A N/A 19,785
N/A N/A 1,790 N/A (588)
20,378 272 5,530 6,227 242,952 13,270 207,855 324,461
2,596,483 2,367,202 2,303,682 2,746,768
Total
freight Passenger
expense
(f) (g)
149,838 26,414 25,567
23,290 7,934
286 233,329
5,328,953
85,676 59,491
133,606 55,636 55,637 3,677 N/A
27,146
59,577 4,906
98,448 1,769
3,904
145,671
19,785
1,790 (588)
32,407 788,538
10,014, 135
Total
(h)
149,838 26,414 25,567
23,290
7,934
286 233,329
5,328,953
85,676
59,491 133,606 55,636 55,637
3,677 27,146
59,577 4,906
98,448 1,769
3,904
145,671
19,785
1,790 (588)
32,407 788,538
10,014,135
Line
No.
518 519 520 521 522
523 524 525 526 527 528
601 602 603 604 605 606 607
608 609 610 611 612
613
614
615
616 617
618 619 620
:D ~-a $!) c. 5" ;:::;: iii" ~ CD z UJ "Tl
-< CD ~ I\) 0 0 01
01 ~
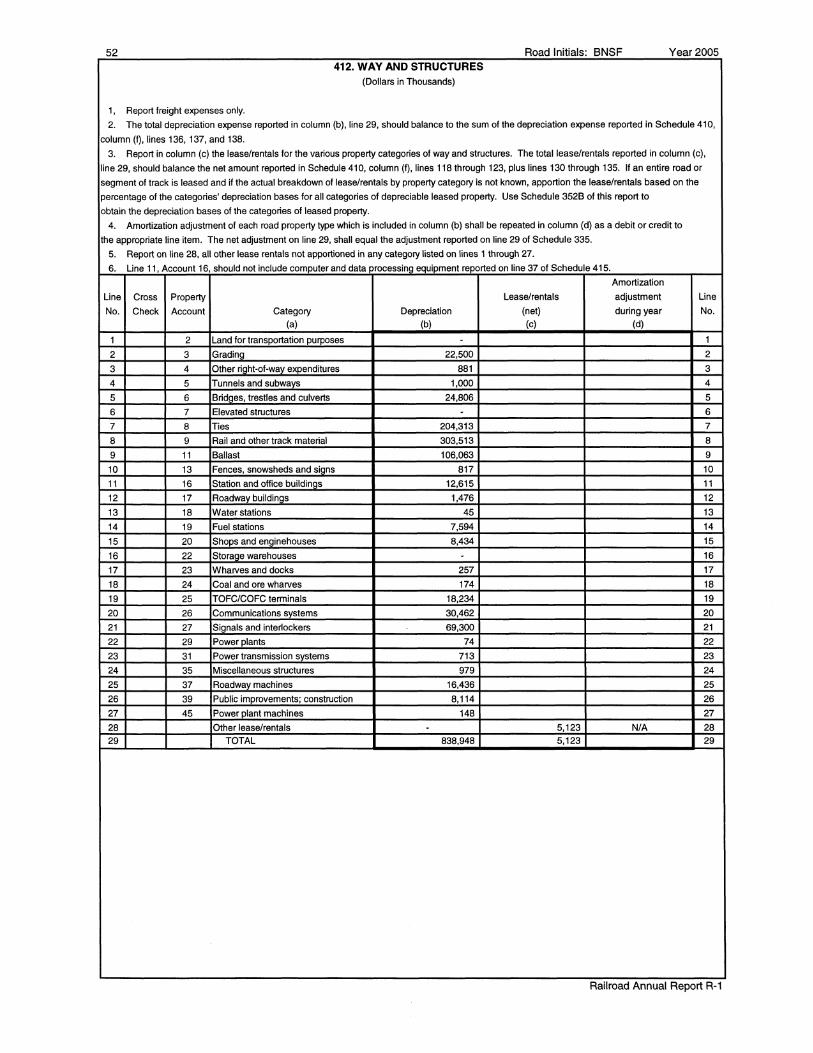
52 Road Initials· BNSF Year 2005 412. WAY AND STRUCTURES
(Dollars in Thousands)
1, Report freight expenses only.
2. The total depreciation expense reported in column (b), line 29, should balance to the sum of the depreciation expense reported in Schedule 410,
column (f), lines 136, 137, and 138.
3. Report in column (c) the lease/rentals for the various property categories of way and structures. The total lease/rentals reported in column (c),
line 29, should balance the net amount reported in Schedule 410, column (f), lines 118 through 123, plus lines 130 through 135. If an entire road or
segment of track is leased and if the actual breakdown of lease/rentals by property category is not known, apportion the lease/rentals based on the
percentage of the categories' depreciation bases for all categories of depreciable leased property. Use Schedule 352B of this report to
obtain the depreciation bases of the categories of leased property.
4. Amortization adjustment of each road property type which is included in column (b) shall be repeated in column (d) as a debit or credit to
the appropriate line item. The net adjustment on line 29, shall equal the adjustment reported on line 29 of Schedule 335.
5. Report on line 28, all other lease rentals not apportioned in any category listed on lines 1 through 27.
6. Line 11, Account 16, should not include computer and data orocessing equipment reported on line 37 of Schedule 415.
Amortization
Line Cross Property Lease/rentals adjustment Line
No. Check Account Category Depreciation (net) during year No. (a) (b) (c) (d)
1 2 Land for transportation purooses . 1
2 3 Grading 22,500 2
3 4 Other riaht-of-wav expenditures 881 3
4 5 Tunnels and subways 1,000 4
5 6 Bridges, trestles and culverts 24,806 5
6 7 Elevated structures . 6
7 8 Ties 204,313 7
8 9 Rail and other track material 303,513 8
9 11 Ballast 106,063 9
10 13 Fences, snowsheds and sians 817 10
11 16 Station and office buildinas 12,615 11
12 17 Roadwav buildinas 1,476 12
13 18 Water stations 45 13
14 19 Fuel stations 7,594 14
15 20 Shops and enainehouses 8,434 15
16 22 Storaae warehouses . 16
17 23 Wharves and docks 257 17
18 24 Coal and ore wharves 174 18
19 25 TOFC/COFC terminals 18,234 19
20 26 Communications systems 30,462 20
21 27 Signals and inter1ockers 69,300 21
22 29 Power plants 74 22
23 31 Power transmission svstems 713 23
24 35 Miscellaneous structures 979 24
25 37 Roadway machines 16,436 25
26 39 Public improvements; construction 8,114 26
27 45 Power plant machines 148 27
28 Other lease/rentals . 5,123 N/A 28 29 TOTAL 838,948 5,123 29
Railroad Annual Report R-1

:xi !!!. a ~ s-:> c !!!.
l ;:i.
~
414. RENTS FOR INTERCHANGED FREIGHT TRAIN CARS AND OTHER FREIGHT CARRYING EQUIPMENT (Dollars in Thousands)
1. Report freight expenses only. 2. Report in this supporting schedule rental Information by car type and other freight-carrying equipment relating to the interchange of railroad owned or leased equipment and privately owned
equipment. (Reporting for leased equipment covers equipment with the carriefs own railroad markings.) 3. The gross amounts receivable and payable for freight-train cars (line 19, columns (b) through (d), and fine 19, columns (e) through (g), respectively) should balance with Schedule 410, column (f)
lines 231 (credits) and 230 (debits). Trailer and container rentals in this schedule are included in Schedule 410, column (f) lines 315 and 316. However, the trailer and container rentals in this schedule will not balance to lines 315 and 316 of Schedule 410 because those lines Include rents for 'Other Equipment' which is reported In Schedule 415, column (f). The balancing of Schedules 410, 414, and 415 "Other Equipment' is outlined in note 6 to Schedule 415.
4. Report In columns (b) and (e) rentals for private-line cars (whether under railroad control or not) and shipper owned cars. 5. Report in columns (c), (d), (f), and (g) rentals for railroad owned cars prescribed by the Board in Ex Part No. 334, for which rentals are settled on a combination mileage and time basis (basic
per diem). Include railroad owned per diem tank cars on line 17. NOTE: Mechanical designations for each car type are shown in Schedule 710.
GROSS AMOUNTS RECEIVABLE Per Diem Basis
Line Cross Type of Equipment Private Mileage Time No. Check Line Cars
(a) (b) (c) (d)
CAR TYPES
1 Box • Plain 40 Foot
2 Box - Plain 50 Foot and Longer 3
3 Box • Equipped 3,877 13,093
4 Gondola • Plain 671 690
5 Gondola - Equipped 1,801 6,241
6 Hopper • Covered 12,464 25,150
7 Hopper· Open Top • General Service 1,206 3,167
8 Hopper - Open Top - Special Service 371 666
9 Refrigerator • Mechanical 1,695 5,097
10 Refrigerator • Nonmechanical 1,976 4,742
11 Flat • TOFC/COFC 8,332 30,682
12 Flat - Multi-Level 1,246 2,152
13 Flat - General Service 7 18
14 Flat-Other 1,389 3,683
15 Tank· Under 22,000 Gallons 1 10
16 Tank - 22,000 Gallons and Over 2 14
17 All Other Freight Cars 57 220
18 Auto Racks 751
19 TOTAL FREIGHT TRAIN CARS 35,095 96,379
OTHER FREIGHT CARRYING EQUIPMENT
20 Refrigerated Trailers
21 Other Trailers 33,128
22 Refrigerated Containers
23 Other Containers
24 . TOTAL TRAILERS AND CONTAINERS 33,128
25 GRAND TOTAL (Lines 19 and 24) 35,095 129,507
GROSS AMOUNTS PAYABLE Per Diem Basis
Private Miieage Line Cars
(e) (f)
8,377 1,150
10,852 17,010
1,430 721
5,432
17,380 9,127
2 1,261
7 658
339
10 1,543
185,403 11,884
23,453 3,624
94 75
25,304 7,691
5,933 2
3,305
32 47
15,664
297,246 60,564
28,198
28,198
325,444 60,564
Time
(g)
2,574
39,286
988
9,882
19,799
2,264
799
682
2,277
28,810
4,685
91
16,479
11
1,290
904
130,821
4,694
4,694
135,515
Line No.
1
2
3
4
5
6
7
8
9
10
11
12
13
14
15
16
17
18
19
20
21
22
23
24
25
:xi
~ 5" "" ;;;· ~ OJ z en "Tl
~ Ill
~
fl

54 Road Initials: BNSF Year2005 NOTES AND REMARKS
THIS PAGE INTENTIONALLY LEFT BLANK
Railroad Annual Report R-1

Road Initials: BNSF Year 2005 GENERAL INSTRUCTIONS CONCERNING RETURNS TO BE MADE TO SCHEDULE 415
1. Report freight expenses only.
2. Report by type of equipment all natural expenses relating to equipment functions (salaries and wages, materials, tools, supplies, fuels and
lubricants, purchased services, and general).
3. Report in column (b) net repair expense, excluding the cost to repair damaged equipment.
Schedule 415, column (b) will balance to Schedule410, column (f) as follows:
(a) Locomotives, line 5 plus line 38, compared to the sum of Schedule 410, lines 202, 203, and 216 (excluding wreck repairs). Do not
report in Schedule 415, Equipment Damaged from Schedule 410, line 204.
(b) Freight cars, line 24 plus line 39, compared to the sum of Schedule 410, lines 221, 222, and 235 (excluding wreck repairs). Do not
report in Schedule 415, Equipment Damaged from Schedule 410, line 223.
(c) Sum of highway equipment (line 32), floating equipment (line 35), passenger and other revenue equipment (line 36), computer and data
processing equipment (line 37), machinery-other equipment (line 40), and work and other non-revenue equipment (line 41 ), compared
to Schedule 410, the sum of lines 302 through 307, plus line 320 (excluding wreck repairs). Do not report in Schedule 415, equipment
damaged from Schedule 410, line 308.
Note: Lines 216, 235, and 320 of Schedule 41 Oare credit amounts.
The allocation of freight car repair expenses reportable on Schedule 415 by car types shall be in accordance with Instruction 2-21, Freight
train repair costing, 49CFR 1201.
4. Depreciation expense for each class of equipment by car type shall be reported in columns (c) and (d). For improvements on leased
property, Accounts 732 and 733, use a supplementary Schedule 415, which will relate to Schedules 340 and 342.
Depreciation charges reported in columns (c) and (d) will balance to Schedule 410, column (f) as follows:
(a) Locomotives, lines 5 and 38, compared to Schedule 410, line 213.
(b) Freight cars, lines 24 and 39, compared to Schedule 410, line 232.
(c) Sum of highway equipment (line 32), floating equipment (line 35), passenger and other revenue equipment (line 36), computer and data
processing equipment (line 37), machinery-other equipment (line 40), and work and other non-revenue equipment (line 41), compared
to Schedule 410, line 317.
5. Amortization adjustment of each equipment type which is included in column (c) shall be reported in column (e) as a debit or credit to the
appropriate line item. The net adjustment on line 43 shall equal the equipment amortization adjustment applicable to equipment used in
freight service included in line 39, column (c), of Schedule 335.
6. Lease/rentals reported in column (f) should balance to column (f) of Schedule 410 as follows:
(a) Locomotives, lines 5 and 38, compared to Schedule 410, lines 207, 208, 211, and 212.
(b) Freight cars, lines 24 and 39, compared to Schedule 410, lines 226 and 227 (note that Schedule 410, lines 230 and 231, are reported in
Schedule 415, and are not included in Schedule 415).
(c) Sum of lease/rentals for all other equipment, lines 32, 35, 36, 37, 40, and 41, will balance to Schedule 410, lines 311, 312, 315, and 316,
except for the interchange rental on trailers and containers which is reported in Schedule 414. Therefore, both Schedules 414 and 415
should be used when balancing lease/rentals other equipment to Schedule 410. Do not report in Schedule 415, the trailer and
container rentals reported in Schedule 414.
7. Investment base by types of equipment shall be reported in columns (g) and (h) and should not include the cost of equipment used but not
owned when rents therefore are included in the rent for equipment and Account Nos. 31-21-00, 31-22-00, 31-23-00, 35-21-00, 35-22-00,
and 35-23-00. It should include the cost of equipment owned and leased to others when the rents are included in the rent for Equipment Account Nos. 32-21-00, 32-22-00, 32-23-00, 36-21-00, 36-22-00, and 36-23-00.
Property used but not owned should also be included when the rent is included in Account Nos. 31-12-00, 31-13-00, 31-21-00, 31-22-00,
and 31-23-00, inclusive.
The grand total of each equipment account in column (h) of Schedule 330 should equal the totals of line items constituting the
equipment account totals of columns (g) and (h) of Schedule 415.
8. Accumulated depreciation for each class of equipment shall be reported in columns (i) and 0). The grand total of each equipment reserve
account in column (g), Schedule 335, shall equal the combined aggregate total accumulated depreciation for line items constituting the
corresponding equipment accounts reported in columns (i) and 0), on Schedule 415.
Railroad Annual Report R-1
55

56 Road Initials: BNSF Year 2005 415. SUPPORTING SCHEDULE - EQUIPMENT
(Dollars in Thousands)
Depreciation Amortization
Line Cross Types of equipment Repairs Owned Capitalized Adjustment net Line
No. Check (net expense) lease during year No.
(a) (b) (c) (d) (e)
LOCOMOTIVES
1 Diesel Locomotives - Yard 25,874 1,727 1
2 Diesel Locomotives - Road 491,607 82,300 51,976 2
3 Other Locomotives - Yard 3,093 3
4 Other Locomotives - Road 4
5 . TOTAL LOCOMOTIVES 517,481 87,120 51,976 5
FREIGHT TRAIN CARS
6 Box - Plain 40 foot 3 6
7 Box - Plain 50 foot and lonaer 6,714 411 7
8 Box - Equipoed 23,622 3,429 8
9 Gondola - Plain 32,106 2,228 9
10 Gondola - Equipped 19,914 2,982 10
11 Hopper - Covered 51,260 7,778 11
12 Hopper - Ooen Top - General Service 10,031 3,501 12
13 Hopper - Open Top - Special Service 13,716 1,088 13
14 Refrigerator - Mechanical 2,500 544 14
15 Refrigerator - Nonmechanical 7,315 3,364 15
16 Flat - TOFC/COFC 18,414 457 16
17 Flat - Multi-level 85 296 17
18 Flat - General Service 4,890 58 18
19 Flat-Other 13,920 2,563 19
20 All Other Freiaht Cars 17,838 274 20
21 Cabooses 63 163 21
22 Auto Racks 4,533 22
23 Miscellaneous Accessories 7,187 1,562 23
24 . TOTAL FREIGHT TRAIN CARS 229,575 35,234 24
OTHER EQUIPMENT - REVENUE FREIGHT
HIGHWAY EQUIPMENT
25 Refrigerated Trailers 5,642 25
26 Other Trailers 5,571 26
27 Refrigerated Containers 27
28 Other Containers 184 807 28
29 Boaies 29
30 Chassis 10,876 30
31 Other Highway Equipment (Freight) 979 31
32 . TOTAL HIGHWAY EQUIPMENT 23,252 807 32
FLOATING EQUIPMENT - REVENUE SERVICE
33 Marine Line-Haul 33
34 Local Marine 34
35 . TOTAL FLOATING EQUIPMENT 35
OTHER EQUIPMENT
36 Passenger & Other Revenue Equipment 36 . (Freight Portion) 5,305
37 . Computer Systems & Word Processing Equip. 321 48,351 37
38 . Machinerv- Locomotives (1) 2,389 4,397 38
39 . Machinery - Freiaht Cars (2) 1,387 2,546 39
40 . Machinery - Other Equipment (3) 66 771 40
41 . Work and Other Nonrevenue Equipment 7,322 24,827 20,890 41
42 TOTAL OTHER EQUIPMENT 16,790 80,892 20,890 42
43 TOTAL ALL EQUIPMENT (FREIGHT PORTION) 787,098 204,053 72,866 43
(1) Data reported on line 38, column (b) is the amount reported in Sched. 410, column (f), line 203, reduced by the allocable portion of line 216.
(2) Data reported on line 39, column (b) is the amount reported in Sched. 410, column (f), line 222, reduced by the allocable portion of line 235.
(3) Data reported on line 40, column (b) is the amount reported in Sched. 410, column (f), line 306, reduced by the allocable portion of line 320.
Railroad Annual Report R-1

Road Initials: BNSF Year 2005 57 415. SUPPORTING SCHEDULE - EQUIPMENT- (Continued)
Investment base as of 12/31 Accumulated depreciation as of 12/31
Line Cross Lease & rentals Owned Capitalized Owned Capitalized Line
No. Check (net) lease lease No.
(I) (g) (h) (i) m
1 57,075 21,747 1
2 2,103,455 1,187,002 838,928 334,343 2
3 28,875 17,857 3
4 238,393 15,717 4
5 . 238,393 2,205,122 1,187,002 878,532 334,343 5
6 79 (151) 6
7 11,738 5,933 7
8 15,481 128,215 23,979 8
9 94,670 29,398 9
10 39,749 126,570 63,532 10
11 67,377 435,983 161,348 11
12 149,276 55,905 12
13 16,317 58,944 19,204 13
14 23,188 2,514 14
15 11,190 121,308 33,393 15
16 56,950 14,661 7,275 16
17 14,155 6,377 17
18 2,589 486 18
19 11,254 96,900 46,729 19
20 579 16,496 7,701 20
21 13,659 12,400 21
22 17,559 101,976 66,206 22
23 8,411 7,525 23
24 . 236,456 1,418,818 549,754 24
25 25
26 11,000 26
27 27
28 14,505 7,707 7,493 28
29 29
30 22,865 5,744 5,744 30
31 31
32 . 48,370 13,451 13,237 32
33 33
34 34
35 . 35
36 36 . 37 . 422,445 88,313 37
38 . 103,446 37,085 38
39 . 59,889 21,470 39
40 . 2,387 18,148 6,506 40
41 . (63) 341,177 130,789 180,338 33,936 41
42 2,324 945,105 130,789 333,712 33,936 42 43 525,543 4,582,496 1,317,791 1,775,235 368,279 43
(1) Data reported on lines 38, 39, and 40 in columns (g) and (h) are investment recorded in property account 44, allocated to locomotives,
freight cars, and other equipment.
(2) Depreciation reported on lines 38, 39, and 40 in column (c) is calculated by multiplying the investment in each element by the effective
composite rate for property account 44, and then adding or subtracting the adjustment reported in column (e). This calculation
should equal the amount shown in column (c), Schedule 335.
Railroad Annual Report R-1
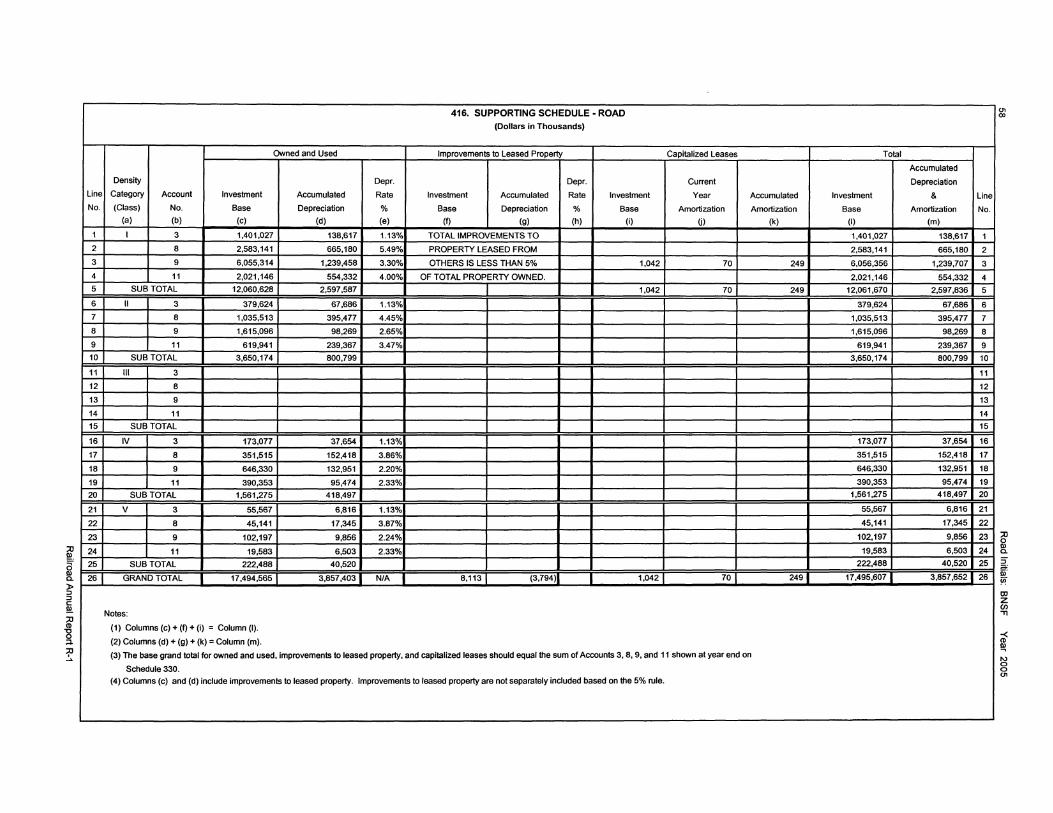
~ ~ c. )> :J :J c: !!!. ;o (I)
1l ;:i.
~
Line
No.
1
2
3
4
5
6
7
8
9
10
11
12
13
14
15
16
17
18
19
20
21
22
23
24
25
26
416. SUPPORTING SCHEDULE - ROAD (Dollars in Thousands)
Owned and Used Improvements to Leased Property Capitalized Leases
Density Depr. Depr. Current
Category Account Investment Accumulated Rate Investment Accumulated Rate Investment Year Accumulated
(Class) No. Base Depreciation % Base Depreciation % Base Amortization Amortization (a) (b) (c) (d) (e) (f) (g) (h) (i) G> (k)
I 3 1.401,027 138,617 1.13% TOTAL IMPROVEMENTS TO
8 2,583,141 665,180 5.49% PROPERTY LEASED FROM
9 6,055,314 1,239,458 3.30% OTHERS IS LESS THAN 5% 1,042 70 249
11 2.021,146 554,332 4.00% OF TOTAL PROPERTY OWNED.
SUB TOTAL 12,060,628 2,597,587 1,042 70 249
II 3 379,624 67,686 1.13%
8 1,035,513 395,477 4.45%
9 1,615,096 98,269 2.65%
11 619,941 239,367 3.47%
SUBTOTAL 3,650,174 800,799
Ill 3
8
9
11
SUB TOTAL
IV 3 173,077 37,654 1.13%
8 351,515 152,418 3.86%
9 646,330 132,951 2.20%
11 390,353 95,474 2.33%
SUBTOTAL 1,561,275 418,497
v 3 55,567 6,816 1.13%
8 45,141 17,345 3.87%
9 102,197 9,856 2.24%
11 19,583 6,503 2.33%
SUBTOTAL 222,488 40,520
GRAND TOTAL 17.494,565 3,857,403 N/A 8,113 (3,794) 1,042 70 249
Notes:
(1) Columns (c) + (f) + (i) = Column (I).
(2) Columns (d) + (g) + (k) =Column (m).
(3) The base grand total for owned and used, improvements to leased property, and capitalized leases should equal the sum of Accounts 3, 8, 9, and 11 shown at year end on
Schedule 330.
(4) Columns (c) and (d) include improvements to leased property. Improvements to leased property are not separately included based on the 5% rule.
Total
Accumulated
Depreciation
Investment &
Base Amortization
(I) (m)
1,401,027 138,617
2.583,141 665,180
6,056,356 1,239,707
2,021,146 554,332
12,061,670 2,597,836
379,624 67,686
1,035,513 395.477
1,615,096 98,269
619,941 239,367
3,650,174 800,799
173,077 37,654
351,515 152,418
646,330 132,951
390,353 95,474
1,561,275 418,497
55,567 6,816
45,141 17,345
102,197 9,856
19,583 6,503
222,488 40,520
17,495,607 3,857,652
Line
No.
1
2
3
4
5
6
7
8
9
10
11
12
13
14
15
16
17
18
19
20
21
22
23
24
25
26
"' 00
g c. :J
~ ~
°' z en "Tl
-< m ,_, 0 0
"'
Road Initials: BNSF Year2005 59 NOTES AND REMARKS
THIS PAGE INTENTIONALLY LEFT BLANK
Railroad Annual Report R-1
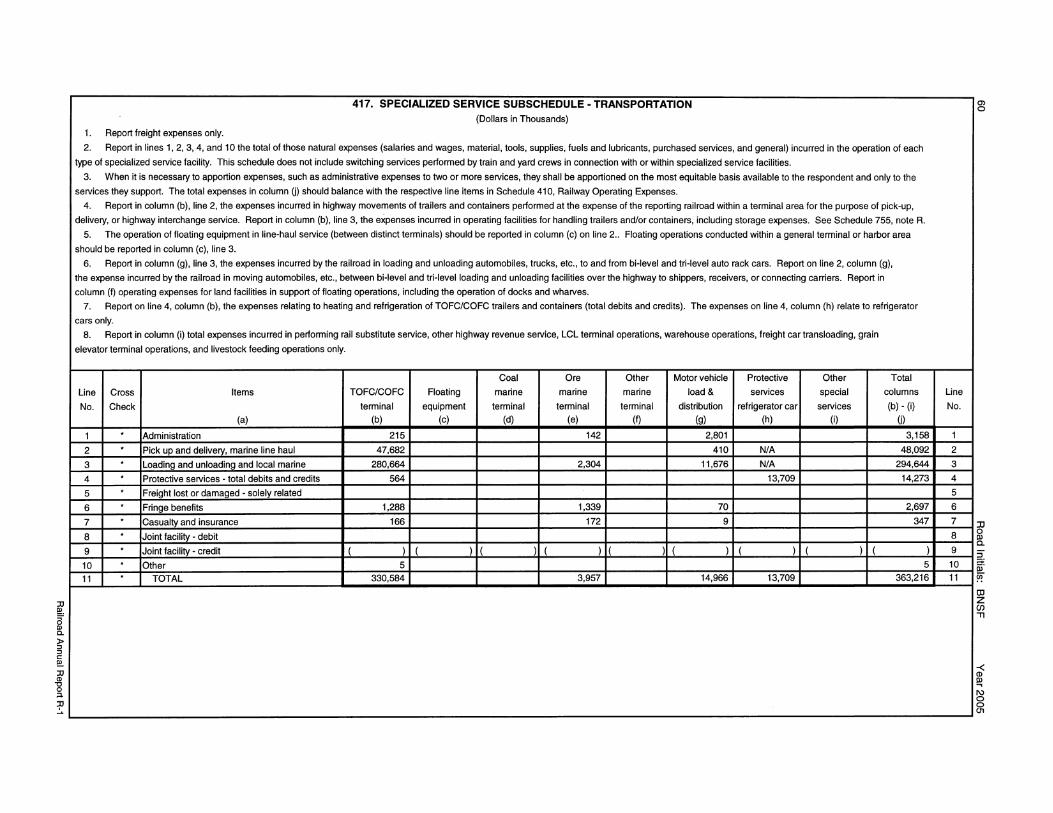
:II !!!.
i > :::i :::i c !!!.
fl/ ""C 0 ;::i.
~
417. SPECIALIZED SERVICE SUBSCHEDULE - TRANSPORTATION (Dollars in Thousands)
1. Report freight expenses only.
2. Report in lines 1, 2, 3, 4, and 10 the total of those natural expenses (salaries and wages, material, tools, supplies, fuels and lubricants, purchased seivices, and general) incurred in the operation of each
type of specialized seivice facility. This schedule does not include switching seivices performed by train and yard crews in connection with or within specialized service facilities.
3. When it is necessary to apportion expenses, such as administrative expenses to two or more services, they shall be apportioned on the most equitable basis available to the respondent and only to the
seivices they support. The total expenses in column OJ should balance with the respective line items in Schedule 410, Railway Operating Expenses.
4. Report in column (b), line 2, the expenses incurred in highway movements of trailers and containers performed at the expense of the reporting railroad within a terminal area for the purpose of pick-up,
delivery, or highway interchange service. Report in column (b), line 3, the e,(penses incurred in operating facilities for handling trailers and/or containers, including storage expenses. See Schedule 755, note R.
5. The operation of floating equipment in line-haul seivice (between distinct terminals) should be reported in column (c) on line 2 .. Floating operations conducted within a general terminal or harbor area
should be reported in column (c), line 3.
6. Report in column (g), line 3, the expenses incurred by the railroad in loading and unloading automobiles, trucks, etc., to and from bi-level and tri-level auto rack cars. Report on line 2, column (g),
the expense incurred by the railroad in moving automobiles, etc., between bi-level and tri-level loading and unloading facilities over the highway to shippers, receivers, or connecting carriers. Report in
column (f) operating expenses for land facilities in support of floating operations, including the operation of docks and whaives.
7. Report on line 4, column (b), the expenses relating to heating and refrigeration of TOFC/COFC trailers and containers (total debits and credits). The expenses on line 4, column (h) relate to refrigerator
cars only.
8. Report in column (i) total expenses incurred in performing rail substitute seivice, other highway revenue seivice, LCL terminal operations, warehouse operations, freight car transloading, grain
elevator terminal operations, and livestock feeding operations only.
Coal Ore Other Motor vehicle Protective Other Total
Line Cross Items TOFC/COFC Floating marine marine marine load& seivices special columns
No. Check terminal equipment terminal terminal terminal distribution refrigerator car seivices (b) - (i) (a) (b) (c) (d) (e) (I) (g) (h) (i) OJ
1 * Administration 215 142 2,801 3,158
2 * Pick up and delivery, marine line haul 47,682 410 N/A 48,092
3 * Loading and unloading and local marine 280,664 2,304 11,676 N/A 294,644
4 * Protective seivices - total debits and credits 564 13,709 14,273
5 * Freight lost or damaged - solely related
6 * Fringe benefits 1,288 1,339 70 2,697
7 * Casualty and insurance 166 172 9 347
8 * Joint facility - debit
9 * Joint facility - credit ( ) ( ) ( ) ( ) ( ) ( ) ( ) ( ) ( )
10 * Other 5 5
11 * TOTAL 330,584 3,957 14,966 13,709 363,216
Line
No.
1
2
3
4
5
6
7
8
9
10 11
m 0
J] 0
~ ::l
~ !'! CD z U> ""Tl
-< m ~ 0 (11

Road Initials· BNSF Year2005 61 418. SUPPORTING SCHEDULE· CAPITAL LEASES
(Dollars in Thousands)
Instructions:
This schedule will show the investment in capitalized leases in road and equipment by primary account.
Column (a) = primary account number and tHle for which capttal lease amounts are included therein. (b) = the total investment in that primary account. (c) = the investment in capttal leases at the end of the year. (d) = the current year amortization. (e) = the accumulated amortization relating to the leased properties.
Caottal Leases Primary Account Total Investment Investment at Current Year Accumulated
No.&Trtle At End of Year End of Year Amortization Amortization (a) (b) (cl (d) (e)
9 - Rail and Other Track Material 8,419,979 1,042 70 249
19 - Fuel Stations 237,n6 1,159 38 566
25 - TOFC/COFC 624,548 19,644 553 613
37 - Roadwav Machines 345,101 31,932 1,759 2,039
52 - Locomotives 3,392,124 1,187,002 51,976 334,343
57 - Work Equipment 152,572 20,643 1,818 6,652
58 - Miscellaneous Eauioment 319,394 110,146 19,072 27,284
Railroad Annual Report R-1

62 Road Initials: BNSF Year2005 NOTES AND REMARKS
THIS PAGE INTENTIONALLY LEFY BLANK
Railroad Annual Report R-1
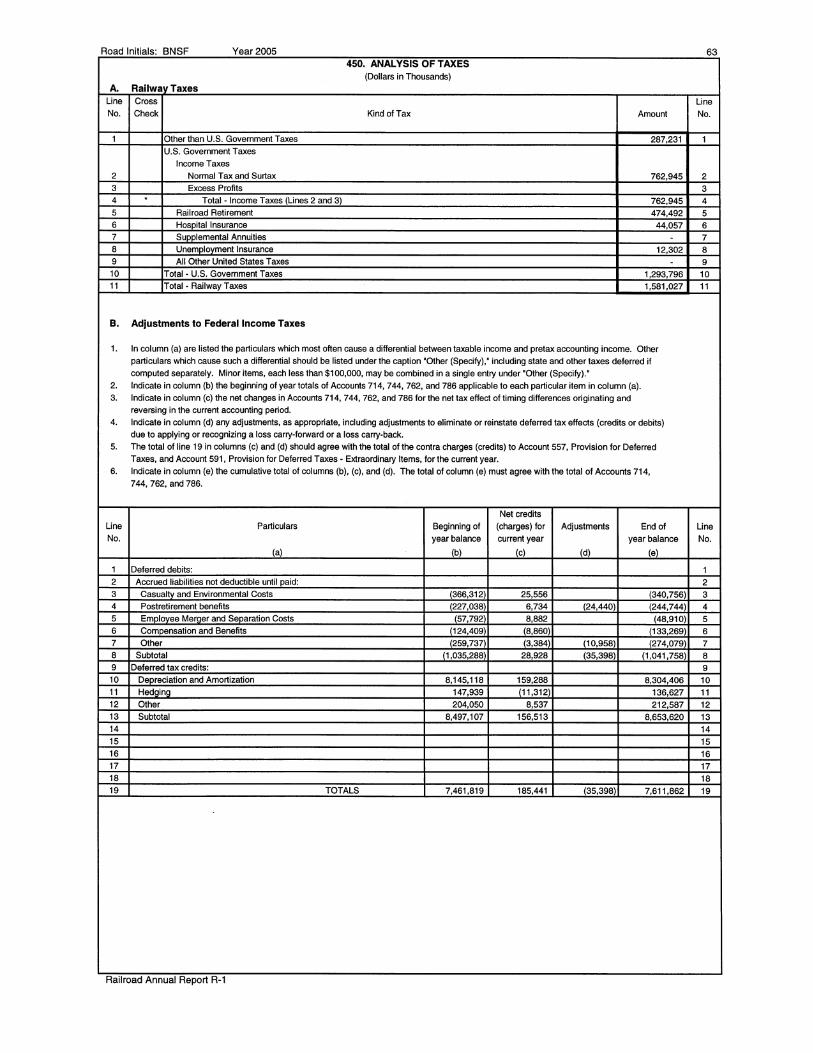
Road Initials· BNSF Year2005 63 450. ANALYSIS OF TAXES
(Dollars in Thousands)
A. Railwav Taxes Line Cross Line No. Check Kind ofTax Amount No.
1 Other than U.S. Government Taxes 287,231 1 U.S. Government Taxes
Income Taxes
2 Normal Tax and Surtax 762,945 2 3 Excess Profits 3 4 . Total· Income Taxes (Lines 2 and 3) 762,945 4 5 Railroad Retirement 474,492 5 6 Hospital Insurance 44,057 6 7 Suoolemental Annuities - 7 8 Unemployment Insurance 12,302 8 9 All Other United States Taxes - 9 10 Total - U.S. Government Taxes 1,293,796 10 11 Total - Railway Taxes 1,581,027 11
B. Adjustments to Federal Income Taxes
1. In column (a) are listed the particulars which most often cause a differential between taxable income and pretax accounting income. Other particulars which cause such a differential should be listed under the caption 'Other (Specify),' including state and other taxes deferred if
computed separately. Minor items, each less than $100,000, may be combined in a single entry under 'Other (Specify).•
2. Indicate in column (b) the beginning of year totals of Accounts 714, 744, 762, and 786 applicable to each particular item in column (a).
3. Indicate in column (c) the net changes in Accounts 714, 744, 762, and 786 for the net tax effect of timing differences originating and
reversing in the current accounting period.
4. Indicate in column (d) any adjustments, as appropriate, including adjustments to eliminate or reinstate deferred tax effects (credits or debits) due to applying or recognizing a loss carry-forward or a loss carry-back.
5. The total of line 19 in columns (c) and (d) should agree with the total of the contra charges (credits) to Account 557, Provision for Deferred
Taxes, and Account 591, Provision for Deferred Taxes - Extraordinary Items, for the current year.
6. Indicate in column (e) the cumulative total of columns (b), (c), and (d). The total of column (e) must agree with the total of Accounts 714, 7 44, 762, and 786.
Net credits
Line Particulars Beginning of (charges) for Adjustments End of Line No. year balance current year year balance No.
(a) (bl (c) (d) (e)
1 Deferred debits: 1 2 Accrued liabilities not deductible until paid: 2 3 Casualtv and Environmental Costs (366,312 25,556 (340,756) 3 4 Postretirement benefits (227,038) 6,734 (24,440) (244,744) 4 5 Emolovee Mercer and Seoaration Costs (57,792) 8,882 (48,910) 5 6 Compensation and Benefits (124,409) (8,860) (133,269 6 7 Other (259,737) (3,384) (10,958) (274,079) 7 8 Subtotal (1,035,288) 28,928 (35,398) (1,041,758) 8 9 Deferred tax credits: 9 10 Deoreciation and Amortization 8,145,118 159,288 8,304,406 10 11 Hedging 147,939 (11,312) 136,627 11 12 Other 204,050 8,537 212,587 12 13 Subtotal 8,497,107 156,513 8,653,620 13 14 14 15 15 16 16 17 17 18 18 19 TOTALS 7,461,819 185,441 (35,398 7,611,862 19
Railroad Annual Report R-1
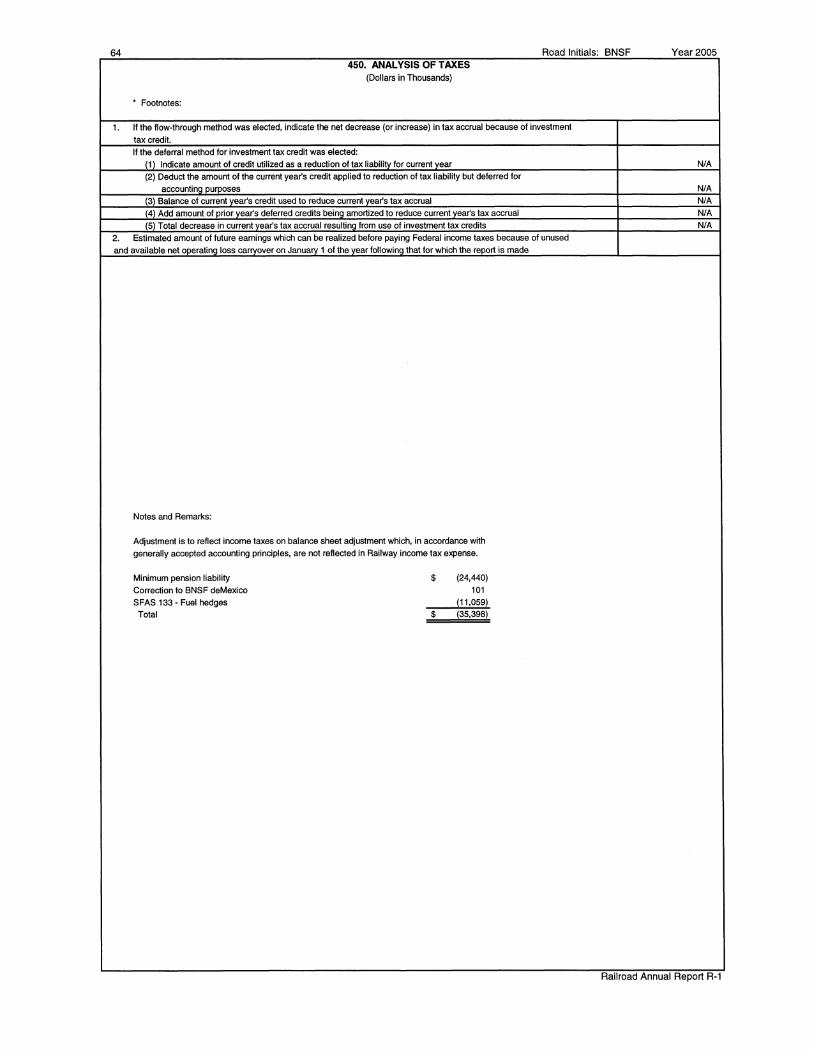
64 Road Initials· BNSF Year2005 450. ANALYSIS OF TAXES
(Dollars in Thousands)
• Footnotes:
1. If the flow-through method was elected, indicate the net decrease (or increase) in tax accrual because of investment tax credit. If the deferral method for investment tax credit was elected:
(1) Indicate amount of credit utilized as a reduction of tax liabilitv for current vear NIA (2) Deduct the amount of the current yea(s credit applied to reduction of tax liability but deferred for
accountinQ purposes N/A (3) Balance of current vea(s credit used to reduce current vea(s tax accrual N/A (4) Add amount of plior vea(s deferred credits beina amortized to reduce current vea(s tax accrual NIA (5) Total decrease in current vea(s tax accrual resultina from use of investment tax credits N/A
2. Estimated amount of future earnings which can be realized before paying Federal income taxes because of unused and available net operatina loss carrvover on January 1 of the vear followina that for which the report is made
Notes and Remarks:
Adjustment is to reflect income taxes on balance sheet adjustment which, in accordance with generally accepted accounting principles, are not reflected in Railway income tax expense.
Minimum pension liability $ (24,440)
Correction to BNSF deMexico 101 SFAS 133 - Fuel hedges (11,059)
Total $ !35,398)
Railroad Annual Report R-1
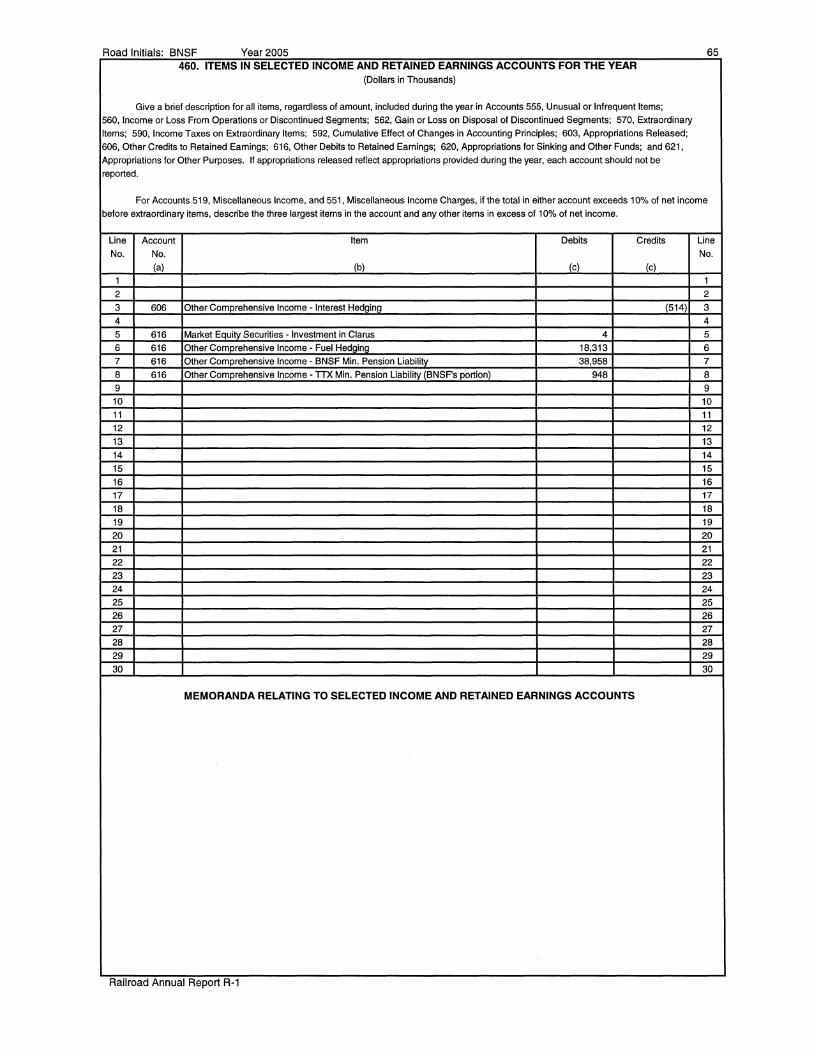
Road Initials· BNSF Year2005 65 460. ITEMS IN SELECTED INCOME AND RETAINED EARNINGS ACCOUNTS FOR THE YEAR
(Dollars in Thousands)
Give a brief description for all items, regardless of amount, included during the year in Accounts 555, Unusual or Infrequent Items;
560, Income or Loss From Operations or Discontinued Segments; 562, Gain or Loss on Disposal of Discontinued Segments; 570, Extraordinary
Items; 590, Income Taxes on Extraordinary Items; 592, Cumulative Effect of Changes in Accounting Principles; 603, Appropriations Released;
606, Other Credits to Retained Earnings; 616, Other Debits to Retained Earnings; 620, Appropriations for Sinking and Other Funds; and 621,
Appropriations for Other Purposes. If appropriations released reflect appropriations provided during the year, each account should not be
reported.
For Accounts 519, Miscellaneous Income, and 551, Miscellaneous Income Charges, if the total in either account exceeds 10% of net income
before extraordinary items, describe the three largest items in the account and any other items in excess of 10% of net income.
Line Account Item Debits Credits Line
No. No. No.
(a) (b) (c) (c)
1 1
2 2
3 606 Other Comprehensive Income - Interest Hedriini:i (514) 3
4 4
5 616 Market Equity Securities - Investment in Glarus 4 5
6 616 Other Comprehensive Income - Fuel Hedging 18,313 6
7 616 Other Comprehensive Income - BNSF Min. Pension Liability 38,958 7
8 616 Other Comprehensive Income - TIX Min. Pension Liability (BNSF's portion) 948 8
9 9
10 10 11 11
12 12
13 13
14 14
15 15
16 16
17 17
18 18
19 19
20 20
21 21
22 22
23 23
24 24
25 25
26 26
27 27
28 28
29 29
30 30
MEMORANDA RELATING TO SELECTED INCOME AND RETAINED EARNINGS ACCOUNTS
Railroad Annual Report R-1

66 Road Initials· BNSF Year2005
501. GUARANTIES AND SURETYSHIPS (Dollars in Thousands)
1. If the respondent was under obligation as guarantor or surety for the performance by any other corporation or association of any agreement or obligation, show the particulars of each contract of guarantee or suretyship in effect at the close of the year or entered into and expired during the year. This inquiry does not cover the case of ordinary commercial paper maturing on demand or not later than two years after the date of issue. Items of less than $50,000 may be shown as one total.
Line Names of all parties principally Description Amount of Sole or joint Line
No. and primarily liable contingent liability contingent liability No. (a) (b) (c) (d)
1 Terminal Railroad Association of St Louis 1 2 Burlington Northern and Santa Fe Railwav Companv Sinkina Fund and interest 7,787 Joint (Note 1) 2 3 CSX Transportation, Inc. on Refunding and Improvement 3 4 Illinois Central Gulf Railroad Co. Mortaaae Bonds Series C 4 5 Norfolk and Southern Railway Company due 7/01/2019 5 6 Union PacHic Railroad Company 6 7 St. Louis Southwestern Railwav Company 7 8 8 9 KCT lntermodal Transportation Corporation 9 10 Burlinaton Northern Santa Fe Railwav Companv 6.884% Railwav Bridae Svstem Bonds 62,200 Joint 10 11 Union Pacific Railroad Company Series 1998 Bonds due 11 12 August 1, 2018 12 13 13 14 The Unified Government of Wyandotte County/Kansas City, KS 14 15 Burlinaton Northern Santa Fe Railway Companv 5.648% Railwav Bridae Svstem Bonds 15
16 (KCT Araentine Connection Project) 13,500 Sole (Note 2) 16 17 June 15, 2023 17
18 Westside lntermodal Transportation Corporation 18
19 Burlinaton Northern Santa Fe Railway Company 5.648% Railway Bridge System Bonds 43,485 Sole (Note 3) 19
20 (KCT Araentine Connection Project) 20 21 June 15, 2023 21 22 22 23 Kinder Morgan Energy Partners, LP. 190,000 Sole (Note 4) 23 24 Burlington Northern Santa Fe Railway Company 24
25 25 26 Other debt and lease auarantees related to various 8,396 Sole 26 27 facilities 27 28 28 29 Residual Value Guarantees N/A 1Note5) 29 30 30 31 Note 1: Terminal Railroad Association of St. Louis Mortaaae Bonds are fully funded by TRRA through a Sinkina fund established with a balance in the 31 32 amount of approximately $15 million as of December 31, 2005. This fund covers future interest and principal oavments throuah the remainder of the bonds 32 33 term. 33 34 Note 2: At 12131/05, usina the percentaae of completion method, $11 million of the $14 million was included in schedule 510 as a caoital lease. 34 35 Note 3: At 12131/05, using the percentage of completion method, $36 million of the $43 million was included in schedule 510 as a capital lease. 35 36 Note 4: Santa Fe Pacific Pipelines, Inc (SFPP) , an indirect, wholly-owned subsidiarv of BNSF, has a guarantee in connection with its remaining special 36 37 partnership Interest in SFPP, LP. All obliaations with respect to the auarantee will cease upon termination of ownership rights which would occur upon a put 37 38 notice issued by BNSF or the exercise of the call rights by the general partners of SFPP, LP. I 38 39 Note 5: Residual value auarantees related to Locomotives, vehicles and miscellaneous other equipment. Maximum future payments are estimated to be 39 40 $298 million. The companv has recorded a $68 million asset and correspondina liabilitv for the fair value of the RVGs as of 12131/05. 40
2. If any corporation or other association was under obligation as guarantor or surety for the performance by the respondent of any agreement or obligation, show the particulars called for hereunder for each such contract of guaranty or suretyship in effect at the close of the year or entered into and expired during the year. This inquiry does not cover the case of ordinary commercial paper maturing on demand or not later than two years after the date of issue, nor does it include ordinary surety bonds or undertakings on appeals in court proceedings.
Finance cocket number, title Line maturity date and concise descrip- Names of all Amount of contingent Sole or joint Line No. lion of agreement or obligation guarantors and sureties liability of guarantors contingent liability No.
(a) (b) (c) (d)
1 1
2 2 3 None 3 4 4 5 5 6 6 7 7 8 8 9 9
Railroad Annual Report R-1
Road Initials: BNSF Year2005 502. COMPENSATING BALANCES AND SHORT-TERM BORROWING AGREEMENTS
(Dollars in Thousands)
Using the following notes as a guideline, show the requirements of compensating balances and short-term borrowing agreements. Footnote disclosure is required even the arrangement is not reduced to writing.
1. Disclose compensating balances not legally restricted, lines of credit used and unused, average interest rate of short-term borrowings that are outstanding at balance sheet date, maximum amount of outstanding borrowings during the period and the weighted average rate of those borrowings. 2. Time deposits and certificates of deposit constituting compensating balances not legally restricted should be disclosed. 3. Compensating balance arrangements need only be disclosed for the latest fiscal year. 4. Compensating balances included in Account 703, Special Deposits, and in Account 717, Other Funds, should also be separately disclosed below. 5. Compensating balance arrangements are sufficiently material to require disclosure in footnotes when the aggregate of written and oral
agreement balances amount to 15% or more of liquid assets (current cash balances, restricted and unrestricted, plus marketable securities). 6. When a carrier is not in compliance with a compensating balance requirement, that fact should be disclosed, along with stated and possible
sanctions, whenever such possible sanctions may be immediate (not vague or unpredictable) and material.
1. None 2. None 3. None 4. None 5. None 6. None
Railroad Annual Report R-1
67

68 Road Initials: BNSF Year 2005
NOTES AND REMARKS
THIS PAGE INTENTIONALLY LEFT BLANK
Railroad Annual Report R-1

Road Initials: BNSF Year 2005 69 510. SEPARATION OF DEBTHOLDINGS BETWEEN ROAD PROPERTY AND EQUIPMENT
(Dollars in Thousands)
The principal use of this schedule is to determine the average rate of debt capital.
I. Debt Outstanding at End of Year
Line Account Title Source Balance
No. No. Close of Year
(a) (b) (c) (d)
1 751 Loans and notes payable Sch 200, Line 30
2 764 Equipment oblioations and other Iona-term debt due within one year Sch 200, Line 39 456,129
3 765(767 Funded debt unmatured Sch 200, Line 41 456,401 4 766 Equipment oblioations Sch 200, Line 42 357,367
5 766.5 Capitalized lease obligations Sch 200, Line 43 495,240
6 768 Debt in default Sch 200, Line 44
7 769 Accounts payable • affiliated companies Sch 200, Line 45
8 770.1(770.2 Unamortized debt premium Sch 200, Line 46 (30,233)
9 Total debt Sum of Lines 1 through 8 1,734,904
10 Debt directly related to road propertv Note 1 506,593
11 Debt directly related to equipment Note 1 1,021,408
12 Total debt related to road and equipment Lines 10 and 11 1,528,001
13 Percent directly related to road Line 10/Line 12
Whole % + 2 decimals 33.15%
14 Percent directly related to equipment Line 11 /Line 12
Whole % + 2 decimals 66.85%
15 Debt not directly related to road and equipment Line 9 ·Line 12 206,903
16 Road propertv debt (Note 2) (Line 13 x Line 15) + Line 10 575,182
17 Equipment debt (Note 2) (Line 14 x Line 15) +Line 11 1,159,722
II. Interest Accrued During the Year
Line Account Title Source Balance
No. No. Close of Year
(al (b) (c) (d)
18 546-548 Total interest and amortization (fixed charges) Sch. 210, Line 42 121,357
19 546 Contingent interest on funded debt Sch. 210, Line 44
20 517 Release of premium on funded debt Sch. 210, Line 22
21 Total interest (Note 3) (Line 18 + Line 19) - Line 20 121,357
22 Interest directly related to road propertv debt Note4 29,862
23 Interest directlv related to equipment debt Note4 74,420
24 Interest not directly related to road or equipment property debt Line 21 • (Lines 22 + 23) 17,075
25 Interest on road property debt (Note 5) Line 22 + (Line 24 x Line 13) 35,522 26 Interest on eauipment debt (Note 5) Line 23 +(Line 24 x Line 14) 85,835
27 Embedded rate of debt capital • road propertv Line 25 / Line 16 6.18% 28 Embedded rate of debt capital • equipment Line 26 / Line 17 7.40%
Note 1: Directly related means the purpose which the funds were used for when the debt was issued.
Note 2: Line 16 plus Line 17 must equal Line 9.
Note3: Line 21 includes interest on debt in Account 769 - Accounts Payable; Affiliated Companies.
Note 4: This interest relates to debt reported on Lines 10 and 11, respectively.
Notes: Line 25 plus Line 26 must equal Line 21.
Railroad Annual Report R-1

70 Road Initials: BNSF Year2005 NOTES AND REMARKS
THIS PAGE INTENTIONALLY LEFT BLANK
Railroad Annual Report R-1
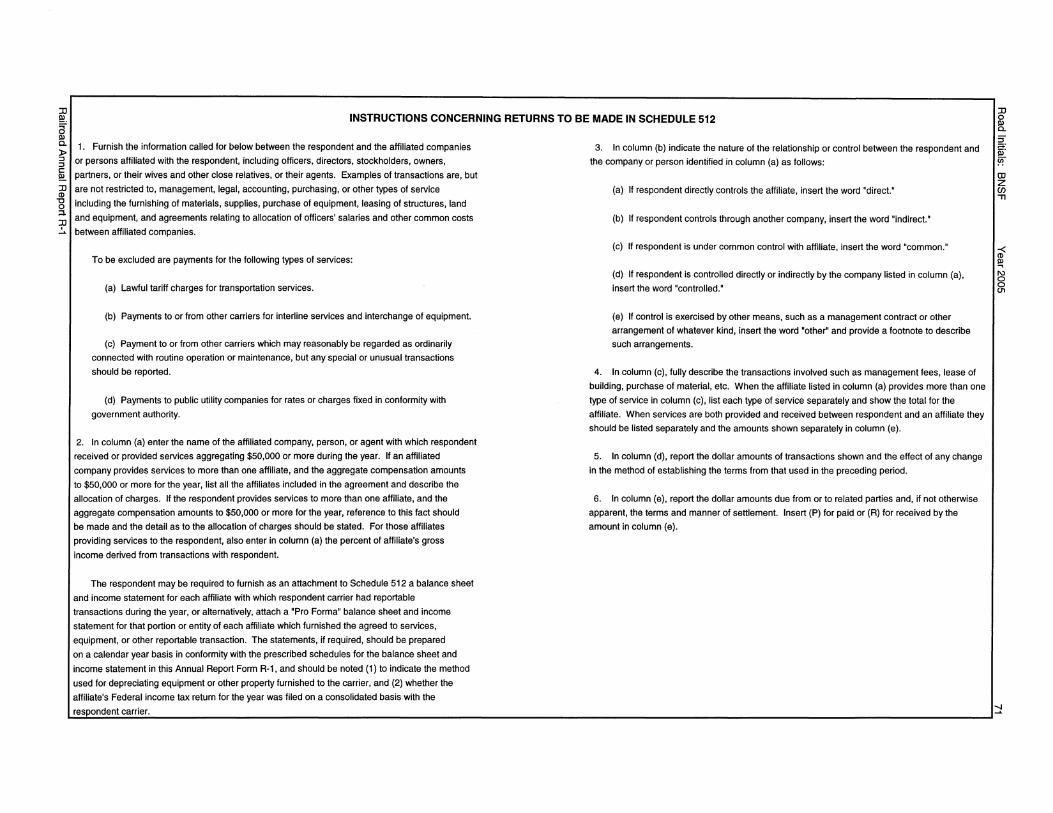
:D !!!. INSTRUCTIONS CONCERNING RETURNS TO BE MADE IN SCHEDULE 512
~ ~ I 1. Furnish the information called for below between the respondent and the affiliated companies ::I ::I c: !!!. :D <D
"t:J 0 ::l
~
or persons affiliated with the respondent, including officers, directors, stockholders, owners,
partners, or their wives and other close relatives, or their agents. Examples of transactions are, but
are not restricted to, management, legal, accounting, purchasing, or other types of service
including the furnishing of materials, supplies, purchase of equipment, leasing of structures, land
and equipment, and agreements relating to allocation of officers' salaries and other common costs
between affiliated companies.
To be excluded are payments for the following types of services:
(a) Lawful tariff charges for transportation services.
(b) Payments to or from other carriers for interline services and interchange of equipment.
(c) Payment to or from other carriers which may reasonably be regarded as ordinarily
connected with routine operation or maintenance, but any special or unusual transactions
should be reported.
(d) Payments to public utility companies for rates or charges fixed in conformity with
government authority.
2. In column (a) enter the name of the affiliated company, person, or agent with which respondent
received or provided services aggregating $50,000 or more during the year. If an affiliated
company provides services to more than one affiliate, and the aggregate compensation amounts
to $50,000 or more for the year, list all the affiliates included in the agreement and describe the
allocation of charges. If the respondent provides services to more than one affiliate, and the
aggregate compensation amounts to $50,000 or more for the year, reference to this fact should
be made and the detail as to the allocation of charges should be stated. For those affiliates
providing services to the respondent, also enter in column (a) the percent of affiliate's gross
income derived from transactions with respondent.
The respondent may be required to furnish as an attachment to Schedule 512 a balance sheet
and income statement for each affiliate with which respondent carrier had reportable
transactions during the year, or alternatively, attach a 'Pro Forma" balance sheet and income
statement for that portion or entity of each affiliate which furnished the agreed to services,
equipment, or other reportable transaction. The statements, if required, should be prepared
on a calendar year basis in conformity with the prescribed schedules for the balance sheet and
income statement in this Annual Report Form R-1, and should be noted (1) to indicate the method
used for depreciating equipment or other property furnished to the carrier, and (2) whether the
affiliate's Federal income tax return for the year was filed on a consolidated basis with the
3. In column (b) indicate the nature of the relationship or control between the respondent and
the company or person identified in column (a) as follows:
(a) If respondent directly controls the affiliate, insert the word "direct."
(b) If respondent controls through another company, insert the word "indirect."
(c) If respondent is under common control with affiliate, insert the word "common."
(d) If respondent is controlled directly or indirectly by the company listed in column (a),
insert the word "controlled.•
(e) If control is exercised by other means, such as a management contract or other
arrangement of whatever kind, insert the word 'other" and provide a footnote to describe
such arrangements.
4. In column (c), fully describe the transactions involved such as management fees, lease of
building, purchase of material, etc. When the affiliate listed in column (a) provides more than one
type of service in column (c), list each type of service separately and show the total for the
affiliate. When services are both provided and received between respondent and an affiliate they
should be listed separately and the amounts shown separately in column (e).
5. In column (d), report the dollar amounts of transactions shown and the effect of any change
in the method of establishing the terms from that used in the preceding period.
6. In column (e), report the dollar amounts due from or to related parties and, if not otherwise
apparent, the terms and manner of settlement. Insert (P) for paid or (R) for received by the
amount in column (e).
:D
[ 5"
~ !'!
CD z en "Tl
~ 8 U'1
respondent carrier. "::!

::D ~a ~ )> ::i ::i c: !!?. ::D ct>
"O 0 ::l.
~
Line
No.
1
2
3 4
5
6
7
8 9 10
11
12
13
14
15
16
17
18
19
20
21 22
23
24
25
512. TRANSACTIONS BETWEEN RESPONDENT AND COMPANIES OR PERSONS AFFILIATED WITH RESPONDENT FOR SERVICES RECEIVED OR PROVIDED (Dollars in Thousands)
Name of company or related Amount due from party with percent % Nature of relationship Description of Dollar amounts or to related of gross income transactions of transactions parties
(a) (b) (c) (d) (e) Burlinaton Northern Santa Fe Corporation Controlled Services Rendered 24,879 287,739
BN Acquisition Common (576)
Freiahtwise Common 1,848
BNSF IC Common Insurance Premiums 140,000 (315,886) Claims Paid 132,418 see above
BNSF Loaistics, LLC Common Services Rendered 16 (1,754)
Line
No.
1
2
3 4 5
6
7
8 9
10 11
12
13
14
15
16 17
18
19
20 21
22
23 24
25
-.J I\)
::D ~-g c.
~ iii" ??" CD z (J) "Tl
-< ct> ~ I\)
§

Road Initials: BNSF Year2005
INSTRUCTIONS CONCERNING RETURNS TO BE MADE IN SCHEDULE 700
State particulars of all tracks operated by the respondent at the close of the year, according to the following classifications: (1) Line owned by respondent. (2) Line owned by proprietary companies. (3) Line operated under lease for a specified sum, lessor being (A) an affiliated corporation, or (B) independent or not affiliated with the
respondent. (4) Line operated under contract or agreement for contingent rent, owner being (A) an affiliated corporation, or (B) independent or not
affiliated with the respondent. (5) Line operated under trackage rights.
Give subtotals for each of the several numbered classes, in the order listed above, as well as the total for all classes. Lengths of track should be reported to the nearest WHOLE mile adjusted to accord with footings; i.e., counting one-half mile or over as a whole
mile and disregarding any fraction less than one-half mile. In Column (a) insert the figure (and letter, if any) indicating its class in accordance with the above list of classifications. In Column (b) give the various proportions of each class owned or leased by respondent, listing each proportion once in any grouping.
Canadian mileage should be segregated and identified on separate lines in the various groupings. For each listing, in Column (d) give its entire length (the distances between terminals of single or first main track), and in the following columns the lengths of second main track, all other main tracks, passing tracks, cross-overs and tum-outs, way switching tracks, and yard switching tracks. These classes of tracks are defined as follows:
RUNNING TRACKS - Running tracks, passing tracks, cross-overs, etc., including turn-outs from those tracks to clearance points. WAY SWITCHING TRACKS - Station, team, industry, and other switching tracks for which no separate service is maintained. YARD SWITCHING TRACKS - Yard where separate switching services are maintained, including classification, house, team, industry, and other
tracks switched by yard locomotives. The returns in Columns (h) and (i) should include tracks serving industries, such as mines, mills, smelters, factories, etc. Tracks belonging to an
industry for which no rent is payable should not be included. Tracks leading to and in gravel and sand pits and quarries, the cost of which is chargeable to a clearing account and which are used in getting
out material for the respondent's use, should not be included, Class (1) includes all lines operated by the respondent at the close of the year to which it has title in perpetuity. Class (2) includes each line, full title to which is in an inactive proprietary corporation of the respondent (i.e., one all of whose outstanding
stocks or obligations are held by or for the respondent, and which is operated by the respondent or an affiliated system corporation without any accounting to the said proprietary corporation). It may also include such line when the actual title to all of the outstanding stocks or obligations rests in a corporation controlled by or controlling the respondent. But in the case of any such inclusion, the facts of the relationship to the respondent of the corporation holding the securities should be fully set forth in a footnote. An inactive corporation is one which has been practically absorbed in a controlling corporation, and which neither operates property nor administers its financial affairs. If it maintains an organization, it does so only for the purpose of complying with legal requirements and maintaining title to property or franchises.
Class (3) includes all tracks operated under a lease or formal conveyance of less than the grantor's interest in the property, with a specific and unconditional rent reserved. The fact that the lessor does or does not maintain an independent organization for financial purposes is immaterial in this connection.
Class (4) is the same as Class (3), except that the rent reserved is conditional upon earnings or some other fact. Class (5) includes all tracks operated and maintained by others, but over which the respondent has the right to operate some or all of its
trains. In the road of this class, the respondent has no proprietary rights, but only the rights of a licensee. Include in this class, also, on main tracks, industrial tracks and sidings owned by noncarrier companies and individuals when the respondent operates over them but does not have exclusive possession of them.
Road held by respondent as a joint or common owner or a joint lessee or under any joint arrangement should be shown in its appropriate class and the entry of length should be the entire length of the portion jointly held. The class symbol should have the letter (J) attached.
Road operated by the respondent as an agent for another carrier should not be included in this schedule.
Railroad Annual Report R-1
73

74 Road Initials· BNSF Year2005
700. MILEAGE OPERATED AT CLOSE OF YEAR
Runnin! tracks, passing tracks, cross-overs, etc. Proportion Miles of owned or Miles Miles of Miles of passing tracks, Miles of Miles of
Line Class leased by of second all other cross-overs, way switching yard switching TOTAL Line No. respondent road main track main tracks and turnouts tracks tracks No.
(a) (b) (c) (d) (e) (!) lal (h) (i)
1 1 100% 23,057 4,354 114 3,195 2,464 5,535 38,719 1 2 1J 75% 5 5 2 3 1J 66.7% 17 17 3 4 1J 50% 536 122 80 48 84 245 1, 115 4 5 1J 33.3% 2 1 6 35 44 5 6 1J 25% 1 55 56 6 7 1J 20% 7 8 1J 16.7% 8
9 Total 1J 538 122 80 49 91 357 1,237 9 10 10
11 Total 1 and 1J 23,595 4,476 194 3,244 2,555 5,892 39,956 11 12 12 13 2 123 10 9 25 167 13 14 3 34 34 14 15 4 15 4 1 8 28 15 16 5 8,421 327 26 123 319 164 9,380 16 17 17 57 Grand Total 32,154 4,803 220 3,381 2,884 6,123 49,565 57 58 Miles of electrified road 58
or track included in the NONE preceding grand total
700. CANADIAN MILEAGE OPERATED AT THE CLOSE OF YEAR (INCLUDED IN SCHEDULE 700 ABOVE)
Runnini tracks, passina tracks, cross-overs, etc. Proportion Miles of owned or Miles Miles of Miles of passing tracks, Miles of Miles of
Line Class leased by of second all other cross-overs, way switching yard switching TOTAL Line No. respondent road main track main tracks and turnouts tracks tracks No.
(a) lb) (c) (d) le\ (fl la\ (h) (i) 1 1 100% 36 10 6 1 18 71 1 2 1J 50% 5 5 2 3 Total 1 and 1J 41 10 6 1 18 76 3 4 2 4 1 5 10 4 5 5 70 2 5 6 83 5
Grand Total Canadian 57 Miles 115 12 11 8 23 169 57
Railroad Annual Report R-1

JJ !!!.
[ ?;' ::>
~ JJ CD -c 0 ;:::i.
~
702. MILES OF ROAD AT CLOSE OF YEAR· BY STATES AND TERRITORIES (SINGLE TRACK)
Give particulars, as of the close of the year, of all road operated and of all road owned but not operated. The respondent's proportion of operated road held by tt as a joint or common owner, or
under a joint lease, or under any joint arrangement, should be shown in columns (b), (c), (d), or (e), as may be appropriate. The remainder of jointly operated mileage should be shown in column (f).
Respondent's proportion of road jointly owned but not operated should be shown in column (h), as appropriate. Mileage which has been permanently abandoned should not be included in column (h).
Mileage should be reported to the nearest WHOLE mile adjusted in accord with footings; i.e., counting one-haH mile and over as a whole mile and disregarding any fraction less than one-haH mile.
MILES OF ROAD OPERATED BY RESPONDENT
Line of Line operated Line operated Total Line owned,
Line Cross State or Line proprietary Line operated under contract, under trackage mileage not operated
No. Check territory owned companies under lease etc. rights operated by respondent
(a) (b) (c) (d) (e) (I) (o) (h)
1 Alabama 115 129 244 17
2 Arizona 595 595
3 Arkansas 203 849 1,052
4 British Columbia 41 1 42
5 California 1,155 975 2,130 43
6 Colorado 771 96 533 1,400 3
7 Florida
8 Idaho 124 1 125 33
9 Illinois 1,199 2 213 1,414 5
10 Iowa 637 38 675
11 Kansas 1,275 3 475 1,753 6
12 Kentuckv 13 13
13 Louisiana 237 111 348
14 Manitoba 4 69 73
15 Minnesota 1,598 95 1,693 3
16 Mississippi 166 13 179
17 Missouri 1,598 166 1,764
18 Montana 1,966 17 1,983 800
19 Nebraska 1,540 94 1,634
20 Nevada 805 805
21 New Mexico 1,029 365 1,394 248
22 North Dakota 1,907 16 1,923 650
23 Oklahoma 1,040 253 1,293 189
24 Oreaon 235 151 386 127
25 South Dakota 901 25 926
26 Tennessee 17 17
27 Texas 2,504 20 2,471 4,995 100
28 Utah 433 433
29 Washinaton 1,509 112 1,621 113
30 Wisconsin 267 6 273
31 Wyoming 966 5 971
32 Total Mileage (Single Track) 23,595 123 15 8,421 32,154 2,337
Newline
constructed
during year
(i)
Line
No.
1
2
3
4
5
6
7
8
9
10
11
12
13
14
15
16
17
18
19
20
21
22
23
24
25
26
27
28
29
30
31
32
[ :;-;::+ iii" !i?" IJJ z UJ "Tl
~ !!!
~
CJl

76 Road Initials: BNSF Year2005
NOTES AND REMARKS
THIS PAGE INTENTIONALLY LEFT BLANK
Railroad Annual Report R-1

:II !!!.
INSTRUCTIONS CONCERNING RETURNS TO BE MADE IN SCHEDULE 710
[ Instructions for reporting locomotive and passenger-train car data.
)>
~ , 1. Give particulars of each of the various classes of equipment which respondent owned or leased
!!!.. during the year. :II <D -g ::1
~
2. In column (c), give the number of units purchased new or built in company shops. In column (d),
give the number of new units leased from others. The term 'new' means a unit placed in service for
the first time on any railroad.
3. Units leased to others for a period of one year or more are reportable in column (I). Units
temporarily out of respondent's service and rented to others for less than one year are to be
included in column (h). Units rented from others for a period less than one year should not be
included in column (i).
4. For reporting purposes, a "locomotive unit" is a self-propelled vehicle generating or converting
energy into motion, and designed solely for moving other equipment. An "A" unit is the least
number of wheel bases with superstructure designed for use singly or as a lead locomotive unit in
combination with other locomotive units. A "B" unit is similar to an "A" unit but it is not equipped
for use singly or as a lead locomotive unit. A "B" unit may be equipped with hostler controls for
independent operation at terminals.
5. A 'self-propelled" car is a rail motor car propelled by electric motors receiving power from a
third rail or overhead, or internal combustion engines located on the car itself. Trailers equipped
for use only in trains of cars that are self-propelled are to be included as self-propelled equipment.
6. A 'diesel" unit includes all units propelled by diesel internal combustion engines regardless of
final drive or whether power may at times be supplied from an external conductor. Units other than
diesel-electric, e.g., diesel-hydraulic, should be identified in a footnote, giving the number and a
brief description.. An 'electric" unit includes all units which receive electric power from a third
rail or overhead contact wire, and use the power to drive one or more electric motors that propel
the vehicle. An 'other self-powered unit" includes all units other than diesel or electric, e.g., gas
turbine, steam. Show the type of unit, service, and number, as appropriate, in a brief description
sufficient for positive identification. An "Auxiliary unit' includes all units used in conjunction with
locomotives, but which draw their power from the "mother' unit, e.g., boosters, slugs, etc. For
reporting purposes, indicate radio-controlled self-powered diesel units on lines 1 through 8, as
appropriate. Radio-controlled units that are not self-propelled, i.e., those without a diesel, should
be reported on line 13 under "auxiliary units.•
7. Column (k) should show aggregate capacity for all units reported in column OJ, as follows:
For locomotive units, report the manufacturer's rated horsepower (the maximum continuous
power output from the diesel engines or engines delivered to the main generator or generators
for tractive purposes). Exclude capacity data for steam locomotives. For passenger-train cars,
report the number of passenger seats available for revenue service, counting one passenger to
each berth in sleeping cars.
8. Passenger-train car types and service equipment car types correspond to AAR Mechanical
Division designations. Descriptions of car codes and designations are published in The
Official Railway Equipment Register.
9. Cross-checks
Schedule 71 O
Line 5, column (j) Line 6, column (j)
Line 7, column (j) Line 8, column (j)
Line 9, column (j) Line 10, column (j)
Schedule 71 O
Line 11, column (I)
Line 12, column (I)
Line 13, column (I)
Line 14, column (I)
Line 15, column (I)
Line 16, column (I)
When data appear in column (j), lines 1 through 8, column (k) should have data on the same lines.
When data appear in columns (k) or (I), lines 36 through 53, and 55, column (m) should have
data on the same lines.
..___ ______________________________________ _
:II 0
~ 5" ::;: iii" ii>
Ill z Ul "Tl
-< <D !!l N
~
:::I

:D ~.
[ )> ::i ::i c: !!!.
$l "O 0 ;:i.
~
Line
No.
1
2
3
4
5
6
7
8
9
10
Line
No.
11
12
13
14
15
16
Cross
Check
. . . . .
.
Cross
Check
. . . . .
.
710. INVENTORY OF EQUIPMENT UNITS OWNED, INCLUDED IN INVESTMENT ACCOUNT, AND LEASED FROM OTHERS
Changes During the Year Units at Close of Year
Units Installed
All other units Units retired
including from service
Rebuilt units reclassification of respondent Aggregate Units in acquired and and second whether capacity of
service of New units rebuilt units hand units owned or Total in units respondent New units leased rewritten purchased leased, Owned Leased service of reported
at beginning purchased from into property or leased from including and from respondent in col (j) Type or design of units of year or built others accounts others reclassification used others [col (h) &(i)] (See Ins. 7)
(a) (b) (c) (d) (e) (f) (g) (h) (i) (j) (k)
Locomotive Units (HP) Diesel-freight units 4,328 288 49 2,171 2,396 4,567 17,959,620
Diesel-passenger units
Diesel-multiple purpose units 1,090 131 823 136 959 2,090,397
Diesel-switching units 257 32 220 5 225 300,400
TOTAL (lines 1to4) units 5,675 288 212 3,214 2,537 5,751 20,350,417
Electric locomotives
Other self-powered units 2 2
TOTAL (lines 5, 6, and 7) 5,677 288 214 3,214 2,537 5,751 20,350,417
Auxiliary units 38 1 39 39 NIA
TOTAL LOCOMOTIVE UNITS (lines 8 and 9) 5,715 288 1 214 3,253 2,537 5,790 20,350,417
DISTRIBUTION OF LOCOMOTIVE UNITS IN SERVICE OF RESPONDENT AT CLOSE OF YEAR BUILT, DISREGARDING YEAR OF REBUILDING
During Calendar Year
Between Between Between Between
Jan 1, 1985 Jan 1, 1990 Jan 1, 1995 Jan 1, 2000
Before and and and and
Type or design of units Jan 1,1985 Dec31, 1989 Dec31, 1994 Dec31, 1999 Dec 31, 2004 2005 2006 2007 2008 2009
(a) (b) (c) (d) (e) (f) (g) (h) (i) Gl (k)
Diesel 1,637 371 930 1,504 1,021 288
Electric
Other self-powered units
TOTAL (lines 11 to 13) 1,637 371 930 1,504 1,021 288
Auxiliary units 23 4 12
TOTAL LOCOMOTIVE UNITS (lines 14 and 15) 1,660 375 942 1,504 1,021 288
Leased
to others (I)
TOTAL (I)
5,751
5,751
39
5,790
al
Line
No.
1
2
3 4
5
6 7
8
9
10
1: ~ Line 1,
No. 1: ~ 11
12
13
14
15
16
o;· iii
DJ z (/) .,
m I\)
8 01
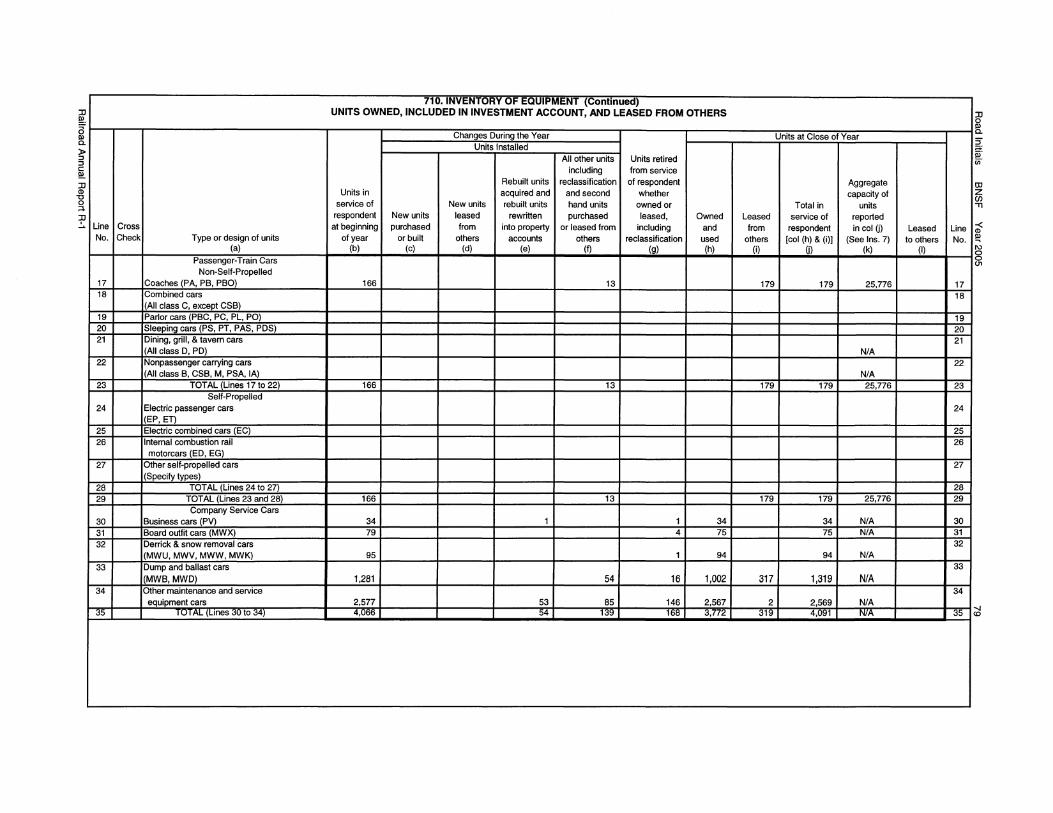
JJ !!!.
[ )> ::J ::J c: !!!. JJ CD
"O 0 ;::i.
~ Line Cross No. Check
17 18
19 20 21
22
23
24
25 26
27
28 29
30 31 32
33
34
35
Type or design of units (a)
Passenger-Train Cars Non-Self-Propelled
Coaches (PA, PB, PBO) Combined cars (All class C, except CSB) Parlor cars (PBC, PC, PL, PO) Sleeping cars (PS, PT, PAS, PDSl Dining, grill, & tavern cars (All class D, PD) Nonpassenger carrying cars (All class B, CSB, M, PSA, IA)
TOTAL /Lines 17 to 22) Self-Propelled
Electric passenger cars (EP, ET) Electric combined cars (EC) Internal combustion rail motorcars IED, EG)
Other self-propelled cars (Specifv tvoes)
TOTAL (Lines 24 to 27) TOTAL (Lines 23 and 28) Company Service Cars
Business cars (PV) Board outm cars (MWXl Derrick & snow removal cars (MWU, MWV, MWW, MWK) Dump and ballast cars
(MWB,MWD) Other maintenance and service
equipment cars I u I AL (Lines 30 to 34)
710. INVENTORY OF EQUIPMENT (Continued) UNITS OWNED, INCLUDED IN INVESTMENT ACCOUNT, AND LEASED FROM OTHERS
Chanoes During the Year Units Installed
All other units Units retired including from service
Rebuilt units reclassification of respondent Units in acquired and and second whether
service of New units rebuilt units hand units owned or respondent New units leased rewritten purchased leased, Owned at beginning purchased from into property or leased from including and
of year or built others accounts others reclassification used (b) (c) (d) (e) (f) (g) (h)
166 13
166 13
166 13
34 1 1 34 79 4 75
95 1 94
1,281 54 16 1,002
2,577 53 85 146 2,567 4,066 54 l<I~ 168 3,772
Un~s at Close of Year
Aggregate capacity of
Total in units Leased service of reported
from respondent incolG) others [col (h)& (i)] (See Ins. 7)
(i) m (k)
179 179 25,776
NIA
N/A 179 179 25,776
179 179 25,776
34 NIA 75 NIA
94 NIA
317 1,319 NIA
2 2,569 N/A 319 4,U~l NIA
Leased Line to others No.
(I)
17 18
19 20 21
22
23
24
25 26
27
28 29
30 31 32
33
34
35
JJ
~ ~ !!!: en
11
11
OJ z en ""Tl
~ ~
§
-.J <O

80 Road Initials BNSF Year 2005 710. INVENTORY OF EQUIPMENT - Continued
Instructions for reporting freight-train car data. 1. Give particulars of each of the various classes of equipment which respondent owned or leased during the year. 2. In Column (d) give the number of units purchased or built in company shops. In Column (e) give the number of new units leased from
others. The term "new' means a unit placed in service for the first time on any railroad. 3. Units leased to others for a period of one year or more are reportable in Column (n). Units temporarily out of respondent's service
and rented to others for less than one year are to be included in Column (i). Units rented from others for a period less than one year should not be included in Column G).
UNITS OWNED, INCLUDED IN INVESTMENT ACCOUNT, AND LEASED FROM OTHERS Units in service of respon- Chanaes durina the year dent at beainnina of vear Units installed
Rebuilt units All other units, acquired and Including
New units New or rebuilt units reclassification Class of equipment Time- purchased rebuilt units rewritten and second hand
Line Cross and mileage All or leased into units purchased Line No. Check car designations cars Others built from others property or leased No.
accounts from others (a) (b) (c) (d) (e) (f) (g)
FREIGHT TRAIN CARS 36 Plain box cars - 40' 36
(B1_, B2_l 22 Plain box cars - 50' and longer
37 (B3_0-7, B4_0·7, BS_, B6_ B7~ BB I 5 37
Equipped box cars 38 (All Code A, Exceot A 5 l 9,625 576 325 38
Plain gondola cars 39 (All Codes G & J, J_ 1, J_2,
J 3,J_4) 8,367 297 6 39 Equipped gondola cars
40 (All Code El 7,703 65 40 Covered hopper cars
41 (C_1, C_2, C_3, C_4) 35,066 5,979 342 325 41 Open top hopper cars - general
42 service (All Code H) 6,972 30 42 Open top hopper cars • special
43 service (J 0), and All Code Kl 4,285 1,180 43 Refrigerator cars - mechanical
44 (R_5,_, R_6_, R_7 _, R_8_, R_9_) 1,911 44 Refrigerator cars - nonmechanical
45 (R_O , R_1_, R_2_l 3,509 40 45
Flat cars - TOFC/COFC 46 (All Code P, Q, & S, Except QB_l 3,893 883 46
Flat cars - multilevel 47 (AllCodeV) 894 3 47
Flat cars - general service 48 (F10 , F20 , F30 _) 153 48
Flat cars - other 49 (F_1_, F_2_, F_3_, F_4~ F_S_, 4,086 240 70 15 49
F6,F8,F40l Tank cars - under 22,000 gal.
50 (T_O, T_1, T_2, T_3, T_4, 130 1 50 T_S)
Tank cars - 22,000 gal. and over 51 (T 6,T 7,T 8, T 9) 482 51
All other freight cars 52 (A 5 ,F 7 ,AllCodeL&Q8 l 6 60 52 53 TOTAL (Lines 36 to 52) 87,109 8,609 1,102 726 53 54 Caboose (All Code M-930) N/A 267 54 55 TOT AL (Lines 53 and 54) 87,109 267 8,609 1,102 726 55
Railroad Annual Report R-1
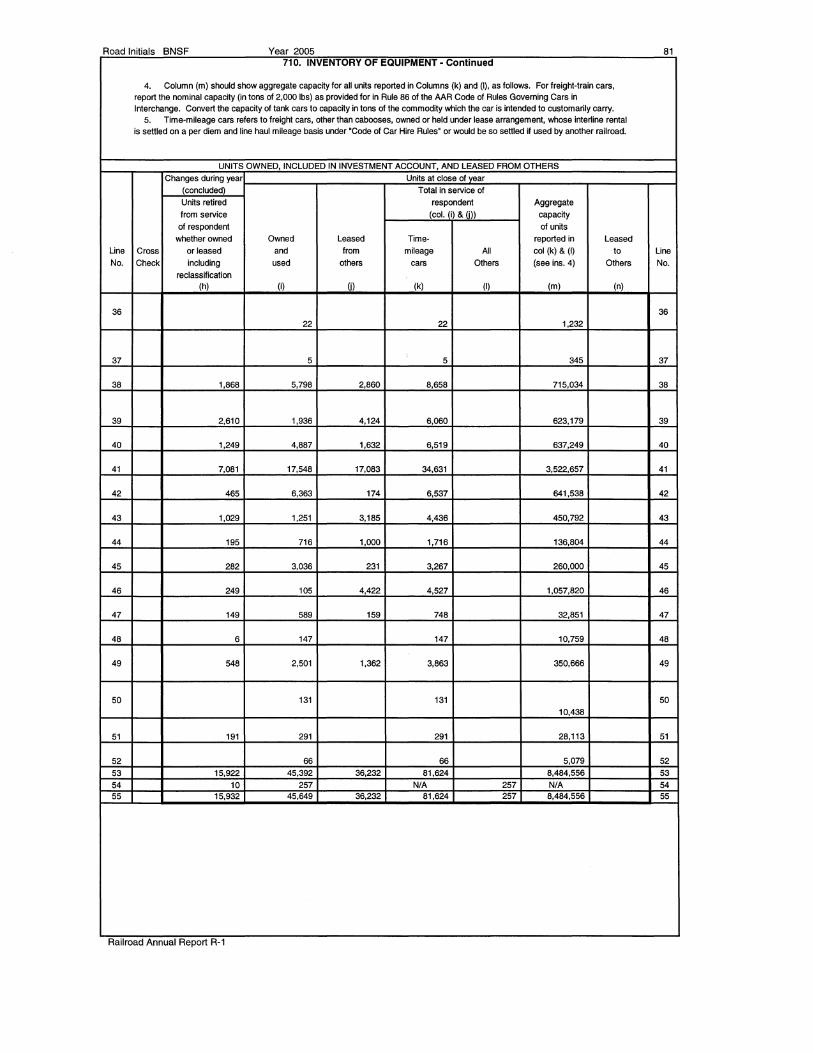
Road Initials BNSF Year 2005 81 710. INVENTORY OF EQUIPMENT· Continued
4. Column (m) should show aggregate capacity for all units reported in Columns (k) and (I), as follows. For freight-train cars, report the nominal capacity (in tons of 2,000 lbs) as provided for in Rule 86 of the AAR Code of Rules Governing Cars in Interchange. Convert the capacity of tank cars to capacity in tons of the commodity which the car is intended to customarily carry.
5. Time-mileage cars refers to freight cars, other than cabooses, owned or held under lease arrangement, whose inte~ine rental is settled on a per diem and line haul mileage basis under 'Code of Car Hire Rules' or would be so settled if used by another railroad.
UNITS OWNED, INCLUDED IN INVESTMENT ACCOUNT, AND LEASED FROM OTHERS
Changes during year Units at close of vear
(concluded) Total in service of
Units retired respondent Aggregate
from service (col. (i &(i)) capacity
of respondent of units whether owned Owned Leased Time- reported in Leased
Line Cross or leased and from mileage All col (k) &(I) to Line
No. Check including used others cars Others (see ins. 4) Others No.
reclassification (h) (i) Ol (k) (I) (m) (n)
36 36
22 22 1,232
37 5 5 345 37
38 1,868 5,798 2,860 8,658 715,034 38
39 2,610 1,936 4,124 6,060 623,179 39
40 1,249 4,887 1,632 6,519 637,249 40
41 7,081 17,548 17,083 34,631 3,522,657 41
42 465 6,363 174 6,537 641,538 42
43 1,029 1,251 3,185 4,436 450,792 43
44 195 716 1,000 1,716 136,804 44
45 282 3,036 231 3,267 260,000 45
46 249 105 4,422 4,527 1,057,820 46
47 149 589 159 748 32,851 47
48 6 147 147 10,759 48
49 548 2,501 1,362 3,863 350,666 49
50 131 131 50 10,438
51 191 291 291 28,113 51
52 66 66 5,079 52
53 15,922 45,392 36,232 81,624 8,484,556 53
54 10 257 N/A 257 NIA 54 55 15,932 45,649 36,232 81,624 257 8,484,556 55
Railroad Annual Report R-1

82 Road Initials BNSF Year 2005 710. INVENTORY OF EQUIPMENT· Continued
UNITS OWNED, INCLUDED IN INVESTMENT ACCOUNT, AND LEASED FROM OTHERS Units in service of respon· Chanaes durina the vear dent at beginning of year Units installed
Rebuilt units All other units, acquired and including
New units rebuilt units reclassnication Class of equipment purchased New units rewritten and second hand
Line Cross and Per All or leased into units purchased Line No. Check car designations diem Others built from others property or leased No.
accounts from others (a) (b) (c) (d) (e) (!) (g)
FLOATING EQUIPMENT Self-propelled vessels
56 (tuaboats, car ferries, etc.) NIA 56 Non-self-propelled vessels
57 (car floats, liahlers, etc.) NIA 57 58 TOT AL (Lines 56 and 57) NIA 58
HIGHWAY REVENUE EQUIPMENT
59 Chassis (Z1 , Z67 , Z68 , Z 69 _) 9,846 1,S99 1,236 S9 60 Drvvan (U2 , Z , Z6 , 1-6) 12,643 60 61 Flat bed (U3 ,Z3 l 61 62 Ooen bed (U4 ,Z4 l 62 63 Mechanical refrigerator (US , ZS ) 63 64 Bulk hoooer (UO ,ZO l 64 65 Insulated (U7 ,Z7_J 65 66 Tank(ZO , U6 l (See note) 66
Other trailer and container 67 (Special equipped dry van U9_, 67
Z8 ,Z9 I 68 Tractor 68 69 Truck 69
70 TOTAL (Lines S9 to 69) 22,489 1,S99 1,236 70
NOTES AND REMARKS
Note: Line 66 (Tank) must have fitting code 'CN' to qualfy as a tank, otherwise It is a bulk hopper.
Railroad Annual Report R-1

Road Initials BNSF Year 2005 83 710. INVENTORY OF EQUIPMENT- Concluded
UNITS OWNED, INCLUDED IN INVESTMENT ACCOUNT, AND LEASED FROM OTHERS
Changes during year Units at close of vear
(concluded) Total in service of Units retired respondent Aggregate
from service (col. (i) &(j)) capacity
of respondent of units
whether owned Owned Leased reported in Leased
Line Cross or leased and from Per All col (k) &(I) to Line
No. Check including used others diem Others (see ins. 4) Others No.
reclassHication
(h) (i) (j) (k) (I) (m) (n)
56 NIA 56
57 NIA 57
58 NIA 58
59 32 904 11,745 12,649 382,806 59
60 315 775 11,553 12,328 407,778 60 61 61
62 62
63 63
64 64
65 65
66 66
67 67
68 68
69 69
70 347 1,679 23,298 24,977 790,584 70
NOTES AND REMARKS
Railroad Annual Report R-1
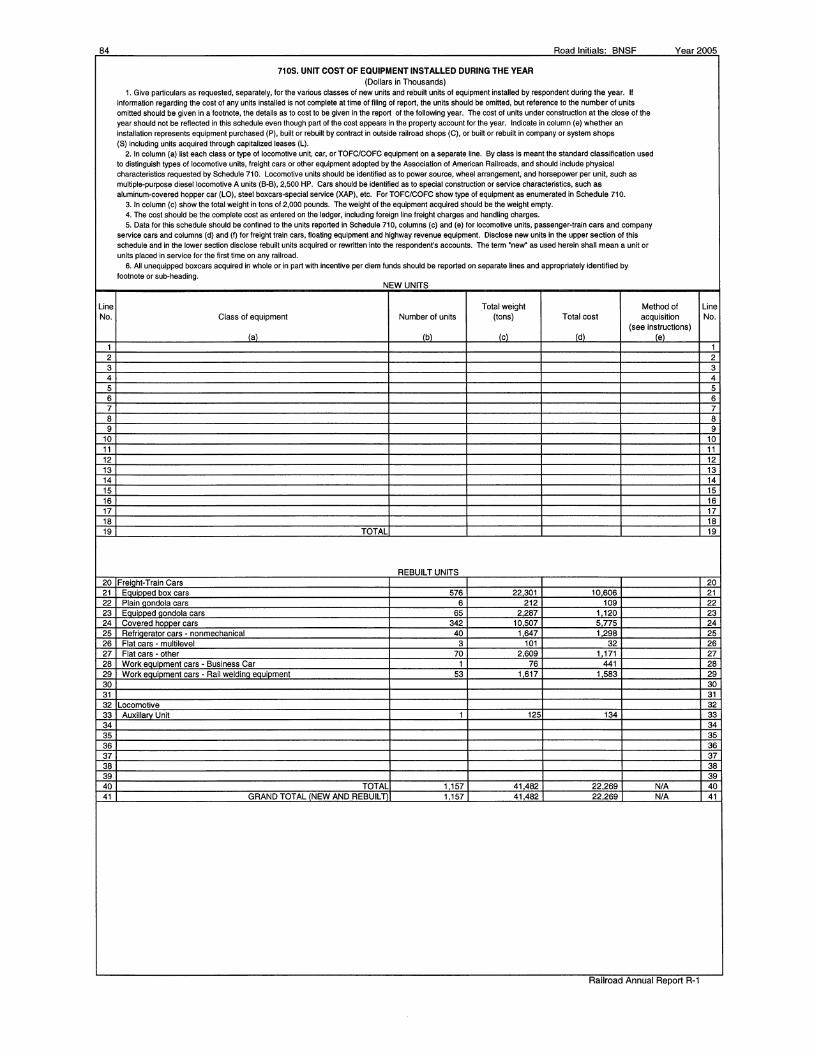
84 Road Initials· BNSF Year2005
710S. UNIT COST OF EQUIPMENT INSTALLED DURING THE YEAR (Dollars in Thousands)
1. Give particulars as requested, separately, for the various classes of new uni1s and rebuilt units of equipment installed by respondent during the year. If information regarding the cost of any units installed is not complete at time of filing of report, the units should be omitted, but reference to the number of units omitted should be given in a footnote, the details as to cost to be given In the report of the following year. The cost of units under construction at the close of the year should not be reflected in this schedule even though part of the cost appears In the property account for the year. Indicate in column (e) whether an installation represents equipment purchased (P), built or rebuilt by contract In outside railroad shops {C), or built or rebuilt In company or system shops (S) including units acquired through capitalized leases {L).
2. In column (a) list each class or type of locomotive unit, car, or TOFC/COFC equipment on a separate line. By class Is meant the standard classification used to distinguish types of locomotive units, freight cars or other equipment adopted by the Association of American Railroads, and should include physical characteristics requested by Schedule 710. Locomotive units should be Identified as to power source, wheel arrangement, and horsepower per unit, such as multiple-purpose diesel locomotive A uni1s (B-B), 2,500 HP. Cars should be identified as to special construction or service characteristics, such as aluminum-covered hopper car (LO), steel boxcars-special service (XAP), etc. For TOFC/COFC show type of equipment as enumerated in Schedule 710.
3. In column (c) show the total weight In tons of 2,000 pounds. The weight of the equipment acquired should be the weight empty. 4. The cost should be the complete cost as entered on the ledger, including foreign line freight charges and handling charges. 5. Data for this schedule should be confined to the units reported In Schedule 710, columns {c) and {e) for locomotive units, passenger-train cars and company
service cars and columns (d) and {f) for freight train cars, floating equipment and highway revenue equipment. Disclose new units in the upper section of this schedule and In the lower section disclose rebuilt units acquired or rewritten into the respondent's accounts. The term 'new' as used herein shall mean a unit or units placed in service for the first time on any railroad.
6. All unequipped boxcars acquired In whole or In part with incentive per diem funds should be reported on separate lines and appropriately identified by footnote or sub-heading.
NEW UNITS
Line Total weight Method of Line No. Class of equipment Number of units (tons) Total cost acquisition No.
(see instructions) la\ lb\ le\ ldl lel
1 1 2 2 3 3 4 4 5 5 6 6 7 7 8 8 9 9
10 10 11 11 12 12 13 13 14 14 15 15 16 16 17 17 18 18 19 TOTAL 19
REBUILT UNITS 20 Freiaht-Train Cars 20 21 Eauiooed box cars 576 22301 10 606 21 22 Plain aondola cars 6 212 109 22 23 Eauiooed aondola cars 65 2287 1120 23 24 Covered hoooer cars 342 10507 5775 24 25 Refriaerator cars - nonmechanical 40 1 647 1,298 25 26 Flat cars - multilevel 3 101 32 26 27 Flat cars - other 70 2609 1171 27 28 Work eauioment cars - Business Car 1 76 441 28 29 Work eauioment cars - Rail weldina eauioment 53 1 617 1 583 29 30 30 31 31 32 Locomotive 32 33 Auxillarv Unit 1 125 134 33 34 34 35 35 36 36 37 37 38 38 39 39 40 TOTAL 1,157 41482 22269 NIA 40 41 GRAND TOTAL INEW AND REBUILT 1,157 41482 22 269 N/A 41
Railroad Annual Report R-1

~ [ > ::J ::J
~ :0 (1) "C 0 :::i.
~
GENERAL INSTRUCTIONS CONCERNING RETURNS TO BE MADE IN SCHEDULES 720, 721, 723, AND 726
1. For purposes of these schedules, the track categories are defined as follows: Track category 1 A - Freight density of 20 million or more gross ton miles per track mile per year (include passing tracks, turnouts and crossovers)
8 - Freight density of less than 20 million gross ton miles per track mile per year, but at least 5 million (include passing tracks, turnouts and crossovers)
C - Freight density of less than 5 million gross ton miles per track mile per year, but at least 1 million (include passing tracks, turnouts and crossovers)
D - Freight density of less than 1 million gross ton miles per track mile per year(include passing tracks, turnouts and crossovers)
E - Way and yard switching tracks (passing tracks, crossovers and turnouts shall be included in category A, 8, C, D, F, and Potential abandonments, as appropriate).
F - Track over which any passenger service is provided (other than potential abandonments). Mileage should be included within track categories A through E unless there is dedicated entirely to passenger service F.
Potential abandonments - Route segments identified by railroads as potentially subject to abandonment as required by Section 10904 of the Interstate Commerce Act.
2.This schedule should include all class 1, 2, 3, or 4 track from schedule 700 that is maintained by the respondent (class 5 is assumed to be maintained by others).
3. If, for two consecutive years, a line segment classified in one track category maintains a traffic density which would place it in another, it shall be reclassified into that category as of the beginning of the second year.
4.Traffic density related to passenger service shall not be included in the determination of the track category of a line segment.
720. TRACK AND TRAFFIC CONDITIONS
1. Disclose the requested information pertaining to track and traffic conditions.
Line Miieage OT traCKS Average annual tramc aens1ty in Average running 1 racK mues unaer No. Track Category at end of period millions of gross ton-miles per track-mile* speed limit slow orders
(whole numbers) (use two decimal places) (use two decimal places) at end of period Cal (b) (c) (d) (e)
1 A 21,360 62.05 57.86 582.2 2 8 6,773 11.65 45.43 431.4 3 c 1,890 2.88 38.21 114.4 4 D 1,638 0.42 22.65 405.1 5 E 8,524 n/a n/a 6 TOTAL 40,185 44.54 52.20 1,533.1 7 F 11,010 n/a n/a 8 Potential abandonments
*To determine average density, total track miles (route miles times number of tracks), rather than route-miles, shall be used.
Line No.
1 2 3 4 5 6 7 8
~ :::; :::;:
!\!: rn
OJ z en "Tl
i ~
' ' ffi
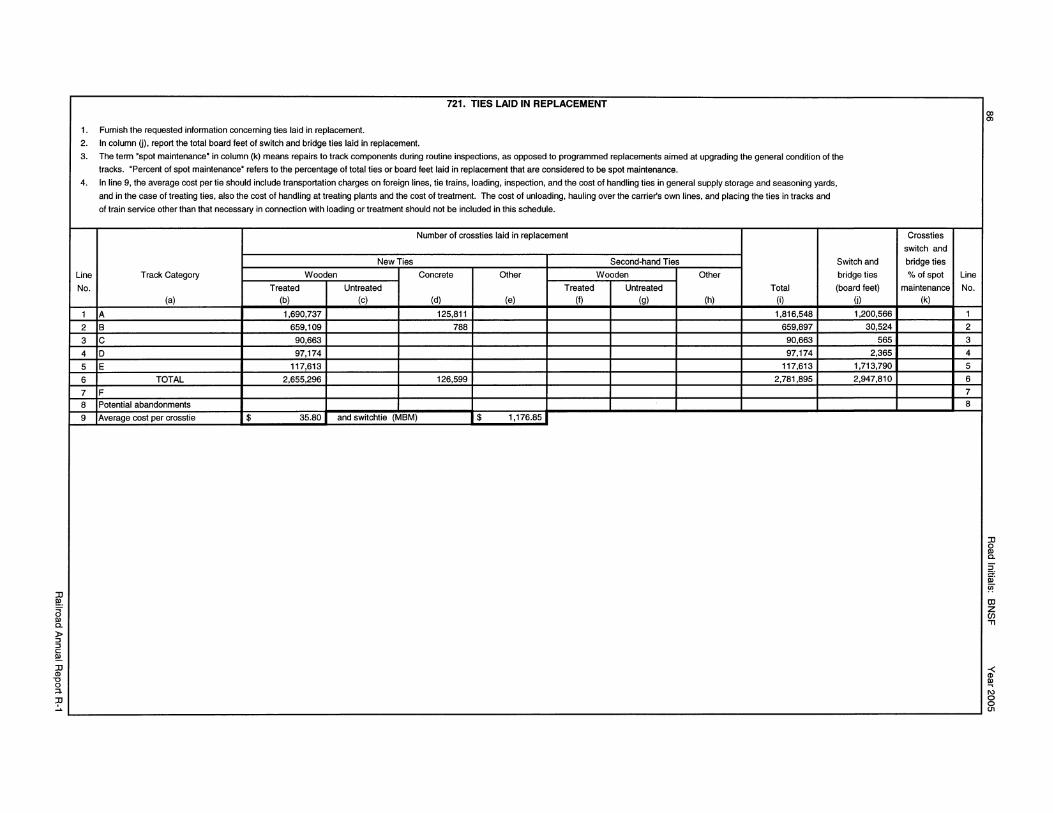
~ [ )> ::J ::J c: !!!. :D CD
"'C 0 ;::i.
~
1.
2.
3.
4.
Line
No.
1
2
3
4
5
6
7 8
9
721. TIES LAID IN REPLACEMENT
Furnish the requested information concerning ties laid in replacement.
In column (j), report the total board feet of switch and bridge ties laid in replacement.
The term 'spot maintenance' in column (k) means repairs to track components during routine inspections, as opposed to programmed replacements aimed at upgrading the general condition of the
tracks. 'Percent of spot maintenance' refers to the percentage of total ties or board feet laid in replacement that are considered to be spot maintenance.
In line 9, the average cost per tie should include transportation charges on foreign lines, tie trains, loading, inspection, and the cost of handling ties in general supply storage and seasoning yards,
and in the case of treating ties, also the cost of handling at treating plants and the cost of treatment. The cost of unloading, hauling over the carrier's own lines, and placing the ties in tracks and
of train service other than that necessary in connection with loading or treatment should not be included in this schedule.
Number of crossties laid in replacement
New Ties Second-hand Ties Switch and
Track Category Wooden Concrete Other Wooden Other bridge ties
Treated Untreated Treated Untreated Total (board feet) (a) (b) (c) (d) (e) (I) (g) (h) (i) (j)
A 1,690,737 125,811 1,816,548 1,200,566
B 659,109 788 659,897 30,524
c 90,663 90,663 565
D 97,174 97,174 2,365
E 117,613 117,613 1,713,790
TOTAL 2,655,296 126,599 2,781,895 2,947,810
F Potential abandonments
Average cost per crosstie $ 35.80 and switchtie (MBM) $ 1,176.85
Crossties
switch and
bridge ties
"lo of spot
maintenance (k)
Line
No.
1 2
3
4
5
6 7 8
00
°'
:D
~ ~ iii' w Ol z C/l "Tl
~ ~
g c.n

:rJ !!!. a ~ )> :J :J c: !!!. :rJ CD
"8 ;:::i.
~
722. TIES LAID IN ADDITIONAL TRACKS AND IN NEW LINES AND EXTENSIONS (Dollars in Thousands)
Give particulars of ties laid during the year in new construction during the year.
In column (a), classify the ties as follows:
U - Wooden ties, untreated when applied.
T - Wooden ties, treated before application.
S - Ties other than wooden (steel, concrete, etc.). Indicate type under remarks in column (h).
Report new and second-hand (relay) ties separately, indicating in column (h) which ties are new.
In columns (d) and (g), show the total cost, including transportation charges on foreign lines, tie trains, loading, inspection, and the cost of handling ties in general supply, storage and seasoning yard.
In the case of treated ties, also show the cost of handling at treating plants and the cost of treatment. The cost of unloading, hauling over carrier's own lines, and placing the ties in tracks, and of train
service, other than that necessary in connection with loading or treatment, should not be included in this schedule.
Crossties Switch and Bridge Ties
Total cost of Total cost of
crossties laid in Number of feet Average cost switch & bridge
Line Class Total number Average cost new tracks (board measure) per M feet ties laid in new Remarks
No. of ties of ties applied pertie during year laid in tracks (board measure) tracks during year
(a) (b) (c) (d) (e) (I) (g) (h)
1 T 50,226 55.37 2,781 14,690 1,179.85 17,332 New
2 s 339,402 46.61 15,820 - Concrete
3
4
5
6
7
8
9
10
11
12
13
14
15
16
17
18
19
20 TOTAL 389,628 18,601 14,690 17,332
21 Number of miles of new running tracks, passing tracks, cross-overs, etc., in which ties were laid 130.76
22 Number of miles of new yard, station, team, industry, and other switching tracks in which ties were laid 31.26
Line
No.
1
2
3
4
5
6
7
8
9
10
11
12
13
14
15
16
17
18
19
20
21
22
:rJ
~ 2: pf !'! ID z en ,,
-< m I\) 0 0 C11
00 '-I

:;o ~-a Q) a. )> ::J ::J c: !!!. :;o <1>
"8 ;::i.
~
1.
2.
3.
Line
No.
1
2
3
4
5
6
7
8
9
723. RAILS LAID IN REPLACEMENT
Furnish the requested infonnation concerning rails laid in replacement.
The tenn "spot maintenance" in column (h) means repairs to track components during routine inspections, as opposed to programmed replacements aimed at upgrading the general condition of the
tracks. "Percent of spot maintenance" refers to the percentage of total rails laid in replacement that are considered to be spot maintenance.
In line 9, the average cost of new and relay rail should include the cost of loading at the point of purchase ready for shipment, freight charges paid to foreign lines, and the cost of handling rails in
general supply and storage yards. The cost of unloading, hauling over the carrier's own lines, and placing the rails in tracks and of train service in connection wtth the distribution of rails should not
be included in this schedule.
Miles of rail laid in replacement (rail-miles) Total
New rail Relay rail
Track Welded Bolted Welded Bolted Welded Bolted
Category rail rail rail rail rail rail (a) (b) (c) (d) (e) (f) (g)
A 751.47 3.62 125.48 12.31 876.95 15.93
B 73.22 0.35 12.23 1.20 85.45 1.55
c 6.83 0.03 1.14 0.11 7.97 0.14
D - - - -E 91.78 0.44 15.32 1.50 107.10 1.94
TOTAL 923.30 4.44 154.17 15.12 1,077.47 19.56
F
Potential Abandonments
Average cost of new and relay rail laid in replacement per gross ton $677.66 New $696.85 Relay $573.89
Percent of
Spot Line
Maintenance No.
(h)
1
2
3
4
5
6
7
8
9
co co
:;o 0 Q) a. 3' g. ii!"" OJ z en .,
-< <1> !!! "' 0 0 01
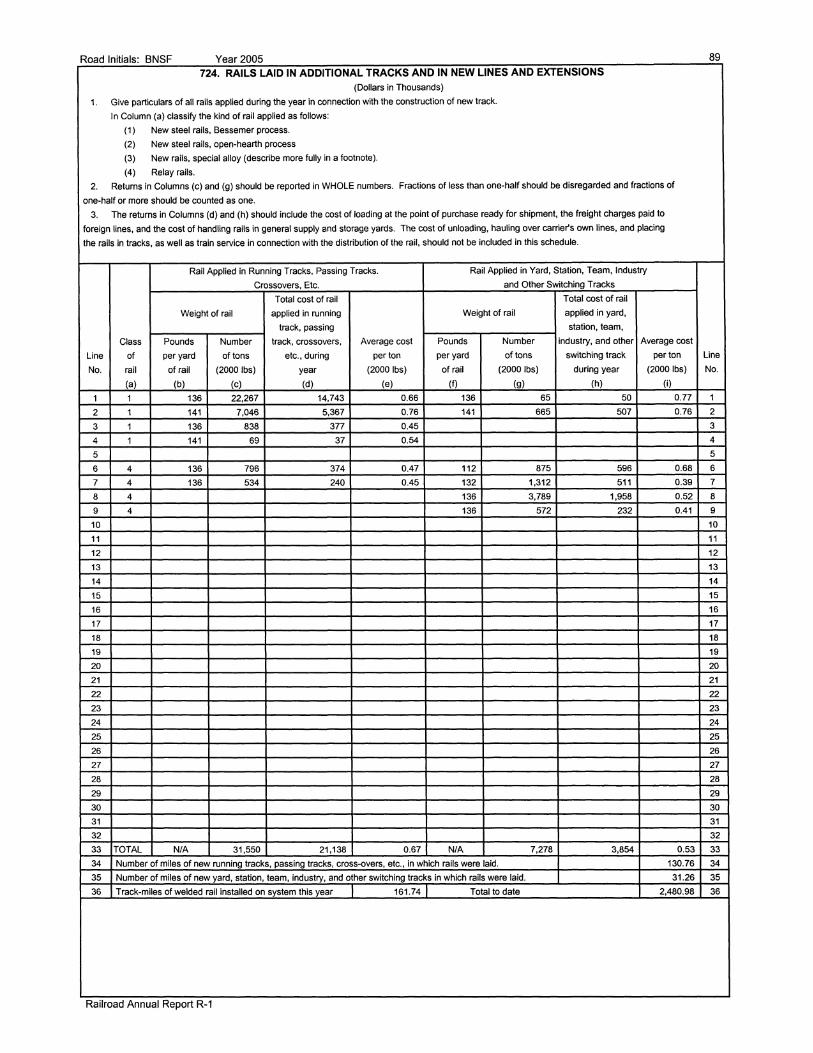
Road Initials· BNSF Year2005 89 724. RAILS LAID IN ADDITIONAL TRACKS AND IN NEW LINES AND EXTENSIONS
(Dollars in Thousands)
1. Give particulars of all rails applied during the year in connection with the construction of new track.
In Column (a) classify the kind of rail applied as follows:
(1) New steel rails, Bessemer process.
(2) New steel rails, open-hearth process
(3) New rails, special alloy (describe more fully in a footnote).
(4) Relay rails.
2. Returns in Columns (c) and (g) should be reported in WHOLE numbers. Fractions of less than one-half should be disregarded and fractions of
one-half or more should be counted as one.
3. The returns in Columns (d) and (h) should include the cost of loading at the point of purchase ready for shipment, the freight charges paid to
foreign lines, and the cost of handling rails in general supply and storage yards. The cost of unloading, hauling over carrier's own lines, and placing
the rails in tracks, as well as train service in connection with the distribution of the rail, should not be included in this schedule.
Rail Applied in Running Tracks, Passing Tracks. Rail Applied in Yard, Station, Team, Industry
Crossovers, Etc. and Other Switching Tracks
Total cost of rail Total cost of rail
Weight of rail applied in running Weight of rail applied in yard,
track, passing station, team,
Class Pounds Number track, crossovers, Average cost Pounds Number industry, and other Average cost
Line of per yard of tons etc., during per ton per yard of tons switching track per ton Line
No. rail of rail (2000 lbs) year (2000 lbs) of rail (2000 lbs) during year (2000 lbs) No.
(a) (b) (c) (d) (e) (f) (g) (h) (i)
1 1 136 22,267 14,743 0.66 136 65 50 0.77 1
2 1 141 7,046 5,367 0.76 141 665 507 0.76 2
3 1 136 838 377 0.45 3
4 1 141 69 37 0.54 4
5 5
6 4 136 796 374 0.47 112 875 596 0.68 6
7 4 136 534 240 0.45 132 1,312 511 0.39 7
8 4 136 3,789 1,958 0.52 8
9 4 136 572 232 0.41 9
10 10
11 11
12 12
13 13
14 14
15 15
16 16
17 17
18 18
19 19
20 20
21 21
22 22
23 23
24 24
25 25
26 26
27 27
28 28
29 29
30 30
31 31
32 32
33 TOTAL NIA 31,550 21,138 0.67 NIA 7,278 3,854 0.53 33
34 Number of miles of new running tracks, passing tracks, cross-overs, etc., in which rails were laid. 130.76 34
35 Number of miles of new yard, station, team, industry, and other switching tracks in which rails were laid. 31.26 35
36 Track-miles of welded rail installed on system this year 161.74 Total to date 2,480.98 36
Railroad Annual Report R-1
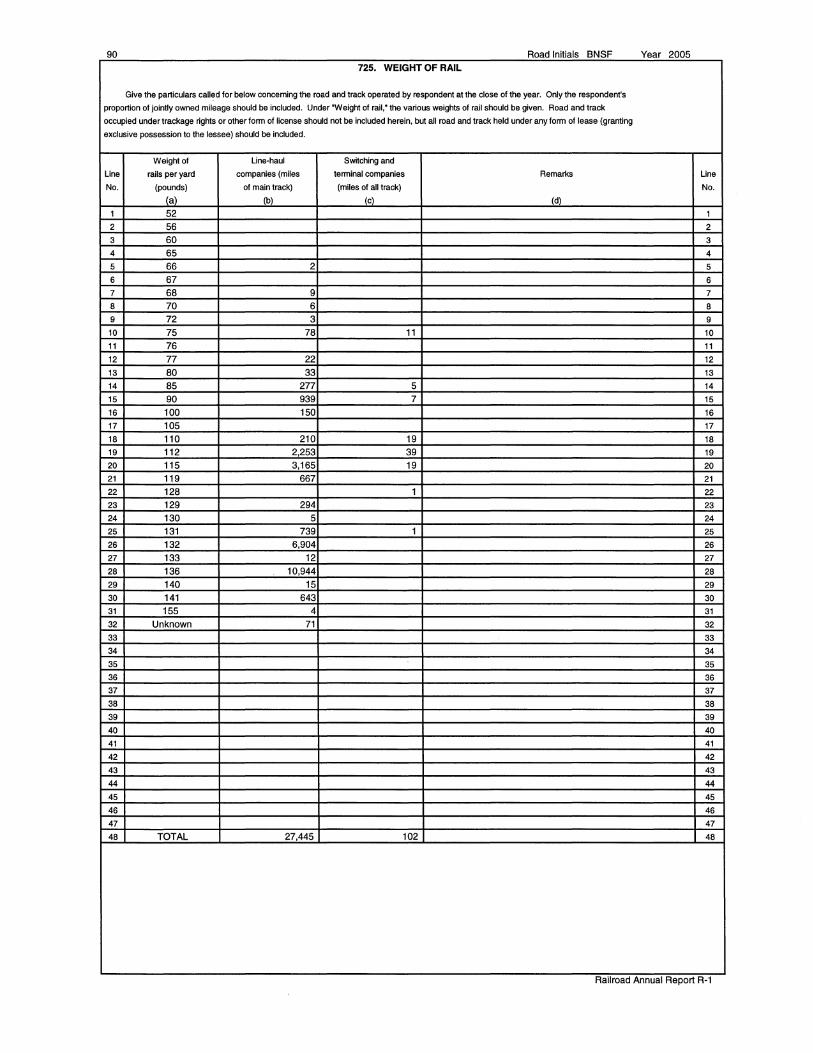
90 Road Initials BNSF Year 2005
725. WEIGHT OF RAIL
Give the particulars called for below concerning the road and track operated by respondent at the close of the year. Only the respondent's
proportion of jointly owned mileage should be included. Under "Weight of rail," the various weights of rail should be given. Road and track
occupied under trackage rights or other form of license should not be included herein, but all road and track held under any form of lease (granting
exclusive possession to the lessee) should be included.
Weight of Line-haul Switching and
Line rails per yard companies (miles terminal companies Remarks Line
No. (pounds) of main track) (miles of all track) No.
(a) (bl (cl (dl
1 52 1
2 56 2
3 60 3
4 65 4
5 66 2 5
6 67 6
7 68 9 7
8 70 6 8
9 72 3 9
10 75 78 11 10
11 76 11
12 77 22 12
13 80 33 13
14 85 277 5 14
15 90 939 7 15
16 100 150 16
17 105 17
18 110 210 19 18
19 112 2,253 39 19
20 115 3,165 19 20
21 119 667 21
22 128 1 22
23 129 294 23
24 130 5 24
25 131 739 1 25
26 132 6,904 26
27 133 12 27
28 136 10,944 28
29 140 15 29
30 141 643 30
31 155 4 31
32 Unknown 71 32
33 33
34 34
35 35
36 36
37 37
38 38
39 39
40 40
41 41
42 42
43 43
44 44
45 45
46 46
47 47
48 TOTAL 27,445 102 48
Railroad Annual Report R·1
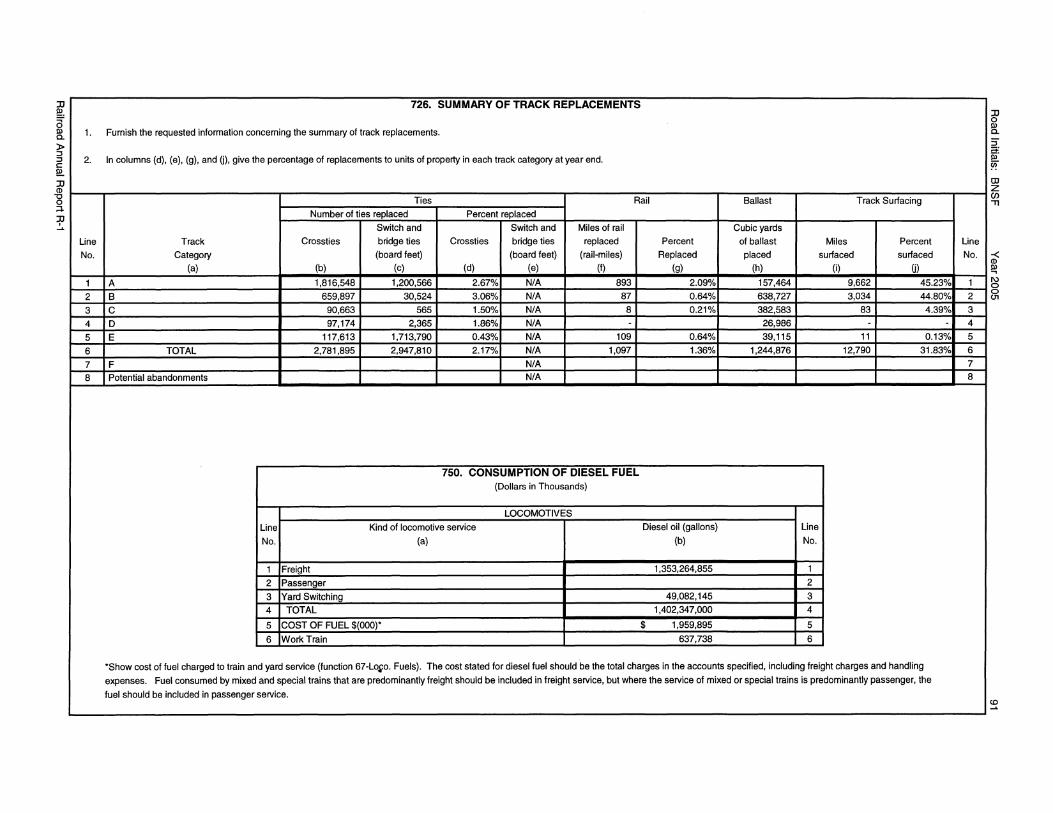
~
i )> ~ ~ c: !!!. J) CD
"8 ;:+
~
1.
2.
Line No.
1 2 3 4 5 6 7 8
726. SUMMARY OF TRACK REPLACEMENTS
Furnish the requested information concerning the summary of track replacements.
In columns (d), (e), (g), and 0), give the percentage of replacements to units of property in each track category at year end.
Ties Rail Ballast Track Surfacing Number of ties replaced Percent replaced
Switch and Switch and Miles of rail Cubic yards Track Crossties bridge ties Crossties bridge ties replaced Percent of ballast Miles Percent
Category (board feet) (board feet) (rail-miles) Replaced placed surfaced surfaced (a) (b) (c) (d) (e) (I) (g) (h) (i) 0)
A 1,816,548 1,200,566 2.67% N/A 893 2.09% 157,464 9,662 45.23%
B 659,897 30,524 3.06% N/A 87 0.64% 638,727 3,034 44.80%
c 90,663 565 1.50% N/A 8 0.21% 382,583 83 4.39%
D 97,174 2,365 1.86% N/A - 26,986 - -E 117,613 1,713,790 0.43% N/A 109 0.64% 39,115 11 0.13%
TOTAL 2,781,895 2,947,810 2.17% N/A 1,097 1.36% 1,244,876 12,790 31.83%
F N/A Potential abandonments N/A
750. CONSUMPTION OF DIESEL FUEL (Dollars in Thousands)
LOCOMOTIVES
Line Kind of locomotive service Diesel oil (gallons) Line
No. (a) (b) No.
1 Freight 1,353,264,855 1
2 Passenger 2
3 Yard Switching 49,082,145 3 4 TOTAL 1,402,347,000 4
5 COST OF FUEL $(000)* $ 1,959,895 5
6 Work Train 637,738 6
*Show cost of fuel charged to train and yard service (function 67-Lo~o. Fuels). The cost stated for diesel fuel should be the total charges in the accounts specified, including freight charges and handling expenses. Fuel consumed by mixed and special trains that are predominantly freight should be included in freight service, but where the service of mixed or special trains is predominantly passenger, the
fuel should be included in passenger service.
Line No.
1 2 3 4 5 6 7 8
J)
~ 5' ~ !i!' ID z en ,,
-< m l\J 0
~
~
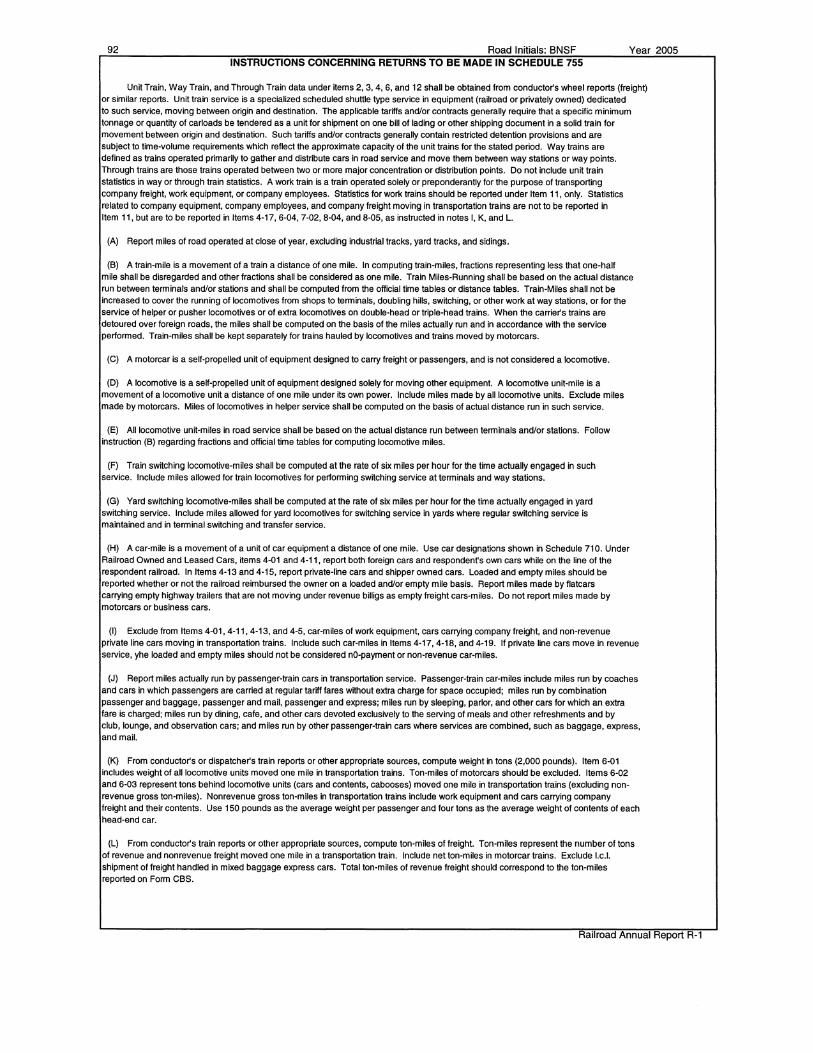
92 Road Initials: BNSF Year 2005 INSTRUCTIONS CONCERNING RETURNS TO BE MADE IN SCHEDULE 755
Unit Train, Way Train, and Through Train data under Items 2, 3, 4, 6, and 12 shall be obtained from conductor's wheel reports (freight)
or similar reports. Unit train service is a specialized scheduled shuttle type service in equipment (railroad or privately owned) dedicated to such service, moving between origin and destination. The applicable tariffs and/or contracts generally require that a specific minimum tonnage or quantity of carloads be tendered as a unit for shipment on one bill of lading or other shipping document in a solid train for movement between origin and destination. Such tariffs and/or contracts generally contain restricted detention provisions and are subject to time-volume requirements which reflect the approximate capacity of the unit trains for the stated period. Way trains are defined as trains operated primarily to gather and distribute cars in road service and move them between way stations or way points.
Through trains are those trains operated between two or more major concentration or distribution points. Do not include unit train statistics in way or through train statistics. A work train is a train operated solely or preponderantly for the purpose of transporting company freight, work equipment, or company employees. Statistics for work trains should be reported under Item 11, only. Statistics related to company equipment, company employees, and company freight moving in transportation trains are not to be reported in Item 11, but are to be reported in Items 4-17, 6-04, 7-02, 8-04, and 8-05, as instructed in notes I, K, and L.
(A) Report miles of road operated at close of year, excluding industrial tracks, yard tracks, and sidings.
(B) A train-mile is a movement of a train a distance of one mile. In computing train-miles, fractions representing less that one-half mile shall be disregarded and other fractions shall be considered as one mile. Train Miles-Running shall be based on the actual distance run between terminals and/or stations and shall be computed from the official time tables or distance tables. Train-Miles shall not be increased to cover the running of locomotives from shops to terminals, doubling hills, switching, or other work at way stations, or for the service of helper or pusher locomotives or of extra locomotives on double-head or triple-head trains. When the carrier's trains are detoured over foreign roads, the miles shall be computed on the basis of the miles actually run and in accordance with the service performed. Train-miles shall be kept separately for trains hauled by locomotives and trains moved by motorcars.
(C) A motorcar is a self-propelled unit of equipment designed to carry freight or passengers, and is not considered a locomotive.
(D) A locomotive is a self-propelled unit of equipment designed solely for moving other equipment. A locomotive unit-mile is a movement of a locomotive unit a distance of one mile under Its own power. Include miles made by all locomotive units. Exclude miles made by motorcars. Miles of locomotives in helper service shall be computed on the basis of actual distance run in such service.
(E) All locomotive unit-miles in road service shall be based on the actual distance run between terminals and/or stations. Follow instruction (B) regarding fractions and official time tables for computing locomotive miles.
(F) Train switching locomotive-miles shall be computed at the rate of six miles per hour for the time actually engaged in such service. Include miles allowed for train locomotives for performing switching service at terminals and way stations.
(G) Yard switching locomotive-miles shall be computed at the rate of six miles per hour for the time actually engaged in yard switching service. Include miles allowed for yard locomotives for switching service in yards where regular switching service is maintained and in terminal switching and transfer service.
(H) A car-mile is a movement of a unit of car equipment a distance of one mile. Use car designations shown in Schedule 710. Under Railroad Owned and Leased Cars, Items 4-01 and 4-11, report both foreign cars and respondent's own cars while on the line of the respondent railroad. In Items 4-13 and 4-15, report private-line cars and shipper owned cars. Loaded and empty miles should be reported whether or not the railroad reimbursed the owner on a loaded and/or empty mile basis. Report miles made by flatcars carrying empty highway trailers that are not moving under revenue billigs as empty freight cars-miles. Do not report miles made by motorcars or business cars.
(I) Exclude from Items 4-01, 4-11, 4-13, and 4-5, car-miles of work equipment, cars carrying company freight, and non-revenue private line cars moving in transportation trains. Include such car-miles in Items 4-17, 4-18, and 4-19. If private line cars move in revenue service, yhe loaded and empty miles should not be considered no-payment or non-revenue car-miles.
(J) Report miles actually run by passenger-train cars in transportation service. Passenger-train car-miles include miles run by coaches and cars in which passengers are carried at regular tariff fares without extra charge for space occupied; miles run by combination passenger and baggage, passenger and mail, passenger and express; miles run by sleeping, parlor, and other cars for which an extra fare is charged; miles run by dining, cafe, and other cars devoted exclusively to the serving of meals and other refreshments and by club, lounge, and observation cars; and miles run by other passenger-train cars where services are combined, such as baggage, express, and mail.
(K) From conductor's or dispatcher's train reports or other appropriate sources, compute weight in tons (2,000 pounds). Item 6-01 includes weight of all locomotive units moved one mile in transportation trains. Ton-miles of motorcars should be excluded. Items 6-02 and 6-03 represent tons behind locomotive units (cars and contents, cabooses) moved one mile in transportation trains (excluding nonrevenue gross ton-miles). Nonrevenue gross ton-miles in transportation trains include work equipment and cars carrying company freight and their contents. Use 150 pounds as the average weight per passenger and four tons as the average weight of contents of each head-end car.
(L) From conductor's train reports or other appropriate sources, compute ton-miles of freight. Ton-miles represent the number of tons of revenue and nonrevenue freight moved one mile in a transportation train. Include net ton-miles in motorcar trains. Exclude l.c.1. shipment of freight handled in mixed baggage express cars. Total ton-miles of revenue freight should correspond to the ton-miles reported on Form CBS.
Railroad Annual Report R-1

Road Initials: BNSF Year 2005 INSTRUCTIONS CONCERNING RETURNS TO BE MADE IN SCHEDULE 755 - (Concluded)
(M) Road service represents elapse time of transportation trains (both ordinary and light) between the time of leaving the inltial terminals and the time at final terminals, including trains switching at way stations and delays on road as shown by conductor's or dispatcher's train reports. Include time of motorcar service performed by train iocomotives at terminals and way stations. Report in Item 9-02, train switching hours included in Item 9-01. Train switching is the time spent by the train while performing switching service at terminals and way stations where no regular yard service is maintained. A train hour is independent of the number of locomotives in the train.
(N) Yard switching hours are hours expended in switching service performed by yard crews in yards where regular switching service is maintained, including switching and transfer service in connection with the transportation of revenue and incidentally of company freight. Hours in yard switching are independent of the number of locomotives used.
(0) Work-train miles include the miles run by trains engaged in company service such as official inspection; inspection trains for railway commissioners for which no revenue is received; trains running special with fire apparatus to save carrier's property from destruction: trains run for transporting the carrier's employees to and from work when no transportation charge is made; wrecking trains run solely for the purpose of transporting company material; trains run for distributing material and supplies for use in connection with operations; and all other trains used in work-train services. Exclude miles run by locomotives while engaged incidentally in switching company materials in company shops or material yards in connection with regular yard switching service or in switching equipment for repairs between yards and shops.
(P) The number of loaded freight cars shall be obtained from the conductors' wheel report and shall be the sum of all loaded cars handled by each train. For example, H a car moves loaded (1) in a way train from the origination points, (2) in two through trains, and (3) in a way-train to the destination point, the total count of loaded cars would be four: two counts for the movements in the way trains and two counts for the movements in through trains. Therefore, each car originated or received from a connecting carrier receives an initial count, plus one count for each subsequent physical transfer between trains on respondenfs lines. No addltional count is given because of crew change or changes in track identification number unless there is a physical transfer of the car between trains. Each car moving under revenue billing shall be considered as a loaded car.
(Q) Report vehicles (TOFC trailers/containers, automobiles and trucks) loaded and unloaded to and from TOFC and multiple level freight cars when the work is performed at the railroad's expense.
(R) Report the number of loaded revenue trailers/containers picked up, plus revenue trailers/containers delivered in TOFC/COFC and in highway interchange service, when the work is performed at the railroad's expense. (Performed at railroad's expense means that railroad employees perform the service or that the railroad hires a subsidiary or outside contractor to perform the service.) Do not include those trailers/containers which are picked up or delivered by a shipper or motor carrier, etc. when a tariff provision requires that the shipper or motor carrier, etc., and not the railroad, perform that service. Note: The count should reflect the trailers/containers for which expenses are reported in Schedule 417, line 2, column (b).
(S) Report under Marine Terminals, Item 16, the tons loaded onto and unloaded from marine vessels at the expense of the reporting railroad.
(T) Report the total number of foreign railroad cars on line at the end of the year (except surplus cars, see below). Foreign railroad cars refers to freight cars owned by other railroads whose interline rental is settled on time (by hour) and actual line-haul mileage charges under the Code of Car Hire Rules.
Carriers will be governed by local conditions in determining whether a car at an interchange point should be considered 'on-line." Unserviceable cars include cars on repair tracks undergoing or awaiting repairs. They include cars on repair tracks repaired and awaiting switching, cars on repair tracks undergoing or awaiting repairs swlt~hing, cars awaiting movement to repair tracks held in train yards (excluding cars which are to be repaired in the train yard without loss of time), cars moving empty in trains en route to shop, and cars stored awaiting disposition.
Surplus cars are cars which are in serviceable condition for loading on the last day of the year, but have not been placed for loading within 48 hours. This count can be an annual average based on weekly count of cars that have not been placed for loading within 48 hours.
(U) Flat-TOFC/COFC Car-miles reported in lines 25 (4-020), 41 (4-120), 57 (4-140), and 75 (4-160) will be computed using cars rather than constructed container platforms. For example, an articulated car consisting of five platforms moved one mile will be counted as one car-mile, not five car-miles.
(V) The intermodal Load Factor reported on Line 134 will be calculated for the average number of intermodal (TOFC/COFC) units loaded on the average intermodal car. Units are to be calculated in the same manner as Line 123 (13 TOFC/COFC - No. of Revenue Trailers & Containers Loaded and Unloaded (Q)). lntermodal cars will be calculated in accordance with instruction U for reporting Flat-TOFC/COFC Car-miles. Both intermodal (TOFC/COFC) units and intermodal cars are to be calculated using actual units and not constructed intermodal (TOFC/COFC) units or cars.
Railroad Annual Report R-1
93

94 Road Initials BNSF Year 2005
755. RAILROAD OPERATING STATISTICS
Line Cross Item Description Freight Passenger Line
No. Check Train Train No.
(a) (b) (c)
1 1 Miles of Road Operated (Al 32,154 6,944 1
2 Train Miles - Running (B)
2 2-01 Unit Trains 52,746,838 )()()()()()( 2
3 2-02 Way Trains 8,234,583 )()()()()()( 3
4 2-03 Throuah Trains 107 ,820,602 4
5 2-04 TOTAL TRAIN MILES (Lines 2-4) 168,802,023 5
6 2-05 Motorcars (C) 6
7 2-07 TOTAL ALL TRAINS (Lines 5 and 6) 168,802,023 7
3 Locomotive Unit Miles (D)
Road Service (E)
8 3-01 Unit Trains 149,267,867 )()()()()()( 8
9 3-02 Way Trains 16,364,n1 )()()()()()( 9
10 3-03 Throuah Trains 355,675,944 10
11 3-04 TOTAL (Lines 8-1 Ol 521,308,582 11
12 3-11 Train SWitchino IFl 4,854,540 )()()()()()( 12
13 3-21 Yard Switching (G) 13,944,240 13
14 3-31 TOTAL ALL SERVICES (Lines 11-13) 540,107,362 14
4 Freight Car-Miles (thousands) (H)
4-01 RR Owned and Leased Cars - Loaded
15 4-010 Box-Plain 40-Foot 4 )()()()()()( 15
16 4-011 Box-Plain 50-Foot and Lonaer 9,591 )()()()()()( 16
17 4-012 Box-Eouiooed 244,229 )()()()()()( 17
18 4-013 Gondola-Plain 281,327 )()()()()()( 18
19 4-014 Gondola-Eaulooed 104,764 )()()()()()( 19
20 4-015 Hoooer-Covered 681,519 )()()()()()( 20
21 4-016 Hoooer-Ooen Too-General Service 83,009 )()()()()()( 21
22 4-017 Hoooer-Open Top-Special Service 99,845 )()()()()()( 22
23 4-018 Refrigerator-Mechanical 29,012 )()()()()()( 23
24 4-019 Refrlaerator-Non-Mechanlcal 68,249 )()()()()()( 24
25 4-020 Flat-TOFC/COFC 247,386 )()()()()()( 25
26 4-021 Flat-Multi-Level 40,373 )()()()()()( 26
27 4-022 Flat-General Service 417 )()()()()()( 27
28 4-023 Flat-AH Other 120,843 )()()()()()( 28
29 4-024 All Other Gar Tvoes-Total 174,126 )()()()()()( 29
30 4-025 TOT AL (Lines 15-29) 2,184,694 )()()()()()( 30
Railroad Annual Report R-1

Road Initials BNSF Year 2005 95
755. RAILROAD OPERATING STATISTICS - (Continued)
Line Cross Item Description Freight Passenger Line
No. Check Train Train No.
(a) (b) (c)
4-11 RR Owned and Leased Cars - Empty
31 4·110 Box-Plain 40-Foot 36 )()()()()()( 31
32 4-111 Box-Plain 50-Foot and Longer 7,740 )()()()()()( 32
33 4-112 Box-Equipped 178,400 )()()()()()( 33
34 4-113 Gondola-Plain 272.877 )()()()()()( 34
35 4-114 Gondola-Eauiooed 89,566 )()()()()()( 35
36 4-115 Hoooer-Covered 634,578 )()()()()()( 36
37 4-116 Hopper-Open Top-General Service 84,785 )()()()()()( 37
38 4-117 Hopper-Open Top-Special Service 94,382 )()()()()()( 38
39 4-118 Refriaerator-Mechanical 21,901 )()()()()()( 39
40 4-119 Refrioerator-Non-Mechanical 39,722 xxxxxx 40
41 4-120 Flat-TOFC/COFC 55,849 )()()()()()( 41
42 4-121 Flat-Multi-Level 13,145 )()()()()()( 42
43 4-122 Flat-General Service 761 )()()()()()( 43
44 4-123 Flat-All Other 110,288 )()()()()()( 44
45 4-124 All Other car Tvoes-Total 53,525 )()()()()()( 45
46 4-125 TOTAL (Lines 31-45) 1,657,555 )()()()()()( 46
4-13 Private Line Cars - Loaded (H)
47 4-130 Box-Plain 40-Foot )()()()()()( 47
48 4-131 Box-Plain 50-Foot and Lonaer 25,058 )()()()()()( 48
49 4-132 Box-Eauiooed 27,904 )()()()()()( 49
50 4-133 Gondola-Plain 10,350 )()()()()()( 50
51 4-134 Gondola-Equipped 6,185 )()()()()()( 51
52 4-135 Hopper-Covered 344,748 )()()()()()( 52
53 4-136 Hoooer-Ooen Too-General Service 17,757 )()()()()()( 53
54 4-137 Hoooer-Ooen Too-Soeclal Service 8,339 )()()()()()( 54
55 4-138 Refrioerator-Mechanical 2,902 )()()()()()( 55
56 4-139 Refrigerator-Non-Mechanical 551 )()()()()()( 56
57 4-140 Flat-TOFC/COFC 937,304 )()()()()()( 57
58 4-141 Flat-Multi-Level 143,707 )()()()()()( 58
59 4-142 Flat-General Service 238 )()()()()()( 59
60 4-143 Flat-All Other 90,906 )()()()()()( 60
61 4-144 Tank Under 22,000 Gallons 143,047 )()()()()()( 61
62 4-145 Tank - 22,000 Gallons and Over 253,341 )()()()()()( 62
63 4-146 All Other car Types-Total 364,602 )()()()()()( 63
64 4-147 TOTAL (Lines 47-63) 2,376,939 )()()()()()( 64
Railroad Annual Report R-1

96 Road lnttials BNSF Year 2005
755. RAILROAD OPERATING STATISTICS· (Continued)
Line Cross Item Description Freight Passenger Line
No. Check Train Train No.
(a) (b) (c)
4-15 Private Line Cars - Empty (H)
65 4-150 Box-Plain 40-Foot xxxxxx 65
66 4-151 Box-Plain 50-Foot and Lonaer 3,649 xxxxxx 66
67 4·152 Box-EQuipped 8.550 xxxxxx 67
68 4-153 Gondola-Plain 7,184 xxxxxx 68
69 4-154 Gondola-EauiPPed 4,776 xxxxxx 69
70 4-155 Hoooer-Covered 160,183 xxxxxx 70
71 4·156 Hopper-Open Top-General Service 10,401 xxxxxx 71
72 4·157 Hopper-Open Top-Special Service 9,683 xxxxxx 72
73 4-158 Refriaerator-Mechanical 1,504 xxxxxx 73
74 4-159 Refriaerator-Non-Mechanical 243 xxxxxx 74
75 4·160 Flat-TOFC/COFC 117,964 xxxxxx 75
76 4-161 Flat·Multl·Level 36,832 xxxxxx 76
77 4-162 Flat-General Service 165 xxxxxx 77
78 4-163 Flat-All Other 46,347 xxxxxx 78
79 4-164 Tank Under 22,000 Gallons 67,330 xxxxxx 79
80 4·165 Tank - 22,000 Gallons and Over 137,470 xxxxxx 80
81 4-166 All Other Car Tvaes-Total 58,905 xxxxxx 81
82 4-167 TOTAL (Lines 65-81\ 671,186 xxxxxx 82
83 4·17 Work EQuipment and Company Freight car-Miles 56,382 xxxxxx 83
84 4-18 No Pavment car-Miles (I) <1> 3,789,621 xxxxxx 84
4-19 Total Car-Miles by Train Type (Note)
85 4·191 Unit Trains 5,504,457 xxxxxx 85
86 4-192 Way Trains 207,386 xxxxxx 86
87 4-193 Throuoh Trains 5,024,535 xxxxxx 87
88 4-194 TOTAL (Lines 85-87\ 10,736,377 xxxxxx 88
89 4-20 Caboose Miles 166 xxxxxx 89
<1> Total number of loaded miles and empty miles ____ by roadrailer reported above.
Note: Line 88, total car miles, is equal to the sum of lines 30, 46, 64, 82, 83, and 84. Accordingly, the car miles reported on lines 83 and 84
are to be allocated to lines 85, 86, and 87, and included in the total shown on line 88.
Rallroad Annual Report R· 1
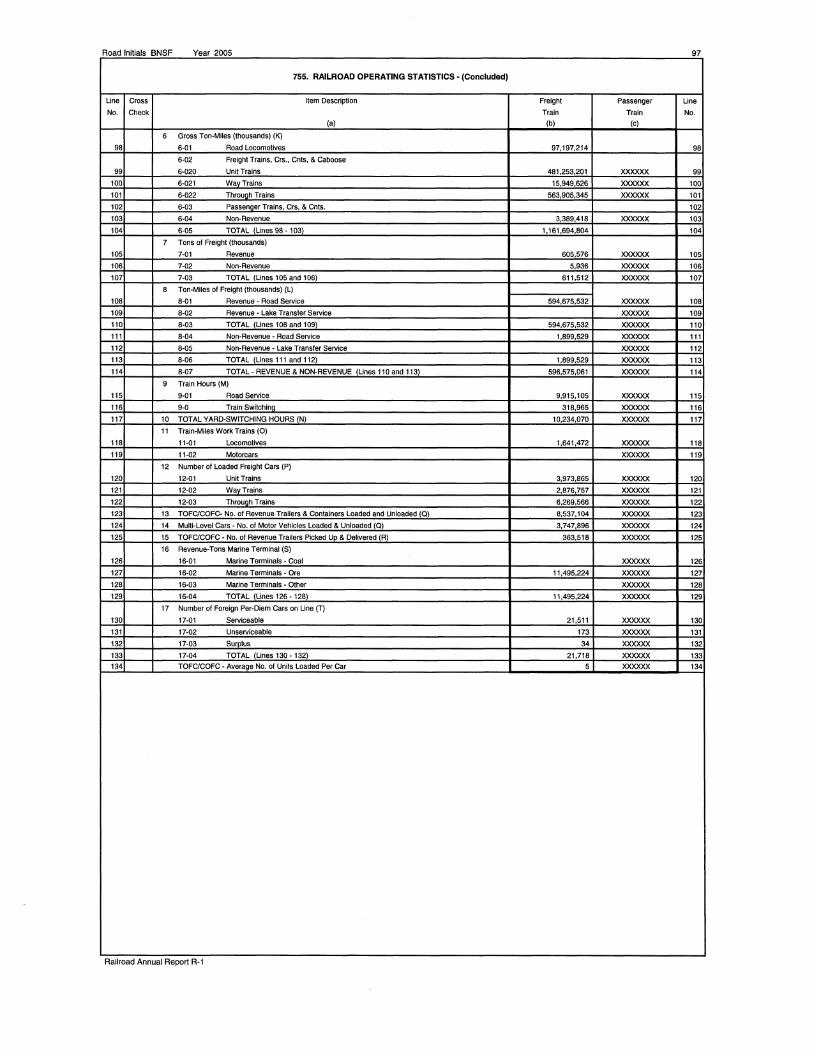
Road Initials BNSF Year 2005 97
755. RAILROAD OPERATING STATISTICS· (Concluded)
Line Cross Item Description Freight Passenger Line
No. Check Train Train No. (a) (b) (c)
6 Gross Ton-Miles (thousands) (K)
98 6-01 Road Locomotives 97,197,214 98
6·02 Freight Trains, Crs., Cnts, & Caboose
99 6·020 Unit Trains 481,253,201 xxxxxx 99
100 6·021 WavTrains 15,949,626 xxxxxx 100
101 6·022 Throuah Trains 563,905,345 xxxxxx 101
102 6-03 Passenaer Trains, Crs, & Cnts. 102
103 6-04 Non-Revenue 3,389,418 xxxxxx 103
104 6-05 TOTAL (Lines 98 • 103) 1,161,694,804 104
7 Tons of Freight (thousands)
105 7-01 Revenue 605,576 xxxxxx 105
106 7-02 Non-Revenue 5,936 xxxxxx 106
107 7-03 TOTAL (Lines 105 and 106) 611,512 xxxxxx 107
8 Ton-Miies of Freight (thousands) (L)
108 8-01 Revenue - Road Service 594,675,532 xxxxxx 108
109 8-02 Revenue - Lake Transfer Service xxxxxx 109
110 8·03 TOTAL (Lines 108 and 109l 594,675,532 xxxxxx 110
111 8-04 Non-Revenue - Road Service 1,899,529 xxxxxx 111
112 8-05 Non-Revenue - Lake Transfer Service xxxxxx 112
113 8-06 TOTAL (Lines 111 and 112) 1,899,529 xxxxxx 113
114 8-07 TOTAL - REVENUE & NON-REVENUE {Lines 110 and 113) 596,575,061 xxxxxx 114
9 Train Hours (M)
115 9-01 Road Service 9,915,105 xxxxxx 115
116 9-0 Train Switchina 318,965 xxxxxx 116
117 10 TOTAL YARD-SWITCHING HOURS INl 10,234,070 xxxxxx 117
11 Train-Miles Work Trains (0)
118 11-01 Locomotives 1,641,472 xxxxxx 118
119 11-02 Motorcars xxxxxx 119
12 Number of Loaded Freight Cars (P)
120 12-01 Unit Trains 3,973,865 xxxxxx 120
121 12-02 WavTrains 2,876,757 xxxxxx 121
122 12-03 Throuoh Trains 6,269,566 xxxxxx 122
123 13 TOFC/COFC- No. of Revenue Trailers & Containers Loaded and Unloaded (0) 8,537,104 xxxxxx 123
124 14 Multi-Level Cars - No. of Motor Vehicles Loaded & Unloaded (0) 3,747,896 xxxxxx 124
125 15 TOFC/COFC - No. of Revenue Trailers Picked Uo & Delivered {R) 363,518 xxxxxx 125
16 Revenue-Tons Marine Terminal (S)
126 16-01 Marine Terminals - Coal xxxxxx 126
127 16-02 Marine Terminals - Ore 11,495,224 xxxxxx 127
128 16-03 Marine Terminals • Other xxxxxx 128
129 16-04 TOTAL {Lines 126 -128) 11,495,224 xxxxxx 129
17 Number of Foreign Per-Diem cars on Line (T)
130 17·01 Serviceable 21,511 xxxxxx 130
131 17-02 Unserviceable 173 xxxxxx 131
132 17-03 Sumlus 34 xxxxxx 132
133 17-04 TOTAL {Lines 130 - 132) 21,718 xxxxxx 133 134 TOFC/COFC - Average No. of Units Loaded Per Car 5 xxxxxx 134
Railroad Annual Report R-1

98 Road Initials: BNSF Year2005
VERIFICATION
The foregoing report shall be verified by the oath of the officer having control of the accounting of the respondent. This report shall also be verified by the oath of the president or other chief officer of the respondent, unless the respondent states that such officer has no control over the respondent's accounting and reporting.
State of Texas County of Tarrant
OATH (To be made by the officer having control of the accounting of the respondent)
Darsi D. Brown makes oath and states that she is General Director of Accounting of Burlington Northern Santa Fe Corporation; that it is her duty to have supervision over the books of accounts of the respondent and to control the manner in which such books are kept; that she knows that such books have been kept in good faith during the period covered by this report; that she knows that the entries contained in this report relate to accounting matters that have been prepared in accordance with the provisions of the Uniform System of Accounts for Railroad Companies and other accounting and reporting directives of the Surface Transportation Board; that she believes that all other statements of fact contained in this report are true, and that this report is a correct and complete statement, accurately taken from the books and records, of the business and affairs of the above-named respondent during the period of time from and including January 1, 2005, to and including December 31, 2005.
Isl Darsi D. Brown (Signature of affiant)
Subscribed and sworn to before me, a _______________________ in and for the State and county above named, this ________ day of ___________ , 20 __ .
My commission expires _________________________ _
Use an LS.
impression seal
State of Texas County of Tarrant
(Signature of officer authorized to administer oaths)
SUPPLEMENTAL OATH (By the president or other chief officer of the respondent)
Paul W. Bischler makes oath and states that he is Assistant Vice President and Controller of Burlington Northern Santa Fe Corporation; that he has carefully examined the foregoing report; that he believes that all statements of fact contained in the said report are true, and that the said report is a correct and complete statement of the business and affairs of the above-named respondent and the operations of its property during the period of time from and including January 1, 2005, to and including December 31, 2005.
Isl Paul W. Bischler (Signature of affiant)
Subscribed and sworn to before me, a __________________ in and for the State and county above named, this __________ day of _______ , 20 __ .
My commission expires _________________________ _
Use an LS.
impression seal (Signature of officer authorized to administer oaths)
Railroad Annual Report R-1

Road Initials· BNSF Year2005 99
MEMORANDA
(FOR USE OF BOARD ONLY)
CORRESPONDENCE
Answer
Office Addressed Date of Letter, Fax, Subject Answer Date of Letter, Fax, or File Number
or Telegram Needed Telegram of Letter,
Fax, or
Name Title Month Dav Year Paae Month Dav Year Telearam
CORRECTIONS
Authoritv
Date Clerk Making
Correction Page Date of Letter, Fax, Officer Sending Letter, Fax, or Telegram Board Correction
orTelearam File Number
Month Dav Year Month Dav Year Name Title Name
EXPLANATORY REMARKS
Railroad Annual Report R-1
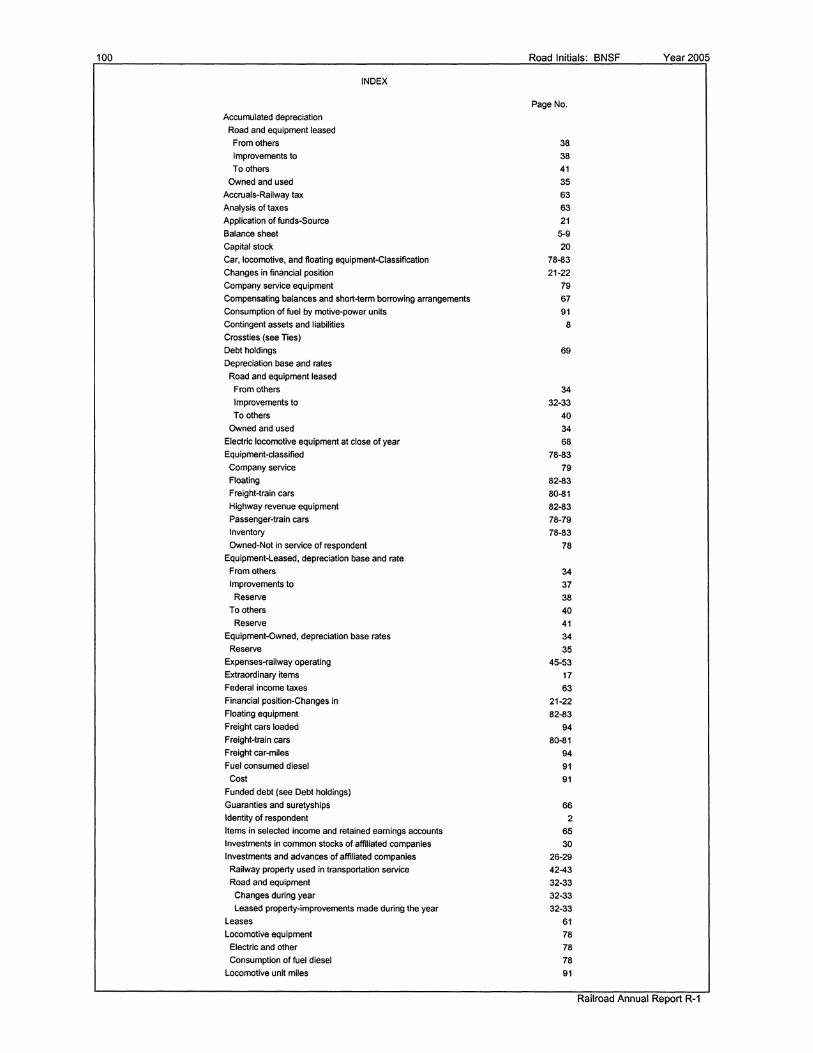
100
Accumulated depreciation Road and equipment leased From others Improvements to To others
Owned and used Accruals-Railway tax Analysis of taxes Application of funds-Source Balance sheet Capltal stock
INDEX
Car, locomotive, and floating equipment-Classification Changes in financial position Company service equipment Compensating balances and short-term borrowing arrangements Consumption of fuel by motive-power units Contingent assets and liabillties Crossties (see Ties) Debt holdings Depreciation base and rates Road and equipment leased From others Improvements to To others
Owned and used Electric locomotive equipment at close of year Equipment-classified Company service Floating Freight-train cars Highway revenue equipment Passenger-train cars Inventory Owned-Not in service of respondent
Equipment-Leased, depreciation base and rate From others Improvements to Reserve
To others Reserve
Equipment-Owned, depreciation base rates Reserve
Expenses-railway operating Extraordinary Items Federal income taxes Financial position-Changes in Floating equipment Freight cars loaded Freight-train cars Freight car-miles Fuel consumed diesel Cost
Funded debt (see Debt holdings) Guaranties and suretyships Identity of respondent Items in selected income and retained earnings accounts Investments in common stocks of affiliated companies Investments and advances of affiliated companies Railway property used in transportation service Road and equipment Changes during year
Leased property-improvements made during the year Leases Locomotive equipment Electric and other Consumption of fuel diesel
Locomotive unit miles
Road Initials: BNSF Year2005
Page No.
38
38
41
35
63
63
21 5-9
20
78-83
21-22
79
67
91
8
69
34
32-33
40
34
68 78-83
79
82-83
80-81
82-83
78-79
78-83
78
34
37
38
40
41
34
35
45-53
17
63 21-22
82-83
94
80-81
94
91
91
66
2 65 30
26-29
42-43
32-33
32-33
32-33
61
78
78
78
91
Railroad Annual Report R-1

Road Initials: BNSF
Railroad Annual Report R-1
Year2005
INDEX - Continued
Mileage-Average of road operated Of new tracks in which rails were laid Of new tracks in which ties were laid
Miscellaneous items in retained income accounts for the year Motorcar car miles Motor rail cars owned or leased Net income Oath Operating expenses (see Expenses) Revenues (see Revenues) Statistics (see Statistics)
Ordinary income Private line cars loaded Private line cars empty Rails Laid in replacement Charges to operating expenses Additional tracks, new lines, and extensions
Miles of new track in which rails were laid Weight of
Railway-Operating expenses Railway-Operating revenues Results of Operations Retained income unappropriated Miscellaneous Items in accounts for year
Revenues Freight
Passenger Road and equipment-Investment in Improvements to leased property Reserve
Leased to others-Depreciation base and rates Reserve
Owned-Depreciation base and rates Reserve
Used-Depreciation base and rates Reserve
Road-Mileage operated at close of year By States and Territories
Securities (see Investments) Short-term borrowing arrangements-compensating balances and Sinking funds Source and application of working capital Specialized service subschedule Statement of changes in financial position Stock outstanding Changes during year
Number of security holders Total voting power Value per share Voting rights
Supporting schedule-Road Suretyships-Guaranties and Ties laid in replacement Ties-Additional tracks, new lines, and extensions Tracks operated at close of year
Miles of, at close of year Track and traffic conditions Train hours, yard switching Train miles Tons of freight Ton-miles of freight
TOFC/COFC number of revenue trailers and containers - loaded & unloaded Voting powers and elections Weight of rail
Page No.
85 88 87
65 94 79 17
98
16 95 95
88 45 89 88
89 45-53
16 16-17
19
11
16 16
32-33
32-33
38 40
41
34
35
34
35 74 75
67
7 21-22
60 21-22
20 20
3 3-4
3
3 56-57
66 86 87
74 75 85 97 94
97 97 97
3
90
101