Embed Size (px)
Citation preview
Clarification as to why alcoholic beverages have the ability
to induce superconductivity in Fe1+dTe1-xSx
K Deguchi1,2,3, D Sato4, M Sugimoto4, H Hara1, Y Kawasaki1,2,3, S Demura1,2,3, T Watanabe1,2, S
J Denholme1, H Okazaki1,3, T Ozaki1,3, T Yamaguchi1,3, H Takeya1,3, T Soga4, M Tomita4 and Y
Takano1,2,3
1 National Institute for Materials Science, 1-2-1, Sengen, Tsukuba, 305-0047, Japan
2 Graduate School of Pure and Applied Sciences, University of Tsukuba, 1-1-1 Tennodai,
Tsukuba, 305-8571, Japan
3 JST-EU-Japan, 1-2-1, Sengen, Tsukuba, 305-0047, Japan
4 Institute for Advanced Biosciences, Keio University, 246-2, Mizukami, Kakuganji, Tsuruoka,
Yamagata 997-0052, Japan
E-mail : [email protected]
Abstract
To elucidate the mechanism as to why alcoholic beverages can induce superconductivity
in Fe1+dTe1-xSx samples, we performed component analysis and found that weak acid such as
organic acid has the ability to induce superconductivity. Inductively-coupled plasma
spectroscopy was performed on weak acid solutions post annealing. We found that the
mechanism of inducement of superconductivity in Fe1+dTe1-xSx is the deintercalation of excess
Fe from the interlayer sites.
Keywords: Superconductivity, Fe-based superconductor, FeTe, Alcoholic beverage annealing,
Deintercalation
Classification codes: 74.70.Xa, 74.62.Yb, 74.62.Dh
1. Introduction
Since the discovery of superconductivity in LaFeAsO1-xFx, research in Fe-based
superconductivity has been actively performed and several types of Fe-based superconductors
have been discovered [1-4]. Among them, the 11 system, whose parent compounds are FeSe and
FeTe. These have advantages for understanding the mechanism of Fe-based superconductivity
because they are binary compounds and have the simplest crystal structure. FeSe shows
superconductivity with a transition temperature Tc of 8.5 K. In contrast to FeSe, isostructural
FeTe does not show superconductivity and exhibits an antiferromagnetic transition around 70 K.
The S substitution for the Te site in FeTe suppresses the antiferromagnetism and induces
superconductivity [5].
Fe1+dTe0.8S0.2 synthesized using a melting method showed a shielding volume fraction of
about 20 %, while it contained minor impurity phases. In contrast, almost pure Fe1+dTe0.8S0.2 is
obtained using a solid-state reaction. On the other hand, the as-grown sample does not show
superconductivity, although the antiferromagnetic ordering seems to be suppressed.
Superconductivity in the solid-state reacted sample however can be induced by air exposure,
water immersion, and oxygen annealing [6-8]. Recently, it has been revealed that oxygen
annealing is also effective for superconductivity in Fe1+dTe1-xSex and it is proposed that oxygen
suppresses the magnetic moment of the excess Fe [9].
Furthermore we reported that hot alcoholic beverages were more effective in inducing
superconductivity in Fe1+dTe0.8S0.2 than water [10]. The shielding volume fractions of the
samples heated in red wine, white wine, beer, Japanese sake (rice wine), whisky, and shochu
(distilled spirit) are 62.4, 46.8, 37.8, 35.8, 34.4, and 23.1 %, respectively. These values are
clearly higher than immersing the sample in pure water and ethanol solutions. In a previous
report, we concluded that alcoholic beverages can induce superconductivity, although the exact
mechanism of how they act to enhance the superconductivity in Fe1+dTe1-xSx remains unsolved.
To reveal the mechanism, we utilized a technology of metabolomic analysis, a simultaneous
profiling of hundreds of small molecules, to analyze the ingredient in the alcoholic beverages
and other solutions heated with the samples. In this study, we investigated the key components
in alcoholic beverages and the systematic mechanism to induce superconductivity in
Fe1+dTe0.8S0.2.
2. Experimental
2-1. Sample preparation
Polycrystalline samples of Fe1+dTe0.8S0.2 were prepared using a solid-state reaction method.
Powders of Fe and TeS, and grains of Te with a nominal composition of FeTe0.8S0.2 were put into
a quartz tube. The quartz tube was then evacuated by a rotary pump and sealed. After being
heated at 600 °C for 10 hours, the obtained mixture was ground, pelletized, and put into a quartz
tube. The quartz tube was pumped, sealed, and heated again at 600 °C for 10 hours. We
prepared 5 glass bottles filled with different liquids: ultrapure water, red wine (Bon Marche,
Mercian Corporation), and aqueous solutions of malic acid, citric acid, or β-alanine. Here these
acids were dissolved in ultrapure water. The concentrations of malic acid, citric acid, and
β-alanine in the solutions were 0.16, 0.12, and 0.004 g/L, respectively, concentrations equal to
those found in the red wine. The sintered Fe1+dTe0.8S0.2 pellet was put into each liquid and heated
at 70 °C for 24 hours.
Powder x-ray diffraction patterns were measured using the 2θ/θ method with the Cu Kα
radiation. The temperature dependence of susceptibility was measured using a SQUID
magnetometer down to 2 K under a magnetic field of 10 Oe. The shielding volume fraction was
estimated from the lowest-temperature value of the magnetic susceptibility after zero-field
cooling.
2-2. Component analysis
Metabolomic analysis of the alcoholic beverages was performed using a capillary
electrophoresis time-of-flight mass spectrometer (CE-TOFMS) with slight modifications [11,
12]. The alcoholic beverages used in this study were red wine (Bon Marche), white wine (Bon
Marche, Mercian Corporation), beer (Asahi Super Dry, Asahi Breweries, Ltd.), Japanese sake
(Hitorimusume, Yamanaka shuzo Co., Ltd.), shochu (The Season of Fruit Liqueur, TAKARA
Shuzo Co., Ltd.) and whisky (The Yamazaki Single Malt Whisky, Suntory Holdings Limited).
These alcoholic beverages were centrifuged at 5,800 × g for 15 min (4 °C) to remove the
sediments. The supernatants were filtrated with Ultrafree-MWCO 5,000 centrifugal filter unit
(Millipore) to eliminate large molecules. The filtrated solutions were diluted ten-fold with water
including the internal standards (methionine sulfone, 3-aminopyrrodine, D-camphor-10-sulfonic
acid, and trimesic acid, 200µM each), and applied to CE-TOFMS. The Fe concentration of the
solution after annealing with the sample was analyzed using inductively-coupled plasma (ICP)
spectroscopy.
3. Results and discussions
CE-TOFMS successfully quantified several hundreds of charged metabolites, such as amino
acids, organic acids, nucleotides, and dipeptides. We calculated correlation coefficients between
concentration of a metabolite and the shielding volume fractions obtained from the samples
annealed in alcoholic beverages. The value of correlation coefficient took on a wide range of
0.947 to -0.631. Among the metabolites, we focused on malic acid, citric acid, and β-alanine.
Malic acid had a quite high value of 0.907 and is present at high concentration in alcoholic
beverages compared to other metabolites with a higher value. Citric acid was about the same
concentration as malic acid but with a slightly reduced value of 0.675. β-alanine showed the
highest value of 0.947. Figure 1 shows the shielding volume fractions of the samples with
various alcoholic beverages in ref. 10 as functions of the concentrations of three acids: (a) malic,
(b) citric, and (c) β-alanine. The shielding volume fractions of the samples annealed in the
alcoholic beverages was increased in proportion to the concentrations of these compounds.
Figure 2 shows the x-ray diffraction patterns for the as-grown Fe1+dTe0.8S0.2 sample and the
samples annealed in the red wine, malic acid, citric acid, β-alanine, and water. The calculated
FeTe peaks, taken from PDF#01-089-4077, were also plotted at the bottom. There are no
significant differences among all the patterns, indicating that heating the samples in the
solutions does not decompose the crystal structure.
Figure 3 shows the magnetic susceptibility versus temperature for the as-grown sample and
the samples annealed in various liquids at 70 °C for 24 hours. All the samples annealed in the
solutions show superconductivity, whereas no superconducting signal is observed in the
as-grown sample. We estimate the shielding volume fraction of the samples annealed in the red
wine, malic acid, citric acid, β-alanine, and water to be 56.0, 35.6, 34.8, 25.5, and 17.6 %,
respectively. The obtained shielding volume fractions are summarized in Fig. 4. We found that
the samples annealed in solutions of malic acid, citric acid, and β-alanine have a larger shielding
volume fraction compared with the sample annealed in water, and the volume fraction increases
with decreasing pH.
In order to understand the role of the malic acid, citric acid, and β-alanine, we performed ICP
analysis for these solutions after annealing with samples to estimate the Fe concentration.
Figure 5 shows the concentration of Fe dissolved in solutions as a function of pH. The average
concentration of Fe in red wine, malic acid, citric acid, β-alanine, and water are 85.8 ± 0.91
(standard deviation), 58.0 (± 0.17), 37.2 (± 0.49), 4.5 (± 0.17), and 4.3 (± 0.02) ppm respectively,
which corresponds to 2.81, 1.90, 1.22, 0.15, and 0.13 % of Fe in the sample. The value of red
wine after annealing without a sample is also plotted in Figure 5, indicating that red wine itself
contained only a small quantity of Fe. In comparison with figure 4, it is obvious that the
concentration of Fe in solutions, that is the decrement of Fe from the sample, is related to the
shielding volume fraction.
It is known experimentally that FeTe always has some amount of excess Fe at the interlayer
sites [13]. A previous report indicated that excess Fe is the cause of the bicollinear
antiferromagnetic order and is not in favor of superconductivity [14]. Therefore, reducing the
excess Fe is required to achieve superconductivity. As mentioned above, the shielding volume
fractions of Fe1+dTexSx were increased with reducing the Fe in the sample. Furthermore, as
shown in figure 2, the crystal structure of the samples was not decomposed by annealing. These
results suggest that part of the excess Fe was deintercalated from the interlayer sites. Therefore,
weak acid annealing suppresses the antiferromagnetic correlation by deintercalating the excess
Fe and, hence superconductivity is achieved.
To summarize, we investigated the key components in alcoholic beverages and clarified the
mechanism to induce superconductivity in Fe1+dTe1-xSx. The shielding volume fractions of the
samples annealed in the alcoholic beverages were increased in proportion to the concentrations
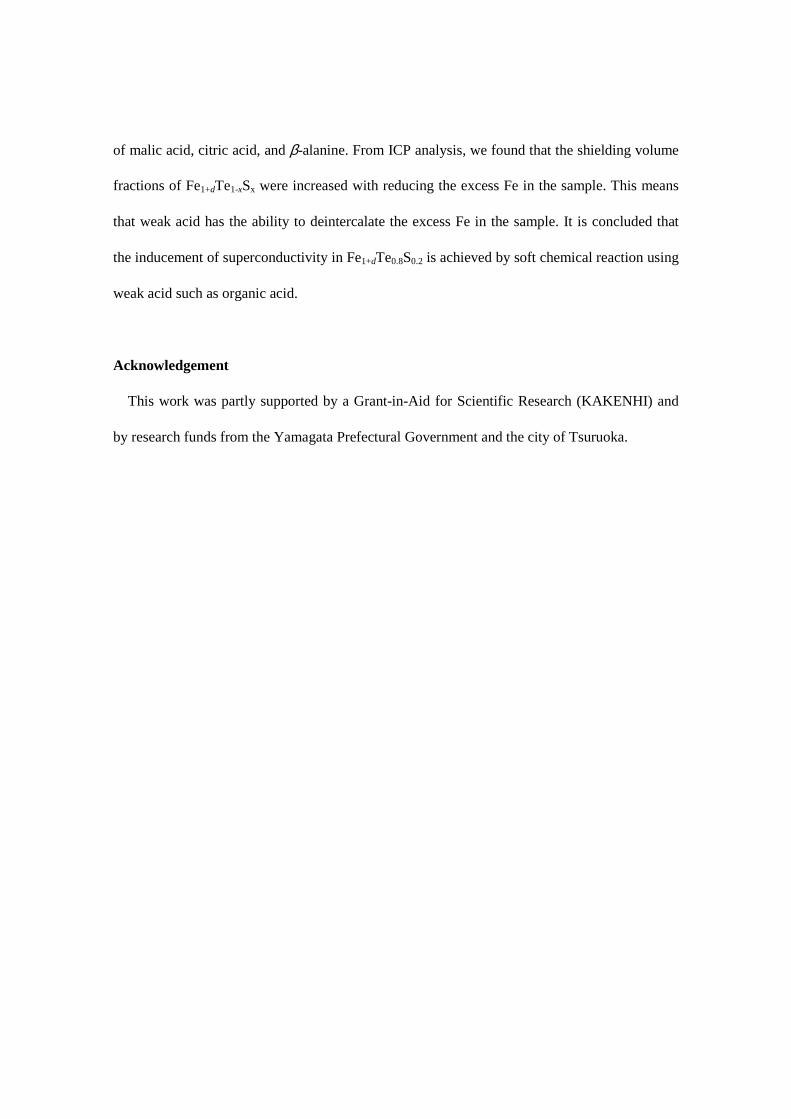
of malic acid, citric acid, and β-alanine. From ICP analysis, we found that the shielding volume
fractions of Fe1+dTe1-xSx were increased with reducing the excess Fe in the sample. This means
that weak acid has the ability to deintercalate the excess Fe in the sample. It is concluded that
the inducement of superconductivity in Fe1+dTe0.8S0.2 is achieved by soft chemical reaction using
weak acid such as organic acid.
Acknowledgement
This work was partly supported by a Grant-in-Aid for Scientific Research (KAKENHI) and
by research funds from the Yamagata Prefectural Government and the city of Tsuruoka.
Figure captions
Figure 1. The shielding volume fraction of Fe1+dTe0.8S0.2 samples annealed in various alcoholic
beverages as a function of the concentration of (a) malic acid, (b) citric acid, (c) β-alanine. The
volume fractions presented in this figures were obtained in the previous study (ref. 10).
Figure 2. The powder x-ray diffraction patterns of an as-grown Fe1+dTe0.8S0.2 sample, samples
annealed in various liquids. The sharp lines on the bottom of the figure indicate 2θ and intensity
expected from a calculation.
Figure 3. The temperature dependence of magnetic susceptibility for the as-grown Fe1+dTe0.8S0.2
sample and the samples annealed in various solutions. The β-alanine, citric acid, and malic acid
were dissolved in water.
Figure 4. The shielding volume fraction estimated from the lowest-temperature value of
magnetic susceptibility for the samples annealed in various liquids as a function of pH.
Figure 5. The pH dependence of Fe concentration dissolved in solutions after annealing with the
sample.
Reference
[1] Kamihara Y, Watanabe T, Hirano M and Hosono H 2008 J. Am. Chem. Soc. 130 3296.
[2] Rotter M, Tegel M and Johrendt D 2008 Phys. Rev. Lett. 101 107006.
[3] Wang X C et al 2008 Solid State Commun. 148 538.
[4] Hsu F C et al 2008 Proc. Natl. Acad. Sci. U.S.A. 105 14262.
[5] Mizuguchi Y, Tomioka F, Tsuda S, Yamaguchi T and Takano Y 2009 Appl. Phys. Lett. 94
012503.
[6] K. Deguchi et al., 2010 Physica C 470 S340-S341.
[7] Mizuguchi Y, Deguchi K, Tsuda S, Yamaguchi T and Takano Y 2010 Phys. Rev. B 81
214510.
[8] Y. Mizuguchi, K. Deguchi, S. Tsuda, T. Yamaguchi and Y. Takano 2010 Europhys. Lett. 90
57002.
[9] Kawasaki Y et al., arXiv: 1111.6472.
[10] Deguchi K et al, 2011 Supercond. Sci. Technol. 24 055008.
[11] Sugimoto M, Wong DT, Hirayama A, Soga T and Tomita M 2010 Metabolomics 6 78.
[12] Sugimoto, M et al., 2012 J. Agric. Food Chem 60606060 2586.
[13] Li S et al., 2009 Phys. Rev. B 79797979 054503.
[14] Han M J and Savrasov S Y 2009 Phys. Rev. Lett. 103 067001.
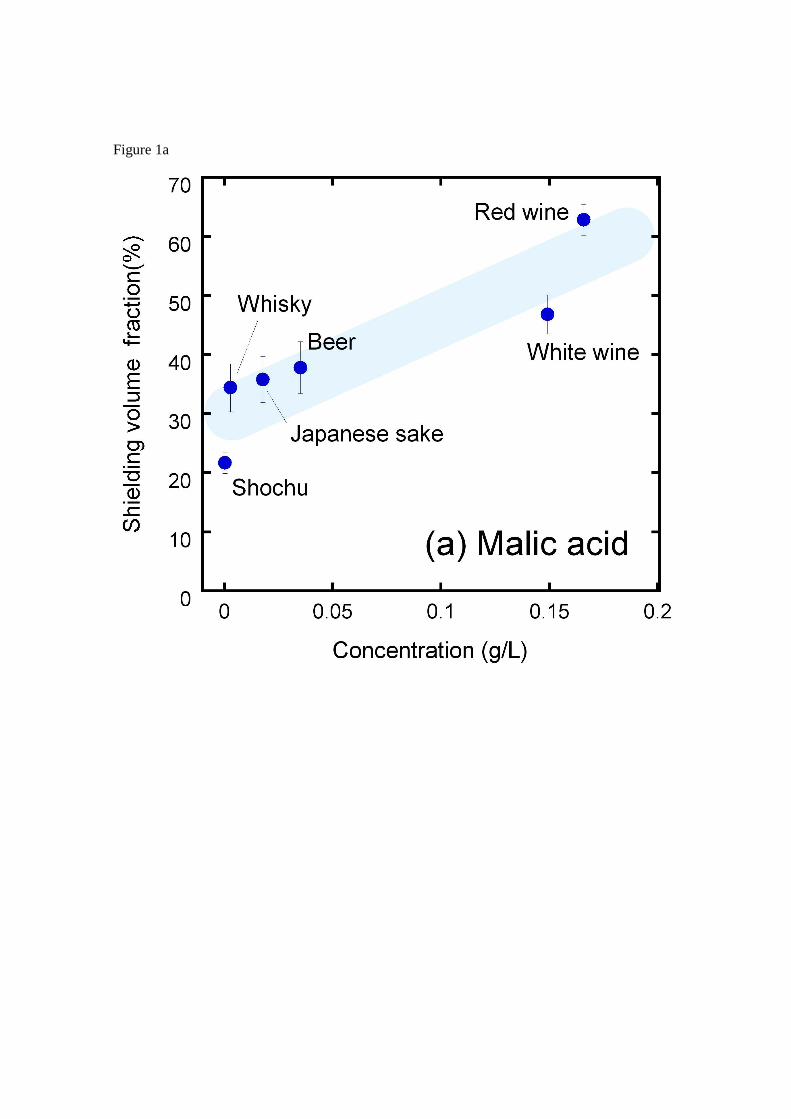
Figure 1a
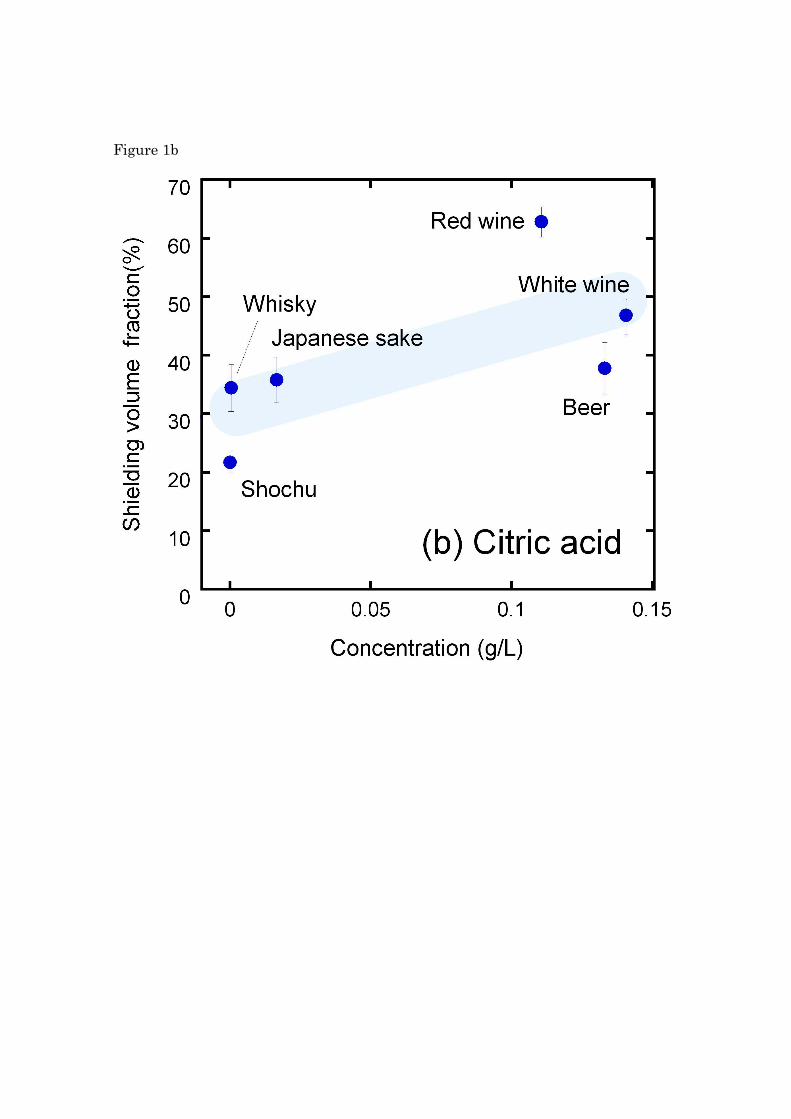
Figure 1b
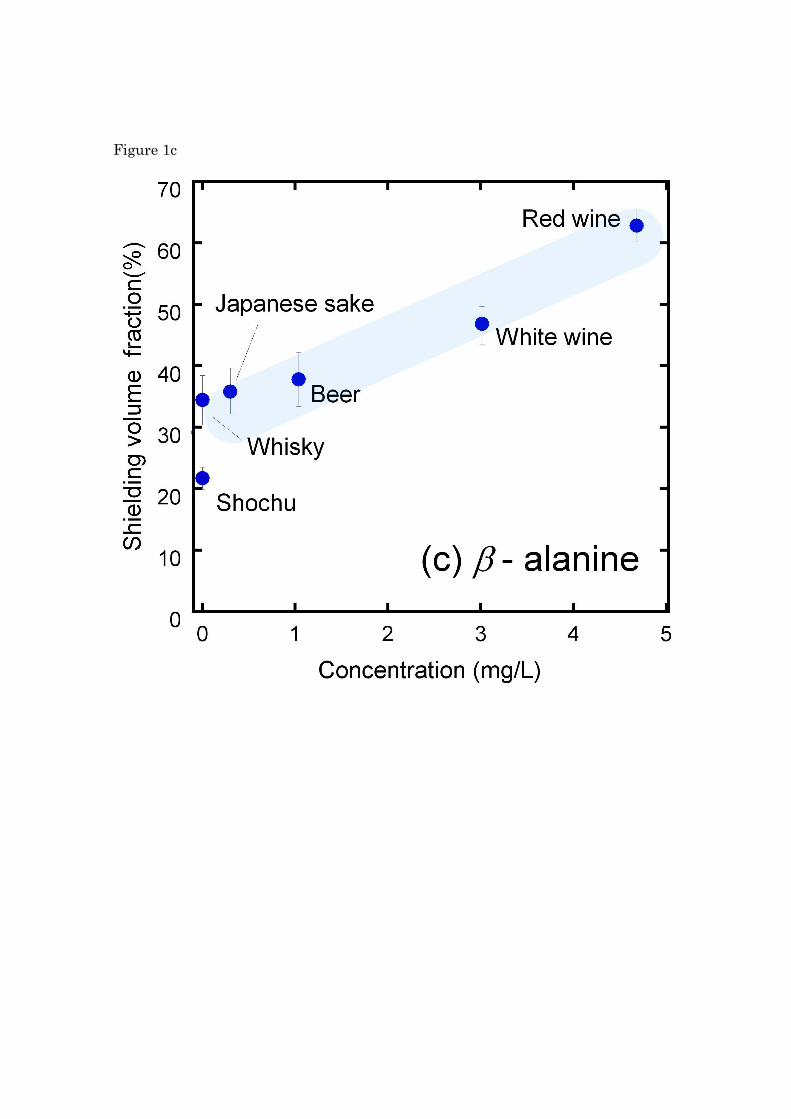
Figure 1c
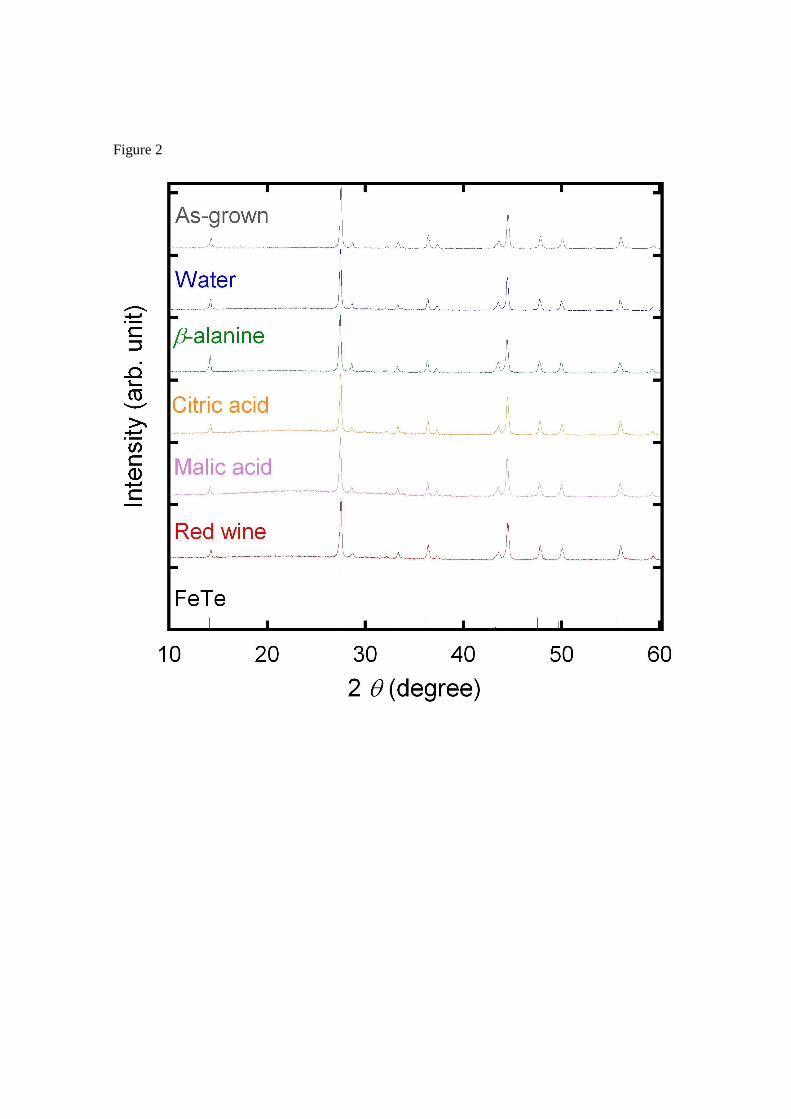
Figure 2
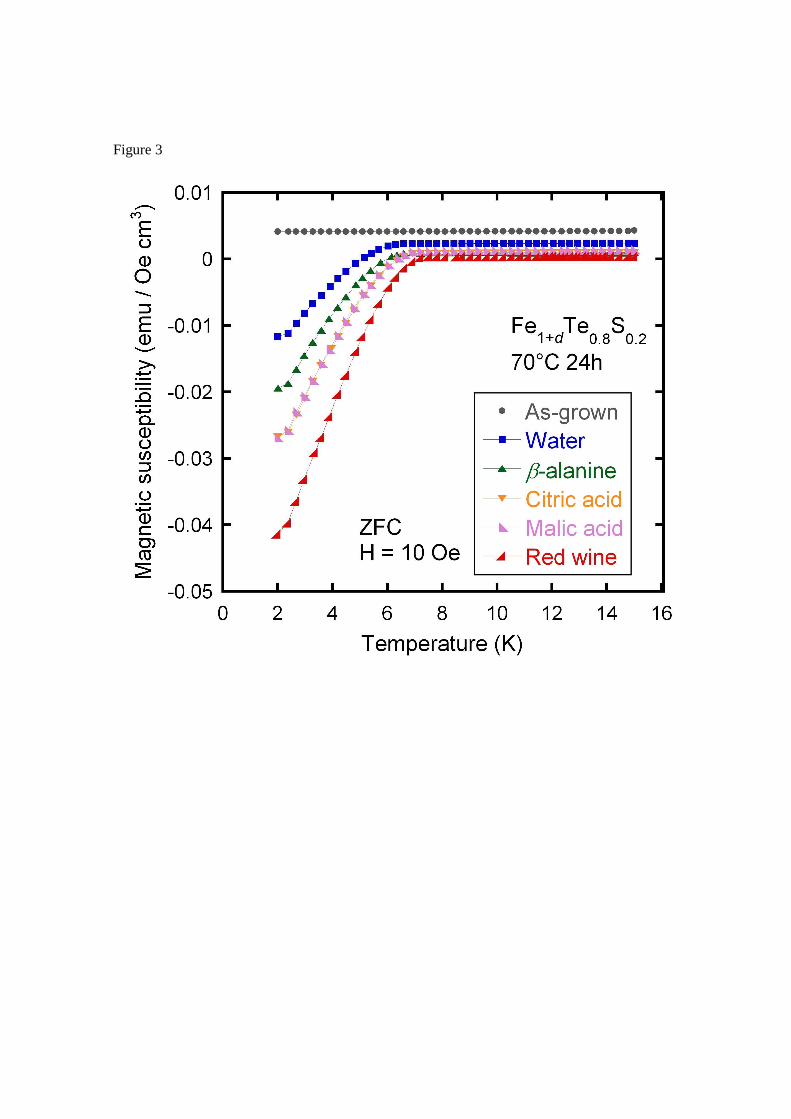
Figure 3
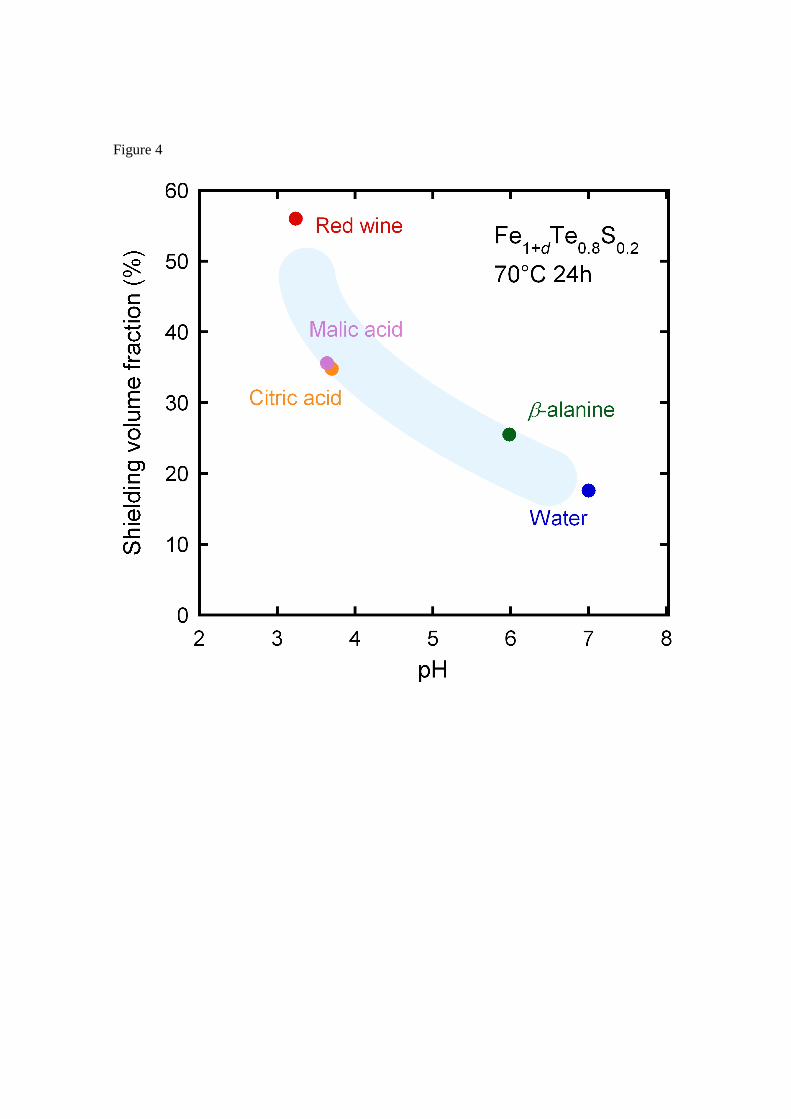
Figure 4
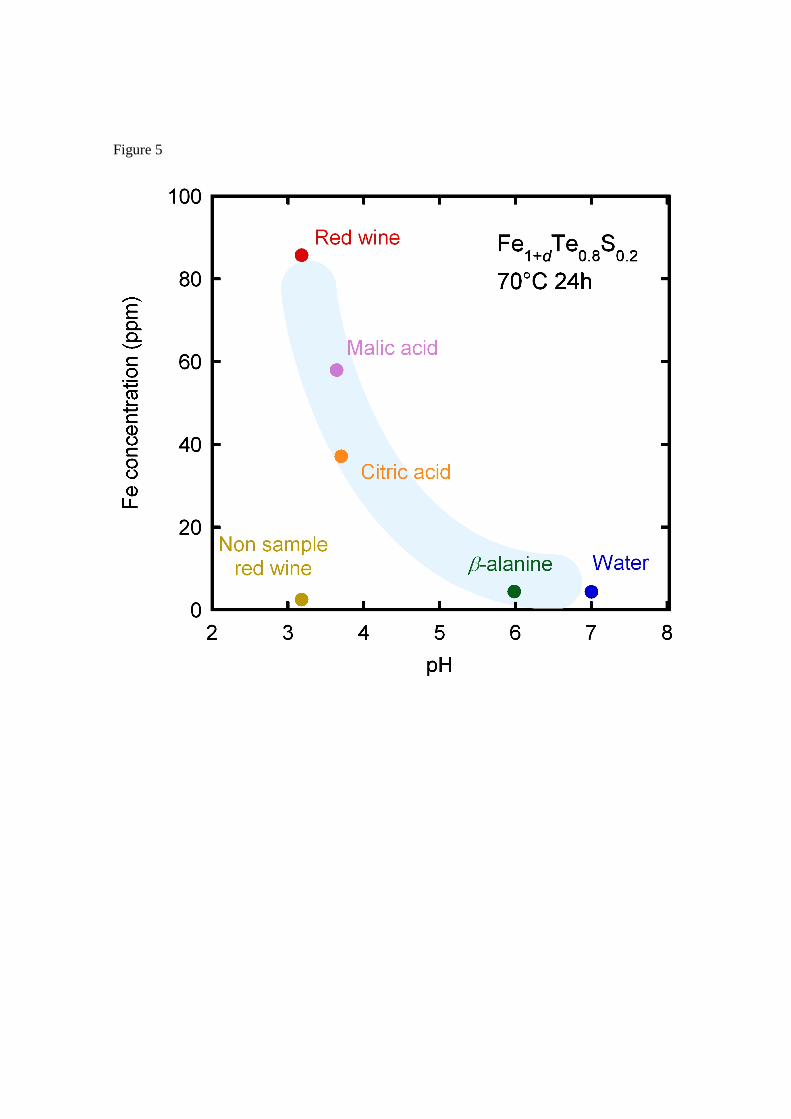
Figure 5