Embed Size (px)
DESCRIPTION
JEL: G22, L22, L25 y M31. Carles Murillo, Franco Sancho y Carlos Vargas Códigos JEL: G22, L22, L25 y M31. Key words: Strategic groups / Dynamic analysis / Spanish Insurance Sector / Strategic change. 1
Citation preview

1
Competitive analysis with Strategic Groups: application to the
Spanish Insurance Sector, 2000-2005
Carles Murillo, Franco Sancho y Carlos Vargas
Abstract: The main goal of this paper is to increase the knowledge of the behavior of strategic groups along time. Given that, the dynamic evolution of a sample of Spanish insurance institutions during the 2000-2005 period has been analyzed. This paper concretely studies: the methodology of identification of generic strategies within the sector, the application of a two-step process for identifying strategic groups and the temporal evolution of strategies and groups. The results of this research indicate that the temporal analysis of both strategies and groups increases the knowledge of the strategic behavior of a sector. Key words: Strategic groups / Dynamic analysis / Spanish Insurance Sector / Strategic change.
JEL: G22, L22, L25 y M31.
Resumen: El objetivo principal de este trabajo es profundizar en el conocimiento del comportamiento de los grupos estratégicos a lo largo del tiempo. Así, se ha analizado la evolución dinámica de una muestra de entidades aseguradoras españolas durante el quinquenio comprendido entre 2000 y 2005. En concreto se estudia: la metodología de identificación de las estrategias genéricas, la aplicación de un proceso bietápico para la formación de los grupos estratégicos y la evolución temporal tanto de las estrategias como de los grupos. Los resultados del mismo indican que el análisis de la evolución temporal de ambas entidades mejora el conocimiento del comportamiento estratégico de un sector. Palabras clave: Grupos estratégicos / Análisis dinámico / Sector Asegurador español / Cambio estratégico. Códigos JEL: G22, L22, L25 y M31.

2
INTRODUCTION
The importance of the strategic group concept within the competitive analysis of an industry or a
sector is undoubtedly. The existence of a vast body of academic literature, based on this paradigm
since mid seventies up to now, confers it both theoretical and empirical interest. The main research
lines within this field are related to the methodology of identification of the groups, the analysis of
the relationship between strategy and results and the study of the dynamic stability of them. At the
same time, the Spanish Insurance Sector has gone through a series of legal and increasing
competitiveness changes, which have promoted deep variations of the environment and therefore in
the ways of competing. Within this new context, it is possible to develop a strategic group analysis
of the Spanish Insurance Sector for a better understanding of the strategies followed by the firms,
the strategic groups that constitute the sector and to assess the association between the fact that a
firm is a member of certain strategic group and its results. To conclude, this paper is divided as
follows. Firstly, a literature review of both strategic group theory and Spanish Insurance Sector is
done for the last two decades. Secondly, the objectives and research hypotheses are presented. The
forth section contains a detailed description of the applied methodology. The fifth and sixth sections
are the results presentation and discussion respectively. Afterwards, a comprehensive summary of
conclusions and managerial implications are given. At the last part, there is an analysis of the main
limitations of this research, which can serve as potential future fields of study.
LITERATURE REVIEW
STRATEGIC GROUP THEORY
The paradigm of strategic group is used as a fundamental tool for defining the competitive strategy
and is basic for resource allocation decisions. Within this context, it is possible to define the
competitive strategy of a firm as the way in which it competes, its objectives and the policies that it
employs to reach such objectives. The strategy is, hence, the combination of goals that wants to
achieve a firm and the means that it uses for reaching them (Porter, 1982). The strategic group
concept was initially used by Hunt in 1972. Since that, the concept has been widely used for either

3
theoretical or empirical investigation. In that way, Porter (1979) defined strategic group as a group
of firms that follow similar strategies in terms of their key success variables. The success of
employing strategic groups for studying the positioning of a firm is based on their intrinsic features.
For that reason, strategic groups can serve: i) as an intermediate level of analysis between the firm
and the sector (Johnson & Scholes, 1997), ii) for studying the relationship between the chosen
strategy and managerial outcomes obtained – potential predictive validity- (McGee & Thomas,
1986; Cool & Schendel, 1987), and iii) for investigating simultaneously a group of firms and to
assess their strategic actions jointly.
The academic research on strategic groups is mainly centred in three research lines, which are: i)the
methodology of group identification, ii) the analysis of result/outcome differences among groups,
iii) the dynamic (temporal) stability of the group structures.
(i) Strategic groups’ identification process
This issue is the foundation of every research based on the strategic group paradigm. There are
several methodological approaches and its application depends on the research objectives. The most
used are the multivariate and the cognitive approaches.
The multivariate methodology is based on the fact that firms which present similar values in their
strategic variables are grouped together. The most widely used multivariate process was prompted
by Fiegenbaum & Thomas (1990a) and it is composed by a series of concatenated stages. A
summary of this process is presented at table 1.
Table 1. Identification process Fiegenbaum & Thomas (1990a)
1st) Mapping of the strategic space
2nd) Selection of the strategic subspace
3rd) Key variables selection
4th) Strategically Stable Time Periods (SSTP) identification
5th) Clustering firms into strategic groups (for each SSTP)
Source: Adapted from Fiegenbaum & Thomas (1990a)

4
The other way for identifying strategic groups is the cognitive approach. It is based on the fact that
individual actions are based on external perceptions of reality, filtered by their own systems (Reger
& Huff, 1993). In this way, managers (individually) or the board of directors (collectively) shape
simplified depictions of mental models or cognitive mapping of their competitive markets, of
rivalry and of strategic grouping itself. The research of Porac & Thomas (1995), Reger & Huff
(1993) and Nath & Gruca (1997) are interesting examples of this view.
To conclude this overall revision, it is worthy to highlight the importance of Nath & Gruca (1997)
paper. This article intends to evaluate the convergence between the previously described methods of
strategic groups’ structure identification. Initially, they identify strategic groups with a multivariate
approach1. Afterwards, they apply a scale to measure managers’ perceptions, using for this task the
specific attributes of the sector under scrutiny, multivariate cognitive approach. Thirdly, they
employ also, managers’ direct competition perception of the firms that struggle within the industry,
direct cognitive approach. To conclude, this research supports the convergence among strategic
groups structure either implementing multivariate or cognitive approaches.
ii) Strategic groups and firm performance
This branch of research studies the association between the performance of a firm and the fact that
it belongs to a specific strategic group. In this way, Mascarenhas & Aaker (1989) considered that
the importance of the strategic group resides in being a useful tool for explaining performance
differences among firms. Therefore, on the one hand, there is lots of research analyzing the
performance differences between groups. This approach is based on the existence of mobility
barriers between groups, which are the main cause for the existence of prevalent performance
differences between strategic groups (Porter, 1979).
Another aspect analyzed within this line of research, is the potential performance differences among
firms within a group. This approach is based on the idea that members of the same group,
implementing similar strategies in terms of strategic variables, are obtaining different outcomes. It
1 The statistical techniques implemented were factorial analysis and cluster analysis.

5
is based on the idea that firms consider as direct competitor those firms that are close to them,
within the same group, and try to exploit as much as they can their differences on resource
allocation to develop isolation mechanisms (Cool & Schendel, 1988). The objective of any firm is,
hence, to maintain these differences for outperforming their competitors.
(iii) Strategic groups structure stability
The last line of research is centered in analyzing the structure of strategic groups from a dynamic
viewpoint and hence to assess the temporal evolution of firm mobility among groups. The
importance of identifying periods of strategic stability, in competitive analysis, is undoubtedly. This
fact is clearly shown at Fiegembaum & Thomas (1990a, 1990b); Cool & Schendel, (1988) or Más,
(1999). However, there are several academic papers which identify strategic groups for only one
economic year. This fact is an important limitation when trying to analyze the competitive evolution
of a sector. Examples of it can be found at Lee et al. (2003); Mac Namara et al. (2003); Nath &
Gruca (1997) or Reger & Huff, (1993).
THE INSURANCE SECTOR
The main contribution of the Insurance Sector to the Economy is to offer several kind of risk
protection. This sort of activity is essential within a Market Economy. The importance of studying
the Insurance Sector rests on the fact that its degree of development is one of the better indicators of
the economic standard of a country (Pinillos & Martin, 1998). In this way, the main indicators to
measure the development and evolution of this sector are the penetration ratio2 and the insurance
density indicator3. The study of such indicators for the Spanish Insurance Sector, during the eighties
and nineties, indicates a continuous increase of the relevance of this sector within the Spanish
Economy. This growth was caused by both regulatory changes4 in the sector and the entrance of
2 Penetration ratio = Total premium generated by the Insurance Sector / Gross Domestic Product. 3 Density indicator = Total premium generated by the Insurance Sector / country inhabitants. 4 The Law of Private Insurance Arrangement, 1984 (LOSP –Ley de Ordenación del Seguro Privado-) and the Law of Supervision and Arrangement of Private Insurance 1995 (LOSSP –Ley de Ordenación y Supervisión del Seguro Privado-)

6
new entities to the Insurance Business5 (Pinillos & Martin, 1998). Both, the legislative change and
the increasing of competence, generated a deep change within the structure of the Spanish Insurance
Sector. They drove the sector from a high dispersion level and ruled by Spanish Insurance firms, at
the beginning of the eighties, into a sector characterized by a high specialization degree where both
traditional Financial Entities (Banks and Saving Banks) and Multinational Insurance Groups have
achieved a leading position (Pinillos & Martin, 1998). In addition, since 2003 there is a complex
process in the Spanish Insurance sector to adopt the Solvency Project6, which is the new european
regulatory framework. It aims to reach a unified set of general principles which overcome existen
differences within the european union countries. This new framework has forced the competing
firms to adapt their strategies to be consistent with the new conditions. Concretely, and given that
the present article deals with the analysis of the competitive context during the 2000-2005 period,
the main indicators of the relevance of the Spanish Insurance Sector are shown in table 2.
Table 2. Evolution of indicators Spanish Insurance Sector
2000 2001 2002 2003 2004
Penetration ratio 6.23% 6.08% 6.52% 5.25% 5.30%
Insurance density (€) 970.26 1006.02 1135.68 959.86 1027.50
Source: Own elaboration from data of INE and ICEA7
Therefore, a detailed strategic analysis of the Spanish Insurance Sector is justified by: i) the strong
association between the Insurance Sector and the overall economic context, ii) the fact that the
sector configuration has radically changed in the last years, iii) the Insurance Sector represents
approximately the 6% of the GDP of Spain, and iv) the average insurance premium (density), is
around 1.000 euros per inhabitant yearly.
To conclude this part of the paper, it is worthy to quote the applications of strategic group theory
within the Insurance Sector of Fiegenbaum & Thomas (1990a, 1990b, 1995, and 2001); and, for the
Spanish case, the research of Martinez (1995) and Pinillos & Martin (1998).
5 Bank-assurance: entrance of Banks and Saving Banks to the sector since mid eighties. 6 Proyecto Solvencia II, Ministerio de Economia y Hacienda. Available at www.dgsfp.meh.es/sector/solvencia2.asp 7 INE (Instituto Nacional de Estadística de España) and ICEA (Investigación Cooperativa entre Entidades Aseguradoras)

7
RESEARCH OBJECTIVES AND HYPOTHESES
The current paper intends to analyze the evolution of the Spanish Insurance Sector during the 2000-
2005 period. This general analysis is concretized in five main research objectives, which are:
(1) Identification of the generic competitive strategies followed by the firms that compose
the Insurance Sector, based on their competitive variables (identification of underlying
factors).
(2) Implementation of a descriptive analysis of the measured variables within each factor
(factor characterization).
(3) Identification of the different strategic groups within the sector, based on the generic
strategies identified at the first objective.
(4) Dynamic analysis of the generic strategies’ evolution for the 2000-2005 period.
(5) Dynamic analysis of the strategic groups’ evolution for the 2000-2005 period.
Most of these objectives have been widely studied at previous research (see section 2.1), thus it
permits to consider their transition into specific research hypotheses. The first, second and third
objectives have a descriptive nature. Therefore, they will not have any hypothesis attached.
However, the forth and fifth objectives will be concretized at the following hypothesis:
H1: In a changing environment, the generic strategies followed by the firms within a sector
will evolve along time.
H2: In a changing environment, the number of strategic groups will continuously change
along time.
H3: In a changing environment, the mobility rates of the firms among strategic groups will
be high.

8
METHODS
TARGET GROUP AND INFORMATION SOURCES
The target population for this research is the set of Insurance entities which constitute the Spanish
Insurance Sector for the 2000-2005 period8. The chosen sample is composed by a number of firms
that accounts, approximately, for the 80% of the market share9.
All the variables employed in this paper come from secondary sources. This economic-accounting
information, contained in the balance sheet and the profit and loss account, is regularly published by
the Spanish Ministry of Economy10. The technical specifications of the present research are
presented at table 3.
Table 3. Technical Specifications
Scope Spain
Insurance and Reinsurance firms Universe
operating at Spanish Territory
Universe Size 200 in 2000 206 in 2001 217 in 2002 219 in 2003 203 in 2004 199 in 2005
Sample Size 59 in 2000 56 in 2001 48 in 2002 65 in 2003 50 in 2004 48 in 2005
Balance sheet and Profit & Loss account of firms Data collection
method (secondary data)
Periods under
scrutiny 2000-2005 (data at December 31st)
Source: own elaboration.
DIMENSIONS AND MEASUREMENT
One of the crucial and most complex processes when analyzing strategically a sector, is the decision
of what strategic dimensions include and what variables employ. This task demands an exhaustive
knowledge of the sector under analysis11.
The included dimensions in this paper can be divided into three categories: i) Scope, ii)
Commitment and iii) Result/outcome dimension (Cool & Schendel, 1987). These three dimensions
8 The information of the sector composition comes from the ICEA databases. 9 Market share is measured by volume of direct insurance premium. 10 Source: DGSFP (Dirección General de Seguros y Fondos de Pensiones, Ministerio de Economía y Hacienda) 11 Fiegenbaum & Thomas (1990a) and Cool & Schendel (1987), among others, employ interviews with managers, university teachers with experience within the field and professional consultants of the sector (external validity of the measures).

9
can be measured within the Insurance Sector in the same way that Fiegenbaum & Thomas (1990a)
and Pinillos & Martin (1998) for the Spanish case12.
a) Scope dimension of the firm
The set of variables included in this group try to reflect the firm field of activity, the market
segment where it is present, the kind of products or services offered and its geographical coverage
(Cool & Schendel, 1987). At the Insurance Sector, it is possible to measure:
A1. Life13/non-life14 insurance proportion (measures product orientation),
A2. Diversification index (measures economies of scope),
A3. Size (measures economies of scale),
b) Resource Commitment dimension of the firm
These variables aim to measure the resource distribution along the different functional areas of the
firm (human resources, supplying, sales, etc.), being a key aspect to maintain a competitive
advantage through time (Cool y Schendel, 1987). The variables included of this sort are:
B1. Expenses ratio = [management expenses / total premium volume]
B2. Reinsurance protection (measures risk diversification)
B3. Investment policy (as an additional income source)
B4. Capital turnover = [net revenues / equity capital]
B5. Coverage ratio = [net revenues / (equity capital + provisions)]
c) Result/outcome dimension
The variables which compose this dimension measure the outcome of a generic Insurance firm. The
whole set of included variables comes from the balance sheet and the profit & loss account. They
try to reflect the multidimensional character of the results of a firm, being similar than those used by
Fiegenbaum y Thomas (1990a) y Pinillos y Martin (1998).
12 For a detailed explanation of the composition and meaning of the variables that compose each dimension, see appendix 1. 13 Life insurance branches: risk, retirement, other saving insurances. 14 Non-life insurance branches: car, multi risk, health, casualty, public-liability insurance.

10
C1. Market share
C2. Loss ratio = [accident rate / total premium volume]
C3. Coverage of accident rate by equity capital = [Accident rate / equity capital]
C4. Coverage of accident rate by wide equity capital = [Accident rate / equity capital + provisions]
C5. Return on investment = [return of financial products / (investments + effective)]
C6. Return on equity (ROE) = [Net revenues / equity capital]
C7. Return on assets (ROA) = [pre taxes and interests profits/Net total assets]
DATA ANALYSIS
To reach the first objective, the strategy identification within the Insurance Sector, a principal
components factorial analysis is applied on the previously defined strategic variables. This
statistical method allows identifying the key success factors for the Insurance Sector. It finds,
therefore, the underlying generic strategies of the firms and eliminates redundant information
contained at the indicators. It also summarizes, in the minimum number of factors, the information
contained at the initial variables, with the minimum loss of information (Hair, 1999).
The second objective, the factor labeling, is done at the same time than the previous factorial. This
is because their meaning interpretation is directly associated with decisions related to the number of
retained factors or the rotation method applied to the factorial loadings. This joint process will allow
labeling the factors previously identified which will be used for subsequent analysis (Hair, 1999).
In relation to the third objective, the firm clustering into homogeneous groups, a cluster analysis is
applied. The main goal of this technique is to obtain a taxonomy of the firms that compose the
Spanish Insurance Sector for each year, by means of a two-steps procedure. Firstly, a hierarchical
cluster is applied, which serves to identify the potential number of strategic groups for each year.
Afterwards, a non hierarchical cluster distributes them in an optimal way (Hair, 1999). The fourth
and fifth objective, the dynamic analysis of the generic strategies and the strategic groups, are
investigated by calculating univariate indicators between periods15. They aim to evaluate the
temporal change in the features of the groups.
15 Example of it is the mobility ratio stated by Sudharshan, Thomas & Fiegenbaum (1991) and used at the Spanish context by Mas (1996). For a detailed explanation see appendix 2.

11
RESULTS
The first and second objectives are tested by means of a principal components factorial analysis on
the original strategic variables (scope and resource commitment variables). However, the
application of this kind of multivariate techniques requires that the initial variables achieve several
adequacy criteria. On the one hand, variables must be measured in interval or ratio scale, being of
this type the ones employed in this paper. On the other hand, the variables must show high
colinearity among them. Table 4 shows the KMO statistic, which indicates that the present sample
presents acceptable levels for every year (KMO ≈ 0.6). It also shows the rejection of the Bartlett’s
null hypothesis of Sphericity for every case. The same conclusion is drawn from the fact that the
determinant of that correlation matrix is close to zero for every year. This fact confirms the
existence of correlation among the variables under study.
Table 4. Adequacy criteria for applying Exploratory Factor Analysis (EFA)
2000 2001 2002 2003 2004 2005
Kaiser-Meyer-Olkin sample adequacy measure 0,599 0,555 0,579 0,519 0,581 0,559
Bartlett's Sphericity Test χ² approx. 279,141 153,147 147,019 182,753 183,270 226,232
dof 28 28 28 28 28 28
Sig. 0,000 0,000 0,000 0,000 0,000 0,000
Correlation matrix determinant 0,002 0,045 0,034 0,042 0,019 0,006
Source: Own elaboration. Once assured the data adequacy, the next step when applying a factorial technique is to decide the
method for factor extraction. In this case, only those factors which have an eigenvalue greater than
one were retained. Under this logic, the first three components for each year were analized and they
explain around 75% of the initial variance (see appendix 3). These figures are higher than 60%
which is considered as acceptable within social science research (Hair, 1999). This is also supported
by the Scree plots (see appendix 4), where the slope of the curve diminishes suddenly after the third
component for each year.
The communalities of the original variables with the factors indicates the representation level of the
indicators on the retained factors. Table 5 shows that almost all of them are greater than 0.65 which
indicates a good representation of the variables within the retained factors. An orthogonal rotation

12
(VARIMAX) of the initial solution has been implemented in order to simplify the factor labeling
process.
Table 5. Communalities
2000 2001 2002 2003 2004 2005
Life/non-life proportion 0,89 0,85 0,87 0,85 0,88 0,90
Diversification index 0,76 0,71 0,85 0,82 0,89 0,88
Size 0,79 0,57 0,71 0,66 0,69 0,65
Expenses ratio 0,97 0,82 0,74 0,79 0,81 0,89
Reinsurance protection 0,96 0,79 0,76 0,78 0,71 0,85
Investment policy 0,61 0,61 0,70 0,63 0,78 0,75
Capital turnover 0,51 0,59 0,63 0,65 0,55 0,58
Coverage ratio 0,78 0,66 0,70 0,57 0,81 0,85
Extraction method: Principal Components Source: Own elaboration.
Once the data adequacy and the proper representation of the variables are checked, the outcomes of
the factorial analysis are presented and the factor labeling has been be done yearly. The table 6
presents the information related to this strategies labeling process.
Table 6. Generic strategies: Spanish Insurance Sector 2000-2005.
Year Importance order
Generic strategy label Descriptors
1 Non-life business focused High non-life proportion and diversification. Low financial investment policy and capital turnover.
2 Differentiation High management expenses ratio and reassurance protection. 2000
3 Cost leadership Large size and low coverage ratio.
1 Non-life business focused High non-life business proportion. Low financial investment policy and capital turnover.
2 Differentiation Small size and high management expenses ratio and reassurance protection. 2001
3 Diversification High diversification of product portfolio and low coverage ratio.
1 Non-life business focused High non-life business proportion and coverage ratio. Low financial investment policy and capital turnover.
2 Differentiation Small size and high expenses ratio and reassurance protection. 2002
3 Diversification High diversification of product portfolio.
1 Differentiation High management expenses ratio and reassurance protection.
2 Non-life business focused High non-life business proportion and coverage ratio. Low financial investment policy.
2003
3 Cost leadership/diversified Large size and highly diversified. High capital turnover
1 Differentiation Small business size. High management expenses ratio and reassurance protection.
2 Non-life business focused High non-life business proportion and coverage ratio. Low financial investment policy.
2004
3 Diversification High diversification of product portfolio.
1 Differentiation Small business size. High management expenses ratio and reassurance protection.
2 Diversification at non-life business Highly diversified portfolio centred at the non-life business. 2005
3 Conservative Low financial investment policy and high coverage ratio.
Source: Own elaboration.
13
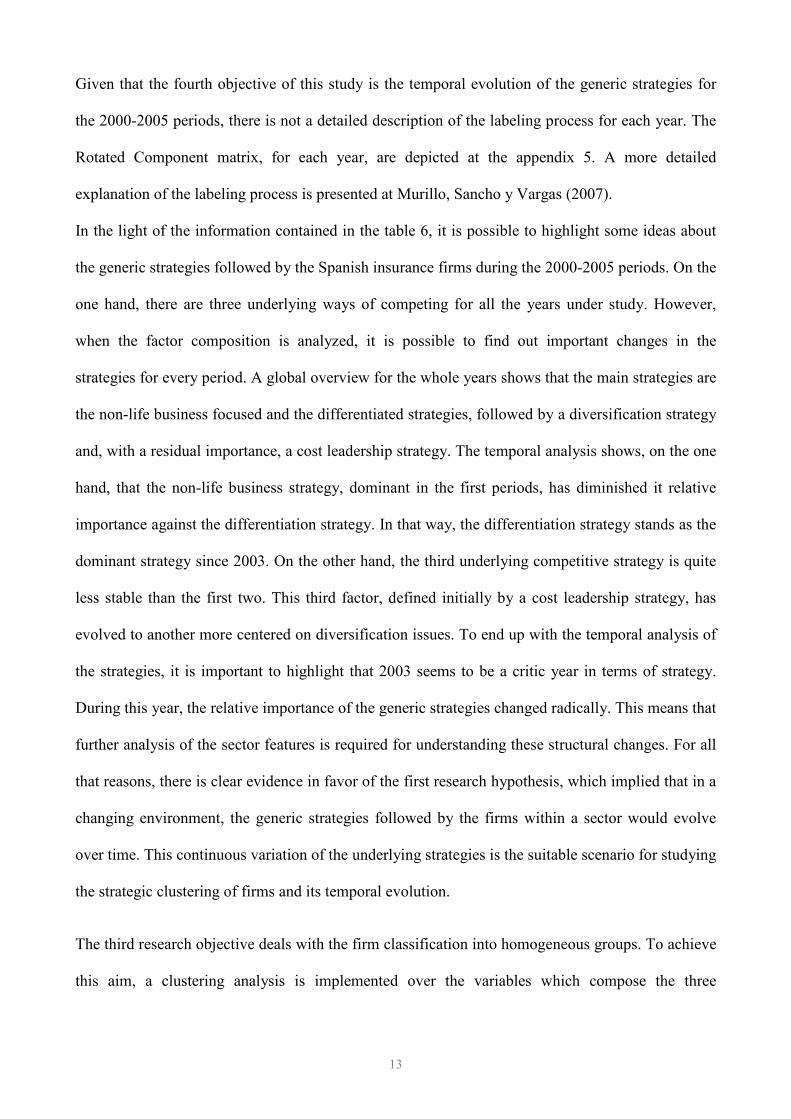
Given that the fourth objective of this study is the temporal evolution of the generic strategies for
the 2000-2005 periods, there is not a detailed description of the labeling process for each year. The
Rotated Component matrix, for each year, are depicted at the appendix 5. A more detailed
explanation of the labeling process is presented at Murillo, Sancho y Vargas (2007).
In the light of the information contained in the table 6, it is possible to highlight some ideas about
the generic strategies followed by the Spanish insurance firms during the 2000-2005 periods. On the
one hand, there are three underlying ways of competing for all the years under study. However,
when the factor composition is analyzed, it is possible to find out important changes in the
strategies for every period. A global overview for the whole years shows that the main strategies are
the non-life business focused and the differentiated strategies, followed by a diversification strategy
and, with a residual importance, a cost leadership strategy. The temporal analysis shows, on the one
hand, that the non-life business strategy, dominant in the first periods, has diminished it relative
importance against the differentiation strategy. In that way, the differentiation strategy stands as the
dominant strategy since 2003. On the other hand, the third underlying competitive strategy is quite
less stable than the first two. This third factor, defined initially by a cost leadership strategy, has
evolved to another more centered on diversification issues. To end up with the temporal analysis of
the strategies, it is important to highlight that 2003 seems to be a critic year in terms of strategy.
During this year, the relative importance of the generic strategies changed radically. This means that
further analysis of the sector features is required for understanding these structural changes. For all
that reasons, there is clear evidence in favor of the first research hypothesis, which implied that in a
changing environment, the generic strategies followed by the firms within a sector would evolve
over time. This continuous variation of the underlying strategies is the suitable scenario for studying
the strategic clustering of firms and its temporal evolution.
The third research objective deals with the firm classification into homogeneous groups. To achieve
this aim, a clustering analysis is implemented over the variables which compose the three
14
dimensions16 defined at the methodology section. The included dimensions are: scope dimension,
resource commitment dimension and result/outcome dimension of the firm. A two-steps clustering
process is undetaken to define the groups and to distribute the firms into them in an optimal way. It
is based on the joint application of a hierarchical and a non hierarchical cluster. The hierarchical
technique is used to determine the number of optimal groups for each year. Afterwards, and
employing the previous number of groups, a non hierarchical K-means clustering method is applied
to obtain the optimal composition of the groups. The application of a non hierarchical technique is
necessary because the hierarchical ones are not very robust due to its sequential nature (Hair, 1999).
The outcome of the hierarchical cluster suggests the existence of four strategic groups for the 2000-
2005 years. The evidence for such statement comes form the analysis of the dendograms depicted
for each year at appendix 6. After this first step is done, a non hierarchical process is undertaken to
provide the optimal distribution of the firms given a number of clusters. In this way, a K-means
cluster analysis is implemented to determine the composition of each group. Based on the results, of
this two-step process, it is possible to distribute the firms within the sample into four strategic
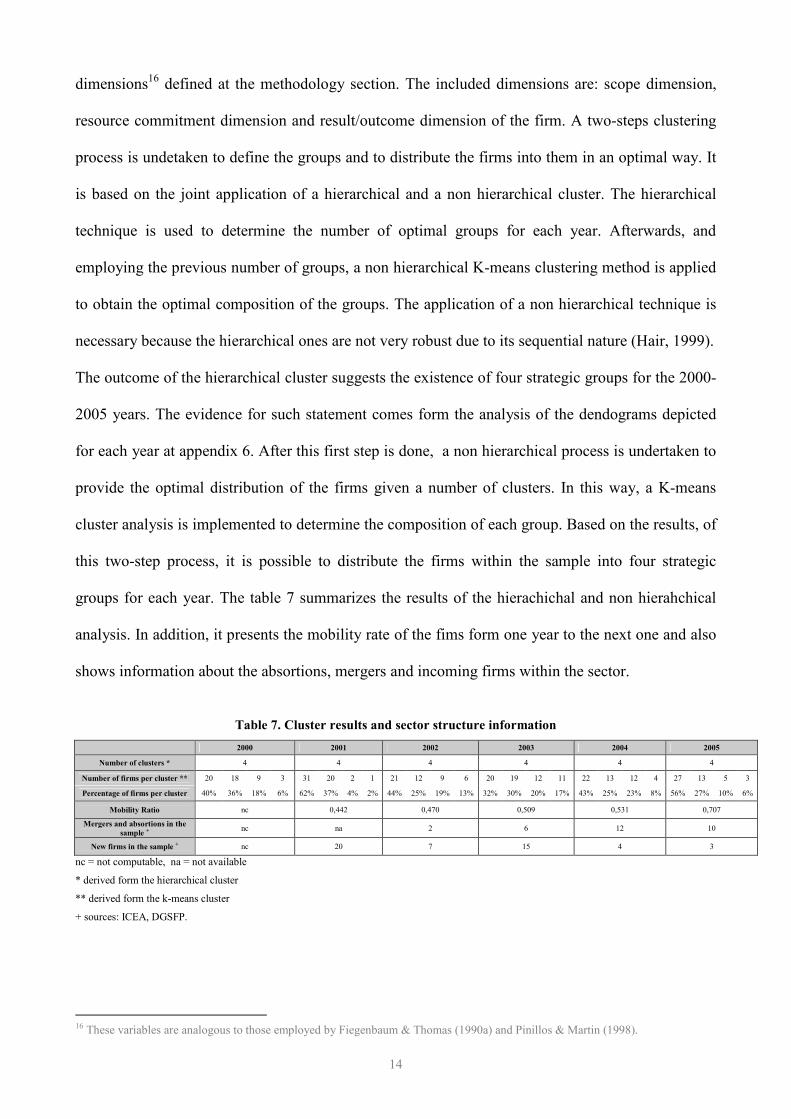
groups for each year. The table 7 summarizes the results of the hierachichal and non hierahchical
analysis. In addition, it presents the mobility rate of the fims form one year to the next one and also
shows information about the absortions, mergers and incoming firms within the sector.
Table 7. Cluster results and sector structure information
2000 2001 2002 2003 2004 2005
Number of clusters * 4 4 4 4 4 4
Number of firms per cluster ** 20 18 9 3 31 20 2 1 21 12 9 6 20 19 12 11 22 13 12 4 27 13 5 3
Percentage of firms per cluster 40% 36% 18% 6% 62% 37% 4% 2% 44% 25% 19% 13% 32% 30% 20% 17% 43% 25% 23% 8% 56% 27% 10% 6%
Mobility Ratio nc 0,442 0,470 0,509 0,531 0,707
Mergers and absortions in the
sample + nc na 2 6 12 10
New firms in the sample + nc 20 7 15 4 3
nc = not computable, na = not available
* derived form the hierarchical cluster
** derived form the k-means cluster
+ sources: ICEA, DGSFP.
16 These variables are analogous to those employed by Fiegenbaum & Thomas (1990a) and Pinillos & Martin (1998).

15
The analsys of the table 7 allows to assess the temporal evolution of the strategic groups for the
period under study17. There are four groups for each year and this figure seems to be stable for the
whole period. The distribution of firms among the groups suggests that there are two principal
strategic groups which include the 75 per cent of the firms of the sample, in average. There are also
two minor groups which include the rest of firms within the sample. However the most interesting
issue is to analize the evolution of the mobility ratio and the mergers and absortion figures for the
period. On the one hand, the mobility ratio suggests that the structure of the sector has not been
stable. It also indicates that the transition of firms from one goup to another has continously
increased from 2000 until 2005. In the same way, the information related to mergers, absortions and
incoming firms indicates that the structure of the sector is continuously evolving over time.
In the light of this empirical evidence, it is possible to draw some conclusions about the structure of
the Spanish Insurance sector for the 2000-2005 period. On the one hand, the number of groups is
relatively stable along time, rejecting the second research hypothesis which stated that in a changing
environment the number of strategic groups would change over time. However, the number of firms
contained in each group presents a peculiar pattern. There are two large groups which stand out for
the whole years but when analyzing them in detail it is possible to observe high group mobility
among firms between periods. This evidence supports the third research hypothesis which indicated
that in a changing environment the mobility ratio of the firms within the strategic groups would be
high. Additionally of this fact, during the research period (2000-2005), there has been a large set of
mergers and absorptions18 which increase this mobility among groups.
DISCUSSION AND CONCLUSIONS
The present section aims to be a critical commentary of the obtained results in preceding sections,
in the same way than to locate these results within the strategic group research literature.
17 Given that the fifth objective of this study is the temporal evolution of the strategic groups for the 2000-2005 periods, there is not a detailed description of the group characterization. For further details on thi issue see Murillo, Sancho y Vargas (2007). 18 Examples of it are: the absorption of PLUS ULTRA SEGUROS GENERALES by GROUPAMA in 2003, the absorption of MUSINI VIDA and MUSINI by GRUPO MAPFRE at the end of 2003, the absorption of ATLÁNTICO VIDA by BANSABADELL in 2004 or the merger during the same year of CASER, ECUADOR, LE MANS, and MAAF Y SUD AMÉRICA to the GRUPO CASER.

16
The outcomes related to the first objective of the paper, the generic strategies identification, are
pretty interesting. The application of a factorial analysis, principal components analysis with
VARIMAX rotation, allows studying the different competing strategies for each year (objectives 1
and 2). It also gives a very approximate idea of their temporal evolution (objective 4).
The process of group composition allows obtaining robust results. This is consequence of the
implementation of a two-step clustering method. In a first stage, a hierarchical cluster analysis has
served to determine the number of strategic groups for each year. Secondly, a K-means cluster
analysis has been used to obtain the group composition. The last stage of this group analysis is
related to the temporal evolution of the groups (objective 5) for the 2000-2005 period. It has
allowed showing, restricted to the chosen sample, the evolution of both the number of strategic
groups and their composition. It is also interesting to highlight the importance of the dynamic
analysis for the strategic management of a firm. Examples of this approach can be found in
Mascarenhas (1989), Fiegenbaum & Thomas (1990) and for the Spanish case Mas (1998 and 1999)
and Flavian & Polo (1999).
Most of the results achieved by this research can be useful for both general strategic analysis and
for the Insurance Sector in particular. On the one hand, the strategic identification methodology can
be applied by the managerial level of the firms to simplify the competitive space where they
operate. On the other hand, the identification of a group structure for a specific sector can help in
the optimal strategy selection process.
LIMITATIONS AND FUTURE RESEARCH LINES
The last section of this paper aims to find out the potential limitations in the same way than
identifying future research lines. Among the limitations, it is worthy to remark:
i) The sample used is constituted by around 50 firms (of an approximate universe of 200) for each
year, accounting for approximately the 80% of the business volume of the sector. It exists, hence, a
clear bias against the smaller firms. For that reason, caution is needed when interpreting the static

17
and dynamic results. However, it is easy to overcome this bias because there is statistic information
for the whole sector.
ii) The variables selection, which aims to reflect the strategic and result dimensions, is exclusively
based on the literature review. It would be interesting to undertake personal interviews to
professional managers and researchers with expertise on the sector to develop better indicators and
validate the existing ones.
REFERENCES
CLAVER, E., MOLINA, J.F. & TARÍ, J.J. (2003A): “Strategic groups and firms performance: the case of
Spanish house-building firms”, Construction Management and Economics (June, 2003) Vol. 21, pp. 369.377
CLAVER, E., MOLINA, J.F., MOLINA, H., MARCO, B. (2003B): “Grupos estratégicos y rentabilidad
empresarial: una prueba complementaria”, ESIC-MARKET, mayo-agosto, pp.82-97.
COOL, K. & SCHENDEL, D. (1987): “Strategic group formation and performance: the case of the
U.S. Pharmaceutical industry, 1963-82”, Management Science, Vol. 33 (9), pp. 1102-1124
COOL, K. & SCHENDEL, D. (1988): “Performance differences among strategic group members”, Strategic
Management Journal, Vol. 9, pp. 207-223
DGSP, Dirección General de Seguros y Fondos de Pensiones, Ministerio de Economía y Hacienda,
Available at: http://www.dgsfp.mineco.es/
FIEGENBAUM, A. & THOMAS, H (1990A): “Strategic Groups and Performance: the U.S. Insurance
Industry, 1970-1984”, Strategic Management Journal, Vol. 11, pp. 197-215
FIEGENBAUM, A., SUDHARSHAN, D. & THOMAS, H. (1990b): “Strategic time periods and Strategic
Groups research: concepts and an empirical example”, Journal of Management Studies, Vol. 27:2, 133-148
FIEGENBAUM, A. Y THOMAS, H. (1995): “Strategic groups as reference groups: theory, modelling and
Empirical examination of industry and competitive strategy”, Strategic Management Journal, 16, 461-476
FIEGENBAUM, A., THOMAS, H. & TANG, M.J. (2001): “Linking Hypercompetition and Strategic Group
Theories: Strategic Maneuvering in the US Insurance Industry”, Managerial and Decision Economics, 22,
pp. 265-279
18
FlAVIAN, C. & POLO, Y. (1999). “Strategic groups analysis (SGA) as a tool for strategic marketing”,
European Journal of Marketing, Vol. 33, issue 5-6, pp. 548-569.
HAIR, J., ANDERSON, R., TATHAM, R, & BLACK, W (1999): “Análsis Multivariante”, 5ª edition.
Prentice Hall, Madrid.
ICEA, Investigación Cooperativa entre Entidades Aseguradoras y Fondos de Pensiones, http://www.icea.es
HUNT, M. (1972): “Competition in the Mayor Home Appliance Industry, 1960-70”. Doctoral Thesis,
Harvard University.
JOHNSON G. & SCHOLES K. (1997) D: “Dirección Estratégica. Análisis de la estrategia de las
Organizaciones”, 3ª Ed., Prentice Hall: Madrid.
LEE, J.; LEE, K. & RHO, D. (2002) “An evolutionary perspective on strategic group emergence: a genetic
Algorithm-based model”, Strategic Management Journal, Vol. 23, pp. 727-746
LEWIS, P. & THOMAS, H. (1990): “The linkage between strategy, strategic groups, and performance in the
U.K. retail grocery industry”, Strategic Management Journal, Vol. 11, pp. 385-97
MARTÍNEZ, M. A. (1993): “Organización y Estrategia en la Empresa: el Ejemplo del Sector Asegurador
en España”, Doctoral Thesis, Universidad de Alcalá de Henares.
MAS, F. J. (1996) “Competencia Dinámica de Grupos Estratégicos: aplicación al sector bancario español”,
Ed. Secretariado de Publicaciones, Universidad de Alicante.
MÁS, F. J. (1998): “Relación rentabilidad-riesgo en el contexto de los grupos estratégicos”, Revista
Europea de Dirección y Economía de la Empresa, Vol. 7, 1, pp. 33-46
MÁS, F. J. (1999): “Dynamic analysis of competition in marketing: strategic groups in Spanish banking”,
International Journal of Bank Marketing, Vol. 17, 5, pp. 233-50.
MASCARENHAS, B. Y AAKER, D.(1989): “Mobility barriers and strategic groups”, Strategic
Management Journal, Vol. 10 (5), pp. 475-485
MCGEE, J. & THOMAS, H. (1986): “Strategic Group: Theory, Research and Taxonomy”, Strategic
Management Journal, Vol.7, pp. 141-160

19
PINILLOS COSTA, M. & MARTÍN, M. L. (1998): “Grupos Estratégicos en el Sector Asegurador, 1991-
1995: El impacto de la Bancaseguros”, Centro de Estudios Superiores Sociales y Jurídicos Ramón Carande.
PORAC, J., THOMAS, H., WILSON, F. PATON, D. & KANFER, A. (1995): “Rivalry and the industry
model of Scottish knitwear producers”, Administrative Science Quarterly, Vol. 40, pp. 203-227
PORTER, M. E. (1982): “Competitive Strategy: Techniques for Analyzing Industries and Competitors”. The
Free Press: Macmillan Co. Inc.
PORTER, M. (1979): “The structure within industries and companies’ performance”, Review of Economics
and Statistics, Vol. 61 (2), pp.214-27
PUNJ. G & STEWART D. (1983) “Cluster Analysis in Marketing Research: Review and Suggestions for
Application.” Journal of Marketing Research, Vol. 20 (May): 134-48
REGER, R. & HUFF, A.S., (1993): “Strategic groups: a cognitive perspective”, Strategic Management
Journal, Vol. 14, pp. 103-124
MURILLO, C., SANCHO ESPER, F. & VARGAS, C. (2007) “Análisis Estratégico mediante grupos
estratégicos: Aplicación al Sector Asegurador Español, 2001-2005”, X Encuentro de Economía Aplicada,
June 2007, Logroño (Spain). Avaliable at: http://www.revecap.com/xeea/trabajos/m/murillo.html
SUDHARSHAN, D., H. THOMAS, & A. FIEGENBAUM (1991) “Assessing Mobility Barriers in Dynamic
Strategic Groups Analysis”, Journal of Management Studies, Vol. 28, issue 5, pp. 429-438.

20
APPENDIX 1 Strategic and result variables
A) Scope variables
A1. Life/non-life proportion,
It tries to quantify the product orientation of a firm and it is the ratio between total net non-life premium and
the total net premium.
A2. Diversification index,
It indicates the degree of business diversification of the firm. It is measured by means of the ratio of the actual
number of branches in which operates a firm and the maximum number of branches in each year.
A3. Size =Ln (total premium),
It aims to measure the size-volume of a firm and is operationalized by the neperian logarithm of the total net
premium.
B) Resource commitment variables
B1. Expenses Ratio,
It is the ratio between the management expenses (internal and external) and the total net premium. It intends to
measure the resource usage productivity.
B2. Reinsurance protection,
It is the ratio between the total reinsurance between the total net premiums. It is an instrument used for
increasing the insurance capacity of a firm (risk reduction).
B3. Investment Policy,
It indicates the proportion of total investment which is financial investment. Decisions related to it can
represent a source of additional income of insurance firms.
B4. Capital turnover,
It is the ratio between the net revenues and the equity capital of a firm.
B5. Coverage ratio,
It is the ratio between the net revenues and the equity capital plus the technical provisions.
C) Result-outcome variables
C1. Market share,
C2. Loss ratio, it is measured by the ratio between accident rate and total net premium.
C3. Coverage of accident rate by equity capital,
C4. Coverage of accident rate by wide equity capital (equity capital and provisions),
C5. Return of investment, return on financial products divided by total investments and effective.
C6. Return on equity (ROE), net revenues divided by equity capital.
C7. Return on assets (ROA), pre taxes and interest profits divided by net total assets.

21
APPENDIX 2 Mobility Ratio (adapted from Mas, 1996)
In general, the comparison between the strategic groups of two yime periods T1 and T2 fallows
these steps:
1) Each group of period one is associated with a number (1, 2, ...,m) in an arbitrary way.
2) Each gof the n groups of T2 period is compared with the ones obtaines in T1 and they
receive the number of identification of the T1 group with higher overlapping level.
3) Comparison among the strategic groups of both periods and calculation of the mobility
ratio.
Where:
C ij = number of firms which belong to group i at T1 period and to group j at T2 period.
N1i = total number of firms which belongs to group i at T1 period.
N2j = total number of firms which belongs to group j at T2 period.

22
APPENDIX 3 Exploratory factor analysis: Total Extracted Variance
Varianza Total Explicada (año 2001)
2,851 35,632 35,632 2,851 35,632 35,632 2,216 27,699 27,699
1,533 19,165 54,797 1,533 19,165 54,797 2,006 25,069 52,768
1,211 15,138 69,935 1,211 15,138 69,935 1,373 17,167 69,935
,846 10,576 80,511
,708 8,853 89,364
,513 6,414 95,778
,195 2,434 98,212
,143 1,788 100,000
Componente1
2
3
4
5
6
7
8
Total% de lavarianza % acumulado Total
% de lavarianza % acumulado Total
% de lavarianza % acumulado
Autovalores inicialesSumas de las saturaciones al cuadrado
de la extracciónSuma de las saturaciones al cuadrado
de la rotación
Método de extracción: Análisis de Componentes principales.
Varianza Total Explicada (año 2002)
2,762 34,519 34,519 2,762 34,519 34,519 2,362 29,529 29,529
1,873 23,414 57,933 1,873 23,414 57,933 2,233 27,909 57,438
1,323 16,534 74,467 1,323 16,534 74,467 1,362 17,029 74,467
,682 8,521 82,988
,547 6,839 89,827
,382 4,775 94,601
,324 4,051 98,652
,108 1,348 100,000
Componente1
2
3
4
5
6
7
8
Total% de lavarianza % acumulado Total
% de lavarianza % acumulado Total
% de lavarianza % acumulado
Autovalores inicialesSumas de las saturaciones al cuadrado
de la extracciónSuma de las saturaciones al cuadrado
de la rotación
Método de extracción: Análisis de Componentes principales.
Varianza Total Explicada (año 2000)
2,936 36,703 36,703 2,936 36,703 36,703 2,507 31,339 31,339
1,758 21,978 58,681 1,758 21,978 58,681 2,061 25,767 57,105
1,582 19,777 78,458 1,582 19,777 78,458 1,708 21,353 78,458
,796 9,951 88,409
,563 7,032 95,441
,239 2,989 98,430
,101 1,263 99,694
,024 ,306 100,000
Componente1
2
3
4
5
6
7
8
Total% de lavarianza % acumulado Total
% de lavarianza % acumulado Total
% de lavarianza % acumulado
Autovalores inicialesSumas de las saturaciones al cuadrado
de la extracciónSuma de las saturaciones al cuadrado
de la rotación
Método de extracción: Análisis de Componentes principales.
Varianza Total Explicada (año 2003)
2,436 30,455 30,455 2,436 30,455 30,455 2,104 26,299 26,299
1,962 24,531 54,986 1,962 24,531 54,986 2,096 26,203 52,502
1,357 16,962 71,948 1,357 16,962 71,948 1,556 19,446 71,948
,836 10,453 82,401
,589 7,363 89,765
,420 5,251 95,016
,293 3,660 98,675
,106 1,325 100,000
Componente1
2
3
4
5
6
7
8
Total% de lavarianza % acumulado Total
% de lavarianza % acumulado Total
% de lavarianza % acumulado
Autovalores inicialesSumas de las saturaciones al cuadrado
de la extracciónSuma de las saturaciones al cuadrado
de la rotación
Método de extracción: Anál isis de Componentes principales.

23
Varianza Total Explicada (año 2004)
2,729 34,111 34,111 2,729 34,111 34,111 2,332 29,156 29,156
2,057 25,714 59,825 2,057 25,714 59,825 2,047 25,584 54,740
1,340 16,745 76,570 1,340 16,745 76,570 1,746 21,830 76,570
,673 8,407 84,977
,525 6,561 91,539
,333 4,157 95,696
,260 3,245 98,941
,085 1,059 100,000
Componente1
2
3
4
5
6
7
8
Total% de lavarianza % acumulado Total
% de lavarianza % acumulado Total
% de lavarianza % acumulado
Autovalores inicialesSumas de las saturaciones al cuadrado
de la extracciónSuma de las saturaciones al cuadrado
de la rotación
Método de extracción: Anál isis de Componentes principales.
Varianza Total Explicada (año 2005)
2,923 36,541 36,541 2,923 36,541 36,541 2,542 31,771 31,771
2,180 27,246 63,787 2,180 27,246 63,787 2,104 26,301 58,072
1,258 15,721 79,508 1,258 15,721 79,508 1,715 21,436 79,508
,653 8,160 87,668
,456 5,699 93,367
,366 4,569 97,936
,105 1,309 99,245
,060 ,755 100,000
Componente1
2
3
4
5
6
7
8
Total% de lavarianza % acumulado Total
% de lavarianza % acumulado Total
% de lavarianza % acumulado
Autovalores inicialesSumas de las saturaciones al cuadrado
de la extracciónSuma de las saturaciones al cuadrado
de la rotación
Método de extracción: Análisis de Componentes principales.

24
APPENDIX 4 Exploratory factor analysis: Scree plots

25
Components
1 2 3
Life/non-life proportion 0,91 0,12 -0,07
Diversification index 0,55 -0,02 0,64
Size 0,06 -0,69 0,31
Expenses ratio 0,32 0,77 0,35
Reinsurance protection 0,08 0,81 0,37
Investment policy -0,78 -0,06 -0,02
Capital turnover -0,54 -0,51 0,19
Coverage ratio 0,29 -0,12 -0,75
Components
1 2 3
Life/non-life proportion 0,29 0,86 0,17
Diversification index 0,34 0,41 0,74
Size -0,32 0,02 0,75
Expenses ratio 0,87 0,07 -0,17
Reinsurance protection 0,88 -0,04 -0,05
Investment policy 0,04 -0,79 -0,10
Capital turnover -0,38 -0,43 0,57
Coverage ratio -0,35 0,62 -0,25
Components
1 2 3
Life/non-life proportion 0,20 0,80 0,48
Diversification index -0,17 0,91 -0,17
Size -0,79 0,17 -0,04
Expenses ratio 0,93 0,14 -0,03
Reinsurance protection 0,90 0,18 -0,10
Investment policy -0,01 -0,45 -0,74
Capital turnover -0,42 -0,59 -0,24
Coverage ratio -0,09 -0,10 0,91
APPENDIX 5 Exploratory factor analysis: Rotated Component Matrix
Rotated Component Matrix 2000 Rotated Component Matrix 2001
Rotated Component Matrix 2002 Rotated Component Matrix 2003 Components
1 2 3
Life/non-life proportion 0,85 0,26 0,29
Diversification index 0,22 0,14 0,88
Size -0,22 -0,62 0,53
Expenses ratio 0,04 0,85 0,07
Reinsurance protection -0,10 0,85 0,15
Investment policy -0,79 0,09 -0,24
Capital turnover -0,61 -0,51 0,07
Coverage ratio 0,73 -0,20 -0,35
Rotated Component Matrix 2004 Rotated Component Matrix 2005 Components
1 2 3
Life/non-life proportion 0,27 0,73 0,65
Diversification index 0,01 -0,08 0,94
Size -0,75 -0,04 0,35
Expenses ratio 0,88 -0,01 0,18
Reinsurance protection 0,80 -0,16 0,19
Investment policy 0,06 -0,87 -0,17
Capital turnover -0,52 -0,30 -0,44
Coverage ratio -0,06 0,88 -0,17
Components
1 2 3
Life/non-life proportion 0,89 0,22 -0,22
Diversification index 0,79 0,00 0,37
Size 0,02 -0,15 0,87
Expenses ratio 0,12 0,98 -0,05
Reinsurance protection 0,14 0,97 0,07
Investment policy -0,78 0,01 0,09
Capital turnover -0,63 -0,26 0,20
Coverage ratio 0,20 -0,18 -0,84

26
2001 C A S E 0 5 10 15 20 25 Label Num +---------+---------+---------+---------+---------+ 11 òø 14 òú 24 òú 33 òú 2 òú 30 òú 35 òú 38 òú 45 òú 8 òú 13 òú 47 òú 10 òú 29 òú 43 òú 19 òú 26 òú 1 òú 4 òú 5 òú 17 òôòòòø 46 òú ó 49 òú ó 44 òú ó 34 òú ó 50 òú ó 51 òú ó 48 òú ó 39 òú ó 40 òú ó 27 òú ó 31 òú ó 42 òú ó 28 òú ó 32 òú ó 16 òú ùòòòòòòòòòòòòòòòòòòòòòòòòòòòòòòòòòòòòòòòòòòòø 25 òú ó ó 23 òú ó ó 53 òú ó ó 52 òú ó ó 36 òú ó ó 37 òú ó ó 41 òú ó ó 54 òú ó ó 6 òú ó ó 21 òú ó ó 18 òú ó ó 20 ò÷ ó ó 12 òø ó ó 15 òú ó ó 9 òôòòò÷ ó 7 òú ó 22 ò÷ ó 3 òòòòòòòòòòòòòòòòòòòòòòòòòòòòòòòòòòòòòòòòòòòòòòòòò÷
2002
C A S E 0 5 10 15 20 25 Label Num +---------+---------+---------+---------+---------+ 14 òø 46 òú 20 òôòø 7 ò÷ ó 36 òø ó 41 òú ùòòòòòòòø 48 òú ó ó 27 òú ó ó 35 òú ó ó 32 òôò÷ ó 47 òú ó 28 òú ó 34 òú ó 37 òú ó 4 òú ó 16 òú ùòòòòòòòòòòòòòòòòòòòòòòòòòòòòòòòòòòòòòø 6 òú ó ó 3 ò÷ ó ó 21 òø ó ó 45 òú ó ó 24 òôòòòø ó ó 23 ò÷ ó ó ó 17 òø ó ó ó 19 òú ó ó ó 29 òú ó ó ó 25 òú ùòòòòò÷ ó 31 òú ó ó 39 òú ó ó 26 òú ó ó 33 òú ó ó 5 òôòø ó ó 43 òú ùò÷ ó 9 ò÷ ó ó 30 òòò÷ ó 13 òø ó 15 òú ó 12 òôòòòòòòòø ó 11 òú ó ó 22 ò÷ ùòòòòòòòòòòòòòòòòòòòòòòòòòòòòòòòòòòòòòòò÷ 38 òø ó 40 òôòø ó 44 ò÷ ùòòòòò÷ 1 òø ó 2 òôò÷ 8 òú 10 òú 18 òú 42 ò÷
2004 C A S E 0 5 10 15 20 25 Label Num +---------+---------+---------+---------+---------+ 10 òø 15 òú 34 òú 44 òôòø 48 òú ó 30 òú ó 51 ò÷ ùòòòø 21 òø ó ó 24 òú ó ó 17 òôò÷ ó 35 òú ùòòòòòòòòòòòòòòòòòòòòòòòòòòòòòòòòòòòòòòòòòø 2 òú ó ó 12 ò÷ ó ó 38 òûòø ó ó 39 ò÷ ùòòò÷ ó 43 òòò÷ ó 19 òûòø ó 50 ò÷ ó ó 25 òø ùòòòòòòòòòòòòòòòòòòòø ó 28 òú ó ó ó 14 òôò÷ ó ó 18 òú ó ó 11 ò÷ ó ó 22 òø ó ó 23 òôòòòòòòòòòòòòòòòòòø ùòòòòòòòòòòòòòòòòòòòòòòòòò÷ 16 òú ó ó 42 ò÷ ó ó 4 òø ó ó 5 òú ó ó 6 òôòø ó ó 7 òú ó ó ó 1 òú ó ùòòò÷ 9 ò÷ ùòø ó 26 òø ó ó ó 36 òú ó ó ó 37 òú ó ó ó 33 òôò÷ ó ó 46 òú ó ó 27 òú ó ó 45 òú ùòòòòòòòòòòòòò÷ 29 òú ó 31 òú ó 8 òú ó 49 ò÷ ó 41 òø ó 47 òôòø ó 40 ò÷ ùò÷ 13 òø ó 32 òôò÷ 3 òú 20 ò÷
2005 C A S E 0 5 10 15 20 25 Label Num +---------+---------+---------+---------+---------+ 10 òø 14 òú 7 òú 6 òú 18 òú 2 òôòòòø 4 ò÷ ó 25 òø ó 34 òú ó 46 òú ùòòòòòòòòòòòòòòòø 8 òôòòòú ó 12 òú ó ó 15 òú ó ó 26 òú ó ó 17 ò÷ ó ó 29 òø ó ó 41 òú ó ó 47 òú ó ùòòòòòø 30 òôòòò÷ ó ó 35 òú ó ó 45 òú ó ó 42 òú ó ó 48 òú ó ó 31 òú ó ó 43 ò÷ ó ó 16 òûòø ó ó 37 ò÷ ùòòòòòòòòòòòòòòòòò÷ ùòòòòòòòòòòòòòòòòòòòòòø 22 òûò÷ ó ó 44 ò÷ ó ó 23 òø ó ó 24 òú ó ó 33 òú ó ó 28 òú ó ó 40 òôòòòòòø ó ó 19 òú ó ó ó 1 òú ùòòòòòòòòòòòòòòòòòòò÷ ó 11 ò÷ ó ó 5 òòòûòòò÷ ó 39 òòò÷ ó 9 òûòòòòòø ó 13 ò÷ ó ó 27 òø ó ó 38 òú ùòòòòòòòòòòòòòòòòòòòòòòòòòòòòòòòòòòòòòòòòò÷ 20 òôòø ó 21 òú ó ó 3 òú ùòòò÷ 32 ò÷ ó 36 òòò÷
2003 C A S E 0 5 10 15 20 25 Label Num +---------+---------+---------+---------+---------+ 51 òø 56 òú 57 òú 50 òú 54 òú 36 òú 58 òú 33 òú 35 òú 25 òú 28 òú 40 òú 26 òôòòòø 27 òú ó 44 òú ó 30 òú ó 41 òú ó 48 òú ó 49 ò÷ ùòòòòòòòòòòòòòòòòòòòòòø 10 òø ó ó 11 òú ó ó 1 òú ó ó 7 òú ó ó 3 òôòø ó ó 4 òú ó ó ó 5 ò÷ ùò÷ ó 46 òø ó ó 47 òôò÷ ó 38 òú ó 43 òú ùòòòòòòòòòòòòòòòòòòòòòø 6 òú ó ó 29 ò÷ ó ó 17 òø ó ó 37 òôòòòòòòòòòòòø ó ó 20 òú ó ó ó 55 ò÷ ó ó ó 22 òø ó ó ó 32 òú ó ó ó 21 òú ó ó ó 19 òú ó ó ó 13 òú ùòòòòòòòòòòòòò÷ ó 15 òú ó ó 2 òôòòòòòø ó ó 53 òú ó ó ó 61 òú ó ó ó 39 òú ó ó ó 52 òú ó ó ó 42 òú ùòòòòò÷ ó 34 ò÷ ó ó 23 òø ó ó 59 òú ó ó 62 òôòø ó ó 9 ò÷ ó ó ó 31 òòòôòòò÷ ó 60 òòò÷ ó 18 òø ó 45 òú ó 14 òú ó 8 òôòòòòòòòòòòòòòòòòòòòòòòòòòòòòòòòòòòòòòòòòòòòòòòò÷ 24 òú 16 òú 12 ò÷
APPENDIX 6 Hierarchical clustering: Dendogram
2000 C A S E 0 5 10 15 20 25 Label Num +---------+---------+---------+---------+---------+ 37 òø 46 òú 22 òú 39 òú 29 òú 19 òú 40 òú 47 òú 50 òú 33 òôòòòø 20 òú ó 23 òú ó 4 òú ùòòòø 48 ò÷ ó ó 6 òø ó ó 31 òú ó ó 27 òôòòò÷ ó 34 ò÷ ó 28 òø ùòòòòòòòòòòòòòòòòòòòòòòòòòòòòòòòòòòòòòòòø 36 òú ó ó 26 òú ó ó 38 òú ó ó 5 òú ó ó 30 òú ó ó 43 òôòòòòòòò÷ ó 44 òú ó 12 òú ó 13 òú ó 16 òú ó 10 òú ó 11 òú ó 3 òú ó 32 òú ó 41 òú ó 42 òú ó 49 òú ó 25 ò÷ ó 9 òø ó 17 òôòòòòòòòòòòòø ó 8 ò÷ ó ó 15 òø ó ó 18 òôòø ùòòòòòòòòòòòòòòòòòòòòòòòòòòòòòòòòòòò÷ 45 ò÷ ó ó 1 òø ó ó 2 òú ùòòòòòòòòò÷ 7 òú ó 21 òú ó 35 òôò÷ 14 òú 24 ò÷


