Embed Size (px)
Citation preview
CLINICAL EPIDEMIOLOGY www.jasn.org
CKD Prevalence Varies across the European GeneralPopulation
Katharina Brück,* Vianda S. Stel,* Giovanni Gambaro,† Stein Hallan,‡ Henry Völzke,§
Johan Ärnlöv,ǁ Mika Kastarinen,¶ Idris Guessous,** José Vinhas,†† Bénédicte Stengel,‡‡
Hermann Brenner,§§ Jerzy Chudek,ǁǁ Solfrid Romundstad,¶¶ Charles Tomson,***Alfonso Otero Gonzalez,††† Aminu K. Bello,‡‡‡ Jean Ferrieres,§§§ Luigi Palmieri,ǁǁǁ
Gemma Browne,¶¶¶ Vincenzo Capuano,**** Wim Van Biesen,†††† Carmine Zoccali,‡‡‡‡
Ron Gansevoort,§§§§ Gerjan Navis,ǁǁǁǁ Dietrich Rothenbacher,¶¶¶¶ Pietro Manuel Ferraro,†
Dorothea Nitsch,***** Christoph Wanner,††††† Kitty J. Jager,*and on behalf of the European CKD Burden Consortium
Due to the number of contributing authors, the affiliations are listed at the end of this article.
ABSTRACTCKD prevalence estimation is central to CKD management and prevention planning at the populationlevel. This study estimated CKD prevalence in the European adult general population and investigatedinternational variation in CKD prevalence by age, sex, and presence of diabetes, hypertension, andobesity. We collected data from 19 general-population studies from 13 European countries. CKD stages1–5 was defined as eGFR,60 ml/min per 1.73 m2, as calculated by the CKD-Epidemiology Collaborationequation, or albuminuria .30 mg/g, and CKD stages 3–5 was defined as eGFR,60 ml/min per 1.73 m2.CKD prevalence was age- and sex-standardized to the population of the 27 Member States of the Euro-pean Union (EU27). We found considerable differences in both CKD stages 1–5 and CKD stages 3–5prevalence across European study populations. The adjusted CKD stages 1–5 prevalence varied between3.31% (95%confidence interval [95%CI], 3.30% to3.33%) inNorway and 17.3% (95%CI, 16.5% to 18.1%) innortheast Germany. The adjustedCKD stages 3–5 prevalence varied between 1.0% (95%CI, 0.7% to 1.3%)in central Italy and 5.9% (95% CI, 5.2% to 6.6%) in northeast Germany. The variation in CKD prevalencestratified by diabetes, hypertension, and obesity status followed the same pattern as the overall preva-lence. In conclusion, this large-scale attempt to carefully characterize CKDprevalence in Europe identifiedsubstantial variation in CKD prevalence that appears to be due to factors other than the prevalence ofdiabetes, hypertension, and obesity.
J Am Soc Nephrol 27: 2135–2147, 2016. doi: 10.1681/ASN.2015050542
CKD reduces lifespan significantly.1 Individualswith CKD have an increased risk of cardiovasculardisease and may develop ESRD.1,2 Fortunately, thedevelopment of these complications can be delayedor prevented.1
CKD prevalence estimation is central to CKDmanagement and prevention planning at the pop-ulation level.3 Identification of countries with a rel-atively low or high CKD prevalence will guide themedical community and policy makers where tofocus prevention and disease management strate-gies. To date, international comparisons have beenhampered by differences in national age and sex
distributions and in definitions of CKD.4Moreover,prevalence estimates are influenced by the use ofdifferent creatinine determination methods.5,6
Received May 18, 2015. Accepted September 24, 2015.
Published online ahead of print. Publication date available atwww.jasn.org.
Correspondence: Katharina Brück, European Renal Association–European Dialysis and Transplant Association Registry, AmsterdamMedical Center, Meibergdreef 9, 1100 DD Amsterdam, TheNetherlands. Email: [email protected]
Copyright © 2016 by the American Society of Nephrology
J Am Soc Nephrol 27: 2135–2147, 2016 ISSN : 1046-6673/2707-2135 2135
Table
1.Description
ofinclud
edstud
iesan
dstud
ysamplin
gmetho
ds
Country
Reg
ion(s)/C
ities
Stud
yAgeRan
ge
Samplin
gFram
eSa
mple
Selection
Res
pons
e(%
)Rep
rese
ntativen
essb
Finlan
dAll
FINRISK
25–74
Populationregister
Agean
dsexstratifi
edsample
70Ye
sFran
ceBordea
ux,D
ijonan
dMon
tpellie
rTh
reeCity
65+
Elec
toralrolls
Rand
omsample
ofno
ninstitutiona
lized
individua
ls37
Yes
Lille
,Bas-Rhinan
dHau
te-G
aron
neMONALISA
35–74
Elec
toralrolls
Agean
dsexstratifi
edrand
omsample
51Ye
s
German
ySo
uth
ActiFE
65–91
Populationregister
Agean
dsexstratifi
edrand
omsample
ofno
ninstitutiona
lized
individua
ls20
Yes
Southw
est
ESTH
ER50
–74
Gen
eral
practition
ers
lists
Recruitm
entd
uringbiann
ually
health
exam
inationforo
lder
adults
Not
given
Yesc
Northea
stSH
IP20
–79
Populationregisters
Twostag
es:
69Ye
s(1)S
tratificatio
nbased
onN.o
fresiden
tsper
mun
icipality
(2)A
gean
dsexstratifi
edrand
omsample
selectionper
commun
ityIre
land
All
SLAN
45+
Postal
residen
tiallists
Agean
durban
/rural
loca
tionan
dsocial
classstratifi
edsample
66Ye
sd
Italy
Northea
stIN
CIPE
40+
Gen
eral
practition
ers
lists
Rand
omselectionof
partic
ipan
tsfrom
62rand
omselected
practices
62Ye
s
Cen
tral
MATISS
20–79
Elec
toralrolls
Agean
dsexstratifi
edrand
omsample
offour
mun
icipalities
60Ye
s
South
VIP
25–74
Elec
toralrolls
Agean
dsexstratifi
edrand
omsample
72Ye
sNethe
rland
sNorth
LifeLine
s20
+Gen
eral
practition
ers
lists
Twostag
es:
Not
given
Yes
(1)A
llsubjectsag
ed25
–50
years
registeredwith
gen
eral
practition
era
(2)F
amily
mem
bersof
firstsam
ple
Groning
enPR
EVEN
D28
–75
Populationregister
Threestag
es:
48Ye
s(1)A
llinha
bita
ntsof
city
(2)S
elec
tionof
subjectsbased
onalbum
inuria
leve
l(3)C
orrectionforo
versam
plin
gof
album
inuria
Norway
Cen
tral
HUNT
20+
Cen
susdata
Allresiden
tsin
region
71Ye
sPo
land
All
PolSen
ior
65+
Populationregister
Threestag
es:
42Ye
s(1)S
tratificatio
nbased
onN.o
fresiden
tsper
mun
icipality
(2)S
tratificatio
nbased
onstreets/towns
(3)A
gestratifi
edrand
omsample
Portug
alAll
PREVADIAB
20–79
Unive
rsal
health
card
(heldby99
%of
pop
ulation)
Twostag
es:
84Ye
sd
(1)A
gean
dsexstratifi
edsample
(2)C
orrectionforu
ninten
tiona
lov
ersamplin
gof
elderlyfemales
2136 Journal of the American Society of Nephrology J Am Soc Nephrol 27: 2135–2147, 2016
CLINICAL EPIDEMIOLOGY www.jasn.org
Because diabetes, hypertension, and obesity are important riskfactors for CKD,2 the prevalence of these diseases should betaken into account when comparing CKD prevalence.Whether disparities in CKD prevalence are explained by theserisk factors will guide policy makers to focus on secondary orprimary prevention.
Therefore the purpose of our study was (1) to estimate theCKD prevalence in the adult general population across Europe,and (2) to investigate variation in prevalence across countriesby age, sex, and the presence of diabetes, hypertension, andobesity. We collected data from 19 general population-basedstudies from 13 European countries and estimated CKD prev-alence using one definition of CKD.
RESULTS
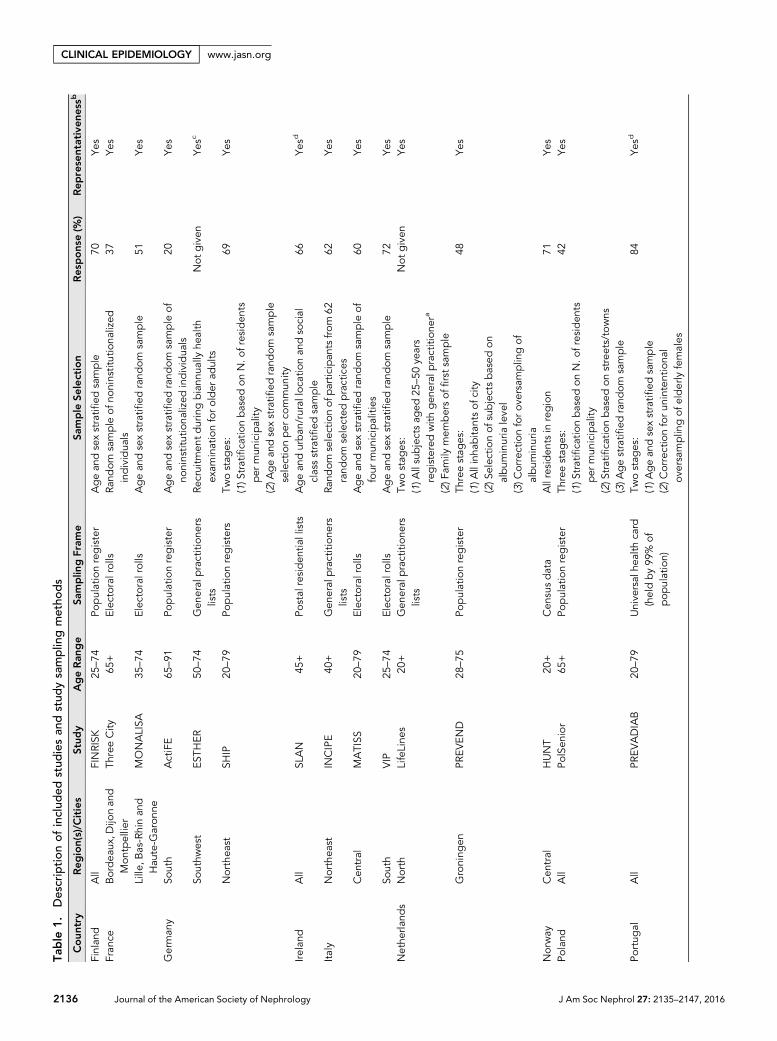
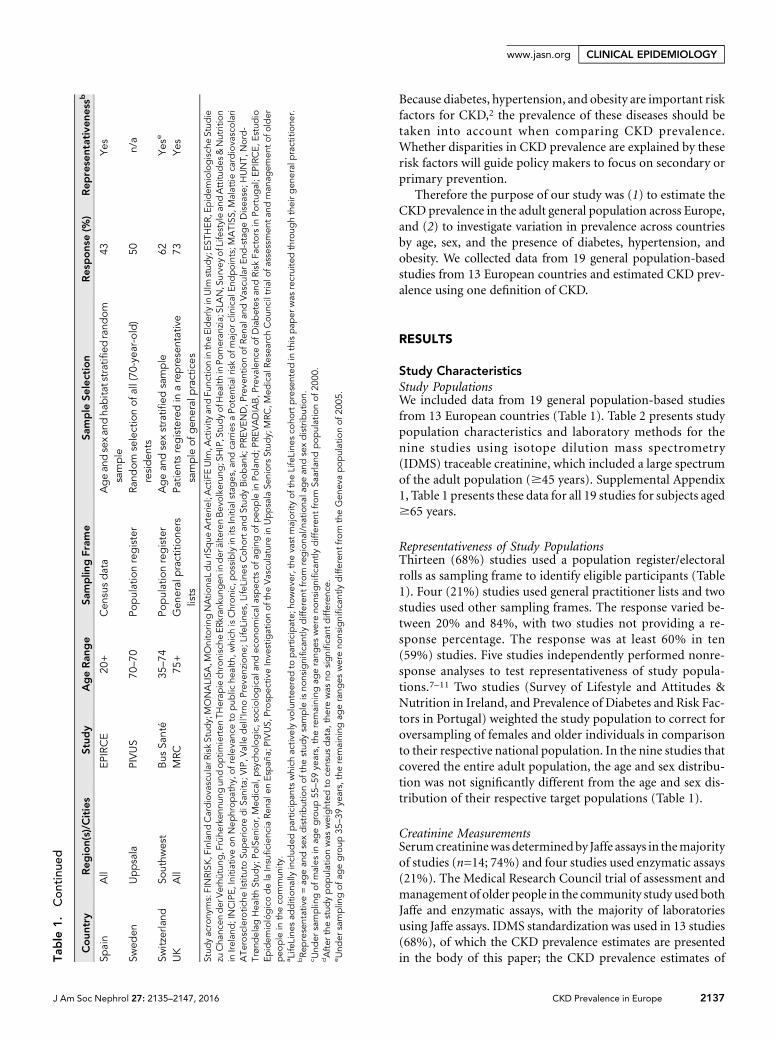
Study CharacteristicsStudy PopulationsWe included data from 19 general population-based studiesfrom 13 European countries (Table 1). Table 2 presents studypopulation characteristics and laboratory methods for thenine studies using isotope dilution mass spectrometry(IDMS) traceable creatinine, which included a large spectrumof the adult population ($45 years). Supplemental Appendix1, Table 1 presents these data for all 19 studies for subjects aged$65 years.
Representativeness of Study PopulationsThirteen (68%) studies used a population register/electoralrolls as sampling frame to identify eligible participants (Table1). Four (21%) studies used general practitioner lists and twostudies used other sampling frames. The response varied be-tween 20% and 84%, with two studies not providing a re-sponse percentage. The response was at least 60% in ten(59%) studies. Five studies independently performed nonre-sponse analyses to test representativeness of study popula-tions.7–11 Two studies (Survey of Lifestyle and Attitudes &Nutrition in Ireland, and Prevalence of Diabetes and Risk Fac-tors in Portugal) weighted the study population to correct foroversampling of females and older individuals in comparisonto their respective national population. In the nine studies thatcovered the entire adult population, the age and sex distribu-tion was not significantly different from the age and sex dis-tribution of their respective target populations (Table 1).
Creatinine MeasurementsSerumcreatininewasdeterminedby Jaffe assays in themajorityof studies (n=14; 74%) and four studies used enzymatic assays(21%). The Medical Research Council trial of assessment andmanagement of older people in the community study used bothJaffe and enzymatic assays, with the majority of laboratoriesusing Jaffe assays. IDMS standardization was used in 13 studies(68%), of which the CKD prevalence estimates are presentedin the body of this paper; the CKD prevalence estimates ofTa
ble
1.Con
tinu
ed
Country
Reg
ion(s)/C
ities
Stud
yAgeRan
ge
Samplin
gFram
eSa
mple
Selection
Res
pons
e(%
)Rep
rese
ntativen
essb
Spain
All
EPIRCE
20+
Cen
susdata
Agean
dsexan
dha
bita
tstratified
rand
omsample
43Ye
s
Swed
enUppsala
PIVUS
70–70
Populationregister
Rand
omselectionof
all(70
-yea
r-old)
residen
ts50
n/a
Switzerland
Southw
est
Bus
Santé
35–74
Populationregister
Agean
dsexstratifi
edsample
62Ye
se
UK
All
MRC
75+
Gen
eral
practition
ers
lists
Patie
ntsregisteredin
arepresentative
sample
ofgen
eral
practices
73Ye
s
Stud
yacrony
ms:FINRISK
,Finland
Cardiovascular
Risk
Stud
y;MONALISA
,MOnitorin
gNAtio
naLdurISq
ueArteriel;ActiFEUlm
,Activity
andFu
nctio
nintheElderlyinUlm
stud
y;ES
THER,
Epidem
iologisch
eStud
iezu
Cha
ncen
der
Verhü
tung
,Frühe
rken
nung
undop
timierten
THerap
iech
ronische
ERkran
kung
eninder
älterenBev
olke
rung
;SHIP,Studyof
Hea
lthinPo
meran
zia;SL
AN,Surve
yof
Lifestylean
dAttitu
des
&Nutrition
inIrelan
d;INCIPE,
Initiativeon
Nep
hrop
athy
,ofrelev
ance
topub
liche
alth,w
hich
isChron
ic,p
ossiblyin
itsInitialstag
es,a
ndca
rriesaPo
tentialriskof
major
clinical
Endpoints;MATISS
,Malattie
cardiovascolari
ATe
rosclerotic
heIstitutoSu
periore
diS
anita
;VIP,V
alle
dell’IrnoPrev
enzione
;Life
Line
s,LifeLine
sCoh
ortan
dStud
yBioban
k;PR
EVEN
D,P
reve
ntionof
Rena
land
Vascu
larEn
d-stageDisea
se;H
UNT,
Nord-
Trønd
elag
Hea
lthStud
y;Po
lSen
ior,Med
ical,p
sych
ologic,soc
iological
andec
onom
ical
aspec
tsof
agingof
peo
ple
inPo
land
;PRE
VADIAB,P
reva
lenc
eof
Diabetes
andRisk
Factorsin
Portug
al;E
PIRC
E,Estudio
Epidem
iológicodela
Insuficien
ciaRe
nale
nEspañ
a;PIVUS,
Prosp
ectiv
eInve
stigationof
theVascu
lature
inUppsala
SeniorsStud
y;MRC
,Med
icalRe
search
Cou
nciltrialo
fassessm
enta
ndman
agem
ento
folder
peo
ple
intheco
mmun
ity.
a Life
Line
sad
dition
allyinclud
edpartic
ipan
tswhich
activ
elyvo
luntee
redto
partic
ipate;
howev
er,the
vast
majority
oftheLifeLine
sco
hortpresented
inthispap
erwas
recruitedthroug
htheirg
eneral
practitione
r.bRe
presentative=ag
ean
dsexdistributionof
thestud
ysample
isno
nsignificantlydifferen
tfrom
regiona
l/na
tiona
lagean
dsexdistribution.
c Und
ersamplin
gof
males
inag
egroup
55–59
years,theremaining
agerang
eswereno
nsignifica
ntly
differen
tfrom
Saarland
pop
ulationof
2000
.dAfter
thestud
ypop
ulationwas
weighted
toce
nsus
data,
therewas
nosignifica
ntdifferen
ce.
eUnd
ersamplin
gof
agegroup
35–39
years,theremaining
agerang
eswereno
nsignificantlydifferen
tfrom
theGen
evapop
ulationof
2005
.
J Am Soc Nephrol 27: 2135–2147, 2016 CKD Prevalence in Europe 2137
www.jasn.org CLINICAL EPIDEMIOLOGY
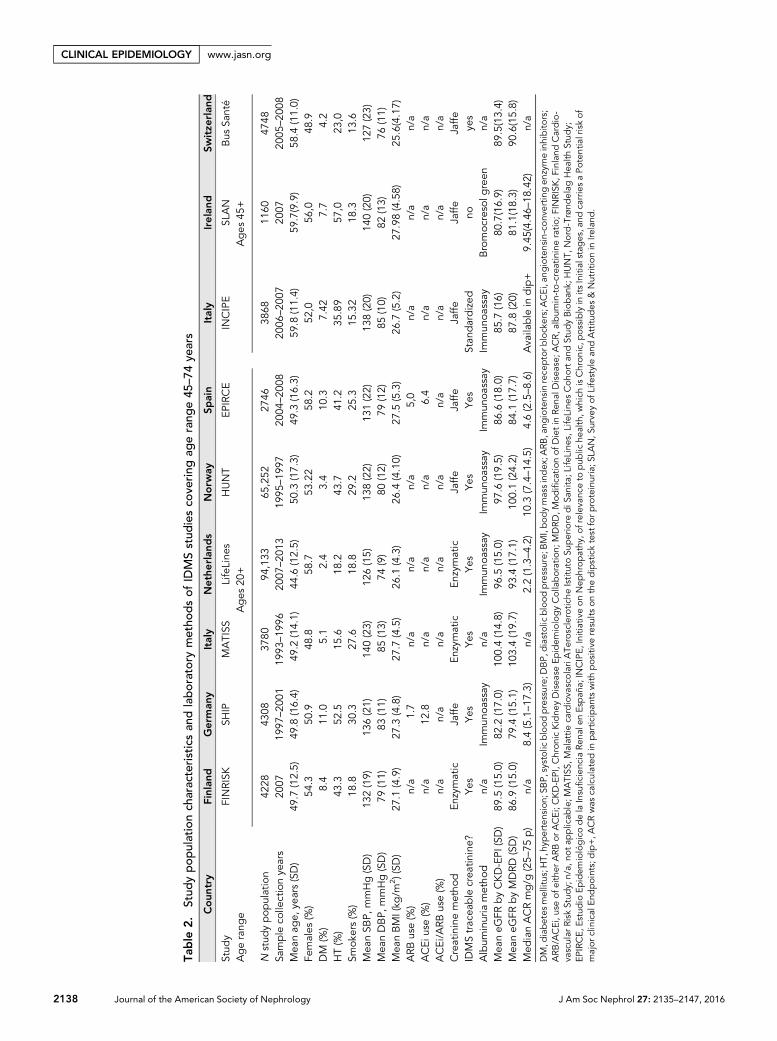
Table
2.Stud
ypop
ulationch
aracteristicsan
dlaboratorymetho
dsof
IDMSstud
iesco
vering
agerang
e45
–74
years
Coun
try
Finlan
dGerman
yItaly
Nethe
rlan
ds
Norw
aySp
ain
Italy
Ireland
Switze
rlan
d
Stud
yFINRISK
SHIP
MATISS
LifeLine
sHUNT
EPIRCE
INCIPE
SLAN
Bus
Santé
Agerang
eAges
20+
Ages
45+
Nstud
ypop
ulation
4228
4308
3780
94,133
65,252
2746
3868
1160
4748
Sample
colle
ctionye
ars
2007
1997
–20
0119
93–19
9620
07–20
1319
95–19
9720
04–20
0820
06–20
0720
0720
05–20
08Mea
nag
e,ye
ars(SD)
49.7
(12.5)
49.8
(16.4)
49.2
(14.1)
44.6
(12.5)
50.3
(17.3)
49.3
(16.3)
59.8
(11.4)
59.7(9.9)
58.4
(11.0)
Females
(%)
54.3
50.9
48.8
58.7
53.22
58.2
52,0
56,0
48.9
DM
(%)
8.4
11.0
5.1
2.4
3.4
10.3
7.42
7.7
4.2
HT(%
)43
.352
.515
.618
.243
.741
.235
.89
57,0
23,0
Smok
ers(%
)18
.830
.327
.618
.829
.225
.315
.32
18.3
13.6
Mea
nSB
P,mmHg(SD)
132(19)
136(21)
140(23)
126(15)
138(22)
131(22)
138(20)
140(20)
127(23)
Mea
nDBP,
mmHg(SD)
79(11)
83(11)
85(13)
74(9)
80(12)
79(12)
85(10)
82(13)
76(11)
Mea
nBMI(kg
/m2)(SD
)27
.1(4.9)
27.3
(4.8)
27.7
(4.5)
26.1
(4.3)
26.4
(4.10)
27.5
(5.3)
26.7
(5.2)
27.98(4.58)
25.6(4.17)
ARB
use(%
)n/a
1.7
n/a
n/a
n/a
5,0
n/a
n/a
n/a
ACEi
use(%
)n/a
12.8
n/a
n/a
n/a
6.4
n/a
n/a
n/a
ACEi/A
RBuse(%
)n/a
n/a
n/a
n/a
n/a
n/a
n/a
n/a
n/a
Creatininemetho
dEn
zymatic
Jaffe
Enzymatic
Enzymatic
Jaffe
Jaffe
Jaffe
Jaffe
Jaffe
IDMStrac
eable
crea
tinine?
Yes
Yes
Yes
Yes
Yes
Yes
Stan
dardized
noye
sAlbum
inuria
metho
dn/a
Immun
oassay
n/a
Immun
oassay
Immun
oassay
Immun
oassay
Immun
oassay
Bromoc
resolg
reen
n/a
Mea
neG
FRbyCKD-EPI
(SD)
89.5
(15.0)
82.2
(17.0)
100.4(14.8)
96.5
(15.0)
97.6
(19.5)
86.6
(18.0)
85.7
(16)
80.7(16.9)
89.5(13.4)
Mea
neG
FRbyMDRD
(SD)
86.9
(15.0)
79.4
(15.1)
103.4(19.7)
93.4
(17.1)
100.1(24.2)
84.1
(17.7)
87.8
(20)
81.1(18.3)
90.6(15.8)
Med
ianACRmg/g
(25–
75p)
n/a
8.4(5.1–17
.3)
n/a
2.2(1.3–4.2)
10.3
(7.4–14
.5)
4.6(2.5–8.6)
Availa
ble
indip+
9.45
(4.46–
18.42)
n/a
DM,d
iabetes
mellitus;H
T,hy
pertension;
SBP,
systolicblood
pressure;
DBP,
diastolicblood
pressure;
BMI,bod
ymassindex
;ARB
,ang
iotensin
rece
ptorb
lockers;ACEi,an
giotensin-conv
ertin
gen
zymeinhibito
rs;
ARB
/ACEi,u
seof
either
ARB
orACEi;CKD-EPI,Chron
icKidne
yDisea
seEp
idem
iologyCollaboration;
MDRD,M
odificatio
nof
Dietin
Rena
lDisea
se;A
CR,a
lbum
in-to-creatinineratio
;FIN
RISK
,Finland
Cardio-
vascular
Risk
Stud
y;n/a,
nota
pplicab
le;M
ATISS
,Malattie
cardiova
scolariATe
rosclerotic
heIstitutoSu
periore
diS
anita
;Life
Line
s,LifeLine
sCoh
ortan
dStud
yBioban
k;HUNT,
Nord-Trønd
elag
Hea
lthStud
y;EP
IRCE,E
stud
ioEp
idem
iológicodelaInsuficien
ciaRe
nale
nEspañ
a;IN
CIPE,
Initiativeon
Nep
hrop
athy
,ofrelev
ance
topub
liche
alth,w
hich
isChron
ic,p
ossiblyin
itsInitialstag
es,a
ndcarriesaPo
tentialriskof
major
clinical
Endpoints;dip+,A
CRwas
calculated
inpartic
ipan
tswith
pos
itive
results
onthedipsticktest
forp
roteinuria;S
LAN,S
urve
yof
Lifestylean
dAttitu
des
&Nutritionin
Ireland
.
2138 Journal of the American Society of Nephrology J Am Soc Nephrol 27: 2135–2147, 2016
CLINICAL EPIDEMIOLOGY www.jasn.org
studies using non–IDMS-standardized creatinine (n=6, 32%)are presented exclusively in Supplemental Appendix 1.
Albuminuria MeasurementsOf the 11 studies that collected albuminuria data, ten (91%)used immunoassays to measure urinary albumin. Two studies(18%) used dipsticks to assess albuminuria presence, whichwas confirmed by immunoassay in the Initiative on Nephrop-athy, of relevance to public health,which isChronic, possibly inits Initial stages, and carries a Potential risk of major clinicalEndpoints study.
CKD Stage 1–5 PrevalenceAdult PopulationPrevalence estimates were adjusted to the age and sex distri-bution of the population of the 27 Member States of theEuropean Union (EU27) in 200512 to correct for differences innational age and sex distributions. The adjusted CKD stages1–5 prevalence in the adult population, including subjectsaged 20–74 years, for studies using IDMS-standardized creat-inine varied between 3.31% (95% confidence interval [95%CI], 3.30 to 3.33) in Norway and 17.3% (95% CI, 16.5 to 18.1)in the Northeast German Study of Health in Pomeranzia(SHIP) study (Supplemental Appendix 1, Figure 1).
Supplemental Appendix 1, Table 2 shows the unadjustedand adjusted CKD stages 1–5 prevalence in the adult popula-tion, for both IDMS and non-IDMS studies. For studies usingnon–IDMS-standardized creatinine, the unadjusted and ad-justed CKD stages 1–5 prevalence in the adult population isgraphically presented in Supplemental Appendix Figure 1.
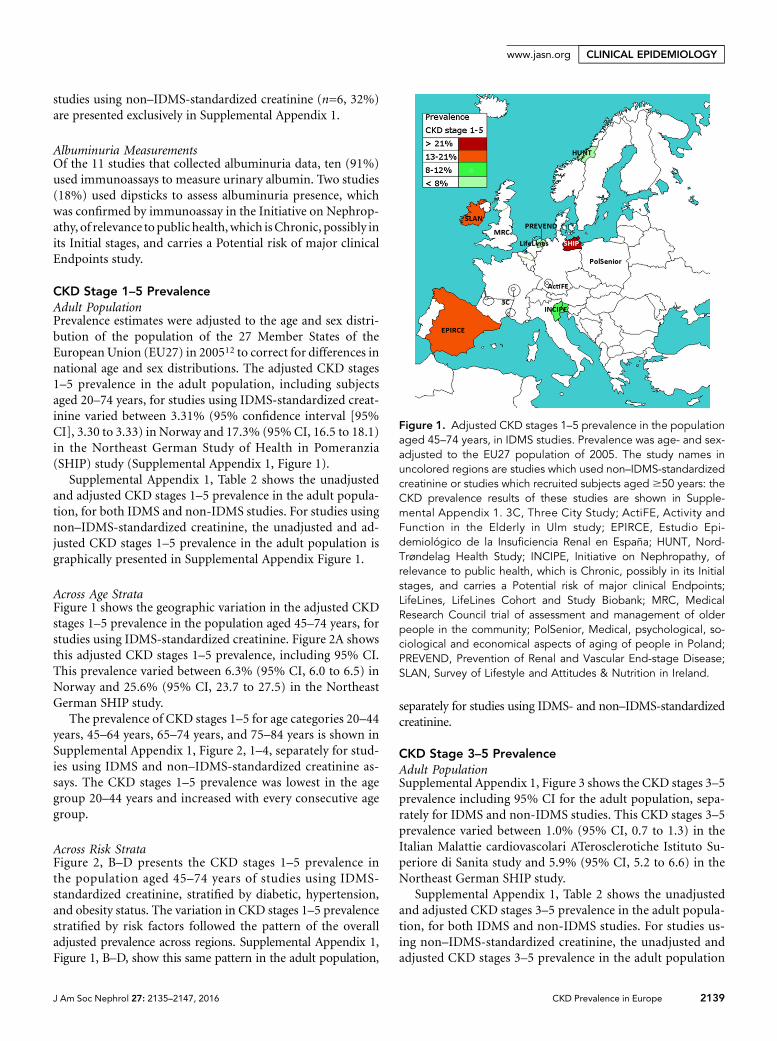
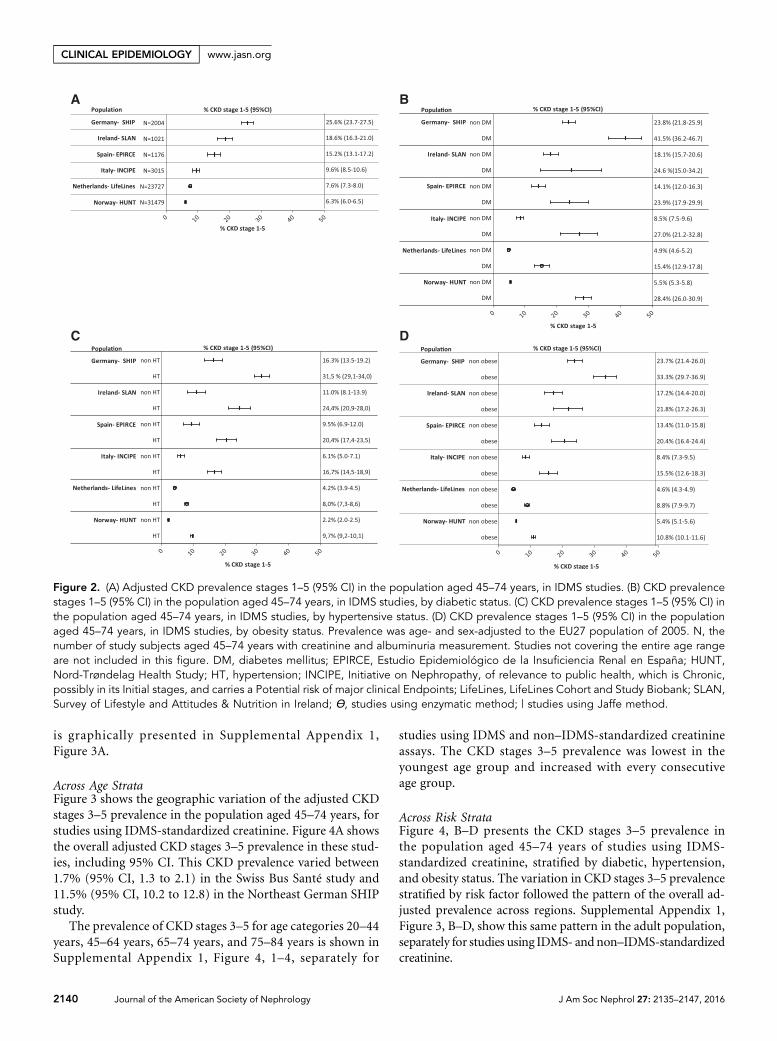
Across Age StrataFigure 1 shows the geographic variation in the adjusted CKDstages 1–5 prevalence in the population aged 45–74 years, forstudies using IDMS-standardized creatinine. Figure 2A showsthis adjusted CKD stages 1–5 prevalence, including 95% CI.This prevalence varied between 6.3% (95% CI, 6.0 to 6.5) inNorway and 25.6% (95% CI, 23.7 to 27.5) in the NortheastGerman SHIP study.
The prevalence of CKD stages 1–5 for age categories 20–44years, 45–64 years, 65–74 years, and 75–84 years is shown inSupplemental Appendix 1, Figure 2, 1–4, separately for stud-ies using IDMS and non–IDMS-standardized creatinine as-says. The CKD stages 1–5 prevalence was lowest in the agegroup 20–44 years and increased with every consecutive agegroup.
Across Risk StrataFigure 2, B–D presents the CKD stages 1–5 prevalence inthe population aged 45–74 years of studies using IDMS-standardized creatinine, stratified by diabetic, hypertension,and obesity status. The variation in CKD stages 1–5 prevalencestratified by risk factors followed the pattern of the overalladjusted prevalence across regions. Supplemental Appendix 1,Figure 1, B–D, show this same pattern in the adult population,
separately for studies using IDMS- and non–IDMS-standardizedcreatinine.
CKD Stage 3–5 PrevalenceAdult PopulationSupplemental Appendix 1, Figure 3 shows the CKD stages 3–5prevalence including 95% CI for the adult population, sepa-rately for IDMS and non-IDMS studies. This CKD stages 3–5prevalence varied between 1.0% (95% CI, 0.7 to 1.3) in theItalian Malattie cardiovascolari ATerosclerotiche Istituto Su-periore di Sanita study and 5.9% (95% CI, 5.2 to 6.6) in theNortheast German SHIP study.
Supplemental Appendix 1, Table 2 shows the unadjustedand adjusted CKD stages 3–5 prevalence in the adult popula-tion, for both IDMS and non-IDMS studies. For studies us-ing non–IDMS-standardized creatinine, the unadjusted andadjusted CKD stages 3–5 prevalence in the adult population
Figure 1. Adjusted CKD stages 1–5 prevalence in the populationaged 45–74 years, in IDMS studies. Prevalence was age- and sex-adjusted to the EU27 population of 2005. The study names inuncolored regions are studies which used non–IDMS-standardizedcreatinine or studies which recruited subjects aged $50 years: theCKD prevalence results of these studies are shown in Supple-mental Appendix 1. 3C, Three City Study; ActiFE, Activity andFunction in the Elderly in Ulm study; EPIRCE, Estudio Epi-demiológico de la Insuficiencia Renal en España; HUNT, Nord-Trøndelag Health Study; INCIPE, Initiative on Nephropathy, ofrelevance to public health, which is Chronic, possibly in its Initialstages, and carries a Potential risk of major clinical Endpoints;LifeLines, LifeLines Cohort and Study Biobank; MRC, MedicalResearch Council trial of assessment and management of olderpeople in the community; PolSenior, Medical, psychological, so-ciological and economical aspects of aging of people in Poland;PREVEND, Prevention of Renal and Vascular End-stage Disease;SLAN, Survey of Lifestyle and Attitudes & Nutrition in Ireland.
J Am Soc Nephrol 27: 2135–2147, 2016 CKD Prevalence in Europe 2139
www.jasn.org CLINICAL EPIDEMIOLOGY
is graphically presented in Supplemental Appendix 1,Figure 3A.
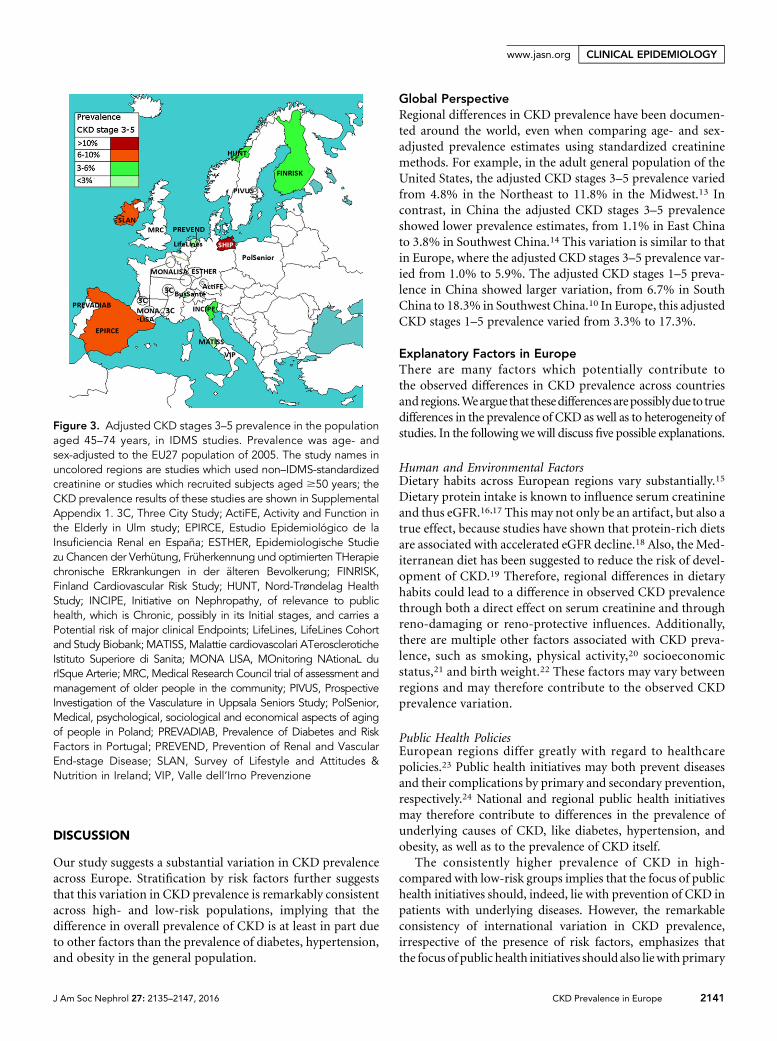
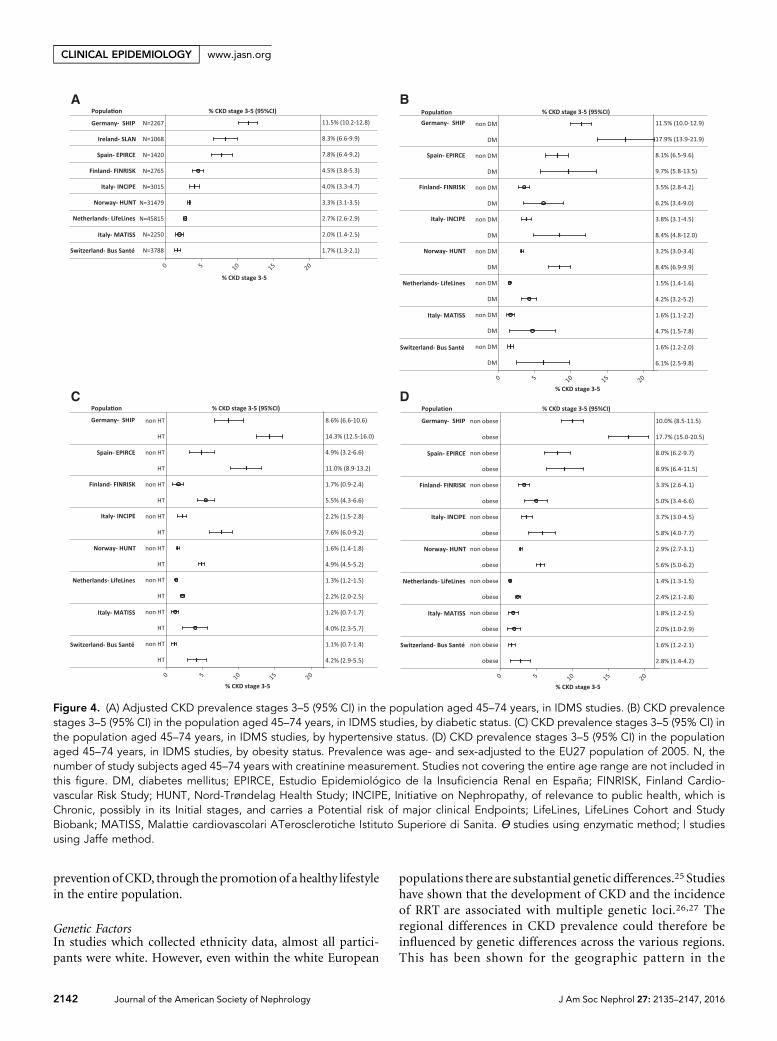
Across Age StrataFigure 3 shows the geographic variation of the adjusted CKDstages 3–5 prevalence in the population aged 45–74 years, forstudies using IDMS-standardized creatinine. Figure 4A showsthe overall adjusted CKD stages 3–5 prevalence in these stud-ies, including 95% CI. This CKD prevalence varied between1.7% (95% CI, 1.3 to 2.1) in the Swiss Bus Santé study and11.5% (95% CI, 10.2 to 12.8) in the Northeast German SHIPstudy.
The prevalence of CKD stages 3–5 for age categories 20–44years, 45–64 years, 65–74 years, and 75–84 years is shown inSupplemental Appendix 1, Figure 4, 1–4, separately for
studies using IDMS and non–IDMS-standardized creatinineassays. The CKD stages 3–5 prevalence was lowest in theyoungest age group and increased with every consecutiveage group.
Across Risk StrataFigure 4, B–D presents the CKD stages 3–5 prevalence inthe population aged 45–74 years of studies using IDMS-standardized creatinine, stratified by diabetic, hypertension,and obesity status. The variation in CKD stages 3–5 prevalencestratified by risk factor followed the pattern of the overall ad-justed prevalence across regions. Supplemental Appendix 1,Figure 3, B–D, show this same pattern in the adult population,separately for studies using IDMS- and non–IDMS-standardizedcreatinine.
Figure 2. (A) Adjusted CKD prevalence stages 1–5 (95% CI) in the population aged 45–74 years, in IDMS studies. (B) CKD prevalencestages 1–5 (95% CI) in the population aged 45–74 years, in IDMS studies, by diabetic status. (C) CKD prevalence stages 1–5 (95% CI) inthe population aged 45–74 years, in IDMS studies, by hypertensive status. (D) CKD prevalence stages 1–5 (95% CI) in the populationaged 45–74 years, in IDMS studies, by obesity status. Prevalence was age- and sex-adjusted to the EU27 population of 2005. N, thenumber of study subjects aged 45–74 years with creatinine and albuminuria measurement. Studies not covering the entire age rangeare not included in this figure. DM, diabetes mellitus; EPIRCE, Estudio Epidemiológico de la Insuficiencia Renal en España; HUNT,Nord-Trøndelag Health Study; HT, hypertension; INCIPE, Initiative on Nephropathy, of relevance to public health, which is Chronic,possibly in its Initial stages, and carries a Potential risk of major clinical Endpoints; LifeLines, LifeLines Cohort and Study Biobank; SLAN,Survey of Lifestyle and Attitudes & Nutrition in Ireland; Ɵ, studies using enzymatic method; | studies using Jaffe method.
2140 Journal of the American Society of Nephrology J Am Soc Nephrol 27: 2135–2147, 2016
CLINICAL EPIDEMIOLOGY www.jasn.org
DISCUSSION
Our study suggests a substantial variation in CKD prevalenceacross Europe. Stratification by risk factors further suggeststhat this variation in CKD prevalence is remarkably consistentacross high- and low-risk populations, implying that thedifference in overall prevalence of CKD is at least in part dueto other factors than the prevalence of diabetes, hypertension,and obesity in the general population.
Global PerspectiveRegional differences in CKD prevalence have been documen-ted around the world, even when comparing age- and sex-adjusted prevalence estimates using standardized creatininemethods. For example, in the adult general population of theUnited States, the adjusted CKD stages 3–5 prevalence variedfrom 4.8% in the Northeast to 11.8% in the Midwest.13 Incontrast, in China the adjusted CKD stages 3–5 prevalenceshowed lower prevalence estimates, from 1.1% in East Chinato 3.8% in Southwest China.14 This variation is similar to thatin Europe, where the adjusted CKD stages 3–5 prevalence var-ied from 1.0% to 5.9%. The adjusted CKD stages 1–5 preva-lence in China showed larger variation, from 6.7% in SouthChina to 18.3% in Southwest China.10 In Europe, this adjustedCKD stages 1–5 prevalence varied from 3.3% to 17.3%.
Explanatory Factors in EuropeThere are many factors which potentially contribute tothe observed differences in CKD prevalence across countriesand regions.Weargue that thesedifferencesarepossiblyduetotruedifferences in the prevalence of CKD as well as to heterogeneity ofstudies. In the following wewill discuss five possible explanations.
Human and Environmental FactorsDietary habits across European regions vary substantially.15
Dietary protein intake is known to influence serum creatinineand thus eGFR.16,17 This may not only be an artifact, but also atrue effect, because studies have shown that protein-rich dietsare associated with accelerated eGFR decline.18 Also, the Med-iterranean diet has been suggested to reduce the risk of devel-opment of CKD.19 Therefore, regional differences in dietaryhabits could lead to a difference in observed CKD prevalencethrough both a direct effect on serum creatinine and throughreno-damaging or reno-protective influences. Additionally,there are multiple other factors associated with CKD preva-lence, such as smoking, physical activity,20 socioeconomicstatus,21 and birth weight.22 These factors may vary betweenregions and may therefore contribute to the observed CKDprevalence variation.
Public Health PoliciesEuropean regions differ greatly with regard to healthcarepolicies.23 Public health initiatives may both prevent diseasesand their complications by primary and secondary prevention,respectively.24 National and regional public health initiativesmay therefore contribute to differences in the prevalence ofunderlying causes of CKD, like diabetes, hypertension, andobesity, as well as to the prevalence of CKD itself.
The consistently higher prevalence of CKD in high-compared with low-risk groups implies that the focus of publichealth initiatives should, indeed, lie with prevention of CKD inpatients with underlying diseases. However, the remarkableconsistency of international variation in CKD prevalence,irrespective of the presence of risk factors, emphasizes thatthe focus of public health initiatives should also liewith primary
Figure 3. Adjusted CKD stages 3–5 prevalence in the populationaged 45–74 years, in IDMS studies. Prevalence was age- andsex-adjusted to the EU27 population of 2005. The study names inuncolored regions are studies which used non–IDMS-standardizedcreatinine or studies which recruited subjects aged $50 years; theCKD prevalence results of these studies are shown in SupplementalAppendix 1. 3C, Three City Study; ActiFE, Activity and Function inthe Elderly in Ulm study; EPIRCE, Estudio Epidemiológico de laInsuficiencia Renal en España; ESTHER, Epidemiologische Studiezu Chancen der Verhütung, Früherkennung und optimierten THerapiechronische ERkrankungen in der älteren Bevolkerung; FINRISK,Finland Cardiovascular Risk Study; HUNT, Nord-Trøndelag HealthStudy; INCIPE, Initiative on Nephropathy, of relevance to publichealth, which is Chronic, possibly in its Initial stages, and carries aPotential risk of major clinical Endpoints; LifeLines, LifeLines Cohortand Study Biobank; MATISS, Malattie cardiovascolari ATeroscleroticheIstituto Superiore di Sanita; MONA LISA, MOnitoring NAtionaL durISque Arterie; MRC, Medical Research Council trial of assessment andmanagement of older people in the community; PIVUS, ProspectiveInvestigation of the Vasculature in Uppsala Seniors Study; PolSenior,Medical, psychological, sociological and economical aspects of agingof people in Poland; PREVADIAB, Prevalence of Diabetes and RiskFactors in Portugal; PREVEND, Prevention of Renal and VascularEnd-stage Disease; SLAN, Survey of Lifestyle and Attitudes &Nutrition in Ireland; VIP, Valle dell’Irno Prevenzione
J Am Soc Nephrol 27: 2135–2147, 2016 CKD Prevalence in Europe 2141
www.jasn.org CLINICAL EPIDEMIOLOGY
preventionofCKD, through the promotion of a healthy lifestylein the entire population.
Genetic FactorsIn studies which collected ethnicity data, almost all partici-pants were white. However, even within the white European
populations there are substantial genetic differences.25 Studieshave shown that the development of CKD and the incidenceof RRT are associated with multiple genetic loci.26,27 Theregional differences in CKD prevalence could therefore beinfluenced by genetic differences across the various regions.This has been shown for the geographic pattern in the
Figure 4. (A) Adjusted CKD prevalence stages 3–5 (95% CI) in the population aged 45–74 years, in IDMS studies. (B) CKD prevalencestages 3–5 (95% CI) in the population aged 45–74 years, in IDMS studies, by diabetic status. (C) CKD prevalence stages 3–5 (95% CI) inthe population aged 45–74 years, in IDMS studies, by hypertensive status. (D) CKD prevalence stages 3–5 (95% CI) in the populationaged 45–74 years, in IDMS studies, by obesity status. Prevalence was age- and sex-adjusted to the EU27 population of 2005. N, thenumber of study subjects aged 45–74 years with creatinine measurement. Studies not covering the entire age range are not included inthis figure. DM, diabetes mellitus; EPIRCE, Estudio Epidemiológico de la Insuficiencia Renal en España; FINRISK, Finland Cardio-vascular Risk Study; HUNT, Nord-Trøndelag Health Study; INCIPE, Initiative on Nephropathy, of relevance to public health, which isChronic, possibly in its Initial stages, and carries a Potential risk of major clinical Endpoints; LifeLines, LifeLines Cohort and StudyBiobank; MATISS, Malattie cardiovascolari ATerosclerotiche Istituto Superiore di Sanita. Ɵ studies using enzymatic method; | studiesusing Jaffe method.
2142 Journal of the American Society of Nephrology J Am Soc Nephrol 27: 2135–2147, 2016
CLINICAL EPIDEMIOLOGY www.jasn.org
prevalence of RRT for IgA nephropathy.28 Because 7.1% ofall RRT is provided for hereditary nephropathies (EuropeanRenal Association–European Dialysis and Transplant Associ-ation Registry, unpublished data), it is to be expected thatsome of the variation in CKD prevalence is also due to geneticdifferences.
Heterogeneity in Laboratory MethodsIn addition to reflecting true differences inCKDprevalence, ourresults may also vary due to the heterogeneity of methodologyused to measure creatinine5 and albuminuria,29 including dif-ferences in assays but also in handling and storage conditions(e.g., duration as well as number of freeze and thaw cycles untilanalysis).29,30
Differences in creatinine assays will likely contribute to thevariation in CKD prevalence, as most Jaffe assays overestimateserum creatinine.5 The resulting bias may vary depending onthe creatinine concentration, specific assay, manufacturer, andcalibration material used.31,32 Fortunately, the IDMS calibra-tion standardization has reduced the bias and improved theinterlaboratory comparability.5,32 Despite the use of IDMSstandardization, some interlaboratory variability still ex-ists,31 being lowest in IDMS-standardized enzymatic assays.5
Notably, our study shows substantial differences in CKDstages 3–5 prevalence across studies using enzymatic IDMS-standardized assays. In these studies, the adjusted CKD stages3–5 prevalence in the age group 65–74 years varied from 4.8%in central Italy to 11.4% in Finland.
Moreover, CKD stages 1–5 prevalence may additionally beinfluenced by albuminuria assays.29 As recommended byKidneyDisease Improving Global Outcomes (KDIGO), urinary albu-min was measured by immunoassays in 91% of studies and weused urinary albumin-to-creatinine ratio for the definition ofCKD.1 Importantly, there is no standardization available to en-hance comparability of immunoassays across laboratories.29
Heterogeneity in Study PopulationsFinally, differences in prevalence may have resulted fromdifferences in population sample selections. As in the UnitedStates, CKD prevalence in Europemay have changed over time,and this might explain some of the observed differences.33
Nevertheless, we found both high and low CKD preva-lence in older and in more recent studies. For example,in studies performed in the period 2005–2010 using theIDMS-standardized Jaffe method, the adjusted CKD stages 3–5 prevalence in the age group 65–74 years ranged from 4.1%in Switzerland to 20.8% in South Germany. This suggests thatdifferences in time periods cannot fully explain the observeddifferences in CKD prevalence.
Although all studies were designed to be representative ofthe respective regional or national general population, theirsample selections varied substantially as outlined in Table 1.Sample selection methods influence the coverage of the pop-ulation investigated and influence the response, which bothinfluence the ultimate representativeness of the sample.34,35
We have checked the representativeness of the included studiesby comparing the age and sex distribution of the study pop-ulations to the relevant census data. Although overall the studypopulations appear to be representative for the age and sexdistribution of their target population, we cannot exclude aselection bias based on unmeasured factors, such as the pres-ence of (unmeasured) comorbidities.
Studies with high response are less likely to suffer fromnonresponse bias, yet the impact of nonresponse bias onrepresentativeness is not solely determined by the response.34
Even with low response a sample may be highly representativeby chance alone. To date, there is no validated method to mea-sure the influence of nonresponse bias on the representative-ness of study results.34,36 However, nonresponse analyses canprovide some insight into the likely direction of a possible non-response bias.34 All nonresponse analyses performed by theindividual studies suggested that recruited participants weresimilar or healthier in comparison to nonparticipants.7–11
This might have led to an underestimation of the true CKDprevalence in these studies.
Strengths and LimitationsThe new European CKDBurden Consortium enabled this firstlarge-scale study to describe CKD prevalence across Europe.The comparability of CKD prevalence across studies wasincreased by using the same definition based on one eGFRequation.Additionally, we only compared studies using IDMS-standardized creatinine to increase interlaboratory compara-bility of creatinine results. Moreover, the comparability ofstudy populations across European countries was enhanced byremoving the influence of differences in national age and sexdistributions through age and sex standardization to the EU27population.12 Finally, to avoid the influence of internationaldifferences in the prevalence of diabetes, hypertension, andobesity, we determined CKD prevalence in subgroups withand without these risk factors.
There are also limitations to this study. First, the prevalenceof CKD might have been slightly overestimated using singlecreatinine and albuminuria measurements. However, this willnot have influenced the variation of CKD prevalence acrossstudies, as all estimations will be equally affected. Ethnicitystatus was not included in the eGFR equation because this wasnot available for all studies, which might have led to a slightoverestimation of CKD prevalence in some studies. However,in studies which did collect ethnicity data, at least 96% werewhite; therefore, the expected impact on the overall prevalenceestimation is negligible. Other limitations relate to the hetero-geneity of included studies with regard to laboratory methodsand sample selection. This heterogeneitymight have influencedthe variation of CKD prevalence as discussed. The first may besolved by central measurement of serum creatinine and albu-minuria in a reference laboratory. The effect of response, how-ever, is inherent to population surveys and cannot be avoided.
In conclusion, this is the first study which carefully charac-terizes CKD prevalence across Europe. Our results suggest
J Am Soc Nephrol 27: 2135–2147, 2016 CKD Prevalence in Europe 2143
www.jasn.org CLINICAL EPIDEMIOLOGY
substantial variation in CKD prevalence across populationsamples in Europe. These differences are possibly due to truedifferences in the prevalence of CKD as well as to heterogeneityof the laboratory and sample selection methods. The effect ofthe variation in European regions with regard to human andenvironmental factors, public health policies, and genetics onCKD prevalence needs further investigation.
Our results may be used to guide future projections of theCKD burden in Europe and thereby help estimate the growingdemand for CKD services that the ageing populationwill likelycreate. Our results are also a first step inmonitoring the impactof strategies designed to reduce the burden of CKD in Europe.Thismonitoringmay assist themedical community and policymakers in the further development of these strategies.
CONCISE METHODS
Data CollectionStudy SelectionWe first systematically searched scientific publications, to identify
European studies with data on CKD prevalence in the general
population (details described in Supplemental Appendix 2).37 Addi-
tionally, the representatives of national kidney foundations, renal
registries, and expert nephrologists in 39 European countries were
asked to provide contact details for any relevant unpublished stud-
ies. Studies were included if they were designed to select a represen-
tative sample of the adult general population and CKD prevalence
could be calculated. Studies that ended recruitment prior to 1996
were excluded. Eligible studies were invited to participate in an on-
line questionnaire, assessing general study information (e.g., period
of participant inclusion), collected data, and regional healthcare
system characteristics. Answers regarding collected data and health-
care system characteristics are shown in Supplemental Appendix 2,
Tables 1 and 2, respectively. Finally, studies that agreed to contribute
data were sent a statistical analysis syntax to collect aggregated data.
All studies were approved by local ethical committees and all par-
ticipants gave consent.
All studies which contributed data were included in the Euro-
pean CKD Burden Consortium. The European CKD Burden Consor-
tium, including nephrologists and epidemiologists, was established
to characterize CKD prevalence and progression of CKD across
Europe.
Collected DataData were collected for the total study population and for subgroups
by age (#.65 years), sex, and by diabetes, hypertension, and obesity
(body mass index $30 kg/m2) status. For the continuous variables
age, systolic and diastolic blood pressure, body mass index, eGFR,
and urinary albumin-to-creatinine ratio, we collected the mean
(SD) and median (25th and 75th percentiles). In addition, we col-
lected the following factors known to influence kidney function: the
proportion of current smokers and individuals using angiotensin-
converting enzyme inhibitors and angiotensin receptor blockers.
Furthermore,we collected the laboratorymethods for themeasurement
of serum creatinine and detection of albuminuria. Serum
creatinine was measured by a Jaffe or enzymatic method, both of
which can be standardized to IDMS.32 Diabetes was defined as
self-reported diabetes and/or the use of glucose lowering medica-
tion. Hypertension was defined as a systolic blood pressure of
$140 mmHg, a diastolic blood pressure of $90 mmHg, or the use
of antihypertensive drugs.
Definition of CKD
1. CKD stages 1–5: eGFR,60 ml/min per 1.73 m2 calculated
by the CKD-Epidemiology Collaboration equation1,38 and/or
uACR$30 mg/g.
2. CKD stages 3–5: eGFR,60 ml/min per 1.73 m2 calculated by the
CKD-Epidemiology Collaboration equation.
These definitions were based on the KDIGO practice guideline.1 As
no studies repeated measurements after three months, the chronicity
criterion (symptoms $3 months) was not applied to the definition.
Statistical AnalysesNormally distributed variables are presented as means with SD, and
non-normally distributed data as medians with interquartile ranges.
Dichotomous data are given in percentages. The representativeness of
study populations was tested by comparing the age and sex distri-
bution of the study population to the distribution of the relevant
regional/national population using the chi-squared test. The preva-
lence of CKD stages 1–5 andCKD stages 3–5with 95%CI is presented
as unadjusted rates and weighted averages using the age and sex dis-
tribution of the 2005 EU27 population.12 To limit the influence of
random variation, this adjustment was only applied to studies with a
minimum of 100 participants per included age stratum. Conse-
quently, (sub)groups with insufficient numbers were excluded from
this adjustment. Additionally, we stratified study populations into the
following age groups: 45–74, 20–44, 45–64, 65–74, and 75–84 years,
and whenever possible adjusted for the effect of age within strata. The
age-stratified CKD prevalence is given for the overall study popula-
tion as well as by diabetic, hypertension, and obesity status.
ACKNOWLEDGMENTS
K.B. and V.S.S. were responsible for the literature cited. K.B., V.S.S.,
G.G., S.H., C.T., W.V.B., C.Z., C.W., and K.J.J. were responsible for
the study design. K.B., G.G., S.H., H.V., J.Ä., M.K., I.G., J.V., B.S., H.B.,
J.C., A.O.G., A.K.B., J.F., L.P., G.B., V.C., R.G., G.N., D.R., P.M.F., and
D.N. were responsible for data collection. K.B., V.S.S., G.G., S.H., H.V.,
J.Ä., M. K., I.G., J.V., B.S., H.B., J.C., S.R., C.T., A.O.G., A.K.B., J.F.,
L.P., G.B., V.C., W.V.B., C.Z., R.G., G.N., D.R., P.M.F., D.N., C.W.,
and K.J.J. were responsible for data interpretation and revision of
the manuscript. K.B., V.S.S., and K.J.J. were responsible for drafting
the first manuscript. K.B. was responsible for the creation of figures
and data analyses. All authors approved final submission of the
manuscript.
2144 Journal of the American Society of Nephrology J Am Soc Nephrol 27: 2135–2147, 2016
CLINICAL EPIDEMIOLOGY www.jasn.org
The research leading to these results has received funding from (1)
the European Community’s Seventh Framework Programme under
grant agreement number HEALTH-F2-2009-241544 (Systems Biology
towards Novel Chronic Kidney Disease Diagnosis and Treatment), and
(2) the European Renal Association–European Dialysis and Transplant
Association (ERA-EDTA) under the Quality European Studies initia-
tive. This article was written by K. Brück et al. on behalf of the ERA-
EDTA Registry which is an official body of the ERA-EDTA. The
Activity and Function in the Elderly in Ulm (ActiFE) study was funded
by grants from the German Ministry of Science, Research and Arts,
State of Baden-Wuerttemberg, Germany, as part of the Geriatric
Competence Center, Ulm University. The Survey of Lifestyle and
Attitudes & Nutrition in Ireland (SLAN) 2007 study was originally
funded by the Department of Health and Children. Work on this project
was also in part funded by the Irish Health Research Board, Health
Research Board (HRB) Grant file reference HRC/2007/13 HRB Centre
for Health & Diet Research. The Prevention of Renal and Vascular End-
stage Disease (PREVEND) study was funded by the Dutch Kidney
Foundation. The medical, psychologic, sociological and economical
aspects of aging of people in Poland study (PolSenior; project no. PBZ-
MEIN-9/2/2006) was funded by Polish Ministry of Science and Higher
Education. The Prevalence of Diabetes and Risk Factors in Portugal
(PREVADIAB) study was funded by the Portuguese Ministry of Health.
The following institutions and investigators participated in this
study: Pekka Jousilahti (FinlandCardiovascular Risk Study); Catherine
Helmer, Marie Metzger (Three City); Jean Bernard Ruidavets, Vanina
Bongard (Monitoring National du Risque Arteriel); Wolfgang Koenig,
Michael D. Denkinger (ActiFE); Ben Schöttker, Kai-Uwe Saum
(Epidemiologische Studie zuChancen derVerhütung, Früherkennung
und optimierten Therapie chronische Erkrankungen in der älteren
Bevolkerung); Matthias Nauck, Sylvia Stracke (Study of Health in
Pomeranzia); Ivan J. Perry, Joseph Eustace (SLAN); Antonio Lupo
(Initiative on Nephropathy, of relevance to public health, which is
Chronic, possibly in its Initial stages, and carries a Potential risk of
major clinical Endpoints); Chiara Donfrancesco, Simonetta Palleschi
(Malattie cardiovascolari ATerosclerotiche Istituto Superiore di Sanita);
Norman Lamaida, Ernesto Capuano (Valle dell’Irno Prevenzione);
Steef Sinkeler, B.H.R. Wolffenbuttel (LifeLines); Stephan J.L. Bakker,
Michel Joosten (PREVEND); Knut Aasarød, Jostein Holmen (Nord-
Trøndelag Health Study); Malgorzata Mossakowska, Andrzej Wiecek
(PolSenior); Luis Gardete-Correia, João F. Raposo (PREVADIAB);
A.L. Martin de Francisco, P. Gayoso Diz (Estudio Epidemiológico de
la Insuficiencia Renal en España); Elisabet Nerpin, Lars Lind
(Prospective Investigation of the Vasculature in Uppsala Seniors
Study); Murielle Bochud, Jean-Michel Gaspoz (Bus Santé); Astrid
Fletcher, Paul Roderick (Medical Research Council Trial of As-
sessment and Management of Older People in the Community);
Gijs Van Pottelbergh (Belgian cohort of the very elderly + Intego
Project); Arjan Van Der Tol (Unreferred Renal Insufficiency
Study); Samy Hadjadj (Survie, Diabete de type 2 et Genetique); Olivera
Stojceva-Taneva (Screening for Early Detection of Kidney Disease).
DISCLOSURESNone.
REFERENCES
1. Kidney Disease; Improving Global Outcomes (KDIGO) CKD WorkGroup: KDIGO 2012 Clinical Practice Guideline for the Evaluation andManagement of Chronic Kidney Disease. Kidney Int Suppl 3: 1–150,2013
2. Gansevoort RT, Correa-Rotter R, Hemmelgarn BR, Jafar TH, HeerspinkHJ, Mann JF, Matsushita K, Wen CP: Chronic kidney disease and car-diovascular risk: epidemiology, mechanisms, and prevention. Lancet382: 339–352, 2013
3. Coresh J, Selvin E, Stevens LA, Manzi J, Kusek JW, Eggers P, Van LenteF, Levey AS: Prevalence of chronic kidney disease in the United States.JAMA 298: 2038–2047, 2007
4. McCullough K, Sharma P, Ali T, Khan I, Smith WC, MacLeod A, Black C:Measuring the population burden of chronic kidney disease: a sys-tematic literature review of the estimated prevalence of impaired kid-ney function. Nephrol Dial Transplant 27: 1812–1821, 2012
5. Drion I, Cobbaert C, Groenier KH, Weykamp C, Bilo HJ, Wetzels JF,Kleefstra N: Clinical evaluation of analytical variations in serum creati-ninemeasurements: why laboratories should abandon Jaffe techniques.BMC Nephrol 13: 133, 2012
6. Cheuiche AV, Soares AA, Camargo EG, Weinert LS, Camargo JL,Silveiro SP: Comparison between IDMS-traceable Jaffe and enzymaticcreatinine assays for estimation of glomerular filtration rate by the CKD-EPI equation in healthy and diabetic subjects. Clin Biochem 46: 1423–1429, 2013
7. Holmen J, Midthjell K, Krüger O, Langhammer A, Holmen TL, BratbergGH, Vatten L, Lund-Larsen PG: The Nord-Trøndelag Health Study1995-97 (HUNT 2): Objectives, contents, methods and participation.Norsk Epidemiologi 13: 19–32, 2002
8. Nerpin E, Ingelsson E, Risérus U, Helmersson-Karlqvist J, Sundström J,Jobs E, Larsson A, Lind L, Ärnlöv J: Association between glomerularfiltration rate and endothelial function in an elderly community cohort.Atherosclerosis 224: 242–246, 2012
9. Guessous I, Bochud M, Theler JM, Gaspoz JM, Pechère-Bertschi A:1999-2009 Trends in prevalence, unawareness, treatment and controlof hypertension in Geneva, Switzerland. PLoS One 7: e39877, 2012
10. Nitsch D, Nonyane BA, Smeeth L, Bulpitt CJ, Roderick PJ, Fletcher A:CKD and hospitalization in the elderly: a community-based cohortstudy in the United Kingdom. Am J Kidney Dis 57: 664–672, 2011
11. Dallmeier D, Klenk J, Peter RS, Denkinger M, Peter R, Rapp K, KoenigW, Rothenbacher D: A prospective assessment of cardiac biomarkersfor hemodynamic stress and necrosis and the risk of falls among olderpeople: the ActiFE study. Eur J Epidemiol 2015, in press
12. Eurostat: Table: Average population by sex and five-year age groups,2009. Available at: http://ec.europa.eu/eurostat/data/database. Ac-cessed July 15, 2009
13. Tanner RM, Gutiérrez OM, Judd S,McClellanW, Bowling CB, BradburyBD, Safford MM, Cushman M, Warnock D, Muntner P: Geographicvariation in CKD prevalence and ESRD incidence in the United States:results from the reasons for geographic and racial differences in stroke(REGARDS) study. Am J Kidney Dis 61: 395–403, 2013
14. Zhang L,Wang F,Wang L,WangW, Liu B, Liu J, ChenM, HeQ, Liao Y,Yu X, Chen N, Zhang JE, Hu Z, Liu F, Hong D, Ma L, Liu H, Zhou X,Chen J, Pan L, Chen W, Wang W, Li X, Wang H: Prevalence of chronickidney disease in China: a cross-sectional survey. Lancet 379: 815–822, 2012
15. Nöthlings U, Boeing H, Maskarinec G, Sluik D, Teucher B, Kaaks R,Tjønneland A, Halkjaer J, Dethlefsen C, Overvad K, Amiano P, ToledoE, Bendinelli B, Grioni S, Tumino R, Sacerdote C, Mattiello A, BeulensJW, Iestra JA, Spijkerman AM, van der A DL, Nilsson P, Sonestedt E,Rolandsson O, Franks PW, Vergnaud AC, Romaguera D, Norat T,Kolonel LN: Food intake of individuals with andwithout diabetes acrossdifferent countries and ethnic groups. Eur J Clin Nutr 65: 635–641,2011
J Am Soc Nephrol 27: 2135–2147, 2016 CKD Prevalence in Europe 2145
www.jasn.org CLINICAL EPIDEMIOLOGY
16. Jha V,Garcia-GarciaG, Iseki K, Li Z, Naicker S, Plattner B, Saran R,WangAY, Yang CW: Chronic kidney disease: global dimension and per-spectives. Lancet 382: 260–272, 2013
17. Jacobsen FK, Christensen CK, Mogensen CE, Andreasen F, HeilskovNS: Pronounced increase in serum creatinine concentration after eatingcooked meat. BMJ 1: 1049–1050, 1979
18. Friedman AN: High-protein diets: potential effects on the kidney inrenal health and disease. Am J Kidney Dis 44: 950–962, 2004
19. Chrysohoou C, Panagiotakos DB, Pitsavos C, Skoumas J, Zeimbekis A,Kastorini CM, Stefanadis C: Adherence to the Mediterranean diet isassociatedwith renal function among healthy adults: the ATTICA study.J Ren Nutr 20: 176–184, 2010
20. Stengel B, Tarver-Carr ME, Powe NR, Eberhardt MS, Brancati FL: Life-style factors, obesity and the risk of chronic kidney disease. Epidemi-ology 14: 479–487, 2003
21. Vart P, Gansevoort RT, Coresh J, Reijneveld SA, Bültmann U: Socio-economic measures and CKD in the United States and The Nether-lands. Clin J Am Soc Nephrol 8: 1685–1693, 2013
22. Silverwood RJ, PierceM, Hardy R, Sattar N,Whincup P, Ferro C, SavageC, Kuh D, Nitsch D: Low birth weight, later renal function, and the rolesof adulthood blood pressure, diabetes, and obesity in a British birthcohort. Kidney Int 84: 1262–1270, 2013
23. Mackenbach JP, Karanikolos M, McKee M: The unequal health of Euro-peans: successes and failures of policies. Lancet 381: 1125–1134, 2013
24. Unal B, Critchley JA, Capewell S: Modelling the decline in coronaryheart disease deaths in England and Wales, 1981-2000: comparingcontributions from primary prevention and secondary prevention. BMJ331: 614, 2005
25. Moskvina V, Smith M, Ivanov D, Blackwood D, StClair D, Hultman C,Toncheva D, Gill M, Corvin A, O’Dushlaine C, Morris DW, Wray NR,Sullivan P, Pato C, Pato MT, Sklar P, Purcell S, Holmans P, O’DonovanMC, Owen MJ, Kirov G; International Schizophrenia Consortium: Ge-netic differences between five European populations. Hum Hered 70:141–149, 2010
26. Böger CA, Gorski M, Li M, HoffmannMM, Huang C, YangQ, Teumer A,Krane V, O’Seaghdha CM, Kutalik Z, Wichmann HE, Haak T, Boes E,Coassin S, Coresh J, Kollerits B, HaunM, Paulweber B, Köttgen A, Li G,Shlipak MG, Powe N, Hwang SJ, Dehghan A, Rivadeneira F,Uitterlinden A, Hofman A, Beckmann JS, Krämer BK, Witteman J,BochudM, Siscovick D, Rettig R, Kronenberg F, Wanner C, Thadhani RI,Heid IM, Fox CS, Kao WH; CKDGen Consortium: Association of eGFR-Related Loci Identified by GWAS with Incident CKD and ESRD. PLoSGenet 7: e1002292, 2011
27. Köttgen A, Glazer NL, Dehghan A, Hwang SJ, Katz R, Li M, Yang Q,Gudnason V, Launer LJ, Harris TB, Smith AV, Arking DE, Astor BC,Boerwinkle E, Ehret GB, Ruczinski I, Scharpf RB, Chen YD, de Boer IH,Haritunians T, Lumley T, Sarnak M, Siscovick D, Benjamin EJ, Levy D,Upadhyay A, Aulchenko YS, Hofman A, Rivadeneira F, Uitterlinden AG,van Duijn CM, Chasman DI, Paré G, Ridker PM, KaoWH, Witteman JC,Coresh J, Shlipak MG, Fox CS: Multiple loci associated with indices ofrenal function and chronic kidney disease. Nat Genet 41: 712–717,2009
28. Kiryluk K, Li Y, Sanna-Cherchi S, Rohanizadegan M, Suzuki H, Eitner F,Snyder HJ, Choi M, Hou P, Scolari F, Izzi C, Gigante M, Gesualdo L,Savoldi S, Amoroso A, Cusi D, Zamboli P, Julian BA, Novak J, Wyatt RJ,Mucha K, Perola M, Kristiansson K, Viktorin A, Magnusson PK,
Thorleifsson G, Thorsteinsdottir U, Stefansson K, Boland A, Metzger M,Thibaudin L, Wanner C, Jager KJ, Goto S, Maixnerova D, Karnib HH,Nagy J, Panzer U, Xie J, Chen N, Tesar V, Narita I, Berthoux F, Floege J,Stengel B, Zhang H, Lifton RP, Gharavi AG: Geographic differences ingenetic susceptibility to IgA nephropathy: GWAS replication study andgeospatial risk analysis. PLoS Genet 8: e1002765, 2012
29. Bachmann LM,NilssonG, Bruns DE,McQueenMJ, Lieske JC, ZakowskiJJ, Miller WG: State of the art for measurement of urine albumin:comparison of routine measurement procedures to isotope dilutiontandem mass spectrometry. Clin Chem 60: 471–480, 2014
30. Cuhadar S, Koseoglu M, Atay A, Dirican A: The effect of storage timeand freeze-thaw cycles on the stability of serum samples. BiochemMed(Zagreb) 23: 70–77, 2013
31. Delanaye P, Cavalier E, Cristol JP, Delanghe JR: Calibration and pre-cision of serum creatinine and plasma cystatin C measurement: impacton the estimation of glomerular filtration rate. J Nephrol 27: 467–475,2014
32. Myers GL, Miller WG, Coresh J, Fleming J, Greenberg N, Greene T,Hostetter T, Levey AS, Panteghini M, Welch M, Eckfeldt JH; NationalKidney Disease Education Program Laboratory Working Group: Rec-ommendations for improving serum creatinine measurement: a reportfrom the Laboratory Working Group of the National Kidney DiseaseEducation Program. Clin Chem 52: 5–18, 2006
33. Sayday S, Eberhardt M, Rios-Burrows N, Williams D, Geiss L, Dorsey R:Prevalence of CKD and associated risk factors – United States 1999–2004. MMWR Morbid Mortal Wkly Rep, 56: 161–165, 2007
34. Groves R, Fowler F, Couper M, Lepkowski J, Singer E, Tourangeau R:Survey Methodology, 2nd Ed., Hoboken, New Jersey, Wiley, 2009
35. Tripepi G, Jager KJ, Dekker FW, Zoccali C: Selection bias and in-formation bias in clinical research. Nephron Clin Pract 115: c94–c99,2010
36. Halbesleben JR, Whitman MV: Evaluating survey quality in health ser-vices research: a decision framework for assessing nonresponse bias.Health Serv Res 48: 913–930, 2013
37. BrückK, JagerKJ,Dounousi E, KainzA,NitschD,Ärnlöv J, RothenbacherD, BrowneG,CapuanoV, Ferraro PM, Ferrieres J,GambaroG,GuessousI, Hallan S, KastarinenM,NavisG, Gonzalez AO, Palmieri L, RomundstadS, Spoto B, Stengel B, Tomson C, Tripepi G, Völzke H, Wiȩcek A,Gansevoort R, Schöttker B,Wanner C, Vinhas J, Zoccali C, Van BiesenW,Stel VS; European CKD Burden Consortium: Methodology used instudies reporting chronic kidney disease prevalence: a systematicliterature review. Nephrol Dial Transplant 30[Suppl 4]: iv6–iv16,2015
38. Levey AS, Stevens LA, Schmid CH, Zhang YL, Castro AF 3rd, FeldmanHI, Kusek JW, Eggers P, Van Lente F, Greene T, Coresh J; CKD-EPI(Chronic Kidney Disease Epidemiology Collaboration): A new equationto estimate glomerular filtration rate. Ann Intern Med 150: 604–612,2009
See related editorial, “Unlocking the Value of Variation in CKD Prevalence,” onpages 1874–1877.
This article contains supplemental material online at http://jasn.asnjournals.org/lookup/suppl/doi:10.1681/ASN.2015050542/-/DCSupplemental.
AFFILIATIONS
*European Renal Association–European Dialysis and Transplant Association Registry, Department of Medical Informatics, Amsterdam MedicalCenter, Amsterdam, The Netherlands; †Division of Nephrology and Dialysis, Columbus-Gemelli University Hospital, Catholic University of theSacred Heart, Rome, Italy; ‡Department of Nephrology, St. Olav’s Hospital/Faculty of Medicine, The Norwegian University of Science and
2146 Journal of the American Society of Nephrology J Am Soc Nephrol 27: 2135–2147, 2016
CLINICAL EPIDEMIOLOGY www.jasn.org
Technology, Trondheim, Norway; §Department of Clinical Epidemiology research, University Medicine Greifswald, Greifswald, Germany;ǁDepartment of Medical Sciences/Molecular Epidemiology, Uppsala University, Uppsala, Sweden; ¶Finnish Medicines Agency, Department ofInternal Medicine and Nephrology, Kuopio/National Institute for Health and Welfare, Helsinki, Finland; **Department of CommunityMedicine, Primary Care and Emergency medicine, Geneva University Hospital, Geneva, Switzerland; ††Department of Medicine, SetubalHospital Centre, Setubal, Portugal; ‡‡Research Centre in Epidemiology and Population Health, INSERM Unit 1018, Villejuif, France; §§Divisionof Clinical Epidemiology and Aging Research, German Cancer Research Center/Network Aging Research, University of Heidelberg,Heidelberg, Germany; ǁǁDepartment of Pathophysiology, Medical Faculty/Department of Nephrology Endocrinology and Metabolic Diseases,Medical University of Silesia, Katowice, Poland; ¶¶Department of Nephrology, Levanger Hospital, Health Trust Nord-Trøndelag/TheNorwegian University of Science and Technology, Norway; ***Department of Nephrology, Freeman Hospital, Newcastle upon Tyne, UK;†††Department of Nephrology, University Hospital of Orense, Orense, Spain; ‡‡‡Department of Medicine, University of Alberta, Edmonton,Canada; §§§Department of Cardiology, Toulouse University School of Medicine, Rangueil Hospital, Toulouse, France; ǁǁǁDepartment ofEpidemiology of Cerebro and Cardiovascular Diseases, Istituto Superiore di Sanità, Rome, Italy; ¶¶¶Department of Epidemiology & PublicHealth, University College Cork & Mercy University Hospital, Cork, Ireland; ****Unità Operativa di Cardiologia ed UTIC, Mercato S. SeverinoHospital, Salerno, Italy; ††††Department of Nephrology, Ghent University Hospital, Ghent, Belgium; ‡‡‡‡Consiglio Nazionale delle Ricerche-Istituto di Fisiologia Clinica, Clinical Epidemiology and Pathophysiology of Renal Diseases and Hypertension, Reggio Calabria, Italy;§§§§Department of Nephrology/Graduate School of Medical Sciences and ǁǁǁǁDivision of Nephrology, Department of Internal Medicine,University Medical Center Groningen, Groningen, The Netherlands; ¶¶¶¶Institute of Epidemiology and Medical Biometry, Ulm University, Ulm,Germany; *****Department of Non-Communicable Disease Epidemiology, London School of Hygiene & Tropical Medicine and UniversityCollege London, Centre for Nephrology, London, United Kingdom; and †††††Department of Nephrology, University Hospital Würzburg,Würzburg, Germany
J Am Soc Nephrol 27: 2135–2147, 2016 CKD Prevalence in Europe 2147
www.jasn.org CLINICAL EPIDEMIOLOGY