Embed Size (px)
Citation preview
City of Westminster
A Study of Small Offices in Westminster
June 2008
APPENDICES
DTZ Research
48 Warwick Street
London
W1B 5NL
This report has been produced by DTZ Research in commission of Westminster City Council.
2
Contents
1. The size and characterisitics of the small office market in Westminster...................................3
2. The character of small office occupiers and main business clusters.......................................11
3. Westminster availability and take-up........................................................................................25
4. How small offices provide accomodation for established and start-up companies..................34
5. Demand – employment structures and displacement..............................................................38
6. Westminster Council Policy Com 4..........................................................................................42
7. DTZ Research all small office and industry cluster maps………........……….......…................45
8. Westminster Council‟s small office losses and gains maps.....................................................67
9. „Geoplan‟ Westminster postcode sector map...........................................................................71
Select Bibliography...................................................................................................................73

3
APPENDIX 1
THE SIZE AND CHARACTERISTICS OF THE SMALL OFFICE MARKET IN WESTMINSTER
4
APPENDIX 1: THE SIZE AND CHARACTERISTICS OF THE SMALL OFFICE MARKET IN
WESTMINSTER
1.01 This study has sought to analyse the number and locations of small offices within Westminster
and has made several observations on size, age and type characteristics.
1.02 Comprehensive details of the occupiers of these small offices are held on only 45% of the
total small office figure. The rest of the total is made up as follows:
The occupiers of 22% of the offices are not monitored by the utilised sources as the small
office floorspace is less than 93 sq m. With a few exceptions, the details of occupiers of
offices under 93 sq m in size are not included.
3% of the total is listed as being available small offices and therefore occupier details are
not known.
23% of the total is derived from information from the VOA which does not include
comprehensive details of the occupiers.
3% are categorised by the sources as offices (of all sizes between 0-250 sq m) which are
multi-tenanted offices, with no information provided on the occupier of each of these
offices.
3% of all small offices are categorised as „Undisclosed Occupier‟ or „Undisclosed Letting‟
where the sources utilised do not provide the details of the occupier.
1% of the small office total is made up of buildings between 0-1000 sq m which are listed
as being multi-tenanted. When compiling this section of the database, a cut-off size of
1000 sq m was implemented; the theory being that multi-tenanted buildings of this size
would have at least four separate offices and would thus house offices of 250 sq m and
under.
1.03 Data limitations on the smaller buildings has in some cases precluded identification of how
many office occupiers there are in these smaller buildings (some are not monitored). Whilst
this anomaly will not affect our assessment of Westminster small offices by floorspace, it does
affect them by number. By way of example, of the 432 „Entire Building‟ entries, only 234 of
them provide occupier details. The rest of the entries are either deemed too small to monitor
or are categorised as „Multi-Tenanted‟.
1.04 In terms of the quality of the stock housing small offices, an assessment has been made using
the age of the building and the overwhelming majority is deemed „poor second hand‟ stock.
This comprises stock which is more than 10 years old and lacking modern office specification,
such as air-conditioning, raised floors, etc. This appeals to common sense; that on the whole
small space is cheaper space, and thus likely to be in poorer condition than average.
Furthermore, for those offices where information is available, at the time of leasing, the over
whelming majority of the stock was also deemed poor second hand stock. Only 5.7% of small
office stock is leased as „new‟, 24% is „good second hand stock‟ and the majority 70% is „poor
second hand‟.
1.05 77%, or 5,394 of the total number of small offices in the master database have information
containing the age of the building housing the small offices. Although not complete, this
percentage is enough from which to draw conclusions. It is interesting to note that 800 of the
offices, or just over 119,000 sq m/1.3 million sq ft are buildings which have been refurbished -
11.5% of total small office stock. This would further underline the point that the majority of
small office space can be classified as „poor second hand‟, and suggests that the rise of
5
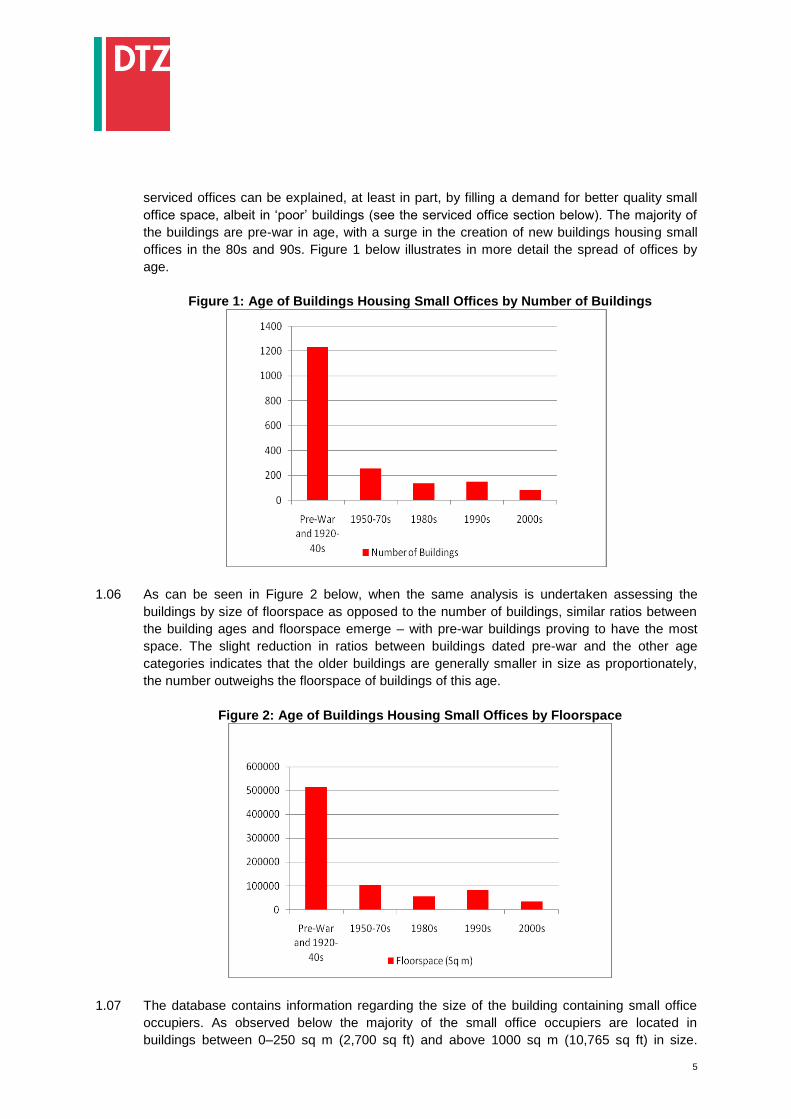
serviced offices can be explained, at least in part, by filling a demand for better quality small
office space, albeit in „poor‟ buildings (see the serviced office section below). The majority of
the buildings are pre-war in age, with a surge in the creation of new buildings housing small
offices in the 80s and 90s. Figure 1 below illustrates in more detail the spread of offices by
age.
Figure 1: Age of Buildings Housing Small Offices by Number of Buildings
1.06 As can be seen in Figure 2 below, when the same analysis is undertaken assessing the
buildings by size of floorspace as opposed to the number of buildings, similar ratios between
the building ages and floorspace emerge – with pre-war buildings proving to have the most
space. The slight reduction in ratios between buildings dated pre-war and the other age
categories indicates that the older buildings are generally smaller in size as proportionately,
the number outweighs the floorspace of buildings of this age.
Figure 2: Age of Buildings Housing Small Offices by Floorspace
1.07 The database contains information regarding the size of the building containing small office
occupiers. As observed below the majority of the small office occupiers are located in
buildings between 0–250 sq m (2,700 sq ft) and above 1000 sq m (10,765 sq ft) in size.
6
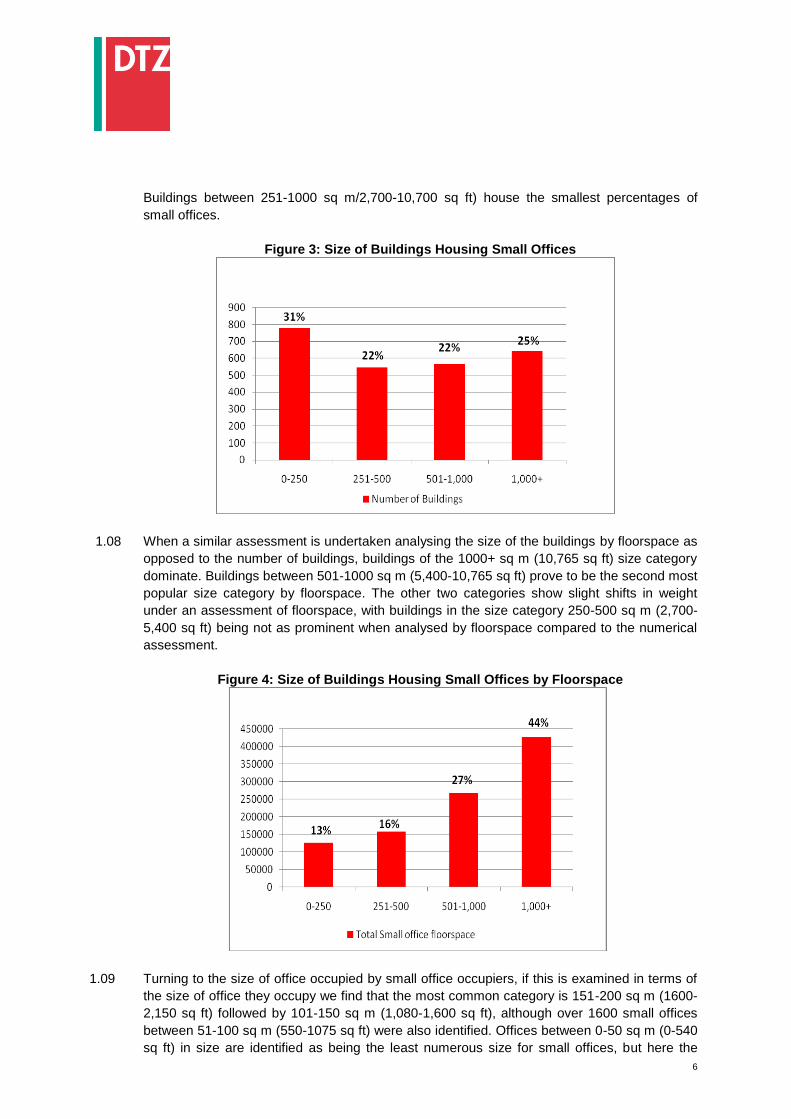
Buildings between 251-1000 sq m/2,700-10,700 sq ft) house the smallest percentages of
small offices.
Figure 3: Size of Buildings Housing Small Offices
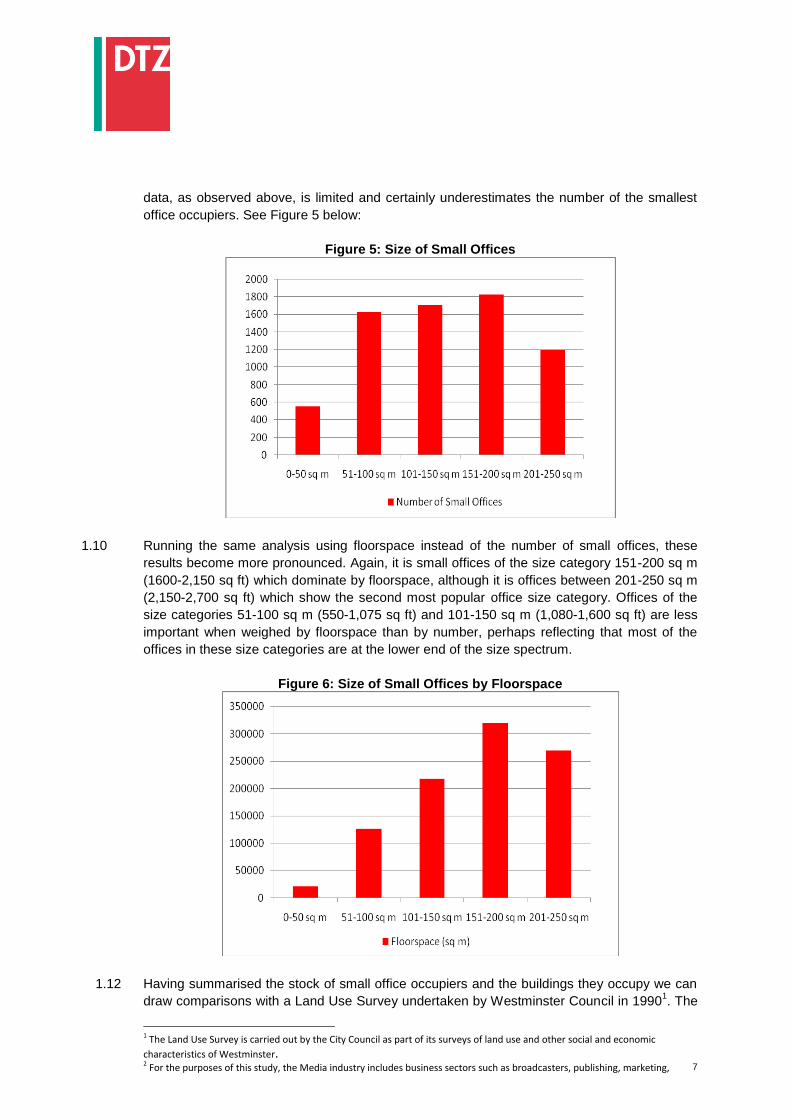
1.08 When a similar assessment is undertaken analysing the size of the buildings by floorspace as
opposed to the number of buildings, buildings of the 1000+ sq m (10,765 sq ft) size category
dominate. Buildings between 501-1000 sq m (5,400-10,765 sq ft) prove to be the second most
popular size category by floorspace. The other two categories show slight shifts in weight
under an assessment of floorspace, with buildings in the size category 250-500 sq m (2,700-
5,400 sq ft) being not as prominent when analysed by floorspace compared to the numerical
assessment.
Figure 4: Size of Buildings Housing Small Offices by Floorspace
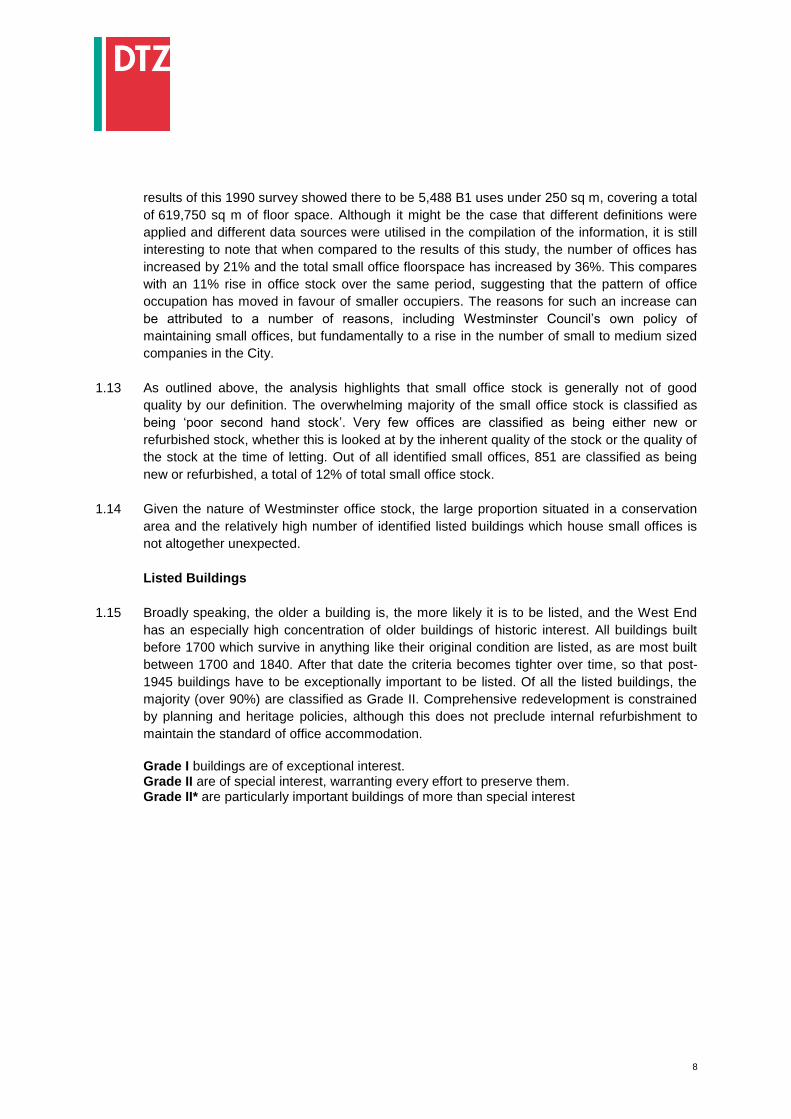
1.09 Turning to the size of office occupied by small office occupiers, if this is examined in terms of
the size of office they occupy we find that the most common category is 151-200 sq m (1600-
2,150 sq ft) followed by 101-150 sq m (1,080-1,600 sq ft), although over 1600 small offices
between 51-100 sq m (550-1075 sq ft) were also identified. Offices between 0-50 sq m (0-540
sq ft) in size are identified as being the least numerous size for small offices, but here the
7
data, as observed above, is limited and certainly underestimates the number of the smallest
office occupiers. See Figure 5 below:
Figure 5: Size of Small Offices
1.10 Running the same analysis using floorspace instead of the number of small offices, these
results become more pronounced. Again, it is small offices of the size category 151-200 sq m
(1600-2,150 sq ft) which dominate by floorspace, although it is offices between 201-250 sq m
(2,150-2,700 sq ft) which show the second most popular office size category. Offices of the
size categories 51-100 sq m (550-1,075 sq ft) and 101-150 sq m (1,080-1,600 sq ft) are less
important when weighed by floorspace than by number, perhaps reflecting that most of the
offices in these size categories are at the lower end of the size spectrum.
Figure 6: Size of Small Offices by Floorspace
1.12 Having summarised the stock of small office occupiers and the buildings they occupy we can
draw comparisons with a Land Use Survey undertaken by Westminster Council in 19901. The
1 The Land Use Survey is carried out by the City Council as part of its surveys of land use and other social and economic
characteristics of Westminster. 2 For the purposes of this study, the Media industry includes business sectors such as broadcasters, publishing, marketing,
8
results of this 1990 survey showed there to be 5,488 B1 uses under 250 sq m, covering a total
of 619,750 sq m of floor space. Although it might be the case that different definitions were
applied and different data sources were utilised in the compilation of the information, it is still
interesting to note that when compared to the results of this study, the number of offices has
increased by 21% and the total small office floorspace has increased by 36%. This compares
with an 11% rise in office stock over the same period, suggesting that the pattern of office
occupation has moved in favour of smaller occupiers. The reasons for such an increase can
be attributed to a number of reasons, including Westminster Council‟s own policy of
maintaining small offices, but fundamentally to a rise in the number of small to medium sized
companies in the City.
1.13 As outlined above, the analysis highlights that small office stock is generally not of good
quality by our definition. The overwhelming majority of the small office stock is classified as
being „poor second hand stock‟. Very few offices are classified as being either new or
refurbished stock, whether this is looked at by the inherent quality of the stock or the quality of
the stock at the time of letting. Out of all identified small offices, 851 are classified as being
new or refurbished, a total of 12% of total small office stock.
1.14 Given the nature of Westminster office stock, the large proportion situated in a conservation
area and the relatively high number of identified listed buildings which house small offices is
not altogether unexpected.
Listed Buildings
1.15 Broadly speaking, the older a building is, the more likely it is to be listed, and the West End
has an especially high concentration of older buildings of historic interest. All buildings built
before 1700 which survive in anything like their original condition are listed, as are most built
between 1700 and 1840. After that date the criteria becomes tighter over time, so that post-
1945 buildings have to be exceptionally important to be listed. Of all the listed buildings, the
majority (over 90%) are classified as Grade II. Comprehensive redevelopment is constrained
by planning and heritage policies, although this does not preclude internal refurbishment to
maintain the standard of office accommodation.
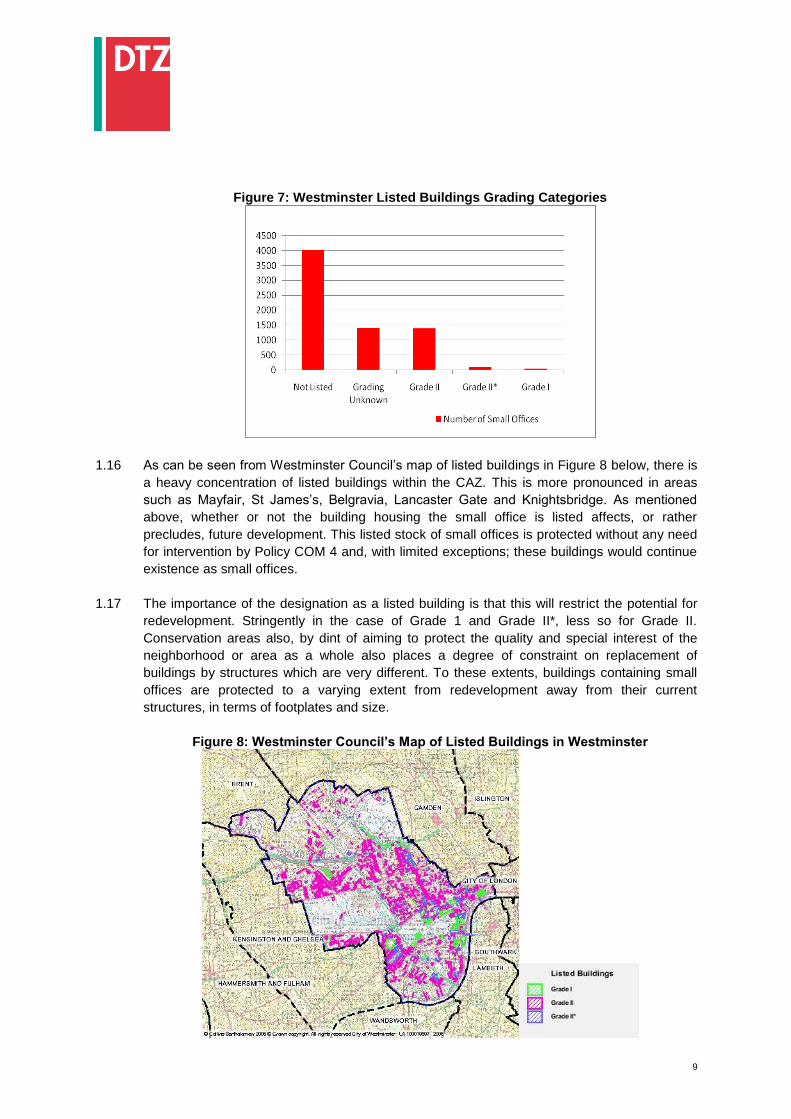
Grade I buildings are of exceptional interest. Grade II are of special interest, warranting every effort to preserve them. Grade II* are particularly important buildings of more than special interest
9
Figure 7: Westminster Listed Buildings Grading Categories
1.16 As can be seen from Westminster Council‟s map of listed buildings in Figure 8 below, there is
a heavy concentration of listed buildings within the CAZ. This is more pronounced in areas
such as Mayfair, St James‟s, Belgravia, Lancaster Gate and Knightsbridge. As mentioned
above, whether or not the building housing the small office is listed affects, or rather
precludes, future development. This listed stock of small offices is protected without any need
for intervention by Policy COM 4 and, with limited exceptions; these buildings would continue
existence as small offices.
1.17 The importance of the designation as a listed building is that this will restrict the potential for
redevelopment. Stringently in the case of Grade 1 and Grade II*, less so for Grade II.
Conservation areas also, by dint of aiming to protect the quality and special interest of the
neighborhood or area as a whole also places a degree of constraint on replacement of
buildings by structures which are very different. To these extents, buildings containing small
offices are protected to a varying extent from redevelopment away from their current
structures, in terms of footplates and size.
Figure 8: Westminster Council’s Map of Listed Buildings in Westminster
10
Conservation Areas
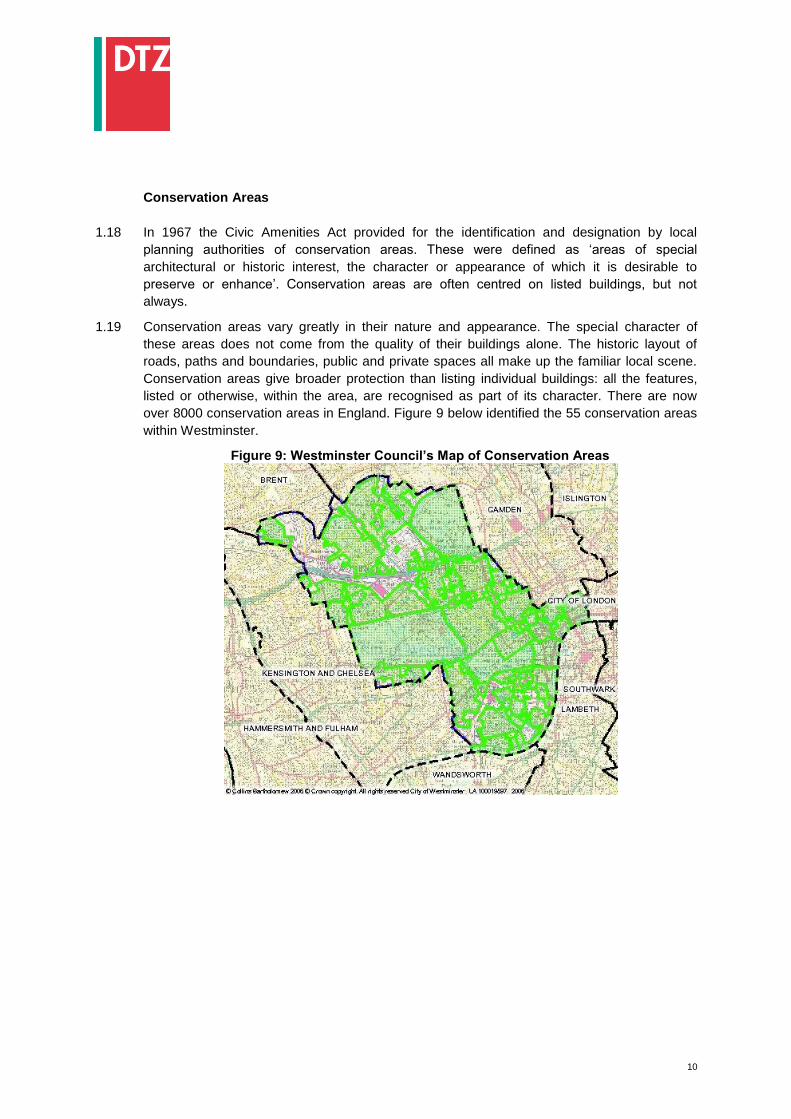
1.18 In 1967 the Civic Amenities Act provided for the identification and designation by local
planning authorities of conservation areas. These were defined as „areas of special
architectural or historic interest, the character or appearance of which it is desirable to
preserve or enhance‟. Conservation areas are often centred on listed buildings, but not
always.
1.19 Conservation areas vary greatly in their nature and appearance. The special character of
these areas does not come from the quality of their buildings alone. The historic layout of
roads, paths and boundaries, public and private spaces all make up the familiar local scene.
Conservation areas give broader protection than listing individual buildings: all the features,
listed or otherwise, within the area, are recognised as part of its character. There are now
over 8000 conservation areas in England. Figure 9 below identified the 55 conservation areas
within Westminster.
Figure 9: Westminster Council’s Map of Conservation Areas

11
APPENDIX 2
THE CHARACTER OF SMALL OFFICE OCCUPIERS AND MAIN BUSINESS CLUSTERS
12
APPENDIX 2: THE CHARACTER OF SMALL OFFICE OCCUPIERS AND MAIN BUSINESS
CLUSTERS
Top Five Westminster Small Office Occupiers by Business Sector
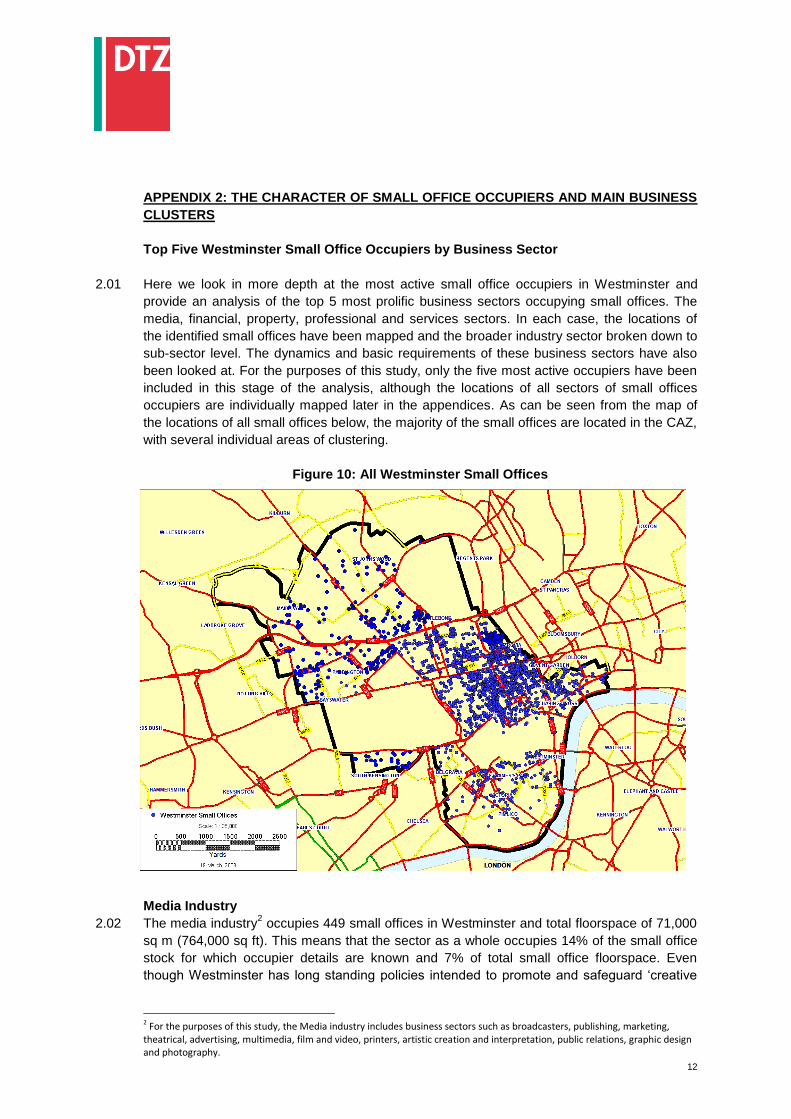
2.01 Here we look in more depth at the most active small office occupiers in Westminster and
provide an analysis of the top 5 most prolific business sectors occupying small offices. The
media, financial, property, professional and services sectors. In each case, the locations of
the identified small offices have been mapped and the broader industry sector broken down to
sub-sector level. The dynamics and basic requirements of these business sectors have also
been looked at. For the purposes of this study, only the five most active occupiers have been
included in this stage of the analysis, although the locations of all sectors of small offices
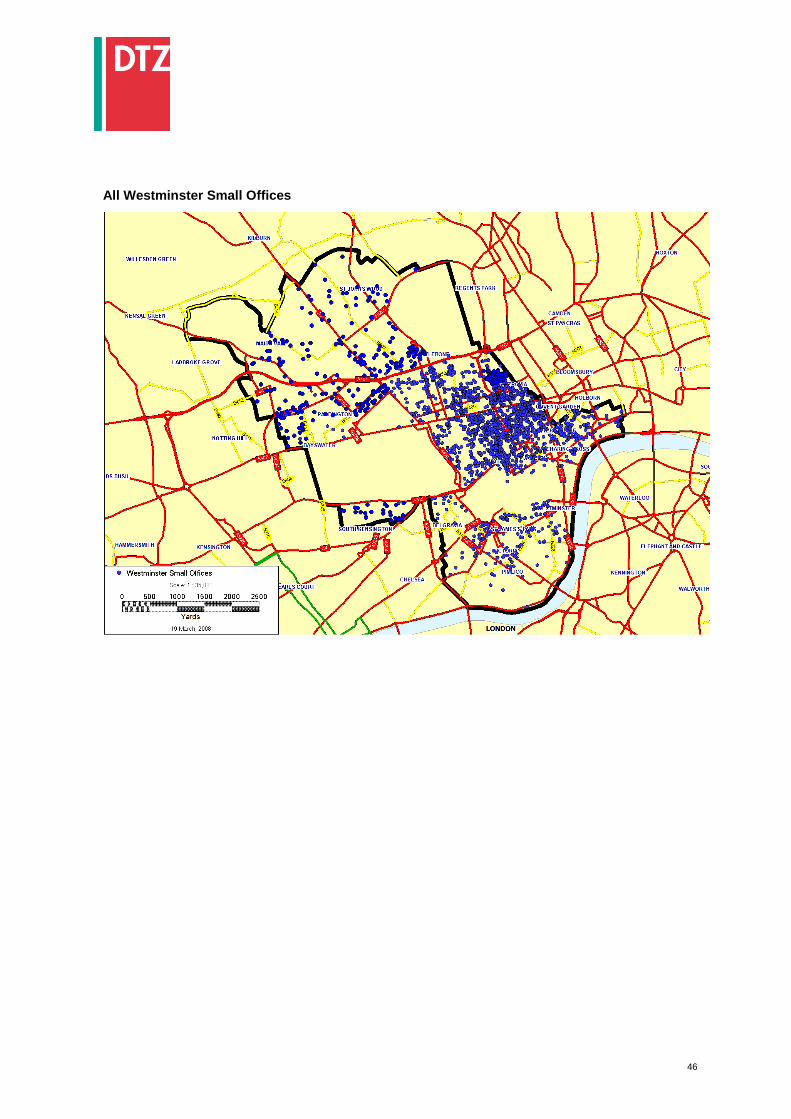
occupiers are individually mapped later in the appendices. As can be seen from the map of
the locations of all small offices below, the majority of the small offices are located in the CAZ,
with several individual areas of clustering.
Figure 10: All Westminster Small Offices
Media Industry
2.02 The media industry2 occupies 449 small offices in Westminster and total floorspace of 71,000
sq m (764,000 sq ft). This means that the sector as a whole occupies 14% of the small office
stock for which occupier details are known and 7% of total small office floorspace. Even
though Westminster has long standing policies intended to promote and safeguard „creative
2 For the purposes of this study, the Media industry includes business sectors such as broadcasters, publishing, marketing, theatrical, advertising, multimedia, film and video, printers, artistic creation and interpretation, public relations, graphic design and photography.
13
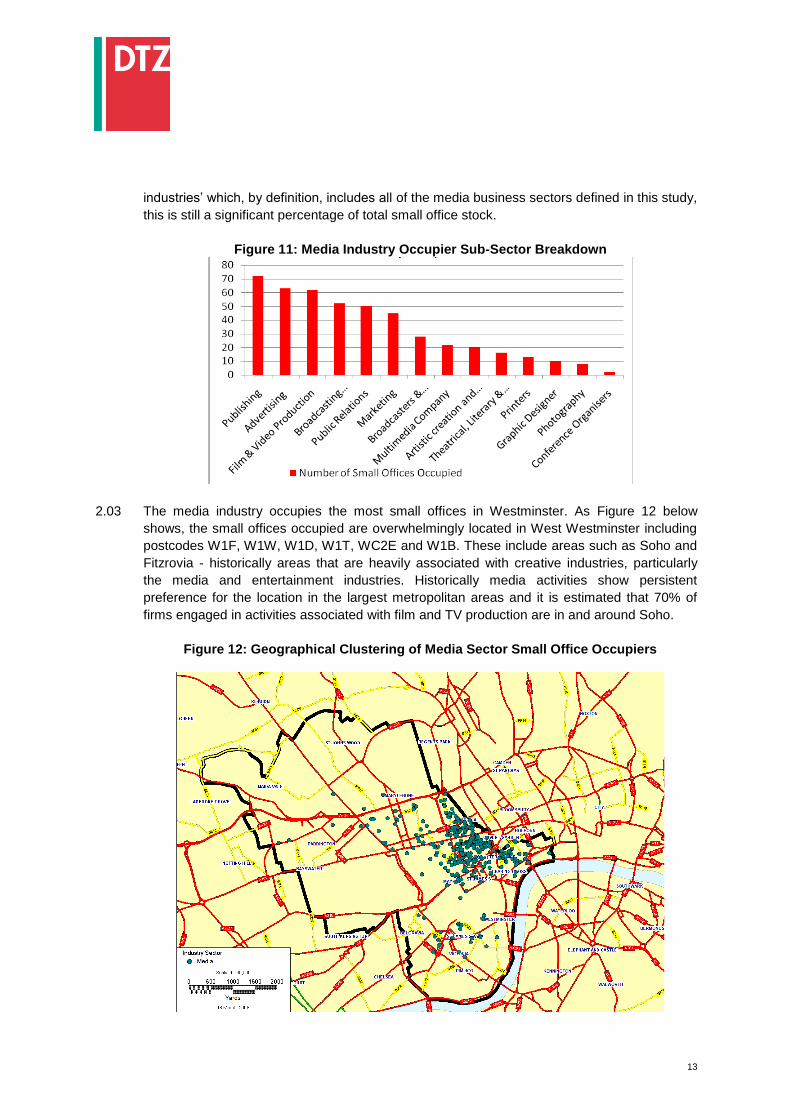
industries‟ which, by definition, includes all of the media business sectors defined in this study,
this is still a significant percentage of total small office stock.
Figure 11: Media Industry Occupier Sub-Sector Breakdown
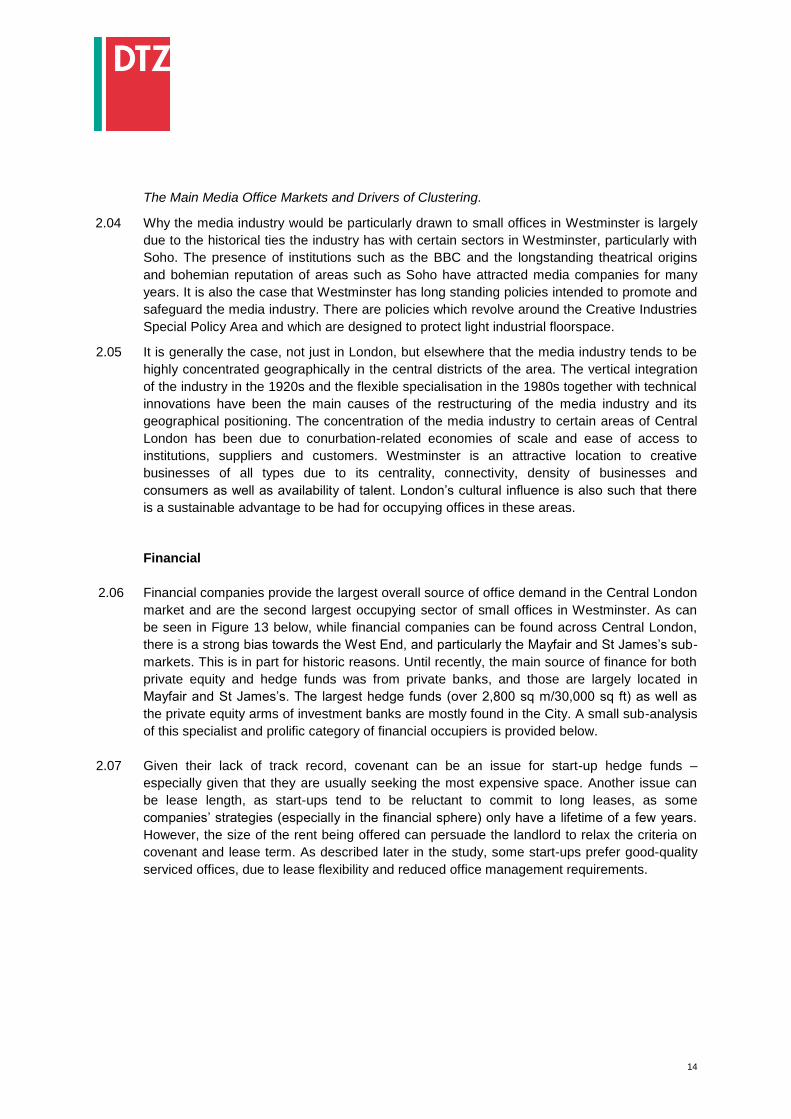
2.03 The media industry occupies the most small offices in Westminster. As Figure 12 below
shows, the small offices occupied are overwhelmingly located in West Westminster including
postcodes W1F, W1W, W1D, W1T, WC2E and W1B. These include areas such as Soho and
Fitzrovia - historically areas that are heavily associated with creative industries, particularly
the media and entertainment industries. Historically media activities show persistent
preference for the location in the largest metropolitan areas and it is estimated that 70% of
firms engaged in activities associated with film and TV production are in and around Soho.
Figure 12: Geographical Clustering of Media Sector Small Office Occupiers
14
The Main Media Office Markets and Drivers of Clustering.
2.04 Why the media industry would be particularly drawn to small offices in Westminster is largely
due to the historical ties the industry has with certain sectors in Westminster, particularly with
Soho. The presence of institutions such as the BBC and the longstanding theatrical origins
and bohemian reputation of areas such as Soho have attracted media companies for many
years. It is also the case that Westminster has long standing policies intended to promote and
safeguard the media industry. There are policies which revolve around the Creative Industries
Special Policy Area and which are designed to protect light industrial floorspace.
2.05 It is generally the case, not just in London, but elsewhere that the media industry tends to be
highly concentrated geographically in the central districts of the area. The vertical integration
of the industry in the 1920s and the flexible specialisation in the 1980s together with technical
innovations have been the main causes of the restructuring of the media industry and its
geographical positioning. The concentration of the media industry to certain areas of Central
London has been due to conurbation-related economies of scale and ease of access to
institutions, suppliers and customers. Westminster is an attractive location to creative
businesses of all types due to its centrality, connectivity, density of businesses and
consumers as well as availability of talent. London‟s cultural influence is also such that there
is a sustainable advantage to be had for occupying offices in these areas.
Financial
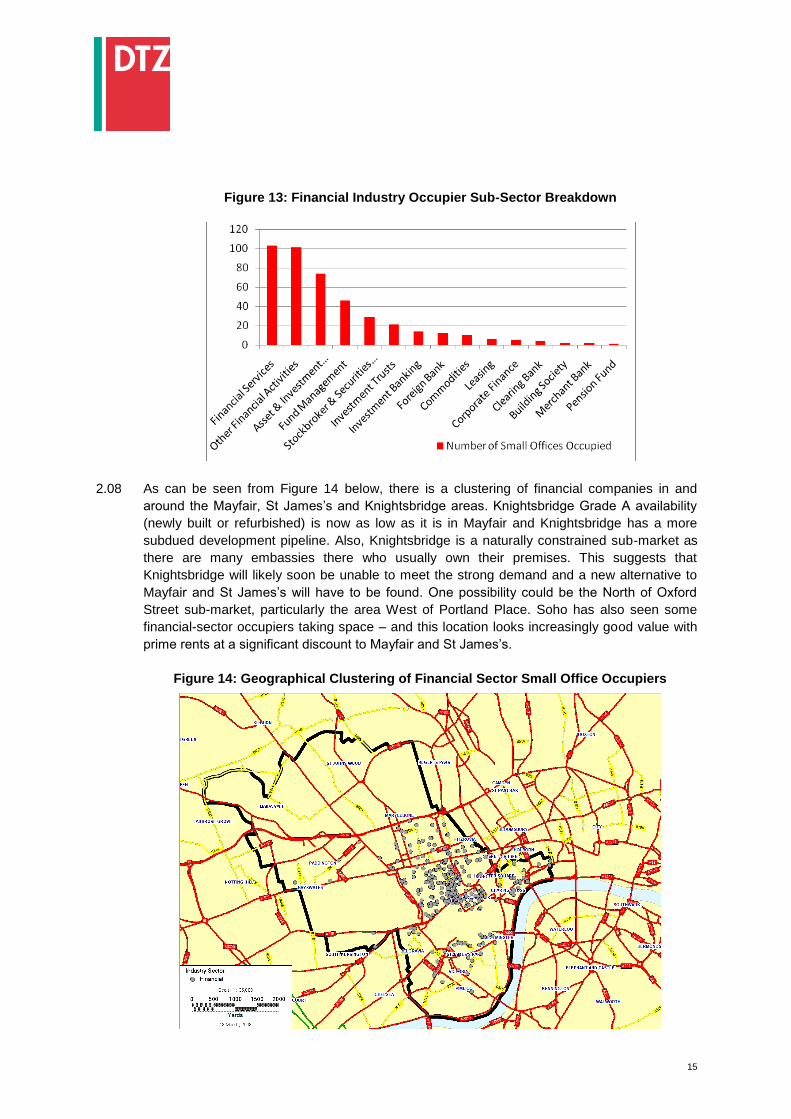
2.06 Financial companies provide the largest overall source of office demand in the Central London
market and are the second largest occupying sector of small offices in Westminster. As can
be seen in Figure 13 below, while financial companies can be found across Central London,
there is a strong bias towards the West End, and particularly the Mayfair and St James‟s sub-
markets. This is in part for historic reasons. Until recently, the main source of finance for both
private equity and hedge funds was from private banks, and those are largely located in
Mayfair and St James‟s. The largest hedge funds (over 2,800 sq m/30,000 sq ft) as well as
the private equity arms of investment banks are mostly found in the City. A small sub-analysis
of this specialist and prolific category of financial occupiers is provided below.
2.07 Given their lack of track record, covenant can be an issue for start-up hedge funds –
especially given that they are usually seeking the most expensive space. Another issue can
be lease length, as start-ups tend to be reluctant to commit to long leases, as some
companies‟ strategies (especially in the financial sphere) only have a lifetime of a few years.
However, the size of the rent being offered can persuade the landlord to relax the criteria on
covenant and lease term. As described later in the study, some start-ups prefer good-quality
serviced offices, due to lease flexibility and reduced office management requirements.
15
Figure 13: Financial Industry Occupier Sub-Sector Breakdown
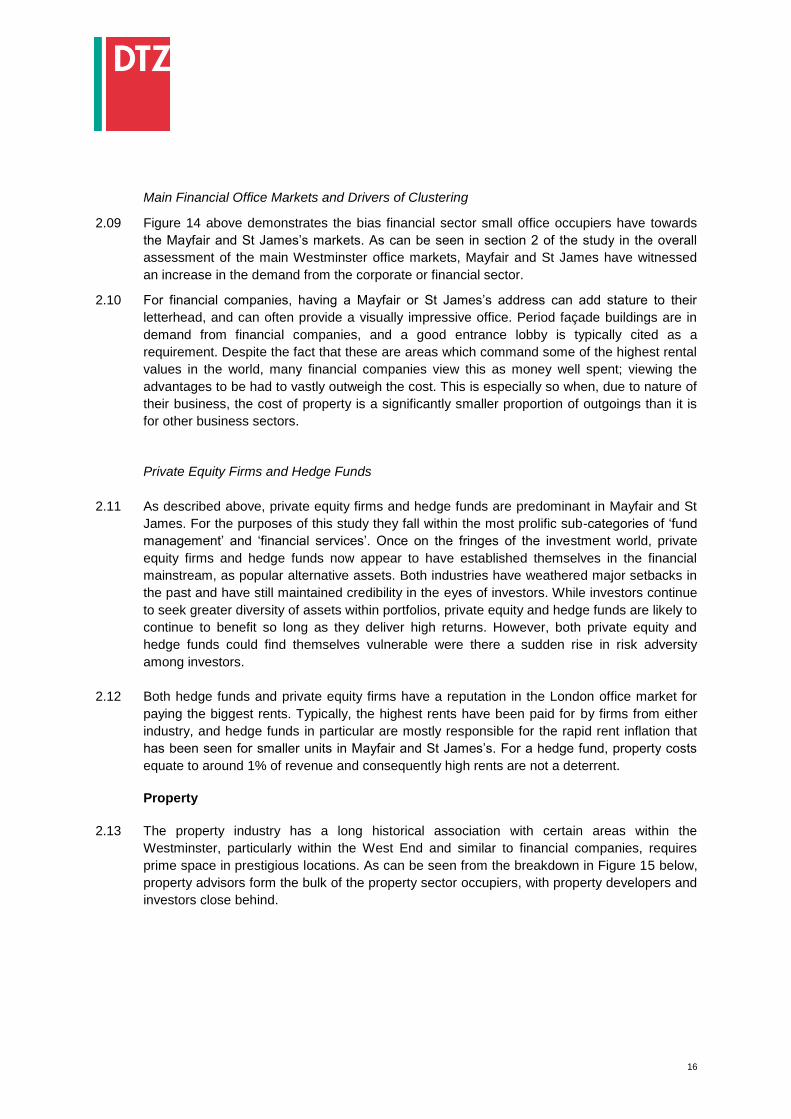
2.08 As can be seen from Figure 14 below, there is a clustering of financial companies in and
around the Mayfair, St James‟s and Knightsbridge areas. Knightsbridge Grade A availability
(newly built or refurbished) is now as low as it is in Mayfair and Knightsbridge has a more
subdued development pipeline. Also, Knightsbridge is a naturally constrained sub-market as
there are many embassies there who usually own their premises. This suggests that
Knightsbridge will likely soon be unable to meet the strong demand and a new alternative to
Mayfair and St James‟s will have to be found. One possibility could be the North of Oxford
Street sub-market, particularly the area West of Portland Place. Soho has also seen some
financial-sector occupiers taking space – and this location looks increasingly good value with
prime rents at a significant discount to Mayfair and St James‟s.
Figure 14: Geographical Clustering of Financial Sector Small Office Occupiers
16
Main Financial Office Markets and Drivers of Clustering
2.09 Figure 14 above demonstrates the bias financial sector small office occupiers have towards
the Mayfair and St James‟s markets. As can be seen in section 2 of the study in the overall
assessment of the main Westminster office markets, Mayfair and St James have witnessed
an increase in the demand from the corporate or financial sector.
2.10 For financial companies, having a Mayfair or St James‟s address can add stature to their
letterhead, and can often provide a visually impressive office. Period façade buildings are in
demand from financial companies, and a good entrance lobby is typically cited as a
requirement. Despite the fact that these are areas which command some of the highest rental
values in the world, many financial companies view this as money well spent; viewing the
advantages to be had to vastly outweigh the cost. This is especially so when, due to nature of
their business, the cost of property is a significantly smaller proportion of outgoings than it is
for other business sectors.
Private Equity Firms and Hedge Funds
2.11 As described above, private equity firms and hedge funds are predominant in Mayfair and St
James. For the purposes of this study they fall within the most prolific sub-categories of „fund
management‟ and „financial services‟. Once on the fringes of the investment world, private
equity firms and hedge funds now appear to have established themselves in the financial
mainstream, as popular alternative assets. Both industries have weathered major setbacks in
the past and have still maintained credibility in the eyes of investors. While investors continue
to seek greater diversity of assets within portfolios, private equity and hedge funds are likely to
continue to benefit so long as they deliver high returns. However, both private equity and
hedge funds could find themselves vulnerable were there a sudden rise in risk adversity
among investors.
2.12 Both hedge funds and private equity firms have a reputation in the London office market for
paying the biggest rents. Typically, the highest rents have been paid for by firms from either
industry, and hedge funds in particular are mostly responsible for the rapid rent inflation that
has been seen for smaller units in Mayfair and St James‟s. For a hedge fund, property costs
equate to around 1% of revenue and consequently high rents are not a deterrent.
Property
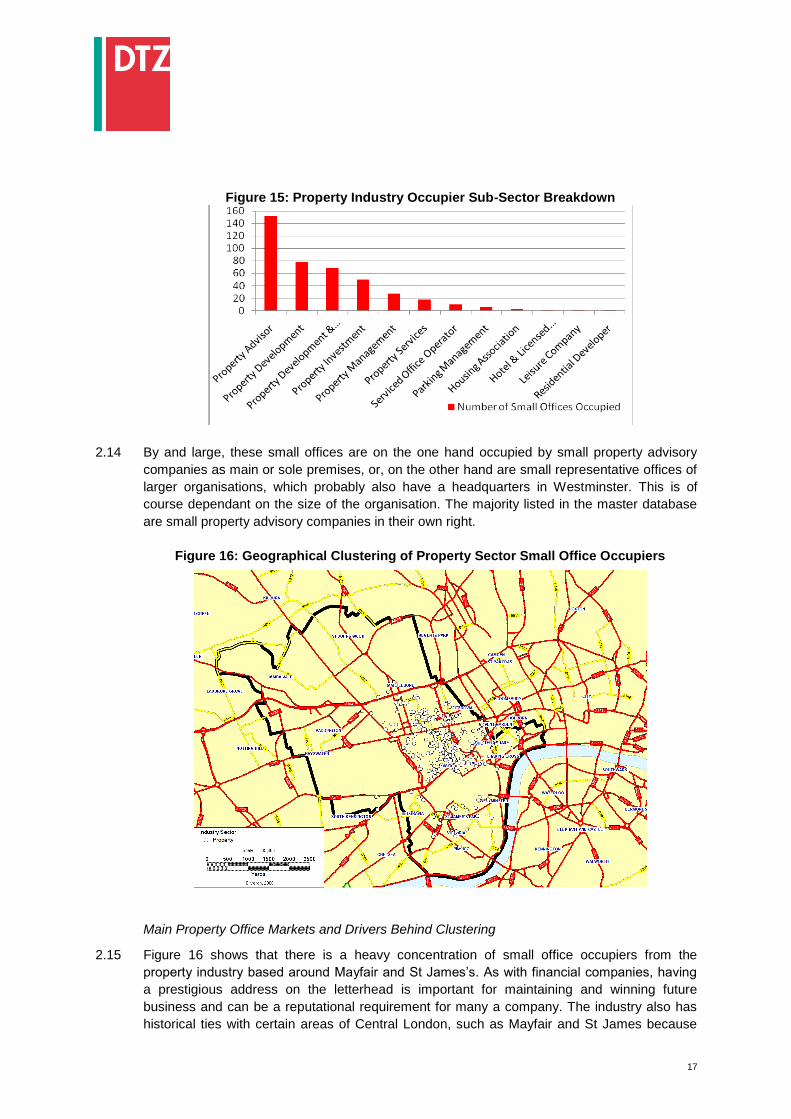
2.13 The property industry has a long historical association with certain areas within the
Westminster, particularly within the West End and similar to financial companies, requires
prime space in prestigious locations. As can be seen from the breakdown in Figure 15 below,
property advisors form the bulk of the property sector occupiers, with property developers and
investors close behind.
17
Figure 15: Property Industry Occupier Sub-Sector Breakdown
2.14 By and large, these small offices are on the one hand occupied by small property advisory
companies as main or sole premises, or, on the other hand are small representative offices of
larger organisations, which probably also have a headquarters in Westminster. This is of
course dependant on the size of the organisation. The majority listed in the master database
are small property advisory companies in their own right.
Figure 16: Geographical Clustering of Property Sector Small Office Occupiers
Main Property Office Markets and Drivers Behind Clustering
2.15 Figure 16 shows that there is a heavy concentration of small office occupiers from the
property industry based around Mayfair and St James‟s. As with financial companies, having
a prestigious address on the letterhead is important for maintaining and winning future
business and can be a reputational requirement for many a company. The industry also has
historical ties with certain areas of Central London, such as Mayfair and St James because
18
principally it is here that the landed estates (both urban and rural) were either resident or
accessible.
2.16 In recent years the sector has become less fragmented, and a polarisation between of larger
international firms and the small and medium sized companies‟ is taking place. The former
have become more sensitive to their property costs and are de-clustering away from the
Mayfair/St James‟s core. Their client base is less local than the smaller companies, who are
also more dependent on the local labour pool, and keen to remain in close proximity to their
peer group for broking and intelligence reasons. It is these factors which keep the smaller
surveyors‟ tied into a West End location. Professional
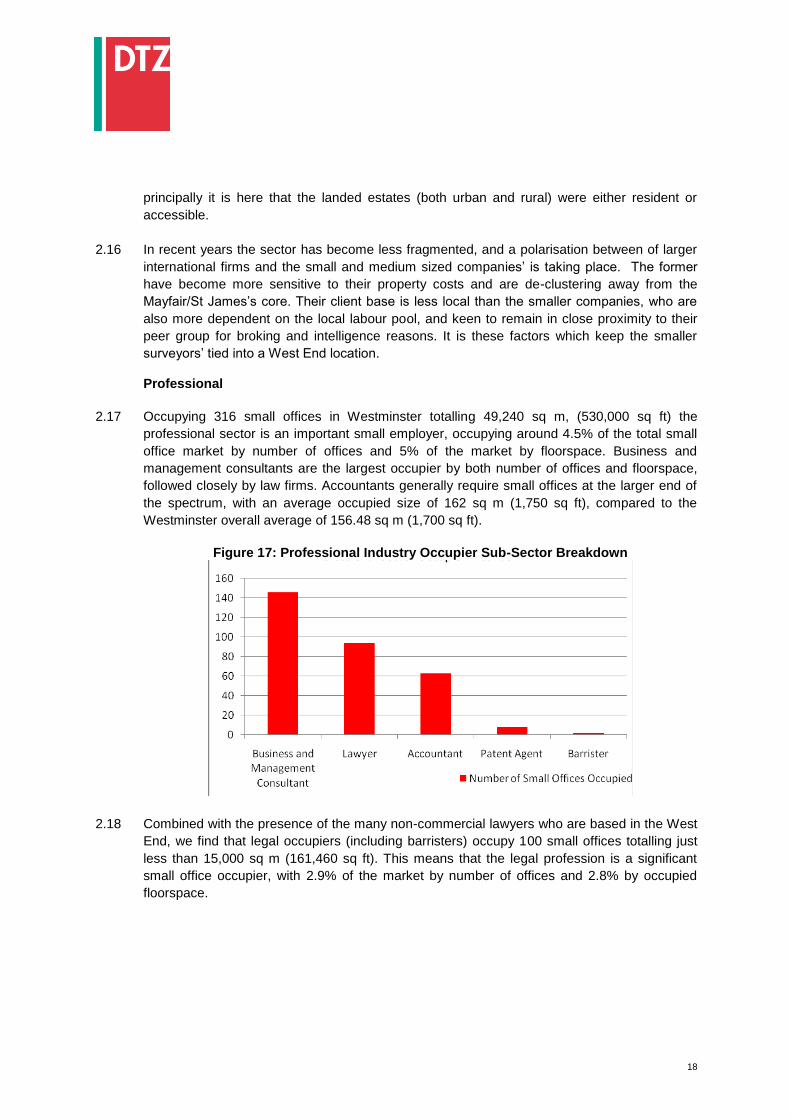
2.17 Occupying 316 small offices in Westminster totalling 49,240 sq m, (530,000 sq ft) the
professional sector is an important small employer, occupying around 4.5% of the total small
office market by number of offices and 5% of the market by floorspace. Business and
management consultants are the largest occupier by both number of offices and floorspace,
followed closely by law firms. Accountants generally require small offices at the larger end of
the spectrum, with an average occupied size of 162 sq m (1,750 sq ft), compared to the
Westminster overall average of 156.48 sq m (1,700 sq ft).
Figure 17: Professional Industry Occupier Sub-Sector Breakdown
2.18 Combined with the presence of the many non-commercial lawyers who are based in the West
End, we find that legal occupiers (including barristers) occupy 100 small offices totalling just
less than 15,000 sq m (161,460 sq ft). This means that the legal profession is a significant
small office occupier, with 2.9% of the market by number of offices and 2.8% by occupied
floorspace.
19
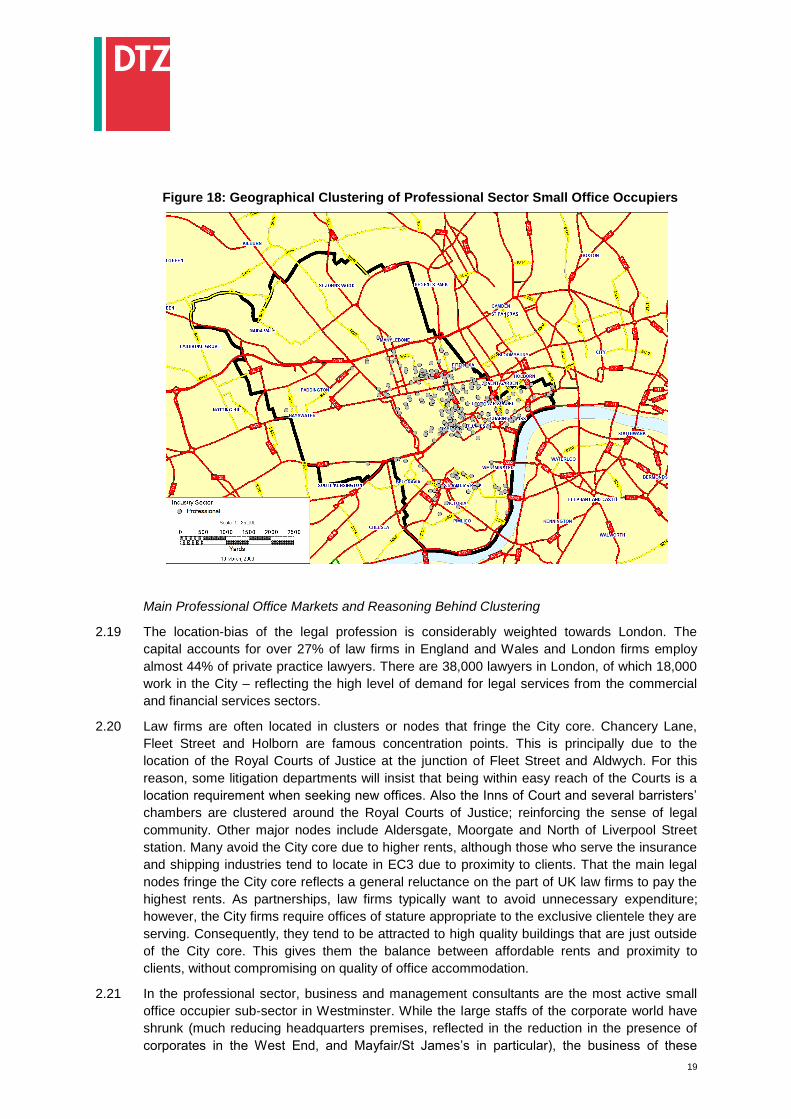
Figure 18: Geographical Clustering of Professional Sector Small Office Occupiers
Main Professional Office Markets and Reasoning Behind Clustering
2.19 The location-bias of the legal profession is considerably weighted towards London. The
capital accounts for over 27% of law firms in England and Wales and London firms employ
almost 44% of private practice lawyers. There are 38,000 lawyers in London, of which 18,000
work in the City – reflecting the high level of demand for legal services from the commercial
and financial services sectors.
2.20 Law firms are often located in clusters or nodes that fringe the City core. Chancery Lane,
Fleet Street and Holborn are famous concentration points. This is principally due to the
location of the Royal Courts of Justice at the junction of Fleet Street and Aldwych. For this
reason, some litigation departments will insist that being within easy reach of the Courts is a
location requirement when seeking new offices. Also the Inns of Court and several barristers‟
chambers are clustered around the Royal Courts of Justice; reinforcing the sense of legal
community. Other major nodes include Aldersgate, Moorgate and North of Liverpool Street
station. Many avoid the City core due to higher rents, although those who serve the insurance
and shipping industries tend to locate in EC3 due to proximity to clients. That the main legal
nodes fringe the City core reflects a general reluctance on the part of UK law firms to pay the
highest rents. As partnerships, law firms typically want to avoid unnecessary expenditure;
however, the City firms require offices of stature appropriate to the exclusive clientele they are
serving. Consequently, they tend to be attracted to high quality buildings that are just outside
of the City core. This gives them the balance between affordable rents and proximity to
clients, without compromising on quality of office accommodation.
2.21 In the professional sector, business and management consultants are the most active small
office occupier sub-sector in Westminster. While the large staffs of the corporate world have
shrunk (much reducing headquarters premises, reflected in the reduction in the presence of
corporates in the West End, and Mayfair/St James‟s in particular), the business of these
20
corporate advisors has grown enormously, with concomitant increase in the number and size
of the companies involved. Like other professional sectors, they find being located in the
centre of London essential for meeting and serving clients and accessing their labour market
of skilled and qualified professionals.
2.22 Management consultancy is rapidly expanding are of business services, and, similar to
accountancy, encompasses a range of activities. The main areas of consultancy are
outsourcing and IT, which account for approximately two-thirds of all consultancy fee income.
As the core business is providing advice to other firms, management consultants naturally
prefer a central city location where they maintain regular contact with clients and promote
close working relationships. One example is on software consultancy where the information
embodies in the product is often highly technical or specialist and requires face-to-face
contact to aid the understanding between client and supplier. It is estimated that in London,
the consultancy sector employs roughly 28,000 workers accounting for 10% of the UK total.
Services
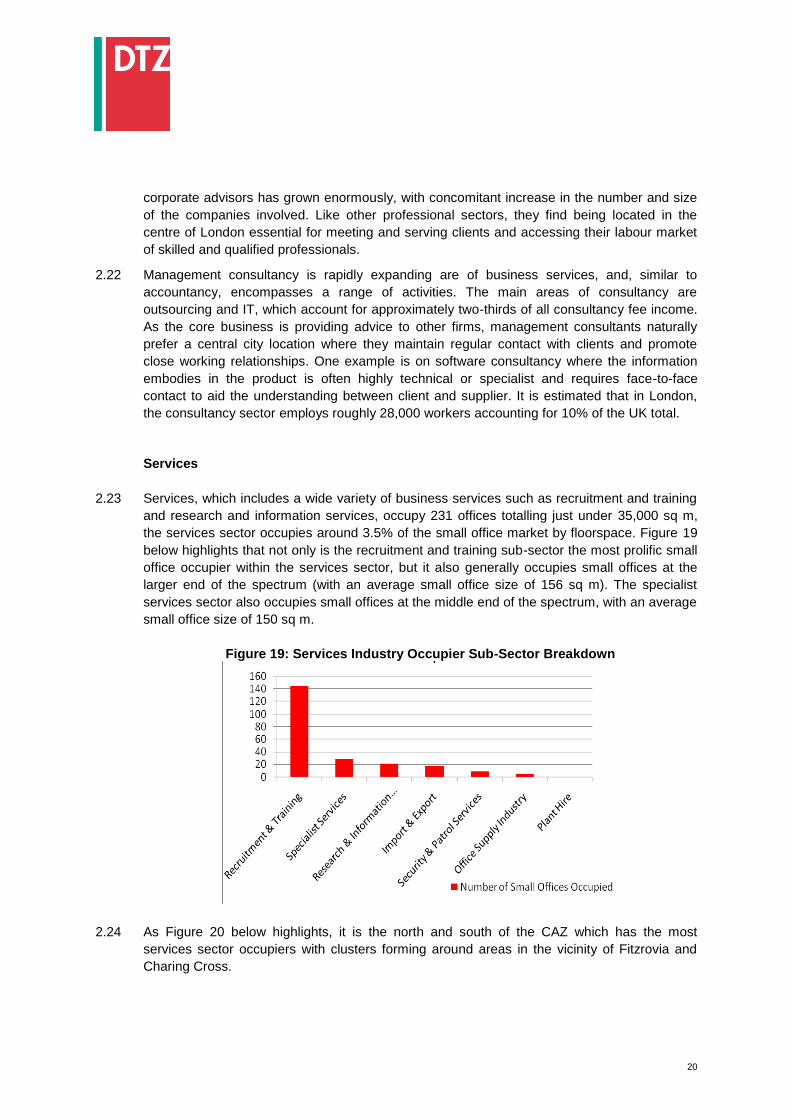
2.23 Services, which includes a wide variety of business services such as recruitment and training
and research and information services, occupy 231 offices totalling just under 35,000 sq m,
the services sector occupies around 3.5% of the small office market by floorspace. Figure 19
below highlights that not only is the recruitment and training sub-sector the most prolific small
office occupier within the services sector, but it also generally occupies small offices at the
larger end of the spectrum (with an average small office size of 156 sq m). The specialist
services sector also occupies small offices at the middle end of the spectrum, with an average
small office size of 150 sq m.
Figure 19: Services Industry Occupier Sub-Sector Breakdown
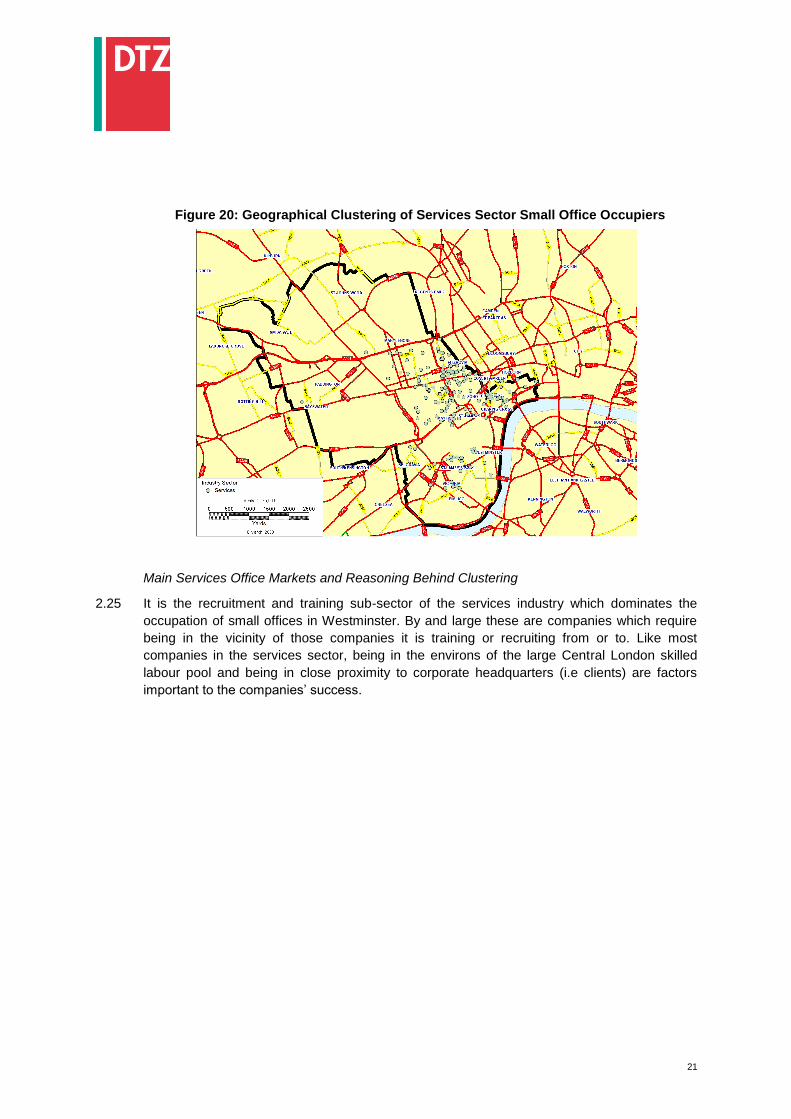
2.24 As Figure 20 below highlights, it is the north and south of the CAZ which has the most
services sector occupiers with clusters forming around areas in the vicinity of Fitzrovia and
Charing Cross.
21
Figure 20: Geographical Clustering of Services Sector Small Office Occupiers
Main Services Office Markets and Reasoning Behind Clustering
2.25 It is the recruitment and training sub-sector of the services industry which dominates the
occupation of small offices in Westminster. By and large these are companies which require
being in the vicinity of those companies it is training or recruiting from or to. Like most
companies in the services sector, being in the environs of the large Central London skilled
labour pool and being in close proximity to corporate headquarters (i.e clients) are factors
important to the companies‟ success.

22
APPENDIX 3
WESTMINSTER AVAILABILITY AND TAKE-UP
23
APPENDIX 3: WESTMINSTER AVAILABILITY AND TAKE-UP
Availability
3.01 The supply of small offices to meet demand comes from the availability on the market at any
particular time. Here we look at the character of current availability, and compare it with the
level of past availability. Availability is here defined as all floors currently on the market of 250
sq m (2,700 sq ft) area or less. As space is generally not made available in neat determinate
sizes, we have instead looked at the number of floors in this assessment. This definition also
stems from the way office floorspace is marketed: unless otherwise specified landlords, and
tenants offering offices for assignment or letting, will lease space off by floors. Now they will
prefer, for reasons of convenience, to lease the space to one tenant if possible. This is
especially true if the available space covers an entire building. But if a building is already
multi-let, it is likely that even if initially offered as a single lease, the floors could be let off
separately. Hence here we do not attempt to second guess which would be let in amounts
above or below 250 sq m (2,700 sq ft), but examine the character of the floorspace which falls
beneath our chosen threshold.
3.02 An assessment of small office availability levels in Westminster has shown there to be 752
floors, totalling 68,810 sq m (740,000 sq ft), in 349 buildings. 7% of total identified small office
stock. This is not an unusually high or low availability rate when compared to either the rest of
London or other markets throughout the UK. As discussed below, although availability levels
have gradually declined over the years in this market, the current availability rate is within the
parameters of what one would expect.
3.03 What is interesting from this analysis are the results of the breakdown of available small
offices by unit size and floorspace. By the number of available units, it is those small offices
at the smaller end of the spectrum (0-100 sq m/0-1,075 sq ft) which show the most number.
By floorspace, it is small offices between 51-100 sq m (550-1,075 sq ft) and 201-250 sq m
(2,150-2,700 sq ft) which have the most available space. This would indicate that small office
availability levels in Westminster are geared towards the small and larger end of the size
spectrum.
3.04 As discussed earlier, analyses of historical timelines of small office take-up in Westminster
from 1996 to 2007 by floorspace and number of units has shown a steady drop off. Indeed,
since 2001, this has been a theme across Central London, and the take-up figures for small
offices in Westminster are not exceptional. The proportional take-up of „good‟ or „new‟ stock
and „poor second hand‟ stock has fluctuated over the last ten years, but it is evident that the
amount of good or new space being taken-up has fallen off since 2003. The figures for 2007
show that the majority of space taken was „poor quality‟ space. This is in part due to the fact
that large parts of the CAZ are made up of period office buildings, but it can also be due to the
technicalities and difficulties of the planning and development process.
3.05 In order to put this into a wider context, when plotted against full West End take-up figures
there has been a steady downward trend since 1996 to a low in 2007 of just over 10% of total
West End take-up. This downward trend in take-up for Westminster small offices can in part
be put down a decrease in availability levels, but it could also be attributed to a fall off in
demand for such space.
24
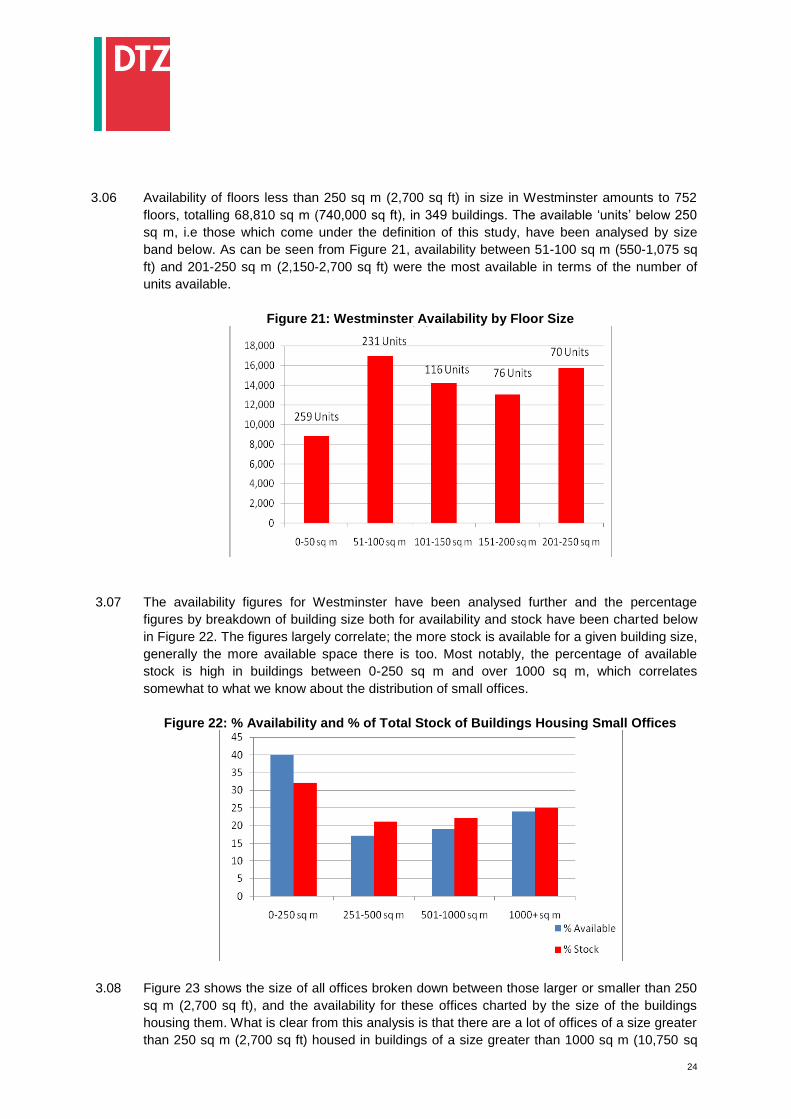
3.06 Availability of floors less than 250 sq m (2,700 sq ft) in size in Westminster amounts to 752
floors, totalling 68,810 sq m (740,000 sq ft), in 349 buildings. The available „units‟ below 250
sq m, i.e those which come under the definition of this study, have been analysed by size
band below. As can be seen from Figure 21, availability between 51-100 sq m (550-1,075 sq
ft) and 201-250 sq m (2,150-2,700 sq ft) were the most available in terms of the number of
units available.
Figure 21: Westminster Availability by Floor Size
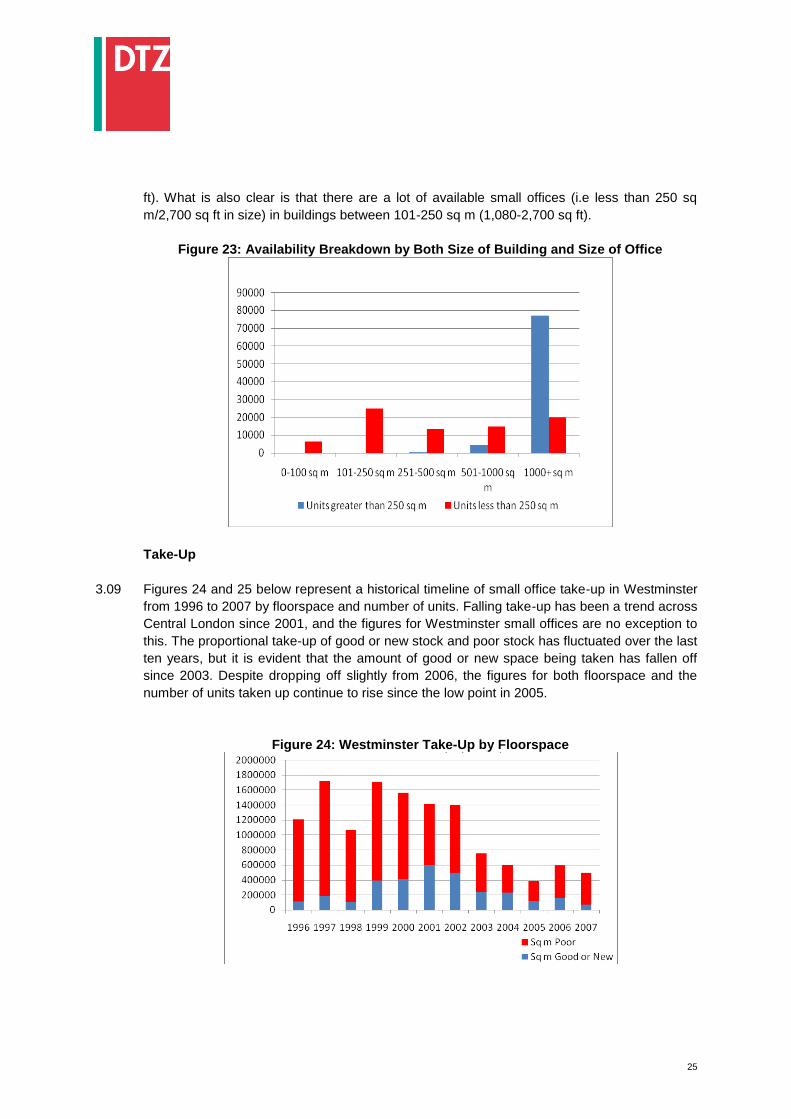
3.07 The availability figures for Westminster have been analysed further and the percentage
figures by breakdown of building size both for availability and stock have been charted below
in Figure 22. The figures largely correlate; the more stock is available for a given building size,
generally the more available space there is too. Most notably, the percentage of available
stock is high in buildings between 0-250 sq m and over 1000 sq m, which correlates
somewhat to what we know about the distribution of small offices.
Figure 22: % Availability and % of Total Stock of Buildings Housing Small Offices
3.08 Figure 23 shows the size of all offices broken down between those larger or smaller than 250
sq m (2,700 sq ft), and the availability for these offices charted by the size of the buildings
housing them. What is clear from this analysis is that there are a lot of offices of a size greater
than 250 sq m (2,700 sq ft) housed in buildings of a size greater than 1000 sq m (10,750 sq
25
ft). What is also clear is that there are a lot of available small offices (i.e less than 250 sq
m/2,700 sq ft in size) in buildings between 101-250 sq m (1,080-2,700 sq ft).
Figure 23: Availability Breakdown by Both Size of Building and Size of Office
Take-Up
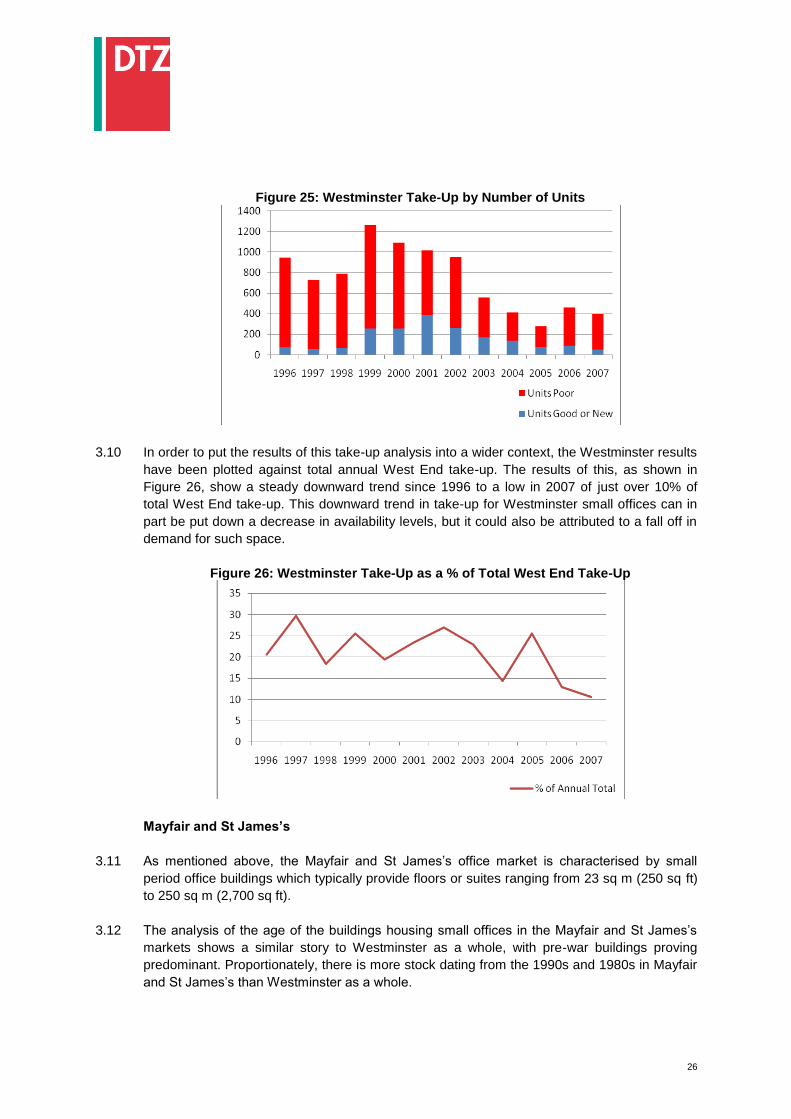
3.09 Figures 24 and 25 below represent a historical timeline of small office take-up in Westminster
from 1996 to 2007 by floorspace and number of units. Falling take-up has been a trend across
Central London since 2001, and the figures for Westminster small offices are no exception to
this. The proportional take-up of good or new stock and poor stock has fluctuated over the last
ten years, but it is evident that the amount of good or new space being taken has fallen off
since 2003. Despite dropping off slightly from 2006, the figures for both floorspace and the
number of units taken up continue to rise since the low point in 2005.
Figure 24: Westminster Take-Up by Floorspace
26
Figure 25: Westminster Take-Up by Number of Units
3.10 In order to put the results of this take-up analysis into a wider context, the Westminster results
have been plotted against total annual West End take-up. The results of this, as shown in
Figure 26, show a steady downward trend since 1996 to a low in 2007 of just over 10% of
total West End take-up. This downward trend in take-up for Westminster small offices can in
part be put down a decrease in availability levels, but it could also be attributed to a fall off in
demand for such space.
Figure 26: Westminster Take-Up as a % of Total West End Take-Up
Mayfair and St James’s
3.11 As mentioned above, the Mayfair and St James‟s office market is characterised by small
period office buildings which typically provide floors or suites ranging from 23 sq m (250 sq ft)
to 250 sq m (2,700 sq ft).
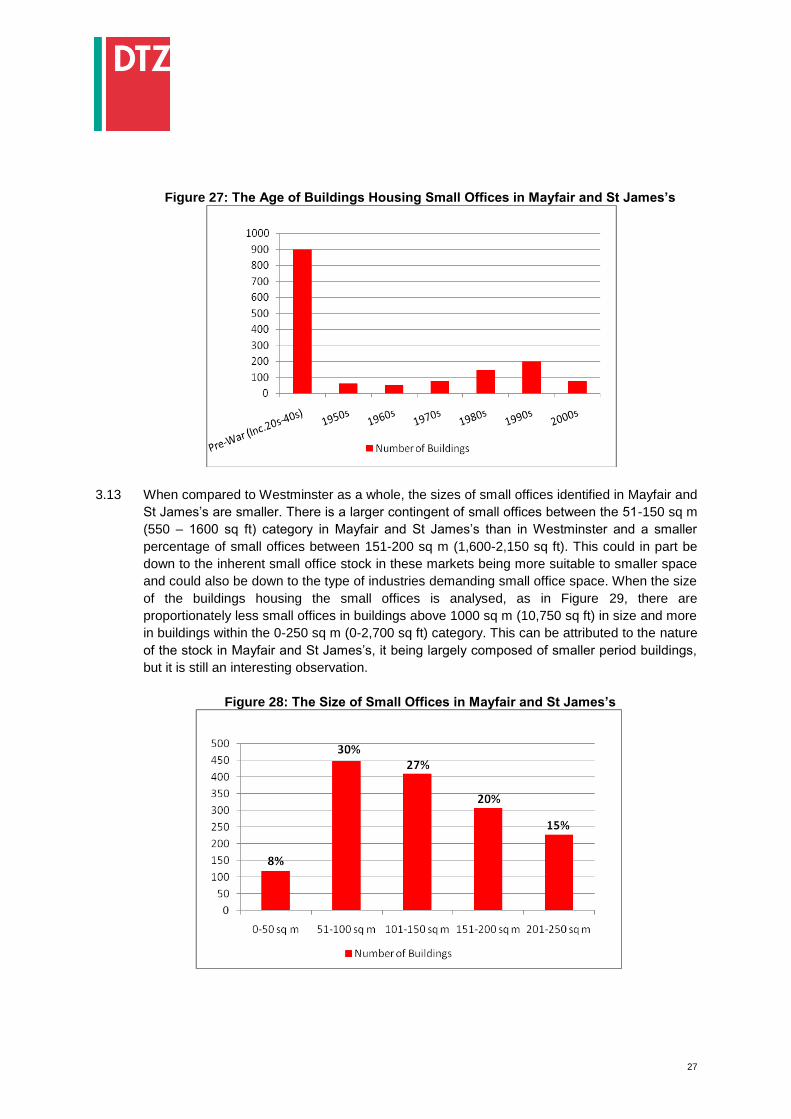
3.12 The analysis of the age of the buildings housing small offices in the Mayfair and St James‟s
markets shows a similar story to Westminster as a whole, with pre-war buildings proving
predominant. Proportionately, there is more stock dating from the 1990s and 1980s in Mayfair
and St James‟s than Westminster as a whole.
27
Figure 27: The Age of Buildings Housing Small Offices in Mayfair and St James’s
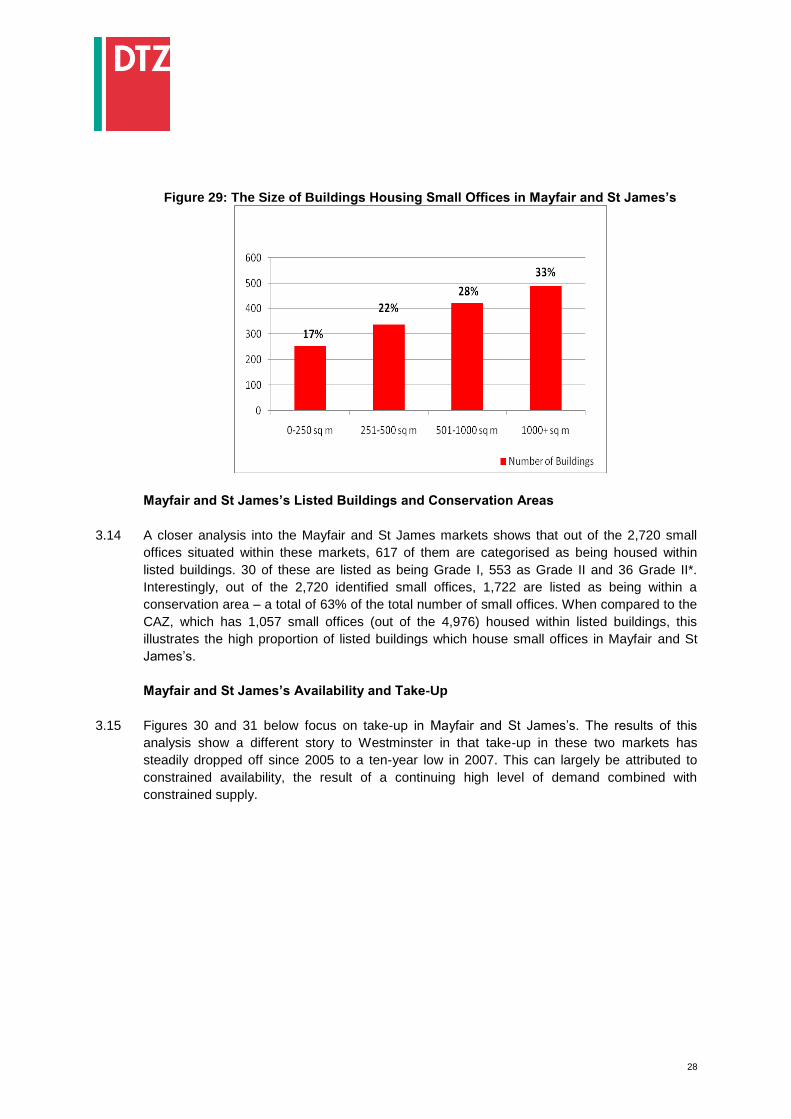
3.13 When compared to Westminster as a whole, the sizes of small offices identified in Mayfair and
St James‟s are smaller. There is a larger contingent of small offices between the 51-150 sq m
(550 – 1600 sq ft) category in Mayfair and St James‟s than in Westminster and a smaller
percentage of small offices between 151-200 sq m (1,600-2,150 sq ft). This could in part be
down to the inherent small office stock in these markets being more suitable to smaller space
and could also be down to the type of industries demanding small office space. When the size
of the buildings housing the small offices is analysed, as in Figure 29, there are
proportionately less small offices in buildings above 1000 sq m (10,750 sq ft) in size and more
in buildings within the 0-250 sq m (0-2,700 sq ft) category. This can be attributed to the nature
of the stock in Mayfair and St James‟s, it being largely composed of smaller period buildings,
but it is still an interesting observation.
Figure 28: The Size of Small Offices in Mayfair and St James’s
28
Figure 29: The Size of Buildings Housing Small Offices in Mayfair and St James’s
Mayfair and St James’s Listed Buildings and Conservation Areas
3.14 A closer analysis into the Mayfair and St James markets shows that out of the 2,720 small
offices situated within these markets, 617 of them are categorised as being housed within
listed buildings. 30 of these are listed as being Grade I, 553 as Grade II and 36 Grade II*.
Interestingly, out of the 2,720 identified small offices, 1,722 are listed as being within a
conservation area – a total of 63% of the total number of small offices. When compared to the
CAZ, which has 1,057 small offices (out of the 4,976) housed within listed buildings, this
illustrates the high proportion of listed buildings which house small offices in Mayfair and St
James‟s.
Mayfair and St James’s Availability and Take-Up
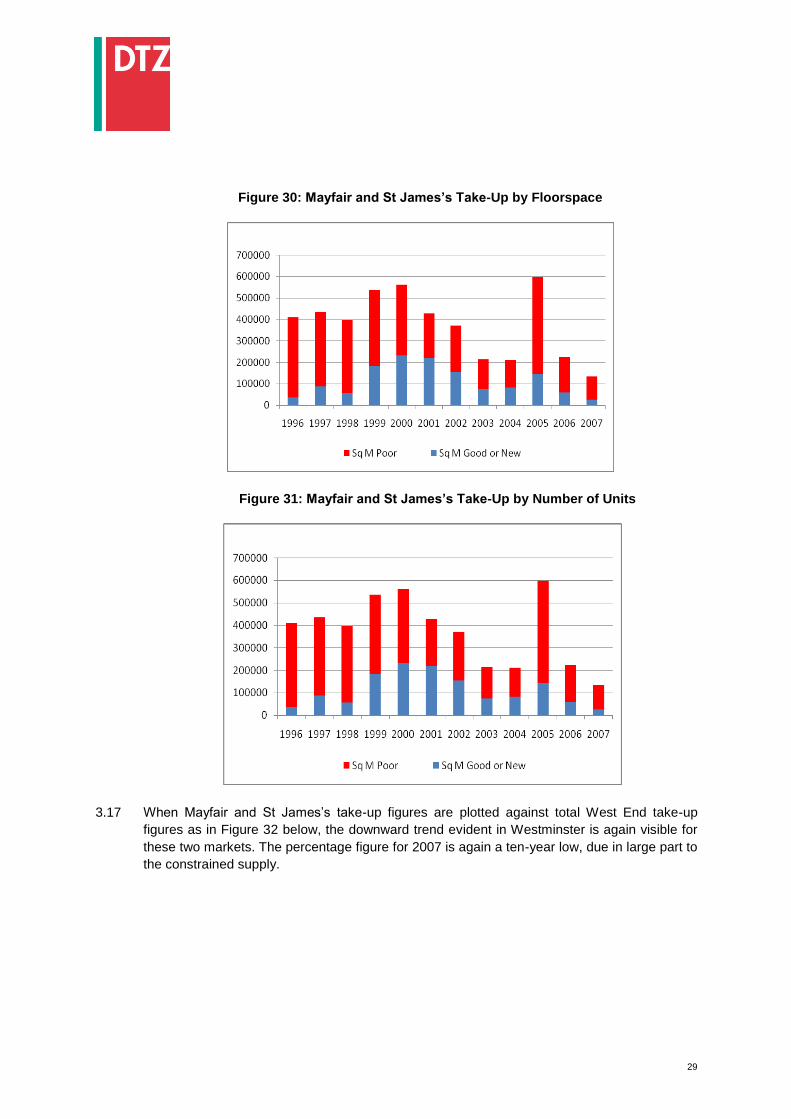
3.15 Figures 30 and 31 below focus on take-up in Mayfair and St James‟s. The results of this
analysis show a different story to Westminster in that take-up in these two markets has
steadily dropped off since 2005 to a ten-year low in 2007. This can largely be attributed to
constrained availability, the result of a continuing high level of demand combined with
constrained supply.
29
Figure 30: Mayfair and St James’s Take-Up by Floorspace
Figure 31: Mayfair and St James’s Take-Up by Number of Units
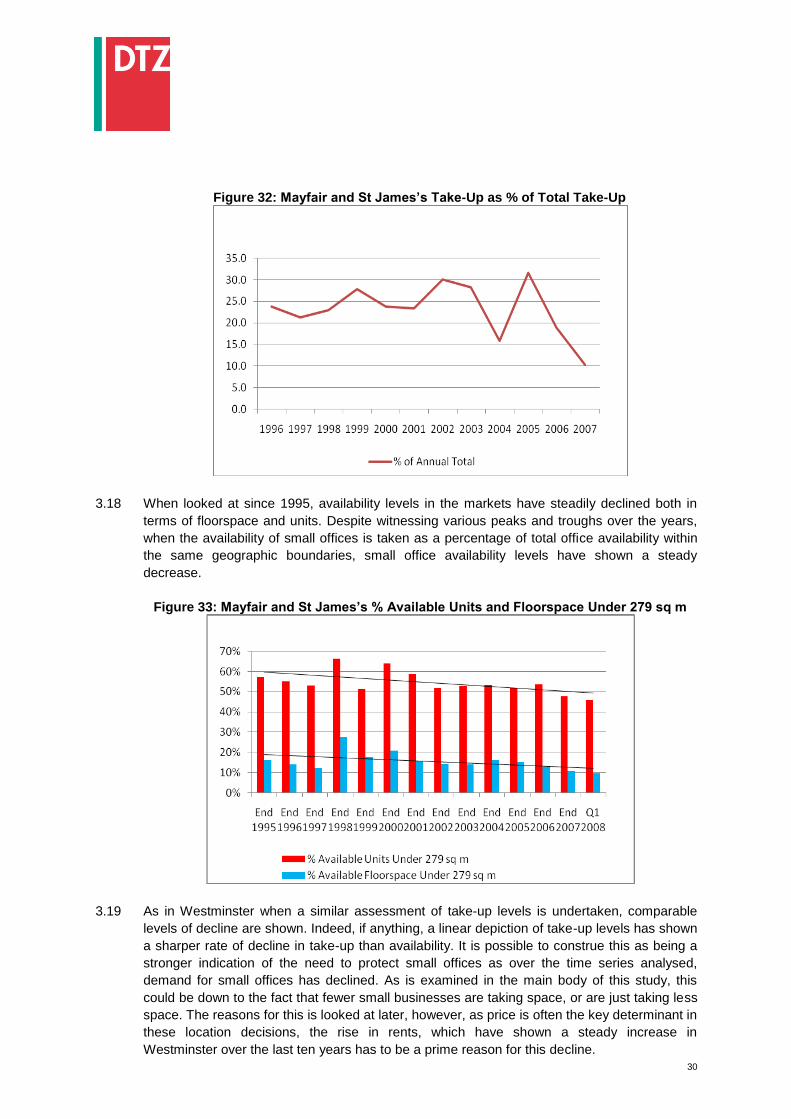
3.17 When Mayfair and St James‟s take-up figures are plotted against total West End take-up
figures as in Figure 32 below, the downward trend evident in Westminster is again visible for
these two markets. The percentage figure for 2007 is again a ten-year low, due in large part to
the constrained supply.
30
Figure 32: Mayfair and St James’s Take-Up as % of Total Take-Up
3.18 When looked at since 1995, availability levels in the markets have steadily declined both in
terms of floorspace and units. Despite witnessing various peaks and troughs over the years,
when the availability of small offices is taken as a percentage of total office availability within
the same geographic boundaries, small office availability levels have shown a steady
decrease.
Figure 33: Mayfair and St James’s % Available Units and Floorspace Under 279 sq m
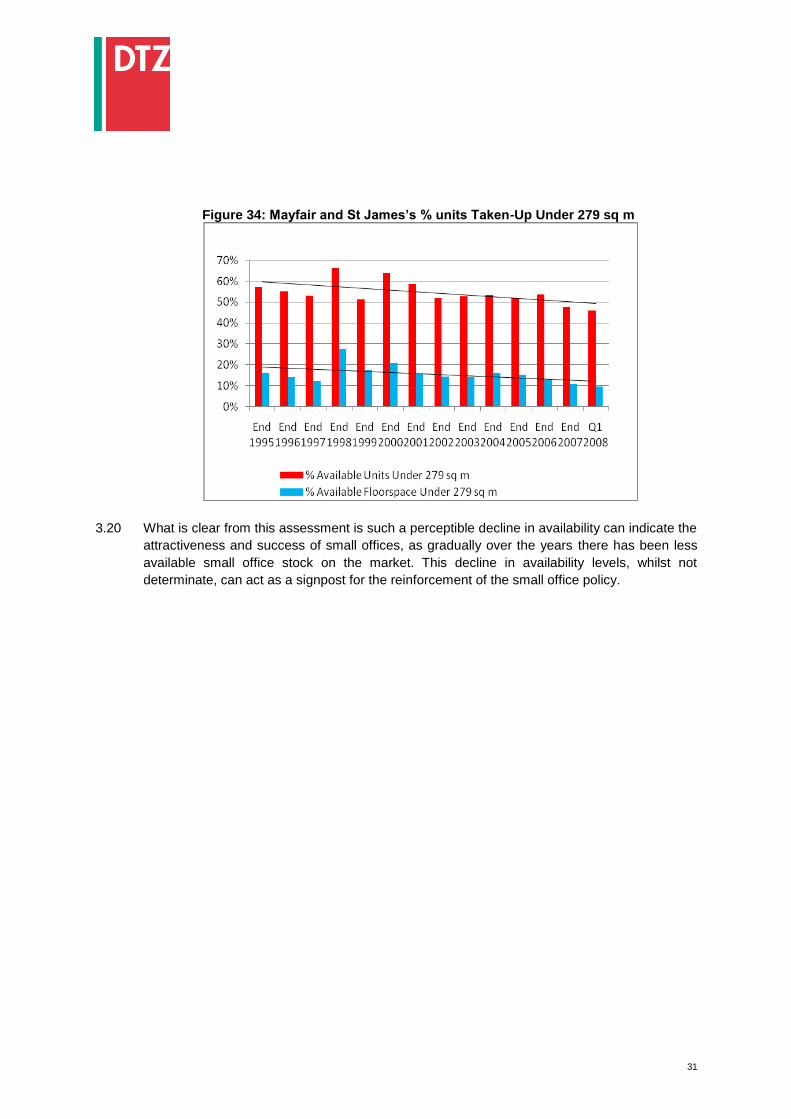
3.19 As in Westminster when a similar assessment of take-up levels is undertaken, comparable
levels of decline are shown. Indeed, if anything, a linear depiction of take-up levels has shown
a sharper rate of decline in take-up than availability. It is possible to construe this as being a
stronger indication of the need to protect small offices as over the time series analysed,
demand for small offices has declined. As is examined in the main body of this study, this
could be down to the fact that fewer small businesses are taking space, or are just taking less
space. The reasons for this is looked at later, however, as price is often the key determinant in
these location decisions, the rise in rents, which have shown a steady increase in
Westminster over the last ten years has to be a prime reason for this decline.
31
Figure 34: Mayfair and St James’s % units Taken-Up Under 279 sq m
3.20 What is clear from this assessment is such a perceptible decline in availability can indicate the
attractiveness and success of small offices, as gradually over the years there has been less
available small office stock on the market. This decline in availability levels, whilst not
determinate, can act as a signpost for the reinforcement of the small office policy.

32
APPENDIX 4
AN ASSESSMENT OF HOW SMALL OFFICES PROVIDE ACCOMODATION FOR BOTH
‘ESTABLISHED’ AND ‘START-UP’ BUSINESSES IN WESTMINSTER
33
APPENDIX 4 - AN ASSESSMENT OF HOW SMALL OFFICES PROVIDE ACCOMODATION
FOR BOTH ‘ESTABLISHED’ AND ‘START-UP’ BUSINESSES IN WESTMINSTER
New Firm Formation in Westminster
4.01 Small companies have a high attrition rate; not all grow successfully and go on to become
established, secure and substantial enterprises. This attrition makes it critical for the
maintenance of a vigorous local economy to have a healthy rate of new firm formation,
especially at the smaller end of size of enterprise. This section looks at the evidence of new
firm formation in Westminster.
4.02 VAT-based data, especially VAT registrations, are often used as a basis for calculating
business start-ups. Whilst such data is a useful surrogate, there are drawbacks (some
registrations may simply be the result of a change in legal status of a business, or that it has
only just started to meet the threshold at which VAT registration is required); similarly VAT de-
registrations cannot therefore be used as an absolute indicator of “business deaths” as de-
registrations may be caused by turnover falling below the VAT threshold, the legal status or
ownership of the company being altered as well as the obvious reason of ceasing to trade
completely. Nevertheless, in the absence of any better measure (except the now defunct
Barclays Bank survey referred to below) this gives a broad relative measure of small business
creation and demise.
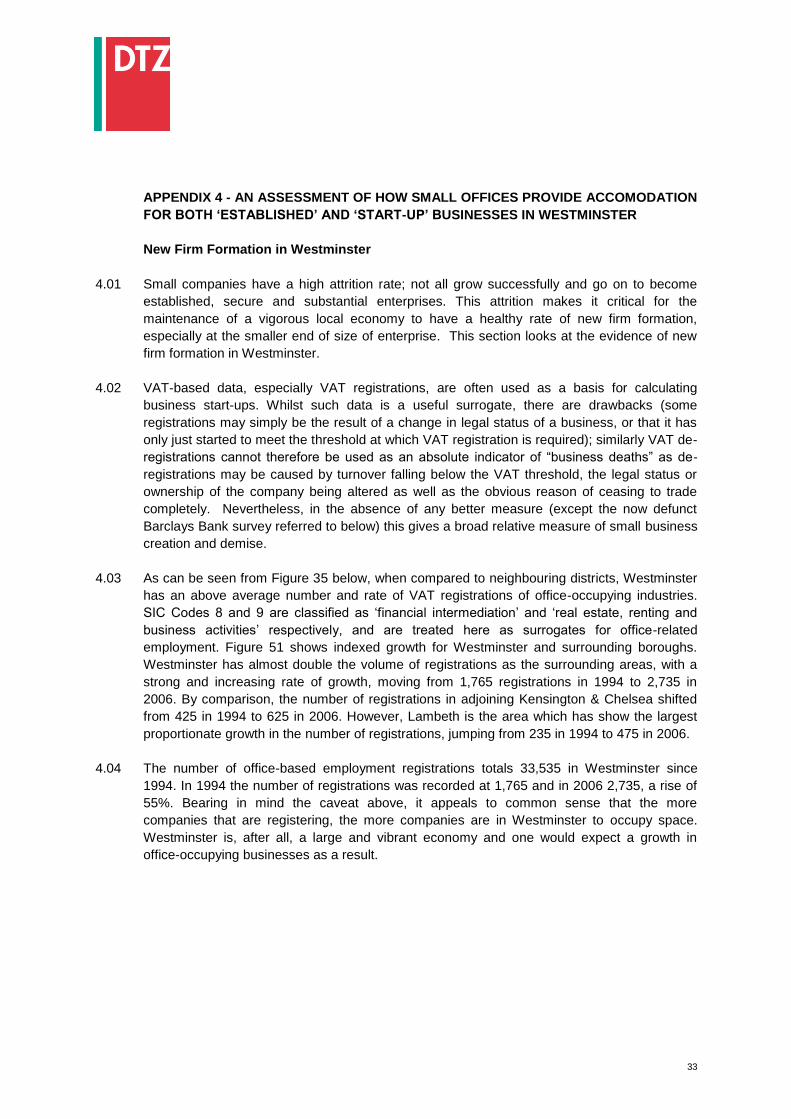
4.03 As can be seen from Figure 35 below, when compared to neighbouring districts, Westminster
has an above average number and rate of VAT registrations of office-occupying industries.
SIC Codes 8 and 9 are classified as „financial intermediation‟ and „real estate, renting and
business activities‟ respectively, and are treated here as surrogates for office-related
employment. Figure 51 shows indexed growth for Westminster and surrounding boroughs.
Westminster has almost double the volume of registrations as the surrounding areas, with a
strong and increasing rate of growth, moving from 1,765 registrations in 1994 to 2,735 in
2006. By comparison, the number of registrations in adjoining Kensington & Chelsea shifted
from 425 in 1994 to 625 in 2006. However, Lambeth is the area which has show the largest
proportionate growth in the number of registrations, jumping from 235 in 1994 to 475 in 2006.
4.04 The number of office-based employment registrations totals 33,535 in Westminster since
1994. In 1994 the number of registrations was recorded at 1,765 and in 2006 2,735, a rise of
55%. Bearing in mind the caveat above, it appeals to common sense that the more
companies that are registering, the more companies are in Westminster to occupy space.
Westminster is, after all, a large and vibrant economy and one would expect a growth in
office-occupying businesses as a result.
34
Figure 35: Number of Office-Occupying VAT Registrations 1994-2006
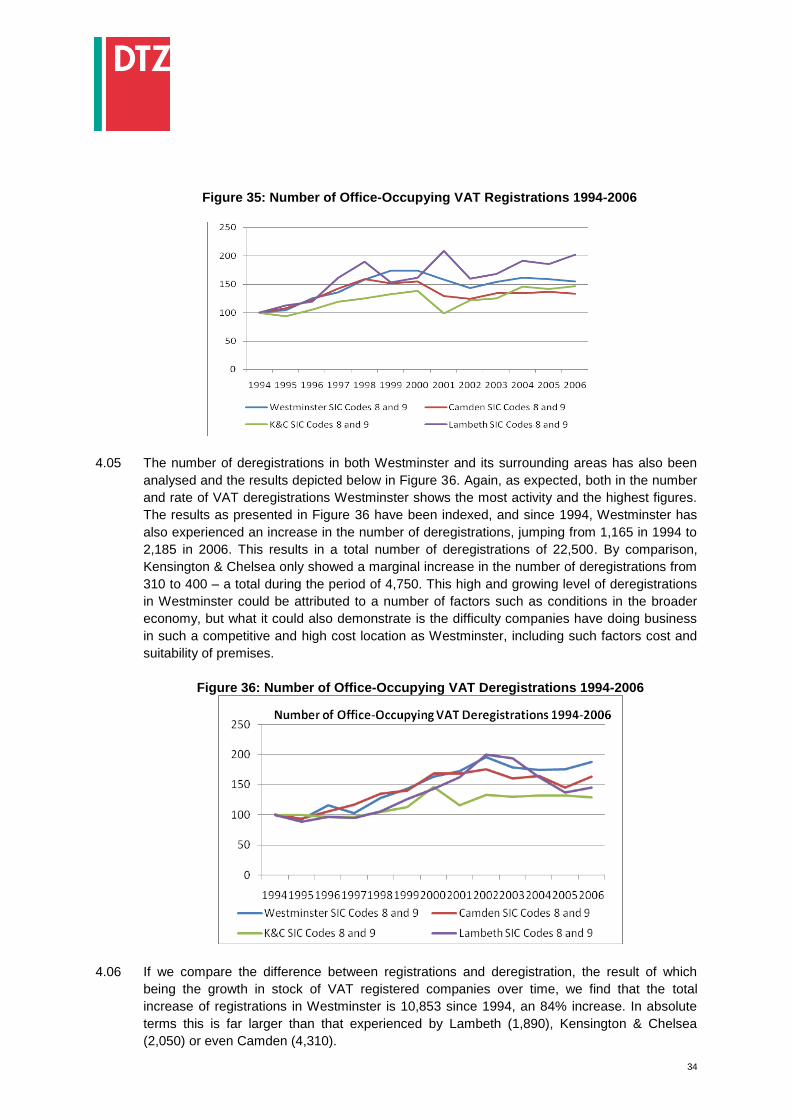
4.05 The number of deregistrations in both Westminster and its surrounding areas has also been
analysed and the results depicted below in Figure 36. Again, as expected, both in the number
and rate of VAT deregistrations Westminster shows the most activity and the highest figures.
The results as presented in Figure 36 have been indexed, and since 1994, Westminster has
also experienced an increase in the number of deregistrations, jumping from 1,165 in 1994 to
2,185 in 2006. This results in a total number of deregistrations of 22,500. By comparison,
Kensington & Chelsea only showed a marginal increase in the number of deregistrations from
310 to 400 – a total during the period of 4,750. This high and growing level of deregistrations
in Westminster could be attributed to a number of factors such as conditions in the broader
economy, but what it could also demonstrate is the difficulty companies have doing business
in such a competitive and high cost location as Westminster, including such factors cost and
suitability of premises.
Figure 36: Number of Office-Occupying VAT Deregistrations 1994-2006
4.06 If we compare the difference between registrations and deregistration, the result of which
being the growth in stock of VAT registered companies over time, we find that the total
increase of registrations in Westminster is 10,853 since 1994, an 84% increase. In absolute
terms this is far larger than that experienced by Lambeth (1,890), Kensington & Chelsea
(2,050) or even Camden (4,310).
35
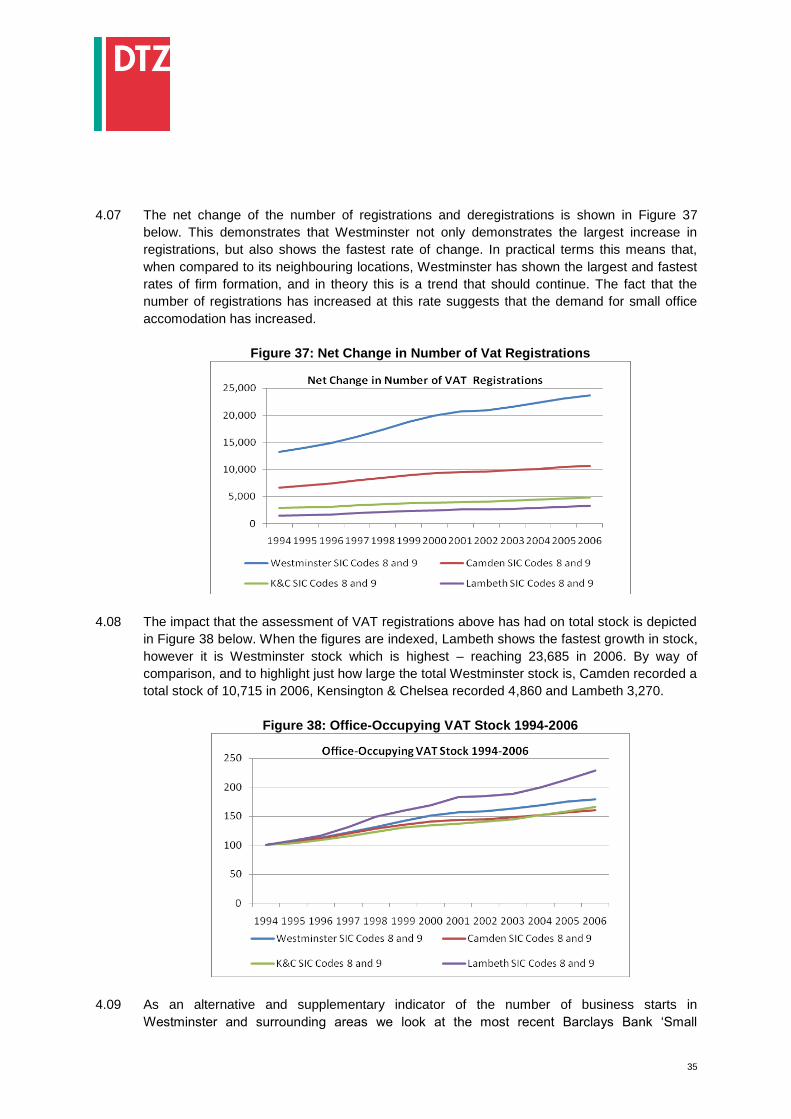
4.07 The net change of the number of registrations and deregistrations is shown in Figure 37
below. This demonstrates that Westminster not only demonstrates the largest increase in
registrations, but also shows the fastest rate of change. In practical terms this means that,
when compared to its neighbouring locations, Westminster has shown the largest and fastest
rates of firm formation, and in theory this is a trend that should continue. The fact that the
number of registrations has increased at this rate suggests that the demand for small office
accomodation has increased.
Figure 37: Net Change in Number of Vat Registrations
4.08 The impact that the assessment of VAT registrations above has had on total stock is depicted
in Figure 38 below. When the figures are indexed, Lambeth shows the fastest growth in stock,
however it is Westminster stock which is highest – reaching 23,685 in 2006. By way of
comparison, and to highlight just how large the total Westminster stock is, Camden recorded a
total stock of 10,715 in 2006, Kensington & Chelsea recorded 4,860 and Lambeth 3,270.
Figure 38: Office-Occupying VAT Stock 1994-2006
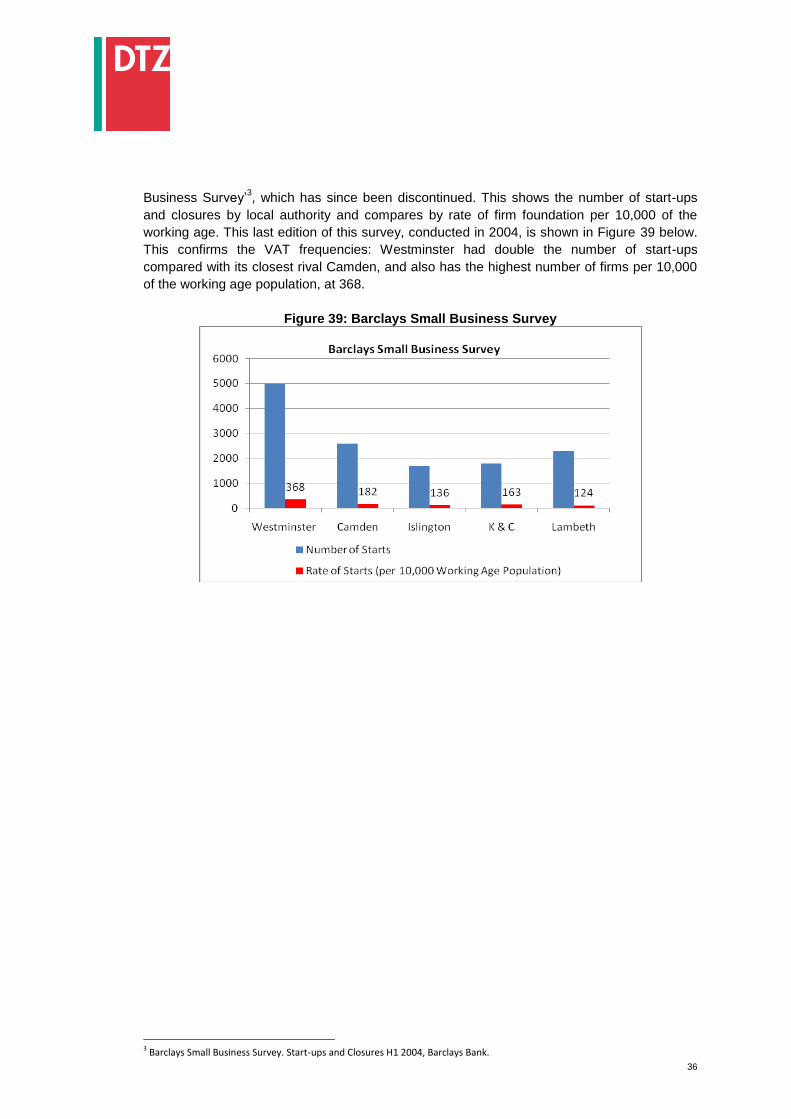
4.09 As an alternative and supplementary indicator of the number of business starts in
Westminster and surrounding areas we look at the most recent Barclays Bank „Small
36
Business Survey‟3, which has since been discontinued. This shows the number of start-ups
and closures by local authority and compares by rate of firm foundation per 10,000 of the
working age. This last edition of this survey, conducted in 2004, is shown in Figure 39 below.
This confirms the VAT frequencies: Westminster had double the number of start-ups
compared with its closest rival Camden, and also has the highest number of firms per 10,000
of the working age population, at 368.
Figure 39: Barclays Small Business Survey
3 Barclays Small Business Survey. Start-ups and Closures H1 2004, Barclays Bank.

37
APPENDIX 5
DEMAND – EMPLOYMENT STRUCTURES AND DISPLACEMENT

38
APPENDIX 5 - DEMAND – EMPLOYMENT STRUCTURES AND DISPLACEMENT
Change in Employment Structure – Comparison of Office-Related Employment and
Small Office Related Employment
5.01 In order to expand on the demand analysis, here we look at recent growth patterns in
employment at the city level, comparing small office occupiers with overall office-based
employment to see if the former is keeping in step with pattern on the wider economy. We
also compare the pattern of employment change between Westminster and neighbouring
boroughs to see if there is any evidence (albeit indirect) of migration from Westminster, a
trend which could be ascribed to pricing or availability.
5.02 Looking at employment structure across the city allows conclusions to be drawn as to how
vigorous business growth is, and how demand is changing from the different businesses
sectors which comprise the local economy. This analysis draws upon Annual Business Survey
data to examine change in employment by sector in Westminster between 1998 and 2006.
Firstly we look at office employment in toto, expressed in terms of a tailor-made compilation of
employees by four digit SIC codes, chosen to encompass as precisely as possible office-
related employment. The data relates to the type of company, not to occupation, and so
encompasses all employees in such companies if located in Westminster.
5.03 In this analysis between 1998 and 2006 overall office-based employment increased by 8%,
from 297,000 to 320,000, giving an average of about 16.25 sq m per person office space, a
plausible gross internal measure average for Central London compared to survey data. The
leading areas of growth were Electronics (a catch-all for the hardware and software
industries), by far the strongest increase at 129%, followed by Business Services, Property,
and Associations (associations and charities). Sectors of declining employment were Industry
and Retailing. The financial sector showed a small decline in employment over the period.
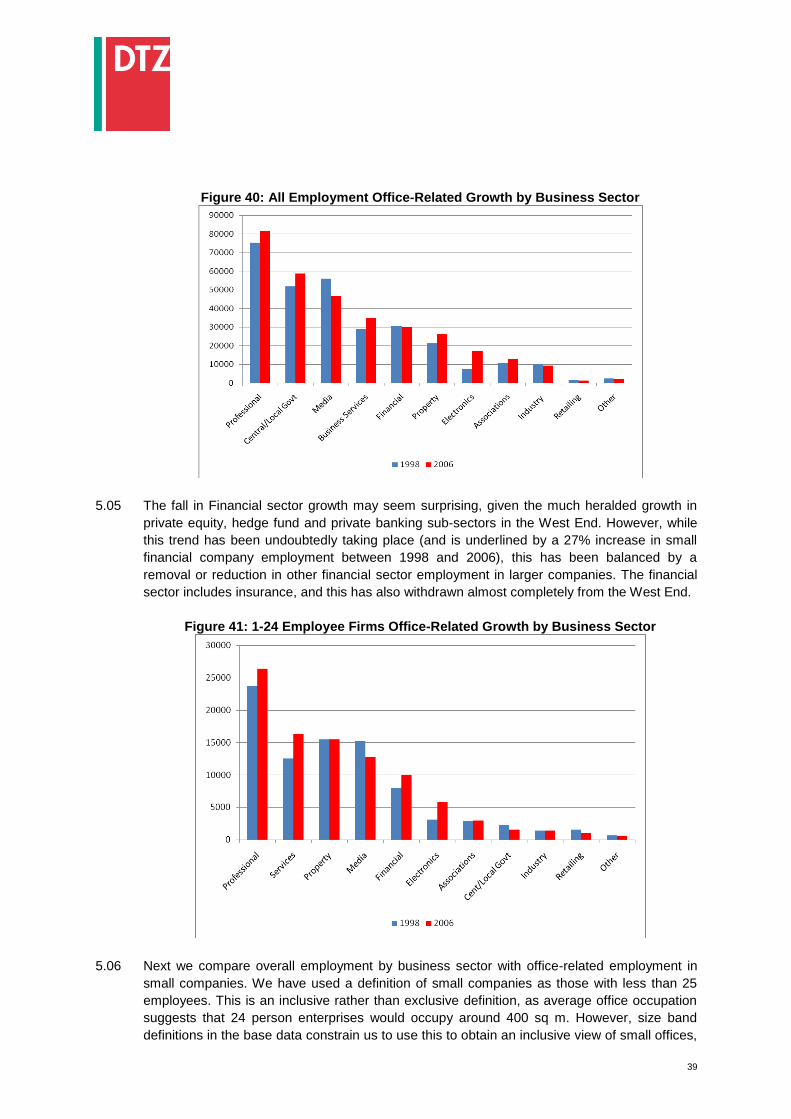
5.04 Professional employment, which grew by 8%, remains the most important single sector of
employment in the city, with a quarter of all office related staff. This is followed by
government, predominantly Central Government, Media and Business Services. Central
Government growth is related to the concentration of London-wide employment in
Westminster within the context of a fall in employment in London and the South East.
39
Figure 40: All Employment Office-Related Growth by Business Sector
5.05 The fall in Financial sector growth may seem surprising, given the much heralded growth in
private equity, hedge fund and private banking sub-sectors in the West End. However, while
this trend has been undoubtedly taking place (and is underlined by a 27% increase in small
financial company employment between 1998 and 2006), this has been balanced by a
removal or reduction in other financial sector employment in larger companies. The financial
sector includes insurance, and this has also withdrawn almost completely from the West End.
Figure 41: 1-24 Employee Firms Office-Related Growth by Business Sector
5.06 Next we compare overall employment by business sector with office-related employment in
small companies. We have used a definition of small companies as those with less than 25
employees. This is an inclusive rather than exclusive definition, as average office occupation
suggests that 24 person enterprises would occupy around 400 sq m. However, size band
definitions in the base data constrain us to use this to obtain an inclusive view of small offices,
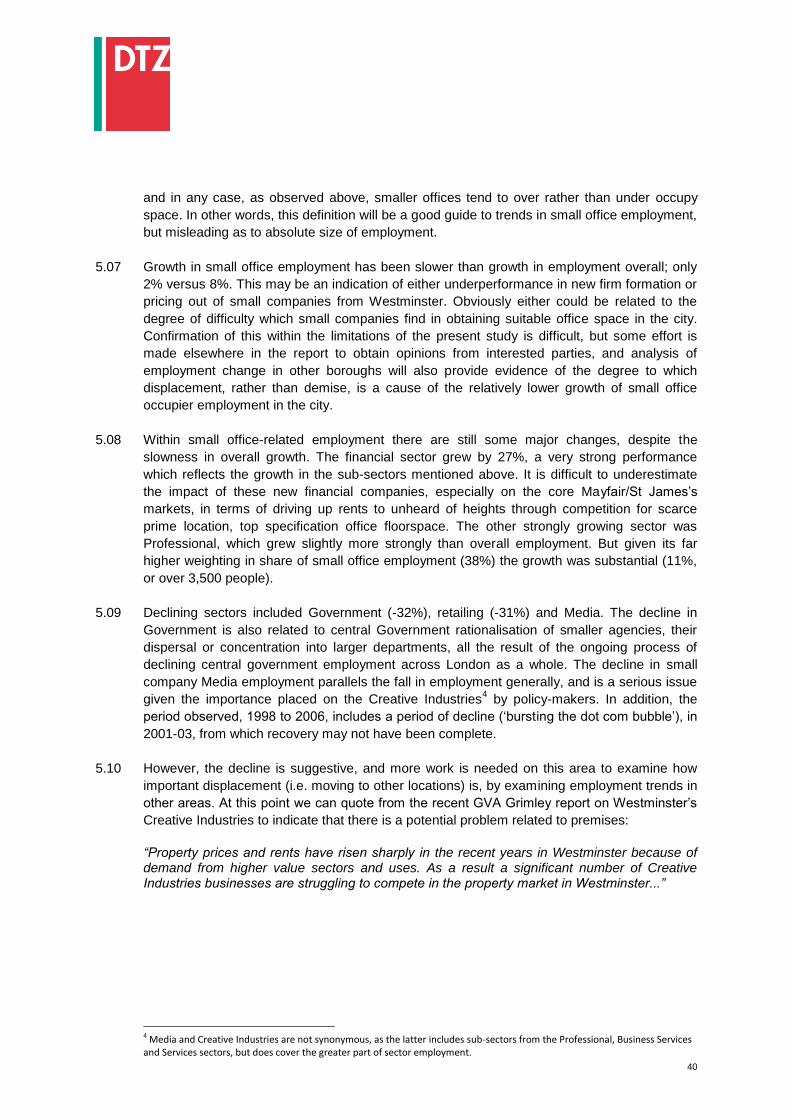
40
and in any case, as observed above, smaller offices tend to over rather than under occupy
space. In other words, this definition will be a good guide to trends in small office employment,
but misleading as to absolute size of employment.
5.07 Growth in small office employment has been slower than growth in employment overall; only
2% versus 8%. This may be an indication of either underperformance in new firm formation or
pricing out of small companies from Westminster. Obviously either could be related to the
degree of difficulty which small companies find in obtaining suitable office space in the city.
Confirmation of this within the limitations of the present study is difficult, but some effort is
made elsewhere in the report to obtain opinions from interested parties, and analysis of
employment change in other boroughs will also provide evidence of the degree to which
displacement, rather than demise, is a cause of the relatively lower growth of small office
occupier employment in the city.
5.08 Within small office-related employment there are still some major changes, despite the
slowness in overall growth. The financial sector grew by 27%, a very strong performance
which reflects the growth in the sub-sectors mentioned above. It is difficult to underestimate
the impact of these new financial companies, especially on the core Mayfair/St James‟s
markets, in terms of driving up rents to unheard of heights through competition for scarce
prime location, top specification office floorspace. The other strongly growing sector was
Professional, which grew slightly more strongly than overall employment. But given its far
higher weighting in share of small office employment (38%) the growth was substantial (11%,
or over 3,500 people).
5.09 Declining sectors included Government (-32%), retailing (-31%) and Media. The decline in
Government is also related to central Government rationalisation of smaller agencies, their
dispersal or concentration into larger departments, all the result of the ongoing process of
declining central government employment across London as a whole. The decline in small
company Media employment parallels the fall in employment generally, and is a serious issue
given the importance placed on the Creative Industries4 by policy-makers. In addition, the
period observed, 1998 to 2006, includes a period of decline („bursting the dot com bubble‟), in
2001-03, from which recovery may not have been complete.
5.10 However, the decline is suggestive, and more work is needed on this area to examine how
important displacement (i.e. moving to other locations) is, by examining employment trends in
other areas. At this point we can quote from the recent GVA Grimley report on Westminster‟s
Creative Industries to indicate that there is a potential problem related to premises:
“Property prices and rents have risen sharply in the recent years in Westminster because of demand from higher value sectors and uses. As a result a significant number of Creative Industries businesses are struggling to compete in the property market in Westminster...”
4 Media and Creative Industries are not synonymous, as the latter includes sub-sectors from the Professional, Business Services and Services sectors, but does cover the greater part of sector employment.

41
APPENDIX 6
WESTMINSTER COUNCIL POLICY COM 4
42
APPENDIX 6: WESTMINSTER COUNCIL POLICY COM 4 POLICY COM 4: RETENTION AND PROVISION OF SMALL OFFICES (A) Planning permission for the redevelopment of small offices or their alteration within Central Westminster will not be granted where: 1 the small offices make a particular contribution to the character and function of Central
Westminster 2 the premises have been in long term use as small offices for a period of ten years or more 3 because of their size, layout and structural condition they are likely to be particularly suited to
such use. (B) The loss of small offices within the North West Westminster Special Policy area will be
resisted through policy NWW1. (C) All proposals for new office development should normally be designed with the accesses and
service cores located so as to facilitate the sub-division of the buildings to enable provision of a range of small office accommodation.
__________________________________________________________________ Policy application 2.44 The City Council regards „small offices‟ as those with less than 250 sq m of floorspace. Policy COM 4 will apply to offices below this threshold. 2.45 Existing small offices contribute to the provision of local employment opportunities in the North West Westminster area and will generally be protected to assist the regeneration of the area. (See Chapter 5: Policies for North West Westminster, Section B). Reasons 2.46 The City Council wishes to maintain Westminster‟s stock of accommodation for small and growing businesses. This accommodation meets a wide range of demand for small and very small units. 2.47 In the London Plan, the Mayor‟s overall policy on developing London‟s economy includes the aim, in policy 3B.1, of seeking “a range of premises of different types, sizes and costs to meet the needs of different sectors of the economy and firms of different types and sizes”. The Mayor‟s economic development strategy, published in 2005, recognised that London‟s enterprises, especially small and medium enterprises, need an adequate supply of suitable workspaces. 2.48 The supply of small offices in Westminster is particularly valuable in accommodating the activities illustrated in Chapter 1: Westminster‟s Central Area, in Tables 1.1 and 1.2, as Central London activities and supporting activities. In many cases, the firms have strong linkages with, and supply supporting services to, other Central London activities. Some firms such as agents, publishers and other media-based activities are characteristic of particular areas. Losses of small offices may result in the loss of appropriate Central London activities and supporting activities which could affect the character and functioning of Central London. 2.49 There is a need to provide suitable accommodation for new enterprise and innovation within the heart of the City to retain and add to its vitality and character. The high values and security of asset values in the central part of the City attracts much institutional investment in office development. The City Council‟s concern is that the requirements of occupiers is given due weight alongside those of institutional lenders, investors and landlords which have in the past tended to seek large single lettings to established „blue chip‟ tenants. Therefore, the City Council will seek the retention and provision of a range of office accommodation.

43
2.50 An important source of small offices is the subdivision and letting of larger office buildings, involving works which generally do not require planning permission. Premises are often subdivided and then let on a short term basis timed to their refurbishment or redevelopment. New office buildings may also be sub-let on a short term basis by the main occupier, who may choose to rent out space that is currently unused but which may be required to accommodate its future business expansion. In either case, because of the limited leases and often lower rental levels this supply of small office accommodation is particularly attractive to new businesses looking to start up or become established in Westminster. This is an effective use of office accommodation and the City Council will not seek to prevent the redevelopment or refurbishment of large offices that have been let as small offices on a short-term basis. 2.51 A more recent trend has been the provision of serviced suites of small offices which share centralised support functions, such as secretarial and administrative services and meeting rooms, within a larger office building. These also provide a valuable supply of smaller office accommodation to meet the needs of smaller businesses in Westminster. 2.52 Some small office accommodation is provided in premises which, because of their size and layout, are particularly suited to small office use, often being originally built as houses or workshops. These buildings ensure a continued supply of suitable accommodation for small businesses. Such buildings are found throughout the Central Activities Zone: the local economy benefits from the concentration and diversity of small businesses that such buildings accommodate. In such areas the safeguarding of long-standing small offices contributes to the character and function of these areas as well as to the economy as a whole.

44
APPENDIX 7
DTZ RESEARCH ALL SMALL OFFICE AND INDUSTRY CLUSTER MAPS
45
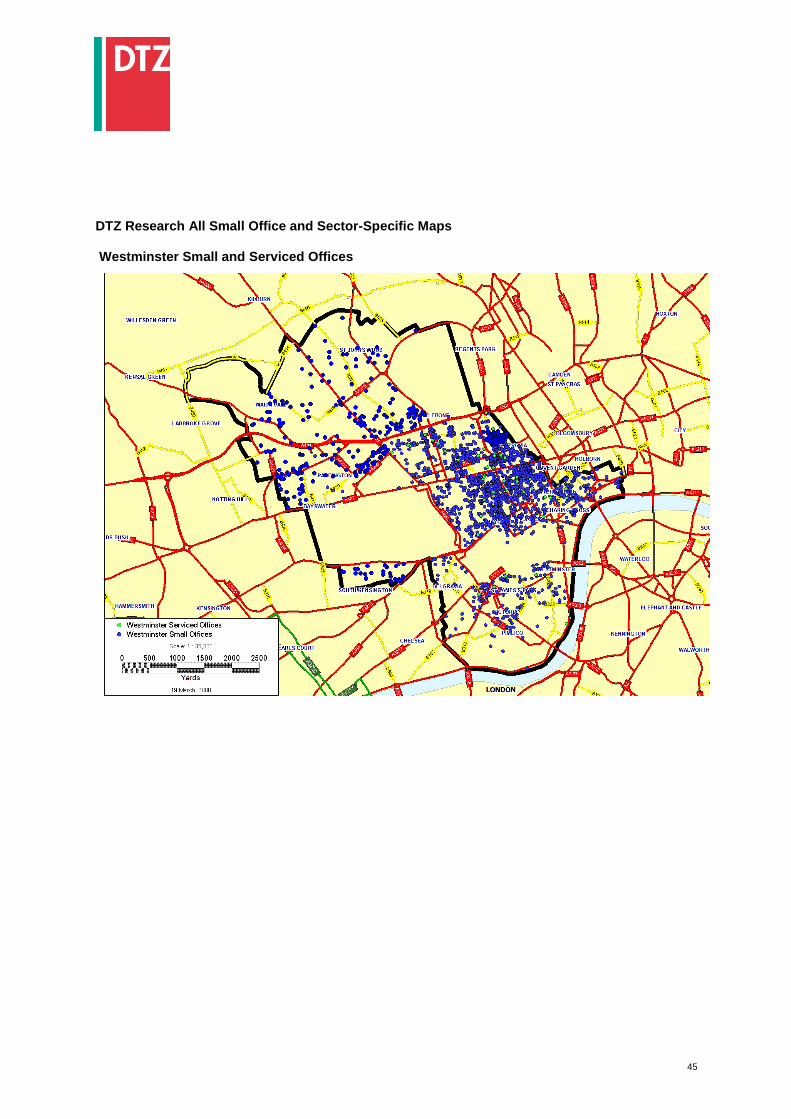
DTZ Research All Small Office and Sector-Specific Maps Westminster Small and Serviced Offices
46
All Westminster Small Offices

47
Westminster Small Offices - Associations
48
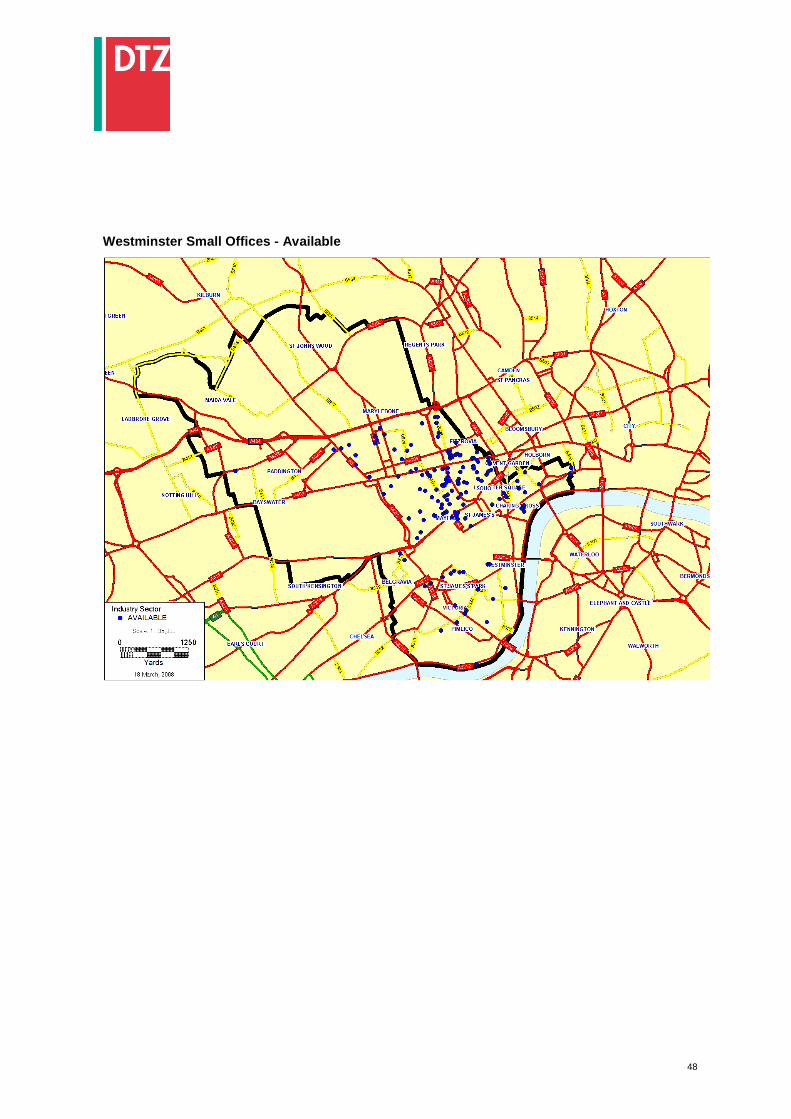
Westminster Small Offices - Available
49
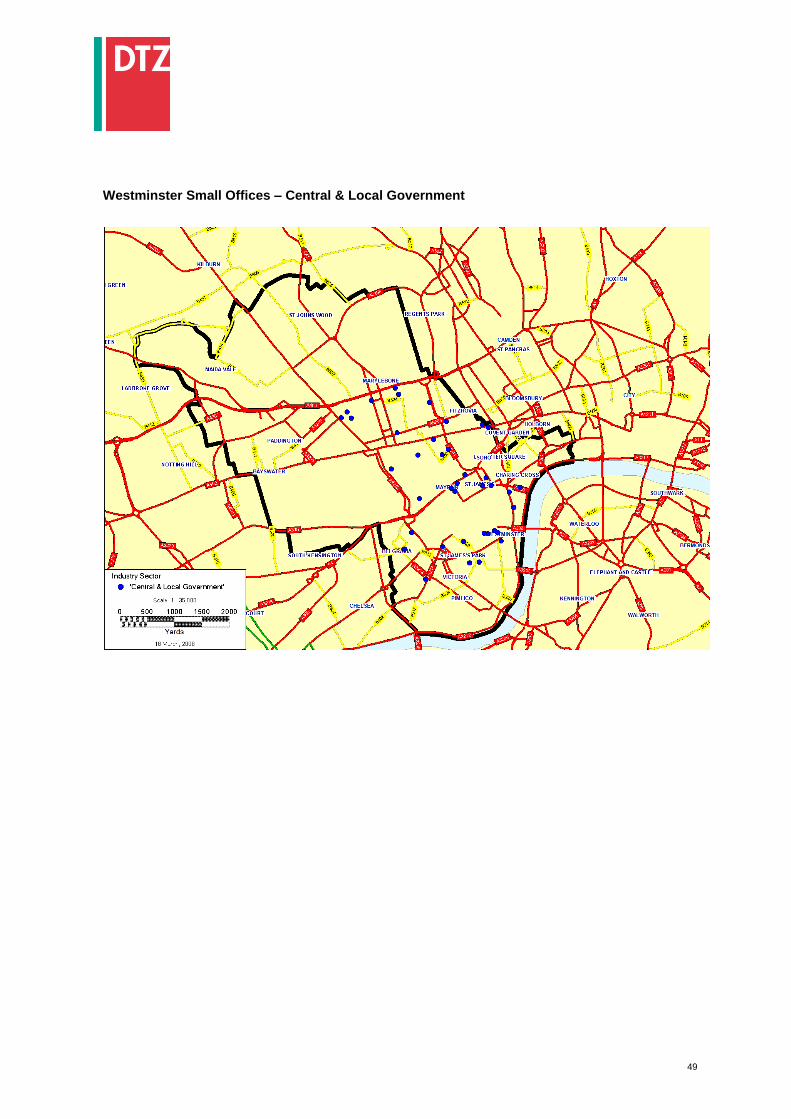
Westminster Small Offices – Central & Local Government
50
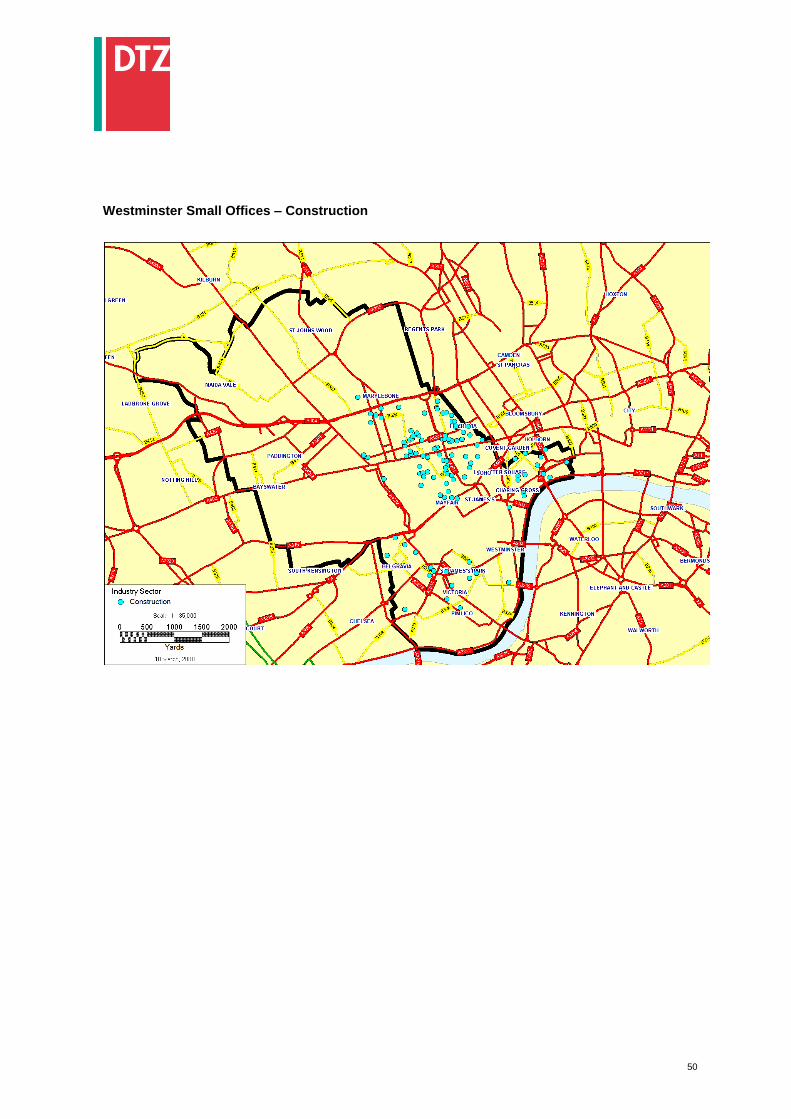
Westminster Small Offices – Construction
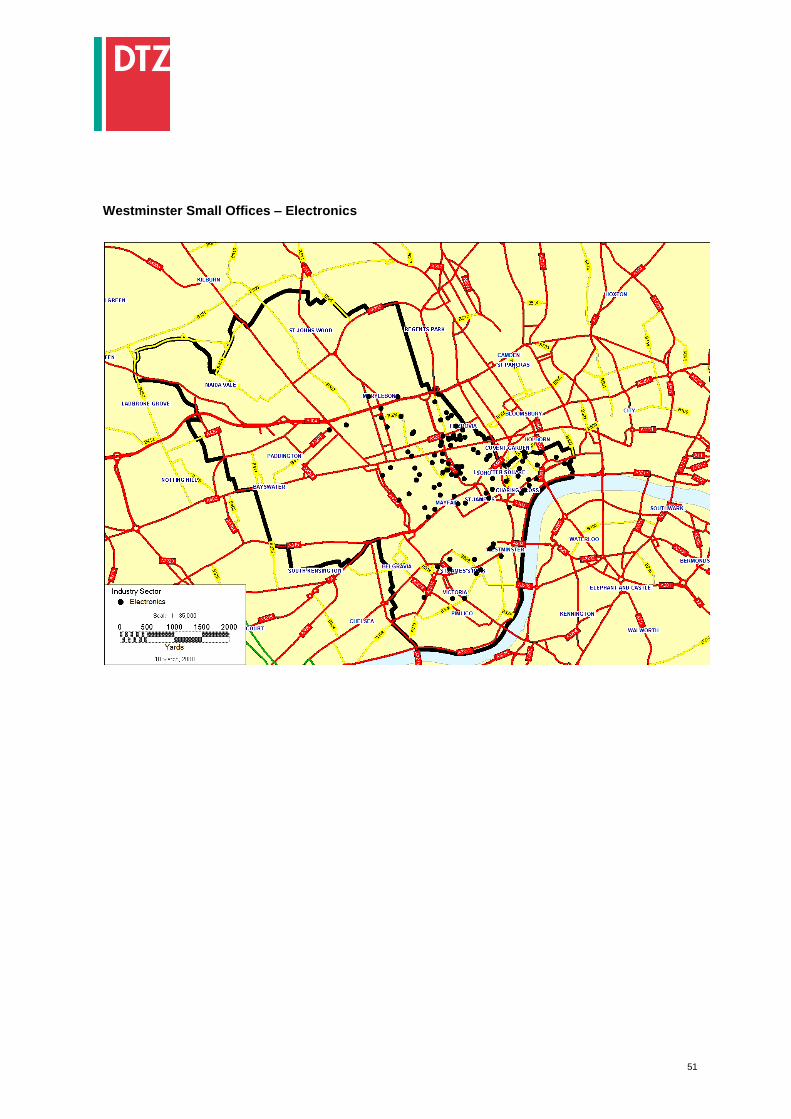
51
Westminster Small Offices – Electronics

52
Westminster Small Offices – Financial
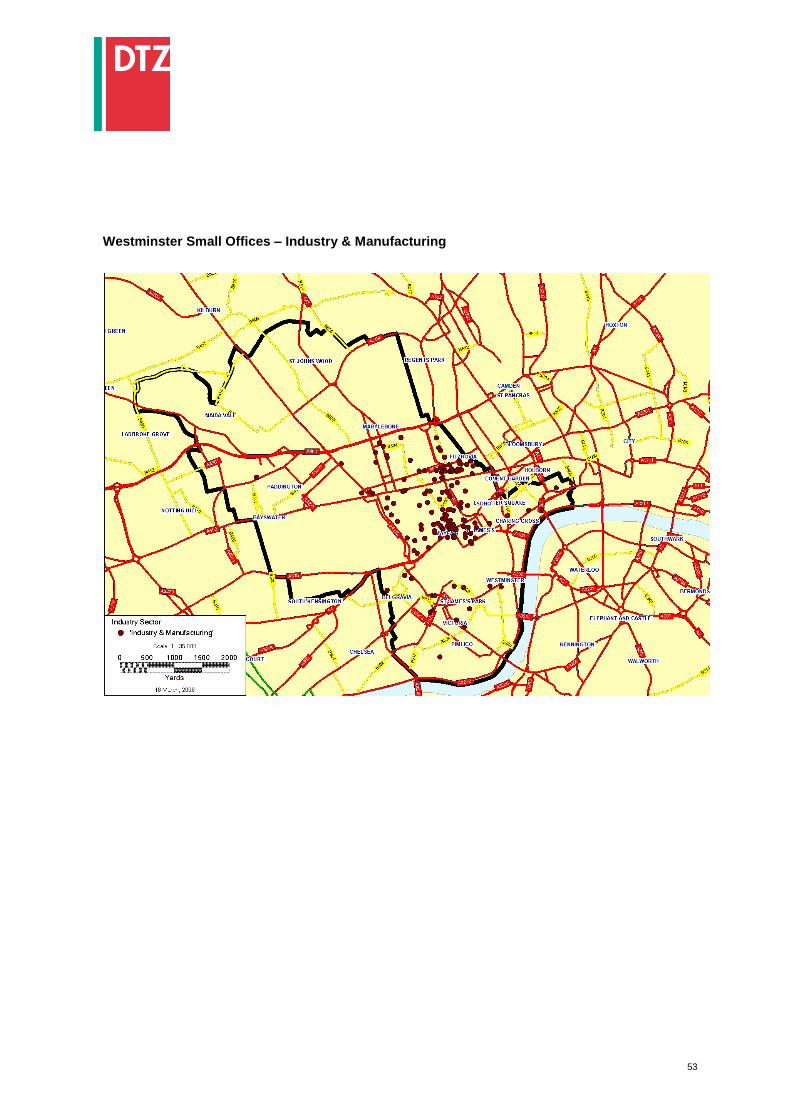
53
Westminster Small Offices – Industry & Manufacturing

54
Westminster Small Offices – Leisure
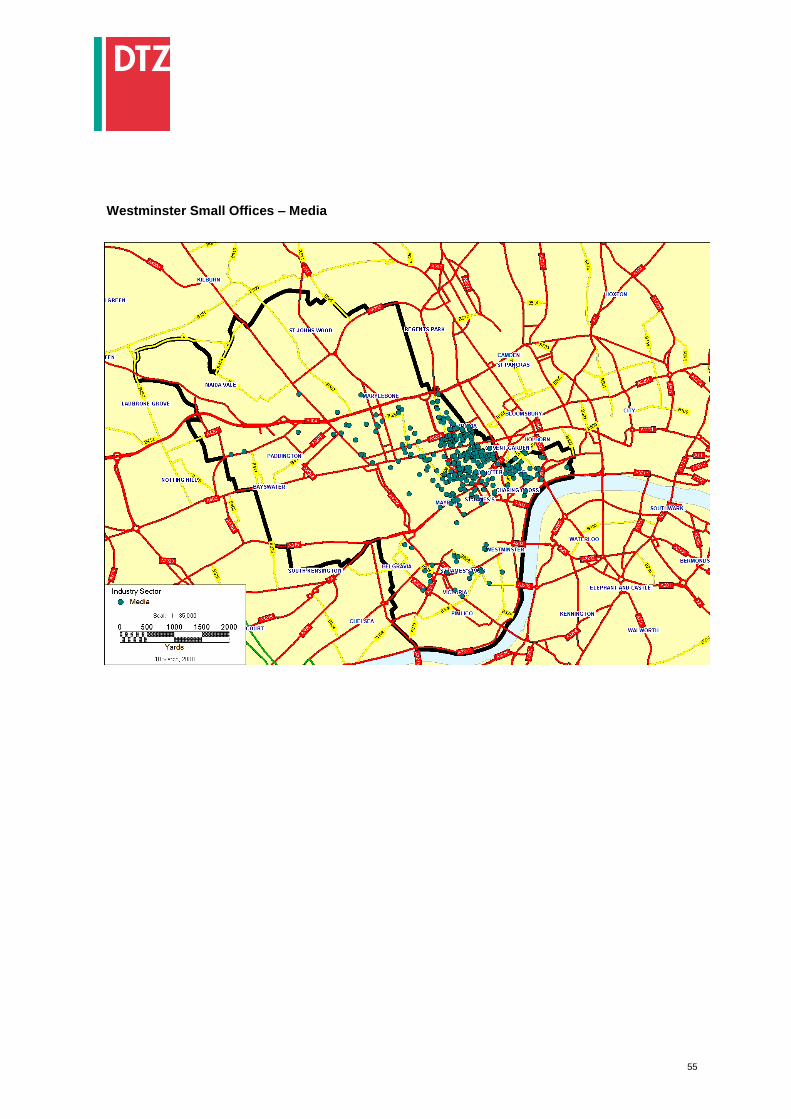
55
Westminster Small Offices – Media
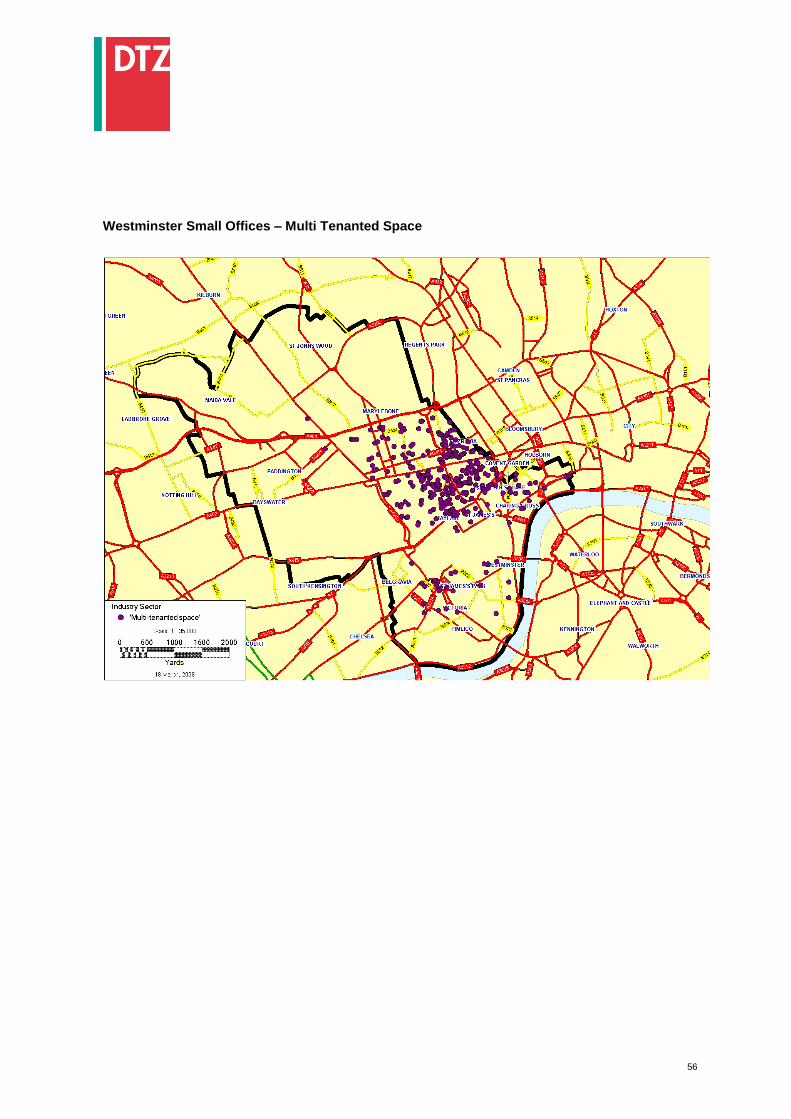
56
Westminster Small Offices – Multi Tenanted Space
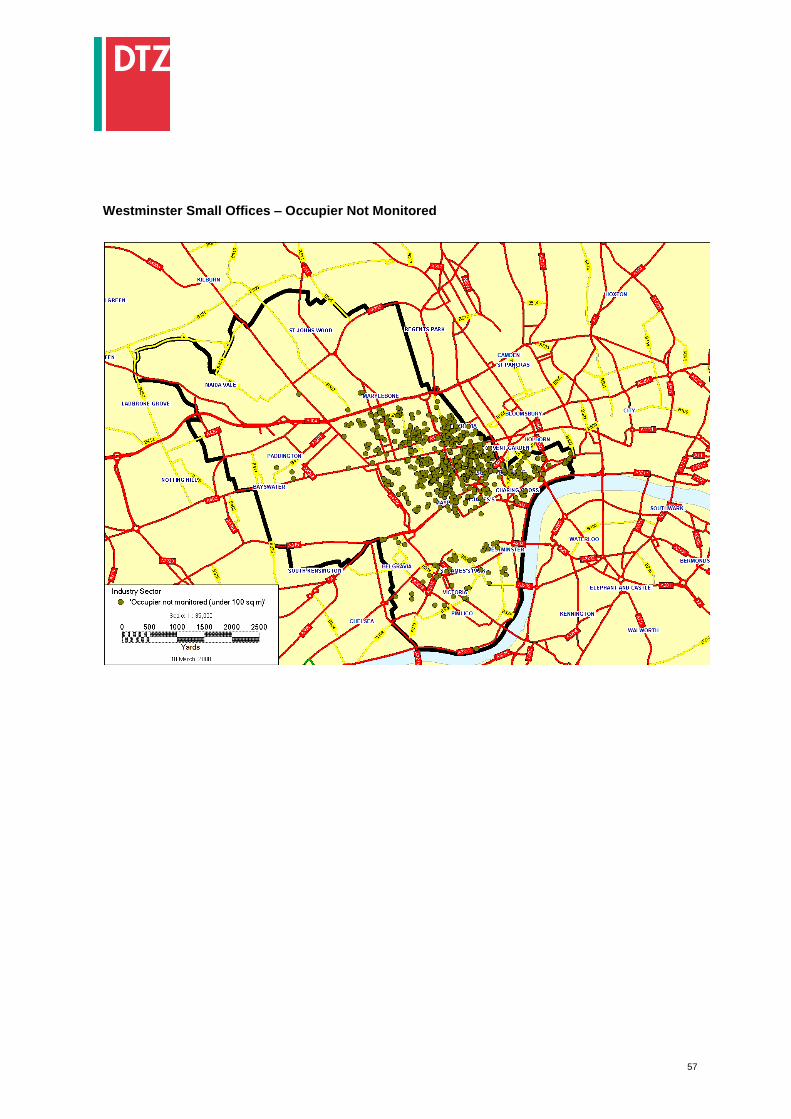
57
Westminster Small Offices – Occupier Not Monitored

58
Westminster Small Offices – Others

59
Westminster Small Offices – Professional
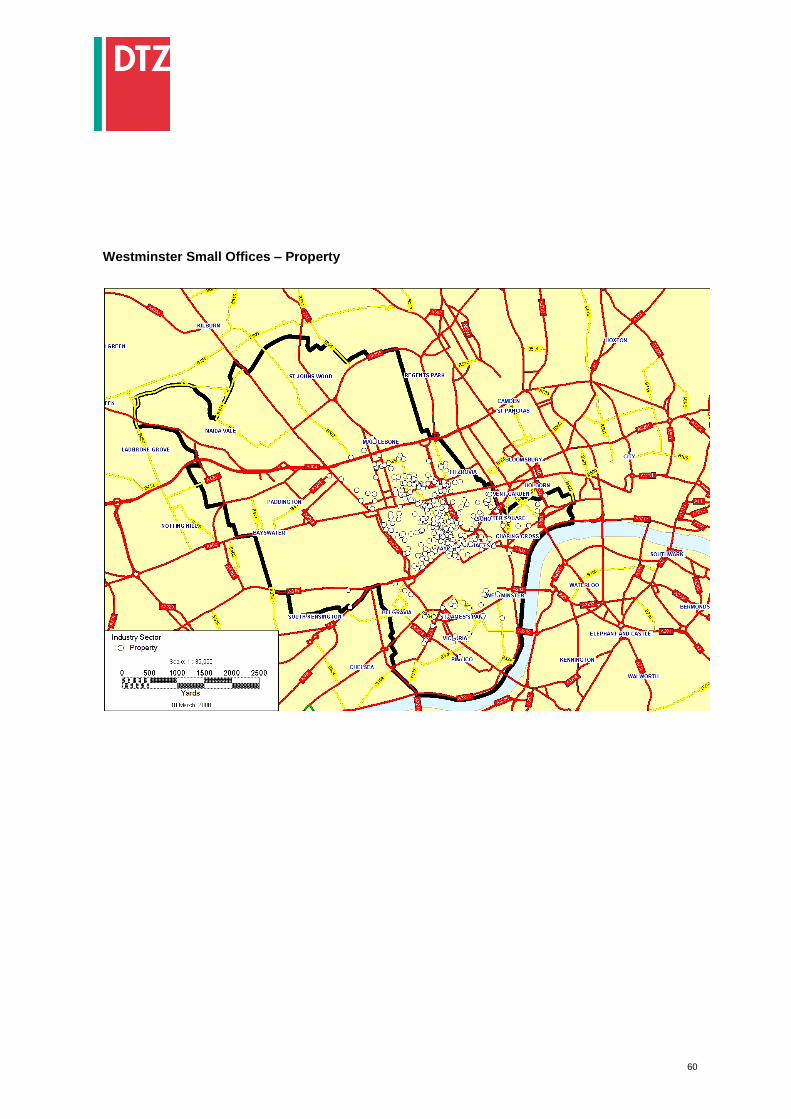
60
Westminster Small Offices – Property
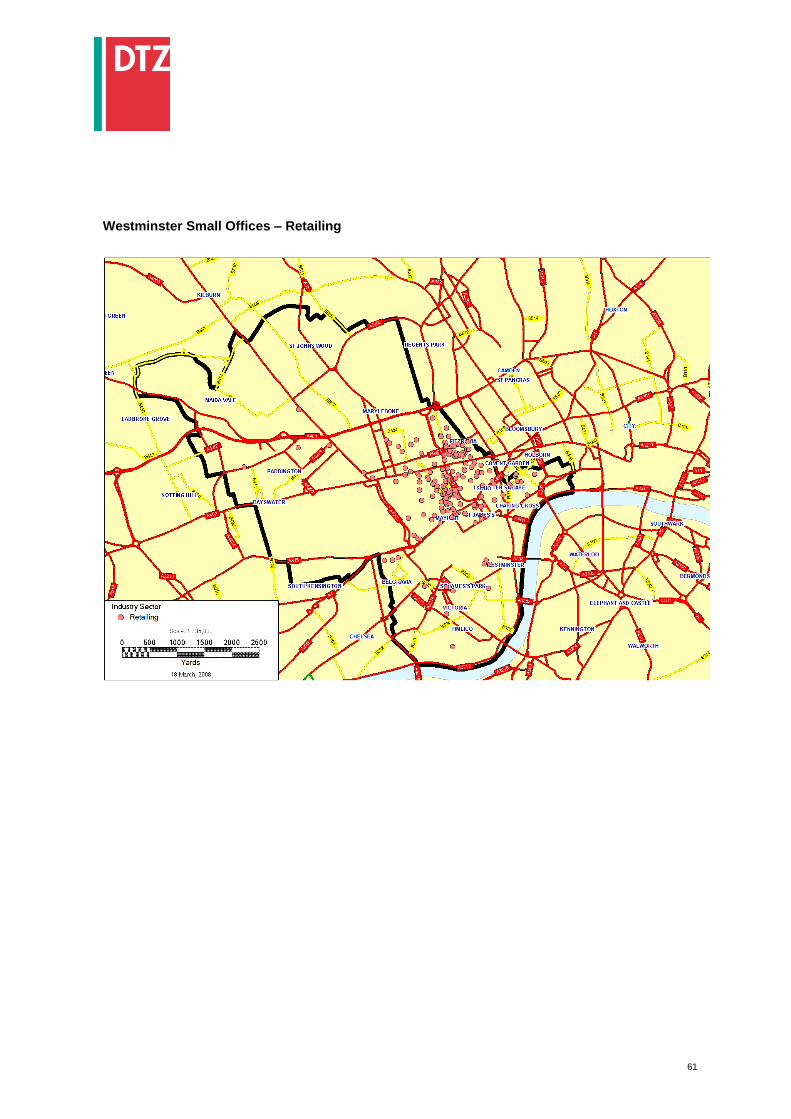
61
Westminster Small Offices – Retailing
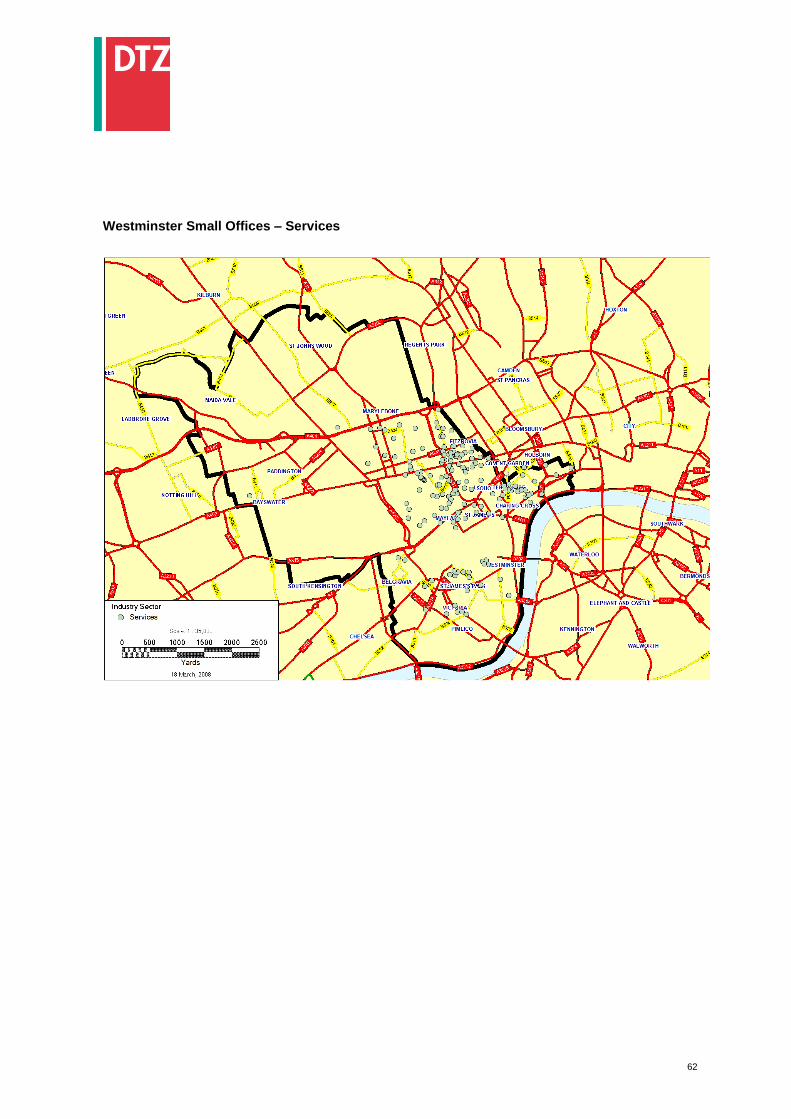
62
Westminster Small Offices – Services
63
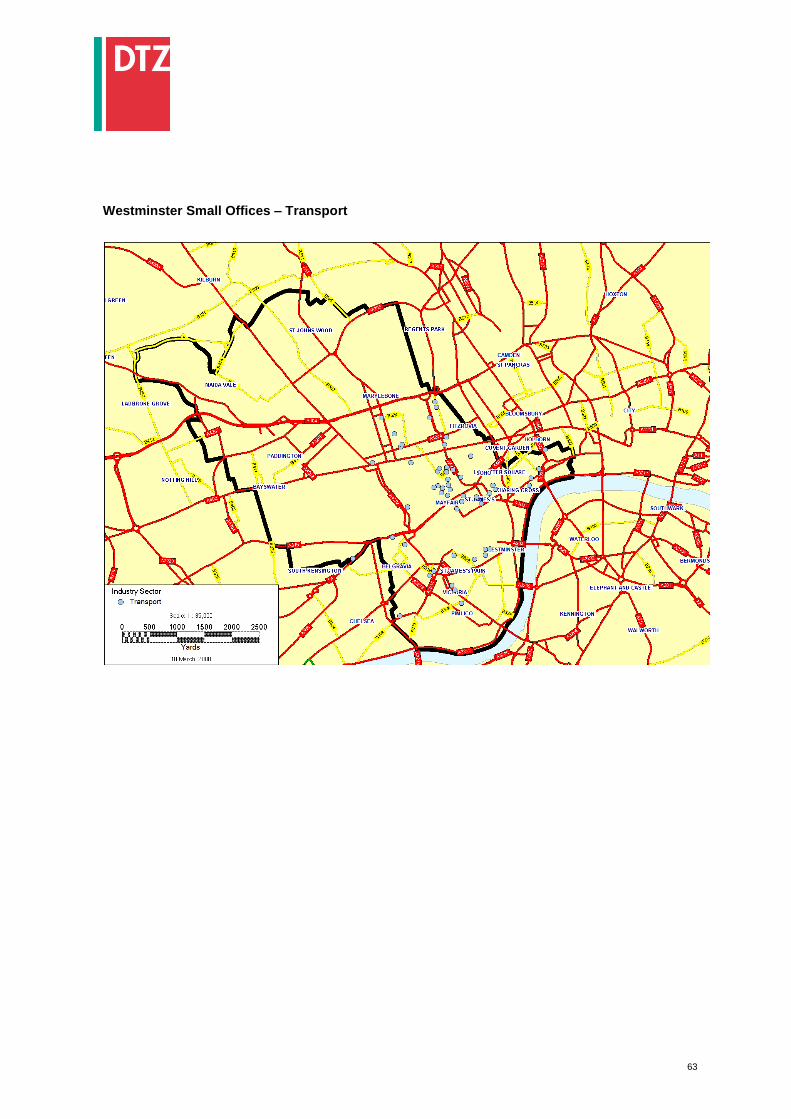
Westminster Small Offices – Transport
64
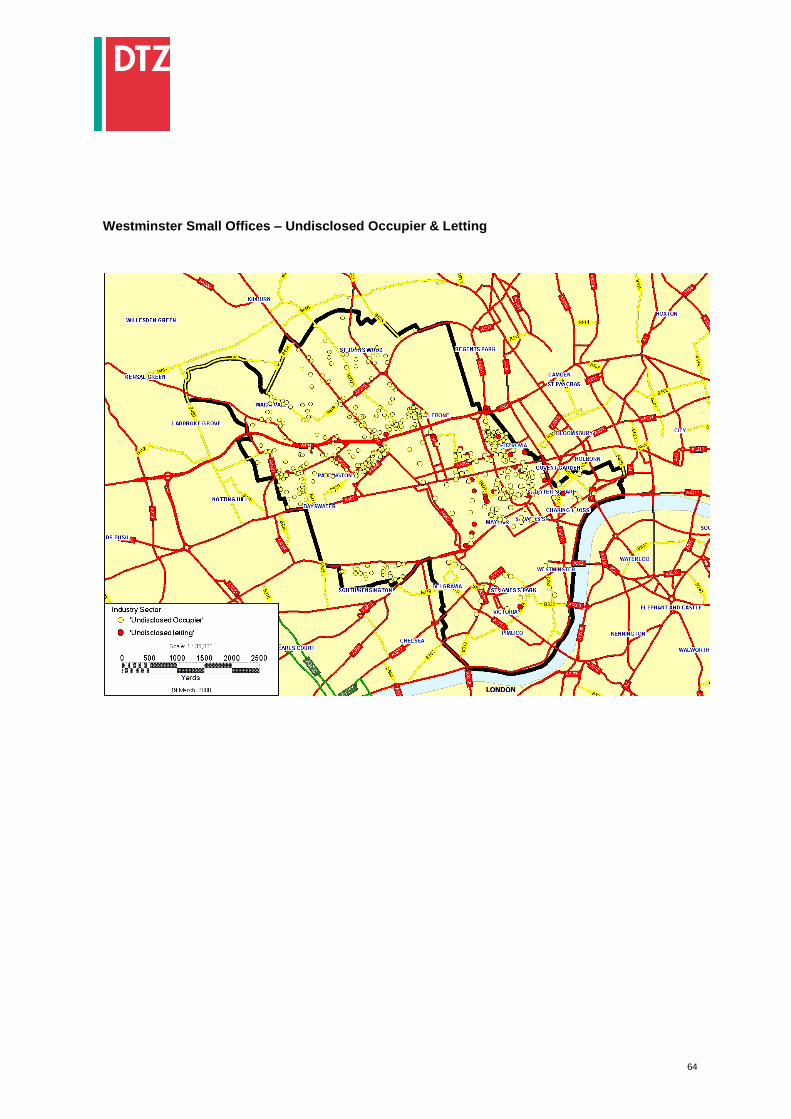
Westminster Small Offices – Undisclosed Occupier & Letting
65
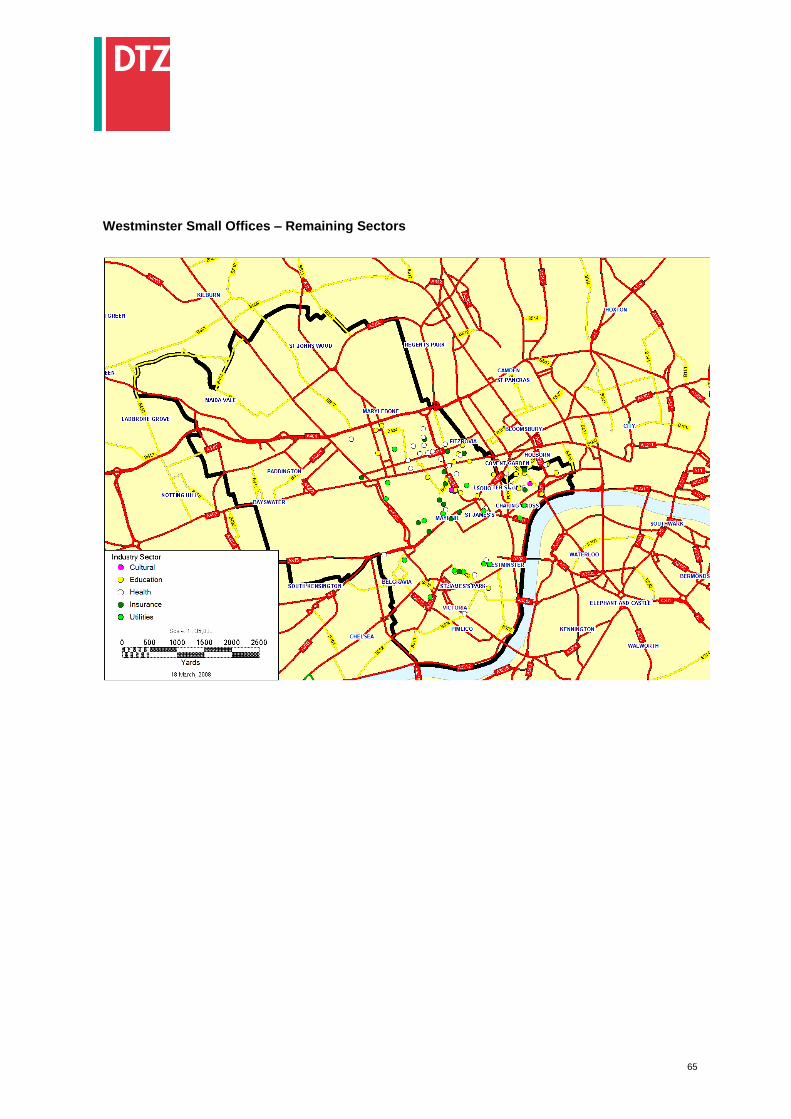
Westminster Small Offices – Remaining Sectors

66
APPENDIX 8
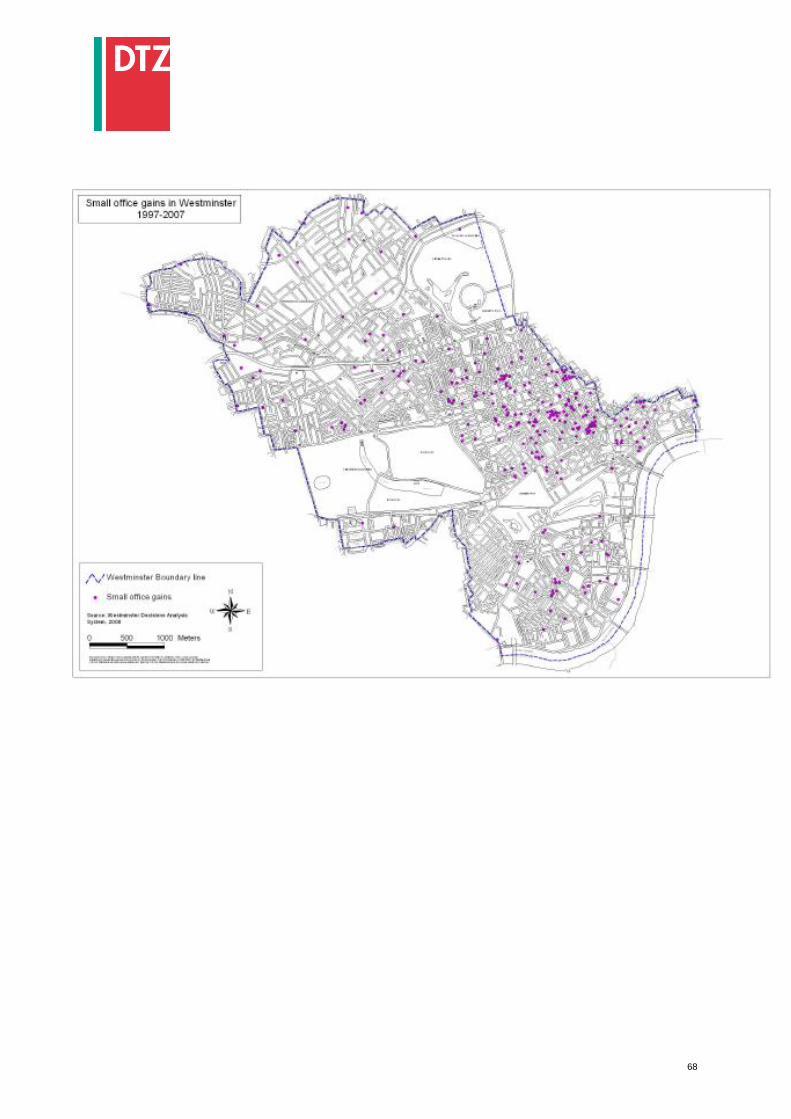
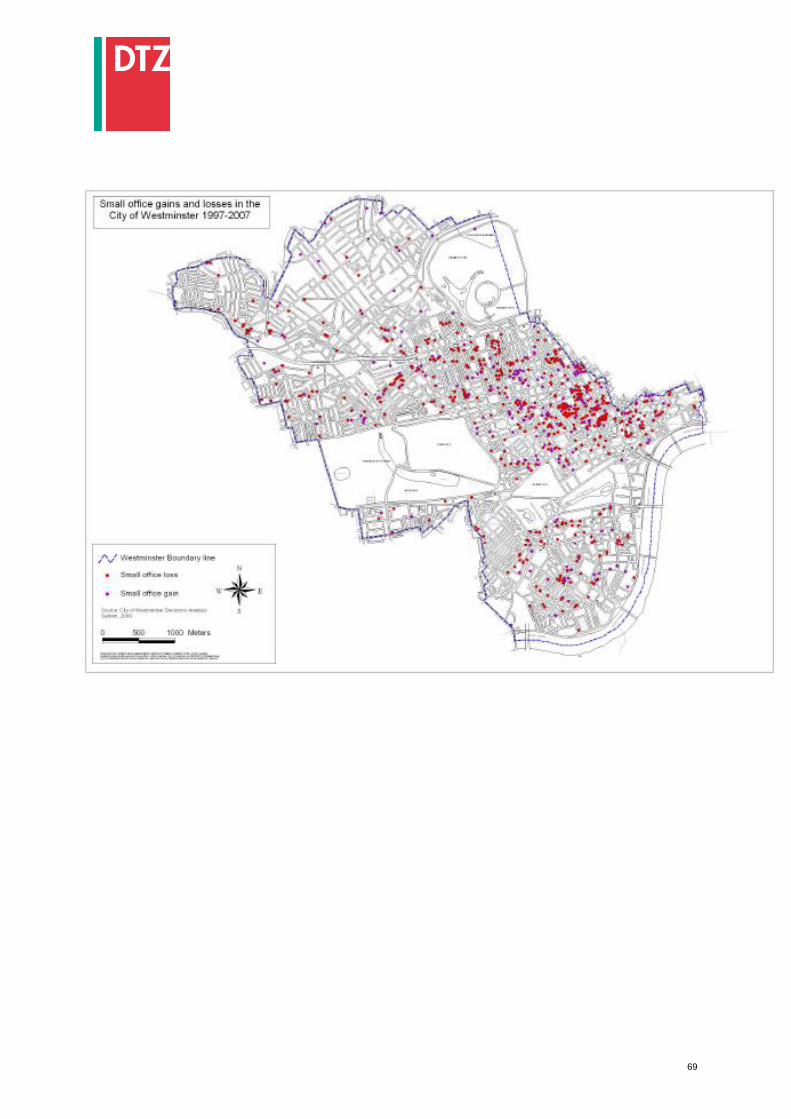
WESTMINSTER COUNCIL’S SMALL OFFICE LOSSES AND GAINS MAPS
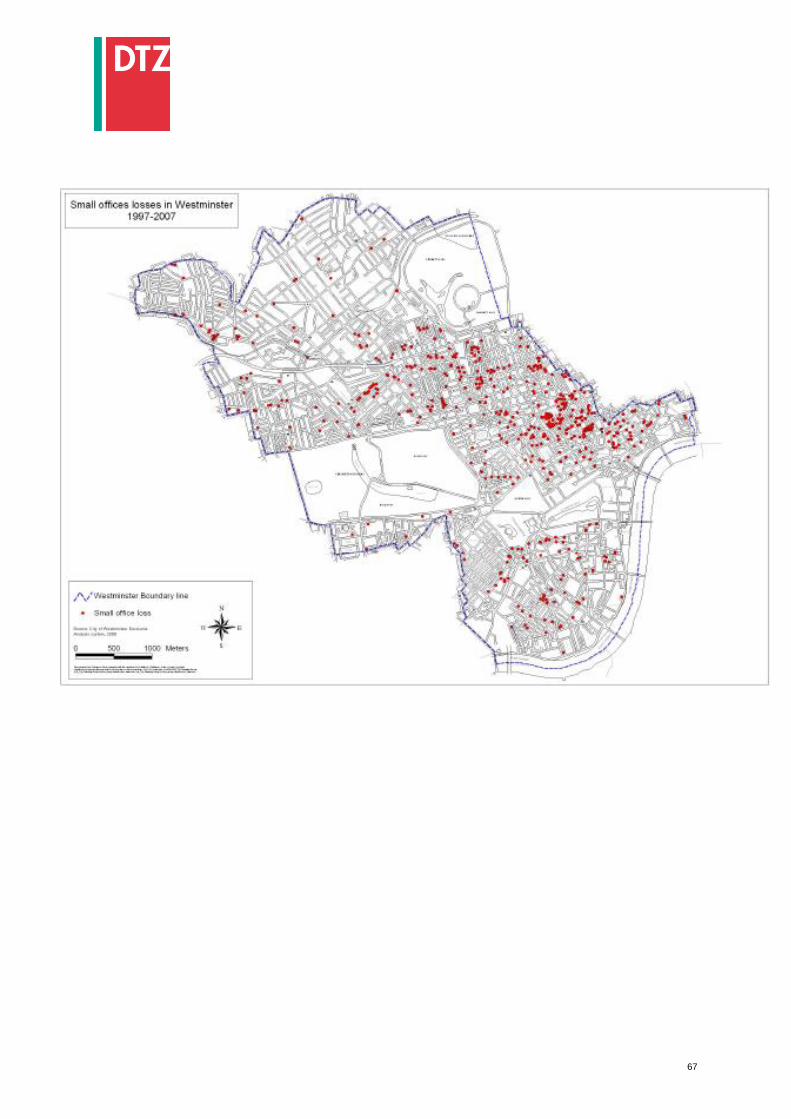
67
68
69

70
APPENDIX 9
‘GEOPLAN’ WESTMINSTER POSTCODE SECTOR MAP
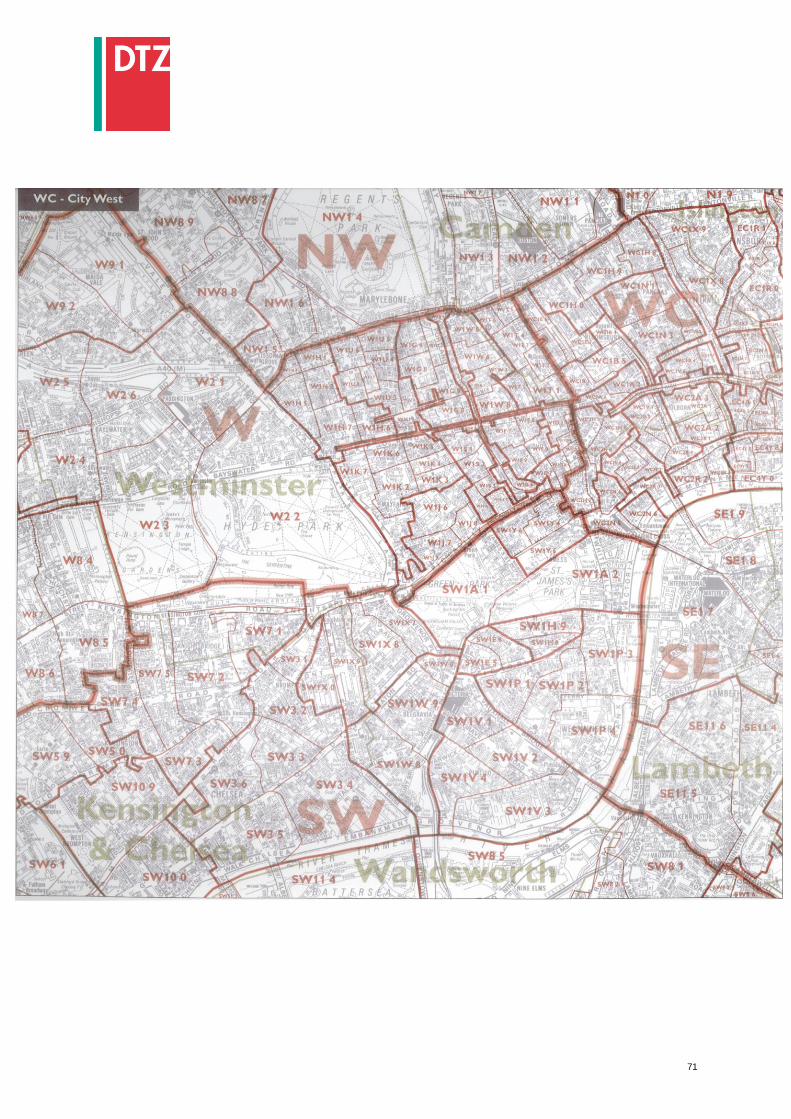
71
72
SELECT BIBLIOGRAPHY
1. London‟s Central Business District: Its global importance. GLAECONOMICS. January 2008 2. DTZ Research CORe. Central Offices Research. November 2007/March 2008. 3. Drivers Jonas. Office Trends. Mayfair & St James‟s Occupier Survey 2007. August 2007. 4. 1-11 Hay Hill and 1-1A and 2 Grafton Street, W1 Planning Application together with
accompanying small office suite availability report compiled by GVA Saxon Law and Knight Frank. 24 October 2007.
5. City of Westminster UDP adopted January 2007. 6. Westminster‟s Creative Industries June 2007 – City of Westminster, BOP, GVA Grimley. 7. WPOA note on serviced office space 2006. 8. Economic Development Strategy 2007 – 2010, Draft for Consultation September 2007. 9. City of Westminster - Core Strategy – Issues and Options, Local Development Framework.
May 2007. 10. 4-Stage Flexible Managed Office Market Reports. DTZ Research. May 2005 onwards. 11. London Office Policy Review 2007. Mayor of London. May 2007. 12. Central London Offices Property Forecasts. DTZ Research. February 2008. 13. UK Property Market Indicators. DTZ Research. Q4 2007. 14. UK Property Markets Overview. DTZ Research. Q4 2007. 15. Consultation Paper on a new Planning Policy Statement 4: Planning for Sustainable
Economic Development. Communities and Local Government. December 2007. 16. Barclays Small Business Survey. Start-ups and Closures Half One 2004

73