Embed Size (px)
Citation preview


CITY OF SAN LEANDRO, CALIFORNIA
COMPREHENSIVE ANNUAL FINANCIAL REPORT FOR THE FISCAL YEAR ENDED
JUNE 30, 2020
PREPARED BY: City of San Leandro – Finance Department

CITY OF SAN LEANDRO Comprehensive Annual Financial Report
For the Year Ended June 30, 2020
Table of Contents
i
INTRODUCTORY SECTION
Table of Contents ........................................................................................................................................... i
Letter of Transmittal ..................................................................................................................................... v
Organizational Chart ................................................................................................................................... xii
Principal Officers ........................................................................................................................................ xii
Location Map ............................................................................................................................................. xiv
FINANCIAL SECTION
Independent Auditors’ Report .................................................................................................................................... 1 Management’s Discussion and Analysis ................................................................................................... 3 Basic Financial Statements:
Government-Wide Financial Statements:
Statement of Net Position ................................................................................................. 21 Statement of Activities and Changes in Net Position ....................................................... 22
Fund Financial Statements: Government Funds Financial Statements:
Balance Sheet .................................................................................................................... 28 Reconciliation of the Governmental Funds Balance Sheet with the
Statement of Net Position .................................................................................................. 29 Statement of Revenues, Expenditures and Changes in Fund Balances ............................ 30 Reconciliation of the Net Change in Fund Balances – Total Governmental Funds
with the Statement of Activities ........................................................................................ 31
Proprietary Funds Financial Statements: Statement of Net Position ................................................................................................. 34 Statement of Revenues, Expenses and Changes in Fund Net Position ............................. 35 Statement of Cash Flows .................................................................................................. 36
Fiduciary Fund Financial Statement: Statement of Fiduciary Net Position ................................................................................. 38 Statement of Changes in Fiduciary Net Position .............................................................. 39

CITY OF SAN LEANDRO Comprehensive Annual Financial Report
For the Year Ended June 30, 2020
Table of Contents
ii
FINANCIAL SECTION (Continued)
Index to Notes to Basic Financial Statements ............................................................................................. 41
Notes to Basic Financial Statements ........................................................................................................... 42
Required Supplementary Information:
Schedule of Changes in the Net Pension Liability and Related Ratios ............................. 92 Schedule of Contributions – Miscellaneous Plan ............................................................. 93 Schedule of the Plan’s Proportionate Share of the Net Pension Liability and Related Ratios as of the Measurement Date ................................................................... 94
Schedule of Contributions – Safety Plan .......................................................................... 95
Schedule of Changes in the Net OPEB Liability and Related Ratios ............................... 96
Schedule of Contributions – Single-Employer Plan ......................................................... 97
Schedule of Revenues, Expenditures and Changes in Fund Balances – Budget and Actual – General Fund .................................................................................................... 98 Notes to Required Supplementary Information ................................................................ 99
Supplementary Information:
Schedule of Revenues, Expenditures and Changes in Fund Balances – Budget and Actual – Capital Improvement Capital Projects Fund .................................................. 102
Non-Major Governmental Funds: Combining Balance Sheet ............................................................................................... 106 Combining Statement of Revenue, Expenditures and Changes in Fund Balances ......... 110 Schedule of Revenues, Expenditures and Changes in Fund Balances – Budget and Actual – Non-Major Governmental Funds ................................................................... 114
Non-Major Enterprise Funds:
Combining Statement of Net Position ............................................................................ 138 Combining Statement of Revenues, Expenses, and Changes in Net Position ................ 139 Combining Statement of Cash Flows ............................................................................. 140

CITY OF SAN LEANDRO Comprehensive Annual Financial Report
For the Year Ended June 30, 2020
Table of Contents
iii
FINANCIAL SECTION (Continued)
Internal Service Funds:
Combining Statement of Net Position ............................................................................ 142 Combining Statement of Revenues, Expenses and Changes in Fund Net Position ........ 143 Combining Statement of Cash Flows ............................................................................. 144
Fiduciary Fund Financial Statements:
Combining Statement of Assets and Liabilities – Agency Funds .................................. 146 Combining Statement of Changes in Assets and Liabilities – Agency Funds ................ 147
STATISTICAL SECTION
Net Position by Component – Last Ten Fiscal Years ............................................................................... 153 Changes in Net Position – Last Ten Fiscal Years ..................................................................................... 154 Program Revenues by Function/Program – Last Ten Fiscal Years .......................................................... 155 Fund Balance of Governmental Funds – Last Ten Fiscal Years ............................................................... 156 General Governmental Revenues by Source – Last Ten Fiscal Years ...................................................... 157 Changes in Fund Balance of Governmental Funds – Last Ten Years ...................................................... 158 Direct and Overlapping Property Tax Rates – Last Ten Fiscal Years ...................................................... 161 Assessed Value of Taxable Property – Last Ten Fiscal Years .................................................................. 162 Net Assessed Value of Property by Use Code, Citywide – Last Three Fiscal Years ............................... 163 Principal Property Tax Payers – Current Fiscal Year and Nine Years Ago ............................................. 164 Property Tax Levies and Collections – Last Ten Fiscal Years ................................................................. 165 Historical Sales Tax Amount by Benchmark Year – Last Nine Fiscal Years at Quarter 1 (Q1) .............. 166 Principal Sales Tax Produces – Current Fiscal Year and Nine Years Ago ............................................... 167 Sewer Rates – Last Ten Fiscal Years ........................................................................................................ 168 Number of Permits and Valuation of Taxable Transactions – Last Ten Calendar Years ......................... 169 Direct and Overlapping Debt – As of June 30, 2018 ................................................................................ 173 Pledged-Revenue Coverage – Last Ten Fiscal Years ............................................................................... 174 Computation of Legal Debt Margin – Last Ten Fiscal Years ................................................................... 175 Ratios of General Bonded Debt Outstanding ............................................................................................ 176 Ratios of Outstanding Debt by Type – Last Ten Fiscal Years .................................................................. 177 Demographic and Economic Statistics – Last Ten Fiscal Years ............................................................... 181 Principals Employers – Current Year and Eight Years Ago ..................................................................... 182 Full-Time and Part-Time City Employees by Function – Last Ten Fiscal Years ..................................... 185 Operating Indicators by Function – Last Ten Fiscal Years ....................................................................... 186 Capital Asset Statistics by Function – Last Ten Fiscal Years ................................................................... 187


January 26, 2021
Honorable Mayor and Members of the City Council City of San Leandro San Leandro, CA 94577
Dear Mayor and Members of the City Council:
The Comprehensive Annual Financial Report (CAFR) for the City of San Leandro is hereby submitted for the year ended June 30, 2020. Responsibility for both the accuracy of the data and completeness and fairness of the presentation, including all disclosures, rests with the City. To the best of our knowledge and belief, the enclosed information is accurate in all material respects and is reported in a manner designed to fairly present the City’s financial position and results of operations of all funds. All disclosures necessary to understand the City’s financial activities are included.
Section 555 of the City Charter requires an annual independent audit of the City’s fiscal affairs. This report is published to fulfill this requirement for the fiscal year ending June 30, 2020.
This report consists of management’s representations concerning the finances of the City. To provide a reasonable basis for making these representations, management established a comprehensive internal control framework designed to both protect the City’s assets from loss, theft, or misuse, compiled sufficient reliable information for the preparation of the City’s financial statements in conformity with Generally Accepted Accounting Principles (GAAP), and complied with applicable laws and regulations.
The City contracted with Maze & Associates, a public accounting firm licensed to perform local government audits in California, to complete the annual audit. Maze concluded that the financial statements present fairly the respective financial position of the government activities, the business-type activities, each major fund, and the aggregate remaining fund information of the City, and the respective changes in financial position, and where applicable, cash flows for the year ended June 30, 2020 in accordance with GAAP. This is a favorable conclusion and is commonly referred to as an unqualified opinion.
The audit involved examining on a test basis evidence supporting the amounts and disclosures in the financial statements, assessing the accounting principles used and significant estimates made by management, and evaluating the overall financial statement presentation.
In addition to the CAFR, the City prepares a mandated Single Audit designed to meet requirements related to major program expenditures of Federal funds. The standards governing Single Audit engagements require the independent auditor to report on the audited government’s internal controls and compliance with legal requirements, emphasizing administration of Federal awards. These reports are available in the City’s separately issued Single Audit Report.
v
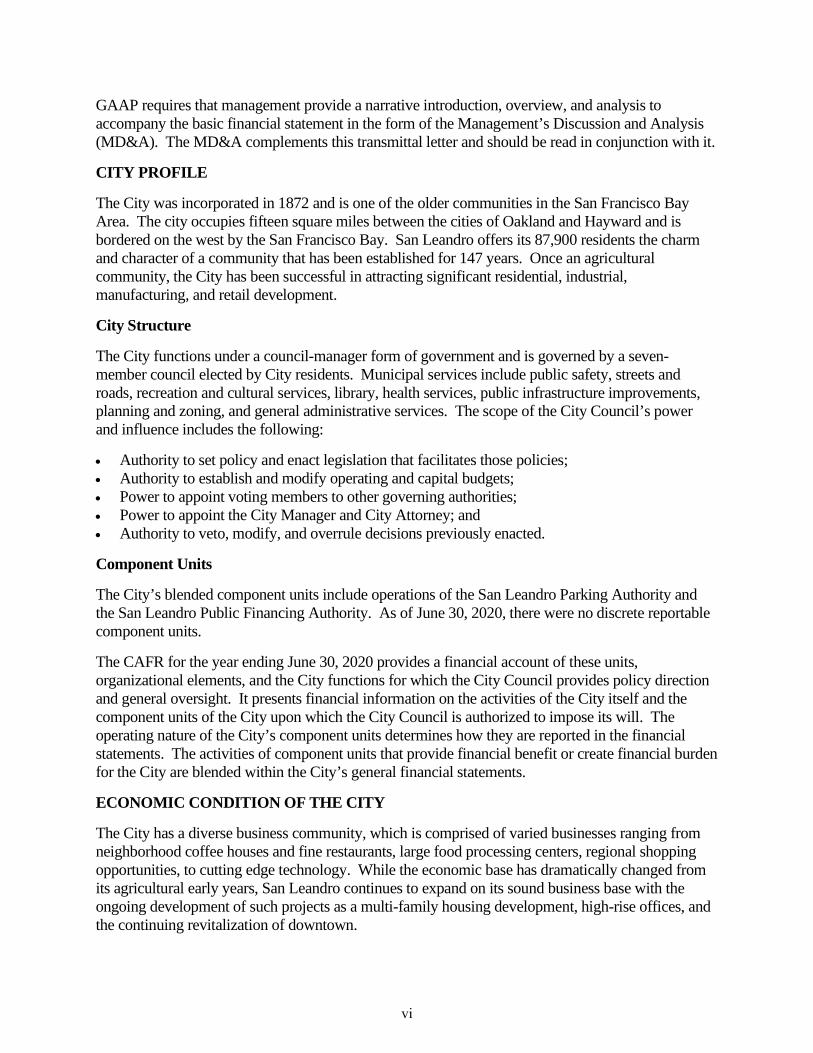
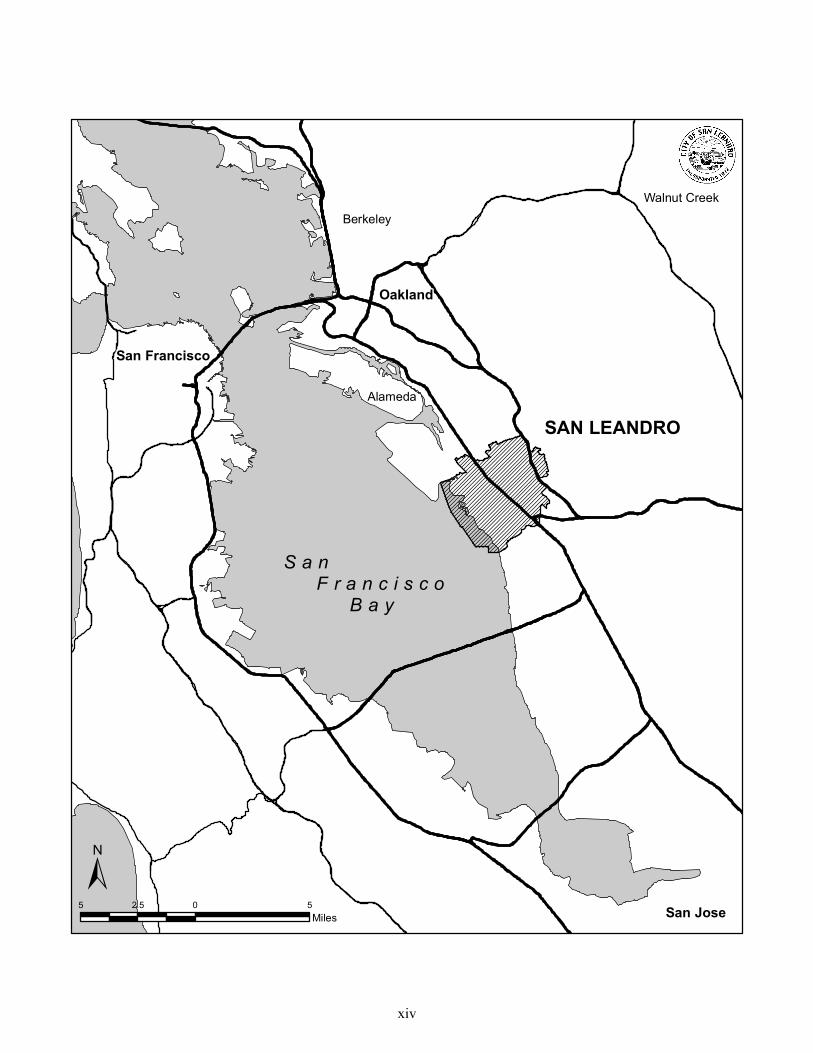
GAAP requires that management provide a narrative introduction, overview, and analysis to accompany the basic financial statement in the form of the Management’s Discussion and Analysis (MD&A). The MD&A complements this transmittal letter and should be read in conjunction with it. CITY PROFILE The City was incorporated in 1872 and is one of the older communities in the San Francisco Bay Area. The city occupies fifteen square miles between the cities of Oakland and Hayward and is bordered on the west by the San Francisco Bay. San Leandro offers its 87,900 residents the charm and character of a community that has been established for 147 years. Once an agricultural community, the City has been successful in attracting significant residential, industrial, manufacturing, and retail development. City Structure The City functions under a council-manager form of government and is governed by a seven-member council elected by City residents. Municipal services include public safety, streets and roads, recreation and cultural services, library, health services, public infrastructure improvements, planning and zoning, and general administrative services. The scope of the City Council’s power and influence includes the following: • Authority to set policy and enact legislation that facilitates those policies; • Authority to establish and modify operating and capital budgets; • Power to appoint voting members to other governing authorities; • Power to appoint the City Manager and City Attorney; and • Authority to veto, modify, and overrule decisions previously enacted. Component Units The City’s blended component units include operations of the San Leandro Parking Authority and the San Leandro Public Financing Authority. As of June 30, 2020, there were no discrete reportable component units. The CAFR for the year ending June 30, 2020 provides a financial account of these units, organizational elements, and the City functions for which the City Council provides policy direction and general oversight. It presents financial information on the activities of the City itself and the component units of the City upon which the City Council is authorized to impose its will. The operating nature of the City’s component units determines how they are reported in the financial statements. The activities of component units that provide financial benefit or create financial burden for the City are blended within the City’s general financial statements. ECONOMIC CONDITION OF THE CITY The City has a diverse business community, which is comprised of varied businesses ranging from neighborhood coffee houses and fine restaurants, large food processing centers, regional shopping opportunities, to cutting edge technology. While the economic base has dramatically changed from its agricultural early years, San Leandro continues to expand on its sound business base with the ongoing development of such projects as a multi-family housing development, high-rise offices, and the continuing revitalization of downtown.
vi
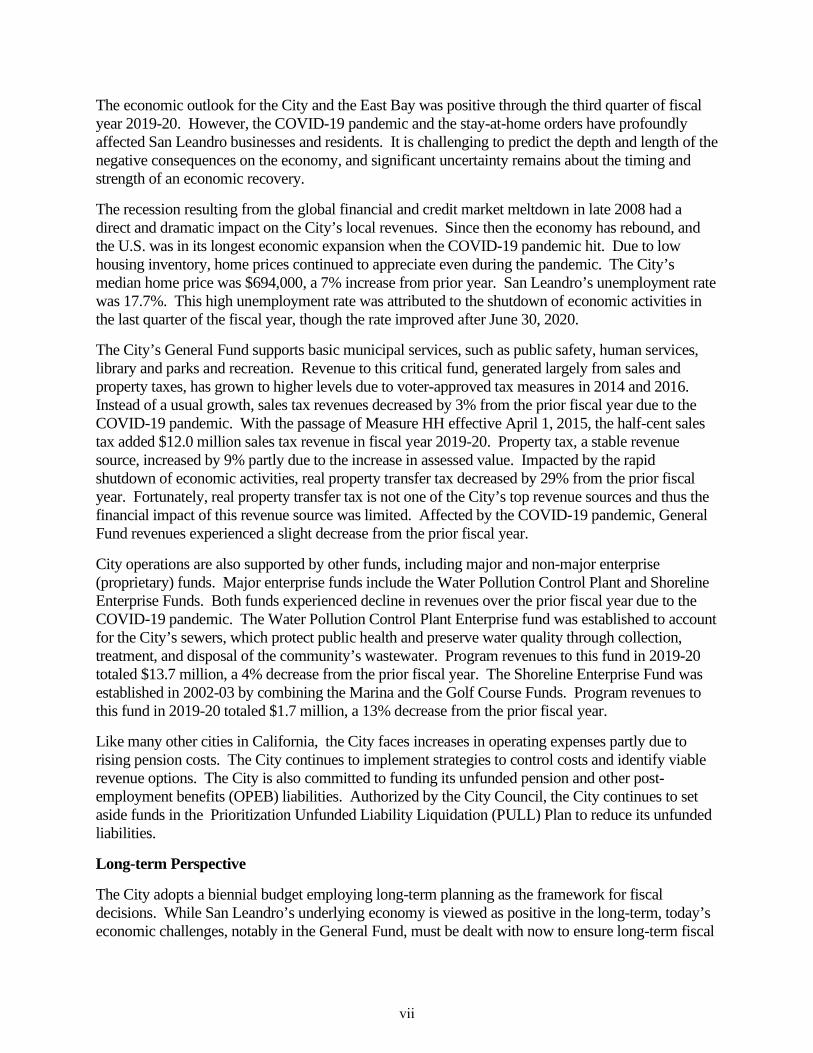
The economic outlook for the City and the East Bay was positive through the third quarter of fiscal year 2019-20. However, the COVID-19 pandemic and the stay-at-home orders have profoundly affected San Leandro businesses and residents. It is challenging to predict the depth and length of the negative consequences on the economy, and significant uncertainty remains about the timing and strength of an economic recovery. The recession resulting from the global financial and credit market meltdown in late 2008 had a direct and dramatic impact on the City’s local revenues. Since then the economy has rebound, and the U.S. was in its longest economic expansion when the COVID-19 pandemic hit. Due to low housing inventory, home prices continued to appreciate even during the pandemic. The City’s median home price was $694,000, a 7% increase from prior year. San Leandro’s unemployment rate was 17.7%. This high unemployment rate was attributed to the shutdown of economic activities in the last quarter of the fiscal year, though the rate improved after June 30, 2020. The City’s General Fund supports basic municipal services, such as public safety, human services, library and parks and recreation. Revenue to this critical fund, generated largely from sales and property taxes, has grown to higher levels due to voter-approved tax measures in 2014 and 2016. Instead of a usual growth, sales tax revenues decreased by 3% from the prior fiscal year due to the COVID-19 pandemic. With the passage of Measure HH effective April 1, 2015, the half-cent sales tax added $12.0 million sales tax revenue in fiscal year 2019-20. Property tax, a stable revenue source, increased by 9% partly due to the increase in assessed value. Impacted by the rapid shutdown of economic activities, real property transfer tax decreased by 29% from the prior fiscal year. Fortunately, real property transfer tax is not one of the City’s top revenue sources and thus the financial impact of this revenue source was limited. Affected by the COVID-19 pandemic, General Fund revenues experienced a slight decrease from the prior fiscal year. City operations are also supported by other funds, including major and non-major enterprise (proprietary) funds. Major enterprise funds include the Water Pollution Control Plant and Shoreline Enterprise Funds. Both funds experienced decline in revenues over the prior fiscal year due to the COVID-19 pandemic. The Water Pollution Control Plant Enterprise fund was established to account for the City’s sewers, which protect public health and preserve water quality through collection, treatment, and disposal of the community’s wastewater. Program revenues to this fund in 2019-20 totaled $13.7 million, a 4% decrease from the prior fiscal year. The Shoreline Enterprise Fund was established in 2002-03 by combining the Marina and the Golf Course Funds. Program revenues to this fund in 2019-20 totaled $1.7 million, a 13% decrease from the prior fiscal year. Like many other cities in California, the City faces increases in operating expenses partly due to rising pension costs. The City continues to implement strategies to control costs and identify viable revenue options. The City is also committed to funding its unfunded pension and other post-employment benefits (OPEB) liabilities. Authorized by the City Council, the City continues to set aside funds in the Prioritization Unfunded Liability Liquidation (PULL) Plan to reduce its unfunded liabilities. Long-term Perspective The City adopts a biennial budget employing long-term planning as the framework for fiscal decisions. While San Leandro’s underlying economy is viewed as positive in the long-term, today’s economic challenges, notably in the General Fund, must be dealt with now to ensure long-term fiscal
vii

sustainability. The City Council has implemented numerous cost cutting measures after staffing peaked in 2008-09 to produce recurring budget savings to address its financial challenges. Passage of Measure Z in November 2010, Measure HH in 2014, and Measures OO, PP, and NN in 2016 have improved revenues enough to restore selective services. The City has also implemented strategies to control costs such as soft hiring freeze to mitigate the impact from the COVID-19 pandemic. Consistent with the City Councils’ direction to pursue a balanced approach to addressing the City’s deficit that includes both expenditure reductions and revenue increases, the City placed Measure VV on the November 2020 ballot; the measure was approved by San Leandro voters. This measure authorized an increase to the real property transfer tax rate from $6 per thousand dollars in assessed valuation to $11 per thousand dollars in valuation, and which is forecasted to generate approximately $4.0 million in new annual General Fund revenue beginning in the latter half of fiscal year 2020-21.
City Council unrestricted reserves total $46.7 million in the General Fund at June 30, 2020. The restricted reserves total $17.8 million. MAJOR INITIATIVES AND ACCOMPLISHMENTS The City is committed to providing innovative and responsive services to the community. In its role of providing policy direction and general oversight, the City Council establishes major goals for City service delivery. The City initiated and completed a list of major programs/projects during 2019-20 that helped achieve the City’s mission of serving the public and enhancing the quality of life in San Leandro. Certain programs were created in response to the COVID-19 pandemic, which helped to reduce the combined health, social, and economic impacts of the pandemic. Some of these major initiatives and accomplishments include: COVID-19 Assistance – The Community Development Department played a major role in the City’s immediate response to the COVID-19 pandemic and its impact on residents and businesses due to the closure of businesses and unemployment. Key COVID-19 related initiatives included:
• Adoption of an eviction moratorium for residential and commercial renters immediately after the initial issuance of the March 16th Alameda County shelter in place order.
• Creation of the Rental Assistance Program (RAP) funded with over $450,000 of emergency federal Community Development Block Grant under the Coronavirus Aid, Relief & Economic Security (CARES) Act. RAP provides urgent gap funding for lower income residential renters unable to pay rent due to the pandemic. The City was also awarded over $765,000 from additional CARES Act funding in fiscal year 2020-21 that will be added to RAP to assist more eligible renters in need.
• Creation of the City funded $300,000 Small Business Continuity Grant Program, which provided up to $5,000 to small businesses to help them continue operations during the COVID-19 public health emergency. The objective of this program is to offer immediate financial assistance to small businesses and independent restaurants to aid them in maintaining their business operations and workforce.
viii

• Establishment of the COVID-19 Relief Temporary Outdoor Facilities Program, which was a streamlined, no-cost outdoor facilities process for restaurants and food providers, retailers and other outdoor activities permitted by Alameda County Public Health to operate.
Housing – The 85-unit senior affordable rental housing development, La Vereda, opened and was fully leased. It is adjacent to Marea Alta, a 115-unit affordable rental housing development which opened in 2017. Together they represent the first major housing development completed under the 2007 Downtown Transit-Oriented Development Strategy. The City invested nearly $11.0 million in both projects. Over 700 residential units are in the building permit review process, and an additional 45 units of ownership housing received planning/zoning approvals. Commercial/industrial Development – The second of three planned new Class A office buildings was completed in the San Leandro Tech campus. Over 1.5 million square feet of industrial buildings were completed at 100 Halcyon Street and 2000 Marina Blvd. The latter will become the 330,000 square foot global headquarters for Torani, the 95-year-old flavor company best known for introducing the Italian soda to America and creating the world’s first flavored latte, which is moving from South San Francisco. Shoreline Development – The Shoreline Development Project took an important step forward with the approval of a Disposition and Development Agreement (DDA) with the private developer Cal Coast Companies LLC Inc. to facilitate the future development of the Shoreline area. The Shoreline Development Project envisions the revitalization of 75 acres of public area to create 18 acres of public recreational areas, including a 9-acre park, a new Mulford/Marina Library, up to 500 new homes, a new hotel, restaurants, banquet facility, and market/café space.
Street Rehabilitation and Sealing – The City accepted as complete $12.2 million worth of street maintenance and reconstruction work that occurred throughout the City. This work improved the safety and longevity of City streets by overlaying and reconstructing 2.7 lane miles and sealing 34.4 lane miles. Curb ramps, rectangular rapid flashing beacon crosswalks and other complete street features were included in the construction to make San Leandro a better place for all users of the roadway.
Farrelly Pool Replacement Project – The City awarded a $6.2 million construction contract to build a new swimming pool facility to replace the aged existing complex. The work consists of constructing a 75’ by 62’ lap swimming pool with swim lesson area, ADA compliant public changing rooms, restrooms, staff area, first aid station and an equipment building. When completed this facility will provide many years of enjoyment and swim training to San Leandrans.
One Megawatt Solar Array at Water Pollution Control Plant – In May 2020, the City successfully completed a new 1-megawatt solar photovoltaic project at the Water Pollution Control Plant. The $3.9 million project was funded 50% by a grant from the California Energy Commission. The project was anticipated to provide approximately 45% of the Plant’s energy needs, and the first three months’ of data indicate that the project is exceeding this expectation.
ix
Measure VV – In an effort to address the City’s projected budget deficit and to ensure a secure financial future, the City launched various community engagement efforts designed to explore the viability of a potential revenue measure. As part of this work, several community surveys and a public opinion poll were executed in fiscal year 2019-20 to gain a better understanding of public service priorities. Several potential tax measures were also tested, including a modification to the real property transfer tax, a public safety parcel tax, and a vacant property tax. The results of this work were ultimately presented to the City Council in fiscal year 2019-20 and used to inform their decision in fiscal year 2020-21 to place Measure VV on the November 2020 ballot, increasing the real property transfer tax rate from $6 per thousand dollars in assessed valuation to $11 per thousand dollars in valuation.
FINANCIAL INFORMATION City Budget & Budgetary Controls The City Council is required to adopt a final budget by passing a budget resolution no later than June 30, following a public hearing process. This annual budget serves as the foundation for the City’s financial planning and control. The budget is prepared by fund, function (Public Safety) and department (Police). The legal level of budgetary control is at the fund level. The City Manager is authorized to transfer budgeted amounts between departments and line items within any fund. Any revisions that alter the total expenditures of any fund must be approved by the City Council. Transfers between funds must be approved by the City Council. At the end of the fiscal year, encumbered appropriations are carried forward and become part of the following year’s budget while appropriations that have not been encumbered lapse, unless otherwise authorized by the City Council and the City Manager. Accounting System The City’s accounting records for general government operations are maintained on a modified accrual basis, with revenues recorded when measurable and available. Expenditures are recorded when the services or goods are received and the liabilities incurred. Accounting records for the City’s proprietary activities are maintained on the full accrual basis, with revenues recorded when earned and expenses when incurred. In maintaining the City’s accounting system, consideration is given to the adequacy of internal controls. Internal controls are designed to provide reasonable assurance regarding the safeguarding of assets and to ensure the reliability of financial records and maintaining accountability for assets. The concept of reasonable assurance recognizes that the cost of control should not exceed the benefits likely to be derived. The evaluation of costs and benefits requires continuing estimates and judgments by City management. We believe that the City’s system of internal accounting controls continues to adequately safeguard assets and provide reasonable assurance that financial transactions are properly recorded. Risk Management The City maintains commercial insurance combined with self-insurance for all of its governmental operations. The City is a member of the Local Agency Workers’ Compensation Excess Joint Powers Authority (LAWCX). The City is also a member of California Joint Powers Risk Management Authority (CJPRMA), providing general liability coverage in an aggregate up to $40 million.
x
Additional information on the City’s risk management activity can be found in Note 11 to the basic financial statements.
OTHER INFORMATION
Certificate of Achievement
The Government Finance Officers Association (GFOA) awarded a Certificate of Achievement for Excellence in Financial Reporting to the City for its CAFR for the year ended June 30, 2018. This was the 23rd consecutive year that the City received this award. Because of staffing transitions, the City did not apply for the GFOA award for the fiscal year 2018-19 CAFR. The City is planning to apply for the award for the fiscal year 2019-20 CAFR. To be awarded a Certificate of Achievement, a government must publish an easily readable and efficiently organized CAFR. This report must satisfy both generally accepted accounting principles and applicable legal requirements.
We believe that our current CAFR continues to meet the Certificate of Achievement Program’s requirements and we are submitting it to the GFOA to determine its eligibility for another certificate.
Acknowledgements
This CAFR represents the culmination of numerous hours of hard work expended by the dedicated staff in the Finance Department. Furthermore, I would like to thank Maze & Associates for their professional assistance and cooperation. Finally, I want to thank the City Council for their continued interest and support in planning and conducting the City’s financial operations.
Respectfully submitted,
Susan Hsieh Finance Director
xi

LibraryHistorical
Commission
City Council
Residents ofSan Leandro
SeniorCommission
ArtsCommission
This organizational chart reflects relationships between policy-making responsibility(Mayor, City Council, and Advisory Boards and Commissions)
and administrative officers and departments.
HumanServices
Commission
Recreationand Parks
Commission
YouthAdvisory
Commission
City Manager'sOffice Finance Library
Services
City Manager
Alameda CountyFire Department
Engineeringand
Transportation
City Attorney
Public WorksRecreationand Human
ServicesPoliceCommunity
Development
Board of ZoningAdjustments/
PersonnelRelations
BoardPlanning
Commission
Rent ReviewBoard
xii
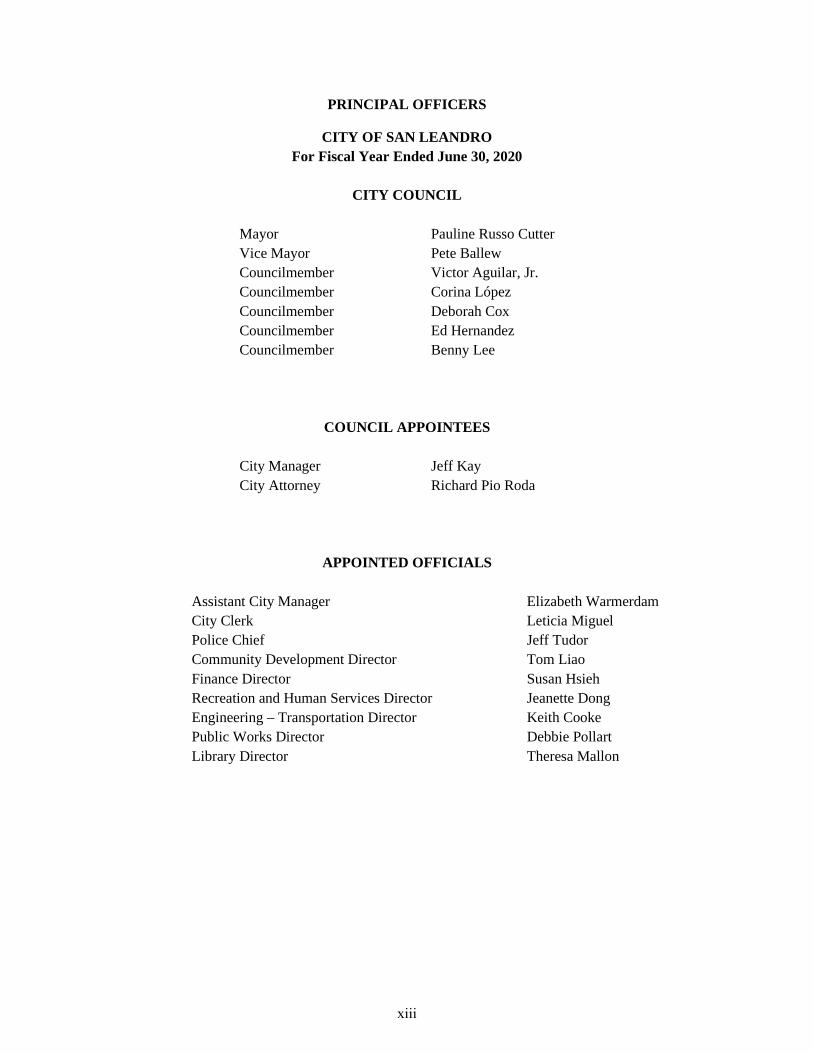
PRINCIPAL OFFICERS
CITY OF SAN LEANDRO For Fiscal Year Ended June 30, 2020
CITY COUNCIL
Mayor Pauline Russo Cutter Vice Mayor Pete Ballew Councilmember Victor Aguilar, Jr. Councilmember Corina López Councilmember Deborah Cox Councilmember Ed Hernandez Councilmember Benny Lee
COUNCIL APPOINTEES
City Manager Jeff Kay City Attorney Richard Pio Roda
APPOINTED OFFICIALS
Assistant City Manager Elizabeth Warmerdam City Clerk Leticia Miguel Police Chief Jeff Tudor Community Development Director Tom Liao Finance Director Susan Hsieh Recreation and Human Services Director Jeanette Dong Engineering – Transportation Director Keith Cooke Public Works Director Debbie Pollart Library Director Theresa Mallon
xiii
SAN LEANDRO
S a nF r a n c i s c o
B a y
Oakland
Alameda
San Jose
BerkeleyWalnut Creek
San Francisco
±5 0 52.5
Miles
xiv
INDEPENDENT AUDITOR’S REPORT
To the Honorable Members of City Council City of San Leandro, California
Report on Financial Statements
We have audited the accompanying financial statements of the governmental activities, the business-type activities, each major fund, and the aggregate remaining fund information of the City of San Leandro (City), California, as of and for the year ended June 30, 2020, and the related notes to the financial statements, which collectively comprise the City’s basic financial statements as listed in the Table of Contents.
Management’s Responsibility for the Financial Statements
Management is responsible for the preparation and fair presentation of these financial statements in accordance with accounting principles generally accepted in the United States of America; this includes the design, implementation, and maintenance of internal control relevant to the preparation and fair presentation of the financial statements that are free from material misstatement, whether due to fraud or error.
Auditor’s Responsibility
Our responsibility is to express opinions on these financial statements based on our audit. We conducted our audit in accordance with auditing standards generally accepted in the United States of America and the standards applicable to financial audits contained in Government Auditing Standards, issued by the Comptroller General of the United States. Those standards require that we plan and perform the audit to obtain reasonable assurance about whether the financial statements are free from material misstatement.
An audit involves performing procedures to obtain audit evidence about the amounts and disclosures in the financial statements. The procedures selected depend on the auditor’s judgment, including the assessment of the risks of material misstatement of the financial statements, whether due to fraud or error. In making those risk assessments, the auditor considers internal control relevant to the City’s preparation and fair presentation of the financial statements in order to design audit procedures that are appropriate in the circumstances, but not for the purpose of expressing an opinion on the effectiveness of the City’s internal control. Accordingly, we express no such opinion. An audit also includes evaluating the appropriateness of accounting policies used and the reasonableness of significant accounting estimates made by management, as well as evaluating the overall presentation of the financial statements.
We believe that the audit evidence we have obtained is sufficient and appropriate to provide a basis for our audit opinions.
Opinions
In our opinion, the financial statements referred to above present fairly, in all material respects, the respective financial position of the governmental activities, the business-type activities, each major fund, and the aggregate remaining fund information of the City as of June 30, 2020 and the respective changes in financial position and, where applicable, cash flows thereof for the year then ended in accordance with accounting principles generally accepted in the United States of America.
1

Other Matters
Required Supplementary Information
Accounting principles generally accepted in the United States of America require that Management’s Discussion and Analysis and other required supplementary information as listed in the Table of Contents be presented to supplement the basic financial statements. Such information, although not a part of the basic financial statements, is required by the Governmental Accounting Standards Board, who considers it to be an essential part of financial reporting for placing the basic financial statements in an appropriate operational, economic or historical context. We have applied certain limited procedures to the required supplementary information in accordance with auditing standards generally accepted in the United States of America, which consisted of inquiries of management about the methods of preparing the information and comparing the information for consistency with management’s responses to our inquiries, the basic financial statements, and other knowledge we obtained during our audit of the basic financial statements. We do not express an opinion or provide any assurance on the information because the limited procedures do not provide us with sufficient evidence to express an opinion or provide any assurance.
Other Information
Our audit was conducted for the purpose of forming opinions on the financial statements that collectively comprise the City’s basic financial statement. The Introductory Section, Supplementary Information, and Statistical Section as listed in the Table of Contents are presented for purposes of additional analysis and are not required parts of the basic financial statements.
The Supplementary Information is the responsibility of management and was derived from and relates directly to the underlying accounting and other records used to prepare the basic financial statements. Such information has been subjected to the auditing procedures applied in the audit of the basic financial statements and certain additional procedures, including comparing and reconciling such information directly to the underlying accounting and other records used to prepare the financial statements or to the basic financial statements themselves, and other additional procedures in accordance with auditing standards generally accepted in the United States of America. In our opinion, the Supplementary Information is fairly stated, in all material respects in relation to the basic financial statements as a whole.
The Introductory and Statistical Sections have not been subjected to the auditing procedures applied in the audit of the basic financial statements and, accordingly, we do not express an opinion or provide any assurance on them.
Other Reporting Required by Government Auditing Standards
In accordance with Government Auditing Standards, we have also issued our report dated January 26, 2021, on our consideration of the City’s internal control over financial reporting and on our tests of its compliance with certain provisions of laws, regulations, contracts, and grant agreements and other matters. The purpose of that report is to describe the scope of our testing of internal control over financial reporting and compliance and the results of that testing, and not to provide an opinion on internal control over financial reporting or on compliance. That report is an integral part of an audit performed in accordance with Government Auditing Standards in considering the City’s internal control over financial reporting and compliance.
Pleasant Hill, California January 26, 2021
2
Management’s Discussion and Analysis for Fiscal Year Ended June 30, 2020
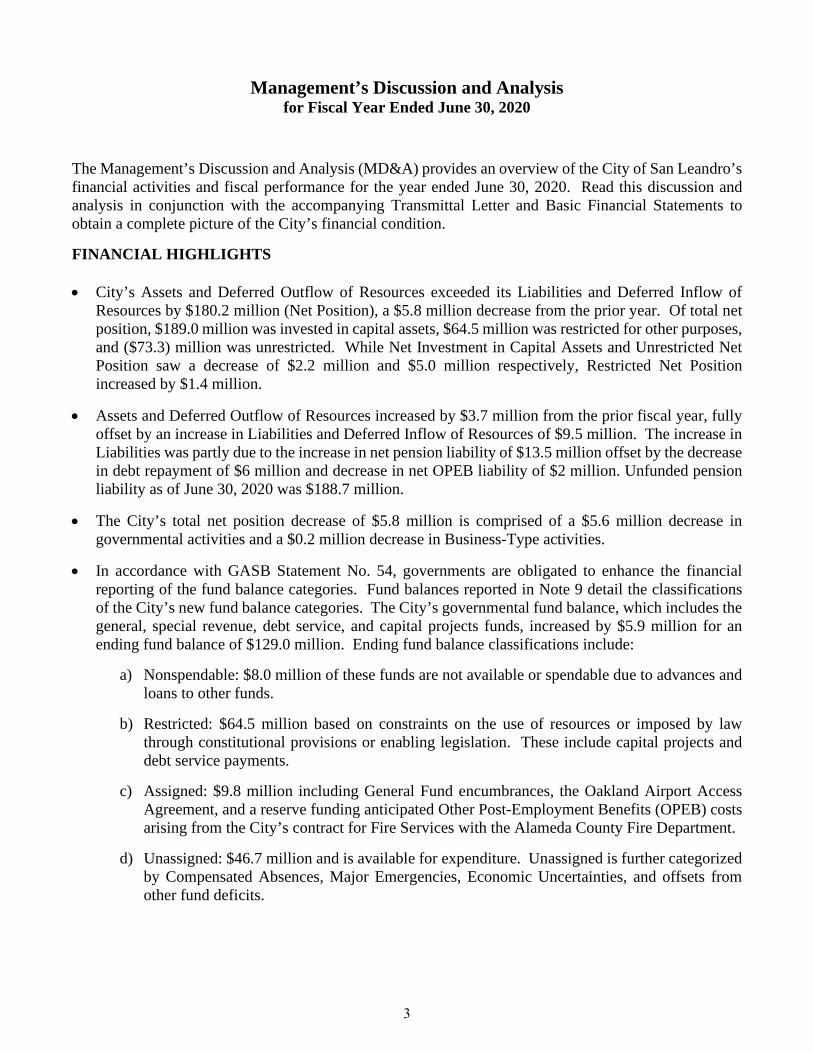
The Management’s Discussion and Analysis (MD&A) provides an overview of the City of San Leandro’s financial activities and fiscal performance for the year ended June 30, 2020. Read this discussion and analysis in conjunction with the accompanying Transmittal Letter and Basic Financial Statements to obtain a complete picture of the City’s financial condition.
FINANCIAL HIGHLIGHTS
• City’s Assets and Deferred Outflow of Resources exceeded its Liabilities and Deferred Inflow ofResources by $180.2 million (Net Position), a $5.8 million decrease from the prior year. Of total netposition, $189.0 million was invested in capital assets, $64.5 million was restricted for other purposes,and ($73.3) million was unrestricted. While Net Investment in Capital Assets and Unrestricted NetPosition saw a decrease of $2.2 million and $5.0 million respectively, Restricted Net Positionincreased by $1.4 million.
• Assets and Deferred Outflow of Resources increased by $3.7 million from the prior fiscal year, fullyoffset by an increase in Liabilities and Deferred Inflow of Resources of $9.5 million. The increase inLiabilities was partly due to the increase in net pension liability of $13.5 million offset by the decreasein debt repayment of $6 million and decrease in net OPEB liability of $2 million. Unfunded pensionliability as of June 30, 2020 was $188.7 million.
• The City’s total net position decrease of $5.8 million is comprised of a $5.6 million decrease ingovernmental activities and a $0.2 million decrease in Business-Type activities.
• In accordance with GASB Statement No. 54, governments are obligated to enhance the financialreporting of the fund balance categories. Fund balances reported in Note 9 detail the classificationsof the City’s new fund balance categories. The City’s governmental fund balance, which includes thegeneral, special revenue, debt service, and capital projects funds, increased by $5.9 million for anending fund balance of $129.0 million. Ending fund balance classifications include:
a) Nonspendable: $8.0 million of these funds are not available or spendable due to advances andloans to other funds.
b) Restricted: $64.5 million based on constraints on the use of resources or imposed by lawthrough constitutional provisions or enabling legislation. These include capital projects anddebt service payments.
c) Assigned: $9.8 million including General Fund encumbrances, the Oakland Airport AccessAgreement, and a reserve funding anticipated Other Post-Employment Benefits (OPEB) costsarising from the City’s contract for Fire Services with the Alameda County Fire Department.
d) Unassigned: $46.7 million and is available for expenditure. Unassigned is further categorizedby Compensated Absences, Major Emergencies, Economic Uncertainties, and offsets fromother fund deficits.
3

OVERVIEW OF THE BASIC FINANCIAL STATEMENTS
The MD&A serves as an introduction to the City’s basic financial statements. The City’s basic financial statements comprise of three components: 1) government-wide financial statements, 2) fund financial statements, and 3) notes to the financial statements. The report also contains other supplementary information in addition to the basic financial statements.
Government-Wide Financial Statements The government-wide financial statements provide readers a broad overview of the City’s finances in a manner similar to statements of a private-sector business. The Statements are comprised of the Statement of Net Position and Statement of Activities and Changes in Net Position.
The Statement of Net Position presents information on the City’s assets and liabilities, with the difference between the two reported as net position. Over time, increases or decreases in net position may serve as a useful indicator of changes in the City’s financial reporting.
The Statement of Activities and Changes in Net Position presents information showing how the government’s net position changed during the fiscal year. All changes in net position are reported as soon as the underlying event giving rise to the change occurs, regardless of the timing of the related cash flows. Revenues and expenses are reported in this statement for some items that will only result in cash flows in future fiscal periods (e.g. uncollected taxes, earned but unused vacation leave, and other compensated absences).
The government-wide financial statements distinguish functions of the City that are principally supported by taxes and intergovernmental revenue (governmental activities) from other functions intended to recover all or a significant portion of their costs through user fees and charges (business-type activities).
Both of the above financial statements have separate sections for two different types of programs or activities. These two types of activities are:
Governmental Activities – The activities in this section are mostly supported by taxes and charges for services. The governmental activities of the City include General Government (City Council, City Manager, City Clerk, Human Resources, Information Technologies, and Finance), Public Safety (Police and Fire), Engineering & Transportation (including Public Works), Recreation and Culture (including the Library), and Community Development.
Business-Type Activities – These functions normally recover all or a significant portion of their costs through user fees and charges to external users of goods and services. The business-type activities of the City include the Water Pollution Control Plant, Environmental Services, Shoreline Enterprise, and Storm Water.
Fund Financial Statements A fund is a grouping of related accounts maintaining control over resources segregated for specific activities or objectives. The City, like other state and local governments, uses fund accounting to ensure and demonstrate compliance with finance-related legal requirements. All the funds of the City can be divided into three categories: governmental funds, proprietary funds, and fiduciary funds.
4

Governmental Funds – Governmental funds are used to account for the same functions reported as governmental activities in the government-wide financial statements. However, unlike the government-wide financial statements, governmental fund statements focus on near-term inflows and outflows of spendable resources, as well as on balances of spendable resources available at the end of the fiscal year. Such information may be useful in evaluating a government’s near-term financial capacity.
Because the focus of governmental funds is narrower than that of the government-wide financial statements, it is useful to compare the information presented for government funds with similar information presented for governmental activities in the government-wide financial statements. By doing so, readers may better understand the long-term impact of the government’s near-term financing decisions. Both the governmental fund balance sheet and the governmental fund statement of revenues, expenditures, and changes in fund balances provide a reconciliation facilitating the comparison between governmental funds and governmental activities. Reconciliations are presented on the page immediately following each governmental fund financial statement.
The City has 25 governmental funds, of which two are considered a major fund for presentation purposes. Major funds are presented separately in the governmental fund balance sheet and in the governmental fund statement of revenues, expenditures, and changes in fund balances. The City’s two major funds are the General Fund and the Capital Improvement Capital Project Fund. Individual fund for each of the non-major governmental funds are provided in the form of combining statements elsewhere in this report.
The City adopts an annual appropriated budget for its General Fund and all other major and non-major funds. Budgetary comparison statements are elsewhere in this report to demonstrate compliance with the adopted budget.
Proprietary Funds – The City maintains two different types of proprietary funds: enterprise funds and internal service funds. Enterprise funds are used to report the functions presented as business-type activities in the government-wide financial statements. The City uses enterprise funds to account for the Water Pollution Control Plant, Shoreline, Storm Water, and Environmental Services. Internal service funds are used to accumulate and allocate costs internally among various City functions. The City uses internal service funds to account for the fleet of vehicles, building and facilities maintenance, insurance services, and information systems. Because these services primarily benefit governmental rather than business-type functions, these are included within governmental activities in the governmental-wide financial statements.
Proprietary funds provide the same type of information as the government-wide financial statements, but in greater detail. The proprietary fund financial statements provide separate information for the City’s proprietary funds. Internal service funds are combined into a single, aggregated presentation in the proprietary financial statements. Individual fund data for the proprietary and internal service funds are provided in the form of combining statements elsewhere in the report.
Fiduciary Funds – Fiduciary funds, consisting solely of trust and agency funds, are used to account for resources held for the benefit of parties outside the government. Fiduciary funds are not reflected in the government-wide financial statements because the resources of these funds are not available to support City’s programs. The accounting used for these funds is much like that used for governmental funds. These funds are reported in a separate statement of fiduciary assets.
5
Notes to the Basic Financial Statements The notes to the basic financial statements provide additional information that is essential to a full understanding of the data provided in the government-wide and fund financial statements. The notes to the financial statements follow the basic financial statements.
Other Information In addition to the basic financial statements and accompanying notes, this report also presents required supplemental information. This information includes budgetary comparison schedules, more detailed information about the City’s agreement with the California Public Employees Retirement System (CalPERS) for the defined benefit pension plan, more detailed information on the City’s Other Post Employment Benefit Plan (OPEB), and a detailed description of the City’s Long Term Debt.
GOVERNMENT-WIDE FINANCIAL ANALYSIS
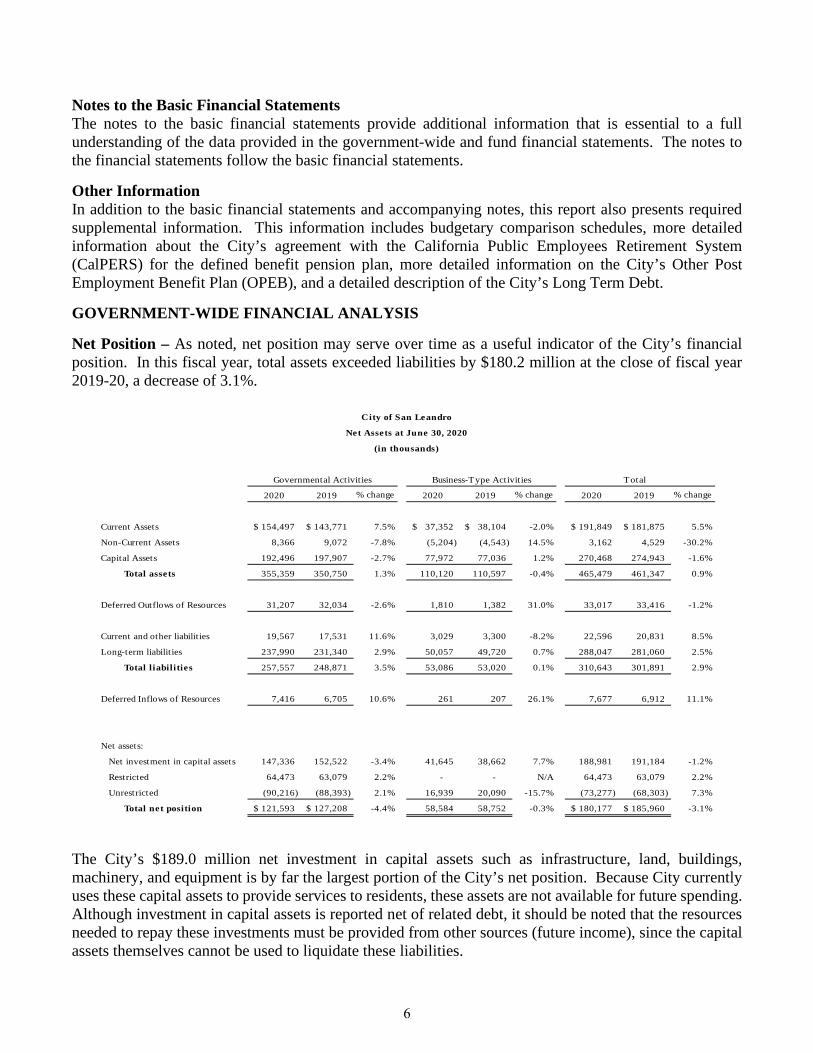
Net Position – As noted, net position may serve over time as a useful indicator of the City’s financial position. In this fiscal year, total assets exceeded liabilities by $180.2 million at the close of fiscal year 2019-20, a decrease of 3.1%.
Total
2020 2019 % change 2020 2019 % change 2020 2019 % change
Current Assets 154,497$ 143,771$ 7.5% 37,352$ 38,104$ -2.0% 191,849$ 181,875$ 5.5%
Non-Current Assets 8,366 9,072 -7.8% (5,204) (4,543) 14.5% 3,162 4,529 -30.2%
Capital Assets 192,496 197,907 -2.7% 77,972 77,036 1.2% 270,468 274,943 -1.6%
Total assets 355,359 350,750 1.3% 110,120 110,597 -0.4% 465,479 461,347 0.9%
Deferred Outflows of Resources 31,207 32,034 -2.6% 1,810 1,382 31.0% 33,017 33,416 -1.2%
Current and other liabilit ies 19,567 17,531 11.6% 3,029 3,300 -8.2% 22,596 20,831 8.5%
Long-term liabilit ies 237,990 231,340 2.9% 50,057 49,720 0.7% 288,047 281,060 2.5%
Total liabilities 257,557 248,871 3.5% 53,086 53,020 0.1% 310,643 301,891 2.9%
Deferred Inflows of Resources 7,416 6,705 10.6% 261 207 26.1% 7,677 6,912 11.1%
Net assets:
Net investment in capital assets 147,336 152,522 -3.4% 41,645 38,662 7.7% 188,981 191,184 -1.2%
Restricted 64,473 63,079 2.2% - - N/A 64,473 63,079 2.2%
Unrestricted (90,216) (88,393) 2.1% 16,939 20,090 -15.7% (73,277) (68,303) 7.3%
Total net position 121,593$ 127,208$ -4.4% 58,584 58,752 -0.3% 180,177$ 185,960$ -3.1%
City of San Leandro
Net Assets at June 30, 2020
(in thousands)
Governmental Activities Business-Type Activities
The City’s $189.0 million net investment in capital assets such as infrastructure, land, buildings, machinery, and equipment is by far the largest portion of the City’s net position. Because City currently uses these capital assets to provide services to residents, these assets are not available for future spending. Although investment in capital assets is reported net of related debt, it should be noted that the resources needed to repay these investments must be provided from other sources (future income), since the capital assets themselves cannot be used to liquidate these liabilities.
6
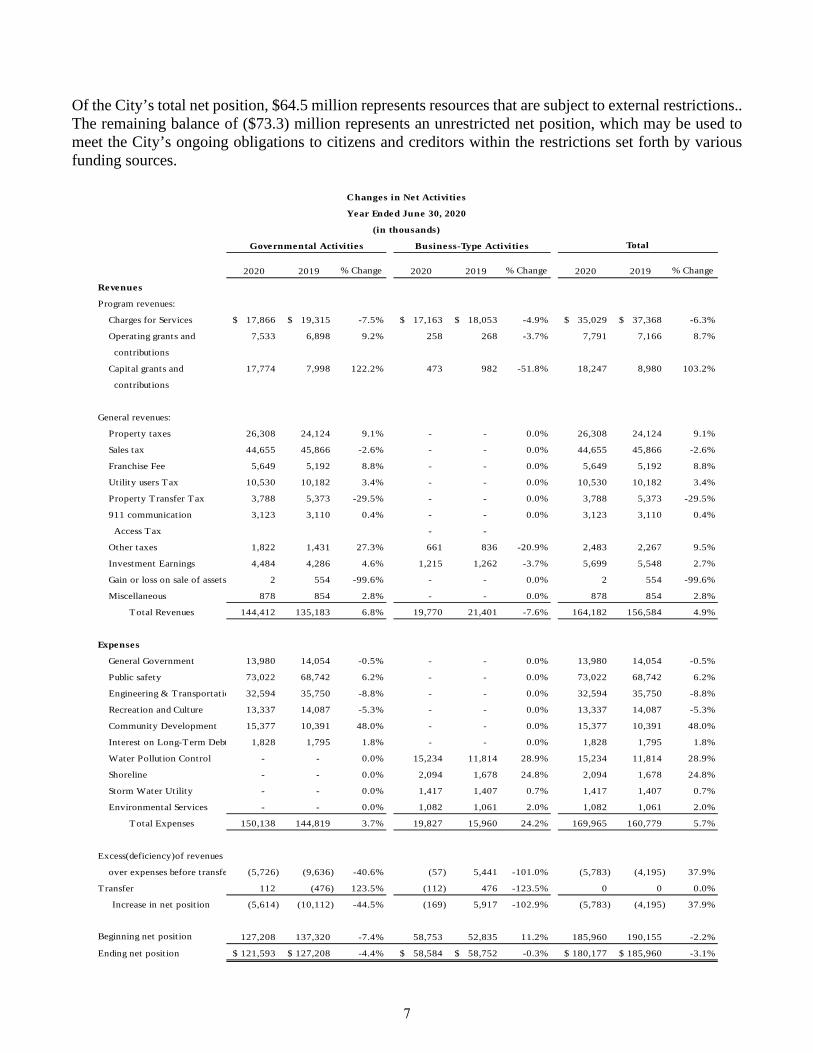
Of the City’s total net position, $64.5 million represents resources that are subject to external restrictions.. The remaining balance of ($73.3) million represents an unrestricted net position, which may be used to meet the City’s ongoing obligations to citizens and creditors within the restrictions set forth by various funding sources.
2020 2019 % Change 2020 2019 % Change 2020 2019 % Change
Revenues
Program revenues:
Charges for Services 17,866$ 19,315$ -7.5% 17,163$ 18,053$ -4.9% 35,029$ 37,368$ -6.3%
Operating grants and 7,533 6,898 9.2% 258 268 -3.7% 7,791 7,166 8.7%
contributions
Capital grants and 17,774 7,998 122.2% 473 982 -51.8% 18,247 8,980 103.2%
contributions
General revenues:
Property taxes 26,308 24,124 9.1% - - 0.0% 26,308 24,124 9.1%
Sales tax 44,655 45,866 -2.6% - - 0.0% 44,655 45,866 -2.6%
Franchise Fee 5,649 5,192 8.8% - - 0.0% 5,649 5,192 8.8%
Utility users Tax 10,530 10,182 3.4% - - 0.0% 10,530 10,182 3.4%
Property Transfer Tax 3,788 5,373 -29.5% - - 0.0% 3,788 5,373 -29.5%
911 communication 3,123 3,110 0.4% - - 0.0% 3,123 3,110 0.4%
Access Tax - -
Other taxes 1,822 1,431 27.3% 661 836 -20.9% 2,483 2,267 9.5%
Investment Earnings 4,484 4,286 4.6% 1,215 1,262 -3.7% 5,699 5,548 2.7%
Gain or loss on sale of assets 2 554 -99.6% - - 0.0% 2 554 -99.6%
Miscellaneous 878 854 2.8% - - 0.0% 878 854 2.8%
Total Revenues 144,412 135,183 6.8% 19,770 21,401 -7.6% 164,182 156,584 4.9%
Expenses
General Government 13,980 14,054 -0.5% - - 0.0% 13,980 14,054 -0.5%
Public safety 73,022 68,742 6.2% - - 0.0% 73,022 68,742 6.2%
Engineering & Transportatio 32,594 35,750 -8.8% - - 0.0% 32,594 35,750 -8.8%
Recreation and Culture 13,337 14,087 -5.3% - - 0.0% 13,337 14,087 -5.3%
Community Development 15,377 10,391 48.0% - - 0.0% 15,377 10,391 48.0%
Interest on Long-Term Debt 1,828 1,795 1.8% - - 0.0% 1,828 1,795 1.8%
Water Pollution Control - - 0.0% 15,234 11,814 28.9% 15,234 11,814 28.9%
Shoreline - - 0.0% 2,094 1,678 24.8% 2,094 1,678 24.8%
Storm Water Utility - - 0.0% 1,417 1,407 0.7% 1,417 1,407 0.7%
Environmental Services - - 0.0% 1,082 1,061 2.0% 1,082 1,061 2.0%
Total Expenses 150,138 144,819 3.7% 19,827 15,960 24.2% 169,965 160,779 5.7%
Excess(deficiency)of revenues
over expenses before transfe (5,726) (9,636) -40.6% (57) 5,441 -101.0% (5,783) (4,195) 37.9%
Transfer 112 (476) 123.5% (112) 476 -123.5% 0 0 0.0%
Increase in net position (5,614) (10,112) -44.5% (169) 5,917 -102.9% (5,783) (4,195) 37.9%
Beginning net position 127,208 137,320 -7.4% 58,753 52,835 11.2% 185,960 190,155 -2.2%
Ending net position 121,593$ 127,208$ -4.4% 58,584$ 58,752$ -0.3% 180,177$ 185,960$ -3.1%
Changes in Net Activities
Year Ended June 30, 2020
(in thousands)
Governmental Activities Business-Type Activities Total
7
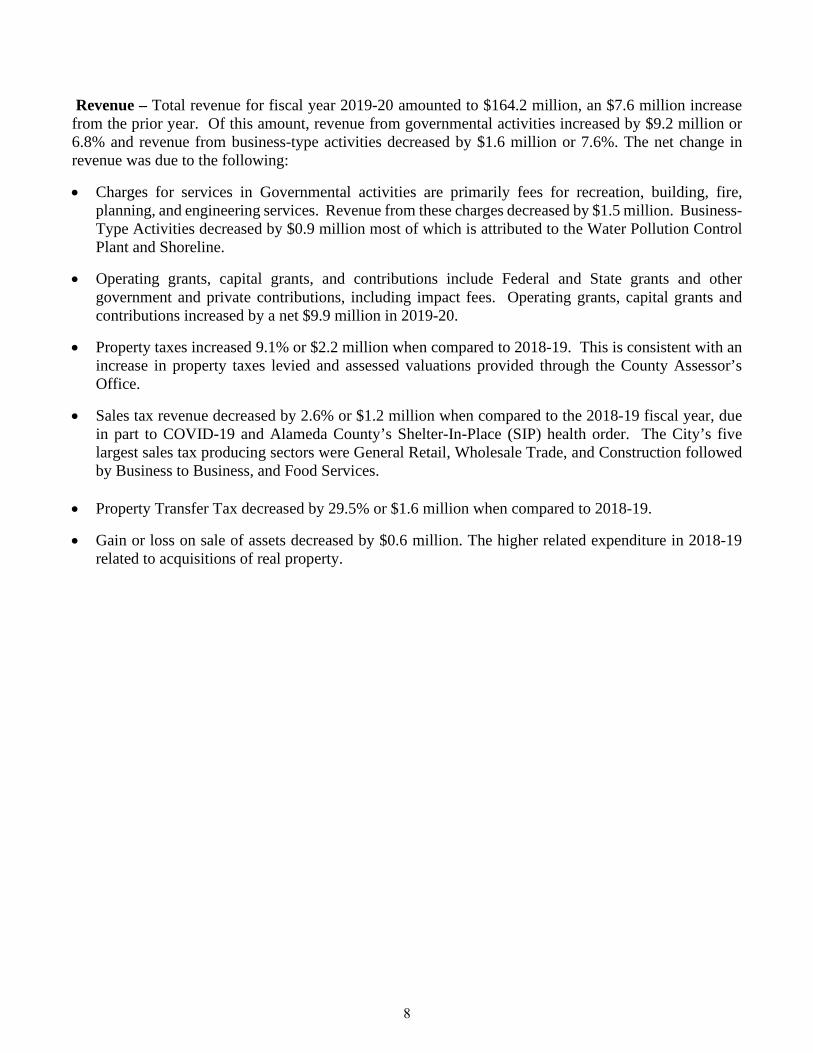
Revenue – Total revenue for fiscal year 2019-20 amounted to $164.2 million, an $7.6 million increase from the prior year. Of this amount, revenue from governmental activities increased by $9.2 million or 6.8% and revenue from business-type activities decreased by $1.6 million or 7.6%. The net change in revenue was due to the following:
• Charges for services in Governmental activities are primarily fees for recreation, building, fire,planning, and engineering services. Revenue from these charges decreased by $1.5 million. Business-Type Activities decreased by $0.9 million most of which is attributed to the Water Pollution ControlPlant and Shoreline.
• Operating grants, capital grants, and contributions include Federal and State grants and othergovernment and private contributions, including impact fees. Operating grants, capital grants andcontributions increased by a net $9.9 million in 2019-20.
• Property taxes increased 9.1% or $2.2 million when compared to 2018-19. This is consistent with anincrease in property taxes levied and assessed valuations provided through the County Assessor’sOffice.
• Sales tax revenue decreased by 2.6% or $1.2 million when compared to the 2018-19 fiscal year, duein part to COVID-19 and Alameda County’s Shelter-In-Place (SIP) health order. The City’s fivelargest sales tax producing sectors were General Retail, Wholesale Trade, and Construction followedby Business to Business, and Food Services.
• Property Transfer Tax decreased by 29.5% or $1.6 million when compared to 2018-19.
• Gain or loss on sale of assets decreased by $0.6 million. The higher related expenditure in 2018-19related to acquisitions of real property.
8
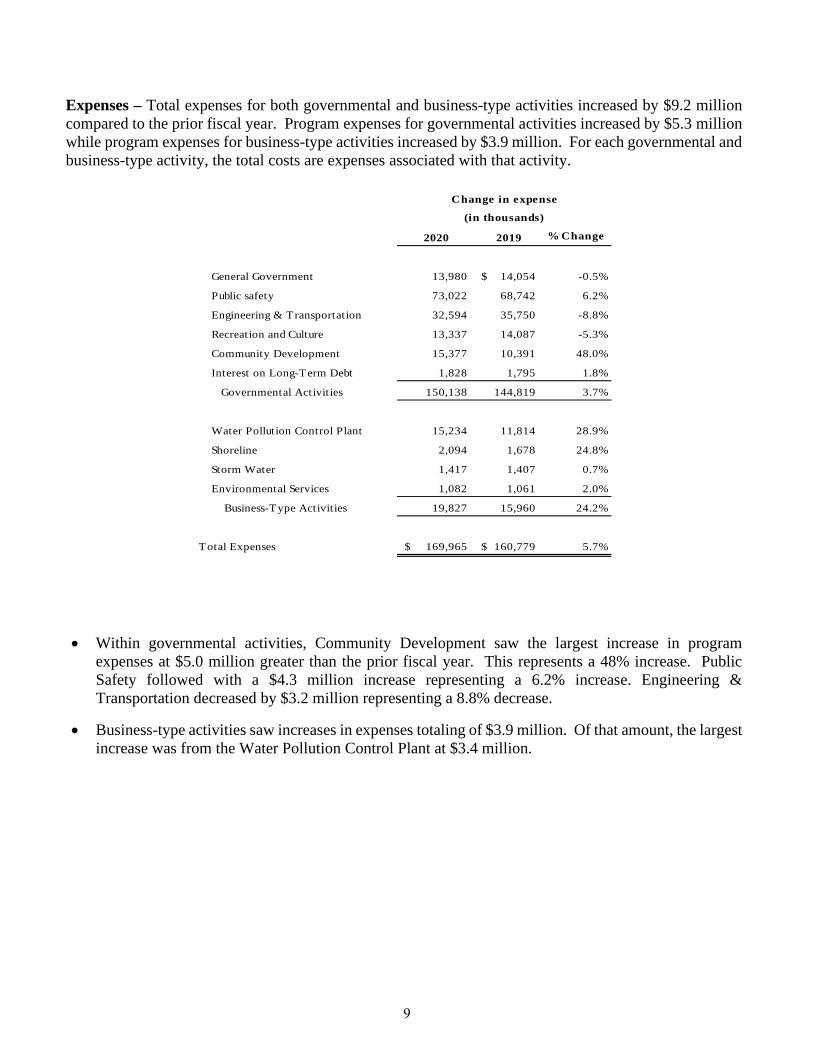
Expenses – Total expenses for both governmental and business-type activities increased by $9.2 million compared to the prior fiscal year. Program expenses for governmental activities increased by $5.3 million while program expenses for business-type activities increased by $3.9 million. For each governmental and business-type activity, the total costs are expenses associated with that activity.
2020 2019 % Change
General Government 13,980 14,054$ -0.5%
Public safety 73,022 68,742 6.2%
Engineering & Transportation 32,594 35,750 -8.8%
Recreation and Culture 13,337 14,087 -5.3%
Community Development 15,377 10,391 48.0%
Interest on Long-Term Debt 1,828 1,795 1.8%
Governmental Activities 150,138 144,819 3.7%
Water Pollution Control Plant 15,234 11,814 28.9%
Shoreline 2,094 1,678 24.8%
Storm Water 1,417 1,407 0.7%
Environmental Services 1,082 1,061 2.0%
Business-Type Activities 19,827 15,960 24.2%
Total Expenses 169,965$ 160,779$ 5.7%
Change in expense
(in thousands)
• Within governmental activities, Community Development saw the largest increase in programexpenses at $5.0 million greater than the prior fiscal year. This represents a 48% increase. PublicSafety followed with a $4.3 million increase representing a 6.2% increase. Engineering &Transportation decreased by $3.2 million representing a 8.8% decrease.
• Business-type activities saw increases in expenses totaling of $3.9 million. Of that amount, the largestincrease was from the Water Pollution Control Plant at $3.4 million.
9
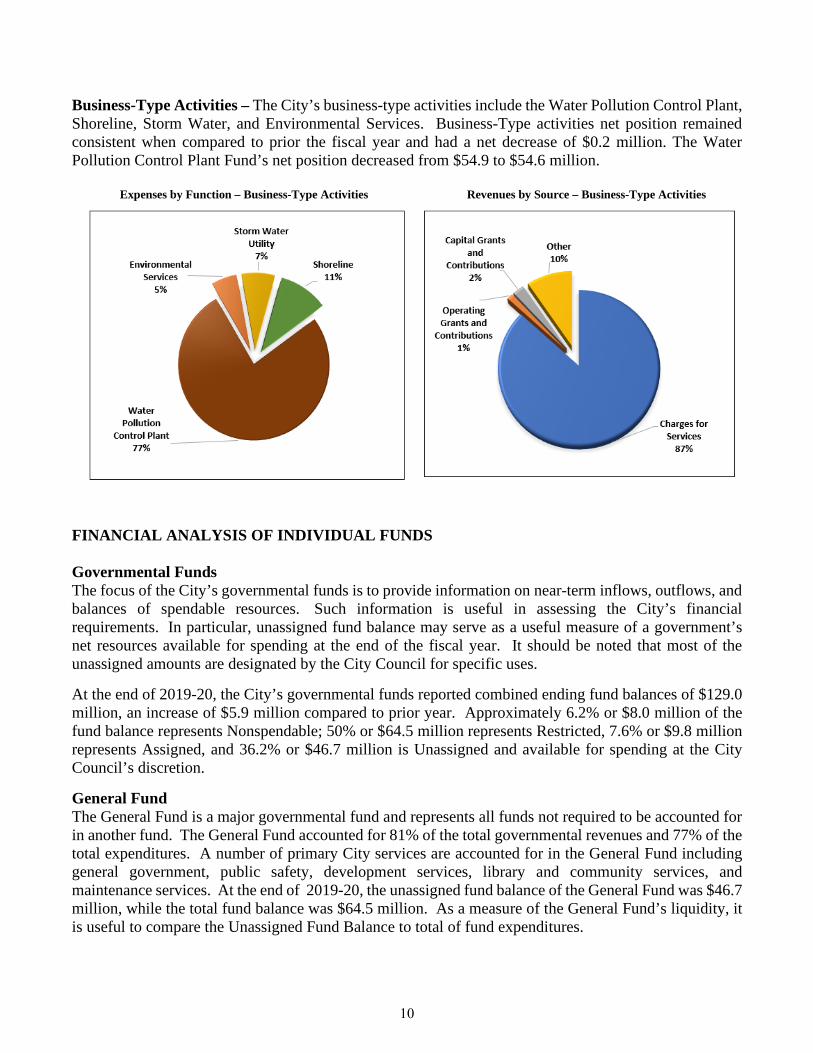
Business-Type Activities – The City’s business-type activities include the Water Pollution Control Plant, Shoreline, Storm Water, and Environmental Services. Business-Type activities net position remained consistent when compared to prior the fiscal year and had a net decrease of $0.2 million. The Water Pollution Control Plant Fund’s net position decreased from $54.9 to $54.6 million.
Expenses by Function – Business-Type Activities Revenues by Source – Business-Type Activities
FINANCIAL ANALYSIS OF INDIVIDUAL FUNDS
Governmental Funds The focus of the City’s governmental funds is to provide information on near-term inflows, outflows, and balances of spendable resources. Such information is useful in assessing the City’s financial requirements. In particular, unassigned fund balance may serve as a useful measure of a government’s net resources available for spending at the end of the fiscal year. It should be noted that most of the unassigned amounts are designated by the City Council for specific uses.
At the end of 2019-20, the City’s governmental funds reported combined ending fund balances of $129.0 million, an increase of $5.9 million compared to prior year. Approximately 6.2% or $8.0 million of the fund balance represents Nonspendable; 50% or $64.5 million represents Restricted, 7.6% or $9.8 million represents Assigned, and 36.2% or $46.7 million is Unassigned and available for spending at the City Council’s discretion.
General Fund The General Fund is a major governmental fund and represents all funds not required to be accounted for in another fund. The General Fund accounted for 81% of the total governmental revenues and 77% of the total expenditures. A number of primary City services are accounted for in the General Fund including general government, public safety, development services, library and community services, and maintenance services. At the end of 2019-20, the unassigned fund balance of the General Fund was $46.7 million, while the total fund balance was $64.5 million. As a measure of the General Fund’s liquidity, it is useful to compare the Unassigned Fund Balance to total of fund expenditures.
10
The Unassigned Fund Balance of $46.7 million has been designated for the following purposes:
• $0.7 million for Compensated Absences• $5.0 million for Major Emergencies• $19.6 million for Economic Uncertainty• $21.4 million for remaining Unassigned (for liquidity and other purposes)
At the end of fiscal year 2019-20 the General Fund ending balance increased by $4.5 million compared to prior Fiscal Year. General Fund revenues decreased by $1.4 million primarily due to a decrease in other revenue for $1.2 million. General Fund expenditures (not including Transfers Out) show an increase of $3.8 million from prior Fiscal Year. The increase is largely due to public safety ($2.7 million increase) and general government ($0.8 million increase).
Capital Improvement Capital Projects Fund The Capital Improvement Capital Projects Fund is a major governmental fund and accounted for less than 0.1% of the total governmental revenues and 5.9% of the total expenditures (not including other financing sources such as issuance of debt or interfund transfers). The Fund accounts for monies for major capital improvement projects not provided for in the other special revenue funds such as the Measure B, BB, and F Funds. At June 30, 2020, the Capital Improvement Capital Projects Fund had a total fund balance of $44.4 million, a decrease of 4.1%. The fund balance including the proceeds from 2018 Lease Revenue Bonds anticipated to include improvements to the Police and South Office Buildings, the Mulford-Marina Branch Library, Manor Park Competition Pool, Farrelly Pool, Casa Peralta, and the Boat Harbor.
Non-major Governmental Funds The City’s non-major funds are presented in the basic financial statements in the aggregate. As of June 30, 2020, non-major funds had a total fund balance of $20.1 million of which all are legally restricted for specific purposes by external funding. More information about these aggregate non-major funds can be found in the combining statements immediately following the required supplementary information.
Proprietary Funds The City’s proprietary funds provide the same type of information found in the government-wide financial statements but in greater detail.
The total net position of the Enterprise Funds was $58.6 million at the end on June 30, 2020, a decrease of $0.2 million from the prior fiscal year. The total net position of the Internal Service Funds was $16.0 million at the end on June 30, 2020, an increase of $1.9 million from the prior fiscal year.
Water Pollution Control Plant Enterprise Fund The Water Pollution Control Plant Enterprise Fund was established to account for the City’s sewers system, which protects public health and preserves water quality through collection, treatment, and disposal of wastewater and wastewater solids. As of June 30, 2020, the Fund’s net position totaled $54.6 million, a decrease of $0.3 million due to increased Salaries and Benefits expenses related to GASB 68 pension expense allocation.
11

Shoreline Enterprise Fund The Shoreline Enterprise Fund was established in 2002-03 by combining the Marina Enterprise and the Golf Course Enterprise Funds. The Fund accounts for the operation of recreational boat berthing, food service facilities, and the public golf course. As of June 30, 2020, the Fund’s net position totaled $3.2 million, an increase of $0.4 million or 15.9%. Net position for the prior year was $2.8 million.
Non-major Enterprise Funds The City’s non-major enterprise funds include Storm Water and Environmental Services. Year over year, net position for non-major enterprise funds decreased by 29.1%, or $0.3 million, due to decrease or loss in the Storm Water Fund of $0.3 million and an increase of $0.1 million in the Environment Services Fund. More information about these aggregate non-major enterprise funds can be found in the combining statements following the required supplementary information.
12

GENERAL FUND BUDGETARY HIGHLIGHTS
The General Fund ended the fiscal year with actual revenues above final budget projections by 0.5% or $0.5 million, not including end of fiscal year carryovers. Expenditures were 9.1% or $10.7 million below final budget projections.
Variance with
Budgeted Amounts Final Budget
Positive
Adopted Final Actual (Negative)
REVENUES:
Property taxes and other taxes 95,604$ 95,604$ 95,518$ (86)$
Licenses and permits 10,554 10,604 11,249 645
Fines and forfeitures 1,581 1,581 1,099 (482)
Services charges 3,034 3,034 2,291 (743)
Intergovernmental 773 773 869 96
Use of money and property 1,920 1,871 4,171 2,300
Interdepartmental charges 2,000 2,000 2,000 -
Other 1,401 1,405 213 (1,192)
Total revenues 116,867 116,872 117,410 538
EXPENDITURES:
Current:
General government 13,388 15,144 13,109 (2,035)
Public safety 66,111 67,600 64,540 (3,060)
Engineering and transportation 10,976 11,683 10,095 (1,588)
Recreation and culture 11,136 11,467 10,386 (1,081)
Community development 6,603 8,228 5,826 (2,402)
Debt service:
Principal 2,520 2,520 2,000 (520)
Interest and fees 706 706 706 -
Total expenditures 111,440 117,348 106,662 (10,686)
EXCESS (DEFICIENCY) OF REVENUES
OVER EXPENDITURES 5,427 (476) 10,748 11,224
OTHER FINANCING SOURCES (USES):
Transfers (in) - 100 100
Transfers (out) (5,350) (6,325) (6,325) -
Total other financing sources (uses) (5,350) (6,225) (6,225) -
NET CHANGE IN FUND BALANCE 77$ (6,701)$ 4,523$ 11,224$
FUND BALANCES:
Beginning of year 59,991
End of year 64,514$
CITY OF SAN LEANDRO
Summary Analysis of General Fund Budget, Fiscal Year 2019-20
(in thousands)
13

CAPITAL ASSETS AND DEBT ADMINISTRATION
Capital Assets The City’s capital assets for its governmental and business-type activities as of June 30, 2020 amount to $270.5 million, net of accumulated depreciation. This represents a decrease of $4.5 million due to an annual depreciation expense of over $18.6 million offset by expenditures for Water Pollution Control Plant and Sewer Infrastructure, the Climatec project, the Police Building & South Office Expansion, and the Farrelly Pool Replacement.
Investment in capital assets includes land, buildings, improvements, machinery and equipment, infrastructure, and construction in progress. Infrastructure assets are items that are normally immovable and of value only to the City such as roads, bridges, streets and sidewalks, drainage systems, lighting systems, and similar infrastructure.
The following is a summary of the City’s capital assets:
City of San Leandro
Capital Assets (net of depreciation)
Year Ended June 30, 2020
(in thousands)
2020 2019 2020 2019 2020 2019
Land 16,550$ 16,550$ 5,234$ 5,234$ 21,784$ 21,784$
Construction in progress 12,945 4,048 1,148 1,469 14,093 5,517
Total non-depreciable assets 29,495 20,598 6,382 6,703 35,877 27,301
Depreciable asets (net of depreciation)
Buildings 52,853 54,397 55,753 57,115 108,606 111,512
Improvements other than buildings 5,037 5,239 - - 5,037 5,239
Machinery and equipment 3,482 2,999 4,926 5,082 8,408 8,081
Licensed Vehicles 6,312 6,226 49 32 6,361 6,258
Infrastructure 95,317 108,447 10,862 8,103 106,179 116,551
Total depreciable assets 163,001 177,309 71,590 70,332 234,591 247,641
Total capital assets 192,496$ 197,907$ 77,972$ 77,035$ 270,468$ 274,942$
Governmental Activities Business-Type Activities Total
Additional information on the City’s capital assets can be found in Note 5 of the notes to the financial statements.
14

Debt Administration At the end of the current fiscal year, the City’s total outstanding long-term debt is $89.9 million, a decrease of $5.9 million from the prior Fiscal Year.
At the end of the current fiscal year, the City’s total long-term debt outstanding for governmental activities is $53.5 million, a decrease of $3.9 million from the prior fiscal year. The decrease was due to principal payments during the year as seen in Note 6 of the notes to the financial statements.
At the end of the current fiscal year, the City’s total long-term debt outstanding for business-type activities is $36.3 million, a decrease of $2.1 million from the prior fiscal year. The decrease reflects normal debt amortization for the State Water Resources Control Board Loan and Marina Cal Boating Loan.
Additional information on the City’s long-term debt obligations can be found in Note 6 of the notes to the financial statements.
The following is a summary of the City’s outstanding debt:
City of San Leandro
Outstanding Debt
Year Ended June 30, 2020
(in thousands)
2020 2019 2020 2019 2020 2019
Revenue bonds and notes 47,585$ 51,018$ -$ -$ 47,585$ 51,018$
(backed by specific tax and fee revenues)
Certificates of participation - - - - - -
Other loans 5,941 6,393 36,327 38,374 42,268 44,767
Total 53,526$ 57,411$ 36,327$ 38,374$ 89,853$ 95,785$
Governmental Activities Business-Type Activities Total
ECONOMIC FACTORS AND NEXT YEAR’S BUDGET
The economy of the City and major initiative are discussed in the Transmittal Letter located in the Introductory Section of the CAFR.
REQUESTS FOR INFORMATION
This financial report is designed to provide a general overview of the City’s finances for all of its citizens, taxpayers, customers, investors and creditors. Questions concerning any of the information provided in this report or requests for additional information should be addressed to the City of San Leandro, Finance Department, 835 East 14th Street, San Leandro, CA 94577.
15


BASIC FINANCIAL STATEMENTS


GOVERNMENT-WIDE FINANCIAL STATEMENTS

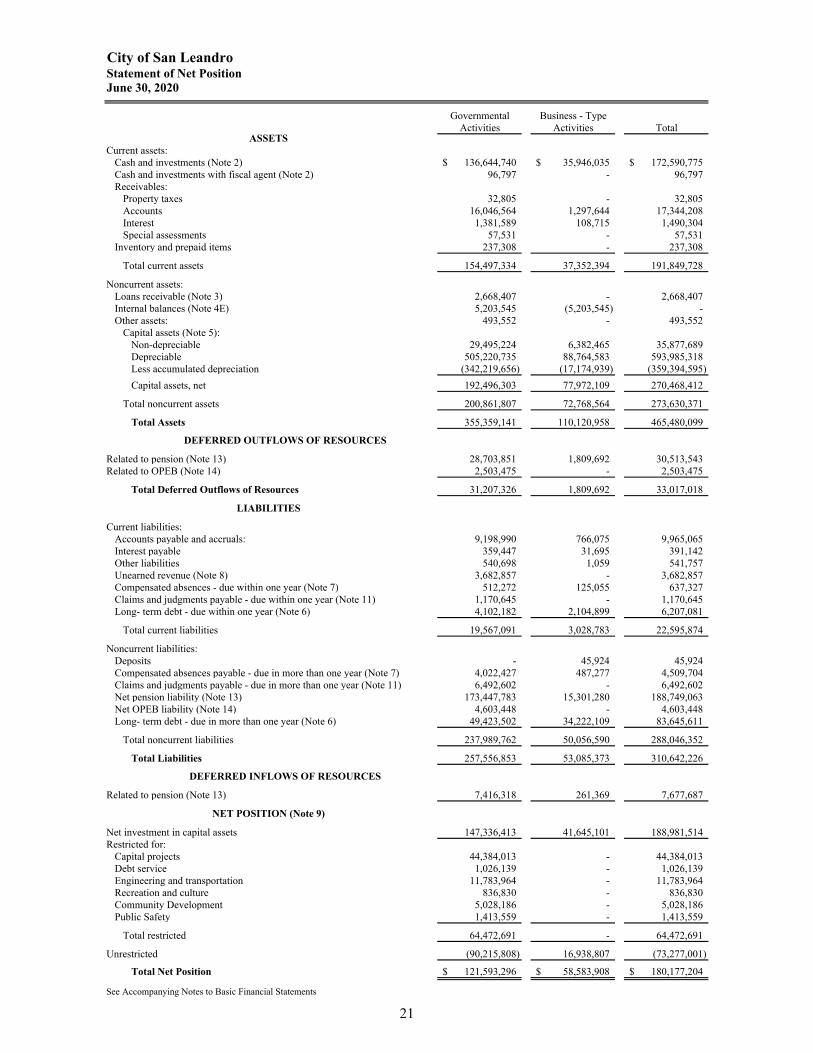
City of San LeandroStatement of Net PositionJune 30, 2020
Governmental Business - TypeActivities Activities Total
Current assets:Cash and investments (Note 2) 136,644,740$ 35,946,035$ 172,590,775$ Cash and investments with fiscal agent (Note 2) 96,797 - 96,797 Receivables:
Property taxes 32,805 - 32,805Accounts 16,046,564 1,297,644 17,344,208 Interest 1,381,589 108,715 1,490,304 Special assessments 57,531 - 57,531
Inventory and prepaid items 237,308 - 237,308
Total current assets 154,497,334 37,352,394 191,849,728
Noncurrent assets:Loans receivable (Note 3) 2,668,407 - 2,668,407 Internal balances (Note 4E) 5,203,545 (5,203,545) - Other assets: 493,552 - 493,552
Capital assets (Note 5):Non-depreciable 29,495,224 6,382,465 35,877,689 Depreciable 505,220,735 88,764,583 593,985,318 Less accumulated depreciation (342,219,656) (17,174,939) (359,394,595)
Capital assets, net 192,496,303 77,972,109 270,468,412
Total noncurrent assets 200,861,807 72,768,564 273,630,371
Total Assets 355,359,141 110,120,958 465,480,099
DEFERRED OUTFLOWS OF RESOURCES
Related to pension (Note 13) 28,703,851 1,809,692 30,513,543 Related to OPEB (Note 14) 2,503,475 - 2,503,475
Total Deferred Outflows of Resources 31,207,326 1,809,692 33,017,018
Current liabilities:Accounts payable and accruals: 9,198,990 766,075 9,965,065 Interest payable 359,447 31,695 391,142 Other liabilities 540,698 1,059 541,757 Unearned revenue (Note 8) 3,682,857 - 3,682,857 Compensated absences - due within one year (Note 7) 512,272 125,055 637,327 Claims and judgments payable - due within one year (Note 11) 1,170,645 - 1,170,645 Long- term debt - due within one year (Note 6) 4,102,182 2,104,899 6,207,081
Total current liabilities 19,567,091 3,028,783 22,595,874
Noncurrent liabilities:Deposits - 45,924 45,924 Compensated absences payable - due in more than one year (Note 7) 4,022,427 487,277 4,509,704 Claims and judgments payable - due in more than one year (Note 11) 6,492,602 - 6,492,602 Net pension liability (Note 13) 173,447,783 15,301,280 188,749,063 Net OPEB liability (Note 14) 4,603,448 - 4,603,448 Long- term debt - due in more than one year (Note 6) 49,423,502 34,222,109 83,645,611
Total noncurrent liabilities 237,989,762 50,056,590 288,046,352
Total Liabilities 257,556,853 53,085,373 310,642,226
DEFERRED INFLOWS OF RESOURCES
Related to pension (Note 13) 7,416,318 261,369 7,677,687
Net investment in capital assets 147,336,413 41,645,101 188,981,514 Restricted for:
Capital projects 44,384,013 - 44,384,013 Debt service 1,026,139 - 1,026,139 Engineering and transportation 11,783,964 - 11,783,964 Recreation and culture 836,830 - 836,830 Community Development 5,028,186 - 5,028,186 Public Safety 1,413,559 - 1,413,559
Total restricted 64,472,691 - 64,472,691
Unrestricted (90,215,808) 16,938,807 (73,277,001)
Total Net Position 121,593,296$ 58,583,908$ 180,177,204$
See Accompanying Notes to Basic Financial Statements
ASSETS
LIABILITIES
NET POSITION (Note 9)
21

City of San LeandroStatement of Activities and Changes in Net PositionFor the year ended June 30, 2020
Operating Capital Charges for Grants and Grants and
Functions/Programs Expenses Services Contributions Contributions Total
Primary government:Governmental Activities:
General government 13,979,398$ 8,780,626$ -$ 880,080$ 9,660,706$ Public safety 73,021,991 3,258,197 324,330 - 3,582,527 Engineering and transportation 32,594,161 809,606 4,876,532 14,574,656 20,260,794 Recreation and culture 13,337,227 920,855 650,059 2,319,848 3,890,762 Community development 15,377,114 4,096,526 1,681,870 - 5,778,396 Interest on long-term debt 1,827,883 - - - -
Total Governmental Activities 150,137,774 17,865,810 7,532,791 17,774,584 43,173,185
Business-type activities:Water Pollution Control Plant 15,233,737 13,699,464 - 472,735 14,172,199 Shoreline 2,094,266 1,710,740 - - 1,710,740 Storm Water Utility 1,417,416 1,073,513 - - 1,073,513 Environmental Services 1,081,674 679,268 258,586 - 937,854
Total business-type Activities 19,827,093 17,162,985 258,586 472,735 17,894,306
Total primary government 169,964,867$ 35,028,795$ 7,791,377$ 18,247,319$ 61,067,491$
General revenues:Taxes:
Property taxes Sales taxFranchise feesUtility users taxProperty transfer tax911 communication access taxOther taxes
Total Taxes
Investment earningsMiscellaneousGain on sale of assets
Transfers
Total general revenues and transfers
Change in net position
Net position - Beginning of year
Net position - End of year
See Accompanying Notes to Basic Financial Statements
Program Revenues
22
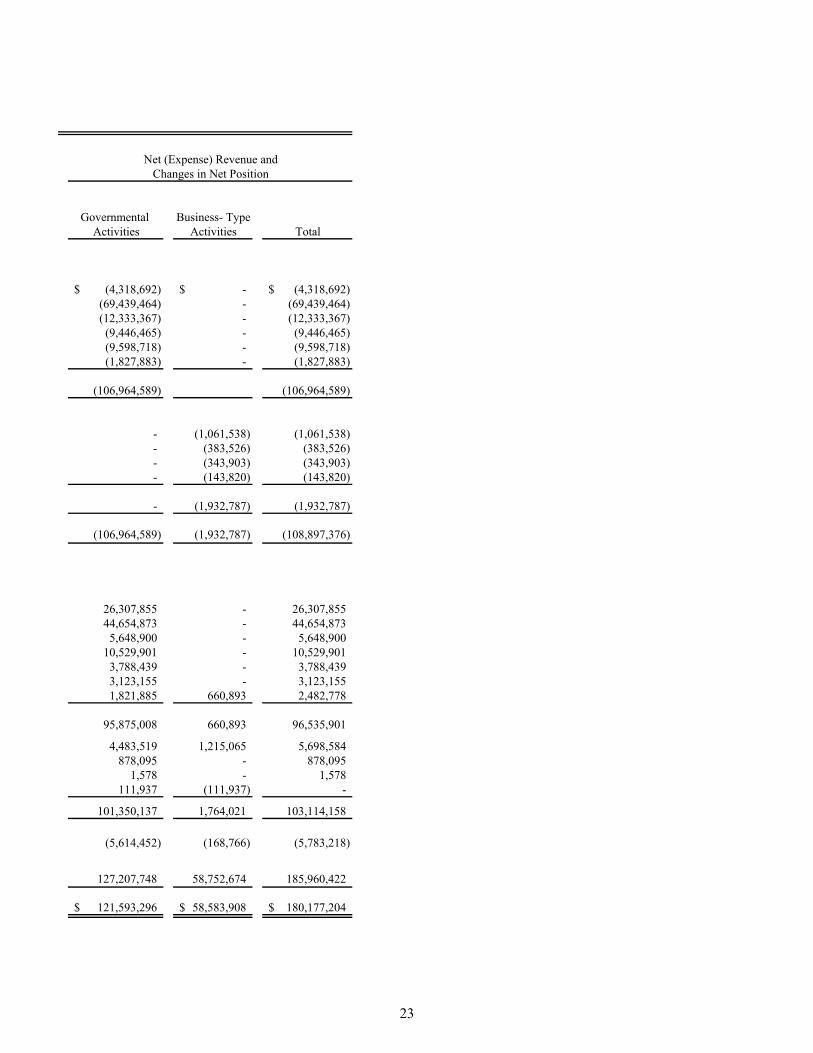
Governmental Business- TypeActivities Activities Total
(4,318,692)$ -$ (4,318,692)$ (69,439,464) - (69,439,464)(12,333,367) - (12,333,367)
(9,446,465) - (9,446,465)(9,598,718) - (9,598,718)(1,827,883) - (1,827,883)
(106,964,589) (106,964,589)
- (1,061,538) (1,061,538) - (383,526) (383,526) - (343,903) (343,903) - (143,820) (143,820)
- (1,932,787) (1,932,787)
(106,964,589) (1,932,787) (108,897,376)
26,307,855 - 26,307,855 44,654,873 - 44,654,873 5,648,900 - 5,648,900
10,529,901 - 10,529,901 3,788,439 - 3,788,439 3,123,155 - 3,123,155 1,821,885 660,893 2,482,778
95,875,008 660,893 96,535,901
4,483,519 1,215,065 5,698,584 878,095 - 878,095
1,578 - 1,578 111,937 (111,937) -
101,350,137 1,764,021 103,114,158
(5,614,452) (168,766) (5,783,218)
127,207,748 58,752,674 185,960,422
121,593,296$ 58,583,908$ 180,177,204$
Changes in Net PositionNet (Expense) Revenue and
23


FUND FINANCIAL STATEMENTS
Governmental Fund Financial Statements Proprietary Fund Financial Statements Fiduciary Fund Financial Statements


GOVERNMENTAL FUND FINANCIAL STATEMENTS
The General Fund – Accounts for all general revenues of the City not specifically levied or collected for other City funds and the related expenditures. The General Fund accounts for all financial resources of a governmental unit which are not accounted for in other funds.
Capital Improvement Projects Capital Projects Fund – This fund accounts monies for major capital improvement projects not provided for in the other capital improvement projects fund.
27

City of San LeandroGovernmental FundsBalance SheetJune 30, 2020
CapitalImprovement Non-Major
Capital Projects GovernmentalGeneral Fund Fund Funds Total
Cash and investments (Note 2) 52,487,251$ 45,834,746$ 19,385,207$ 117,707,204$ Cash and investments with fiscal agent (Note 2) 1 96,796 - 96,797 Receivables:
Property taxes 32,805 - - 32,805 Accounts 12,371,694 - 845,651 13,217,345 Federal, State, and local grants 46,403 - 2,782,816 2,829,219 Interest 1,274,039 - 52,498 1,326,537 Special Assessment 56,626 - 905 57,531 Loans (Note 3) 1,497,835 - 1,170,572 2,668,407
Due from other funds (Note 4A) 1,209,000 - - 1,209,000 Advances to other funds (Note 4B) 6,500,110 - - 6,500,110 Other assets 493,552 - - 493,552
Total Assets 75,969,316$ 45,931,542$ 24,237,649$ 146,138,507$
Liabilities:Accounts payable and accruals 5,531,542$ 1,561,151$ 1,400,586$ 8,493,279$ Due to other funds (Note 4A) - - 265,000 265,000 Advances from other funds (Note 4B) 2,240,565 - - 2,240,565 Unearned revenue 3,682,857 - - 3,682,857
Total Liabilities 11,454,964 1,561,151 1,665,586 14,681,701
Unavailable revenue - grants receivable - - 2,469,763 2,469,763
Total Deferred Inflow of Resources - - 2,469,763 2,469,763
Fund Balances: (Note 9)
Nonspendable 7,997,945 - - 7,997,945 Restricted 50,000 44,370,391 20,102,300 64,522,691 Assigned 9,799,641 - - 9,799,641 Unassigned 46,666,766 - - 46,666,766
Total Fund Balances 64,514,352 44,370,391 20,102,300 128,987,043
Total Liabilities, Deferred Inflows of Resourcesand Fund Balances 75,969,316$ 45,931,542$ 24,237,649$ 146,138,507$
See Accompanying Notes to Basic Financial Statements
ASSETS
DEFERRED INFLOW OF RESOURCES
LIABILITIES
Major Funds
28

City of San LeandroReconciliation of the Governmental Funds Balance Sheet
with the Statement of Net PositionJune 30, 2020
Total fund balances reported on the governmental funds balance sheet 128,987,043$
Amounts reported for Governmental Activities in the Statement of Net Positionare different from those reported in the Governmental Funds above because of the following:
CAPITAL ASSETSCapital assets used in Governmental Activities are not current assets or financial resources andtherefore are not reported in the Governmental Funds. 186,679,788
ALLOCATION OF INTERNAL SERVICE FUND NET POSITIONInternal service funds are not governmental funds. However, they are used by management tocharge the costs of certain activities, such as insurance and central services and maintenanceto individual governmental funds. The net current assets of the Internal Service Funds are thereforeincluded in Governmental Statement of Activities. 15,951,422
LONG-TERM ASSETS AND LIABILITIESThe assets and liabilities below are not due and payable in the current period and therefore are notreported in the Funds:
Net OPEB liability, related deferred outflows and inflows of resources (2,099,973) Net pension liability, related deferred outflows and inflows of resources (152,160,250)Long-term debt (53,525,684) Interest payable (359,447) Compensated absences (4,349,366) Recognition of grants revenue 2,469,763
NET POSITION OF GOVERNMENTAL ACTIVITIES 121,593,296$
See Accompanying Notes to Basic Financial Statements
29

City of San LeandroStatement of Revenues, Expenditures and Changes in Fund BalancesGovernmental FundsFor the year ended June 30, 2020
CapitalImprovement Non-Major
Capital Projects GovernmentalGeneral Fund Funds Total
REVENUES
Property and other taxes 95,518,442$ -$ 571,383$ 96,089,825$ Licenses and permits 11,249,117 - 1,000,082 12,249,199 Fines and forfeitures 1,098,744 - 397,107 1,495,851 Service charges 2,290,682 62,490 46,232 2,399,404 Intergovernmental 869,148 - 19,683,507 20,552,655 Use of money and property 4,170,654 1,002 3,779,335 7,950,991 Interdepartmental charges 1,999,878 - - 1,999,878 Other 213,652 - 1,459,930 1,673,582
Total Revenues 117,410,317 63,492 26,937,576 144,411,385
EXPENDITURES
Current:General government 13,109,392 - - 13,109,392 Public safety 64,540,116 - 168,629 64,708,745 Engineering and transportation 10,094,413 1,291,555 17,395,665 28,781,633 Recreation and culture 10,385,984 - 613,397 10,999,381 Community development 5,825,646 6,858,965 2,014,796 14,699,407
Debt service:Principal 2,000,156 - 1,668,000 3,668,156 Interest and fees 706,022 - 1,711,733 2,417,755
Total Expenditures 106,661,729 8,150,520 23,572,220 138,384,469
REVENUES OVER (UNDER) EXPENDITURES 10,748,588 (8,087,028) 3,365,356 6,026,916
OTHER FINANCING SOURCES (USES)Transfers in (Note 4D) 100,000 6,275,000 50,000 6,425,000 Transfers (out) (Note 4D) (6,325,000) (100,000) (110,090) (6,535,090)
Total Other Financing Sources (Uses) (6,225,000) 6,175,000 (60,090) (110,090)
NET CHANGE IN FUND BALANCES 4,523,588 (1,912,028) 3,305,266 5,916,826
FUND BALANCES
Beginning of year 59,990,764 46,282,419 16,797,034 123,070,217
End of year 64,514,352$ 44,370,391$ 20,102,300$ 128,987,043$
See Accompanying Notes to Basic Financial Statements
Major Fund
30

City of San LeandroReconciliation of the Net Change in Fund Balances - Total Government Funds with the Statement of Activities
For the year ended June 30, 2020
The schedule below reconciles the Net Changes in Fund Balances reported on the Governmental Funds Statement ofRevenues, Expenditures and Changes in Fund Balance, which measures only changes in current assets and currentliabilities on the modified accrual basis, with the Change in Net Position of Governmental Activities reported in theStatement of Activities, which is prepared on the full accrual basis.
NET CHANGE IN FUND BALANCES - TOTAL GOVERNMENTAL FUNDS 5,916,826$
Amounts reported for governmental activities in the Statement of Activities are different because of the following:
CAPITAL ASSET TRANSACTIONS
Governmental Funds report capital outlays as expenditures. However, in the Statement of Activities the cost of those assets is capitalized and allocated over their estimated useful lives and reported as depreciation expense.
Capital expenditures are therefore added back to fund balance 9,756,296 Capital expenditures retirements deducted from fund balance (1,032) Depreciation expense is deducted from the fund balance. The amount excludes the depreciation of $1,060,851,
which is reported in the Internal Service Funds. (15,772,837)
LONG-TERM DEBT PROCEEDS AND PAYMENTS
Bond proceeds provide current financial resources to governmental funds, but issuing debt increases long-term liabilities in the Statement of Net Position.Repayment of bond principal is an expenditure in the governmental funds, butin the Statement of Net Position the repayment reduces long-term liabilities.
Repayment of debt principal is added back to fund balance 3,668,156 Amortization of bond discount is deducted from fund balance (10,119) Amortization of bond premium is added back to fund balance 227,386
ACCRUAL OF NON-CURRENT ITEMS
The amounts below included in the Statement of Activities do not provide or (require) the use of current financial resources and therefore are not reported as revenue or expenditures in governmental funds (net change):
Unearned revenue 59,192Interest payable 12,372Compensated absences (354,136) Net pension liabilities, related deferred outflows and inflows of resources (11,977,779) Net OPEB liabilities, related deferred outflows and inflows of resources 973,217
ALLOCATION OF INTERNAL SERVICE FUND ACTIVITY
Internal Service Funds are used by management to charge the costs of certain activities, 'such as equipment acquisition, maintenance, and insurance to individual funds. The portion of the net revenue (expense) of these Internal Service Funds arising out of their transactions with governmental funds is reported with governmental activities, because they service those activities.
Change in Net Position - All Internal Service Funds 1,888,006
CHANGE IN NET POSITION OF GOVERNMENTAL ACTIVITIES (5,614,452)$
See Accompanying Notes to Basic Financial Statements
31

PROPRIETARY FUND FINANCIAL STATEMENTS
Water Pollution Control Plant - This fund accounts for the City’s sewers which protect public health and preserve water quality through the collection, treatment and disposal of the community’s wastewater and wastewater solids.
Shoreline - The City operates various recreational facilities which include golf and marina berthing as well as providing food service facilities for the general public in an area connected to the San Francisco Bay.
Internal Service Funds - These funds are used to account for special activities and services performed by a designated City department for other departments on a cost reimbursement basis.
33

City of San LeandroStatement of Net PositionProprietary FundsJune 30, 2020
Major Enterprise Funds GovernmentalWater Non- Major Activities-
Pollution Enterprise Internal ServiceControl Plant Shoreline Funds Total Funds
Current Assets:Cash and investments (Note 2) 29,790,884$ 4,416,085$ 1,739,066$ 35,946,035$ 18,937,536$ Receivables:
Accounts 865,547 316,008 116,089 1,297,644 Interest 88,049 15,175 5,491 108,715 55,052
Inventory - - - - 237,308
Total current assets 30,744,480 4,747,268 1,860,646 37,352,394 19,229,896
Noncurrent assets:Advance to other fund (Note 4B) 2,240,565 - - 2,240,565 - Capital assets (Note 5)
Non-Depreciable 2,804,655 3,577,810 - 6,382,465 - Depreciable 82,955,868 5,788,252 20,463 88,764,583 17,737,757 Less accumulated depreciation (13,381,581) (3,772,895) (20,463) (17,174,939) (11,921,242)
Total capital assets, net 72,378,942 5,593,167 - 77,972,109 5,816,515
Total noncurrent assets 74,619,507 5,593,167 - 80,212,674 5,816,515
Total Assets 105,363,987 10,340,435 1,860,646 117,565,068 25,046,411
DEFERRED OUTFLOWS OF RESOURCES
Related to pension (Note 13) 1,809,692 - - 1,809,692 -
Current Liabilities:Accounts payable 728,558 16,778 20,739 766,075 705,711 Interest payable - 31,695 - 31,695 - Due to other funds (Note 4A) - - 944,000 944,000 - Other liabilities 1,059 - - 1,059 540,698 Unearned revenue - - - - - Claims and judgments - due in 1 year (Note 11) - - - - 1,170,645 Compensated absences - due in 1 year (Note 7) 72,010 6,852 46,193 125,055 34,426 Notes payable - due in 1 year (Note 6) 1,834,312 270,587 - 2,104,899 -
Total current liabilities 2,635,939 325,912 1,010,932 3,972,783 2,451,480
Non-current Liabilities:Deposits payable 3,000 42,924 - 45,924 - Advances from other funds (Note 4B) - 6,500,110 - 6,500,110 - Claims and judgments - due in more than 1 year (Note 11) - - - - 6,492,602 Compensated absences - due in more than 1 year (Note 7) 348,820 9,923 128,534 487,277 150,907 Net pension liability (Note 13) 15,301,280 - - 15,301,280 - Long-term debt - due in more than 1 year (Note 6) 33,994,642 227,467 - 34,222,109 -
Total noncurrent liabilities 49,647,742 6,780,424 128,534 56,556,700 6,643,509
Total liabilities 52,283,681 7,106,336 1,139,466 60,529,483 9,094,989
DEFERRED INFLOWS OF RESOURCES
Related to pension (Note 13) 261,369 - - 261,369 -
Net investment in capital asset 36,549,988 5,095,113 - 41,645,101 5,816,515 Unrestricted 18,078,641 (1,861,014) 721,180 16,938,807 10,134,907
Total Net Position 54,628,629$ 3,234,099$ 721,180$ 58,583,908$ 15,951,422$
See Accompanying Notes to Basic Financial Statements
NET POSITION (Note 9)
ASSETS
LIABILITIES
34

City of San LeandroStatement of Revenues, Expenses, and Changes in Fund Net PositionProprietary FundsFor the year ended June 30, 2020
Governmental Water Non- Major Activities-
Pollution Enterprise Internal ServiceControl Plant Shoreline Funds Total Funds
OPERATING REVENUES:Charges for services 12,453,340$ 293,010$ 1,363,447$ 14,109,797$ 16,907,744$ Licenses and permits 856,484 - 371,059 1,227,543 - Rents and concessions - 1,417,034 - 1,417,034 - Other operating revenues 389,640 696 18,275 408,611 496,980
Total Operating Revenues 13,699,464 1,710,740 1,752,781 17,162,985 17,404,724
OPERATING EXPENSES:Salaries and benefits 7,374,993 507,193 1,435,595 9,317,781 3,485,290 Contractual and other services 1,955,578 741,077 371,685 3,068,340 9,223,638 Materials and supplies 638,047 88,156 35,896 762,099 752,824 Depreciation 1,648,108 113,889 19,247 1,781,244 1,060,851 Other operating costs 2,638,975 273,021 636,667 3,548,663 1,793,642
Total Operating Expenses 14,255,701 1,723,336 2,499,090 18,478,127 16,316,245
OPERATING INCOME (LOSS) (556,237) (12,596) (746,309) (1,315,142) 1,088,479
NONOPERATING REVENUES (EXPENSES):Property and other taxes - 660,893 - 660,893 - Intergovernmental - - 258,586 258,586 - Investment income 990,812 165,888 58,365 1,215,065 577,500 Interest expense (978,036) (370,930) - (1,348,966) -
Total Nonoperating Revenues (Expenses) 12,776 455,851 316,951 785,578 577,500
INCOME BEFORE CONTRIBUTIONS AND TRANSFERS (543,461) 443,255 (429,358) (529,564) 1,665,979
CONTRIBUTIONS AND TRANSFERS:Capital contributions 472,735 - - 472,735 - Transfers in (Note 4D) - - 132,782 132,782 222,027 Transfers out (Note 4D) (244,719) - - (244,719) -
Total capital contributions and transfers 228,016 - 132,782 360,798 222,027
Change in net position (315,445) 443,255 (296,576) (168,766) 1,888,006
NET POSITION:Net Position-Beginning of year 54,944,074 2,790,844 1,017,756 58,752,674 14,063,416
Net Position-Ending of year 54,628,629$ 3,234,099$ 721,180$ 58,583,908$ 15,951,422$
See Accompanying Notes to Basic Financial Statements
Major Enterprise Funds
35
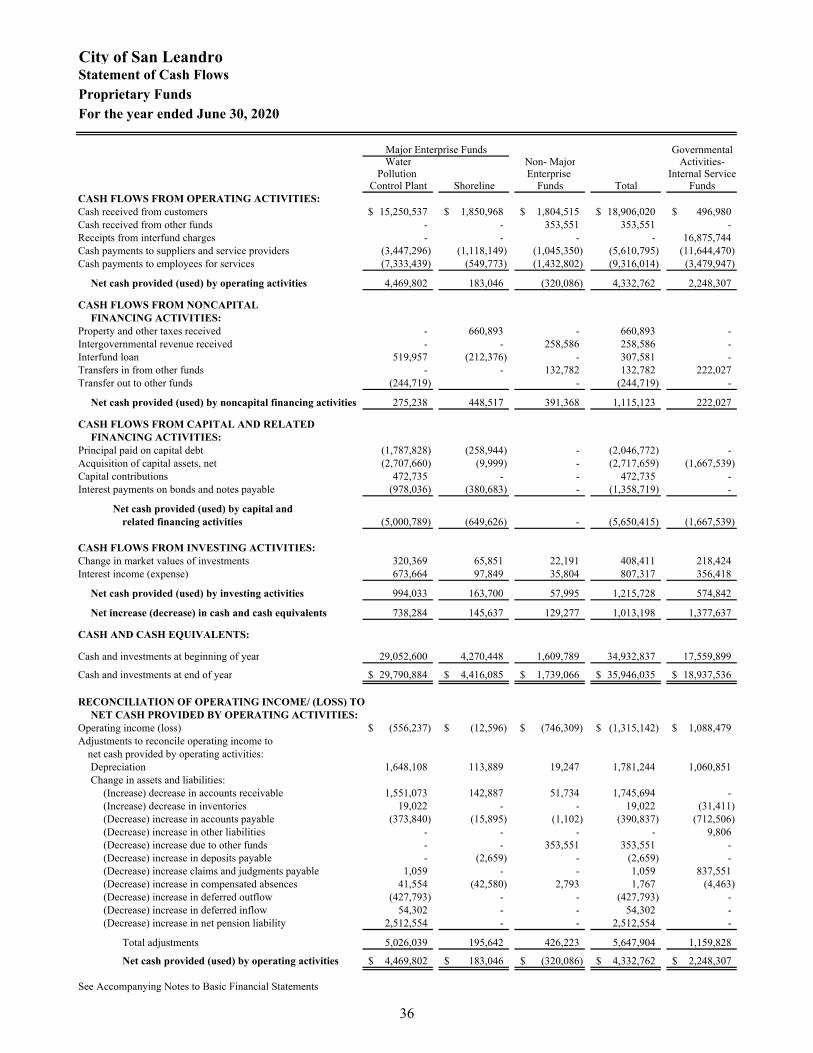
City of San LeandroStatement of Cash FlowsProprietary FundsFor the year ended June 30, 2020
Major Enterprise Funds GovernmentalWater Non- Major Activities-
Pollution Enterprise Internal ServiceControl Plant Shoreline Funds Total Funds
CASH FLOWS FROM OPERATING ACTIVITIES:Cash received from customers 15,250,537$ 1,850,968$ 1,804,515$ 18,906,020$ 496,980$ Cash received from other funds - - 353,551 353,551 - Receipts from interfund charges - - - - 16,875,744 Cash payments to suppliers and service providers (3,447,296) (1,118,149) (1,045,350) (5,610,795) (11,644,470) Cash payments to employees for services (7,333,439) (549,773) (1,432,802) (9,316,014) (3,479,947)
Net cash provided (used) by operating activities 4,469,802 183,046 (320,086) 4,332,762 2,248,307
CASH FLOWS FROM NONCAPITAL FINANCING ACTIVITIES:
Property and other taxes received - 660,893 - 660,893 - Intergovernmental revenue received - - 258,586 258,586 - Interfund loan 519,957 (212,376) - 307,581 - Transfers in from other funds - - 132,782 132,782 222,027 Transfer out to other funds (244,719) - (244,719) -
Net cash provided (used) by noncapital financing activities 275,238 448,517 391,368 1,115,123 222,027
CASH FLOWS FROM CAPITAL AND RELATEDFINANCING ACTIVITIES:
Principal paid on capital debt (1,787,828) (258,944) - (2,046,772) - Acquisition of capital assets, net (2,707,660) (9,999) - (2,717,659) (1,667,539) Capital contributions 472,735 - - 472,735 - Interest payments on bonds and notes payable (978,036) (380,683) - (1,358,719) -
Net cash provided (used) by capital andrelated financing activities (5,000,789) (649,626) - (5,650,415) (1,667,539)
CASH FLOWS FROM INVESTING ACTIVITIES:Change in market values of investments 320,369 65,851 22,191 408,411 218,424Interest income (expense) 673,664 97,849 35,804 807,317 356,418
Net cash provided (used) by investing activities 994,033 163,700 57,995 1,215,728 574,842
Net increase (decrease) in cash and cash equivalents 738,284 145,637 129,277 1,013,198 1,377,637
CASH AND CASH EQUIVALENTS:
Cash and investments at beginning of year 29,052,600 4,270,448 1,609,789 34,932,837 17,559,899
Cash and investments at end of year 29,790,884$ 4,416,085$ 1,739,066$ 35,946,035$ 18,937,536$
RECONCILIATION OF OPERATING INCOME/ (LOSS) TONET CASH PROVIDED BY OPERATING ACTIVITIES:
Operating income (loss) (556,237)$ (12,596)$ (746,309)$ (1,315,142)$ 1,088,479$ Adjustments to reconcile operating income to
net cash provided by operating activities:Depreciation 1,648,108 113,889 19,247 1,781,244 1,060,851 Change in assets and liabilities:
(Increase) decrease in accounts receivable 1,551,073 142,887 51,734 1,745,694 - (Increase) decrease in inventories 19,022 - - 19,022 (31,411) (Decrease) increase in accounts payable (373,840) (15,895) (1,102) (390,837) (712,506) (Decrease) increase in other liabilities - - - - 9,806 (Decrease) increase due to other funds - - 353,551 353,551 - (Decrease) increase in deposits payable - (2,659) - (2,659) - (Decrease) increase claims and judgments payable 1,059 - - 1,059 837,551 (Decrease) increase in compensated absences 41,554 (42,580) 2,793 1,767 (4,463) (Decrease) increase in deferred outflow (427,793) - - (427,793) - (Decrease) increase in deferred inflow 54,302 - - 54,302 - (Decrease) increase in net pension liability 2,512,554 - - 2,512,554 -
Total adjustments 5,026,039 195,642 426,223 5,647,904 1,159,828
Net cash provided (used) by operating activities 4,469,802$ 183,046$ (320,086)$ 4,332,762$ 2,248,307$
See Accompanying Notes to Basic Financial Statements
36

FIDUCIARY FUND FINANCIAL STATEMENTS
Agency Funds are custodial in nature (assets equal liabilities) and do not involve measurement of results of operations. They are used to account for assets held in an agency capacity for others and therefore cannot be used to support the City's programs.
Private Purpose Trust Funds are fiduciary fund types used to report all trust arrangements, other than those properly reported in pension trust funds or investment trust funds, under which principal and income benefit individuals, private organizations, or other governments.
OPEB Trust Fund is used to account for assets held in an irrevocable trust and related activities. This trust is administered by Public Agency Retirement Services (PARS) for the purpose of funding postemployment health care benefits provided by the City.
37
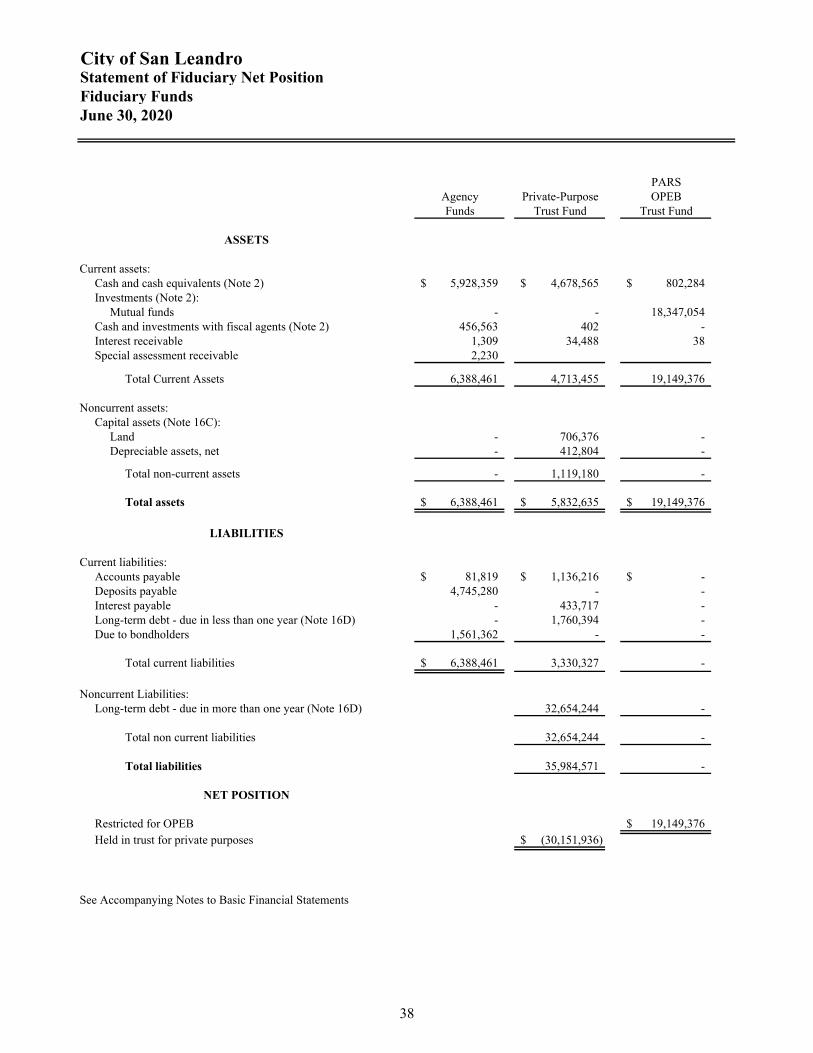
City of San LeandroStatement of Fiduciary Net PositionFiduciary FundsJune 30, 2020
PARSAgency Private-Purpose OPEBFunds Trust Fund Trust Fund
Current assets:Cash and cash equivalents (Note 2) 5,928,359$ 4,678,565$ 802,284$ Investments (Note 2):
Mutual funds - - 18,347,054 Cash and investments with fiscal agents (Note 2) 456,563 402 - Interest receivable 1,309 34,488 38 Special assessment receivable 2,230
Total Current Assets 6,388,461 4,713,455 19,149,376
Noncurrent assets:Capital assets (Note 16C):
Land - 706,376 - Depreciable assets, net - 412,804 -
Total non-current assets - 1,119,180 -
Total assets 6,388,461$ 5,832,635$ 19,149,376$
Current liabilities:Accounts payable 81,819$ 1,136,216$ -$ Deposits payable 4,745,280 - - Interest payable - 433,717 - Long-term debt - due in less than one year (Note 16D) - 1,760,394 - Due to bondholders 1,561,362 - -
Total current liabilities 6,388,461$ 3,330,327 -
Noncurrent Liabilities:Long-term debt - due in more than one year (Note 16D) 32,654,244 -
Total non current liabilities 32,654,244 -
Total liabilities 35,984,571 -
Restricted for OPEB 19,149,376$ Held in trust for private purposes (30,151,936)$
See Accompanying Notes to Basic Financial Statements
LIABILITIES
NET POSITION
ASSETS
38

City of San Leandro
For the year ended June 30, 2020
Successor Agency to the Redevelopment
AgencyPrivate-Purpose OPEB
Trust Fund Trust FundAdditions:
Property taxes 3,238,290$ -$Use of money and property 334,280 -Investment earnings:
Investment earnings - 845,750 Contributions to OPEB Trust-Employer - 1,500,000
Total additions 3,572,570 2,345,750
Deductions:
Community development 367,518 -Depreciation 12,957 -Debt service interest and fiscal agent fees 2,173,877 83,882
Total deductions 2,554,352 83,882
Change in net position 1,018,218 2,261,868
NET POSITION HELD IN TRUST
Net position - beginning (31,170,154) 16,887,508
Net position - end (30,151,936)$ 19,149,376$
See Accompanying Notes to Basic Financial Statements
Statement of Changes in Fiduciary Net Position
39

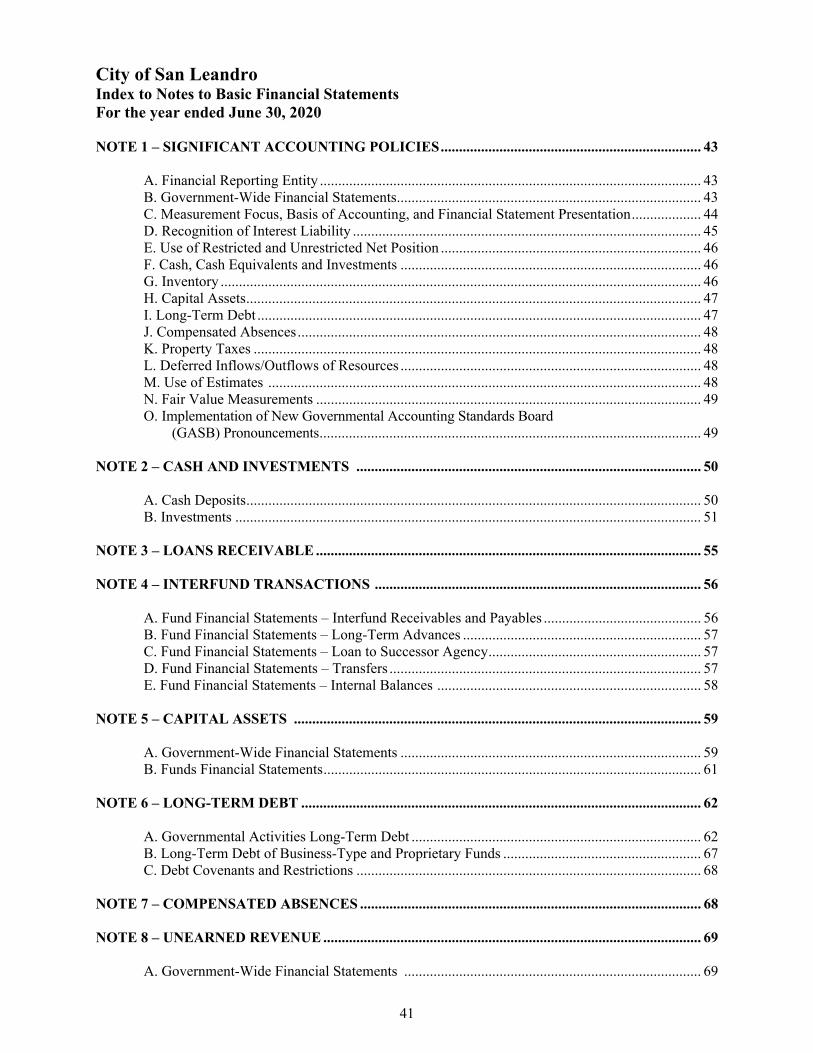
City of San Leandro Index to Notes to Basic Financial Statements For the year ended June 30, 2020
NOTE 1 – SIGNIFICANT ACCOUNTING POLICIES ....................................................................... 43
A. Financial Reporting Entity ........................................................................................................ 43 B. Government-Wide Financial Statements ................................................................................... 43 C. Measurement Focus, Basis of Accounting, and Financial Statement Presentation ................... 44 D. Recognition of Interest Liability ............................................................................................... 45 E. Use of Restricted and Unrestricted Net Position ....................................................................... 46 F. Cash, Cash Equivalents and Investments .................................................................................. 46 G. Inventory ................................................................................................................................... 46 H. Capital Assets ............................................................................................................................ 47 I. Long-Term Debt ......................................................................................................................... 47 J. Compensated Absences .............................................................................................................. 48 K. Property Taxes .......................................................................................................................... 48 L. Deferred Inflows/Outflows of Resources .................................................................................. 48 M. Use of Estimates ...................................................................................................................... 48 N. Fair Value Measurements ......................................................................................................... 49 O. Implementation of New Governmental Accounting Standards Board (GASB) Pronouncements ........................................................................................................ 49
NOTE 2 – CASH AND INVESTMENTS .............................................................................................. 50
A. Cash Deposits ............................................................................................................................ 50 B. Investments ............................................................................................................................... 51
NOTE 3 – LOANS RECEIVABLE ......................................................................................................... 55
NOTE 4 – INTERFUND TRANSACTIONS ......................................................................................... 56
A. Fund Financial Statements – Interfund Receivables and Payables ........................................... 56 B. Fund Financial Statements – Long-Term Advances ................................................................. 57 C. Fund Financial Statements – Loan to Successor Agency .......................................................... 57 D. Fund Financial Statements – Transfers ..................................................................................... 57 E. Fund Financial Statements – Internal Balances ........................................................................ 58
NOTE 5 – CAPITAL ASSETS ............................................................................................................... 59
A. Government-Wide Financial Statements .................................................................................. 59 B. Funds Financial Statements ....................................................................................................... 61
NOTE 6 – LONG-TERM DEBT ............................................................................................................. 62
A. Governmental Activities Long-Term Debt ............................................................................... 62 B. Long-Term Debt of Business-Type and Proprietary Funds ...................................................... 67 C. Debt Covenants and Restrictions .............................................................................................. 68
NOTE 7 – COMPENSATED ABSENCES ............................................................................................. 68
NOTE 8 – UNEARNED REVENUE ....................................................................................................... 69
A. Government-Wide Financial Statements ................................................................................. 69
41
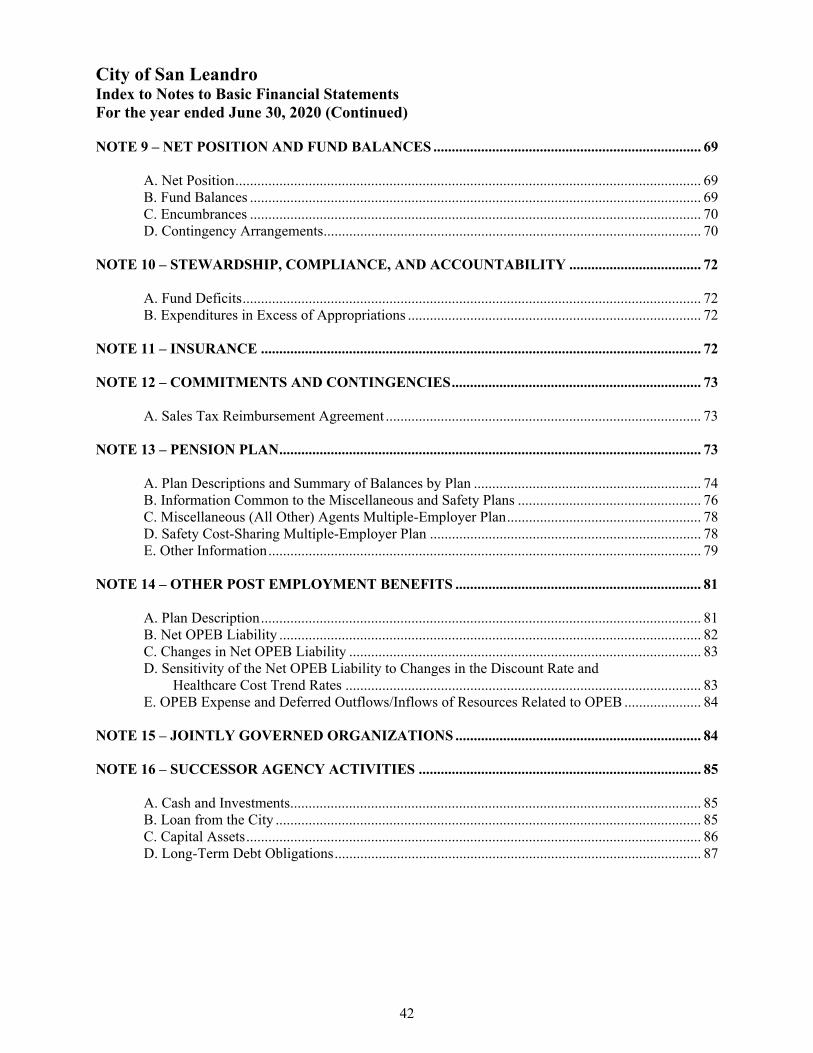
City of San Leandro Index to Notes to Basic Financial Statements For the year ended June 30, 2020 (Continued) NOTE 9 – NET POSITION AND FUND BALANCES ......................................................................... 69
A. Net Position ............................................................................................................................... 69 B. Fund Balances ........................................................................................................................... 69 C. Encumbrances ........................................................................................................................... 70 D. Contingency Arrangements ....................................................................................................... 70
NOTE 10 – STEWARDSHIP, COMPLIANCE, AND ACCOUNTABILITY .................................... 72
A. Fund Deficits ............................................................................................................................. 72 B. Expenditures in Excess of Appropriations ................................................................................ 72
NOTE 11 – INSURANCE ........................................................................................................................ 72 NOTE 12 – COMMITMENTS AND CONTINGENCIES .................................................................... 73
A. Sales Tax Reimbursement Agreement ...................................................................................... 73 NOTE 13 – PENSION PLAN ................................................................................................................... 73
A. Plan Descriptions and Summary of Balances by Plan .............................................................. 74 B. Information Common to the Miscellaneous and Safety Plans .................................................. 76 C. Miscellaneous (All Other) Agents Multiple-Employer Plan ..................................................... 78 D. Safety Cost-Sharing Multiple-Employer Plan .......................................................................... 78 E. Other Information ...................................................................................................................... 79
NOTE 14 – OTHER POST EMPLOYMENT BENEFITS ................................................................... 81
A. Plan Description ........................................................................................................................ 81 B. Net OPEB Liability ................................................................................................................... 82 C. Changes in Net OPEB Liability ................................................................................................ 83 D. Sensitivity of the Net OPEB Liability to Changes in the Discount Rate and Healthcare Cost Trend Rates ................................................................................................. 83 E. OPEB Expense and Deferred Outflows/Inflows of Resources Related to OPEB ..................... 84
NOTE 15 – JOINTLY GOVERNED ORGANIZATIONS ................................................................... 84 NOTE 16 – SUCCESSOR AGENCY ACTIVITIES ............................................................................. 85
A. Cash and Investments ................................................................................................................ 85 B. Loan from the City .................................................................................................................... 85 C. Capital Assets ............................................................................................................................ 86 D. Long-Term Debt Obligations .................................................................................................... 87
42
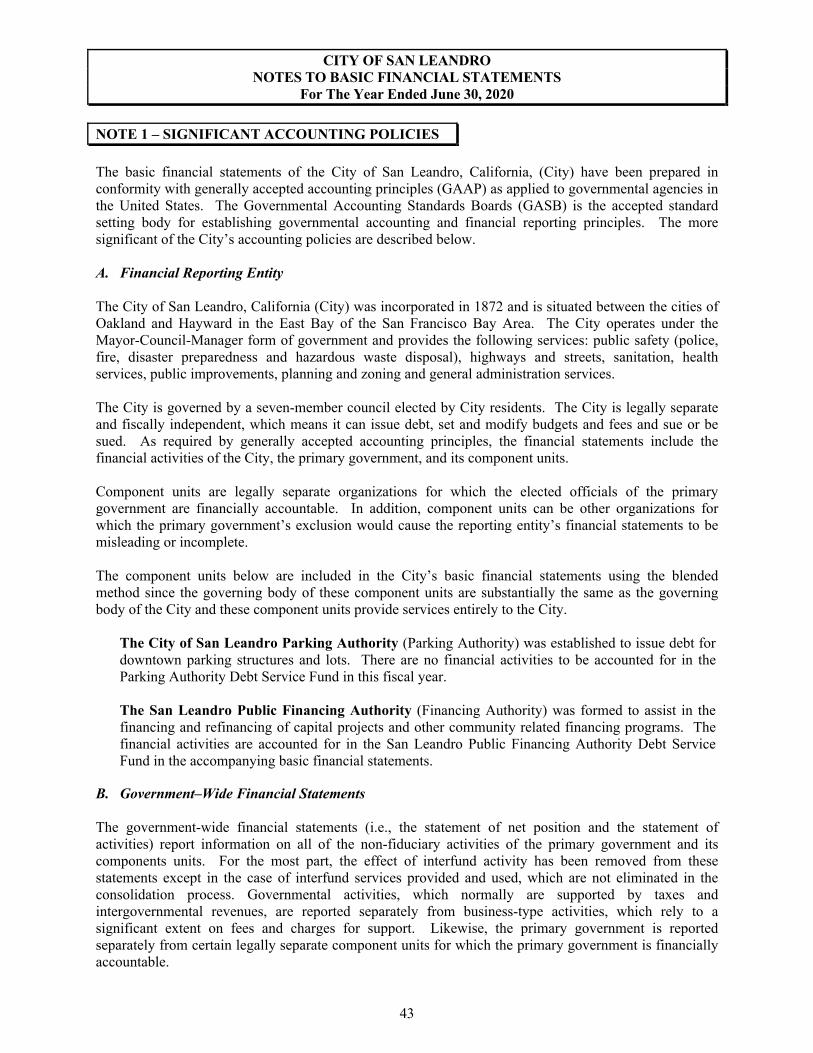
CITY OF SAN LEANDRO NOTES TO BASIC FINANCIAL STATEMENTS
For The Year Ended June 30, 2020
NOTE 1 – SIGNIFICANT ACCOUNTING POLICIES
The basic financial statements of the City of San Leandro, California, (City) have been prepared in conformity with generally accepted accounting principles (GAAP) as applied to governmental agencies in the United States. The Governmental Accounting Standards Boards (GASB) is the accepted standard setting body for establishing governmental accounting and financial reporting principles. The more significant of the City’s accounting policies are described below.
A. Financial Reporting Entity
The City of San Leandro, California (City) was incorporated in 1872 and is situated between the cities of Oakland and Hayward in the East Bay of the San Francisco Bay Area. The City operates under the Mayor-Council-Manager form of government and provides the following services: public safety (police, fire, disaster preparedness and hazardous waste disposal), highways and streets, sanitation, health services, public improvements, planning and zoning and general administration services.
The City is governed by a seven-member council elected by City residents. The City is legally separate and fiscally independent, which means it can issue debt, set and modify budgets and fees and sue or be sued. As required by generally accepted accounting principles, the financial statements include the financial activities of the City, the primary government, and its component units.
Component units are legally separate organizations for which the elected officials of the primary government are financially accountable. In addition, component units can be other organizations for which the primary government’s exclusion would cause the reporting entity’s financial statements to be misleading or incomplete.
The component units below are included in the City’s basic financial statements using the blended method since the governing body of these component units are substantially the same as the governing body of the City and these component units provide services entirely to the City.
The City of San Leandro Parking Authority (Parking Authority) was established to issue debt for downtown parking structures and lots. There are no financial activities to be accounted for in the Parking Authority Debt Service Fund in this fiscal year.
The San Leandro Public Financing Authority (Financing Authority) was formed to assist in the financing and refinancing of capital projects and other community related financing programs. The financial activities are accounted for in the San Leandro Public Financing Authority Debt Service Fund in the accompanying basic financial statements.
B. Government–Wide Financial Statements
The government-wide financial statements (i.e., the statement of net position and the statement of activities) report information on all of the non-fiduciary activities of the primary government and its components units. For the most part, the effect of interfund activity has been removed from these statements except in the case of interfund services provided and used, which are not eliminated in the consolidation process. Governmental activities, which normally are supported by taxes and intergovernmental revenues, are reported separately from business-type activities, which rely to a significant extent on fees and charges for support. Likewise, the primary government is reported separately from certain legally separate component units for which the primary government is financially accountable.
43

CITY OF SAN LEANDRO NOTES TO BASIC FINANCIAL STATEMENTS
For The Year Ended June 30, 2020
NOTE 1 – SIGNIFICANT ACCOUNTING POLICIES (Continued)
The statement of activities demonstrates the degree to which the direct expenses of a given function or segments are offset by program revenues. Direct expenses are those that are clearly identifiable with a specific function or segment. Our policy is to allocate indirect costs to a specific function or segment. Program revenues include 1) charges to customers or applicants who purchase, use, or directly benefit from goods, services, or privileges provided by a given function or segment and 2) grants and contributions that are restricted to meeting the operational or capital requirements or a particular function or segment. Taxes and other items not properly included among program revenues are reported instead as general revenues.
Separate fund financial statements are provided for governmental funds, proprietary funds, and fiduciary funds, even though the latter are excluded from the government-wide financial statements. Major individual governmental funds and major individual enterprise funds are reported as separate columns in the fund financial statements.
C. Measurement Focus, Basis of Accounting, and Financial Statement Presentation
The government–wide financial statements are reported using the economic resources measurement focus and the accrual basis of accounting, as are the proprietary fund and fiduciary fund financial statements. Revenues are recorded when earned and expenses are recorded when a liability is incurred, regardless of the timing of related cash flows. Property taxes are recognized as revenues in the year for which they are levied. Grants and similar items are recognized as revenue as soon as all eligibility requirements imposed by the provider have been met.
Governmental fund financial statements are reported using the current financial resources measurement focus and the modified accrual basis of accounting. Revenues are recognized as soon as they are both measurable and available. Revenues are considered to be available when they are collectible within the current period or soon enough thereafter to pay liabilities of the current period. For this purpose, the City considers revenues to be available if they are collected within 30 days of the end of the current fiscal period. The City considers sales taxes and property taxes as available if they are collected within 60 days after year end. Expenditures generally are recorded when a liability is incurred, as under accrual accounting. However, debt service expenditures, as well as expenditures related to compensated absences and claims and judgments, are recorded only when payment is due.
Sales taxes, property taxes, licenses, and interest associated within the current period are all considered to be susceptible to accrual and so have been recognized as revenues of the current fiscal period. Only the portion of special assessment receivable due within the current fiscal period is considered to be susceptible to accrual as revenue of the current period. All other revenue items are considered to be measurable and available only when cash is received by the City.
The City reports the following major governmental funds:
The General Fund is the government’s primary operating fund. It accounts for all financial resources of the general government, except those required to be accounted for in another fund.
Capital Improvement Projects Capital Projects Fund accounts monies for major capital improvements projects not provided for in the other capital projects fund.
44

CITY OF SAN LEANDRO NOTES TO BASIC FINANCIAL STATEMENTS
For The Year Ended June 30, 2020
NOTE 1 – SIGNIFICANT ACCOUNTING POLICIES (Continued)
The Reconciliation of the Fund Financial Statements to the Government-Wide Financial Statements is provided to explain the differences created by the integrated approach of GASB Statement No. 34. The City also reports the following major proprietary funds:
Water Pollution Control Plant Fund accounts for the City’s sewers which protect public health and preserve water quality. Shoreline Fund accounts for various recreational facilities which include golf and marina berthing as well as providing food service facilities for the general public in an area connected to the San Francisco Bay.
A separate column representing internal service funds is also presented in these statements. However, internal service balances and activities have been combined with the governmental activities in the government-wide financial statements. The City’s Internal Service Funds account for Building Maintenance, Information Management Systems, Self-Insurance, and Equipment Maintenance which provides service to other departments of the City on a cost reimbursement basis. Proprietary funds are accounted for using the “economic resources” measurement focus and the accrual basis of accounting. Accordingly, all assets and liabilities (whether current or noncurrent) are included on the Statement of Net Position. The Statement of Revenues, Expenses and Changes in Net Position presents increases (revenues) and decreases (expenses) in total Net Position. Under the accrual basis of accounting, revenues are recognized in the period in which they are earned while expenses are recognized in the period in which the liability is incurred. Operating revenues in the proprietary funds are those revenues that are generated from the primary operations of the fund. All other revenues are reported as non-operating revenues. Operating expenses are those expenses that are essential to the primary operations of the fund. All other expenses are reported as non-operating expenses.
The Fiduciary fund financial statements normally include a Statement of Net Position and a Statement of Changes in Fiduciary Net Position. The City's fiduciary funds represent a private purpose trust fund, an OPEB Trust Fund, and agency funds. Agency funds are custodial in nature (assets equal liabilities) and do not involve measurement of results of operations. The City’s Fiduciary Funds includes the Deposits Fund which accounts for all deposits held on behalf of other persons and businesses and the Cherrywood Fund accounts for monies accumulated for payments of special assessment bonds.
D. Recognition of Interest Liability In the government-wide financial statements, interest payable of long-term debt is recognized as the liability is incurred for governmental fund types as wells as proprietary fund types. In the fund financial statements, the Governmental fund types do not recognize the interest payable when the liability is incurred. Interest on long-term debt is recorded in the fund statement when payment is made. Proprietary fund types recognize the interest payable when the liability is incurred.
45

CITY OF SAN LEANDRO NOTES TO BASIC FINANCIAL STATEMENTS
For The Year Ended June 30, 2020
NOTE 1 – SIGNIFICANT ACCOUNTING POLICIES (Continued)
E. Use of Restricted and Unrestricted Net Position
When an expense is incurred for purposes for which both restricted and unrestricted net positions are available, the City’s policy is to apply restricted net position first.
F. Cash, Cash Equivalents and Investments
The City pools cash and investments from all sources, except the fiscal agent cash and investments, for the purpose of increasing income through investment activities. Interest income on investments is allocated on the basis of average month-end cash and investment balances in each fund. Cash and cash equivalents represent cash and investments and restricted cash and investments with an original maturity term of three months or less. Pooled cash and investments allocated to proprietary fund types are considered cash and cash equivalents since specific investments held in the City’s pooled cash and investments are not allocated to each fund.
The City invests in the California Local Agency Investment Fund (LAIF), which is part of the Pooled Money Investment Account operated by the California State Treasurer. LAIF funds are invested in high quality money market securities and are managed to insure the safety of the portfolio. A portion of LAIF’s investments are in structured notes and asset-backed securities. The remainder of the City’s investment portfolio is managed by Chandler Asset Management.
In accordance with GASB Statement No. 31, highly liquid money market investments with maturities of one year or less at time of purchase are stated at amortized cost.
G. Inventory
Inventory is held for consumption and is valued at average cost. Internal service fund supplies consist of materials and supplies for the various City vehicles (tires, batteries, etc.) and building maintenance, which are used for replacement parts for vehicle service and to maintain City buildings. Information management service inventory consists of postage for department use and a monthly count is performed to adjust this account to actual at the appropriate month-end.
46
CITY OF SAN LEANDRO NOTES TO BASIC FINANCIAL STATEMENTS
For The Year Ended June 30, 2020
NOTE 1 – SIGNIFICANT ACCOUNTING POLICIES (Continued)
H. Capital Assets Contributed capital assets are valued at their estimated fair market value on the date contributed. Donated capital assets, donated works of art and similar items, and capital assets received in a service concession arrangement are recorded at acquisition value. All other capital assets are valued at historical cost or estimated historical cost if actual historical cost is not available. City policy has set the capitalization threshold for reporting capital assets at $7,500. Depreciation is recorded on a straight-line basis over estimated useful lives of the assets as follows:
Buildings 50 years Improvements other than buildings 20 years Machinery and equipment 5-15 years Licensed Vehicles 3-15 years Infrastructure 20-50 years
The City defines infrastructure as the basic physical assets that allow the City to function. The assets include streets, sewer, and park lands. Each major infrastructure system can be divided into subsystems. For example the street system can be subdivided into pavement, curb and gutters, sidewalks, medians, streetlights, landscaping and land. These subsystems were not delineated in the basic financial statements. The appropriate operating department maintains information regarding the subsystems. Interest accrued during capital assets construction, if any, is capitalized for the business-type and proprietary funds as part of the asset cost. For all infrastructure systems, the City elected to use the Basic Approach as defined by GASB Statement No. 34 for infrastructure reporting. Original costs were developed in one of three ways: (1) historical records; (2) standard unit costs appropriate for the construction/acquisition date; or (3) present cost indexed by a reciprocal factor of the price increase from the construction/acquisition date to the current date. The accumulated depreciation, defined as the total depreciation from the date of construction/acquisition to the current date on a straight line, un-recovered cost method was computed using industry accepted life expectancies for each infrastructure subsystem. The book value was then computed by deducting the accumulated depreciation from the original cost. I. Long-Term Debt In Government-Wide Financial Statements, long-term debt and other financed obligations are reported as liabilities in the appropriate activities. Bond premiums and discounts are deferred and amortized over the life of the bonds using the effective interest method. Bonds Payable are reported net of the applicable premium or discount. In Fund Financial Statements long-term debt is not presented but is instead shown in the Reconciliation of the Governmental Funds Balance Sheet to the Government-Wide Statement of Net Position.
47

CITY OF SAN LEANDRO NOTES TO BASIC FINANCIAL STATEMENTS
For The Year Ended June 30, 2020
NOTE 1 – SIGNIFICANT ACCOUNTING POLICIES (Continued)
J. Compensated Absences Vested vacation, sick leave, compensatory time, and related benefits are accrued as appropriate. For governmental funds, compensated absence obligations are recorded in the appropriate governmental funds when due. The portion not currently due is recorded in the government-wide financial statements. For enterprise funds, compensated absences are expensed when earned by employees. At year-end, the accrued but unpaid compensated absence obligations are recorded as current and non-current liabilities in the appropriate enterprise funds. K. Property Taxes Property taxes are placed on lien January 1 for the following fiscal year. Taxes are payable in two installments, due on November 1 and February 1, becoming delinquent on December 10 (for November) and April 10 (for February), respectively. The Alameda County Tax Collector bills and collects property taxes and allocates a portion to the City. Property tax revenues are recognized in the fiscal year, for which the taxes have been levied, provided they become available. In January 1994, the City elected to continue collection of interest and penalties on delinquent taxes and recognizes these revenues when available. Available means when due or past due and collected within the current period, or expected to be collected soon thereafter, and to be used to pay liabilities of the current period. L. Deferred Inflows/Outflows of Resources In addition to assets, the statement of financial position or balance sheets reports a separate section for deferred outflows of resources. This separate financial statement element, deferred outflows of resources, represents a consumption of net position or fund balance that applies to a future period(s) and so will not be recognized as an outflow of resources (expense/expenditure) until then. In addition to liabilities, the statement of financial position or balance sheet reports a separate section for deferred inflows of resources. This separate financial statement element, deferred inflows of resources, represents an acquisition of net position or fund balance that applies to a future period(s) and so will not be recognized as an inflow of resources (revenue) until that time. M. Use of Estimates The preparation of financial statements in conformity with generally accepted accounting principles requires City management to make estimates and assumptions that affect certain amounts and disclosures. Accordingly, actual results could differ from those estimates.
48
CITY OF SAN LEANDRO NOTES TO BASIC FINANCIAL STATEMENTS
For The Year Ended June 30, 2020
NOTE 1 – SIGNIFICANT ACCOUNTING POLICIES (Continued)
N. Fair Value Measurements
Fair value is defined as the price that would be received to sell an asset or paid to transfer a liability in an orderly transaction between market participants at the measurement date. The City categorizes its fair value measurements within the fair value hierarchy established by generally accepted accounting principles. The fair value hierarchy categorizes the inputs to valuation techniques used to measure fair value into three levels based on the extent to which inputs used in measuring fair value are observable in the market.
Level 1 inputs are quoted prices (unadjusted) in active markets for identical assets or liabilities.
Level 2 inputs are inputs – other than quoted prices included within level 1 that are observable for an asset or liability, either directly or indirectly.
Level 3 inputs are unobservable inputs for an asset or liability.
If the fair value of an asset or liability is measured using inputs from more than one level of the fair value hierarchy, the measurement is considered to be based on the lowest priority level input that is significant to the entire measurement.
O. Implementation of New Governmental Accounting Standards Board (GASB) Pronouncements
Management adopted the provisions of the following Governmental Accounting Standards Board (GASB) Statements which became effective during the year ended June 30, 2020.
In May 2020, GASB issued GASB statement No. 95, Postponement of the Effective Dates of Certain Authoritative Guidance. The primary objective of this statement is to provide temporary relief to governments and other stakeholders in light of the COVID-19 pandemic. That objective is accomplished by postponing the effective or are scheduled to become effective for periods beginning after June 15, 2018, and later. The requirements of the statement are effective immediately. The City implemented GASB Statement No. 95 for the presentation of the fiscal year 2019-20 financial statements.
49

CITY OF SAN LEANDRO NOTES TO BASIC FINANCIAL STATEMENTS
For The Year Ended June 30, 2020
NOTE 2 – CASH AND INVESTMENTS
The City maintains a cash and investment pool, which includes cash balances and authorized investments of all funds, which the Finance Director invests to enhance interest earnings. The pooled interest earned is allocated to the funds based on average daily cash and investment balance in these funds. A. Cash Deposits The carrying amount of the City’s cash deposits is $9,851,517 at June 30, 2020. Bank balances before reconciling items were $ 9,715,637, at that date, the total amount of which was insured or collateralized with securities held by the pledging financial institutions in the City’s name as discussed below. The California Government Code requires California banks and savings and loan associations to secure the City’s cash deposits by pledging securities as collateral. This Code states that collateral pledged in this manner shall have the effect of perfecting a security interest in such collateral superior to those of a general creditor. Thus, collateral for cash deposits is considered to be held in the City's name. The fair value of pledged securities must equal at least 110% of the City's cash deposits. California law also allows institutions to secure City deposits by pledging first trust deed mortgage notes having a value of 150% of the City’s total cash deposits. The City may waive collateral requirements for cash deposits, which are fully insured up to $250,000 by the Federal Deposit Insurance Corporation. The City, however, has not waived the collateralization requirements. The City follows the practice of pooling cash and investments of all funds, except for funds required to be held by fiscal agents under the provisions of bond indentures. Interest income earned on pooled cash and investments is allocated on an accounting period basis to the various funds based on the period-end cash and investment balances. Interest income from cash and investments with fiscal agents is credited directly to the related fund.
50

CITY OF SAN LEANDRO NOTES TO BASIC FINANCIAL STATEMENTS
For The Year Ended June 30, 2020
NOTE 2 – CASH AND INVESTMENTS (Continued)
B. Investments
Under the provisions of the City’s investment policy, and in accordance with California Government Code, the City’s Cash and investments as of June 30, 2020, are classified as follows:
Statement of net position:Cash and investments 172,590,775$ Cash and investments held by fiscal agents 96,797Fiduciary Funds:
Cash and investments 29,756,262Cash and investments with fiscal agents 456,965
Total cash and investments 202,900,799$
Cash and investments as of June 30, 2020, are classified as follows:Deposits with financial institutions 9,851,517$ Investments 193,049,282
Total cash and investments 202,900,799$
Interest Rate Risk
Interest rate risk is the risk that changes in market interest rates will adversely affect the fair value of an investment. Generally, the longer the maturity of an investment, there is a greater sensitivity of its fair value to changes in market interest rates. One of the ways that the City manages its exposure to interest rate risk is by purchasing a combination of shorter term and longer-term investments and by timing cash flow from maturities so that a portion of the portfolio is maturing or coming close to maturity evenly over time as necessary to provide cash flow and liquidity needed for operations.
In accordance with the Policy, the City manages its exposure to declines in fair values by limiting the weighted average maturity of its investment portfolio to 5 years or less. The City is in compliance with this provision of the Policy.
Information about the sensitivity of the fair values of the City’s Investments to market interest rate fluctuations is provided by the following table that shows the distribution of the City’s investment by maturity:
Investment Type Fair Value 12 Months or
Less 13 to 24 Months 25 to 60 Months
41,866,332$ 7,828,256$ 9,335,396$ 24,702,680$ Mutual Funds 18,347,054 18,347,054 Money Market Fund 498,476 498,476 - - U.S. Treasury Notes 33,049,189 13,118,828 11,504,087 8,426,274 Local Agency Investment Fund (LAIF) 62,464,643 62,464,643 - - Medium-Term Notes 25,604,104 9,071,815 6,567,996 9,964,293 Asset Backed Securities 3,196,614 - 1,025,079 2,171,535 Supranationals 5,469,422 2,635,318 822,264 2,011,840 Commercial Paper 1,999,260 1,999,260 - - Held by fiscal agent: U.S. Treasury Money Market Funds 554,188 554,188 - -
Total 193,049,282$ 116,517,838$ 29,254,822$ 47,276,622$
Federal Agency Securities
51
CITY OF SAN LEANDRO NOTES TO BASIC FINANCIAL STATEMENTS
For The Year Ended June 30, 2020
NOTE 2 – CASH AND INVESTMENTS (Continued)
Investments Authorized by the City’s Investment Policy and California Government Code
The table below identifies the investment types that are authorized for the City by the City’s Investment Policy. The table also identifies certain provisions of the California Government Code that address interest rate risk, credit risk, and concentration of credit risk. This table does not address investments of debt proceeds held by bond trustee that are governed by the provisions of the related bond documents.
Investment Type Maximum Maturity Maximum Percentage of *PortfolioU.S. Treasury Obligations 5 years NoneU.S. Agency Securities 5 years NoneBankers Acceptances 180 days 40%Commercial Paper 270 days 25%Negotiable Certificate of Deposit 5 years 30%Repurchase Agreements 1 year 20%Reverse Repurchase Agreements 92 days 20%Medium -Term Notes 5 years 30%Mutual Funds N/A 20%Money Market Mutual Funds N/A 20%Local Agency Investment Fund (LAIF) N/A $65 million per accountPassbook Accounts 5 years NoneCity Issued Securities N/A NoneSupranational Securities 5 years 30%Asset Backed Securities 5 years 20%Mortgage Backed/Pass-Through Securities 5 years 20%Collateralized Mortgage Obligations 5 years 20%Other investment pools N/A None
*excluding amounts held by bond trustee that are not subject to California Government Code restrictions.
Investments in Local Agency Investment Fund
The City invests in the Local Agency Investment Fund (LAIF), a State of California external investment pool.
The fair value is calculated by multiplying the account balance with LAIF times a fair value factor of 1.004912795 which is determined by LAIF. This fair value factor was determined by dividing all LAIF participants’ total aggregate amortized cost by total aggregate fair value.
The City’s investments with Local Agency Investment Funds (LAIF) at June 30, 2020, included a portion of the pool funds invested in Structured Notes and Asset-Backed Securities. These investments included the following:
Structured Notes are debt securities (other than asset-backed securities) whose cash-flowcharacteristics (coupon rate, redemption amount, or stated maturity) depend on one or moreindices and/or that have embedded forwards or options.
52

CITY OF SAN LEANDRO NOTES TO BASIC FINANCIAL STATEMENTS
For The Year Ended June 30, 2020
NOTE 2 – CASH AND INVESTMENTS (Continued)
Asset-backed Securities, the bulk of which are mortgage-backed securities, entitle theirpurchasers to receive a share of the cash flows from a pool of assets such as principal and interestrepayments from a pool of mortgages (such as CMOs) or credit card receivables.
Concentration of Credit Risk
The City’s Policy states that the investment portfolio shall be designed with the objective of attaining a rate of return throughout budgetary and economic cycles, commensurate with the City’s investment risk constraints and the cash flow characteristic of the portfolio. Purchases of mutual funds must not exceed 20% of the value of the portfolio. Investments in U.S. agencies exceed 5% of total portfolio, and Federal agency investments exhibited below exceeded 5% percent or more of the total investments in any one issuer:
US Government Agency Securities Amount InvestedPercentage of Investments
Federal agency securities:Federal Home Loan Bank (FHLB) 16,512,256$ 21.13%Federal Home Loan Mortgage Corporation (FHLMC) 9,964,759 12.75%Federal National Mortgage Association (FNMA) 15,389,295 19.70%
Total 41,866,310$ 53.58%
Disclosures Relating to Credit Risk
Generally, credit risk is the risk that an issuer of an investment will not fulfill its obligation to the holder of the investment. This is measured by the assignment of a rating by a nationally recognized statistical rating organization. Presented below is the minimum rating required by (where applicable) the California Government Code, the Entity’s investment policy, or debt agreements, and the actual rating as of year-end for each investment type.
The City’s policy requires that mutual funds must have the highest rating provided by not less than two of the three largest nationally recognized rating organizations.
Fair Minimum
Legal Exempt From Investment Type Value Rating Disclosure Not Rated A-1 A-1+ AAA AA+
Federal Agency Securities 41,866,332$ N/A -$ 1,324,992$ -$ -$ -$ 40,541,340$ Mutual Funds 18,347,054 A - - - - 18,347,054 - Money Market Fund 498,476 N/A - - - - 498,476 - U.S. Treasury Notes 33,049,189 N/A 33,049,189 - - - - - Local Agency Investment Fund 62,464,643 N/A - 62,464,643 - - - - Medium-Term Notes 25,604,104 A - - - - 1,168,601 1,461,908Asset Backed Securities 3,196,614 AAA - 1,094,625 - - 2,101,989 - Supranationals 5,469,422 AA - 822,264 - - 4,647,158 - Commercial Paper 1,999,260 A-1+ - - 1,999,260 - - - Held by fiscal agent: U.S. Treasury Money Market 554,188 A - - - - 554,188 - Total 193,049,282$ 33,049,189$ 65,706,524$ 1,999,260$ -$ 27,317,466$ 42,003,248$
AA AA- A+ A A-
Medium-Term Notes 3,067,081$ 2,156,294$ 2,722,643$ 8,846,422$ 6,181,155$
53

CITY OF SAN LEANDRO NOTES TO BASIC FINANCIAL STATEMENTS
For The Year Ended June 30, 2020
NOTE 2 – CASH AND INVESTMENTS (Continued)
Fair Value Hierarchy The City categorizes its fair value measurements within the fair value hierarchy established by generally accepted accounting principles. The hierarchy is based on the valuation inputs used to measure fair value of the assets. Level 1 inputs are quoted prices in an active market for identical assets; Level 2 inputs are significant other observable inputs; and Level 3 inputs are significant unobservable inputs. The following is a summary of the fair value hierarchy of the fair value of investments of the City as of June 30, 2020:
Level 1 Level 2 Total Investments By Fair Value Level:
-$ 41,866,332$ 41,866,332$ U.S. Treasury Notes - 33,049,189 33,049,189 Medium-Term Notes - 25,604,104 25,604,104 Asset Backed Securities - 3,196,614 3,196,614 Supranationals - 5,469,422 5,469,422 Commercial Paper - 1,999,260 1,999,260 Total Investments -$ 111,184,921$ 111,184,921
Investments Exempt from Fair Value Hierarchy:
Local Agency Investment Fund (LAIF) 62,464,643
Investments Measured at Amortized Cost:Held by fiscal agent:
U.S. Treasury Money Market Funds 554,188OPEB Trust - Mutual Funds 18,347,054Money Market Fund 498,476
Total 193,049,282$
Federal Agency Securities
U.S. Treasury Notes classified in Level 1 of the fair value hierarchy, are valued using quoted prices in active markets. Federal agency securities, medium term notes, and supranationals, classified in Level 2 of the fair value hierarchy, are valued using matrix pricing techniques maintained by various pricing vendors. Matrix pricing is used to value securities based on the securities’ relationship to benchmark quoted prices. The California Local Agency Investment Fund (LAIF) is valued based on the fair value factor provided by the Treasurer of the State of California, which is calculated as fair value divided by the amortization cost of the investment pool and is exempt from the Fair Value hierarchy. Fair value is defined as the quoted market value on the last trading day of the period. These prices are obtained from various pricing sources by the custodian bank.
54
CITY OF SAN LEANDRO NOTES TO BASIC FINANCIAL STATEMENTS
For The Year Ended June 30, 2020
NOTE 3 – LOANS RECEIVABLE
At June 30, 2020, the City had loans receivable in the following funds:
Governmental Funds:
General Fund 1,497,835$
Non Major Special Revenue Funds:
Affordable Housing Asset Fund 18,695,797
Community Development Block Grant (CDBG) 241,833
HOME Fund 4,444,109
Housing In-Lieu 737,000
Less allowance for uncollectible loans (22,948,167)
Total net loans receivable 2,668,407$
At June 30, 2020, the City was owed in the General Fund, $616,964 for a loan made by the City to Alameda County Industries Inc. (ACI). The loan is to refurbish ACI's Materials Recovery Facility in order to expand operations to take in more solid waste, recyclable, and green waste tonnage. The loan is evidenced by a promissory note with a term of 10 years and is to be repaid in full on July 1, 2025. The interest rate is 2.5% per annum. At June 30, 2020, the City was owed in the General Fund, $14,201 for loans made by the City to employees as part of the Employee Computer Purchase Loan Program. The loans are to assist regular full-time employees after completion of the one-year probationary period, “permanent” part-time employees as defined in the relevant MOU and City Council Members with the purchase of a home computer or laptop. The loans range from $500 to $3,000, are repaid over a 1 or 2 year period, and are interest free. Payments on the loans are handled as standard payroll deduction. At June 30, 2020, the City was owed in the General Fund, $70,139 for a loan made by the City to San Leandro Improvement Agency. The loan is to fund Downtown San Leandro capital improvements. The loan is evidenced by a promissory note with a term of 10 years. The interest rate is 3% per annum. At June 30, 2020, the City was owed in the General Fund, $382,987 for a loan made by the City to the Historic BAL Theatre. The loan is to promote the performing arts, music, and City's culture, which is vital to the public health and economic vitality of the City. The loan is evidenced by a promissory note with a term of 30 years. The interest rate is 3% per annum. At June 30, 2020, the City was owed in the General Fund, $413,544 for a loan made by the City to MTLG, LLC. The loan is for litigation costs between the City of San Leandro and MTLG, LLC for a proposed wind energy conversion project. The loan is evidenced by a promissory note in the amount of the loan and a deed of trust with a term of 10 years. The interest rate is 2% per annum.
55

CITY OF SAN LEANDRO NOTES TO BASIC FINANCIAL STATEMENTS
For The Year Ended June 30, 2020
NOTE 3 – LOANS RECEIVABLE (Continued)
During fiscal year 2020, the City was owed in its Low/Moderate Asset Housing Fund, $18,695,797 which includes (1) loans made to the City property owners who meet the HUD requirements for financial assistance for property improvements and first time home buyer loans; (2) a loan made to Ruth Rogers and Sara Bagwell; (3) a loan made to Eden Housing, Inc.; (4) a loan made to San Leandro Senior Housing; (5) a loan made to Citizens’ Housing Corporation for property improvements; and (6) a loan made to Mercy Housing for the construction of the Casa Verde. The total loan receivable amount was reduced by an allowance for uncollectible loans in the amount of $17,525,225 leaving a balance of $1,170,572 as of June 30, 2020.
At June 30, 2020, the City was owed in its Community Development Block Grant Special Revenue Fund, $241,833 for various housing assistance loans made by the City. The terms of repayment vary. All of the loans receivable was reduced by allowance for uncollectible loans.
At June 30, 2020, the City was owed in its HOME Special Revenue Fund, $4,444,109 which includes (1) two housing assistance loans made by the City to Citizens’ Housing Corporation; (2) a loan made to Estabrook Senior Housing for construction of senior housing facility; (3) a loan made to Hello Housing for the rehabilitation of a single family home; (4) a housing assistance loan made to Allied Housing. The terms of repayment vary. All of the loans receivable were reduced by allowance for uncollectible loans.
At June 30, 2020, the City was owed in its Housing In-Lieu Special Revenue Fund, $737,000 for a housing assistance loan made by the City to the Estabrook Senior Housing for low-moderate housing construction. The terms of repayment vary. The entire loan receivable was reduced by allowance for uncollectible loans.
NOTE 4 – INTERFUND TRANSACTIONS
A. Interfund Receivables and Payables
At June 30, 2020, the City had the following short-term receivables and payables:
Receivable Fund Payable Fund Amount
General Fund 265,000$
944,000
Total 1,209,000$
Non-Major Governmental Funds
Storm Water Utility Fund
The City has recorded due to/due from all funds requiring cash at the end of June 30, 2020. The funds that had deficit year-end balances will be repaid back to the General Fund during the 2020-21 fiscal year.
56

CITY OF SAN LEANDRO NOTES TO BASIC FINANCIAL STATEMENTS
For The Year Ended June 30, 2020
NOTE 4 – INTERFUND TRANSACTIONS (Continued)
B. Long-Term Advances
Long-term advances to be repaid out of future earnings or charges at June 30, 2020, consisted of:
Receivable Fund Payable Fund Amount
General Fund Shoreline Enterprise Fund 6,500,110$
Water Pollution Control Plant Enterprise Fund General Fund 2,240,565
Total 8,740,675$
The City Council authorized General Fund loans to the Shoreline Enterprise Fund for capital improvements at the Marina and Golf Course. The loans are to be paid over 30 years with an annual interest accrual rate of 5%. Principal payments are made annually provided the fund has sufficient resources. The balance as of June 30, 2020, was $2,902,156 and $3,597,954 for the Marina and the Golf Course, respectively, for a total of $6,500,110.
The City Council authorized a loan to the General Fund from the Water Pollution Control Plant Enterprise Fund in 2011 for the partial payment of the Public Safety Side Fund Obligation. The $6,000,000 loan was to pay-down the CalPERS Public Safety Side Fund with a long-term adjustable rate of 4% or less annually for 13 years. As of June 30, 2020, the outstanding amount was $2,240,565.
C. Loan to Successor Agency
The City Council authorized various loans to the Private Purpose Trust Fund from the General Fund for operating and capital improvement purposes. The balance as of June 30, 2020, was $0.
D. Transfers
Transfers during the fiscal year ended June 30, 2020, comprised the following:
Capital Improvements Water Pollution
General Capital Projects Non-Major Control Plan
Fund Fund Governmental Funds Enterprise Fund Total
General Fund -$ 100,000$ -$ -$ 100,000$
Capital Improvements Capital Projects Funds 6,275,000 - - - 6,275,000
Non-major Governmental Funds 50,000 - - - 50,000
Non-major Enterprise Funds - - - 132,782 132,782
Internal Service Funds - - 110,090 111,937 222,027
Total 6,325,000$ 100,000$ 110,090$ 244,719$ 6,779,809$
Transfers Out:
Transfers In
57
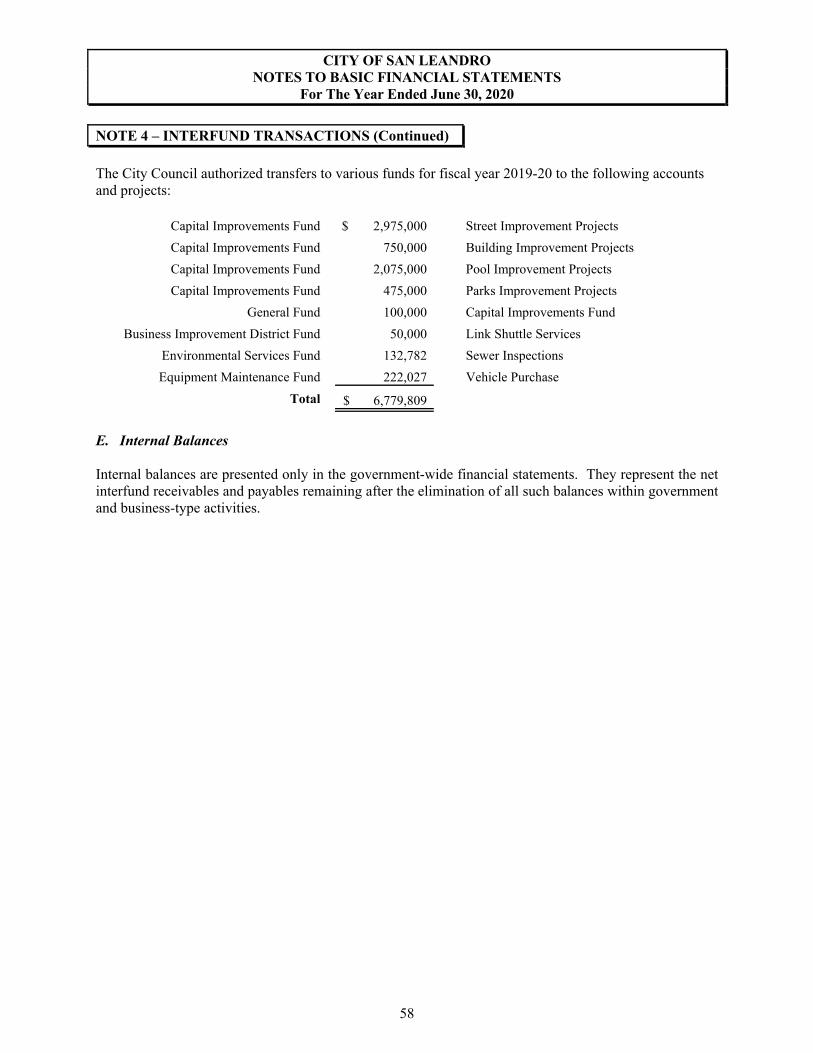
CITY OF SAN LEANDRO NOTES TO BASIC FINANCIAL STATEMENTS
For The Year Ended June 30, 2020
NOTE 4 – INTERFUND TRANSACTIONS (Continued)
The City Council authorized transfers to various funds for fiscal year 2019-20 to the following accounts and projects:
Capital Improvements Fund 2,975,000$ Street Improvement Projects
Capital Improvements Fund 750,000 Building Improvement Projects
Capital Improvements Fund 2,075,000 Pool Improvement Projects
Capital Improvements Fund 475,000 Parks Improvement Projects
General Fund 100,000 Capital Improvements Fund
Business Improvement District Fund 50,000 Link Shuttle Services
Environmental Services Fund 132,782 Sewer Inspections
Equipment Maintenance Fund 222,027 Vehicle Purchase
Total 6,779,809$
E. Internal Balances
Internal balances are presented only in the government-wide financial statements. They represent the net interfund receivables and payables remaining after the elimination of all such balances within government and business-type activities.
58

CITY OF SAN LEANDRO NOTES TO BASIC FINANCIAL STATEMENTS
For The Year Ended June 30, 2020
NOTE 5 – CAPITAL ASSETS
A. Government-Wide Financial Statements
At June 30, 2020, the City’s capital assets consisted of the following:
Governmental Business-TypeActivities Activities Total
Non-depreciable assets:
Land 16,550,305$ 5,234,310$ 21,784,615$
Construction in Progress 12,944,919 1,148,155 14,093,074
Total non-depreciable assets 29,495,224 6,382,465 35,877,689
Depreciable assets:
Buildings 82,705,552 67,353,755 150,059,307
Improvements 10,438,268 113,416 10,551,684
Machinery and Equipment 12,890,027 8,574,732 21,464,759
Licensed Vehicles 15,609,224 143,975 15,753,199
Infrastructure:
Park Irrigation Systems 4,668,420 - 4,668,420
Medians Irrigation 10,145,502 - 10,145,502
Park Structures 2,886,103 - 2,886,103
Roadway 253,514,246 - 253,514,246
Sidewalk 74,895,578 - 74,895,578
Curb and Gutter 37,447,790 - 37,447,790
Underground Piping and Storm Drain 20,025 12,578,705 12,598,730
Total depreciable assets 505,220,735 88,764,583 593,985,318
Less accumulated depreciation (342,219,656) (17,174,939) (359,394,595)
Total depreciable assets, net 163,001,079 71,589,644 234,590,723
Total capital assets 192,496,303$ 77,972,109$ 270,468,412$
59

CITY OF SAN LEANDRO NOTES TO BASIC FINANCIAL STATEMENTS
For The Year Ended June 30, 2020
NOTE 5 – CAPITAL ASSETS (Continued)
The following is a summary of capital assets for governmental activities:
Balance Retirements Balance
July 1, 2019 Additions Adjustments Transfers June 30, 2020
Non-Depreciable Assets:Land 16,550,305$ -$ -$ -$ 16,550,305$ Construction in progress 4,047,965 9,164,397 (267,443) 12,944,919
Total Non-Depreciable Assets 20,598,270 9,164,397 (267,443) 29,495,224
Depreciable Assets:
Buildings 82,705,552 - - - 82,705,552
Improvements 10,438,268 - - - 10,438,268
Machinery and equipment 12,174,725 841,268 (198,346) 72,380 12,890,027
Licensed vehicles 15,087,115 1,448,961 (926,852) - 15,609,224
Infrastructure 383,382,601 - - 195,063 383,577,664
Total Depreciable Assets 503,788,261 2,290,229 (1,125,198) 267,443 505,220,735
Accumulated Depreciation:
Buildings (28,308,428) (1,558,592) 14,237 - (29,852,783)
Improvements (5,199,070) (202,034) - - (5,401,104)
Machinery and equipment (9,175,513) (429,825) 197,314 - (9,408,024)
Licensed vehicles (8,861,067) (1,317,772) 881,824 - (9,297,015)
Infrastructure (274,935,265) (13,325,465) - - (288,260,730)
Total Accumulated Depreciation (326,479,343) (16,833,688) 1,093,375 - (342,219,656)
Depreciable Assets, Net 177,308,918 (14,543,459) (31,823) 267,443 163,001,079
Total Governmental Activities
Capital Assets, Net 197,907,188$ (5,379,062)$ (31,823)$ -$ 192,496,303$
Governmental activities depreciation expenses for capital assets for the year ended June 30, 2020, are as follows:
General Government 315,457$
Public Safety 473,185
Engineering and Transportation 13,091,454
Recreation and Human services 1,577,284
Community Development 315,457
Subtotal 15,772,837
Capital assets held by the City's Internal Service Funds 1,060,851
Total Depreciation Expense 16,833,688$
60

CITY OF SAN LEANDRO NOTES TO BASIC FINANCIAL STATEMENTS
For The Year Ended June 30, 2020
NOTE 5 – CAPITAL ASSETS (Continued)
The following is a summary of capital assets for business-type activities:
Balance BalanceJuly 1, 2019 Additions Retirements Transfers June 30, 2020
Non-Depreciable Assets:Land 5,234,310$ -$ -$ -$ 5,234,310$ Construction in progress 1,469,215 2,687,765 - (3,008,825) 1,148,155
Total Non-Depreciable Assets 6,703,525 2,687,765 - (3,008,825) 6,382,465
Depreciable Assets:
Buildings 67,353,755 - - - 67,353,755
Improvements 113,416 - - - 113,416
Machinery and equipment 8,704,491 17,600 (147,359) - 8,574,732
Licensed vehicles 124,175 19,800 - - 143,975
Infrastructure 9,569,880 - - 3,008,825 12,578,705
Total Depreciable Assets 85,865,717 37,400 (147,359) 3,008,825 88,764,583
Accumulated Depreciation:
Buildings (10,238,829) (1,361,610) - - (11,600,439)
Improvements (113,416) - - - (113,416)
Machinery and equipment (3,622,577) (166,571) 139,855 - (3,649,293)
Licensed vehicles (92,187) (2,711) - - (94,898)
Infrastructure (1,466,539) (250,354) - - (1,716,893)
Total Accumulated Depreciation (15,533,548) (1,781,246) 139,855 - (17,174,939)
Total Business-Type Activities
Capital Assets, Net 77,035,694$ 943,919$ (7,504)$ -$ 77,972,109$
B. Funds Financial Statements The Funds Financial Statements do not present General Government Capital Assets but are shown in the Reconciliation of the Governmental Funds Balance Sheet to the Government-Wide Statement of Net Position.
61

CITY OF SAN LEANDRO NOTES TO BASIC FINANCIAL STATEMENTS
For The Year Ended June 30, 2020
NOTE 6 – LONG-TERM DEBT
A. Governmental Activities Long-Term Debt
Summary of changes in governmental activities long-term debt for the year ended June 30, 2020, follows:
Balance Balance Due within Due in moreGovernmental Activity Debt: June 30, 2019 Retirements June 30, 2020 one year than one year
Pension Obligation Bonds:2012 Taxable Pension Obligation Bonds 10,085,000$ (1,680,000)$ 8,405,000$ 1,835,000$ 6,570,000$
Lease Revenue Bonds:2013 Refunding Lease Revenue Bonds
City portion 6,654,000 (641,000) 6,013,000 661,000 5,352,0002016 Refunding Lease Revenue Bonds 12,345,000 (895,000) 11,450,000 930,000 10,520,0002018 Lease Revenue Bonds 18,905,000 - 18,905,000 - 18,905,000Total Governmental Activity Debt 47,989,000 (3,216,000) 44,773,000 3,426,000 41,347,000
Direct Borrowings: Capital Leases:
2016 Bank of America Equipment Lease 4,941,178 (320,156) 4,621,022 326,915 4,294,107
Total Capital Leases 4,941,178 (320,156) 4,621,022 326,915 4,294,107
Other DebtHUD 108 Loan - Guarantee Loan -
Senior Center 1,452,000 (132,000) 1,320,000 132,000 1,188,000
Total Other Debt 1,452,000 (132,000) 1,320,000 132,000 1,188,000
Total Government Activity Debt 54,382,178 (3,668,156) 50,714,022 3,884,915 46,829,107
Plus unamortized:
Discount (2012 POB) (49,325) 10,119 (39,206) (10,119) (29,087)Premium (2013 RLRB) 174,015 (19,888) 154,127 19,888 134,239Premium (2016 RLRB) 1,638,533 (163,853) 1,474,680 163,853 1,310,827Premium (2018 LRB) 1,265,706 (43,645) 1,222,061 43,645 1,178,416
Total General Long-term Obligations 57,411,107$ (3,885,423)$ 53,525,684$ 4,102,182$ 49,423,502$
62

CITY OF SAN LEANDRO NOTES TO BASIC FINANCIAL STATEMENTS
For The Year Ended June 30, 2020
NOTE 6 – LONG-TERM DEBT (Continued)
2012 Taxable Pension Obligation Bonds In 2012, the City issued $18,305,000 principal amount of 2012 Taxable Pension Obligation Bonds (2012 POB). The purpose of the 2012 POB is to refinance the “side fund” obligations of the City to CalPERS with respect solely to the Public Safety Plan. Side funds with CalPERS are retired over a fixed term with a fixed amortization schedule based on CalPERS actuarial earnings assumption rate (7.65%). 2012 POB principal is due annually on December 1 and interest is due semi-annually on June 1 and December 1 through June 2024. Debt service is payable from available City resources. The 2012 POB are general obligations of the City, payable solely from any legally available moneys or funds of the City. The bond covenants contain events of default that require the revenue of the City to be applied by the Trustee as specified in the terms of the agreement if any of the following conditions occur: default on debt service payments; the failure of the City to observe or perform the conditions, covenants, or agreement terms of the debt; bankruptcy filing by the City; or if any court or competent jurisdiction shall assume custody or control of the City. There were no such events during the fiscal year ending June 30, 2020. At June 30, 2020, future debt service requirements for the City’s portion of the 2012 POB follows:
For The Year Ending June 30 Principal Interest Total
2021 1,835,000$ 441,164$ 2,276,164$ 2022 2,000,000 350,516 2,350,5162023 2,185,000 247,716 2,432,7162024 2,385,000 132,127 2,517,127
8,405,000$ 1,171,523$ 9,576,523$
2013 Refunding Lease Revenue Bonds In April 2013, the City issued $8,883,000 principal amount of 2013 Refunding Lease Revenue Bonds (2013 RLRB). The purpose of the 2013 RLRBs was to refund and retire the City’s 2003 COPs and 2001 COPs. The 2013 RLRBs bear interest rates ranging from 2.00% to 5.00% and are payable semiannually on each June 1 and December 1. Principal payments are payable annually on December 1. The Refunding Bonds are general obligations of the City, payable solely from and secured by Revenues and certain funds and accounts held under the Indenture. The bond covenants contain events of default that may result in the termination of the lease, collection of rent due and other monetary charges but do not terminate the City’s right to possession of the leased property as applied by the Trustee and specified in the terms of the agreement if any of the following conditions occur: default on debt service payments; the failure of the City to observe or perform the conditions, covenants, or agreement terms of the debt; bankruptcy filing by the City; or if any court or competent jurisdiction shall assume custody or control of the City. There were no such events occurred during the fiscal year ending June 30, 2020.
63
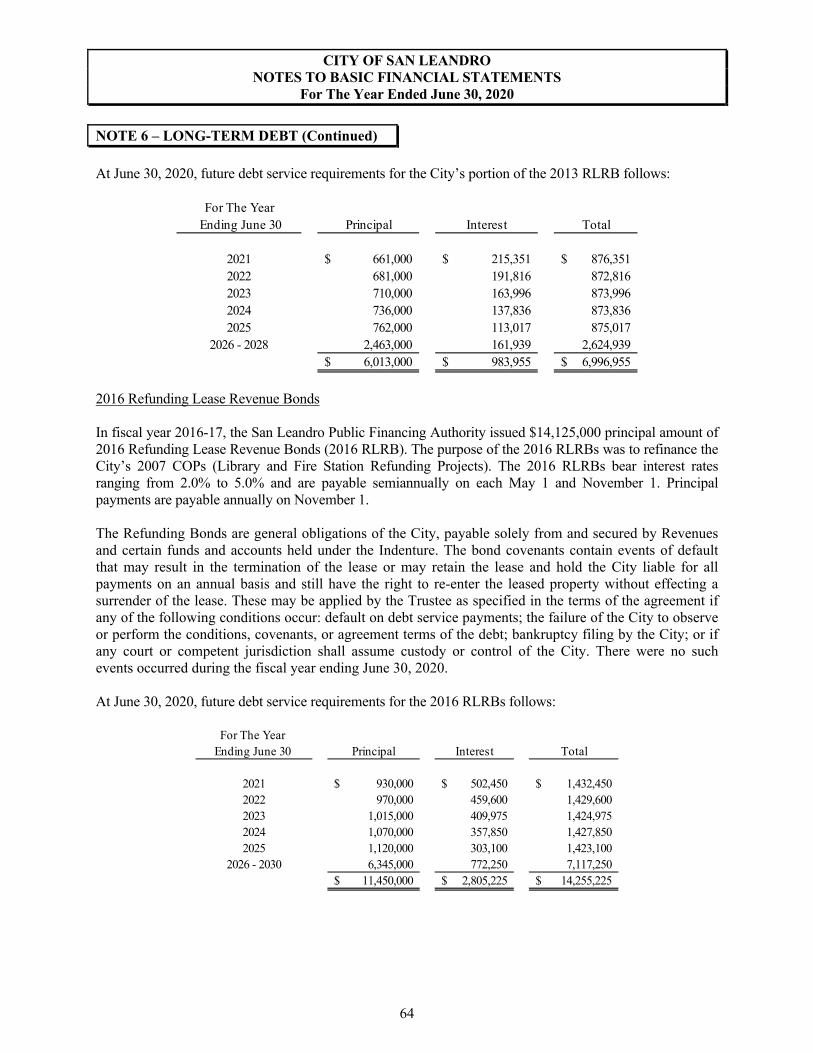
CITY OF SAN LEANDRO NOTES TO BASIC FINANCIAL STATEMENTS
For The Year Ended June 30, 2020
NOTE 6 – LONG-TERM DEBT (Continued)
At June 30, 2020, future debt service requirements for the City’s portion of the 2013 RLRB follows:
For The Year Ending June 30 Principal Interest Total
2021 661,000$ 215,351$ 876,351$ 2022 681,000 191,816 872,8162023 710,000 163,996 873,9962024 736,000 137,836 873,8362025 762,000 113,017 875,017
2026 - 2028 2,463,000 161,939 2,624,9396,013,000$ 983,955$ 6,996,955$
2016 Refunding Lease Revenue Bonds
In fiscal year 2016-17, the San Leandro Public Financing Authority issued $14,125,000 principal amount of 2016 Refunding Lease Revenue Bonds (2016 RLRB). The purpose of the 2016 RLRBs was to refinance the City’s 2007 COPs (Library and Fire Station Refunding Projects). The 2016 RLRBs bear interest rates ranging from 2.0% to 5.0% and are payable semiannually on each May 1 and November 1. Principal payments are payable annually on November 1.
The Refunding Bonds are general obligations of the City, payable solely from and secured by Revenues and certain funds and accounts held under the Indenture. The bond covenants contain events of default that may result in the termination of the lease or may retain the lease and hold the City liable for all payments on an annual basis and still have the right to re-enter the leased property without effecting a surrender of the lease. These may be applied by the Trustee as specified in the terms of the agreement if any of the following conditions occur: default on debt service payments; the failure of the City to observe or perform the conditions, covenants, or agreement terms of the debt; bankruptcy filing by the City; or if any court or competent jurisdiction shall assume custody or control of the City. There were no such events occurred during the fiscal year ending June 30, 2020.
At June 30, 2020, future debt service requirements for the 2016 RLRBs follows:
For The Year Ending June 30 Principal Interest Total
2021 930,000$ 502,450$ 1,432,450$ 2022 970,000 459,600 1,429,6002023 1,015,000 409,975 1,424,9752024 1,070,000 357,850 1,427,8502025 1,120,000 303,100 1,423,100
2026 - 2030 6,345,000 772,250 7,117,25011,450,000$ 2,805,225$ 14,255,225$
64
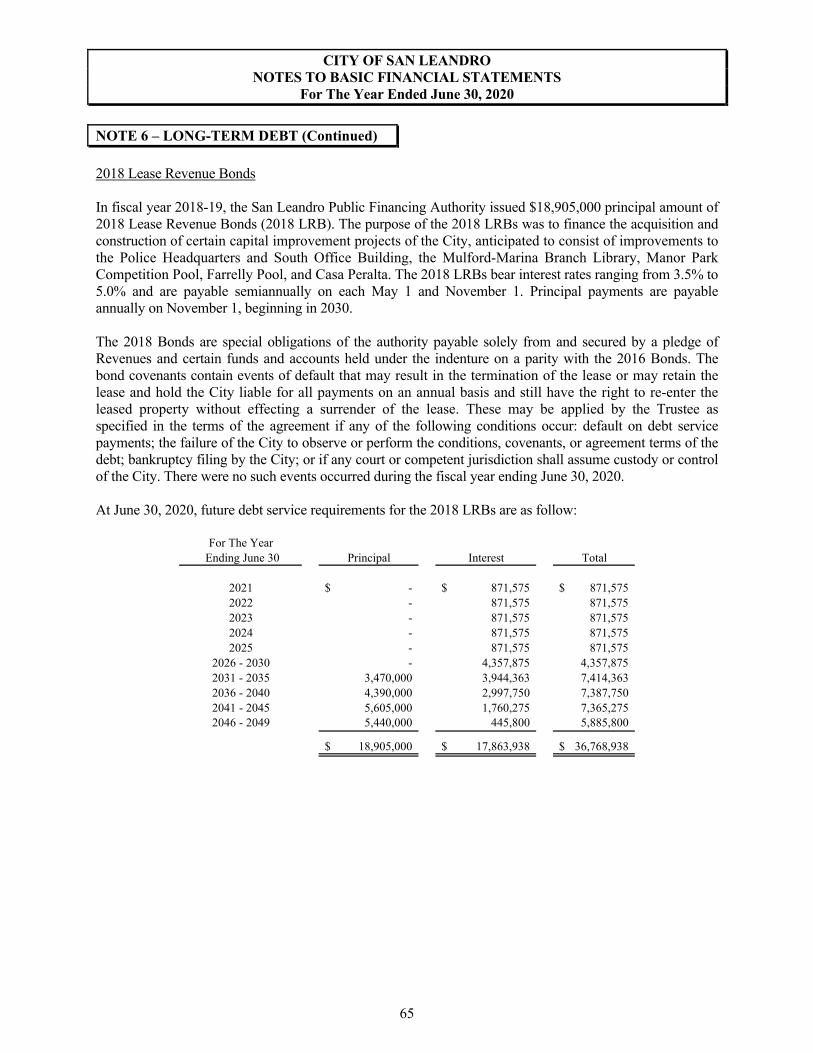
CITY OF SAN LEANDRO NOTES TO BASIC FINANCIAL STATEMENTS
For The Year Ended June 30, 2020
NOTE 6 – LONG-TERM DEBT (Continued)
2018 Lease Revenue Bonds
In fiscal year 2018-19, the San Leandro Public Financing Authority issued $18,905,000 principal amount of 2018 Lease Revenue Bonds (2018 LRB). The purpose of the 2018 LRBs was to finance the acquisition and construction of certain capital improvement projects of the City, anticipated to consist of improvements to the Police Headquarters and South Office Building, the Mulford-Marina Branch Library, Manor Park Competition Pool, Farrelly Pool, and Casa Peralta. The 2018 LRBs bear interest rates ranging from 3.5% to 5.0% and are payable semiannually on each May 1 and November 1. Principal payments are payable annually on November 1, beginning in 2030.
The 2018 Bonds are special obligations of the authority payable solely from and secured by a pledge of Revenues and certain funds and accounts held under the indenture on a parity with the 2016 Bonds. The bond covenants contain events of default that may result in the termination of the lease or may retain the lease and hold the City liable for all payments on an annual basis and still have the right to re-enter the leased property without effecting a surrender of the lease. These may be applied by the Trustee as specified in the terms of the agreement if any of the following conditions occur: default on debt service payments; the failure of the City to observe or perform the conditions, covenants, or agreement terms of the debt; bankruptcy filing by the City; or if any court or competent jurisdiction shall assume custody or control of the City. There were no such events occurred during the fiscal year ending June 30, 2020.
At June 30, 2020, future debt service requirements for the 2018 LRBs are as follow:
For The Year Ending June 30 Principal Interest Total
2021 -$ 871,575$ 871,575$ 2022 - 871,575 871,5752023 - 871,575 871,5752024 - 871,575 871,5752025 - 871,575 871,575
2026 - 2030 - 4,357,875 4,357,8752031 - 2035 3,470,000 3,944,363 7,414,3632036 - 2040 4,390,000 2,997,750 7,387,7502041 - 2045 5,605,000 1,760,275 7,365,2752046 - 2049 5,440,000 445,800 5,885,800
18,905,000$ 17,863,938$ 36,768,938$
65

CITY OF SAN LEANDRO NOTES TO BASIC FINANCIAL STATEMENTS
For The Year Ended June 30, 2020
NOTE 6 – LONG-TERM DEBT (Continued)
2016 Bank of America Equipment Lease
On July 21, 2016, the City entered into a direct borrowing Lease/Purchase Agreement with Bank of America, LLC to Lease/Purchase Equipment in the amount of $5,409,045. The Equipment was for the installation of energy efficiency improvements on various City-owned facilities. The interest is 2.10% payable over 16 years.
At June 30, 2020, future debt service requirements for the 2016 equipment lease follows:
For The Year Ending June 30 Principal Interest Total
2021 326,915$ 95,334$ 422,249$ 2022 333,816 88,433 422,249 2023 340,864 81,389 422,253 2024 348,059 74,190 422,249 2025 355,407 66,842 422,249
2026 - 2030 1,892,794 218,454 2,111,248 2031 - 2033 1,023,167 32,452 1,055,619
4,621,022$ 657,094$ 5,278,116$
HUD 108 Guarantee Loan – Senior Center
In 2011, the City received a direct borrowing $2,500,000 20-year federal loan from HUD, at an interest rate of 3% to finance the acquisition and construction of senior center facility within the City of San Leandro. The loan is secured and payable from the Community Development Block Grant Fund.
The loan covenants contain events of default which include collection of any funds pledged under the contract, withholding the guarantee of any or all obligations not yet disbursed to the City or the Loanee may direct the City’s financial institution to refuse to release any loan funds held in loan accounts, repayment accounts and investment accounts to the City. These events may be applied by the Loanee as specified in the terms of the agreement if any of the following conditions occur: default on debt service payments; the failure of the City to observe or perform the conditions, covenants, or agreement terms of the debt; bankruptcy filing by the City; or if any court or competent jurisdiction shall assume custody or control of the City. There were no such events occurred during the fiscal year ending June 30, 2020.
At June 30, 2020 future debt service requirements for the HUD 108 Guarantee loan follows:
For The Year Ending June 30 Principal Interest Total
2021 132,000$ 50,972$ 182,972$ 2022 132,000 46,246 178,246 2023 132,000 41,256 173,256 2024 132,000 36,135 168,135
2025 132,000 30,882 162,882 2026 - 2030 660,000 71,479 731,479
1,320,000$ 276,970$ 1,596,970$
66
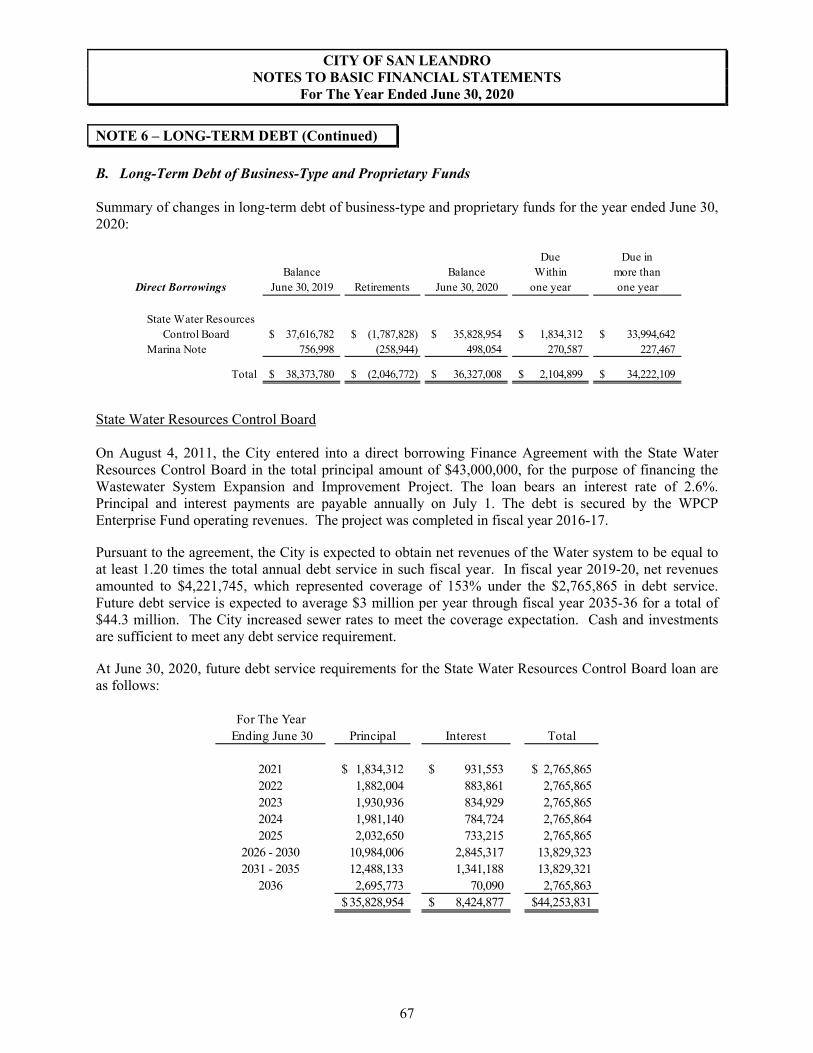
CITY OF SAN LEANDRO NOTES TO BASIC FINANCIAL STATEMENTS
For The Year Ended June 30, 2020
NOTE 6 – LONG-TERM DEBT (Continued)
B. Long-Term Debt of Business-Type and Proprietary Funds
Summary of changes in long-term debt of business-type and proprietary funds for the year ended June 30, 2020:
Due Due inBalance Balance Within more than
Direct Borrowings June 30, 2019 Retirements June 30, 2020 one year one year
State Water ResourcesControl Board 37,616,782$ (1,787,828)$ 35,828,954$ 1,834,312$ 33,994,642$
Marina Note 756,998 (258,944) 498,054 270,587 227,467
Total 38,373,780$ (2,046,772)$ 36,327,008$ 2,104,899$ 34,222,109$
State Water Resources Control Board
On August 4, 2011, the City entered into a direct borrowing Finance Agreement with the State Water Resources Control Board in the total principal amount of $43,000,000, for the purpose of financing the Wastewater System Expansion and Improvement Project. The loan bears an interest rate of 2.6%. Principal and interest payments are payable annually on July 1. The debt is secured by the WPCP Enterprise Fund operating revenues. The project was completed in fiscal year 2016-17.
Pursuant to the agreement, the City is expected to obtain net revenues of the Water system to be equal to at least 1.20 times the total annual debt service in such fiscal year. In fiscal year 2019-20, net revenues amounted to $4,221,745, which represented coverage of 153% under the $2,765,865 in debt service. Future debt service is expected to average $3 million per year through fiscal year 2035-36 for a total of $44.3 million. The City increased sewer rates to meet the coverage expectation. Cash and investments are sufficient to meet any debt service requirement.
At June 30, 2020, future debt service requirements for the State Water Resources Control Board loan are as follows:
For The Year Ending June 30 Principal Interest Total
2021 1,834,312$ 931,553$ 2,765,865$ 2022 1,882,004 883,861 2,765,8652023 1,930,936 834,929 2,765,8652024 1,981,140 784,724 2,765,8642025 2,032,650 733,215 2,765,865
2026 - 2030 10,984,006 2,845,317 13,829,3232031 - 2035 12,488,133 1,341,188 13,829,321
2036 2,695,773 70,090 2,765,86335,828,954$ 8,424,877$ 44,253,831$
67
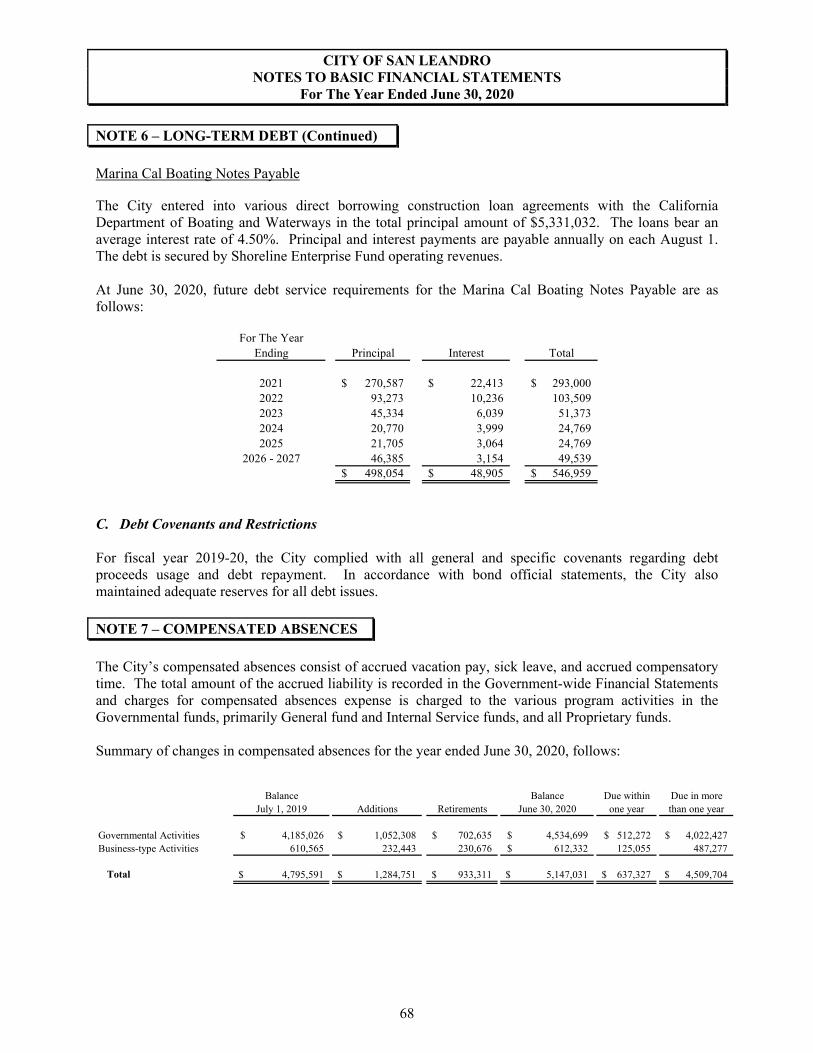
CITY OF SAN LEANDRO NOTES TO BASIC FINANCIAL STATEMENTS
For The Year Ended June 30, 2020
NOTE 6 – LONG-TERM DEBT (Continued)
Marina Cal Boating Notes Payable
The City entered into various direct borrowing construction loan agreements with the California Department of Boating and Waterways in the total principal amount of $5,331,032. The loans bear an average interest rate of 4.50%. Principal and interest payments are payable annually on each August 1. The debt is secured by Shoreline Enterprise Fund operating revenues.
At June 30, 2020, future debt service requirements for the Marina Cal Boating Notes Payable are as follows:
For The YearEnding Principal Interest Total
2021 270,587$ 22,413$ 293,000$ 2022 93,273 10,236 103,5092023 45,334 6,039 51,3732024 20,770 3,999 24,7692025 21,705 3,064 24,769
2026 - 2027 46,385 3,154 49,539498,054$ 48,905$ 546,959$
C. Debt Covenants and Restrictions
For fiscal year 2019-20, the City complied with all general and specific covenants regarding debt proceeds usage and debt repayment. In accordance with bond official statements, the City also maintained adequate reserves for all debt issues.
NOTE 7 – COMPENSATED ABSENCES
The City’s compensated absences consist of accrued vacation pay, sick leave, and accrued compensatory time. The total amount of the accrued liability is recorded in the Government-wide Financial Statements and charges for compensated absences expense is charged to the various program activities in the Governmental funds, primarily General fund and Internal Service funds, and all Proprietary funds.
Summary of changes in compensated absences for the year ended June 30, 2020, follows:
Balance Balance Due within Due in moreJuly 1, 2019 Additions Retirements June 30, 2020 one year than one year
Governmental Activities 4,185,026$ 1,052,308$ 702,635$ 4,534,699$ 512,272$ 4,022,427$ Business-type Activities 610,565 232,443 230,676 612,332$ 125,055 487,277
Total 4,795,591$ 1,284,751$ 933,311$ 5,147,031$ 637,327$ 4,509,704$
68
CITY OF SAN LEANDRO NOTES TO BASIC FINANCIAL STATEMENTS
For The Year Ended June 30, 2020
NOTE 8 – UNEARNED REVENUE
A. Governmental-Wide Financial Statements Unearned revenue in the Government-Wide Financial Statements represents amounts for which revenues have not been earned. At June 30, 2020, unearned revenue in the Government-Wide Financial Statements was $3,682,857.
NOTE 9 – NET POSITION AND FUND BALANCES
A. Net Position Net Position is the excess of all the City’s assets and deferred outflows of resources over all its liabilities, and deferred inflows of resources regardless of fund. Net Position is divided into three captions. These captions apply only to Net Position, which is determined only at the Government-wide level, and are described below: Net investment in capital assets describes the portion of Net Position which is represented by the current net book value of the City’s capital assets, less the outstanding balance of any debt issued to finance these assets. Restricted net position describes the portion of Net Position which is restricted as to use by the terms and conditions of agreements with outside parties, governmental regulations, laws, or other restrictions which the City cannot unilaterally alter. These principally include capital projects, debt service requirements, and special revenue programs restricted to special revenue purposes such as Measure B, Measure BB, Measure F, special Gas Tax, Grant funds, and other special revenue funds. Unrestricted describes the portion of Net Position which is not restricted to use. B. Fund Balances
Governmental fund balances represent the net current assets of each fund. Net current assets generally represent a fund’s cash and receivables, less its liabilities. The City’s fund balances are classified in accordance with Governmental Accounting Standards Board Statement Number 54 (GASB 54), Fund Balance Reporting and Governmental Fund Type Definitions, which requires the City to classify its fund balances based on spending constraints imposed on the use of resources. For programs with multiple funding sources, the City prioritizes and expends funds in the following order: Restricted, Committed, Assigned, and Unassigned. Each category in the following hierarchy is ranked according to the degree of spending constraint: Nonspendable represents balances set aside to indicate items do not represent available, spendable resources even though they are a component of assets. Fund balances required to be maintained intact, such as Permanent Funds, and assets not expected to be converted to cash, such as prepaid, notes receivable, and land held for redevelopment are included. However, if proceeds realized from the sale or collection of nonspendable assets are restricted, committed or assigned, then Nonspendable amounts are required to be presented as a component of the applicable category.
69
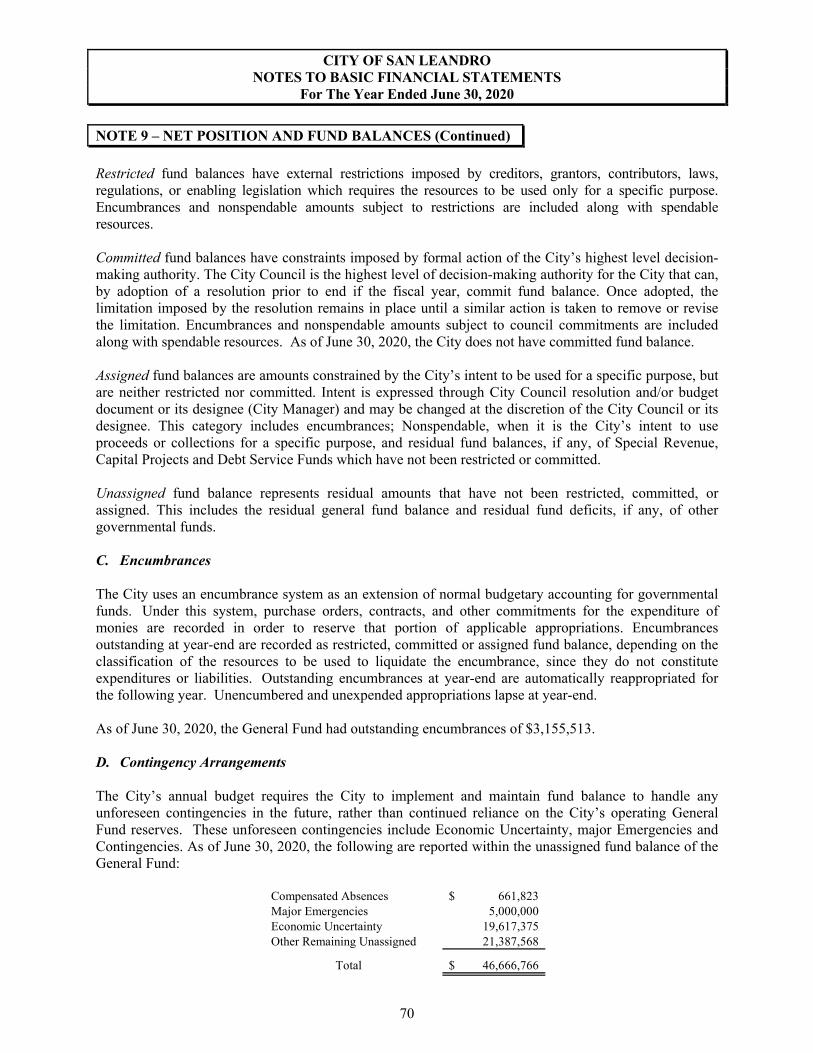
CITY OF SAN LEANDRO NOTES TO BASIC FINANCIAL STATEMENTS
For The Year Ended June 30, 2020
NOTE 9 – NET POSITION AND FUND BALANCES (Continued)
Restricted fund balances have external restrictions imposed by creditors, grantors, contributors, laws, regulations, or enabling legislation which requires the resources to be used only for a specific purpose. Encumbrances and nonspendable amounts subject to restrictions are included along with spendable resources.
Committed fund balances have constraints imposed by formal action of the City’s highest level decision-making authority. The City Council is the highest level of decision-making authority for the City that can, by adoption of a resolution prior to end if the fiscal year, commit fund balance. Once adopted, the limitation imposed by the resolution remains in place until a similar action is taken to remove or revise the limitation. Encumbrances and nonspendable amounts subject to council commitments are included along with spendable resources. As of June 30, 2020, the City does not have committed fund balance.
Assigned fund balances are amounts constrained by the City’s intent to be used for a specific purpose, but are neither restricted nor committed. Intent is expressed through City Council resolution and/or budget document or its designee (City Manager) and may be changed at the discretion of the City Council or its designee. This category includes encumbrances; Nonspendable, when it is the City’s intent to use proceeds or collections for a specific purpose, and residual fund balances, if any, of Special Revenue, Capital Projects and Debt Service Funds which have not been restricted or committed.
Unassigned fund balance represents residual amounts that have not been restricted, committed, or assigned. This includes the residual general fund balance and residual fund deficits, if any, of other governmental funds.
C. Encumbrances
The City uses an encumbrance system as an extension of normal budgetary accounting for governmental funds. Under this system, purchase orders, contracts, and other commitments for the expenditure of monies are recorded in order to reserve that portion of applicable appropriations. Encumbrances outstanding at year-end are recorded as restricted, committed or assigned fund balance, depending on the classification of the resources to be used to liquidate the encumbrance, since they do not constitute expenditures or liabilities. Outstanding encumbrances at year-end are automatically reappropriated for the following year. Unencumbered and unexpended appropriations lapse at year-end.
As of June 30, 2020, the General Fund had outstanding encumbrances of $3,155,513.
D. Contingency Arrangements
The City’s annual budget requires the City to implement and maintain fund balance to handle any unforeseen contingencies in the future, rather than continued reliance on the City’s operating General Fund reserves. These unforeseen contingencies include Economic Uncertainty, major Emergencies and Contingencies. As of June 30, 2020, the following are reported within the unassigned fund balance of the General Fund:
Compensated Absences 661,823$ Major Emergencies 5,000,000 Economic Uncertainty 19,617,375 Other Remaining Unassigned 21,387,568
Total 46,666,766$
70

CITY OF SAN LEANDRO NOTES TO BASIC FINANCIAL STATEMENTS
For The Year Ended June 30, 2020
NOTE 9 – NET POSITION AND FUND BALANCES (Continued)
Detailed classifications of the City’s Fund Balances, as of June 30, 2020, are below:
Capital
Improvement Non-Major
General Capital Project Governmental
Fund Fund Funds Total Nonspendables:
Advances to Other Funds 6,500,110$ -$ -$ 6,500,110$ Loans receivable 1,497,835 - - 1,497,835
Total Nonspendable Fund Balances 7,997,945 - - 7,997,945
Restricted for: Internship 50,000 - - 50,000
Capital Projects Capital Improvement Projects - 44,370,391 - 44,370,391 Subtotal 50,000 44,370,391 44,420,391
Non-Major Governmental Funds Special Assessment District Debt Service - - 121 121 San Leandro Public Financing Authority - - 435,313 435,313 GHAD - - 13,622 13,622 Affordable Housing - - 2,461,387 2,461,387 Street/ Traffic Improvements - - 1,984,325 1,984,325 Park Development Fees - - 1,241,629 1,241,629 Underground Utility - - 3,026,305 3,026,305 Parking - - 266,425 266,425 Special Gas Tax - - 907,518 907,518 Measure BB - - 373,863 373,863 Cherrywood Maintenance - - 462,859 462,859 Measure B - Paratransit - - 590,705 590,705 Asset Seizure - - 1,413,559 1,413,559 Heron Bay - - 821,232 821,232 Proposition 1B - Local Streets & Roads - - 14,093 14,093 Special Grants - - 811,452 811,452 Measure B - - 2,035,874 2,035,874 Measure F - - 1,122,480 1,122,480 CDBG - - 71,215 71,215 HOME - - 781,586 781,586 Housing In- Lieu - - 262,818 262,818 Business Improvement District - - 167,089 167,089 Public Education and Government - - 836,830 836,830
Subtotal - - 20,102,300 20,102,300
Total Restricted Fund Balances 50,000 44,370,391 20,102,300 64,522,691
Assigned to: Encumbrances - departmental projects 3,155,513 - - 3,155,513 Oakland Airport Access Agreement 500,000 - - 500,000 ACFD OPEB 6,144,128 - - 6,144,128
Total Assigned Fund Balances 9,799,641 - - 9,799,641
Unassigned: General fund - Compensated Absences 661,823 - - 661,823 General fund - Major Emergencies 5,000,000 - - 5,000,000 General fund - Economic Uncertainty 19,617,375 - - 19,617,375 General fund - Other 21,387,568 - - 21,387,568
Total Unassigned Fund Balances 46,666,766 - - 46,666,766
Total Fund Balances 64,514,352$ 44,370,391$ 20,102,300$ 128,987,043$
71
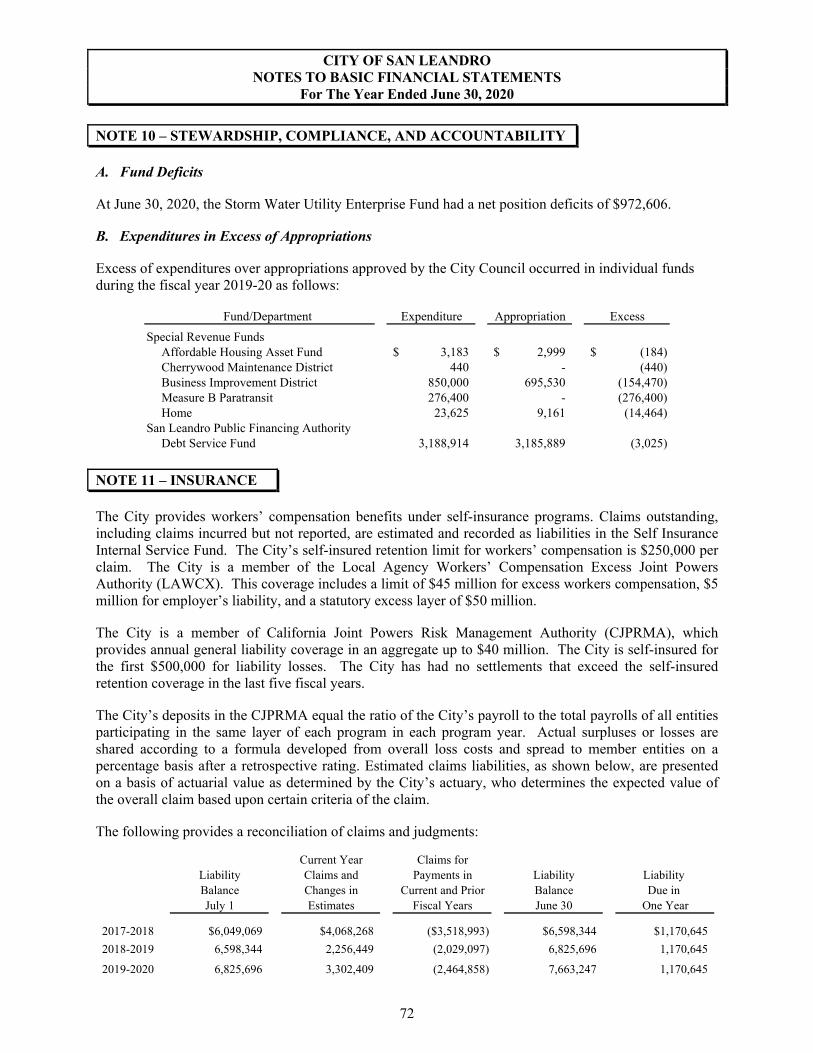
CITY OF SAN LEANDRO NOTES TO BASIC FINANCIAL STATEMENTS
For The Year Ended June 30, 2020
NOTE 10 – STEWARDSHIP, COMPLIANCE, AND ACCOUNTABILITY
A. Fund Deficits
At June 30, 2020, the Storm Water Utility Enterprise Fund had a net position deficits of $972,606.
B. Expenditures in Excess of Appropriations
Excess of expenditures over appropriations approved by the City Council occurred in individual funds during the fiscal year 2019-20 as follows:
Fund/Department Expenditure Appropriation Excess
Special Revenue FundsAffordable Housing Asset Fund 3,183$ 2,999$ (184)$ Cherrywood Maintenance District 440 - (440)Business Improvement District 850,000 695,530 (154,470)Measure B Paratransit 276,400 - (276,400)Home 23,625 9,161 (14,464)
San Leandro Public Financing Authority Debt Service Fund 3,188,914 3,185,889 (3,025)
NOTE 11 – INSURANCE
The City provides workers’ compensation benefits under self-insurance programs. Claims outstanding, including claims incurred but not reported, are estimated and recorded as liabilities in the Self Insurance Internal Service Fund. The City’s self-insured retention limit for workers’ compensation is $250,000 per claim. The City is a member of the Local Agency Workers’ Compensation Excess Joint Powers Authority (LAWCX). This coverage includes a limit of $45 million for excess workers compensation, $5 million for employer’s liability, and a statutory excess layer of $50 million.
The City is a member of California Joint Powers Risk Management Authority (CJPRMA), which provides annual general liability coverage in an aggregate up to $40 million. The City is self-insured for the first $500,000 for liability losses. The City has had no settlements that exceed the self-insured retention coverage in the last five fiscal years.
The City’s deposits in the CJPRMA equal the ratio of the City’s payroll to the total payrolls of all entities participating in the same layer of each program in each program year. Actual surpluses or losses are shared according to a formula developed from overall loss costs and spread to member entities on a percentage basis after a retrospective rating. Estimated claims liabilities, as shown below, are presented on a basis of actuarial value as determined by the City’s actuary, who determines the expected value of the overall claim based upon certain criteria of the claim.
The following provides a reconciliation of claims and judgments:
Current Year Claims forLiability Claims and Payments in Liability Liability Balance Changes in Current and Prior Balance Due in July 1 Estimates Fiscal Years June 30 One Year
2017-2018 $6,049,069 $4,068,268 ($3,518,993) $6,598,344 $1,170,645
2018-2019 6,598,344 2,256,449 (2,029,097) 6,825,696 1,170,645
2019-2020 6,825,696 3,302,409 (2,464,858) 7,663,247 1,170,645
72

CITY OF SAN LEANDRO NOTES TO BASIC FINANCIAL STATEMENTS
For The Year Ended June 30, 2020
NOTE 12 – COMMITMENTS AND CONTINGENCIES
The City participates in several Federal and State grant programs. These programs have been audited by the City’s independent accountants in accordance with the provisions of the Federal Single Audit Act as amended and applicable State requirements. No cost disallowances were proposed as a result of these audits. However, these programs are still subject to further examination by the grantors and the amount, if any, of expenditures that may be disallowed by the granting agencies cannot be determined at this time. The City expects such amounts, if any, to be immaterial.
The City is a defendant in a number of lawsuits which have arisen in the normal course of business. While substantial damages are alleged in some of these actions, their outcome cannot be predicted with certainty. In the opinion of the City Attorney, these actions when finally adjudicated will not have a material adverse effect on the financial position of the City. As discussed in Note 11 to the Financial Statements, the City maintains a Self-Insurance Fund which has reserves of $2,693,806 at the end of June 30, 2020. These reserves are available to satisfy any future liability.
A. Sales Tax Reimbursement Agreement
The City has entered into a sales tax reimbursement agreement in order to encourage construction and improvement of property sites within the City. In return, the City is expected to make annual reimbursement payments until the full amount of assistance has been remitted or over a twenty (20) year period, whichever comes sooner. The annual cost of each reimbursement payment commitment is equal to 50% of the net sales tax generated and received by the City above a base amount of $277,000 as stipulated in the approved agreements.
For financial reporting purposes, GASB Statement No. 77 defines a tax abatement as resulting from an agreement between a government and an individual or entity in which the government promises to forgo tax revenues and the individual or entity promises to subsequently take a specific action that contributes to economic development or otherwise benefits the government or its citizens. According to GASB Statement No. 77, the substance of this sales-tax reimbursement agreement meets the definition of “tax abatements.”
For the fiscal year ended June 30, 2020, under this sales-tax reimbursement agreement, the City has abatements totaling $119,360.
Pursuant to the Sales and Use Tax law (chapter 8 – Article 1 – section 7056), in order to protect the confidential information of the sales taxes collected and abatements provided to each of the specific agencies, the City has presented the aggregate amount abated during the current fiscal year.
NOTE 13 – PENSIONS PLAN
For purposes of measuring the net pension liability and deferred outflows/inflows of resources related to pensions, and pension expense, information about the fiduciary net position of the City’s California Public Employees’ Retirement System (CalPERS) plans (Plans) and additions to/deductions from the Plans’ fiduciary net position have been determined on the same basis as they are reported by CalPERS. For this purpose, benefit payments (including refunds of employee contributions) are recognized when due and payable in accordance with the benefit terms. Investments are reported at fair value.
73

CITY OF SAN LEANDRO NOTES TO BASIC FINANCIAL STATEMENTS
For The Year Ended June 30, 2020
NOTE 13 – PENSIONS PLAN (Continued)
A. Plan Descriptions and Summary of Balances by Plan
All qualified permanent employees are eligible to participate in the City’s defined benefit pension plans: Miscellaneous (all other) agent multiple-employer plan Safety cost-sharing multiple-employer plan
These plans are administered by the California Public Employees’ Retirement System (CalPERS), which acts as a common investment and administrative agent for its participating member employers. Benefit provisions under the Plans are established by State statute and City resolution. CalPERS issues publicly available reports that include a full description of the pension plans regarding benefit provisions, assumptions and membership information that can be found on the CalPERS website. Below is a summary of the deferred outflows of resources, net pension liabilities, and deferred inflows of resources by Plan for the year ended June 30, 2020:
Deferred Deferred
Outflows Net Pension Inflows
of Resources Liability of Resources
Miscellaneous 11,424,825$ 96,598,987$ 1,650,057$
Safety 19,088,718 92,150,076 6,027,630
Total 30,513,543$ 188,749,063$ 7,677,687$
Benefits Provided – CalPERS provides service retirement and disability benefits, annual cost of living adjustments and death benefits to plan members, who must be public employees and beneficiaries. Benefits are based on years of credited service, equal to one year of full-time employment. Members with five years of total service are eligible to retire at age 50 with statutorily reduced benefits. All members are eligible for non-duty disability benefits after 10 years of service. The cost of living adjustments for each plan are applied as specified by the Public Employees’ Retirement Law. The Pension Reform Act of 2013 (PEPRA), Assembly Bill 340, is applicable to employees new to CalPERS and hired after December 31, 2012. During the fiscal year 2019-2020, the City adopted amendments with CalPERS that allows sharing of additional employer costs passed to the employees. The City implemented a cost sharing within the pension plans among San Leandro Police Officers' Association (SLPOA) and San Leandro Management Organization (SLMO) employees. This included SLPOA and SLMO staff picking up the employers CalPERS share of 3%. These are the maximum under CalPERS law for the passing on costs of the employer’s share. These were amendment changes to the contract between the Board of Administration California Public Employees’ Retirement System and the City as proposed changes in Section 20516 (Employees Sharing Additional Costs). Increase in employee contribution rates result in a respective decrease in employer contribution rates. The Plans’ provisions and benefits in effect at June 30, 2020, are summarized as follows:
74

CITY OF SAN LEANDRO NOTES TO BASIC FINANCIAL STATEMENTS
For The Year Ended June 30, 2020
NOTE 13 – PENSIONS PLAN (Continued)
Miscellaneous
Hire datePrior to
May 6, 2010
On or after May 6, 2010 to
January 1, 2013On or after
January 1, 2013
Benefit formula 2.5% @ 55 2% @ 55 2% @ 62
Benefit vesting schedule 5 years service 5 years service 5 years service
Benefit payments monthly for life monthly for life monthly for life
Retirement age 50 to 55 50 to 55 52 to 62
Monthly benefits, as a % of eligible compensation 2.000% - 2.500% 1.426% - 2.418% 1.000% - 2.500%
Required employee contribution rates 8.000% 7.000% 6.750%
Required employer contribution rates, (blended) 10.411% 10.411% 10.411%
Safety
Hire datePrior to
January 1, 2013On or after
January 1, 2013
Benefit formula 3% @ 50 2.7% @ 57
Benefit vesting schedule 5 years service 5 years service
Benefit payments monthly for life monthly for life
Retirement age 50 50 to 57
Monthly benefits, as a % of eligible compensation 3.000% 2.000% - 2.700%
Required employee contribution rates 9.000% 12.750%
Required employer contribution rates 23.654% 13.786%
Beginning in fiscal year 2016, CalPERS collects employer contributions for the Plan as a percentage of payroll for the normal cost portion as noted in the rates above and as a dollar amount for contributions toward the unfunded accrued liability (UAL). The dollar amounts are billed on a monthly basis. The City’s required contribution for the UAL in the Miscellaneous and Safety Plans for the year ended June 30, 2020 were $6,396,251 and $5,485,642, respectively.
Employees Covered – The following employees were covered by the benefit terms for the Miscellaneous Plan as of the most recent actuarial valuation date of June 30, 2018 and measurement date of June 30, 2019:
Miscellaneous
Active employees 261
Inactive employees entitled
but not yet receiving benefits 321
Inactive employees or beneficiaries
currently receiving benefits 629
Total 1,211
* All Tiers of the Miscellaneous plan were combined together on GASB 68report by CalPERS
Contributions – Section 20814(c) of the California Public Employees’ Retirement Law requires that the employer contribution rates for all public employers be determined on an annual basis by the actuary and shall be effective on July 1 following notice of a change in the rate. Funding contributions for both Plans are determined annually on an actuarial basis as of June 30 by CalPERS.
75

CITY OF SAN LEANDRO NOTES TO BASIC FINANCIAL STATEMENTS
For The Year Ended June 30, 2020
NOTE 13 – PENSIONS PLAN (Continued)
The actuarially determined rate is the estimated amount necessary to finance the costs of benefits earned by employees during the year, with an additional amount to finance any unfunded accrued liability. The City is required to contribute the difference between the actuarially determined rate and the contribution rate of employees. For the year ended June 30, 2020, the contributions recognized as part of pension expense for the Plan were as follows:
Miscellaneous Safety Total
Contributions - employer 8,747,418$ 8,187,368$ 16,934,786$
B. Information Common to the Miscellaneous and Safety Plans The City’s net pension liability for each Plan is measured as the total pension liability, less the pension plan’s fiduciary net position. The net pension liability of each of the Plan is measured as of June 30, 2019, using an annual actuarial valuation as of June 30, 2018 rolled forward to June 30, 2019 using standard update procedures. A summary of principal assumptions and methods used to determine the net pension liability is shown below. Actuarial Assumptions – The total pension liabilities in the June 30, 2018 actuarial valuations were determined using the following actuarial assumptions:
All Plans
Valuation Date June 30, 2018Measurement Date June 30, 2019Actuarial Cost Method Entry-Age Normal Cost MethodActuarial Assumptions:
Discount Rate 7.15%Inflation 2.50%Payroll Growth 3.0%Projected Salary Increase Varies by Entry Age and ServiceInvestment Rate of Return 7.15% (1)Mortality Derived using CalPERS Membership Data for all Funds (2) Post Retirement Benefit Increase The lesser of contract COLA or 2.50% until Purchasing Power
Protection Allowance floor on purchasing power applies, 2.5% thereafter
(1) Net of pension plan investment and administrative expenses, including inflation.(2) The mortality table used was developed based on CalPERS' specific data. The probabilities of mortality are based on the 2017 CalPERS Experience Study for 'the period from 1997 to rates include 15 years of projected mortality improvement 90% os Scale MP2015. Pre-retirement and post-retirement mortality - 2016 published by the Society of Actuaries. For more details on this table, please refer to the CalPERS Experience Study and Review of Actuarial Assumptions report from December 2017 that can be found on the CalPERS website.
(3) The underlying mortality assumptions and all other actuarial assumptions used in the June 30, 2018 valuation were based on the results of a December 2017 actuarial experience study can be found on the CalPERS website.
76

CITY OF SAN LEANDRO NOTES TO BASIC FINANCIAL STATEMENTS
For The Year Ended June 30, 2020
NOTE 13 – PENSIONS PLAN (Continued)
Discount Rate – The discount rate used to measure the total pension liability for each Plan was 7.15%. The projection of cash flows used to determine the discount rate for each Plan assumed that contributions from all plan members in the Public Employees Retirement Fund (PERF) will be made at the current member contribution rates and that contributions from employers will be made at statutorily required rates, actuarially determined. Based on those assumptions, each Plan's fiduciary net position was projected to be available to make all projected future benefit payments of current plan members for all plans in the PERF. Therefore, the long-term expected rate of return on plan investments was applied to all periods of projected benefit payments to determine the total pension liability for each Plan. The long-term expected rate of return on pension plan investments was determined using a building-block method in which expected future real rates of return (expected returns, net of pension plan investment expense and inflation) are developed for each major asset class. In determining the long-term expected rate of return, CalPERS took into account both short-term and long-term market return expectations as well as the expected pension fund cash flows. Using historical returns of all the funds’ asset classes, expected compound geometric returns were calculated over the short-term (first 10 years) and the long-term (11+ years) using a building-block approach. Using the expected nominal returns for both short-term and long-term, the present value of benefits was calculated for each fund. The expected rate of return was set by calculating the single equivalent expected return that arrived at the same present value of benefits for cash flows as the one calculated using both short-term and long-term returns. The expected rate of return was then set equal to the single equivalent rate calculated above and adjusted to account for assumed administrative expenses. The table below reflects the long-term expected real rate of return by asset class.
New Strategic Real Return Real Return
Asset Class (a) Allocation Years 1-10 (b) Years 11+ (c)
Global Equity 50.0% 4.80% 5.98%
Fixed Income 28.0% 1.00% 2.62%
Inflation Assets 0.0% 0.77% 1.81%
Private Equity 8.0% 6.30% 7.23%
Real Assets 13.0% 3.75% 4.93%
Liquidity 1.0% 0.00% -0.92% Total 100.0%
(a) In the CalPERS CAFR, Fixed Income is included in Global Debt Securities;
Liquidity is included in Short-term Investments; Inflation Assets are
included in both Global Equity Securities and Global Debt Securities.
(b) An expected inflation of 2.0% used for this period
(c) An expected inflation of 2.92% used for this period
77
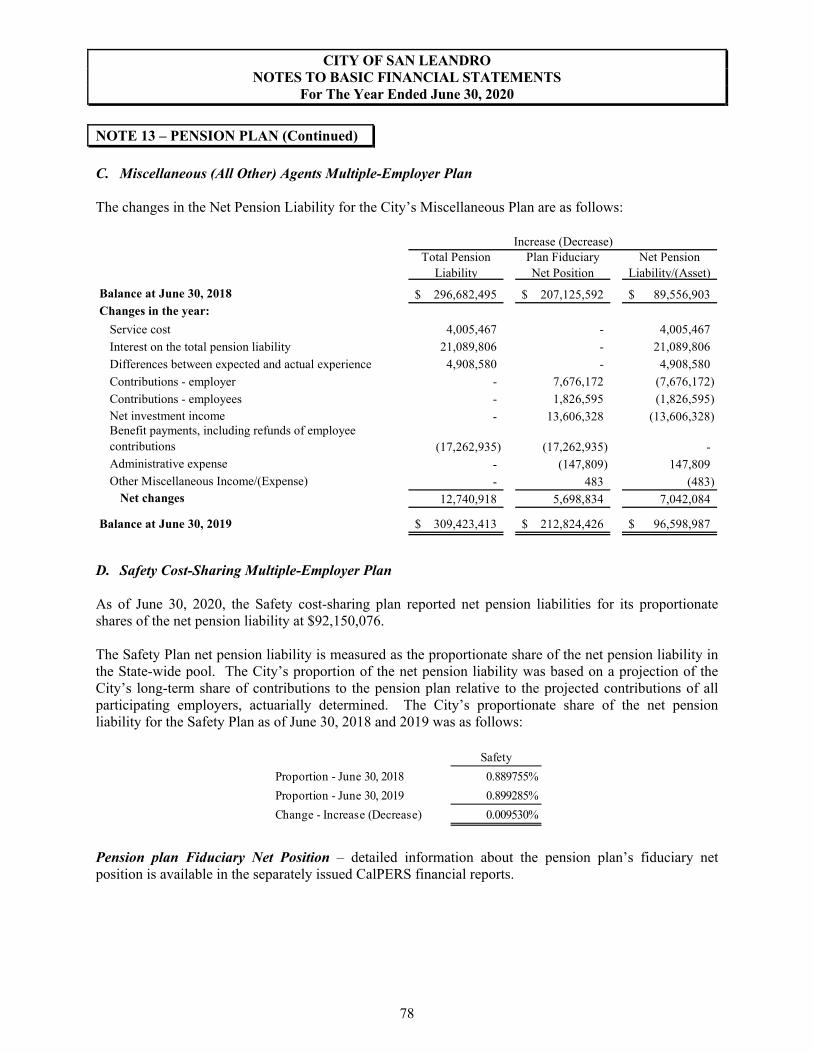
CITY OF SAN LEANDRO NOTES TO BASIC FINANCIAL STATEMENTS
For The Year Ended June 30, 2020
NOTE 13 – PENSION PLAN (Continued)
C. Miscellaneous (All Other) Agents Multiple-Employer Plan The changes in the Net Pension Liability for the City’s Miscellaneous Plan are as follows:
Increase (Decrease)Total Pension
LiabilityPlan FiduciaryNet Position
Net Pension Liability/(Asset)
Balance at June 30, 2018 296,682,495$ 207,125,592$ 89,556,903$ Changes in the year:
Service cost 4,005,467 - 4,005,467
Interest on the total pension liability 21,089,806 - 21,089,806
Differences between expected and actual experience 4,908,580 - 4,908,580
Contributions - employer - 7,676,172 (7,676,172)
Contributions - employees - 1,826,595 (1,826,595)Net investment income - 13,606,328 (13,606,328)Benefit payments, including refunds of employee contributions (17,262,935) (17,262,935) - Administrative expense - (147,809) 147,809Other Miscellaneous Income/(Expense) - 483 (483)
Net changes 12,740,918 5,698,834 7,042,084
Balance at June 30, 2019 309,423,413$ 212,824,426$ 96,598,987$
D. Safety Cost-Sharing Multiple-Employer Plan As of June 30, 2020, the Safety cost-sharing plan reported net pension liabilities for its proportionate shares of the net pension liability at $92,150,076. The Safety Plan net pension liability is measured as the proportionate share of the net pension liability in the State-wide pool. The City’s proportion of the net pension liability was based on a projection of the City’s long-term share of contributions to the pension plan relative to the projected contributions of all participating employers, actuarially determined. The City’s proportionate share of the net pension liability for the Safety Plan as of June 30, 2018 and 2019 was as follows:
Safety
Proportion - June 30, 2018 0.889755%
Proportion - June 30, 2019 0.899285%
Change - Increase (Decrease) 0.009530%
Pension plan Fiduciary Net Position – detailed information about the pension plan’s fiduciary net position is available in the separately issued CalPERS financial reports.
78

CITY OF SAN LEANDRO NOTES TO BASIC FINANCIAL STATEMENTS
For The Year Ended June 30, 2020
NOTE 13 – PENSION PLAN (Continued)
E. Other Information
Sensitivity of the Net Pension Liability to Changes in the Discount Rate – The following presents the net pension liability of the City for the Plan, calculated using the discount rate for the Plan, as well as what the City’s net pension liability would be if it were calculated using a discount rate that is 1-percentage point lower or 1-percentage point higher than the current rate:
Miscellaneous Safety
1% Decrease 6.15% 6.15%
Net Pension Liability 134,918,583$ 134,366,951$
Current Discount Rate 7.15% 7.15%
Net Pension Liability 96,598,987$ 92,150,076$
1% Increase 8.15% 8.15%
Net Pension Liability 64,768,904$ 57,538,853$
Pension Plan Fiduciary Net Position – Detailed information about the pension plan’s fiduciary net position is available in the separately issued CalPERS financial reports. The CalPERS Board of Administration has adopted a new amortization policy effective with the June 30, 2019 actuarial valuation. The new policy shortens the period over which actuarial gains and losses are amortized from 30 years to 20 years with the payments computed using a level dollar amount. In addition, the new policy removes the 5-year ramp-up and ramp-down on UAL bases attributable to assumption changes and non-investment gains/losses. The new policy removes the 5-year ramp-down on investment gains/losses. These changes will apply only to new UAL bases established on or after June 30, 2019. As a result of these changes, the City’s contribution rates for the fiscal year ended June 30, 2021 are expected to increase over the fiscal year 2020 contribution rates.
Pension Expenses and Deferred Outflows/Inflows of Resources Related to Pensions – For the year ended June 30, 2020, the City recognized total pension expense of $3,252,991, and $16,809,781 for the Miscellaneous and Safety, respectively. At June 30, 2020, the City reported deferred outflows of resources and deferred inflows of resources related to pensions from the following sources:
79

CITY OF SAN LEANDRO NOTES TO BASIC FINANCIAL STATEMENTS
For The Year Ended June 30, 2020
NOTE 13 – PENSION PLAN (Continued)
Agent-Multiple Deferred Outflows Deferred InflowsMiscellaneous of Resources of ResourcesPension contributions subsequent to measurement date 8,747,418$ -$ Differences between actual and expected experience 2,677,407 (77,795)Changes in assumptions - (230,650)Net differences between projected and actual earnings on plan investments - (1,341,612)
Total 11,424,825$ (1,650,057)$
Cost-Sharing Deferred Outflows Deferred InflowsSafety of Resources of ResourcesPension contributions subsequent to measurement date 8,187,368$ -$ Differences between actual and expected experience 6,016,568 - Changes in assumptions 3,777,071 (737,092)Change in employer's proportion and differences between the employer’s contributions and the employer’s proportionate share of contributions 1,107,711 (568,580)Differences between the employer's contribution and the employer’s proportionate share of contributions - (3,454,277)Net differences between projected and actual earnings on plan investments - (1,267,681)
Total 19,088,718$ (6,027,630)$
The $8,747,418 and $8,187,368 for Miscellaneous and Safety, respectively, will be reported as deferred outflows of resources related to contributions subsequent to the measurement date and will be recognized as a reduction of the net pension liability in the year ended June 30, 2021. Other amounts reported as deferred outflows of resources and deferred inflows of resources related to pensions will be recognized as pension expense as follows:
Miscellaneous Safety
Plan Plan Total
Year Ended Annual Annual Annual
June 30 Amortization Amortization Amortization
2021 2,704,463$ 4,931,333$ 7,635,796$
2022 (1,461,225) (1,013,430) (2,474,655)
2023 (396,646) 709,166 312,520
2024 180,758 246,651 427,409
1,027,350$ 4,873,720$ 5,901,070$
80

CITY OF SAN LEANDRO NOTES TO BASIC FINANCIAL STATEMENTS
For The Year Ended June 30, 2020
NOTE 14 – OTHER POST EMPLOYMENT BENEFITS
OPEB Liabilities, OPEB Expenses and Deferred Outflows/Inflows of Resources Related to OPEB - For purposes of measuring the net OPEB liability, deferred outflows of resources and deferred inflows of resources related to OPEB, and OPEB expense, information about the fiduciary net position of the City’s OPEB Plan and additions to/deductions from the OPEB Plan’s fiduciary net position have been determined on the same basis as they are reported by PARS. For this purpose, benefit payments are recognized when currently due and payable in accordance with the benefit terms. Investments are reported at fair value.
A. Plan Description
The City administers a single-employer defined-benefit post-employment healthcare plan. Dependents are eligible to enroll, and benefits continue to surviving spouses. The plan was established by City Council in fiscal year 2009-10 and provides reimbursements to retirees for qualified expenses. Retirees who have between five and fifteen years of service and meet certain criterion based upon retirement date, household income in the most recent calendar year, and age are entitled to reimbursements for qualified expenses.
Benefits Provided - Eligibility for retiree health benefits requires retirement from the City. Retirees may receive up to $360 monthly medical and $115.74 monthly dental reimbursement prior to age 65. Some retirees may receive $200 monthly medical reimbursement from age 65 to age 70. With the exception of certain retirees who are eligible for the $200 payment as discussed, after age 65, the retirees receive the PEMHCA minimum amount only.
Amendments to benefit provisions are negotiated by various bargaining units at the City and must be approved by Council. In fiscal year 2008-09, the City established an irrevocable exclusive agent multi-employer benefit trust which is administered by Public Agency Retirement Services (PARS). The trust will be used to accumulate and invest assets necessary to reimburse retirees. No separate financial reports are issued by PARS for the OPEB plan.
Employees Covered by Benefit Terms – Membership in the plan consisted of the following at the measurement date of June 30, 2020:
Active employees 349
Inactives currently receiving benefit payments 283
Inactive entitled to but not yet
receiving benefit payments 214
Total 846
81

CITY OF SAN LEANDRO NOTES TO BASIC FINANCIAL STATEMENTS
For The Year Ended June 30, 2020
NOTE 14 – OTHER POST EMPLOYMENT BENEFITS (Continued)
B. Net OPEB Liability
Actuarial Methods and Assumptions – The City’s net OPEB liability was measured as of June 30, 2020 and the total OPEB liability used to calculate the net OPEB liability was determined on actuarial valuation date that was rolled forward using standard update procedures to determine the total OPEB liability as of the measurement date, based on the following actuarial methods and assumptions:
Actuarial Assumptions June 30, 2020 Measurement DateValuation Date • June 30, 2019Actuarial Cost Method • Entry Age Normal Level Percentage of PayrollFunding Policy • City contributes full Actuarial Determined ContributionDiscount Rate • 5.25 %General Inflation • 2.75% per annumMortality, Retirement, Disability, Termination • CalPERS 1997-2015 Experience Study
Salary Increases• 3.0%• Additional merit-based on CallPERS merit 1997 - 2015 Experience Study
Healthcare Cost Trend • Non-Medicare - 7.25% for 2021, decreasing to an ultimate rate of 4.0% in 2076• Medicare - 6.30% for 2021, decreasing to an ultimate rate of 4.0% in 2076
The long-term expected rate of return on OPEB plan investments (comprised of capital appreciation and reinvestment of dividends, interest, and other distributions) is determined through a combination of historical rates of returns, valuation projections, and economic expectations. The expected return is then calculated by weighting the returns for each asset class according to the exposure as determined by HighMark’s current strategic allocation. Expected returns are developed and annually reviewed. The target allocation and best estimates of real rates of return for each major asset class are summarized in the following table:
Long-Term
Target Expected Real
Asset Class Allocation Rate of ReturnGlobal Equity 29.00% 4.82%
Fixed Income 65.00% 1.47%
Real Estate 1.00% 3.76%
Cash 5.00% 0.06%
Total 100.0%
82

CITY OF SAN LEANDRO NOTES TO BASIC FINANCIAL STATEMENTS
For The Year Ended June 30, 2020
NOTE 14 – OTHER POST EMPLOYMENT BENEFITS (Continued)
Discount Rate – The discount rate used to measure the total OPEB liability is 5.25%. This is the expected long-term rate of return on City assets using a Moderately Conservative Highmark PLUS fund within the Public Agency Retirement Services (PARS). The projection of cash flows used to determine the discount rate assumed that the City contribution will be made at rates equal to the actuarially determined contribution rates. Based on those assumptions, the OPEB plan's fiduciary net position is projected to cover all future OPEB payments. Therefore, the discount rate was set equal to the long-term expected rate of return. C. Changes in Net OPEB Liability The changes in the net OPEB liability follows:
Total OPEB Plan Fiduciary Net OPEBLiability Net Position Liability/(Asset)
(a) (b) (a) - (b)
Balance at June 30, 2019 Measurement Date 22,964,989$ 16,887,508$ 6,077,481$ Changes Recognized for the Measurement Period:
Service Cost 843,066 - 843,066Interest on the total OPEB liability 1,216,539 - 1,216,539Changes in benefit termsDifferences between expected and actual experienceChanges of assumptionsEmployer contributions - City - 2,771,770 (2,771,770)Employer contributions - Implicit subsidyNet investment income - 801,925 (801,925)Benefit payments (1,271,770) (1,271,770) - Implicit rate subsidy fulfilledAdministrative expenses - (40,057) 40,057
Net changes 787,835 2,261,868 (1,474,033)Balance at June 20, 2020 Measurement Date 23,752,824$ 19,149,376$ 4,603,448$
Plan fiduciary net position as percentage of the total OPEB liability 80.62%
D. Sensitivity of the Net OPEB Liability to Changes in the Discount Rate and Healthcare Cost Trend
Rates The following presents the net OPEB liability of the City, as well as what the City's net OPEB liability would be if it were calculated using a discount rate that is 1-percentage-point lower or 1-percentage-point higher than the current discount rate:
Net OPEB Liability/(Asset)
Discount Rate -1% Current Discount Rate Discount Rate +1%(4.25%) (5.25%) (6.25%)
7,694,723$ 4,603,448$ 2,052,246$
83
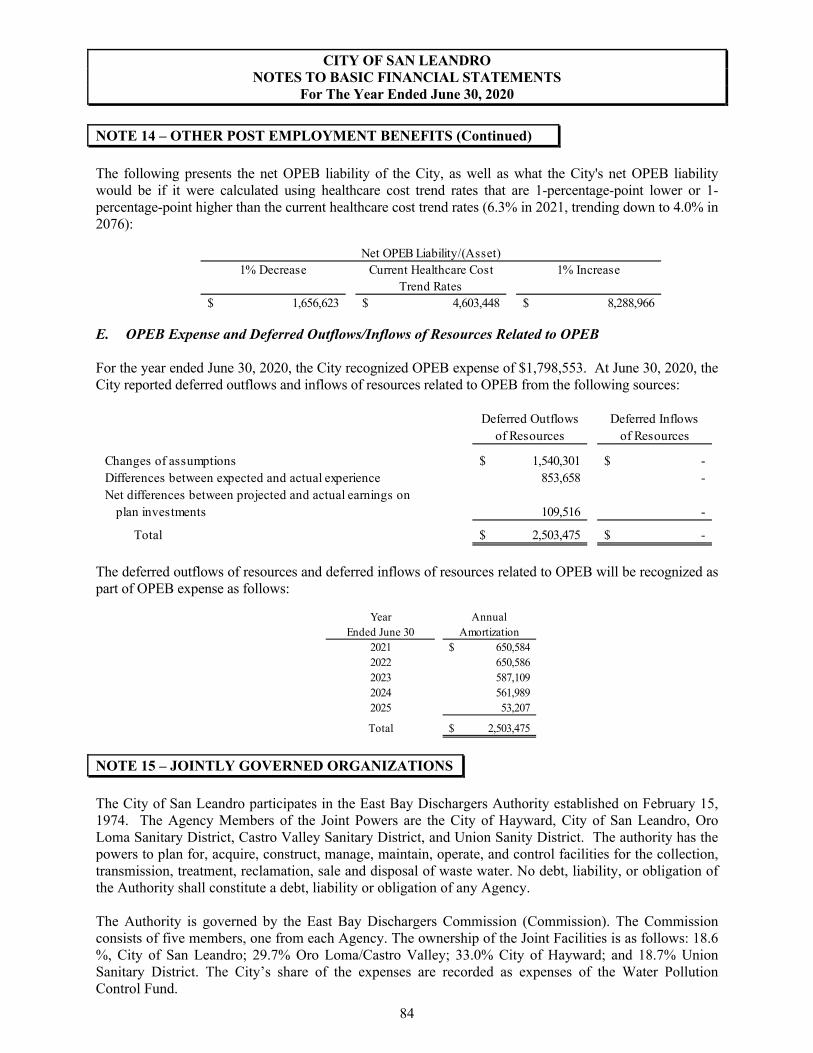
CITY OF SAN LEANDRO NOTES TO BASIC FINANCIAL STATEMENTS
For The Year Ended June 30, 2020
NOTE 14 – OTHER POST EMPLOYMENT BENEFITS (Continued)
The following presents the net OPEB liability of the City, as well as what the City's net OPEB liability would be if it were calculated using healthcare cost trend rates that are 1-percentage-point lower or 1-percentage-point higher than the current healthcare cost trend rates (6.3% in 2021, trending down to 4.0% in 2076):
Net OPEB Liability/(Asset)1% Decrease Current Healthcare Cost 1% Increase
Trend Rates1,656,623$ 4,603,448$ 8,288,966$
E. OPEB Expense and Deferred Outflows/Inflows of Resources Related to OPEB
For the year ended June 30, 2020, the City recognized OPEB expense of $1,798,553. At June 30, 2020, the City reported deferred outflows and inflows of resources related to OPEB from the following sources:
Deferred Outflows Deferred Inflowsof Resources of Resources
Changes of assumptions 1,540,301$ -$ Differences between expected and actual experience 853,658 - Net differences between projected and actual earnings on
plan investments 109,516 -
Total 2,503,475$ -$
The deferred outflows of resources and deferred inflows of resources related to OPEB will be recognized as part of OPEB expense as follows:
Year AnnualEnded June 30 Amortization
2021 650,584$ 2022 650,586 2023 587,109 2024 561,989 2025 53,207
Total 2,503,475$
NOTE 15 – JOINTLY GOVERNED ORGANIZATIONS
The City of San Leandro participates in the East Bay Dischargers Authority established on February 15, 1974. The Agency Members of the Joint Powers are the City of Hayward, City of San Leandro, Oro Loma Sanitary District, Castro Valley Sanitary District, and Union Sanity District. The authority has the powers to plan for, acquire, construct, manage, maintain, operate, and control facilities for the collection, transmission, treatment, reclamation, sale and disposal of waste water. No debt, liability, or obligation of the Authority shall constitute a debt, liability or obligation of any Agency.
The Authority is governed by the East Bay Dischargers Commission (Commission). The Commission consists of five members, one from each Agency. The ownership of the Joint Facilities is as follows: 18.6 %, City of San Leandro; 29.7% Oro Loma/Castro Valley; 33.0% City of Hayward; and 18.7% Union Sanitary District. The City’s share of the expenses are recorded as expenses of the Water Pollution Control Fund.
84

CITY OF SAN LEANDRO NOTES TO BASIC FINANCIAL STATEMENTS
For The Year Ended June 30, 2020
NOTE 16 – SUCCESSOR AGENCY ACTIVITIES
A. Cash and Investments
Cash and Investments at June 30, 2020, consisted of the following:
Statement of net position:
Cash and Investments 4,678,565$
Cash and Investments held by fiscal agents 402
Total cash and investments 4,678,967$
The Successor Agency pools its cash and investment with the City in order to achieve a higher return on investment. Certain restricted funds, which are held and invested by independent custodians through contractual agreements, are not pooled. These restricted funds include cash with fiscal agents.
B. Loan from the City
Plaza Project Area General Fund Loan: On March 7, 2011, the former San Leandro Redevelopment Agency made a scheduled debt service payment of $171,764 in principal and $128,236 in interest for a loan due to the City of San Leandro General Fund from the Plaza Project Area. Subsequently, on March 7, 2011, the Executive Board of the former Agency authorized a payment of $2,137,273 to the City of San Leandro to retire the full remaining balance of this loan. The loan had an initial balance of $2,887,617 and was secured by a Promissory Note executed on December 5, 2002. Although the loan was made for legitimate redevelopment purposes and the repayment was consistent with the requirements of the Promissory Note, the State Department of Finance has asserted that these payments were not made for an approved enforceable obligation and that the funds must be remitted to the Alameda County Auditor-Controller. The City disputed this finding and initiated litigation to resolve this issue. A ruling issued by the Superior Court of California on September 23, 2014 sided with the State Department of Finance on this issue and indicates that the City will be required to remit a payment of $2,437,273 as a “claw back” of General Fund loan payments made after January 1, 2011. While an appeal was pending, the City and the Department of Finance agreed to abide by the initial court ruling on this matter and the Department of Finance ultimately issued a revised determination letter on June 23, 2015 that yielded to the City’s position on other issues but maintained the demand for the $2,437,273 “claw back.” The City made that payment in October 2015, after which the City, as a taxing entity itself, received approximately 12% of the funds. On October 28, 2015, the Successor Agency was issued a finding of Completion, which permits the agency to place loan agreements between the former redevelopment agency and its sponsoring entity on the Recognized Obligation Payment Schedule (ROPS), as an enforceable obligation, provided the oversight board makes a finding that the loan was made for legitimate redevelopment purposes. On January 27, 2016, the Oversight Board made such finding, which was approved by the Department of Finance, and the loan was placed on the 2016-17 ROPS. As of June 30, 2020 the loan was paid off. The General fund will receive $89,456 of interest payment in fiscal year 2020-21.
85

CITY OF SAN LEANDRO NOTES TO BASIC FINANCIAL STATEMENTS
For The Year Ended June 30, 2020
NOTE 16 – SUCCESSOR AGENCY ACTIVITIES (Continued)
C. Capital Assets
The Successor Agency assumed the capital assets of the former Redevelopment Agency as of February 1, 2012. All capital assets are valued at historical cost or estimated historical cost if actual historical cost is not available. Contributed capital assets are valued at their estimated fair market value on the date contributed. The Successor Agency’s policy is to capitalize all assets with costs exceeding certain minimum thresholds and with useful lives exceeding two years. All capital assets with limited useful lives are depreciated over their estimated useful lives. The purpose of depreciation is to spread the cost of capital assets equitably among all users over the life of these assets. The amount charged to depreciation expense each year represents that year’s pro rata share of the cost of capital assets. Depreciation of all capital assets is charged as an expense against operations each year and the total amount of depreciation taken over the years, called accumulated depreciation, is reported on the balance sheet as a reduction in the book value of capital assets.
Balance BalanceJune 30, 2019 Additions Adjustments June 30, 2020
Non-depreciable Assets:Land 706,376$ -$ -$ 706,376$
Depreciable Assets:Buildings and Improvements 711,792 - - 711,792
Total Depreciable Assets 711,792 - - 711,792
Accumulated Depreciation:Buildings and Improvements (300,267) (12,957) 14,236 (298,988)
Total Accumulated Depreciation (300,267) (12,957) 14,236 (298,988)
Depreciable Assets, Net 411,525 (12,957) 14,236 412,804
Total Private PurposeTrust Fund Activity
Capital Assets, Net 1,117,901$ (12,957)$ 14,236$ 1,119,180$
86
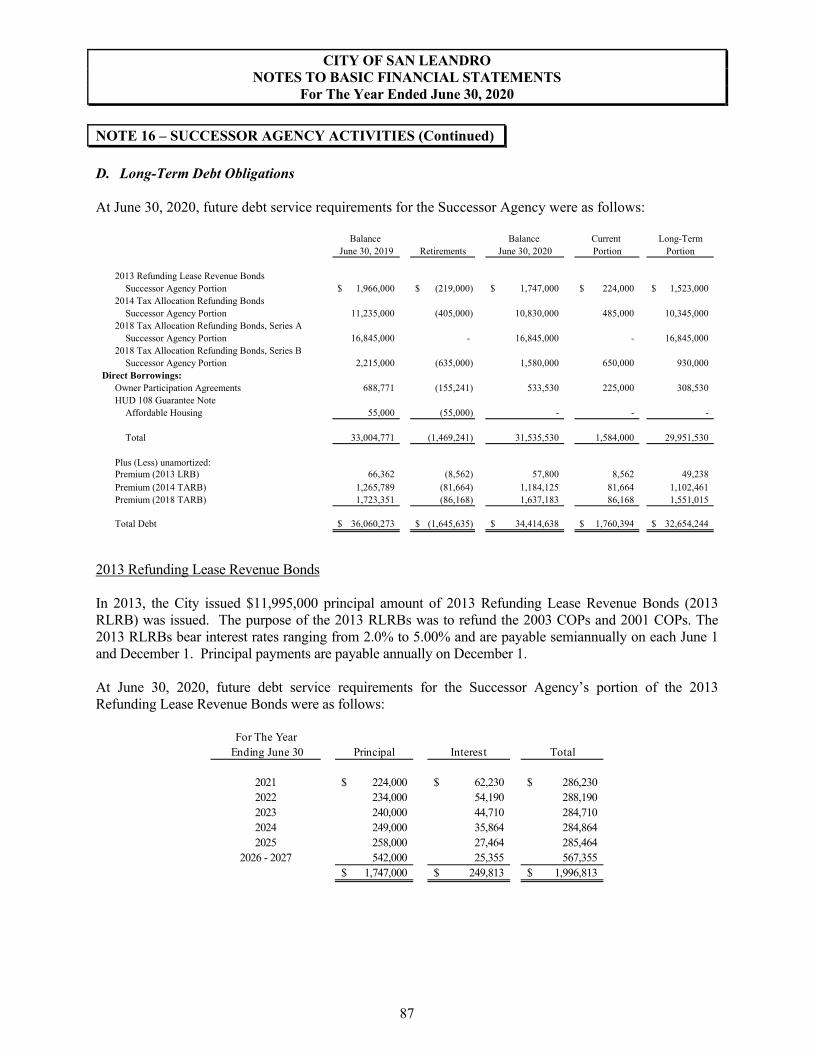
CITY OF SAN LEANDRO NOTES TO BASIC FINANCIAL STATEMENTS
For The Year Ended June 30, 2020
NOTE 16 – SUCCESSOR AGENCY ACTIVITIES (Continued)
D. Long-Term Debt Obligations
At June 30, 2020, future debt service requirements for the Successor Agency were as follows:
Balance Balance Current Long-TermJune 30, 2019 Retirements June 30, 2020 Portion Portion
2013 Refunding Lease Revenue BondsSuccessor Agency Portion 1,966,000$ (219,000)$ 1,747,000$ 224,000$ 1,523,000$
2014 Tax Allocation Refunding BondsSuccessor Agency Portion 11,235,000 (405,000) 10,830,000 485,000 10,345,000
2018 Tax Allocation Refunding Bonds, Series ASuccessor Agency Portion 16,845,000 - 16,845,000 - 16,845,000
2018 Tax Allocation Refunding Bonds, Series BSuccessor Agency Portion 2,215,000 (635,000) 1,580,000 650,000 930,000
Direct Borrowings:Owner Participation Agreements 688,771 (155,241) 533,530 225,000 308,530HUD 108 Guarantee Note
Affordable Housing 55,000 (55,000) - - -
Total 33,004,771 (1,469,241) 31,535,530 1,584,000 29,951,530
Plus (Less) unamortized:Premium (2013 LRB) 66,362 (8,562) 57,800 8,562 49,238Premium (2014 TARB) 1,265,789 (81,664) 1,184,125 81,664 1,102,461Premium (2018 TARB) 1,723,351 (86,168) 1,637,183 86,168 1,551,015
Total Debt 36,060,273$ (1,645,635)$ 34,414,638$ 1,760,394$ 32,654,244$
2013 Refunding Lease Revenue Bonds
In 2013, the City issued $11,995,000 principal amount of 2013 Refunding Lease Revenue Bonds (2013 RLRB) was issued. The purpose of the 2013 RLRBs was to refund the 2003 COPs and 2001 COPs. The 2013 RLRBs bear interest rates ranging from 2.0% to 5.00% and are payable semiannually on each June 1 and December 1. Principal payments are payable annually on December 1.
At June 30, 2020, future debt service requirements for the Successor Agency’s portion of the 2013 Refunding Lease Revenue Bonds were as follows:
For The Year Ending June 30 Principal Interest Total
2021 224,000$ 62,230$ 286,230$ 2022 234,000 54,190 288,1902023 240,000 44,710 284,7102024 249,000 35,864 284,8642025 258,000 27,464 285,464
2026 - 2027 542,000 25,355 567,3551,747,000$ 249,813$ 1,996,813$
87

CITY OF SAN LEANDRO NOTES TO BASIC FINANCIAL STATEMENTS
For The Year Ended June 30, 2020
NOTE 16 – SUCCESSOR AGENCY ACTIVITIES (Continued)
2014 Tax Allocation Refunding Bonds On September 30, 2014, the Successor Agency issued $11,235,000 of Tax Allocation Bonds (2014 TABs) to prepay the 2002 and 2004 Tax Allocation Bonds and to pay issuance costs. The 2014 TABs are payable and secured by a pledge of tax revenues from tax increment generated in the Plaza Project Area and the West San Leandro/MacArthur Boulevard Project Area. The 2014 TABs bear interest rates ranging from 3.5% to 5.00% and are payable semiannually on each Marsh 1st and September 1st. Principal payments are payable on September 1st. Proceeds were deposited in an irrevocable trust with an escrow agent to provide funds to fully redeem, on October 30, 2014, the principal and accrued interest of the 2002 and 2004 Tax Allocation Bonds. As a result, the 2002 and 2004 Tax Allocation Bonds are considered redeemed (current refunding) and the liability for those bonds has been removed from the statement of fiduciary net position. On the date of issuance of the 2014 Bonds, the Successor Agency deposited into the reserve account for the 2014 Bonds a municipal bond debt service insurance policy in the amount of $1,121,078, which is equal to the “Reserve Requirement” for the 2014 Bonds. Neither the balance in the reserve account nor the Reserve Requirement for the 2014 Bonds has changed since such date. At June 30, 2020, future debt service requirements for the 2014 Tax Allocation Refunding Bonds are as follows:
For The Year Ending June 30 Principal Interest Total
2021 485,000$ 505,450$ 990,450$ 2022 675,000 476,450 1,151,4502023 720,000 441,575 1,161,5752024 740,000 405,075 1,145,075
2025 765,000 367,450 1,132,4502026 - 2030 4,130,000 1,235,875 5,365,8752031 - 2035 3,315,000 263,613 3,578,613
10,830,000$ 3,695,488$ 14,525,488$
88
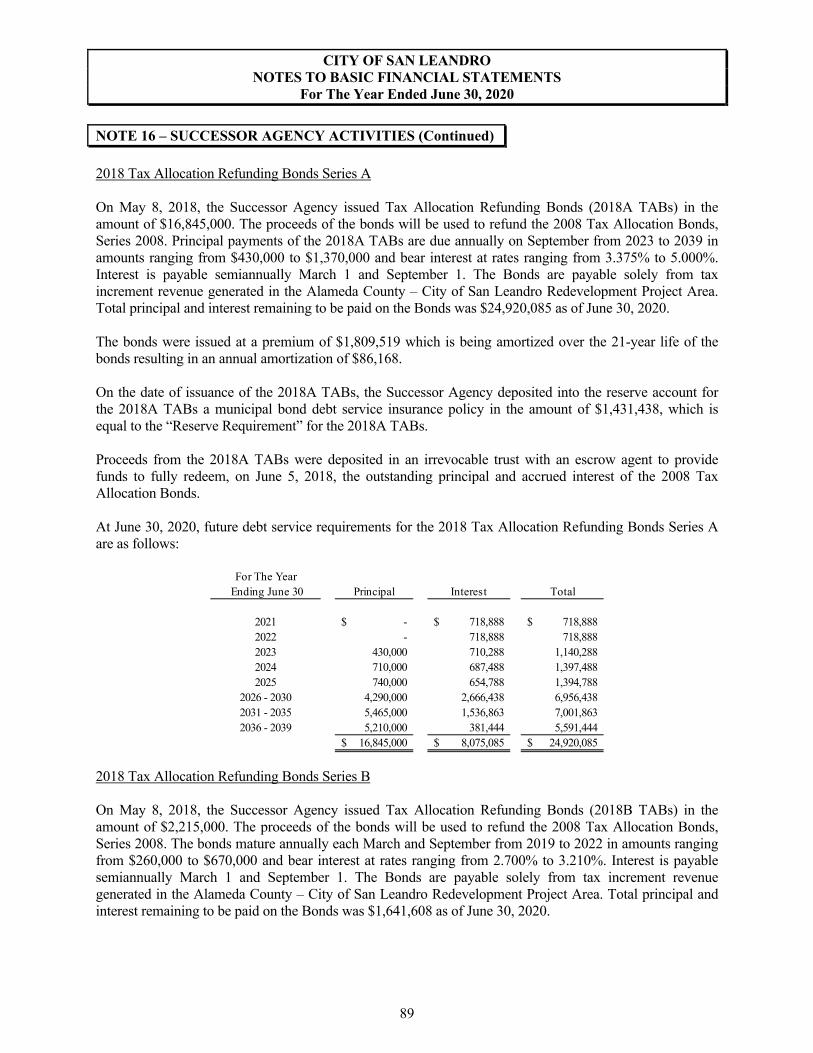
CITY OF SAN LEANDRO NOTES TO BASIC FINANCIAL STATEMENTS
For The Year Ended June 30, 2020
NOTE 16 – SUCCESSOR AGENCY ACTIVITIES (Continued)
2018 Tax Allocation Refunding Bonds Series A
On May 8, 2018, the Successor Agency issued Tax Allocation Refunding Bonds (2018A TABs) in the amount of $16,845,000. The proceeds of the bonds will be used to refund the 2008 Tax Allocation Bonds, Series 2008. Principal payments of the 2018A TABs are due annually on September from 2023 to 2039 in amounts ranging from $430,000 to $1,370,000 and bear interest at rates ranging from 3.375% to 5.000%. Interest is payable semiannually March 1 and September 1. The Bonds are payable solely from tax increment revenue generated in the Alameda County – City of San Leandro Redevelopment Project Area. Total principal and interest remaining to be paid on the Bonds was $24,920,085 as of June 30, 2020.
The bonds were issued at a premium of $1,809,519 which is being amortized over the 21-year life of the bonds resulting in an annual amortization of $86,168.
On the date of issuance of the 2018A TABs, the Successor Agency deposited into the reserve account for the 2018A TABs a municipal bond debt service insurance policy in the amount of $1,431,438, which is equal to the “Reserve Requirement” for the 2018A TABs.
Proceeds from the 2018A TABs were deposited in an irrevocable trust with an escrow agent to provide funds to fully redeem, on June 5, 2018, the outstanding principal and accrued interest of the 2008 Tax Allocation Bonds.
At June 30, 2020, future debt service requirements for the 2018 Tax Allocation Refunding Bonds Series A are as follows:
For The Year Ending June 30 Principal Interest Total
2021 -$ 718,888$ 718,888$ 2022 - 718,888 718,8882023 430,000 710,288 1,140,2882024 710,000 687,488 1,397,4882025 740,000 654,788 1,394,788
2026 - 2030 4,290,000 2,666,438 6,956,4382031 - 2035 5,465,000 1,536,863 7,001,8632036 - 2039 5,210,000 381,444 5,591,444
16,845,000$ 8,075,085$ 24,920,085$
2018 Tax Allocation Refunding Bonds Series B
On May 8, 2018, the Successor Agency issued Tax Allocation Refunding Bonds (2018B TABs) in the amount of $2,215,000. The proceeds of the bonds will be used to refund the 2008 Tax Allocation Bonds, Series 2008. The bonds mature annually each March and September from 2019 to 2022 in amounts ranging from $260,000 to $670,000 and bear interest at rates ranging from 2.700% to 3.210%. Interest is payable semiannually March 1 and September 1. The Bonds are payable solely from tax increment revenue generated in the Alameda County – City of San Leandro Redevelopment Project Area. Total principal and interest remaining to be paid on the Bonds was $1,641,608 as of June 30, 2020.
89

CITY OF SAN LEANDRO NOTES TO BASIC FINANCIAL STATEMENTS
For The Year Ended June 30, 2020
NOTE 16 – SUCCESSOR AGENCY ACTIVITIES (Continued)
Proceeds from the 2018B TABs were deposited in an irrevocable trust with an escrow agent to provide funds to fully redeem, on June 5, 2018, the principal and accrued interest of the 2008 Tax Allocation Bonds.
At June 30, 2020, future debt service requirements for the 2018 Tax Allocation Refunding Bonds Series B are as follows:
For The Year Ending June 30 Principal Interest Total
2021 650,000$ 38,704$ 688,704$ 2022 670,000 18,731 688,7312023 260,000 4,173 264,173
1,580,000$ 61,608$ 1,641,608$
Direct Borrowings
The Agency entered into the following agreements which represent contingency liabilities for the Agency:
Ford Motor Company Owner Participation Agreement
The agreement required the Agency to make annual payment equivalent to 50% of the sales tax generated above a base of $277,000 by the sale of vehicles as part of the Ford Store San Leandro development. The amount due is paid over several years depending on the volume of auto sales at no interest.
HUD 108 Guarantee Note
In 2000, the City received a $1,000,000 20-year federal loan from Housing and Urban Development (HUD 108 Guarantor loan), at an interest rate of 5.6% to finance the acquisition and construction of affordable housing for seniors within the City of San Leandro. The loan is secured and payable from the Agency’s 20% Housing Set-Aside Fund. The debt was assumed by the Successor Agency. As of June 30, 2020, the City has fully paid the Note.
90

REQUIRED SUPPLEMENTARY INFORMATION

CITY OF SAN LEANDRO Notes to Required Supplementary Information
For the year ended June 30, 2020
2014 2015 2016 2017 2018 2019Total Pension LiabilityService Cost 3,921,445$ 3,570,669$ 3,522,248$ 4,044,169$ 4,095,987$ 4,005,467$ Differences between expected and actual experience - (8,034,544) 593,697 (1,248,019) (596,425) 4,908,580 Changes in assumptions - (4,335,946) - 15,476,760 (1,768,314) - Interest 18,796,998 18,867,111 19,495,753 19,808,061 20,204,782 21,089,806 Benefit payments, including refunds of
employee contributions (13,777,288) (14,563,306) (15,016,152) (15,620,511) (16,309,242) (17,262,935)
Net change in total pension liability 8,941,155 (4,496,016) 8,595,546 22,460,460 5,626,788 12,740,918 Total pension liability - beginning 255,554,562 264,495,717 259,999,701 268,595,247 291,055,707 296,682,495 Total pension liability - ending (a) 264,495,717$ 259,999,701$ 268,595,247$ 291,055,707$ 296,682,495$ 309,423,413$
Plan fiduciary net positionContributions - employer 4,594,523$ 5,043,060$ 5,638,865$ 6,399,288$ 6,873,684$ 7,676,172$ Contributions - employee 2,010,061 1,672,356 1,618,186 1,695,139 1,762,858 1,826,595 Net investment income 29,807,971 4,385,312 994,580 20,564,284 16,783,894 13,606,328 Benefit payments, including refunds of employee contributions (13,777,288) (14,563,306) (15,016,152) (15,620,511) (16,309,242) (17,262,935) Plan to Plan Resource Movement - (572) - - (1,934) - Administrative Expense - (217,263) (117,644) (274,840) (309,964) (147,809) Other Miscellaneous Income/(Expense) - - - - (588,627) 483 Net change in plan fiduciary net position 22,635,267 (3,680,413) (6,882,165) 12,763,360 8,210,669 5,698,834 Plan fiduciary net position - beginning 174,078,874 196,714,141 193,033,728 186,151,563 198,914,923 207,125,592 Plan fiduciary net position - ending (b) 196,714,141$ 193,033,728$ 186,151,563$ 198,914,923$ 207,125,592$ 212,824,426$
Net pension liability - ending (a)-(b) 67,781,576$ 66,965,973$ 82,443,684$ 92,140,784$ 89,556,903$ 96,598,987$
Plan fiduciary net position as a percentage of the total pension liability 25.63% 25.76% 30.69% 31.66% 30.19% 31.22%
Covered payroll 20,167,441$ 19,979,507$ 21,037,041$ 21,903,698$ 18,965,111$ 18,814,748$
Plan fiduciary net position as a percentage of covered payroll 336.09% 335.17% 391.90% 420.66% 472.22% 513.42%
Notes to Schedule:
* Fiscal year 2015 was the 1st year of implementation.
Changes in assumptions - GASB 68 paragraph 68 states that the long-termed expected rate of return should be determined net of pension plan investment expense, but without reduction for pension plan administrative expense. In 2018 and 2019 there were no changes. In 2017, the accounting discount rate reduced from 7.65% to 7.15% from 7.5% (net of administrative expense) to 7.65% (without a reduction of pension plan administrative expense) In 2014 amounts were based on the 7.5% discount rate. All other assumptions for the June 30, 2014 measurement dates were the same as those used for the June 30, 2015 and 2016 measurement dates.
Benefit changes - The figures above do not include any liability impact that may have resulted from plan changes which occurred after the June 30, 2016 actuarial valuationdate. This applies for voluntary benefit changes as well as any offers of Two Years Additional Service Credit (a.k.a. Golden Handshakes).
City of San LeandroAgent Multiple Employer Defined Benefit Retirement Plan - Miscellaneous Plan
As of fiscal year ending June 30, 2020SCHEDULE OF CHANGES IN THE NET PENSION LIABILITY AND RELATED RATIOS
Last 10 Years*
92
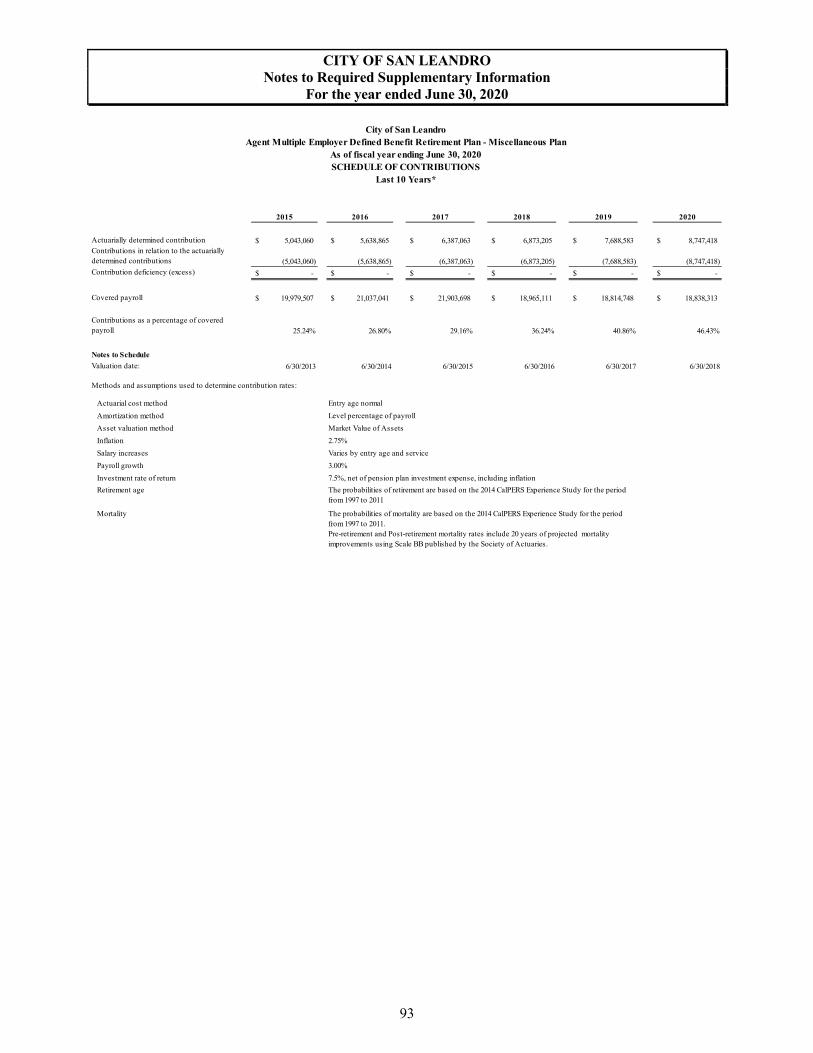
CITY OF SAN LEANDRO Notes to Required Supplementary Information
For the year ended June 30, 2020
2015 2016 2017 2018 2019 2020
Actuarially determined contribution 5,043,060$ 5,638,865$ 6,387,063$ 6,873,205$ 7,688,583$ 8,747,418$ Contributions in relation to the actuarially determined contributions (5,043,060) (5,638,865) (6,387,063) (6,873,205) (7,688,583) (8,747,418) Contribution deficiency (excess) -$ -$ -$ -$ -$ -$
Covered payroll 19,979,507$ 21,037,041$ 21,903,698$ 18,965,111$ 18,814,748$ 18,838,313$
Contributions as a percentage of covered payroll 25.24% 26.80% 29.16% 36.24% 40.86% 46.43%
Notes to Schedule
Valuation date: 6/30/2013 6/30/2014 6/30/2015 6/30/2016 6/30/2017 6/30/2018
Methods and assumptions used to determine contribution rates:
Entry age normal
Level percentage of payroll
Market Value of Assets
2.75%
Varies by entry age and service
3.00%
7.5%, net of pension plan investment expense, including inflation
Mortality
Salary increases
Payroll growth
Investment rate of return
Inflation
Actuarial cost method
Amortization method
Retirement age
Asset valuation method
The probabilities of mortality are based on the 2014 CalPERS Experience Study for the period from 1997 to 2011. Pre-retirement and Post-retirement mortality rates include 20 years of projected mortality improvements using Scale BB published by the Society of Actuaries.
The probabilities of retirement are based on the 2014 CalPERS Experience Study for the period from 1997 to 2011
City of San LeandroAgent Multiple Employer Defined Benefit Retirement Plan - Miscellaneous Plan
As of fiscal year ending June 30, 2020SCHEDULE OF CONTRIBUTIONS
Last 10 Years*
93
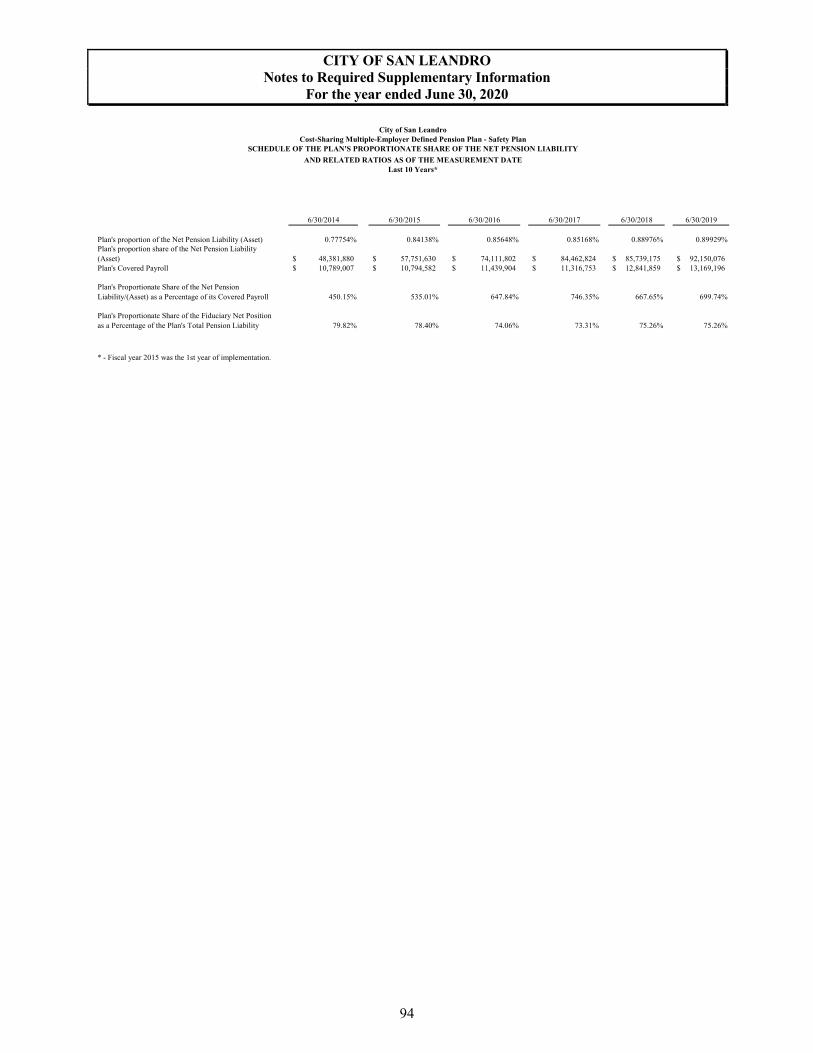
CITY OF SAN LEANDRO Notes to Required Supplementary Information
For the year ended June 30, 2020
6/30/2014 6/30/2015 6/30/2016 6/30/2017 6/30/2018 6/30/2019
Plan's proportion of the Net Pension Liability (Asset) 0.77754% 0.84138% 0.85648% 0.85168% 0.88976% 0.89929%Plan's proportion share of the Net Pension Liability (Asset) 48,381,880$ 57,751,630$ 74,111,802$ 84,462,824$ 85,739,175$ 92,150,076$ Plan's Covered Payroll 10,789,007$ 10,794,582$ 11,439,904$ 11,316,753$ 12,841,859$ 13,169,196$
Plan's Proportionate Share of the Net Pension Liability/(Asset) as a Percentage of its Covered Payroll 450.15% 535.01% 647.84% 746.35% 667.65% 699.74%
Plan's Proportionate Share of the Fiduciary Net Position as a Percentage of the Plan's Total Pension Liability 79.82% 78.40% 74.06% 73.31% 75.26% 75.26%
* - Fiscal year 2015 was the 1st year of implementation.
City of San LeandroCost-Sharing Multiple-Employer Defined Pension Plan - Safety Plan
SCHEDULE OF THE PLAN'S PROPORTIONATE SHARE OF THE NET PENSION LIABILITY
AND RELATED RATIOS AS OF THE MEASUREMENT DATELast 10 Years*
94
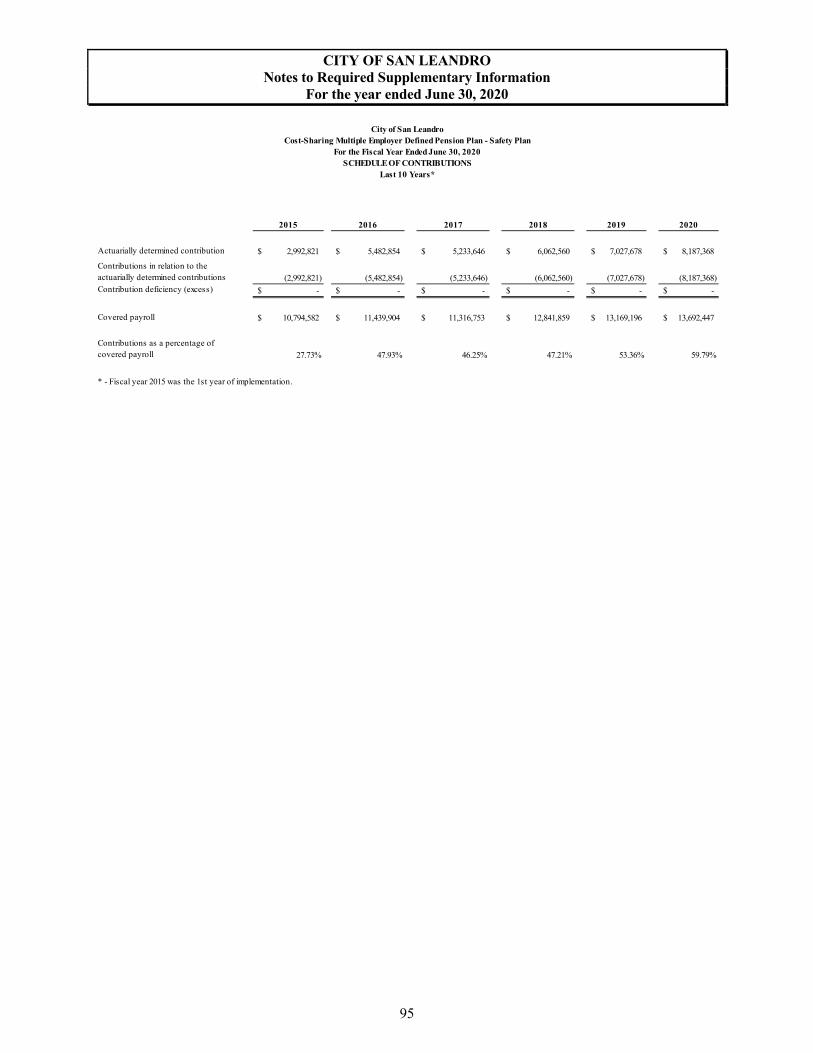
CITY OF SAN LEANDRO Notes to Required Supplementary Information
For the year ended June 30, 2020
2015 2016 2017 2018 2019 2020
Actuarially determined contribution 2,992,821$ 5,482,854$ 5,233,646$ 6,062,560$ 7,027,678$ 8,187,368$
Contributions in relation to the actuarially determined contributions (2,992,821) (5,482,854) (5,233,646) (6,062,560) (7,027,678) (8,187,368) Contribution deficiency (excess) -$ -$ -$ -$ -$ -$
Covered payroll 10,794,582$ 11,439,904$ 11,316,753$ 12,841,859$ 13,169,196$ 13,692,447$
Contributions as a percentage of covered payroll 27.73% 47.93% 46.25% 47.21% 53.36% 59.79%
* - Fiscal year 2015 was the 1st year of implementation.
City of San LeandroCost-Sharing Multiple Employer Defined Pension Plan - Safety Plan
For the Fiscal Year Ended June 30, 2020SCHEDULE OF CONTRIBUTIONS
Last 10 Years*
95
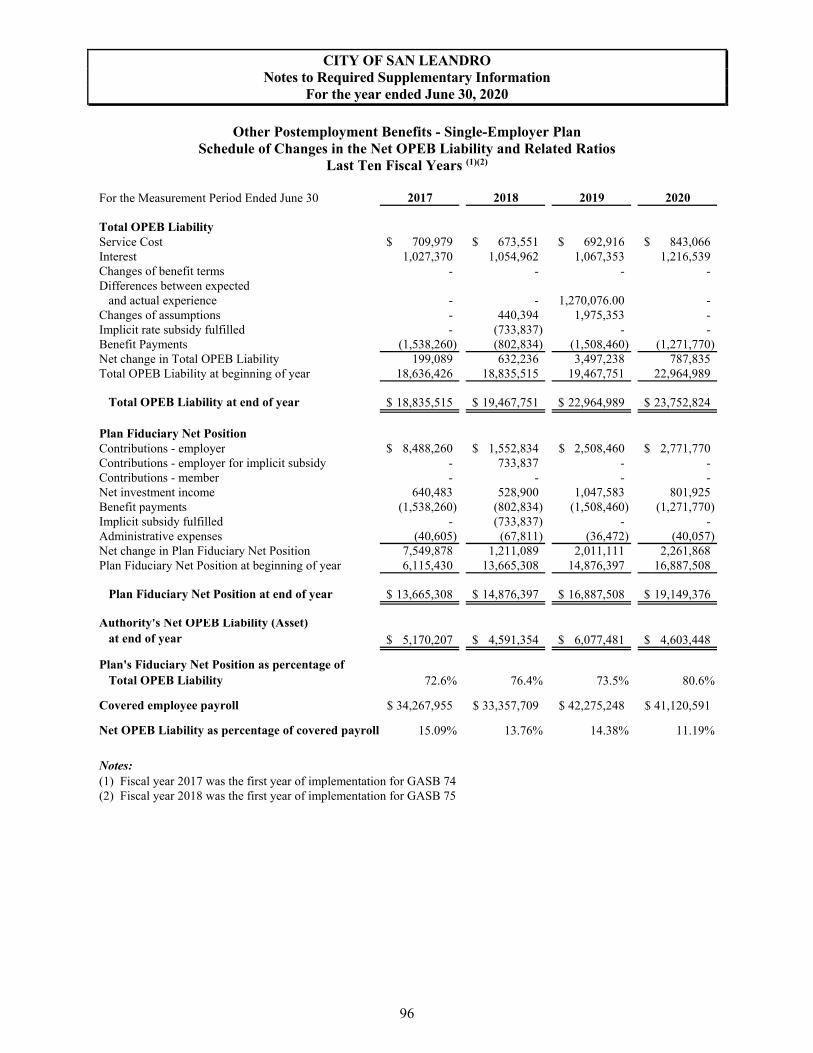
CITY OF SAN LEANDRO Notes to Required Supplementary Information
For the year ended June 30, 2020
Other Postemployment Benefits - Single-Employer Plan Schedule of Changes in the Net OPEB Liability and Related Ratios
Last Ten Fiscal Years (1)(2)
For the Measurement Period Ended June 30 2017 2018 2019 2020
Total OPEB LiabilityService Cost 709,979$ 673,551$ 692,916$ 843,066$ Interest 1,027,370 1,054,962 1,067,353 1,216,539Changes of benefit terms - - - -Differences between expected and actual experience - - 1,270,076.00 -Changes of assumptions - 440,394 1,975,353 -Implicit rate subsidy fulfilled - (733,837) - -Benefit Payments (1,538,260) (802,834) (1,508,460) (1,271,770)Net change in Total OPEB Liability 199,089 632,236 3,497,238 787,835Total OPEB Liability at beginning of year 18,636,426 18,835,515 19,467,751 22,964,989
Total OPEB Liability at end of year 18,835,515$ 19,467,751$ 22,964,989$ 23,752,824$
Plan Fiduciary Net PositionContributions - employer 8,488,260$ 1,552,834$ 2,508,460$ 2,771,770$ Contributions - employer for implicit subsidy - 733,837 - -Contributions - member - - - -Net investment income 640,483 528,900 1,047,583 801,925Benefit payments (1,538,260) (802,834) (1,508,460) (1,271,770)Implicit subsidy fulfilled - (733,837) - -Administrative expenses (40,605) (67,811) (36,472) (40,057)Net change in Plan Fiduciary Net Position 7,549,878 1,211,089 2,011,111 2,261,868Plan Fiduciary Net Position at beginning of year 6,115,430 13,665,308 14,876,397 16,887,508
Plan Fiduciary Net Position at end of year 13,665,308$ 14,876,397$ 16,887,508$ 19,149,376$
Authority's Net OPEB Liability (Asset) at end of year 5,170,207$ 4,591,354$ 6,077,481$ 4,603,448$
Plan's Fiduciary Net Position as percentage of Total OPEB Liability 72.6% 76.4% 73.5% 80.6%
Covered employee payroll 34,267,955$ 33,357,709$ 42,275,248$ 41,120,591$
Net OPEB Liability as percentage of covered payroll 15.09% 13.76% 14.38% 11.19%
Notes:(1) Fiscal year 2017 was the first year of implementation for GASB 74(2) Fiscal year 2018 was the first year of implementation for GASB 75
96

CITY OF SAN LEANDRO Notes to Required Supplementary Information
For the year ended June 30, 2020
Other Postemployment Benefits - Single-Employer Plan Schedule of Contributions
Last Ten Fiscal Years (1)(2)
Fiscal Year Ended June 30, 2017 2018 2019 2020
Actuarially determined contribution 892,618$ 1,121,087$ 1,027,403$ 1,359,000$ Contributions in relation to the
actuarially determined contribution (7,788,327) (2,286,671) (2,508,460) (2,771,770)
Contribution deficiency (excess) (6,895,709)$ (1,165,584)$ (1,481,057)$ (1,412,770)$
Covered-employee payroll 34,267,955$ 33,357,709$ 42,275,248$ 41,120,591$
Contributions as a percentage ofcovered-employee payroll 22.73% 6.86% 5.93% 6.74%
Notes:(1) Fiscal year 2017 was the first year of implementation for GASB 74(2) Fiscal year 2018 was the first year of implementation for GASB 75
97
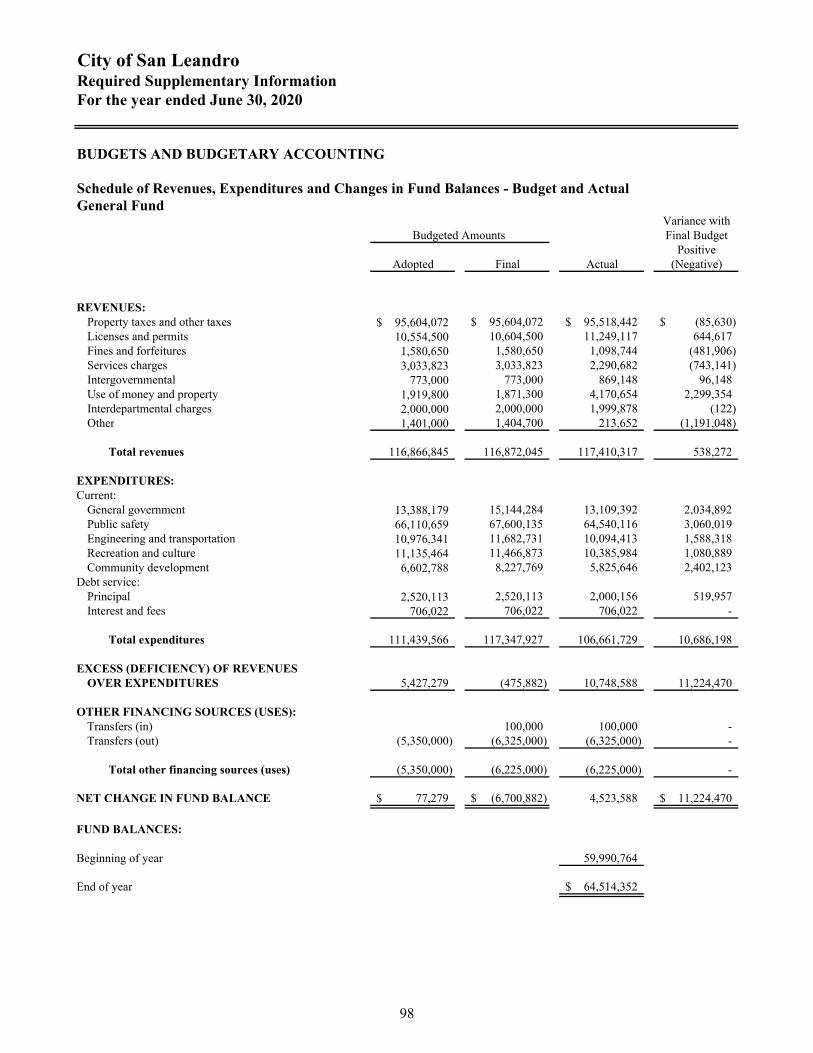
City of San LeandroRequired Supplementary InformationFor the year ended June 30, 2020
BUDGETS AND BUDGETARY ACCOUNTING
Schedule of Revenues, Expenditures and Changes in Fund Balances - Budget and Actual General Fund
Variance withBudgeted Amounts Final Budget
PositiveAdopted Final Actual (Negative)
REVENUES:Property taxes and other taxes 95,604,072$ 95,604,072$ 95,518,442$ (85,630)$ Licenses and permits 10,554,500 10,604,500 11,249,117 644,617 Fines and forfeitures 1,580,650 1,580,650 1,098,744 (481,906) Services charges 3,033,823 3,033,823 2,290,682 (743,141) Intergovernmental 773,000 773,000 869,148 96,148 Use of money and property 1,919,800 1,871,300 4,170,654 2,299,354 Interdepartmental charges 2,000,000 2,000,000 1,999,878 (122)Other 1,401,000 1,404,700 213,652 (1,191,048)
Total revenues 116,866,845 116,872,045 117,410,317 538,272
EXPENDITURES:Current:
General government 13,388,179 15,144,284 13,109,392 2,034,892 Public safety 66,110,659 67,600,135 64,540,116 3,060,019 Engineering and transportation 10,976,341 11,682,731 10,094,413 1,588,318 Recreation and culture 11,135,464 11,466,873 10,385,984 1,080,889 Community development 6,602,788 8,227,769 5,825,646 2,402,123
Debt service:Principal 2,520,113 2,520,113 2,000,156 519,957 Interest and fees 706,022 706,022 706,022 -
Total expenditures 111,439,566 117,347,927 106,661,729 10,686,198
EXCESS (DEFICIENCY) OF REVENUESOVER EXPENDITURES 5,427,279 (475,882) 10,748,588 11,224,470
OTHER FINANCING SOURCES (USES):Transfers (in) 100,000 100,000 -Transfers (out) (5,350,000) (6,325,000) (6,325,000) -
Total other financing sources (uses) (5,350,000) (6,225,000) (6,225,000) -
NET CHANGE IN FUND BALANCE 77,279$ (6,700,882)$ 4,523,588 11,224,470$
FUND BALANCES:
Beginning of year 59,990,764
End of year 64,514,352$
98

CITY OF SAN LEANDRO Notes to Required Supplementary Information
For the year ended June 30, 2020
Budgets and Budgetary Accounting
The City adopts a biennial budget annually for all governmental fund types. This budget is effective July 1 through June 30 for each of the ensuing fiscal years. The second year of the biennial budget is amended during the mid-biennial budget cycle process. From the effective date of the budget, which is adopted and controlled at the department level, the amounts stated therein as proposed expenditures become appropriations to the various City departments. The City Council may amend the budget by resolution during the fiscal year. The City Manager is authorized to transfer budgeted amounts between departments and line items within any fund; however, any revisions that alter the total expenditures of any fund must be approved by the City Council. Transfers between funds must be approved by the City Council. All appropriations lapse at year-end, unless otherwise authorized by the City Council and the City Manager, except for capital improvement funds for which appropriations may be carried over for not more than five (5) fiscal years as per the City of San Leandro Charter, Section 520. The City did not budget Proposition1B – Local Streets and Roads Fund and Housing In Lieu Fund.
Annual budgets are adopted on a basis consistent with generally accepted accounting principles except for capital projects funds, which are adopted on a project length basis, which means budgets, are used until the project’s completion, not to exceed five fiscal years, for the entire project amount.
Under encumbrance accounting, purchase orders, contracts and other commitments for the expenditures of monies are recorded in order to reserve that portion of the applicable appropriation. Encumbrance accounting is employed as an extension of the formal budgetary process. Encumbrances outstanding at year-end are carried over to the next fiscal year as part of that year’s budget resolution.
GAAP serves as the budgetary basis of accounting.
99


SUPPLEMENTARY INFORMATION

City of San LeandroSchedule of Revenues, Expenditures and Changes in Fund Balances - Budget and Actual -
Major Governmental Fund
For the year ended June 30, 2020
VarianceFinal Positive
Budget Actual (Negative)
REVENUES:
Service charges 70,500$ 62,490$ (8,010)$ Use of money and property 100 1,002 902
Total revenues 70,600 63,492 (7,108)
EXPENDITURES:
Current:Engineering and transportation 15,129,905 1,291,555 13,838,350 Recreation and culture 2,500,000 - 2,500,000Community development 35,411,506 6,858,965 28,552,541
Total expenditures 53,041,411 8,150,520 44,890,891
REVENUES OVER (UNDER) EXPENDITURES (52,970,811) (8,087,028) 44,883,783
OTHER FINANCING SOURCES (USES):
Transfer in 6,275,000 6,275,000 - Transfer out (100,000) (100,000) -
Total other financing sources (uses) 6,175,000 6,175,000 -
NET CHANGE IN FUND BALANCES (46,795,811)$ (1,912,028) 44,883,783$
FUND BALANCES:
Beginning of year 46,282,419
End of year 44,370,391$
Capital Improvement Capital Projects Fund
102
NON-MAJOR GOVERNMENTAL FUNDS
SPECIAL REVENUE FUNDS
Affordable Housing Asset Fund – This fund accounts for assets received from affordable housing activities from the former Redevelopment Agency’s Low/Moderate Housing Fund and acts as its Successor Agency.
Street/Traffic Improvements – This fund accounts for development fee assessments levied to provide for partial funding of street and traffic improvements associated with commercial and residential growth.
Park Development Fee – This fund accounts for park development fee assessments levied to provide for partial funding for park development needs associated with residential growth.
Underground Utilities Fees – This fund accounts for utility conversion project assessments levied to provide for the placement of overhead facilities underground. Assessment shall be expended only for expansion of, maintenance of or construction of Underground Utility Districts and facilities.
Parking – This fund accounts for parking meter and parking lot collections for maintenance of downtown parking facilities and other public parking locations.
Special Gas Tax – This fund accounts for revenues and expenditures received from the State of California under Street and Highways Code. The allocations must be spent for street maintenance and construction and a limited amount for engineering.
Cherrywood Maintenance District – This fund is used to account for the special assessment funding for the on-going maintenance of public facilities at the Cherrywood development.
Measure B Paratransit – This fund accounts for the City’s share of proceeds of a one-half cent sales tax increase originally approved by the voters in November 1986. The program is administered by the Alameda County Transportation Authority. The tax provides funds for AC transit and paratransit operations.
Asset Seizure – This fund accounts for funds received from asset forfeiture and used for public safety purposes.
Heron Bay – This fund accounts for maintenance assessments to fund ongoing maintenance of wetlands impacted by residential growth.
Proposition IB Local Streets & Roads – This fund accounts for Proposition IB funds for safety improvements and repairs to local streets and roads.
Special Grants – This fund accounts for various grants from the State of California and the Federal Government to be expended for a specific purpose, activity or facility.
Measure B – This fund accounts for the City's share of proceeds on a one-half cent sales tax increase originally approved by the voters in November 1986. The program is administered by the Alameda County Transportation Authority. The tax provides funds for eight specific projects within Alameda County including major freeway improvements and a major rail extension.
103
NON-MAJOR GOVERNMENTAL FUNDS (Continued)
SPECIAL REVENUE FUNDS (Continued)
Measure BB – This fund accounts for the City's share of revenues earned and expenditure incurred under the City paratransit, streets and roads, and bike and pedestrian programs.
Measure F – This fund accounts for the City's share of proceeds on a $10 increase in Vehicle Registration fees originally approved by the voters in November 2010. The program is administered by the Alameda County Transportation Authority. The tax provides funds for projects to reduce traffic congestion and vehicle related pollution.
C.D.B.G. – This fund accounts for federally funded grants through the Community Development BlockGrant Program from the U.S. Department of Housing and Urban Development.
HOME – This fund accounts for federally funded grants from the U.S. Department of Housing and Urban Development to provide for community housing renovation programs.
Housing In-Lieu – This fund accounts for Housing In-Lieu assessments levied to provide for partial funding of low/moderate housing projects.
Business Improvement District – This fund accounts for service fees charged to business owners to provide a shuttle service from BART to the downtown business district.
Public Education & Government (PEG) Fund – This fund accounts for the Digital Infrastructure and Video Competition Act (DIVCA) of 2006, collecting 1% of gross revenues from state franchise holders. The fund accounts for user fees charged to cable television customers to provide public education on government programs.
DEBT SERVICE FUND
Special Assessment District – This fund accumulates monies for payments of special assessment bonds which are financed by assessments placed on the Alameda County tax roll.
San Leandro Public Financing Authority Debt Service Fund – This fund accounts for the Certificates of Participation issued for the library and fire stations seismic retrofit. These Certificates of Participation were refunded by the issuance of the 2016 Lease Revenue Bonds. The debt will be paid back pursuant to lease agreements between the City of San Leandro and the San Leandro Public Finance Authority.
CAPITAL PROJECTS FUNDS
San Leandro Hillside Geological Hazardous Abatement District (GHAD) – This fund is used to account for the finances of the collaborative between the City of San Leandro and the Geological Hazardous Abatement.
104


City of San LeandroCombining Balance SheetNon-Major Governmental Funds
Affordable Park Underground Housing Street/ Traffic Development Utility
Asset Fund Improvements Fee Fee Parking
Cash and investments 1,281,736$ 2,009,684$ 1,338,246$ 3,016,728$ 270,378$ Receivables:
Accounts 3,684 - - - - Federal, State, and local grants - - - - - Interest 5,998 5,936 2,342 9,577 615 Special assessments - - - - - Loans 1,170,572 - - - -
Total Assets 2,461,990$ 2,015,620$ 1,340,588$ 3,026,305$ 270,993$
Accounts payable 603$ 31,295$ 98,959$ -$ 4,568$ Due to other funds - - - - -
Total Liabilities 603 31,295 98,959 - 4,568
Unavailable revenue - grants receivable - - - - -
Total Deferred Inflow of resources - - - - -
Fund Balances:Restricted 2,461,387 1,984,325 1,241,629 3,026,305 266,425 Unassigned - - - - -
Total Fund Balances 2,461,387 1,984,325 1,241,629 3,026,305 266,425
Total Liabilities, Deferred Inflow of
Resources and Fund Balances 2,461,990$ 2,015,620$ 1,340,588$ 3,026,305$ 270,993$
(Continued)
DEFERRED INFLOW OF RESOURCES
June 30, 2020
ASSETS
LIABILITIES
Special Revenue Funds
106

Cherrywood Proposition IBSpecial Maintenance Measure B Asset Local Streets Special Gas Tax District Paratransit Seizure Heron Bay & Roads Grants Measure B
1,360,683$ 461,432$ 599,703$ 1,414,576$ 823,674$ 14,048$ 842,042$ 1,811,613$
237,573 - - - - - 96,274 7,417 - - 22,134 - - - 2,447,629 313,053
3,986 1,427 1,201 4,176 2,385 45 - 4,454 - - - - 809 - - - - - - - - - - -
1,602,242$ 462,859$ 623,038$ 1,418,752$ 826,868$ 14,093$ 3,385,945$ 2,136,537$
429,724$ -$ 32,333$ 5,193$ 5,636$ -$ 104,730$ 100,663$ 265,000 - - - - - - -
694,724 - 32,333 5,193 5,636 - 104,730 100,663
- - - - - - 2,469,763 -
- - - - - - 2,469,763 -
907,518 462,859 590,705 1,413,559 821,232 14,093 811,452 2,035,874 - - - - - - - -
907,518 462,859 590,705 1,413,559 821,232 14,093 811,452 2,035,874
1,602,242$ 462,859$ 623,038$ 1,418,752$ 826,868$ 14,093$ 3,385,945$ 2,136,537$
(Continued)
Special Revenue Funds
107

City of San LeandroCombining Balance SheetNon-Major Governmental Funds
Housing Measure BB Measure F C.D.B.G. HOME In-Lieu
Cash and investments 200,975$ 1,081,970$ 267,465$ 714,898$ 261,980$ Receivables:
Accounts 276,609 85,538 - 64,624 - Federal, State, and local grants - - - - - Interest - 3,284 - 2,064 838 Special assessments - - - - - Loans - - - - -
Total Assets 477,584$ 1,170,792$ 267,465$ 781,586$ 262,818$
Accounts payable 103,721$ 48,312$ 196,250$ -$ -$ Due to other funds - - - - -
Total Liabilities 103,721 48,312 196,250 - -
DEFERRED INFLOW OF RESOURCES
Unavailable revenue - grants receivable - - - - -
Total Deferred Inflow of resources - - - - -
Fund Balances:Restricted 373,863 1,122,480 71,215 781,586 262,818 Unassigned - - - - -
Total Fund Balances 373,863 1,122,480 71,215 781,586 262,818
Total Liabilities, Deferred Inflow of
Resources and Fund Balances 477,584$ 1,170,792$ 267,465$ 781,586$ 262,818$
(Continued)
Special Revenue Funds
ASSETS
LIABILITIES
June 30, 2020
108

Capital ProjectsSpecial Revenue Funds Debt Service Funds Fund
TotalBusiness Public Special San Leandro Non-Major
Improvement Education and Assessment Public Financing GovernmentalDistrict Government District Authority GHAD Funds
133,791$ 1,030,529$ 121$ 435,313$ 13,622$ 19,385,207$
32,500 41,432 - - - 845,651 - - - - - 2,782,816
702 3,468 - - - 52,498 96 - - - - 905
- - - - - 1,170,572
167,089$ 1,075,429$ 121$ 435,313$ 13,622$ 24,237,649$
-$ 238,599$ -$ -$ -$ 1,400,586$ - - - - - 265,000
- 238,599 - - - 1,665,586
- - - - - 2,469,763
- - - - - 2,469,763
167,089 836,830 121 435,313 13,622 20,102,300 - - - - - -
167,089 836,830 121 435,313 13,622 20,102,300
167,089$ 1,075,429$ 121$ 435,313$ 13,622$ 24,237,649$
109

City of San LeandroCombining Statement of Revenues, Expenditures and Changes in Fund BalancesNon-Major Governmental FundsFor the year ended June 30, 2020
Affordable Park Underground Housing Street/Traffic Development Utility
Asset Fund Improvements Fee Fee Parking
REVENUES:Property and other taxes -$ -$ -$ -$ -$ Licenses and permits - 301,736 - - 342,739 Service charges - - - 46,232 - Fines and forfeitures - - - - 397,107 Intergovernmental - - - - - Use of money and property 115,193 60,207 27,486 99,284 6,260 Other - - 1,303,874 - -
Total Revenues 115,193 361,943 1,331,360 145,516 746,106
EXPENDITURES:
Current:Public safety - - - - - Engineering and transportation - 80,069 - 32,637 562,215 Recreation and culture - - 585,324 - - Community development 3,183 - - - -
Debt service:Principal - - - - - Interest and fees - - - - -
Total Expenditures 3,183 80,069 585,324 32,637 562,215
REVENUES OVER(UNDER) EXPENDITURES 112,010 281,874 746,036 112,879 183,891
OTHER FINANCING SOURCES:Transfer in - - - - - Transfer out - - - - -
Total Other Financing Sources - - - - -
NET CHANGE IN FUND BALANCES 112,010 281,874 746,036 112,879 183,891
FUND BALANCES:
Beginning of year 2,349,377 1,702,451 495,593 2,913,426 82,534
End of year 2,461,387$ 1,984,325$ 1,241,629$ 3,026,305$ 266,425$
(Continued)
Special Revenue Funds
110

Special Revenue Funds
Cherrywood Proposition IBSpecial Maintenance Measure B Asset Local Streets Special Gas Tax District Paratransit Seizure Heron Bay & Roads Grants Measure B
-$ 26,042$ -$ -$ 374,273$ -$ -$ -$ - - - - - - - - - - - - - - - - - - - - - - - -
3,489,416 - 317,009 311,553 - - 1,035,734 1,890,886 40,896 14,775 5,870 42,133 22,751 456 - 38,311
672 - - - - - 5,113 -
3,530,984 40,817 322,879 353,686 397,024 456 1,040,847 1,929,197
- - - 23,724 - - 144,905 - 4,094,756 440 276,400 - 306,757 - 260,626 1,237,192
- - - - - - 28,073 - - - - - - - 42,392 -
- - - - - - - - - - - - 3,405 - - -
4,094,756 440 276,400 23,724 310,162 - 475,996 1,237,192
(563,772) 40,377 46,479 329,962 86,862 456 564,851 692,005
- - - - - - - - (110,090) - - - - - - -
(110,090) - - - - - - -
(673,862) 40,377 46,479 329,962 86,862 456 564,851 692,005
1,581,380 422,482 544,226 1,083,597 734,370 13,637 246,601 1,343,869
907,518$ 462,859$ 590,705$ 1,413,559$ 821,232$ 14,093$ 811,452$ 2,035,874$
(Continued)
111

City of San LeandroCombining Statement of Revenues, Expenditures and Changes in Fund BalancesNon-Major Governmental FundsFor the year ended June 30, 2020
Housing Measure BB Measure F C.D.B.G. HOME In-Lieu
REVENUES:Property and other taxes -$ -$ -$ -$ -$ Licenses and permits - - - - - Service charges - - - - - Fines and forfeitures - - - - - Intergovernmental 11,059,178 483,729 600,479 132,664 - Use of money and property (363) 34,701 8,500 22,300 8,535 Other - - 16,500 133,771 -
Total Revenues 11,058,815 518,430 625,479 288,735 8,535
EXPENDITURES:
Current:Public safety - - - - - Engineering and transportation 10,038,261 506,312 - - - Recreation and culture - - - - - Community development - - 674,268 23,625 -
Debt service:Principal - - 132,000 - - Interest and fees - - 55,414 - -
Total Expenditures 10,038,261 506,312 861,682 23,625 -
REVENUES OVER(UNDER) EXPENDITURES 1,020,554 12,118 (236,203) 265,110 8,535
OTHER FINANCING SOURCES:Transfer in - - - - - Transfer out - - - - -
Total Other Financing Sources - - - - -
NET CHANGE IN FUND BALANCES 1,020,554 12,118 (236,203) 265,110 8,535
FUND BALANCES:
Beginning of year (646,691) 1,110,362 307,418 516,476 254,283
End of year 373,863$ 1,122,480$ 71,215$ 781,586$ 262,818$
(Continued)
Special Revenue Funds
112

Capital Projects Debt Service Funds Fund
TotalBusiness Public Special San Leandro Nonmajor
Improvement Education and Assessment Public Financing GovernmentalDistrict Government District Authority GHAD Funds
-$ 171,068$ -$ -$ -$ 571,383$ 355,607 - - - - 1,000,082
- - - - - 46,232 - - - - - 397,107
362,859 - - - - 19,683,507 7,562 38,874 - 3,185,604 - 3,779,335
- - - - - 1,459,930
726,028 209,942 - 3,185,604 - 26,937,576
- - - - - 168,629 - - - - - 17,395,665 - - - - - 613,397
850,000 421,328 - - - 2,014,796
- - - 1,536,000 - 1,668,000 - - - 1,652,914 - 1,711,733
850,000 421,328 - 3,188,914 - 23,572,220
(123,972) (211,386) - (3,310) - 3,365,356
50,000 - - - - 50,000 - - - - - (110,090)
50,000 - - - - (60,090)
(73,972) (211,386) - (3,310) - 3,305,266
241,061 1,048,216 121 438,623 13,622 16,797,034
167,089$ 836,830$ 121$ 435,313$ 13,622$ 20,102,300$
Special Revenue Funds
113

City of San LeandroSchedule of Revenues, Expenditures and Changes in Fund Balances - Budget and Actual -
Non Major Governmental FundAffordable Housing Asset Special Revenue FundFor the year ended June 30, 2020
VarianceFinal Positive
Budget Actual (Negative)
REVENUES:
Use of money and property 60,000$ 115,193$ 55,193$ Other 140,000 - (140,000)
Total Revenues 200,000 115,193 (84,807)
EXPENDITURES:
Current:Community development 2,999 3,183 (184)
Total Expenditures 2,999 3,183 (184)
NET CHANGE IN FUND BALANCES 197,001$ 112,010 (84,991)$
FUND BALANCES:
Beginning of year 2,349,377
End of year 2,461,387$
114

City of San LeandroSchedule of Revenues, Expenditures and Changes in Fund Balances - Budget and Actual -
Non Major Governmental FundStreet/Traffic Improvements Special Revenue FundFor the year ended June 30, 2020
VarianceFinal Positive
Budget Actual (Negative)
REVENUES:
Licenses and permits 400,000$ 301,736$ (98,264)$ Use of money and property - 60,207 60,207
Total Revenues 400,000 361,943 (38,057)
EXPENDITURES:
Current:Engineering and transportation 1,064,573 80,069 984,504
Total Expenditures 1,064,573 80,069 984,504
NET CHANGE IN FUND BALANCES (664,573)$ 281,874 946,447$
FUND BALANCES:
Beginning of year 1,702,451
End of year 1,984,325$
115

City of San LeandroSchedule of Revenues, Expenditures and Changes in Fund Balances - Budget and Actual -
Non Major Governmental FundPark Development Fee Special Revenue FundFor the year ended June 30, 2020
VarianceFinal Positive
Budget Actual (Negative)
REVENUES:
Use of money and property -$ 27,486$ 27,486$Other 1,000,000 1,303,874 303,874
Total Revenues 1,000,000 1,331,360 331,360
EXPENDITURES:
Current:Recreation and culture 5,212,202 585,324 4,626,878
Total Expenditures 5,212,202 585,324 4,626,878
NET CHANGE IN FUND BALANCES (4,212,202)$ 746,036 4,958,238$
FUND BALANCES:
Beginning of year 495,593
End of year 1,241,629$
116

City of San LeandroSchedule of Revenues, Expenditures and Changes in Fund Balances - Budget and Actual -
Non Major Governmental Fund
For the year ended June 30, 2020
VarianceFinal Positive
Budget Actual (Negative)
REVENUES:
Use of money and property 25,000$ 99,284$ 74,284$Service charges 300,000 46,232 (253,768)
Total Revenues 325,000 145,516 (179,484)
EXPENDITURES:
Current:Engineering and transportation 1,873,574 32,637 1,840,937
Total Expenditures 1,873,574 32,637 1,840,937
NET CHANGE IN FUND BALANCES (1,548,574)$ 112,879 1,661,453$
FUND BALANCES:
Beginning of year 2,913,426
End of year 3,026,305$
Underground Utility Fees Special Revenue Fund
117

City of San LeandroSchedule of Revenues, Expenditures and Changes in Fund Balances - Budget and Actual -
Non Major Governmental FundParking Special Revenue FundFor the year ended June 30, 2020
VarianceFinal Positive
Budget Actual (Negative)
REVENUES:
Licenses and permits 305,000$ 342,739$ 37,739$Use of money and property - 6,260 6,260Fines and forfeitures 200,000 397,107 197,107
Total revenues 505,000 746,106 241,106
EXPENDITURES:
Current:Engineering and transportation 673,511 562,215 111,296
Total expenditures 673,511 562,215 111,296
NET CHANGE IN FUND BALANCES (168,511)$ 183,891 352,402$
FUND BALANCES:
Beginning of year 82,534
End of year 266,425$
118
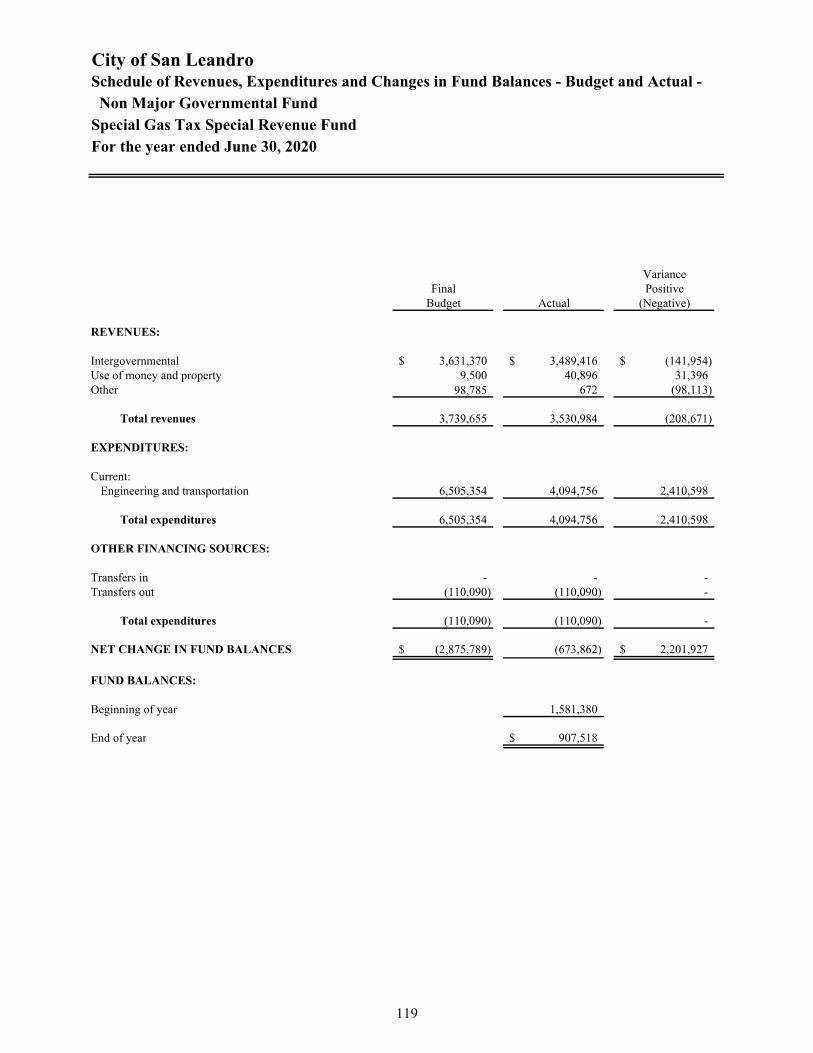
City of San Leandro
Schedule of Revenues, Expenditures and Changes in Fund Balances - Budget and Actual -Non Major Governmental Fund
Special Gas Tax Special Revenue Fund
For the year ended June 30, 2020
VarianceFinal Positive
Budget Actual (Negative)
REVENUES:
Intergovernmental 3,631,370$ 3,489,416$ (141,954)$ Use of money and property 9,500 40,896 31,396 Other 98,785 672 (98,113)
Total revenues 3,739,655 3,530,984 (208,671)
EXPENDITURES:
Current: Engineering and transportation 6,505,354 4,094,756 2,410,598
Total expenditures 6,505,354 4,094,756 2,410,598
OTHER FINANCING SOURCES:
Transfers in - - - Transfers out (110,090) (110,090) -
Total expenditures (110,090) (110,090) -
NET CHANGE IN FUND BALANCES (2,875,789)$ (673,862) 2,201,927$
FUND BALANCES:
Beginning of year 1,581,380
End of year 907,518$
119

City of San LeandroSchedule of Revenues, Expenditures and Changes in Fund Balances - Budget and Actual -
Non Major Governmental FundCherrywood Maintenance District Special Revenue FundFor the year ended June 30, 2020
VarianceFinal Positive
Budget Actual (Negative)
REVENUES:
Property and other taxes -$ 26,042$ 26,042$Use of money and property 4,000 14,775 10,775
Total revenues 4,000 40,817 36,817
EXPENDITURES:
Current:Engineering and transportation - 440 (440)
Total expenditures - 440 (440)
NET CHANGE IN FUND BALANCES 4,000$ 40,377 36,377$
FUND BALANCES:
Beginning of year 422,482
End of year 462,859$
120

City of San LeandroSchedule of Revenues, Expenditures and Changes in Fund Balances - Budget and Actual -
Non Major Governmental Fund
For the year ended June 30, 2020
VarianceFinal Positive
Budget Actual (Negative)
REVENUES:
Intergovernmental -$ 317,009$ 317,009$ Use of money and property - 5,870 5,870
Total revenues - 322,879 322,879
EXPENDITURES:
Current:Engineering and transportation - 276,400 (276,400)
Total expenditures - 276,400 (276,400)
NET CHANGE IN FUND BALANCES -$ 46,479 46,479$
FUND BALANCES:
Beginning of year 544,226
End of year 590,705$
Measure B - Paratransit Special Revenue Fund
121

City of San LeandroSchedule of Revenues, Expenditures and Changes in Fund Balances - Budget and Actual -
Non Major Governmental FundAsset Seizure Special Revenue FundFor the year ended June 30, 2020
VarianceFinal Positive
Budget Actual (Negative)
REVENUES:
Intergovernmental 150,000$ 311,553$ 161,553$ Use of money and property 10,000 42,133 32,133
Total revenues 160,000 353,686 193,686
EXPENDITURES:
Current:Public safety 284,929 23,724 261,205
Total expenditures 284,929 23,724 261,205
NET CHANGE IN FUND BALANCES (124,929)$ 329,962 454,891$
FUND BALANCES:
Beginning of year 1,083,597
End of year 1,413,559$
122

City of San LeandroSchedule of Revenues, Expenditures and Changes in Fund Balances - Budget and Actual -
Non Major Governmental FundHeron Bay Special Revenue FundFor the year ended June 30, 2020
VarianceFinal Positive
Budget Actual (Negative)
REVENUES:
Property and other taxes 360,000$ 374,273$ 14,273$Use of money and property 5,000 22,751 17,751
Total revenues 365,000 397,024 32,024
EXPENDITURES:
Current:Engineering and transportation 896,745 306,757 589,988
Debt service:Interest and fees 3,400 3,405 (5)
Total expenditures 900,145 310,162 589,983
NET CHANGE IN FUND BALANCES (535,145)$ 86,862 (622,007)$
FUND BALANCES:
Beginning of year 734,370
End of year 821,232$
123

City of San LeandroSchedule of Revenues, Expenditures and Changes in Fund Balances - Budget and Actual -
Non Major Governmental FundProposition IB - Local Streets & Roads Special Revenue FundFor the year ended June 30, 2020
VarianceFinal Positive
Budget Actual (Negative)
REVENUES:
Use of money and property 100$ 456$ 356$
Total revenues 100 456 356
EXPENDITURES:
Current:Engineering and transportation - - -
Total expenditures - - -
NET CHANGE IN FUND BALANCES 100$ 456 356$
FUND BALANCES:
Beginning of year 13,637
End of year 14,093$
124
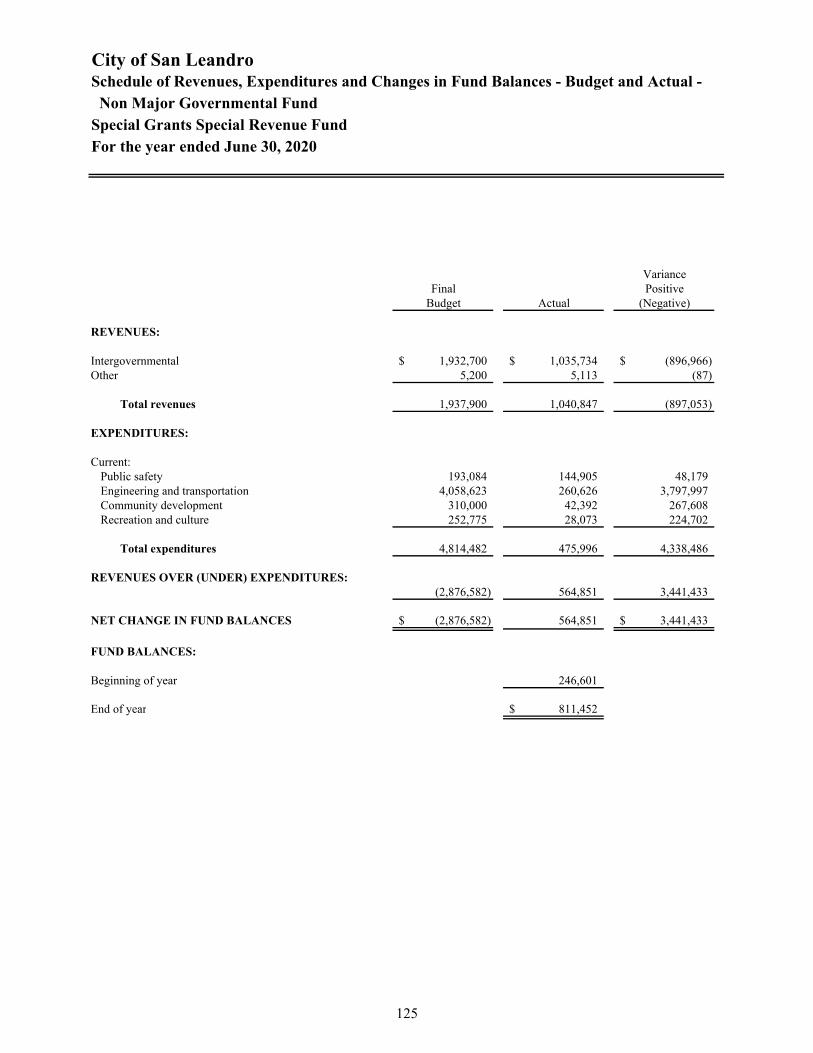
City of San LeandroSchedule of Revenues, Expenditures and Changes in Fund Balances - Budget and Actual -
Non Major Governmental FundSpecial Grants Special Revenue FundFor the year ended June 30, 2020
VarianceFinal Positive
Budget Actual (Negative)
REVENUES:
Intergovernmental 1,932,700$ 1,035,734$ (896,966)$ Other 5,200 5,113 (87)
Total revenues 1,937,900 1,040,847 (897,053)
EXPENDITURES:
Current:Public safety 193,084 144,905 48,179 Engineering and transportation 4,058,623 260,626 3,797,997 Community development 310,000 42,392 267,608 Recreation and culture 252,775 28,073 224,702
Total expenditures 4,814,482 475,996 4,338,486
REVENUES OVER (UNDER) EXPENDITURES:(2,876,582) 564,851 3,441,433
NET CHANGE IN FUND BALANCES (2,876,582)$ 564,851 3,441,433$
FUND BALANCES:
Beginning of year 246,601
End of year 811,452$
125
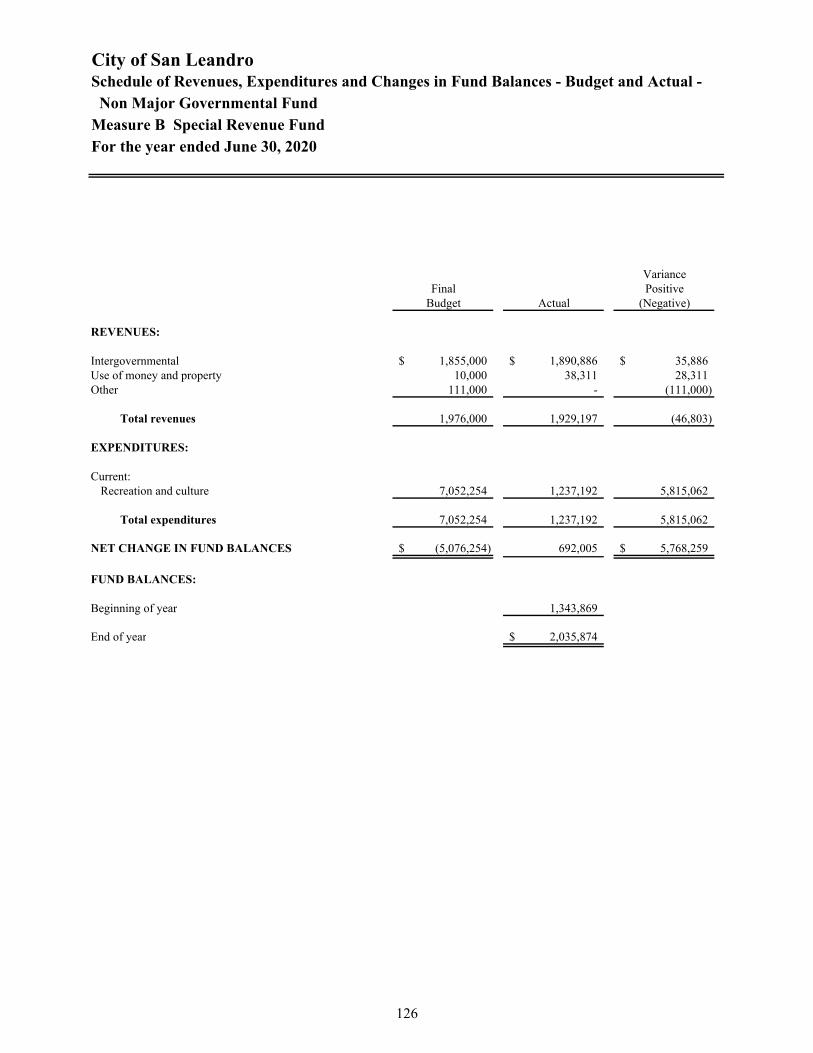
City of San LeandroSchedule of Revenues, Expenditures and Changes in Fund Balances - Budget and Actual -
Non Major Governmental FundMeasure B Special Revenue FundFor the year ended June 30, 2020
VarianceFinal Positive
Budget Actual (Negative)
REVENUES:
Intergovernmental 1,855,000$ 1,890,886$ 35,886$Use of money and property 10,000 38,311 28,311Other 111,000 - (111,000)
Total revenues 1,976,000 1,929,197 (46,803)
EXPENDITURES:
Current:Recreation and culture 7,052,254 1,237,192 5,815,062
Total expenditures 7,052,254 1,237,192 5,815,062
NET CHANGE IN FUND BALANCES (5,076,254)$ 692,005 5,768,259$
FUND BALANCES:
Beginning of year 1,343,869
End of year 2,035,874$
126

City of San LeandroSchedule of Revenues, Expenditures and Changes in Fund Balances - Budget and Actual -
Non Major Governmental FundMeasure BB Special Revenue FundFor the year ended June 30, 2020
VarianceFinal Positive
Budget Actual (Negative)
REVENUES:
Intergovernmental 8,629,000$ 11,059,178$ 2,430,178$ Use of money and property 5,000 (363) (5,363)
Total revenues 8,634,000 11,058,815 2,424,815
EXPENDITURES:
Current:Engineering and transportation 25,105,032 10,038,261 15,066,771
Total expenditures 25,105,032 10,038,261 15,066,771
NET CHANGE IN FUND BALANCES (16,471,032)$ 1,020,554 17,491,586$
FUND BALANCES:
Beginning of year (646,691)
End of year 373,863$
127

City of San LeandroSchedule of Revenues, Expenditures and Changes in Fund Balances - Budget and Actual -
Non Major Governmental FundMeasure F - (Vehicle Registration Fees) Special Revenue FundFor the year ended June 30, 2020
VarianceFinal Positive
Budget Actual (Negative)
REVENUES:
Intergovernmental 440,000$ 483,729$ 43,729$Use of money and property 6,000 34,701 28,701
Total revenues 446,000 518,430 72,430
EXPENDITURES:
Current:Engineering and transportation 1,723,680 506,312 1,217,368
Total expenditures 1,723,680 506,312 1,217,368
NET CHANGE IN FUND BALANCES (1,277,680)$ 12,118 1,289,798$
FUND BALANCES:
Beginning of year 1,110,362
End of year 1,122,480$
128
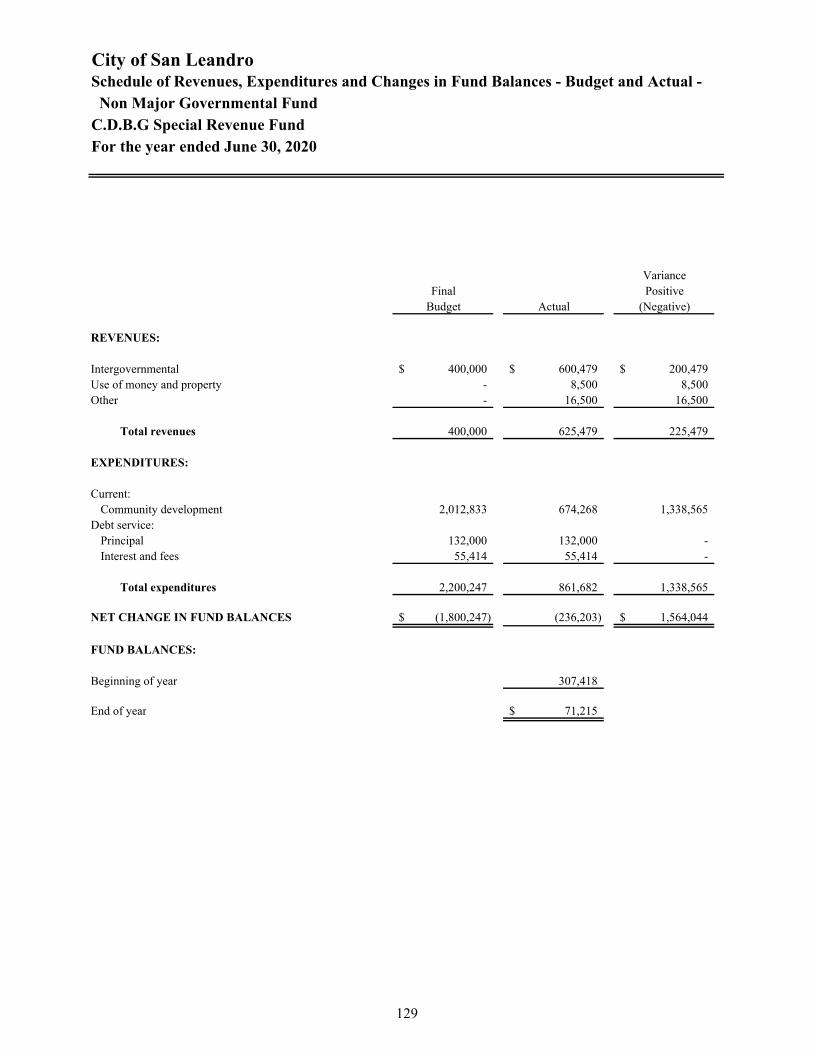
City of San LeandroSchedule of Revenues, Expenditures and Changes in Fund Balances - Budget and Actual -
Non Major Governmental FundC.D.B.G Special Revenue FundFor the year ended June 30, 2020
VarianceFinal Positive
Budget Actual (Negative)
REVENUES:
Intergovernmental 400,000$ 600,479$ 200,479$ Use of money and property - 8,500 8,500Other - 16,500 16,500
Total revenues 400,000 625,479 225,479
EXPENDITURES:
Current:Community development 2,012,833 674,268 1,338,565
Debt service:Principal 132,000 132,000 - Interest and fees 55,414 55,414 -
Total expenditures 2,200,247 861,682 1,338,565
NET CHANGE IN FUND BALANCES (1,800,247)$ (236,203) 1,564,044$
FUND BALANCES:
Beginning of year 307,418
End of year 71,215$
129

City of San LeandroSchedule of Revenues, Expenditures and Changes in Fund Balances - Budget and Actual -
Non Major Governmental FundHOME Special Revenue FundFor the year ended June 30, 2020
VarianceFinal Positive
Budget Actual (Negative)
REVENUES:
Intergovernmental 100,000$ 132,664$ 32,664$ Use of money and property 4,000 22,300 18,300 Other 50,000 133,771 83,771
Total revenues 154,000 288,735 134,735
EXPENDITURES:
Current:Community development 9,161 23,625 (14,464)
Total expenditures 9,161 23,625 (14,464)
NET CHANGE IN FUND BALANCES 144,839$ 265,110 120,271$
FUND BALANCES:
Beginning of year 516,476
End of year 781,586$
130
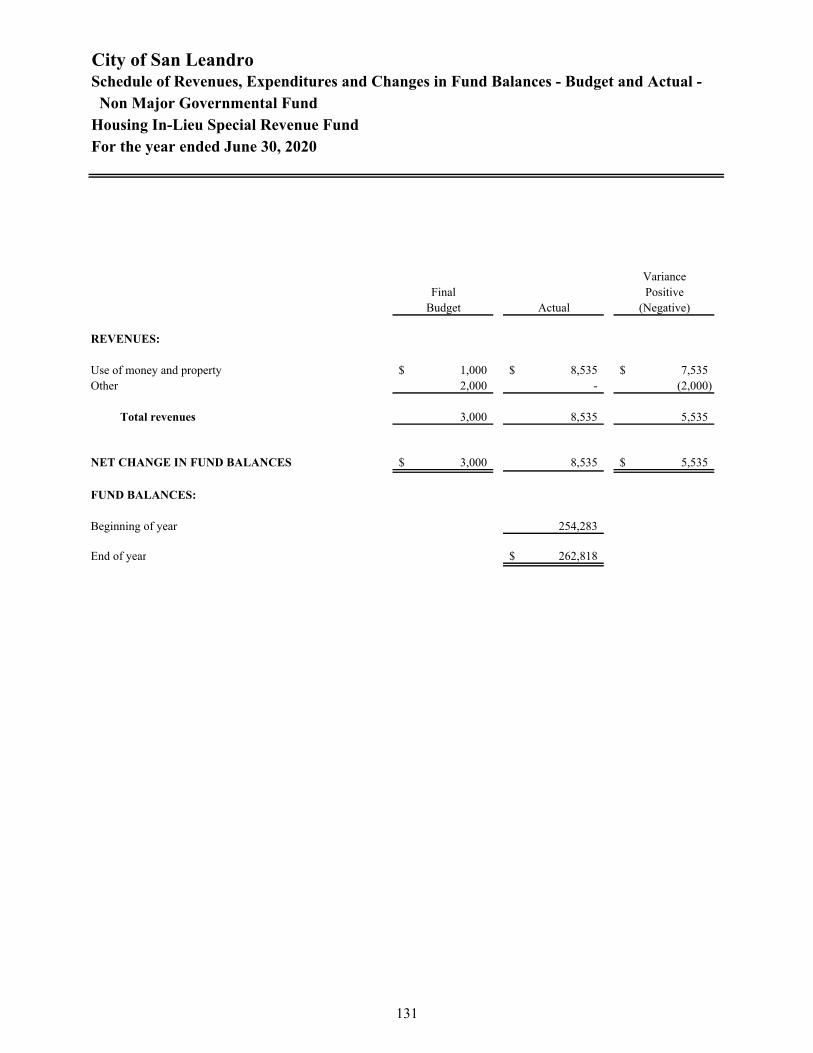
City of San LeandroSchedule of Revenues, Expenditures and Changes in Fund Balances - Budget and Actual -
Non Major Governmental FundHousing In-Lieu Special Revenue FundFor the year ended June 30, 2020
VarianceFinal Positive
Budget Actual (Negative)
REVENUES:
Use of money and property 1,000$ 8,535$ 7,535$Other 2,000 - (2,000)
Total revenues 3,000 8,535 5,535
NET CHANGE IN FUND BALANCES 3,000$ 8,535 5,535$
FUND BALANCES:
Beginning of year 254,283
End of year 262,818$
131

City of San LeandroSchedule of Revenues, Expenditures and Changes in Fund Balances - Budget and Actual -
Non Major Governmental FundBusiness Improvement District Special Revenue FundFor the year ended June 30, 2020
VarianceFinal Positive
Budget Actual (Negative)
REVENUES:
Licenses and permits 400,000$ 355,607$ (44,393)$ Intergovernmental 246,530 362,859 116,329 Use of money and property 1,000 7,562 6,562
Total revenues 647,530 726,028 78,498
EXPENDITURES:
Current: Community development 695,530 850,000 (154,470)
Total expenditures 695,530 850,000 (154,470)
OTHER FINANCING SOURCES:
Transfers in 50,000 50,000 -
NET CHANGE IN FUND BALANCES 2,000$ (73,972) (75,972)$
FUND BALANCES:
Beginning of year 241,061
End of year 167,089$
132

City of San Leandro
Schedule of Revenues, Expenditures and Changes in Fund Balances - Budget and Actual -Non Major Governmental Fund
Public Education and Government Special Revenue Fund
For the year ended June 30, 2020
VarianceFinal Positive
Budget Actual (Negative)
REVENUES:
Property and other taxes 225,000$ 171,068$ (53,932)$ Use of money and property 7,000 38,874 31,874
Total revenues 232,000 209,942 (22,058)
EXPENDITURES:
Current:Community development 961,664 421,328 540,336
Total expenditures 961,664 421,328 540,336
NET CHANGE IN FUND BALANCES (729,664)$ (211,386) 518,278$
FUND BALANCES:
Beginning of year 1,048,216
End of year 836,830$
133
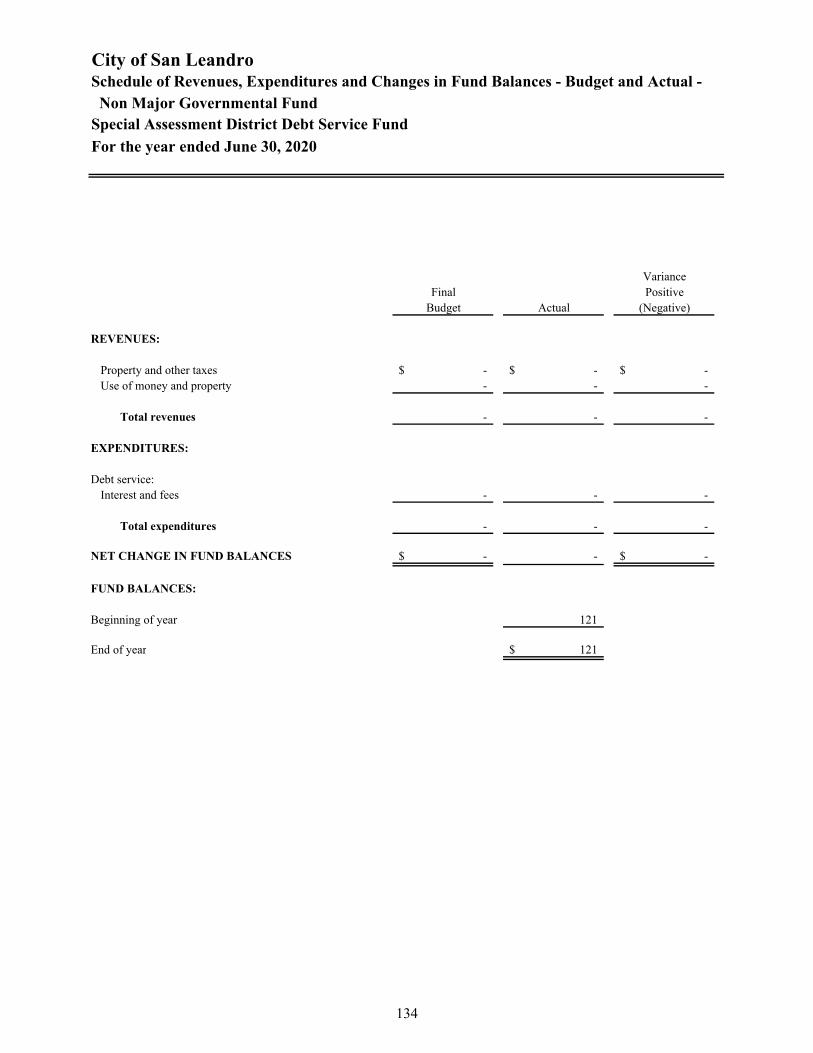
City of San LeandroSchedule of Revenues, Expenditures and Changes in Fund Balances - Budget and Actual -
Non Major Governmental Fund
For the year ended June 30, 2020
VarianceFinal Positive
Budget Actual (Negative)
REVENUES:
Property and other taxes -$ -$ -$ Use of money and property - - -
Total revenues - - -
EXPENDITURES:
Debt service:Interest and fees - - -
Total expenditures - - -
NET CHANGE IN FUND BALANCES -$ - -$
FUND BALANCES:
Beginning of year 121
End of year 121$
Special Assessment District Debt Service Fund
134

City of San LeandroSchedule of Revenues, Expenditures and Changes in Fund Balances - Budget and Actual -
Non Major Governmental FundSan Leandro Public Financing Authority Debt Service FundFor the year ended June 30, 2020
VarianceFinal Positive
Budget Actual (Negative)
REVENUES:
Use of money and property 3,181,406$ 3,185,604$ 4,198$
Total revenues 3,181,406 3,185,604 4,198
EXPENDITURES:
Debt service:Principal 1,536,000 1,536,000 - Interest and fees 1,649,889 1,652,914 (3,025)
Total expenditures 3,185,889 3,188,914 (3,025)
NET CHANGE IN FUND BALANCES (4,483)$ (3,310) 1,173$
FUND BALANCES:
Beginning of year 438,623
End of year 435,313$
135
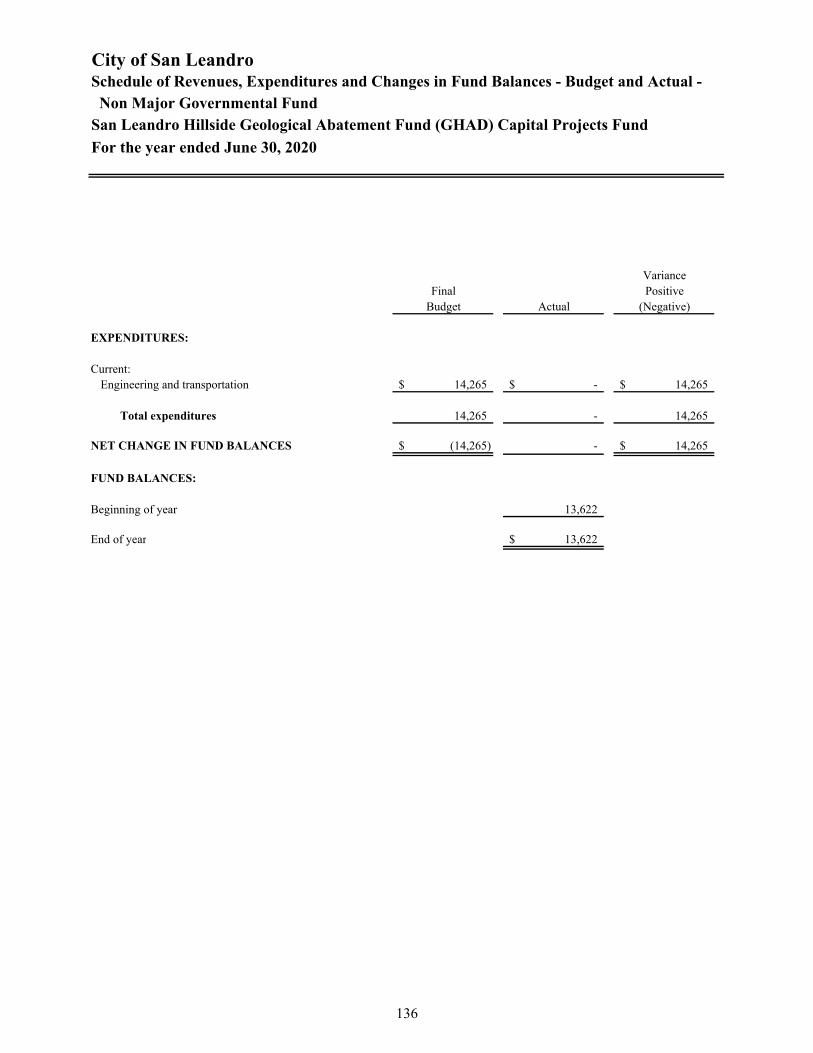
City of San LeandroSchedule of Revenues, Expenditures and Changes in Fund Balances - Budget and Actual -
Non Major Governmental FundSan Leandro Hillside Geological Abatement Fund (GHAD) Capital Projects Fund
For the year ended June 30, 2020
VarianceFinal Positive
Budget Actual (Negative)
EXPENDITURES:
Current:Engineering and transportation 14,265$ -$ 14,265$
Total expenditures 14,265 - 14,265
NET CHANGE IN FUND BALANCES (14,265)$ - 14,265$
FUND BALANCES:
Beginning of year 13,622
End of year 13,622$
136

NON-MAJOR ENTERPRISE FUNDS
Storm Water Utility – Provides for the City’s storm water program in conjunction with the National Pollutant Discharge and Emissions Services Act.
Environmental Services – Accounts for the regulation of hazardous materials, wastewater discharge, storm water runoff, solid waste and recycling, and the landfill at the Marina.
137

City of San LeandroCombining Statement of Net PositionNon-Major Enterprise FundsJune 30, 2020
Total Non-Major
Storm Water Environmental Enterprise Utility Services Funds
Current Assets:Cash and investments 374$ 1,738,692$ 1,739,066$ Receivables:
Accounts 4,591 111,498 116,089Interest - 5,491 5,491
Total current assets 4,965 1,855,681 1,860,646
Noncurrent assets:Capital assets:
Depreciable 15,590 4,873 20,463Less accumulated depreciation (15,590) (4,873) (20,463)
Total noncurrent assets - - -
Total Assets 4,965 1,855,681 1,860,646
Current Liabilities:Accounts payable 6,884 13,855 20,739Due to other funds 944,000 - 944,000 Compensated absences - due in one year 6,739 39,454 46,193
Total current liabilities 957,623 53,309 1,010,932
Non-current Liabilities:Compensated absences - due in more than one year 19,948 108,586 128,534
Total Liabilities 977,571 161,895 1,139,466
Unrestricted (972,606) 1,693,786 721,180
Total Net Position (972,606)$ 1,693,786$ 721,180$
ASSETS
LIABILITIES
NET POSITION
138

City of San LeandroCombining Statement of Revenues, Expenses, and Changes in Net PositionNon-Major Enterprise FundsFor the year ended June 30, 2020
TotalNon-Major
Storm Water Environmental EnterpriseUtility Services Funds
OPERATING REVENUESCharges for services 1,070,663$ 292,784$ 1,363,447$ Licenses and permits - 371,059 371,059 Other operating revenue 2,850 15,425 18,275
Total operating revenues 1,073,513 679,268 1,752,781
OPERATING EXPENSESSalaries and benefits 706,081 729,514 1,435,595 Contractual and other services 265,286 106,399 371,685 Material and supplies 30,408 5,488 35,896 Other operating costs 400,325 236,342 636,667 Depreciation 15,316 3,931 19,247
Total operating expenses 1,417,416 1,081,674 2,499,090
OPERATING INCOME (LOSS) (343,903) (402,406) (746,309)
NONOPERATING REVENUES (EXPENSES):Investment income - 58,365 58,365 Intergovernmental - 258,586 258,586
Total Nonoperating Revenues (Expenses) - 316,951 316,951
INCOME (LOSS) BEFORE TRANSFERS: (343,903) (85,455) (429,358)
Transfers in - 132,782 132,782
Change in net position (343,903) 47,327 (296,576)
NET POSITION:
Beginning of year (628,703) 1,646,459 1,017,756
End of year (972,606)$ 1,693,786$ 721,180$
139

City of San LeandroCombining Statement of Cash Flows
Non-Major Enterprise FundsFor the year ended June 30, 2020
Total Non-Major
Storm Water Environmental EnterpriseUtility Services Funds
CASH FLOWS FROM OPERATING ACTIVITIESCash received from customers 1,075,505$ 729,010$ 1,804,515$ Cash received from other funds 353,551 - 353,551 Cash payments to suppliers and service providers (702,811) (342,539) (1,045,350)Cash payments to employees for services (727,582) (705,220) (1,432,802)
Net cash provided (used) by operating activities (1,337) (318,749) (320,086)
CASH FLOWS FROM NONCAPITAL FINANCING ACTIVITIES:
Intergovernmental revenue received - 258,586 258,586 Transfers in from other funds - 132,782 132,782
Net cash provided (used) by noncapital financing activities - 391,368 391,368
CASH FLOWS FROM INVESTING ACTIVITIES:Change in market values of investments - 22,191 22,191 Interest income - 35,804 35,804
Net cash provided (used) by investing activities - 57,995 57,995
Net increase (decrease) in cash and cash equivalents (1,337) 130,614 129,277
CASH AND CASH EQUIVALENTS:
Beginning of year 1,711 1,608,078 1,609,789
End of year 374$ 1,738,692$ 1,739,066$
RECONCILIATION OR OPERATING INCOME (LOSS) TO NETCASH PROVIDED (USED) BY OPERATING ACTIVITIES:
Operating income (loss) (343,903)$ (402,406)$ (746,309)$ Depreciation 15,316 3,931 19,247
Adjustments to reconcile operating income (loss) to netcash provided (used) by operating activities:Changes in assets and liabilities:(Increase) decrease in accounts receivable 1,992 49,742 51,734 (Decrease) increase in accounts payable (6,792) 5,690 (1,102)(Decrease) increase due to other funds 353,551 - 353,551 (Decrease) increase in compensated absences (21,501) 24,294 2,793
Net cash provided (used) by operating activities (1,337)$ (318,749)$ (320,086)$
140
INTERNAL SERVICE FUNDS
Internal Service Funds are used to account for special activities and services performed by a designated City department for other departments on a cost reimbursement basis. Building Maintenance – This fund accounts for the City’s custodial maintenance and minor building modifications performed on various City complexes. The source of revenue is reimbursement of costs for services performed to the departments. Information Management Services – The fund accounts for centralized data processing and the maintenance, acquisition and replacement of computerized systems. Sources of revenue for this fund are reimbursement of costs for services and equipment purchased by other departments. Self Insurance – This fund accounts for the administration of the City’s self-insurance programs, payment of worker’s compensation and liability claims payments. Equipment Maintenance – This fund accounts for the maintenance and replacement of vehicles and equipment used by all City departments. Source of revenues for this fund is reimbursement of costs for services and supplies purchased by other departments.
141

City of San LeandroCombining Statement of Net PositionInternal Service FundsJune 30, 2020
Information Building Management Self - Equipment
Maintenance Services Insurance Maintenance Total
Cash and investments 1,764,928$ 2,121,613$ 10,986,619$ 4,064,376$ 18,937,536$ Receivables:
Interest 6,600 6,573 30,321 11,558 55,052 Inventory 11,881 58,262 - 167,165 237,308
Total current assets 1,783,409 2,186,448 11,016,940 4,243,099 19,229,896
Capital assets:Depreciable 80,353 5,911,354 - 11,746,050 17,737,757 Less accumulated depreciation (26,614) (5,869,203) - (6,025,425) (11,921,242)
Total Net capital assets 53,739 42,151 - 5,720,625 5,816,515
Total noncurrent assets 53,739 42,151 - 5,720,625 5,816,515
Total Assets 1,837,148 2,228,599 11,016,940 9,963,724 25,046,411
Current Liabilities:Accounts payable 166,079 86,409 112,670 340,553 705,711 Other liabilities - - 540,698 - 540,698 Claims and judgments - due in one year - - 1,170,645 - 1,170,645 Compensated absences payable - due in one year 5,146 23,621 1,720 3,939 34,426
Total current liabilities 171,225 110,030 1,825,733 344,492 2,451,480
Noncurrent Liabilities:Claims and judgments - due in more than one year - - 6,492,602 - 6,492,602 Compensated absences - due in more than one year 8,870 110,876 4,799 26,362 150,907
Total noncurrent liabilities 8,870 110,876 6,497,401 26,362 6,643,509
Total Liabilities 180,095 220,906 8,323,134 370,854 9,094,989
Net investment in capital assets 53,739 42,151 - 5,720,625 5,816,515 Unrestricted 1,603,314 1,965,542 2,693,806 3,872,245 10,134,907
Total Net Position 1,657,053$ 2,007,693$ 2,693,806$ 9,592,870$ 15,951,422$
LIABILITIES
NET POSITION
ASSETS
142
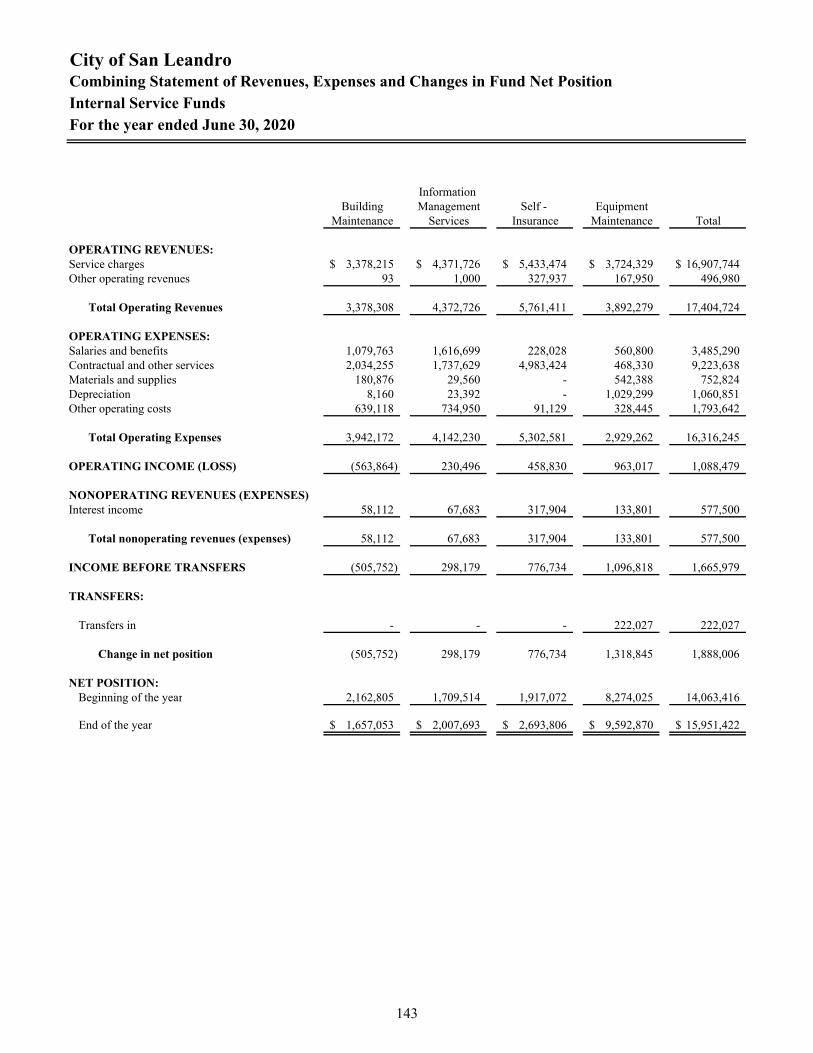
City of San LeandroCombining Statement of Revenues, Expenses and Changes in Fund Net PositionInternal Service FundsFor the year ended June 30, 2020
Information Building Management Self - Equipment
Maintenance Services Insurance Maintenance Total
OPERATING REVENUES:Service charges 3,378,215$ 4,371,726$ 5,433,474$ 3,724,329$ 16,907,744$ Other operating revenues 93 1,000 327,937 167,950 496,980
Total Operating Revenues 3,378,308 4,372,726 5,761,411 3,892,279 17,404,724
OPERATING EXPENSES:Salaries and benefits 1,079,763 1,616,699 228,028 560,800 3,485,290 Contractual and other services 2,034,255 1,737,629 4,983,424 468,330 9,223,638 Materials and supplies 180,876 29,560 - 542,388 752,824 Depreciation 8,160 23,392 - 1,029,299 1,060,851 Other operating costs 639,118 734,950 91,129 328,445 1,793,642
Total Operating Expenses 3,942,172 4,142,230 5,302,581 2,929,262 16,316,245
OPERATING INCOME (LOSS) (563,864) 230,496 458,830 963,017 1,088,479
NONOPERATING REVENUES (EXPENSES)Interest income 58,112 67,683 317,904 133,801 577,500
Total nonoperating revenues (expenses) 58,112 67,683 317,904 133,801 577,500
INCOME BEFORE TRANSFERS (505,752) 298,179 776,734 1,096,818 1,665,979
TRANSFERS:
Transfers in - - - 222,027 222,027
Change in net position (505,752) 298,179 776,734 1,318,845 1,888,006
NET POSITION:Beginning of the year 2,162,805 1,709,514 1,917,072 8,274,025 14,063,416
End of the year 1,657,053$ 2,007,693$ 2,693,806$ 9,592,870$ 15,951,422$
143
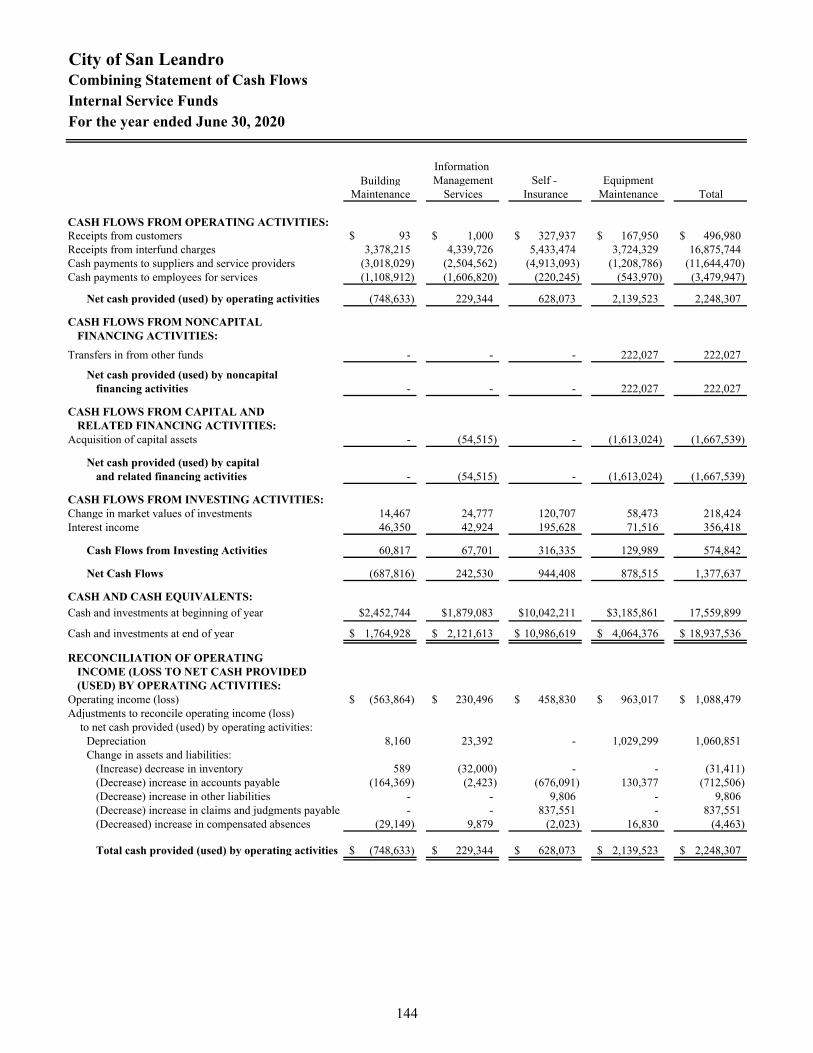
City of San LeandroCombining Statement of Cash FlowsInternal Service FundsFor the year ended June 30, 2020
Information Building Management Self - Equipment
Maintenance Services Insurance Maintenance Total
CASH FLOWS FROM OPERATING ACTIVITIES:Receipts from customers 93$ 1,000$ 327,937$ 167,950$ 496,980$ Receipts from interfund charges 3,378,215 4,339,726 5,433,474 3,724,329 16,875,744 Cash payments to suppliers and service providers (3,018,029) (2,504,562) (4,913,093) (1,208,786) (11,644,470) Cash payments to employees for services (1,108,912) (1,606,820) (220,245) (543,970) (3,479,947)
Net cash provided (used) by operating activities (748,633) 229,344 628,073 2,139,523 2,248,307
CASH FLOWS FROM NONCAPITALFINANCING ACTIVITIES:
Transfers in from other funds - - - 222,027 222,027
Net cash provided (used) by noncapital financing activities - - - 222,027 222,027
CASH FLOWS FROM CAPITAL AND RELATED FINANCING ACTIVITIES:
Acquisition of capital assets - (54,515) - (1,613,024) (1,667,539)
Net cash provided (used) by capital and related financing activities - (54,515) - (1,613,024) (1,667,539)
CASH FLOWS FROM INVESTING ACTIVITIES:Change in market values of investments 14,467 24,777 120,707 58,473 218,424 Interest income 46,350 42,924 195,628 71,516 356,418
Cash Flows from Investing Activities 60,817 67,701 316,335 129,989 574,842
Net Cash Flows (687,816) 242,530 944,408 878,515 1,377,637
CASH AND CASH EQUIVALENTS:
Cash and investments at beginning of year $2,452,744 $1,879,083 $10,042,211 $3,185,861 17,559,899
Cash and investments at end of year 1,764,928$ 2,121,613$ 10,986,619$ 4,064,376$ 18,937,536$
RECONCILIATION OF OPERATING INCOME (LOSS TO NET CASH PROVIDED(USED) BY OPERATING ACTIVITIES:
Operating income (loss) (563,864)$ 230,496$ 458,830$ 963,017$ 1,088,479$ Adjustments to reconcile operating income (loss)
to net cash provided (used) by operating activities:Depreciation 8,160 23,392 - 1,029,299 1,060,851 Change in assets and liabilities:
(Increase) decrease in inventory 589 (32,000) - - (31,411) (Decrease) increase in accounts payable (164,369) (2,423) (676,091) 130,377 (712,506) (Decrease) increase in other liabilities - - 9,806 - 9,806 (Decrease) increase in claims and judgments payable - - 837,551 - 837,551 (Decreased) increase in compensated absences (29,149) 9,879 (2,023) 16,830 (4,463)
Total cash provided (used) by operating activities (748,633)$ 229,344$ 628,073$ 2,139,523$ 2,248,307$
144

FIDUCIARY FUND FINANCIAL STATEMENTS
AGENCY FUNDS
Deposits Fund – Accounts for all deposits held on behalf of other persons and businesses under the control of City departments.
Cherrywood – Accounts for monies accumulated for payments of special assessment bonds which are financed by assessments placed on the Alameda County tax roll for the Cherrywood housing development.
145

City of San LeandroCombining Statement of Assets and LiabilitiesAgency Funds
Deposits Cherrywood Total
Cash and investments 4,827,099$ 1,101,260$ 5,928,359$ Cash and investments with fiscal agents - 456,563 456,563Interest receivable - 1,309 1,309Special assessment receivable - 2,230 2,230
Total Assets 4,827,099$ 1,561,362$ 6,388,461$
Accounts payable 81,819$ -$ 81,819$Deposits payable 4,745,280 - 4,745,280Due to bondholders - 1,561,362 1,561,362
Total Liabilities 4,827,099$ 1,561,362$ 6,388,461$
June 30, 2020
ASSETS
LIABILITIES
146

City of San LeandroCombining Statement of Changes in Assets and LiabilitiesAgency Funds
For the year ended June 30, 2020
Balance BalanceJuly 1, 2019 Additions Deductions June 30, 2020
Assets:Cash and investments 4,214,985$ 770,522$ 158,408$ 4,827,099$
Total assets 4,214,985$ 770,522$ 158,408$ 4,827,099$
Liabilities:Accounts payable 158,408$ 81,819$ 158,408$ 81,819$ Deposits payable 4,056,577 688,703 - 4,745,280
Total liabilities 4,214,985$ 770,522$ 158,408$ 4,827,099$
Assets:Cash and investments 1,074,001$ 27,259$ -$ 1,101,260$ Cash and investments with fiscal agent 457,681 1,531,894 1,533,012 456,563Interest receivable 1,330 1,309 1,330 1,309Special assessments receivable - 2,230 - 2,230
Total assets 1,533,012$ 1,562,692$ 1,534,342$ 1,561,362$
Liabilities:Due to bondholders 1,533,012$ 1,562,692$ 1,534,342$ 1,561,362$
Total liabilities 1,533,012$ 1,562,692$ 1,534,342$ 1,561,362$
Assets:Cash and investments 5,288,986$ 797,781$ 158,408$ 5,928,359$ Cash and investments with fiscal agent 457,681 1,531,894 1,533,012 456,563 Interest receivable 1,330 1,309 1,330 1,309Special assessment receivable - 2,230 - 2,230
Total assets 5,747,997$ 2,333,214$ 1,692,750$ 6,388,461$
Liabilities:Accounts payable 158,408$ 81,819$ 158,408$ 81,819$ Deposits payable 4,056,577 688,703 - 4,745,280Due to bondholders 1,533,012 1,562,692 1,534,342 1,561,362
Total liabilities 5,747,997$ 2,333,214$ 1,692,750$ 6,388,461$
Deposits
Cherrywood
All Agency Funds
147

STATISTICAL SECTION
Contents Page
Financial Trends 151
Revenue Capacity 159
Debt Capacity 171
Demographic and Economic Information 179
Operating Information 183
These schedules contain service and infrastructure data to help the reader understand how the information in the city's financial report relates to the services the city provides and the activities it performs.
This section of the City of San Leandro's comprehensive annual financial report presents detailed information as a context for understanding what the information in the financial statements, note disclosures, and required supplementary information says about the city's overall financial health.
These schedules contain trend information to help the reader understand how the city's financial performance and well-being have changed over time.
These schedules contain information to help the reader assess the city's most significant local revenue sources, sales tax and property tax.
These schedules present information to help the reader assess the affordability of the city's current levels of outstanding debt and the city's ability to issue additional debt in the future.
These schedules offer demographic and economic indicators to help the reader understand the environment within which the city's financial activities take place.
149


FINANCIAL TRENDS
Net Position by Component Unit - Last Ten Fiscal Years
Changes in Net Position - Last Ten Fiscal Years
Program Revenues by Function / Program - Last Ten Fiscal Years
Fund Balances of Governmental Funds - Last Ten Fiscal Years
General Fund Revenue by Source - Last Ten Fiscal Years
Changes in Fund Balance of Governmental Funds - Last Ten Fiscal Years
These schedules contain trend information to help the reader understand how the city's financial performance and well-being have changed over time.
151


Cit
y of
San
Lea
nd
roN
et P
osit
ion
by
Com
pon
ent
Un
itL
ast
Ten
Fis
cal Y
ears
(Acc
rual
Bas
is o
f A
ccou
nti
ng)
Gov
ern
men
tal A
ctiv
itie
s20
1120
1220
1320
1420
1520
1620
1720
1820
1920
20
256,
542,
629
$
25
1,25
2,87
7$
219,
701,
797
$
22
5,40
1,87
3$
212,
967,
616
$
20
0,56
0,06
4$
190,
556,
178
$
18
1,17
8,75
4$
152,
522,
070
$
14
7,33
6,41
3$
Res
tric
ted
37,4
89,2
89
17
,947
,666
24,1
62,1
16
14
,371
,041
21,2
06,6
26
23
,680
,435
31,6
47,6
62
41
,104
,032
63,0
79,4
53
64
,472
,691
Unr
estr
icte
d(3
,737
,046
)
42
,585
,608
33,5
24,4
45
28
,282
,857
(98,
955,
552)
(7
7,77
6,02
9)
(67,
544,
332)
(8
4,96
2,48
6)
(88,
393,
775)
(9
0,21
5,80
8)
Tot
al G
over
nm
enta
l Act
ivit
ies
Net
Pos
itio
n29
0,29
4,87
2$
311,
786,
151
$
27
7,38
8,35
8$
268,
055,
771
$
13
5,21
8,69
0$
146,
464,
470
$
15
4,65
9,50
8$
137,
320,
300
$
12
7,20
7,74
8$
121,
593,
296
$
Bu
sin
ess-
Typ
e A
ctiv
itie
s20
1120
1220
1320
1420
1520
1620
1720
1820
1920
20
26,8
32,0
33$
30
,737
,068
$
32,9
79,2
35$
31
,512
,875
$
32,5
05,6
29$
30
,434
,444
$
31,0
56,1
13$
34
,872
,307
$
38,6
61,9
14$
41
,645
,101
$
Res
tric
ted
- -
- -
- -
- -
- -
Unr
estr
icte
d15
,133
,537
13,0
97,0
06
15
,002
,725
21,0
31,5
37
12
,609
,167
18,0
50,1
70
20
,616
,425
17,9
62,7
02
20
,090
,760
16,9
38,8
07
T
otal
Bu
sin
ess-
Typ
e A
ctiv
itie
s N
et P
osit
ion
41,9
65,5
70$
43
,834
,074
$
47,9
81,9
60$
52
,544
,412
$
45,1
14,7
96$
48
,484
,614
$
51,6
72,5
38$
52
,835
,009
$
58,7
52,6
74$
58
,583
,908
$
Pri
mar
y go
vern
men
t20
1120
1220
1320
1420
1520
1620
1720
1820
1920
20
283,
374,
662
$
28
1,98
9,94
5$
252,
681,
032
$
25
6,91
4,74
8$
245,
473,
245
$
23
0,99
4,50
8$
221,
612,
291
$
21
6,05
1,06
1$
191,
183,
984
$
18
8,98
1,51
4$
Res
tric
ted
37,4
89,2
89
17
,947
,666
24,1
62,1
16
14
,371
,041
21,2
06,6
26
23
,680
,435
31,6
47,6
62
41
,104
,032
63,0
79,4
53
64
,472
,691
Unr
estr
icte
d11
,396
,491
55,6
82,6
14
48
,527
,170
49,3
14,3
94
(8
6,34
6,38
5)
(59,
725,
859)
(4
6,92
7,90
7)
(66,
999,
784)
(6
8,30
3,01
5)
(73,
277,
001)
T
otal
Gov
ern
men
tal A
ctiv
itie
s N
et P
osit
ion
332,
260,
442
$
35
5,62
0,22
5$
325,
370,
318
$
32
0,60
0,18
3$
180,
333,
486
$
19
4,94
9,08
4$
206,
332,
046
$
19
0,15
5,30
9$
185,
960,
422
$
18
0,17
7,20
4$
Sou
rce:
Cit
y of
San
Lea
ndro
Com
preh
ensi
ve A
nnua
l Fin
anci
al R
epor
t (C
AF
R)
- S
tate
men
t of
Net
Pos
itio
n
Not
e: (
1) L
arge
neg
ativ
e am
ount
in 2
015
is d
ue to
the
impl
emen
tati
on o
f G
AS
B 6
8.
Net
inve
stm
ent i
n ca
pita
l as
sets
Net
inve
stm
ent i
n ca
pita
l as
sets
Net
inve
stm
ent i
n ca
pita
l as
sets
‐100
,000
,000
‐50,00
0,00
00
50,000
,000
100,00
0,00
0
150,00
0,00
0
200,00
0,00
0
250,00
0,00
0
300,00
0,00
0
350,00
0,00
0
400,00
0,00
0
2011
2012
2013
2014
2015
2016
2017
2018
2019
2020
Net investmen
t in capital assets
Restricted
Unrestricted
153

Cit
y of
San
Lea
nd
roC
han
ges
in N
et P
osit
ion
Las
t T
en F
isca
l Yea
rs(a
ccru
al b
asis
of
acco
un
tin
g)
Exp
ense
s:20
1120
1220
1320
1420
1520
1620
1720
1820
1920
20
Gov
ernm
enta
l act
ivit
ies:
G
ener
al g
over
nmen
t10
,759
,754
$
10
,238
,787
$
13
,166
,855
$
11
,609
,391
$
10
,896
,679
$
7,
923,
300
$
8,
524,
377
$
13
,658
,584
$
14
,053
,667
$
13
,979
,398
$
Pub
lic
safe
ty45
,936
,832
43
,574
,011
45
,465
,294
47
,180
,237
47
,989
,126
52
,944
,433
54
,510
,194
64
,971
,782
68
,742
,284
73
,021
,991
Eng
inee
ring
& T
rans
port
atio
n22
,720
,292
23
,903
,746
25
,662
,305
31
,712
,176
30
,566
,925
31
,476
,280
28
,124
,152
32
,933
,260
35
,750
,270
32
,594
,161
Rec
reat
ion
& C
ultu
re11
,042
,582
9,
894,
015
11
,586
,223
11
,786
,787
11
,667
,158
13
,824
,385
13
,228
,291
14
,756
,277
14
,087
,453
13
,337
,227
Com
mun
ity
Dev
elop
men
t17
,541
,521
8,
178,
377
4,
904,
402
5,
389,
381
5,
704,
907
6,
840,
393
8,
134,
895
10
,216
,834
10
,390
,977
15
,377
,114
Inte
rest
on
long
-ter
m d
ebt
4,18
2,40
9
2,31
7,75
3
2,54
8,11
9
2,09
7,25
7
2,15
6,40
0
1,76
4,32
2
2,21
8,02
5
1,67
7,31
6
1,79
4,52
6
1,82
7,88
3
T
otal
gov
ernm
enta
l act
ivit
ies
expe
nses
112,
183,
390
98,1
06,6
89
103,
333,
198
109,
775,
229
108,
981,
195
114,
773,
113
114,
739,
934
138,
214,
053
144,
819,
177
150,
137,
774
Bus
ines
s-ty
pe a
ctiv
itie
s:
Wat
er P
ollu
tion
Con
trol
5,85
6,45
2
8,39
5,69
2
7,49
9,55
5
7,97
8,05
8
8,80
2,56
4
13,5
34,4
88
10,7
95,9
50
12,1
84,4
73
11,8
14,4
60
15,2
33,7
37
S
hore
line
1,99
7,75
3
1,84
8,42
8
1,86
1,53
2
1,92
2,48
9
1,69
1,93
2
1,83
9,66
7
1,75
4,84
2
1,78
6,19
3
1,67
7,89
6
2,09
4,26
6
S
torm
Wat
er U
tili
ty84
4,60
4
91
9,99
8
97
8,81
6
1,
078,
252
1,
105,
054
1,
212,
469
1,
106,
011
1,
412,
257
1,
407,
078
1,
417,
416
Env
iron
men
tal S
ervi
ces
1,33
3,14
5
1,22
2,54
3
1,17
5,25
7
1,02
7,05
4
1,02
0,38
8
1,18
9,98
5
1,06
5,88
5
1,09
5,23
2
1,06
1,37
0
1,08
1,67
4
T
otal
bus
ines
s-ty
pe a
ctiv
itie
s ex
pens
es10
,031
,954
12
,386
,661
11
,515
,160
12
,005
,853
12
,619
,938
17
,776
,609
14
,722
,688
16
,478
,155
15
,960
,804
19
,827
,093
T
otal
pri
mar
y go
vern
men
t exp
ense
s12
2,21
5,34
4
11
0,49
3,35
0
11
4,84
8,35
8
12
1,78
1,08
2
12
1,60
1,13
3
13
2,54
9,72
2
12
9,46
2,62
2
15
4,69
2,20
8
16
0,77
9,98
1
16
9,96
4,86
7
Pro
gram
rev
enu
es:
Gov
ernm
enta
l act
ivit
ies:
G
ener
al g
over
nmen
t
Pro
pert
y ta
xes
26,7
20,7
90
22,3
57,1
86
17,6
31,5
82
18,5
14,1
27
18,8
98,0
38
20,0
44,2
19
20,8
58,0
27
22,9
94,2
12
24,1
23,8
75
26,3
07,8
55
S
ales
taxe
s21
,811
,494
24
,126
,105
26
,304
,583
29
,097
,614
32
,948
,155
42
,336
,643
41
,727
,835
42
,990
,223
45
,865
,704
44
,654
,873
Fra
nchi
se F
ees
4,12
4,84
6
4,23
1,42
0
4,44
4,25
1
4,58
1,92
0
4,84
5,08
6
4,96
8,61
4
5,10
2,90
4
5,26
9,39
1
5,19
2,13
8
5,64
8,90
0
U
tili
ty U
sers
Tax
9,93
2,89
3
9,96
8,54
6
9,88
8,12
3
10,1
57,7
62
10,3
59,0
50
10,8
07,5
81
10,9
75,2
34
10,7
19,3
15
10,1
82,1
41
10,5
29,9
01
P
rope
rty
Tra
nsfe
r T
ax2,
528,
604
2,
981,
685
2,
956,
419
3,
282,
026
4,
112,
030
4,
460,
568
5,
459,
316
5,
176,
403
5,
372,
712
3,
788,
439
911
Com
mun
icat
ion
Acc
ess
Tax
2,69
4,14
9
2,68
4,59
1
2,72
3,25
5
2,80
4,18
1
2,97
4,31
3
2,91
7,99
3
2,89
0,30
2
3,03
5,25
6
3,11
0,16
5
3,12
3,15
5
O
ther
taxe
s38
1,12
2
55
5,98
8
59
1,01
6
65
2,86
6
73
3,86
7
81
1,61
9
90
7,65
1
1,
008,
115
1,
430,
740
1,
821,
885
Mot
ors
Veh
icle
Lic
ense
Fee
s50
6,28
0
42
,294
44
,112
36
,768
35
,936
-
- -
- -
In
vest
men
t1,
300,
123
1,
098,
406
91
9,21
3
1,
255,
043
1,
191,
893
1,
882,
764
1,
560,
277
1,
691,
972
4,
286,
379
4,
483,
519
Com
mun
ity
Impa
ct R
eim
burs
emen
t -
- -
- -
- -
- -
-
Mis
cell
aneo
us1,
158,
044
98
8,12
6
96
2,35
6
51
4,85
1
82
5,08
2
4,
225,
123
1,
702,
501
5,
426,
862
85
3,79
7
87
8,09
5
Gai
n on
sal
e of
ass
ets
20,9
14
3,35
3
393,
741
16,1
96
6,90
2
7,06
0
3,00
4
1,02
0,97
0
553,
670
1,57
8
T
rans
fers
240,
484
234,
349
(72,
135)
-
- 25
,000
-
187,
921
(4
76,0
00)
111,
937
C
harg
es f
or S
ervi
ce17
,062
,792
12
,200
,726
13
,735
,756
14
,989
,867
16
,063
,276
16
,552
,308
16
,956
,990
18
,674
,955
19
,315
,193
17
,865
,810
Cap
ital
gra
nts
and
cont
ribu
tion
s6,
581,
532
11
,416
,356
7,
216,
114
10
,009
,842
10
,516
,591
11
,421
,781
9,
456,
976
9,
394,
883
7,
998,
205
17
,774
,584
Ope
rati
ng g
rant
s an
d co
ntri
buti
ons
3,78
3,17
1
5,58
5,46
1
5,67
2,92
9
4,52
9,53
9
8,03
8,94
9
5,55
7,62
0
5,33
3,95
5
6,57
9,22
5
6,89
7,90
6
7,53
2,79
1
T
otal
Gov
ernm
enta
l act
ivit
ies
prog
ram
rev
enue
s98
,847
,238
98
,474
,592
93
,411
,315
10
0,44
2,60
2
11
1,54
9,16
8
12
6,01
8,89
3
12
2,93
4,97
2
13
4,16
9,70
3
13
4,70
6,62
5
14
4,52
3,32
2
Bus
ines
s-ty
pe a
ctiv
itie
s:
Cha
rges
for
ser
vice
s14
,267
,658
14
,895
,604
14
,813
,211
15
,635
,395
16
,878
,752
15
,991
,142
16
,858
,465
16
,368
,849
18
,052
,981
17
,162
,985
C
apit
al G
rant
s an
d C
ontr
ibut
ions
- -
- -
- -
243,
304
369,
087
982,
215
258,
586
O
pera
ting
gra
nts
and
cont
ribu
tion
s-
- -
- -
- -
- 26
8,59
9
47
2,73
5
Oth
er ta
xes
257,
977
323,
430
360,
246
417,
231
477,
190
520,
321
629,
411
806,
392
836,
332
660,
893
In
vest
men
t Ear
ning
s16
7,40
7
14
1,98
0
20
9,65
9
26
4,90
4
25
9,72
4
42
5,83
4
17
9,43
2
28
4,21
9
1,
262,
342
1,
215,
065
Mis
cell
aneo
us33
8,19
6
41
8,96
9
20
7,79
5
25
0,77
5
26
8,68
9
4,
234,
130
-
- -
-
Gai
n or
loss
on
sale
of
asse
ts-
(1,2
90,4
70)
-
- -
- -
- -
-
Tra
nsfe
rs(2
40,4
84)
(234
,349
)
72,1
35
- -
(25,
000)
-
(187
,921
)
476,
000
(111
,937
)
T
otal
Bus
ines
s ac
tivi
ties
p
rogr
am r
even
ues
14,7
90,7
54
14,2
55,1
64
15,6
63,0
46
16,5
68,3
05
17,8
84,3
55
21,1
46,4
27
17,9
10,6
12
17,6
40,6
26
21,8
78,4
69
19,6
58,3
27
T
otal
pri
mar
y go
vern
men
t
p
rogr
am r
even
ues
113,
637,
992
112,
729,
756
109,
074,
361
117,
010,
907
129,
433,
523
147,
165,
320
140,
845,
584
151,
810,
329
156,
585,
094
164,
181,
649
E
xtra
ordi
nary
Ite
ms
- 21
,123
,375
-
- -
- -
- -
- N
et r
even
ues
(ex
pen
ses)
:
Gov
ernm
enta
l Act
ivit
ies
(13,
336,
152)
367,
903
(9
,921
,883
)
(9,3
32,6
27)
2,
567,
973
11
,245
,780
8,
195,
038
(4
,044
,350
)
(10,
112,
552)
(5,6
14,4
52)
Bus
ines
s-ty
pe a
ctiv
itie
s4,
758,
800
1,
868,
503
4,
147,
886
4,
562,
452
5,
264,
417
3,
369,
818
3,
187,
924
1,
162,
471
5,
917,
665
(1
68,7
66)
T
otal
net
rev
enue
s (e
xpen
ses)
(8,5
77,3
52)
$
2,
236,
406
$
(5
,773
,997
)$
(4,7
70,1
75)
$
7,
832,
390
$
14
,615
,598
$
11
,382
,962
$
(2
,881
,879
)$
(4,1
94,8
87)
$
(5
,783
,218
)$
Sou
rce:
Cit
y of
San
Lea
ndro
Com
preh
ensi
ve A
nnua
l Fin
anci
al R
epor
t (C
AF
R)
- S
tate
men
t of
Act
ivit
ies
154
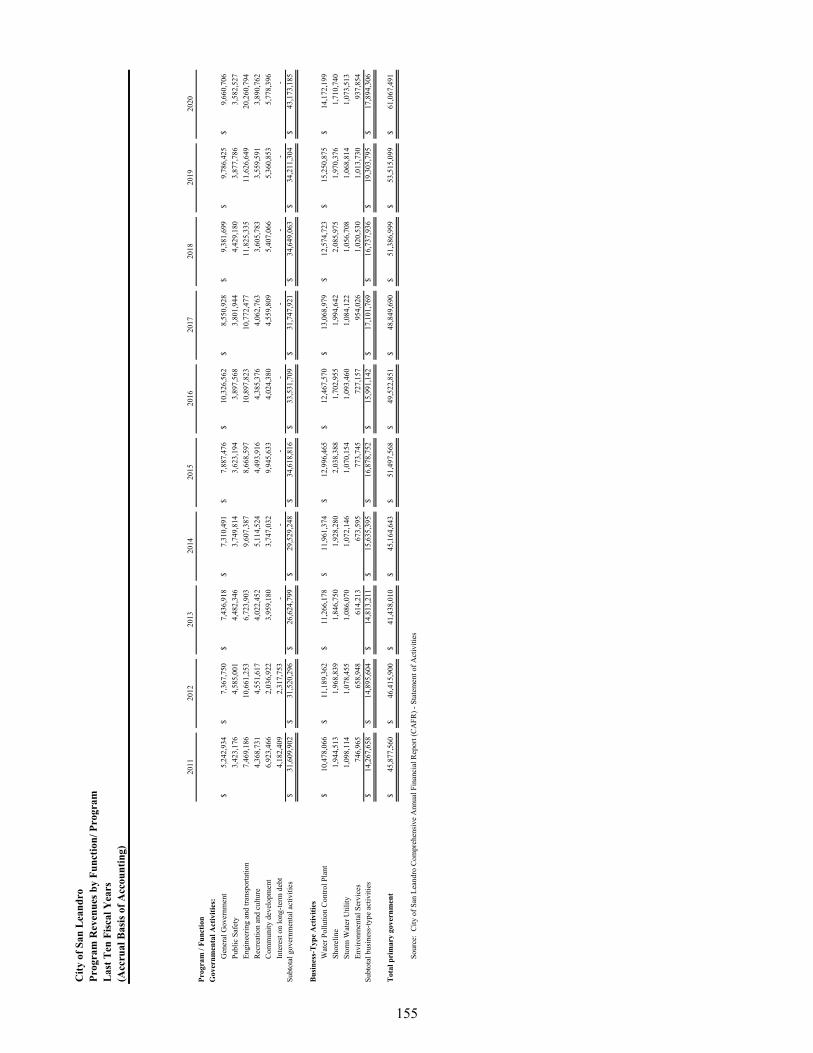
Cit
y of
San
Lea
nd
roP
rogr
am R
even
ues
by
Fu
nct
ion
/ Pro
gram
Las
t T
en F
isca
l Yea
rs(A
ccru
al B
asis
of
Acc
oun
tin
g)
2011
2012
2013
2014
2015
2016
2017
2018
2019
2020
Pro
gram
/ F
un
ctio
n
Gov
ern
men
tal A
ctiv
itie
s:
Gen
eral
Gov
ernm
ent
5,24
2,93
4$
7,
367,
750
$
7,43
6,91
8$
7,
310,
491
$
7,88
7,47
6$
10
,326
,562
$
8,
550,
928
$
9,38
1,69
9$
9,
786,
425
$
9,66
0,70
6$
Pub
lic
Saf
ety
3,42
3,17
6
4,58
5,00
1
4,48
2,34
6
3,74
9,81
4
3,62
3,19
4
3,89
7,56
8
3,80
1,94
4
4,42
9,18
0
3,87
7,78
6
3,58
2,52
7
Eng
inee
ring
and
tran
spor
tati
on7,
469,
186
10
,661
,253
6,
723,
903
9,
607,
387
8,
668,
597
10
,897
,823
10
,772
,477
11
,825
,335
11
,626
,649
20
,260
,794
Rec
reat
ion
and
cult
ure
4,36
8,73
1
4,55
1,61
7
4,02
2,45
2
5,11
4,52
4
4,49
3,91
6
4,38
5,37
6
4,06
2,76
3
3,60
5,78
3
3,55
9,59
1
3,89
0,76
2
Com
mun
ity
deve
lopm
ent
6,92
3,46
6
2,03
6,92
2
3,95
9,18
0
3,74
7,03
2
9,94
5,63
3
4,02
4,38
0
4,55
9,80
9
5,40
7,06
6
5,36
0,85
3
5,77
8,39
6
Inte
rest
on
long
-ter
m d
ebt
4,18
2,40
9
2,31
7,75
3
- -
- -
- -
- -
Sub
tota
l gov
ernm
enta
l act
ivit
ies
31,6
09,9
02$
31,5
20,2
96$
26,6
24,7
99$
29,5
29,2
48$
34,6
18,8
16$
33,5
31,7
09$
31,7
47,9
21$
34,6
49,0
63$
34,2
11,3
04$
43,1
73,1
85$
Bu
sin
ess-
Typ
e A
ctiv
itie
s
Wat
er P
ollu
tion
Con
trol
Pla
nt10
,478
,066
$
11
,189
,362
$
11
,266
,178
$
11
,961
,374
$
12
,996
,465
$
12
,467
,570
$
13
,068
,979
$
12
,574
,723
$
15
,250
,875
$
14
,172
,199
$
Sho
reli
ne1,
944,
513
1,
968,
839
1,
846,
750
1,
928,
280
2,
038,
388
1,
702,
955
1,
994,
642
2,
085,
975
1,
970,
376
1,
710,
740
Sto
rm W
ater
Uti
lity
1,09
8,11
4
1,07
8,45
5
1,08
6,07
0
1,07
2,14
6
1,07
0,15
4
1,09
3,46
0
1,08
4,12
2
1,05
6,70
8
1,06
8,81
4
1,07
3,51
3
Env
iron
men
tal S
ervi
ces
746,
965
65
8,94
8
614,
213
67
3,59
5
773,
745
72
7,15
7
954,
026
1,
020,
530
1,
013,
730
93
7,85
4
Sub
tota
l bus
ines
s-ty
pe a
ctiv
itie
s14
,267
,658
$
14
,895
,604
$
14
,813
,211
$
15
,635
,395
$
16
,878
,752
$
15
,991
,142
$
17
,101
,769
$
16
,737
,936
$
19
,303
,795
$
17
,894
,306
$
Tot
al p
rim
ary
gove
rnm
ent
45,8
77,5
60$
46,4
15,9
00$
41,4
38,0
10$
45,1
64,6
43$
51,4
97,5
68$
49,5
22,8
51$
48,8
49,6
90$
51,3
86,9
99$
53,5
15,0
99$
61,0
67,4
91$
Sou
rce:
Cit
y of
San
Lea
ndro
Com
preh
ensi
ve A
nnua
l Fin
anci
al R
epor
t (C
AF
R)
- S
tate
men
t of
Act
ivit
ies
155
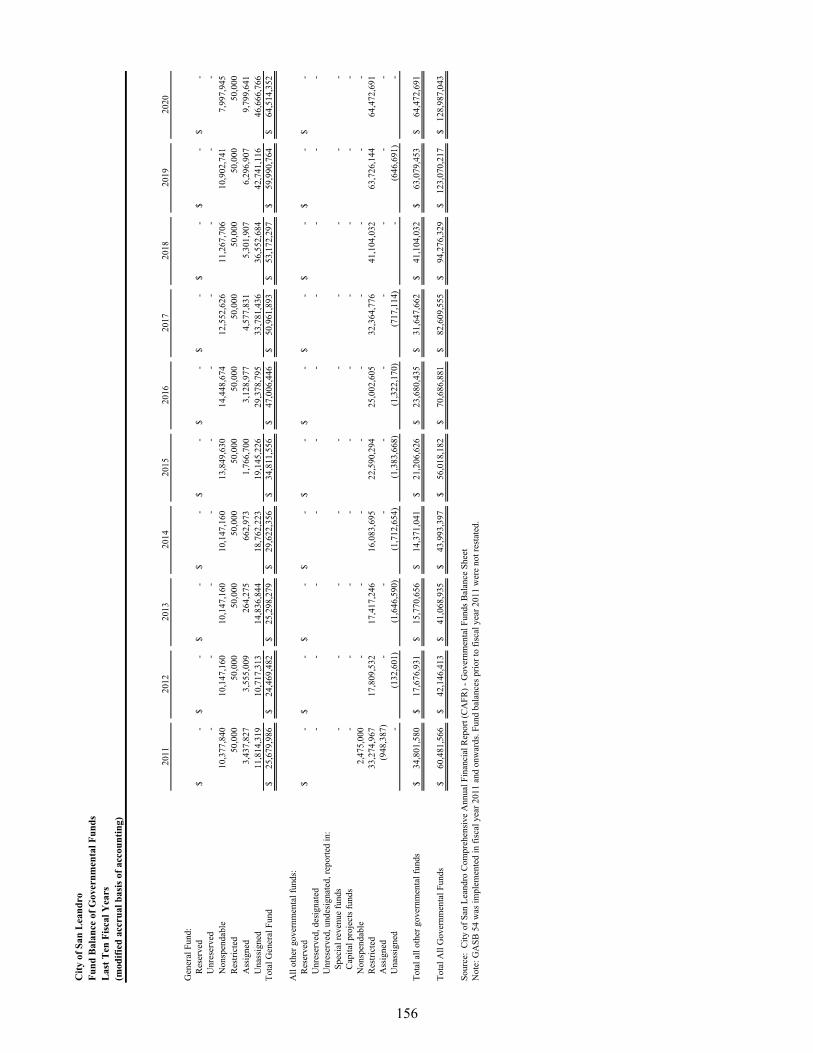
Cit
y of
San
Lea
nd
roF
un
d B
alan
ce o
f G
over
nm
enta
l Fu
nd
sL
ast
Ten
Fis
cal Y
ears
(mod
ifie
d a
ccru
al b
asis
of
acco
un
tin
g)
2011
2012
2013
2014
2015
2016
2017
2018
2019
2020
Gen
eral
Fun
d:
Res
erve
d-
$
-$
-
$
-$
-
$
-$
-
$
-$
-
$
-$
Unr
eser
ved
- -
- -
- -
- -
- -
N
onsp
enda
ble
10,3
77,8
40
10,1
47,1
60
10,1
47,1
60
10,1
47,1
60
13,8
49,6
30
14,4
48,6
74
12,5
52,6
26
11,2
67,7
06
10,9
02,7
41
7,99
7,94
5
Res
tric
ted
50,0
00
50,0
00
50,0
00
50,0
00
50,0
00
50,0
00
50,0
00
50,0
00
50,0
00
50,0
00
A
ssig
ned
3,43
7,82
7
3,
555,
009
264,
275
66
2,97
3
1,76
6,70
0
3,
128,
977
4,57
7,83
1
5,
301,
907
6,29
6,90
7
9,
799,
641
U
nass
igne
d11
,814
,319
10
,717
,313
14
,836
,844
18
,762
,223
19
,145
,226
29
,378
,795
33
,781
,436
36
,552
,684
42
,741
,116
46
,666
,766
T
otal
Gen
eral
Fun
d25
,679
,986
$
24
,469
,482
$
25
,298
,279
$
29
,622
,356
$
34
,811
,556
$
47
,006
,446
$
50
,961
,893
$
53
,172
,297
$
59
,990
,764
$
64
,514
,352
$
All
oth
er g
over
nmen
tal f
unds
:
Res
erve
d-
$
-$
-
$
-$
-
$
-$
-
$
-$
-
$
-$
Unr
eser
ved,
des
igna
ted
- -
- -
- -
- -
- -
U
nres
erve
d, u
ndes
igna
ted,
rep
orte
d in
:
Spe
cial
rev
enue
fun
ds-
- -
- -
- -
- -
-
Cap
ital
pro
ject
s fu
nds
- -
- -
- -
- -
- -
N
onsp
enda
ble
2,47
5,00
0
-
- -
- -
- -
- -
R
estr
icte
d33
,274
,967
17
,809
,532
17
,417
,246
16
,083
,695
22
,590
,294
25
,002
,605
32
,364
,776
41
,104
,032
63
,726
,144
64
,472
,691
Ass
igne
d(9
48,3
87)
- -
- -
- -
- -
-
Una
ssig
ned
- (1
32,6
01)
(1
,646
,590
)
(1,7
12,6
54)
(1
,383
,668
)
(1,3
22,1
70)
(7
17,1
14)
- (6
46,6
91)
-
Tot
al a
ll o
ther
gov
ernm
enta
l fun
ds34
,801
,580
$
17
,676
,931
$
15
,770
,656
$
14
,371
,041
$
21
,206
,626
$
23
,680
,435
$
31
,647
,662
$
41
,104
,032
$
63
,079
,453
$
64
,472
,691
$
Tot
al A
ll G
over
nmen
tal F
unds
60,4
81,5
66$
42,1
46,4
13$
41,0
68,9
35$
43,9
93,3
97$
56,0
18,1
82$
70,6
86,8
81$
82,6
09,5
55$
94,2
76,3
29$
123,
070,
217
$
12
8,98
7,04
3$
Sou
rce:
Cit
y of
San
Lea
ndro
Com
preh
ensi
ve A
nnua
l Fin
anci
al R
epor
t (C
AF
R)
- G
over
nmen
tal F
unds
Bal
ance
She
etN
ote:
GA
SB
54
was
impl
emen
ted
in f
isca
l yea
r 20
11 a
nd o
nwar
ds. F
und
bala
nces
pri
or to
fis
cal y
ear
2011
wer
e no
t res
tate
d.
156
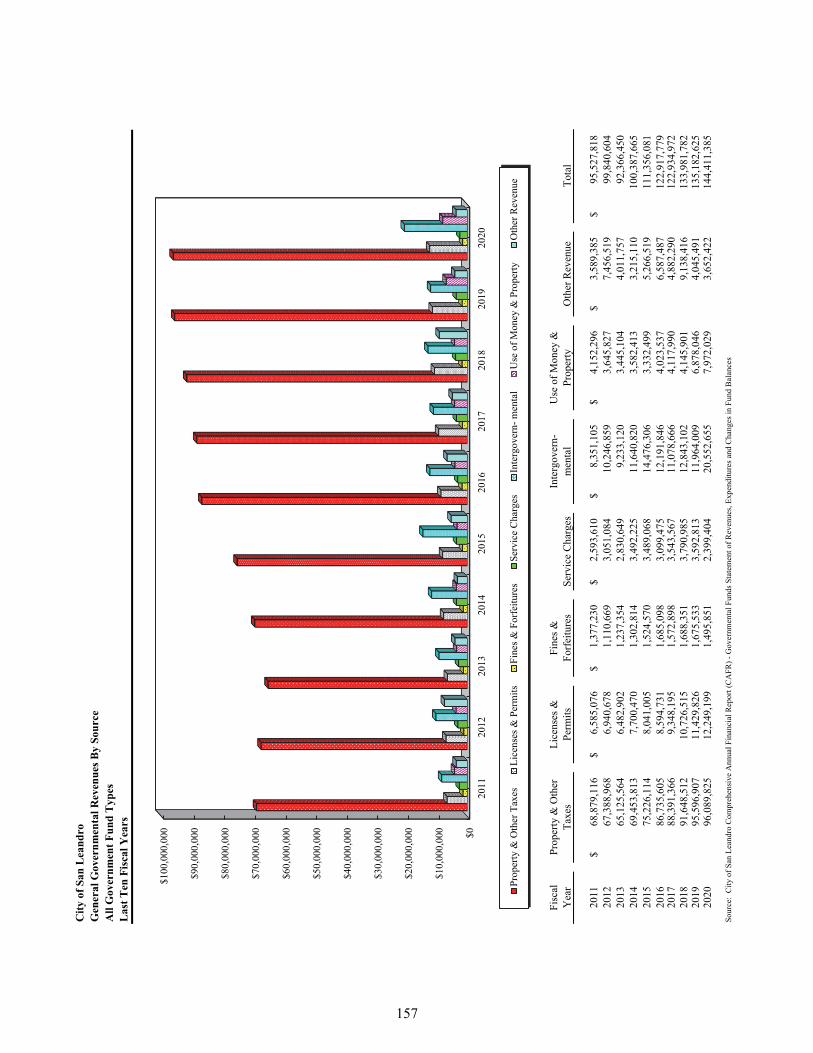
Cit
y of
San
Lea
nd
roG
ener
al G
over
nm
enta
l Rev
enu
es B
y S
ourc
eA
ll G
over
nm
ent
Fu
nd
Typ
esL
ast
Ten
Fis
cal Y
ears
Fis
cal
Yea
rP
rope
rty
& O
ther
T
axes
Lic
ense
s &
P
erm
its
Fin
es &
F
orfe
itur
esS
ervi
ce C
harg
esIn
terg
over
n-
men
tal
Use
of
Mon
ey &
P
rope
rty
Oth
er R
even
ueT
otal
2011
68,8
79,1
16$
6,
585,
076
$
1,
377,
230
$
2,
593,
610
$
8,
351,
105
$
4,15
2,29
6$
3,
589,
385
$
95,5
27,8
18$
2012
67,3
88,9
68
6,
940,
678
1,
110,
669
3,
051,
084
10
,246
,859
3,64
5,82
7
7,
456,
519
99,8
40,6
04
2013
65,1
25,5
64
6,
482,
902
1,
237,
354
2,
830,
649
9,
233,
120
3,44
5,10
4
4,
011,
757
92,3
66,4
50
2014
69,4
53,8
13
7,
700,
470
1,
302,
814
3,
492,
225
11
,640
,820
3,58
2,41
3
3,
215,
110
100,
387,
665
2015
75,2
26,1
14
8,
041,
005
1,
524,
570
3,
489,
068
14
,476
,306
3,33
2,49
9
5,
266,
519
111,
356,
081
2016
86,7
35,6
05
8,
594,
731
1,
685,
098
3,
099,
475
12
,191
,846
4,02
3,53
7
6,
587,
487
122,
917,
779
2017
88,3
91,3
66
9,
348,
195
1,
572,
898
3,
543,
567
11
,078
,666
4,11
7,99
0
4,
882,
290
122,
934,
972
2018
91,6
48,5
12
10
,726
,515
1,
688,
351
3,
790,
985
12
,843
,102
4,14
5,90
1
9,
138,
416
133,
981,
782
2019
95,5
96,9
07
11
,429
,826
1,
675,
533
3,
592,
813
11
,964
,009
6,87
8,04
6
4,
045,
491
135,
182,
625
2020
96,0
89,8
25
12
,249
,199
1,
495,
851
2,
399,
404
20
,552
,655
7,97
2,02
9
3,
652,
422
144,
411,
385
Sou
rce:
Cit
y of
San
Lea
ndro
Com
preh
ensi
ve A
nnua
l Fin
anci
al R
epor
t (C
AF
R)
- G
over
nmen
tal F
unds
Sta
tem
ent o
f R
even
ues,
Exp
endi
ture
s an
d C
hang
es in
Fun
d B
alan
ces
$0
$10,
000,
000
$20,
000,
000
$30,
000,
000
$40,
000,
000
$50,
000,
000
$60,
000,
000
$70,
000,
000
$80,
000,
000
$90,
000,
000
$100
,000
,000
2011
2012
2013
2014
2015
2016
2017
2018
2019
2020
Pro
pert
y &
Oth
er T
axes
Lic
ense
s &
Per
mit
sF
ines
& F
orfe
itur
esS
ervi
ce C
harg
esIn
terg
over
n- m
enta
lU
se o
f M
oney
& P
rope
rty
Oth
er R
even
ue
157

Cit
y of
San
Lea
nd
roC
han
ges
in F
un
d B
alan
ce o
f G
over
nm
enta
l Fu
nd
sL
ast
Ten
Fis
cal Y
ears
2011
2012
2013
2014
2015
2016
2017
2018
2019
2020
Rev
enue
s:
Pro
pert
y an
d ot
her
taxe
s68
,879
,116
$
67,3
88,9
68$
65
,125
,564
$
69,4
53,8
13$
75
,226
,114
$
86,7
35,6
05$
88
,391
,366
$
91,6
48,5
12$
95
,596
,907
$
96,0
89,8
25$
Lic
ense
s an
d pe
rmit
s6,
585,
076
6,
940,
678
6,
482,
902
7,
700,
470
8,
041,
005
8,
594,
731
9,
348,
195
10
,726
,515
11,4
29,8
26
12
,249
,199
F
ines
and
for
feit
ures
1,37
7,23
0
1,11
0,66
9
1,23
7,35
4
1,30
2,81
4
1,52
4,57
0
1,68
5,09
8
1,57
2,89
8
1,68
8,35
1
1,67
5,53
3
1,49
5,85
1
S
ervi
ce c
harg
es2,
593,
610
3,
051,
084
2,
830,
649
3,
492,
225
3,
489,
068
3,
099,
475
3,
543,
567
3,
790,
985
3,
592,
813
2,
399,
404
Inte
rgov
ernm
enta
l8,
351,
105
10
,246
,859
9,23
3,12
0
11,6
40,8
20
14
,476
,306
12,1
91,8
46
11
,078
,666
12,8
43,1
02
11
,964
,009
20,5
52,6
55
Use
of
mon
ey a
nd p
rope
rty
4,15
2,29
6
3,64
5,82
7
3,44
5,10
4
3,58
2,41
3
3,34
0,94
6
4,02
3,53
7
4,11
7,99
0
4,14
5,90
1
6,87
8,04
6
7,97
2,02
9
In
terg
over
nmen
tal
2,29
5,29
3
2,40
1,86
9
2,00
1,92
8
2,00
2,13
9
2,25
0,26
6
1,99
9,87
8
1,99
9,87
8
1,99
9,87
8
1,99
9,87
8
1,99
9,87
8
O
ther
1,29
4,09
2
5,05
4,65
0
2,00
9,82
9
1,21
2,97
1
3,00
7,80
6
4,58
7,60
9
2,88
2,41
2
7,13
8,53
8
2,04
5,61
3
1,65
2,54
4
Tot
al r
even
ues
95,5
27,8
18
99
,840
,604
92,3
66,4
50
10
0,38
7,66
5
11
1,35
6,08
1
12
2,91
7,77
9
12
2,93
4,97
2
13
3,98
1,78
2
13
5,18
2,62
5
14
4,41
1,38
5
Exp
endi
ture
s:
Cur
rent
:
Gen
eral
gov
ernm
ent
9,68
4,29
3
9,94
3,87
1
12,9
93,1
78
11
,350
,118
11,7
20,9
94
11
,846
,864
11,4
93,2
08
11
,679
,072
12,3
05,7
56
13
,109
,392
P
ubli
c sa
fety
43,7
27,6
41
68
,789
,652
46,4
37,9
60
46
,983
,838
49,4
41,4
22
52
,258
,892
54,7
32,1
67
60
,034
,363
62,3
92,4
36
64
,708
,745
E
ngin
eeri
ng a
nd tr
ansp
orta
tion
12,2
31,3
07
9,
778,
421
14
,550
,085
19,3
10,4
89
17
,905
,896
19,1
85,6
57
19
,487
,997
25,6
48,7
73
24
,132
,999
28,7
81,6
33
Rec
reat
ion
and
cult
ure
9,56
0,87
8
8,37
3,42
7
10,2
74,4
96
10
,244
,659
10,4
81,5
28
12
,214
,366
11,8
45,9
86
11
,898
,321
11,1
01,8
82
10
,999
,381
C
omm
unit
y de
velo
pmen
t11
,342
,937
9,23
6,77
3
4,31
1,19
4
5,13
8,37
6
5,70
8,94
5
6,48
0,12
5
7,70
0,15
8
8,24
4,05
6
9,13
2,31
0
14,6
99,4
07
C
apit
al O
utla
y-
5,76
3,82
6
- -
- -
- -
- -
Deb
t ser
vice
:
Pri
ncip
al3,
175,
797
3,
511,
866
1,
577,
051
2,
271,
828
2,
524,
833
2,
549,
397
18
,960
,762
3,20
6,33
0
3,48
0,53
7
3,66
8,15
6
I
nter
est a
nd f
ees
4,24
7,97
3
3,04
3,07
0
2,60
5,76
1
2,16
3,89
5
2,29
9,28
6
1,96
3,77
9
2,19
6,15
7
1,74
4,08
2
2,20
7,84
1
2,41
7,75
5
Tot
al e
xpen
ditu
res
93,9
70,8
26
11
8,44
0,90
6
92
,749
,725
97,4
63,2
03
10
0,08
2,90
4
10
6,49
9,08
0
12
6,41
6,43
5
12
2,45
4,99
7
12
4,75
3,76
1
13
8,38
4,46
9
Exc
ess
(def
icie
ncy
of r
even
ues
over
(un
der)
e
xpen
ditu
res
1,55
6,99
2
(18,
600,
302)
(383
,275
)
2,92
4,46
2
11,2
73,1
77
16
,418
,699
(3,4
81,4
63)
11,5
26,7
85
10
,428
,864
6,02
6,91
6
Oth
er f
inan
cing
Sou
rces
(us
es):
Is
suan
ce o
f ca
pita
l lea
se-
- -
- -
- -
- -
-
Pro
ceed
s fr
om r
efun
ding
of
bond
s-
- (9
,817
,009
)
-
- -
- -
- -
P
aym
ent t
o re
fund
ed b
onds
esc
row
s ag
ents
- -
- -
- -
- -
- -
T
rans
fers
in8,
290,
220
6,
029,
970
57
7,00
0
77
6,00
0
2,
604,
156
3,
877,
017
4,
193,
000
10
,345
,878
28,1
98,3
33
6,
425,
000
Tra
nsfe
rs o
ut(9
,099
,736
)
(5
,775
,621
)
(1
,606
,599
)
(7
76,0
00)
(2
,604
,156
)
(5
,627
,017
)
(1
0,45
3,00
0)
(1
0,20
5,88
9)
(3
0,04
7,66
0)
(6
,535
,090
)
Bon
ds P
roce
eds
- -
- -
- -
- -
- -
L
oan
Pro
ceed
s-
- -
- -
- -
- -
-
Lea
se P
roce
eds
- -
- -
- -
- -
- -
Is
suan
ce o
f D
ebt
- 18
,305
,000
10
,152
,405
- -
- 21
,664
,137
- 20
,214
,351
-
Tot
al o
ther
fin
anci
ng s
ourc
es (
uses
)(8
09,5
16)
18
,559
,349
(694
,203
)
- -
(1,7
50,0
00)
15,4
04,1
37
13
9,98
9
18
,365
,024
(110
,090
)
Pri
or p
erio
d re
stat
emen
t-
- -
- -
- -
- -
-
Net
cha
nge
in f
und
bala
nces
747,
476
$
(40,
953)
$
(1,0
77,4
78)
$
2,92
4,46
2$
11,2
73,1
77$
14
,668
,699
$
11,9
22,6
74$
11
,666
,774
$
28,7
93,8
88$
5,
916,
826
$
Deb
t Ser
vice
s as
a p
erce
ntag
e of
no
ncap
ital
exp
endi
ture
s9.
29%
5.64
%4.
81%
4.78
%4.
83%
4.39
%17
.40%
4.32
%4.
68%
4.50
%
Sou
rces
: C
ity
of S
an L
eand
ro C
ompr
ehen
sive
Ann
ual F
inan
cial
Rep
ort (
CA
FR
) -
Gov
ernm
enta
l Fun
ds S
tate
men
t of
Rev
enue
s, E
xpen
ditu
res
and
Cha
nges
in F
und
Bal
ance
s
Cit
y of
San
Lea
ndro
Com
preh
ensi
ve A
nnua
l Fin
anci
al R
epor
t (C
AF
R)
- R
econ
cili
atio
n of
the
Net
Cha
nge
in F
und
Bal
ance
s -
Tot
al G
over
nmen
t Fun
ds w
ith
the
Sta
tem
ent o
f A
ctiv
itie
s
158
REVENUE CAPACITY
Direct and Overlapping Property Tax Rates - Last Ten Fiscal Years
Assessed Value of Taxable Property - Last Ten Fiscal Years
Net Assessed Value of Property by Use Code, Citywide - Last Three Fiscal Year
Principal Property Tax Payers - Current Year and Nine Years Ago
Property Tax Levies and Collections - Last Ten Fiscal Years
Historical Sales Tax Amount by Benchmark Year - Last Nine Calendar Years at Quarter 1 (Q1)
Principal Sales Tax Producers - Last Fiscal Year and Nine Years Ago
Sewer Rates - Last Ten Fiscal Years
Number of Permits and Valuation of Taxable Transactions - Last Ten Calendar Years
These schedules contain information to help the reader assess the city's most significant local revenue sources, sales tax and property tax.
159


Cit
y of
San
Lea
nd
roD
irec
t an
d O
verl
app
ing
Pro
per
ty T
ax R
ates
(Rat
e p
er $
1,00
0 of
ass
esse
d v
alu
e)L
ast
Ten
Fis
cal Y
ears
2011
2012
2013
2014
2015
2016
2017
2018
2019
2020
Bas
ic C
ity
and
Cou
nty
Lev
y
Cit
y of
San
Lea
ndro
0.15
6681
0.15
6681
0.15
6681
0.15
6681
0.15
6681
0.15
6681
0.15
6681
0.15
6681
0.15
6681
0.15
6681
Cou
nty
of A
lam
eda
0.84
3319
0.84
3319
0.84
3319
0.84
3319
0.84
3319
0.84
3319
0.84
3319
0.84
3319
0.84
3319
0.84
3319
Tot
al B
asic
Lev
y1.
0000
001.
0000
001.
0000
001.
0000
001.
0000
001.
0000
001.
0000
001.
0000
001.
0000
001.
0000
00
Ove
rrid
e A
sses
smen
ts
Cou
nty
GO
Bon
d0.
0000
000.
0000
000.
0000
000.
0000
000.
0000
000.
0000
000.
0000
000.
0000
000.
0112
000.
0108
00
San
Lea
ndro
Uni
fied
Sch
ool B
ond
0.08
9700
0.11
0800
0.10
8500
0.11
8800
0.13
1000
0.12
1500
0.11
7900
0.14
0600
0.13
3500
0.13
2500
Cha
bot-
Las
Pos
itas
Col
lege
Bon
d0.
0211
000.
0214
000.
0219
000.
0214
000.
0217
000.
0198
000.
0246
000.
0445
000.
0443
000.
0422
00
Bay
Are
a R
apid
Tra
nsit
0.00
8400
0.00
7100
0.00
5100
0.00
7500
0.00
4500
0.00
2600
0.00
8000
0.00
8400
0.00
7000
0.01
2000
Eas
t Bay
Reg
iona
l Par
k0.
0031
000.
0041
000.
0043
000.
0078
000.
0085
000.
0067
000.
0032
000.
0021
000.
0057
000.
0060
00
Tot
al O
verr
ide
Rat
e0.
1223
000.
1434
000.
1398
000.
1555
000.
1657
000.
1506
000.
1537
000.
1956
000.
2017
000.
2035
00
Tot
al T
ax R
ate
1.12
2300
1.14
3400
1.13
9800
1.15
5500
1.16
5700
1.15
0600
1.15
3700
1.19
5600
1.20
1700
1.20
3500
Sou
rces 1)
Cou
nty
Aud
itor
/Con
trol
ler
data
, Ave
nu I
nsig
hts
& A
naly
tics
2)20
18-1
9 an
d pr
ior,
pre
viou
sly
publ
ishe
d C
AF
R R
epor
t
Not
e: T
RA
s 10
-001
is r
epre
sent
ed f
or th
is r
epor
t.
161

Cit
y of
San
Lea
nd
roA
sses
sed
Val
ue
of T
axab
le P
rop
erty
Las
t T
en F
isca
l Yea
rs(I
n T
hou
san
ds)
Fis
cal Y
ear
En
ded
Ju
ne
30S
ecu
red
P
rop
erty
Un
secu
red
P
rop
erty
Les
s:
Exe
mp
tion
s
Tax
able
A
sses
sed
V
alu
eS
ecu
red
P
rop
erty
Un
secu
red
P
rop
erty
Les
s:
Exe
mp
tion
sT
axab
le
Ass
esse
d V
alu
eT
otal
Tax
R
ate
(1)
Tax
able
Ass
esse
d
Val
ue
Est
imat
ed
Act
ual
Tax
able
V
alu
e (2
)F
acto
r of
Tax
able
A
sses
sed
Val
ue
(2)
2011
5,50
2,60
0$
17
5,34
5$
10
8,03
3$
5,
569,
912
$
3,
599,
645
$
39
5,24
3$
110,
812
$
3,88
4,07
6$
1.
1223
9,45
3,98
8$
-$
-
$
2012
5,54
0,71
3
12
6,35
3
15
,376
5,
651,
690
3,
568,
829
40
6,08
4
208,
631
3,76
6,28
2
1.
1434
9,41
7,97
2
- -
2013
6,01
5,78
7
14
7,94
8
11
3,08
6
6,
050,
649
3,
570,
284
38
2,53
2
123,
831
3,82
8,98
5
1.
1398
9,87
9,63
4
- -
2014
5,89
9,07
7
15
3,30
0
18
3,51
1
5,
868,
866
4,
365,
737
35
9,50
8
139,
085
4,58
6,16
0
1.
1555
10,4
55,0
26
-
- 20
156,
310,
548
152,
421
196,
657
6,26
6,31
2
4,69
4,15
9
367,
800
90
7,97
3
4,
153,
986
1.16
5710
,420
,298
13,8
08,6
66
1.32
5220
167,
795,
139
197,
971
178,
848
7,81
4,26
2
3,89
9,19
4
371,
143
89
2,30
6
3,
378,
031
1.16
5711
,192
,293
15,9
38,4
74
1.42
4120
178,
243,
336
235,
839
334,
516
8,14
4,65
9
3,99
5,30
8
404,
452
85
1,65
1
3,
548,
110
1.15
3711
,692
,768
20,7
67,7
72
1.77
6120
188,
775,
315
229,
625
319,
941
8,68
4,99
9
4,19
5,62
2
413,
077
88
0,57
0
3,
728,
128
1.19
5612
,413
,128
18,0
25,2
39
1.45
2120
199,
283,
562
281,
710
355,
814
9,20
9,45
7
4,42
4,46
0
473,
473
89
4,21
2
4,
003,
721
1.20
1713
,213
,179
21,1
02,3
45
1.59
7120
209,
780,
976
301,
691
362,
978
9,71
9,68
9
4,79
6,14
6
544,
368
95
6,21
3
4,
384,
301
1.20
3514
,103
,990
20,9
36,3
15
1.48
44
Sou
rce:
Cou
nty
Ass
esso
r D
ata,
Ave
nu I
nsig
hts
& A
naly
tics
Sou
rce:
201
8-19
and
pri
or, p
revi
ousl
y pu
blis
hed
CA
FR
Rep
ort
Tab
le h
as b
een
rest
ated
fro
m p
revi
ous
year
s to
sho
w c
ity
and
succ
esso
r ag
ency
val
ues
excl
usiv
ely
Tab
le d
oes
not i
nclu
de s
tate
uni
tary
val
ue o
f $2
,702
,056
Not
es:
(-)
Dat
a U
nava
ilab
le
(1)
Tot
al d
irec
t tax
rat
e is
rep
rese
nted
by
TR
A 1
0-00
1(2
)Est
imat
ed A
ctua
l Val
ue is
der
ived
fro
m a
ser
ies
of c
alcu
lati
ons
com
pari
ng m
edia
n as
sess
ed v
alue
s fr
om 1
940
to c
urre
nt m
edia
n sa
le p
rice
s.B
ased
on
thes
e ca
lcul
atio
ns a
mul
tipl
ier
valu
e w
as e
xtra
pola
ted
and
appl
ied
to c
urre
nt a
sses
sed
valu
es.
Cit
y (E
xcl S
ucc
esso
r A
gen
cy)
Su
cces
sor
Age
ncy
Cit
y W
ide
162
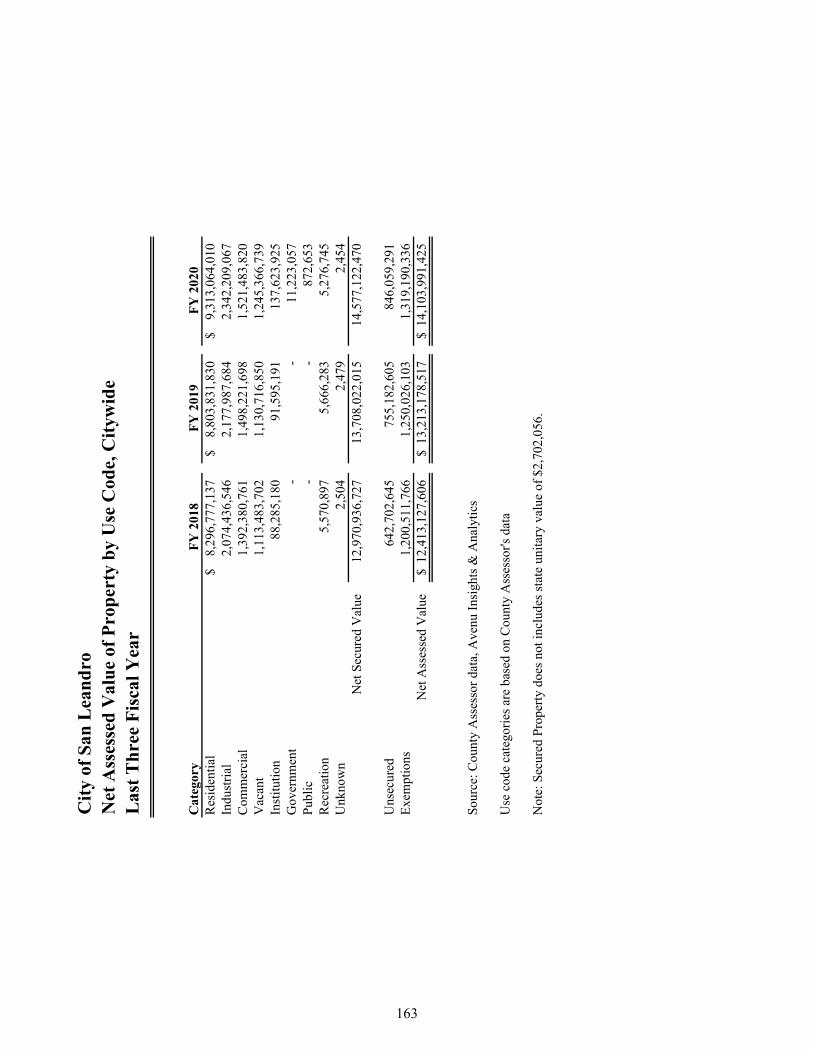
Cit
y of
San
Lea
nd
roN
et A
sses
sed
Val
ue
of P
rop
erty
by
Use
Cod
e, C
ityw
ide
Las
t T
hre
e F
isca
l Yea
r
Cat
egor
yF
Y 2
018
FY
201
9F
Y 2
020
Res
iden
tial
8,29
6,77
7,13
7$
8,
803,
831,
830
$
9,31
3,06
4,01
0$
In
dust
rial
2,07
4,43
6,54
6
2,
177,
987,
684
2,34
2,20
9,06
7
C
omm
erci
al1,
392,
380,
761
1,49
8,22
1,69
8
1,
521,
483,
820
Vac
ant
1,11
3,48
3,70
2
1,
130,
716,
850
1,24
5,36
6,73
9
In
stit
utio
n88
,285
,180
91,5
95,1
91
13
7,62
3,92
5
Gov
ernm
ent
- -
11,2
23,0
57
P
ubli
c-
- 87
2,65
3
Rec
reat
ion
5,57
0,89
7
5,66
6,28
3
5,27
6,74
5
Unk
now
n2,
504
2,
479
2,
454
N
et S
ecur
ed V
alue
12,9
70,9
36,7
27
13
,708
,022
,015
14,5
77,1
22,4
70
Uns
ecur
ed64
2,70
2,64
5
755,
182,
605
84
6,05
9,29
1
Exe
mpt
ions
1,20
0,51
1,76
6
1,
250,
026,
103
1,31
9,19
0,33
6
N
et A
sses
sed
Val
ue12
,413
,127
,606
$
13,2
13,1
78,5
17$
14
,103
,991
,425
$
Sou
rce:
Cou
nty
Ass
esso
r da
ta, A
venu
Ins
ight
s &
Ana
lyti
cs
Use
cod
e ca
tego
ries
are
bas
ed o
n C
ount
y A
sses
sor's
dat
a
Not
e: S
ecur
ed P
rope
rty
does
not
incl
udes
sta
te u
nita
ry v
alue
of
$2,7
02,0
56.
163
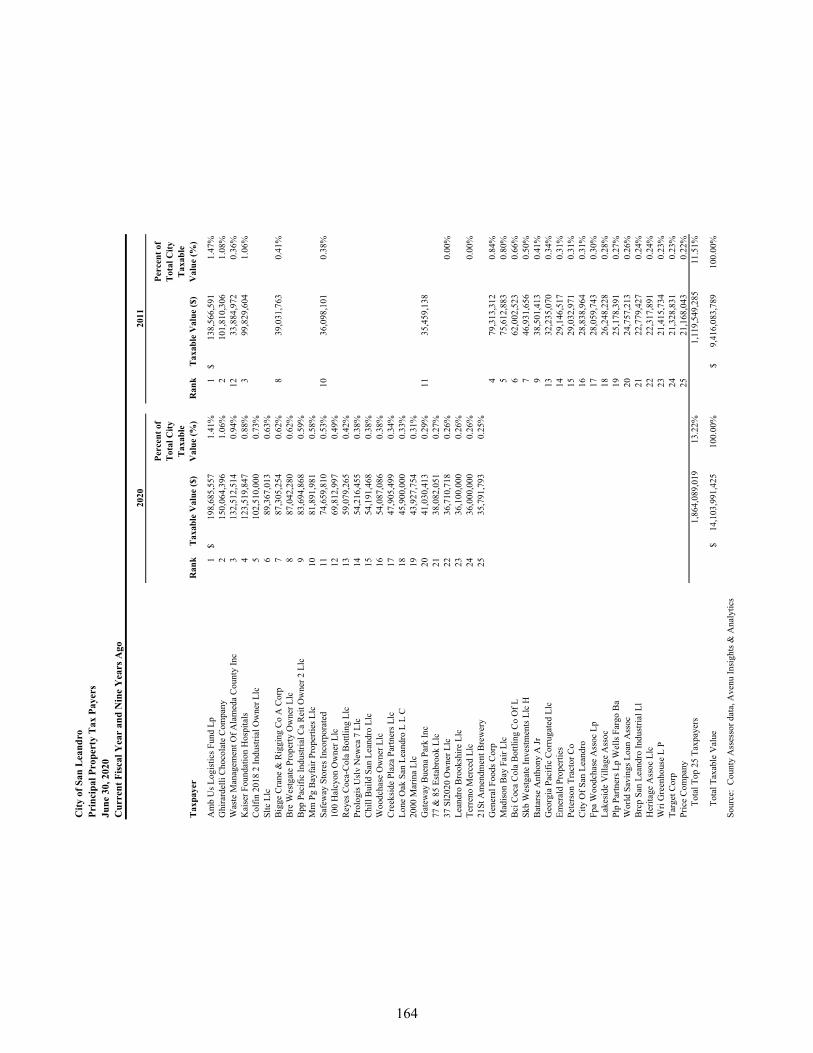
Cit
y of
San
Lea
nd
roP
rin
cip
al P
rop
erty
Tax
Pay
ers
Jun
e 30
, 202
0C
urr
ent
Fis
cal Y
ear
and
Nin
e Y
ears
Ago
Tax
pay
erR
ank
Tax
able
Val
ue
($)
Per
cen
t of
T
otal
Cit
y T
axab
le
Val
ue
(%)
Ran
kT
axab
le V
alu
e ($
)
Per
cen
t of
T
otal
Cit
y T
axab
le
Val
ue
(%)
Am
b U
s L
ogis
tics
Fun
d L
p1
19
8,68
5,55
7$
1.41
%1
13
8,56
6,59
1$
1.47
%G
hira
rdel
li C
hoco
late
Com
pany
2
150,
064,
396
1.
06%
2
101,
810,
306
1.
08%
Was
te M
anag
emen
t Of
Ala
med
a C
ount
y In
c3
13
2,51
2,51
4
0.94
%12
33,8
84,9
72
0.36
%K
aise
r F
ound
atio
n H
ospi
tals
4
123,
519,
847
0.
88%
3
99,8
29,6
04
1.06
%C
olfi
n 20
18 2
Ind
ustr
ial O
wne
r L
lc5
10
2,51
0,00
0
0.73
%S
ltc
Llc
6
89,3
67,0
13
0.63
%B
igge
Cra
ne &
Rig
ging
Co
A C
orp
7
87,3
05,2
54
0.62
%8
39
,031
,763
0.
41%
Bre
Wes
tgat
e P
rope
rty
Ow
ner
Llc
8
87,0
42,2
80
0.62
%B
pp P
acif
ic I
ndus
tria
l Ca
Rei
t Ow
ner
2 L
lc9
83
,694
,868
0.
59%
Mm
Pg
Bay
fair
Pro
pert
ies
Llc
10
81
,891
,981
0.
58%
Saf
eway
Sto
res
Inco
rpor
ated
11
74
,659
,810
0.
53%
10
36
,098
,101
0.
38%
100
Hal
cyon
Ow
ner
Llc
12
69
,812
,997
0.
49%
Rey
es C
oca-
Col
a B
ottl
ing
Llc
13
59
,079
,265
0.
42%
Pro
logi
s U
slv
New
ca 7
Llc
14
54
,216
,455
0.
38%
Chi
ll B
uild
San
Lea
ndro
Llc
15
54
,191
,468
0.
38%
Woo
dcha
se O
wne
r L
lc16
54,0
87,0
86
0.38
%C
reek
side
Pla
za P
artn
ers
Llc
17
47
,905
,499
0.
34%
Lon
e O
ak S
an L
eand
ro L
L C
18
45
,900
,000
0.
33%
2000
Mar
ina
Llc
19
43
,927
,754
0.
31%
Gat
eway
Bue
na P
ark
Inc
20
41
,030
,413
0.
29%
11
35
,459
,138
77
& 8
5 E
stab
rook
Llc
21
38
,082
,051
0.
27%
37 S
l202
0 O
wne
r L
lc22
36,7
10,7
18
0.26
%0.
00%
Lea
ndro
Bro
oksh
ire
Llc
23
36
,100
,000
0.
26%
Ter
reno
Mer
ced
Llc
24
36
,000
,000
0.
26%
0.00
%21
St A
men
dmen
t Bre
wer
y25
35,7
91,7
93
0.25
%G
ener
al F
oods
Cor
p4
79
,313
,312
0.
84%
Mad
ison
Bay
Fai
r L
lc5
75
,612
,883
0.
80%
Bci
Coc
a C
ola
Bot
tlin
g C
o O
f L
6
62,0
02,5
23
0.66
%S
kb W
estg
ate
Inve
stm
ents
Llc
H7
46
,931
,656
0.
50%
Bat
arse
Ant
hony
A J
r9
38
,501
,413
0.
41%
Geo
rgia
Pac
ific
Cor
ruga
ted
Llc
13
32
,235
,070
0.
34%
Em
eral
d P
rope
rtie
s14
29,1
46,5
17
0.31
%P
eter
son
Tra
ctor
Co
15
29
,032
,971
0.
31%
Cit
y O
f S
an L
eand
ro16
28,8
38,9
64
0.31
%F
pa W
oodc
hase
Ass
oc L
p17
28,0
59,7
43
0.30
%L
akes
ide
Vil
lage
Ass
oc18
26,2
48,2
28
0.28
%P
lp P
artn
ers
Lp
Wel
ls F
argo
Ba
19
25
,178
,391
0.
27%
Wor
ld S
avin
gs L
oan
Ass
oc20
24,7
57,2
13
0.26
%B
rcp
San
Lea
ndro
Ind
ustr
ial L
l21
22,7
79,4
27
0.24
%H
erit
age
Ass
oc L
lc22
22,3
17,8
91
0.24
%W
ri G
reen
hous
e L
P23
21,4
15,7
34
0.23
%T
arge
t Cor
p24
21,3
28,8
31
0.23
%P
rice
Com
pan y
25
21
,168
,043
0.
22%
T
otal
Top
25
Tax
paye
rs1,
864,
089,
019
13.2
2%1,
119,
549,
285
11.5
1%
T
otal
Tax
able
Val
ue14
,103
,991
,425
$
10
0.00
%9,
416,
083,
789
$
100.
00%
Sou
rce:
Cou
nty
Ass
esso
r da
ta, A
venu
Ins
ight
s &
Ana
lyti
cs
2020
2011
164
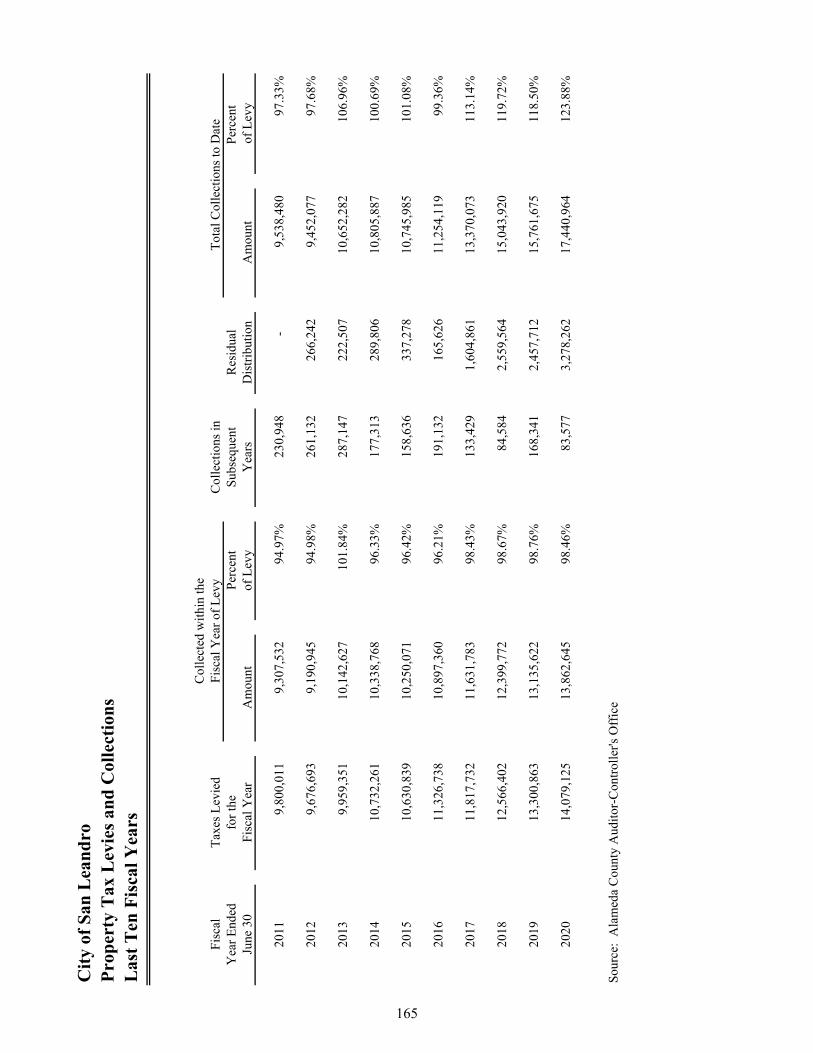
Cit
y of
San
Lea
nd
roP
rop
erty
Tax
Lev
ies
and
Col
lect
ion
sL
ast
Ten
Fis
cal Y
ears
Fis
cal
Tax
es L
evie
dC
olle
ctio
ns in
Yea
r E
nded
for
the
Per
cent
Sub
sequ
ent
Res
idua
lP
erce
nt
June
30
Fis
cal Y
ear
Am
ount
of L
evy
Yea
rsD
istr
ibut
ion
Am
ount
of L
evy
2011
9,80
0,01
1
9,30
7,53
2
94.9
7%23
0,94
8
- 9,
538,
480
97
.33%
2012
9,67
6,69
3
9,19
0,94
5
94.9
8%26
1,13
2
266,
242
9,
452,
077
97
.68%
2013
9,95
9,35
1
10,1
42,6
27
10
1.84
%28
7,14
7
222,
507
10
,652
,282
10
6.96
%
2014
10,7
32,2
61
10,3
38,7
68
96
.33%
177,
313
28
9,80
6
10,8
05,8
87
100.
69%
2015
10,6
30,8
39
10,2
50,0
71
96
.42%
158,
636
33
7,27
8
10,7
45,9
85
101.
08%
2016
11,3
26,7
38
10,8
97,3
60
96
.21%
191,
132
16
5,62
6
11,2
54,1
19
99.3
6%
2017
11,8
17,7
32
11,6
31,7
83
98
.43%
133,
429
1,
604,
861
13,3
70,0
73
113.
14%
2018
12,5
66,4
02
12,3
99,7
72
98
.67%
84,5
84
2,55
9,56
4
15
,043
,920
11
9.72
%
2019
13,3
00,8
63
13,1
35,6
22
98
.76%
168,
341
2,
457,
712
15,7
61,6
75
118.
50%
2020
14,0
79,1
25
13,8
62,6
45
98
.46%
83,5
77
3,27
8,26
2
17
,440
,964
12
3.88
%
Sou
rce:
Ala
med
a C
ount
y A
udit
or-C
ontr
olle
r's O
ffic
e
Col
lect
ed w
ithi
n th
eF
isca
l Yea
r of
Lev
yT
otal
Col
lect
ions
to D
ate
165

Cit
y of
San
Lea
nd
roH
isto
rica
l Sal
es T
ax A
mou
nt
by
Ben
chm
ark
Yea
rL
ast
Nin
e F
isca
l Yea
rs a
t Q
uar
ter
1 (Q
1)(I
n T
hou
san
ds)
2020
Q1
2019
Q1
2018
Q1
2017
Q1
2016
Q1
2015
Q1
2014
Q1
2013
Q1
2012
Q1
Acc
omm
odat
ion
and
Foo
d S
ervi
ces
2,25
7,50
8$
2,25
7,31
4$
2,10
6,28
4$
1,93
6,52
8$
1,78
9,26
1$
1,55
3,12
0$
1,44
5,23
8$
1,25
9,63
0$
1,18
0,91
9$
Agr
icul
ture
, For
estr
y, F
ishi
ng a
nd H
unti
ng29
1,65
2
30
7,71
3
29
4,09
7
33
0,19
5
27
2,56
7
31
7,66
0
19
8,97
1
19
1,30
1
14
2,20
1
Art
s, E
nter
tain
men
t, an
d R
ecre
atio
n1,
020
96
1
1,05
5
1,16
4
3,90
6
9,30
9
8,51
6
9,18
5
8,91
1
Con
stru
ctio
n2,
230,
270
1,
526,
046
1,
652,
249
1,
486,
772
1,
909,
746
1,
541,
014
1,
226,
263
1,
075,
288
1,
069,
906
Edu
cati
onal
Ser
vice
s13
,563
19
,452
26
,226
13
,790
8,
747
11
,553
6,
896
4,
448
3,
984
Info
rmat
ion
78,9
95
89,6
55
85,5
57
84,1
41
74,1
44
79,5
50
55,2
95
53,1
08
141,
275
Man
ufac
turi
ng1,
812,
944
1,
568,
875
1,
904,
956
3,
337,
097
3,
640,
956
3,
163,
571
1,
550,
292
1,
333,
638
1,
395,
599
Min
ing,
Qua
rryi
ng, a
nd O
il a
nd G
as E
xtra
ctio
n2,
696,
782
2,
593,
700
2,
208,
773
1,
885,
403
1,
700,
702
1,
658,
736
1,
692,
608
1,
502,
822
1,
646,
870
Oth
er S
ervi
ces
(exc
ept P
ubli
c A
dmin
istr
atio
n)29
4,57
1
27
7,37
1
33
8,94
6
30
3,06
5
32
3,41
2
26
9,19
9
24
5,24
4
21
0,14
9
18
8,09
1
Pro
fess
iona
l, S
cien
tifi
c, a
nd T
echn
ical
Ser
vice
s19
5,88
5
19
5,36
3
18
9,80
5
21
1,07
4
20
9,55
8
16
6,24
7
11
4,73
0
10
5,98
9
15
1,61
9
Rea
l Est
ate
and
Ren
tal a
nd L
easi
ng21
1,39
0
28
8,22
0
15
9,32
1
15
7,39
3
21
1,46
4
19
4,12
4
22
1,08
4
21
1,35
5
13
8,90
1
Ret
ail T
rade
16,6
11,8
01
16,8
48,9
09
16,7
50,9
69
15,6
00,3
77
14,5
43,6
27
13,6
51,9
87
13,3
25,5
13
12,4
90,2
79
11,6
71,0
08
Uti
liti
es76
8,89
9
66
6,19
9
58
1,12
4
55
7,61
4
51
6,30
8
50
3,14
0
48
0,99
5
41
0,90
8
36
4,72
3
All
Oth
er S
ecto
rs24
8,47
4
25
2,93
2
23
3,12
4
19
2,56
5
19
8,57
5
28
6,36
8
27
3,59
0
26
6,69
0
34
4,99
1
TO
TA
L27
,713
,754
$
26
,892
,710
$
26
,532
,483
$
26
,097
,177
$
25
,402
,974
$
23
,405
,580
$
20
,845
,236
$
19
,124
,790
$
18
,448
,998
$
Sou
rce:
Ave
nu I
nsig
hts
& A
naly
tics
Not
e:
The
dat
a co
ntai
ned
in th
is r
epor
t is
econ
omic
and
ther
efor
e co
nsta
ntly
cha
ngin
g as
adj
ustm
ents
, fun
d tr
ansf
ers,
late
fil
ings
and
aud
its
are
reco
rded
.
The
cat
egor
ies
list
ed in
pre
viou
s re
port
s w
ere
base
d on
SB
OE
NA
ICS
cod
es a
nd h
ave
been
upd
ated
to r
efle
ct c
urre
nt u
pdat
ed C
DT
FA
sta
ndar
ds.
166
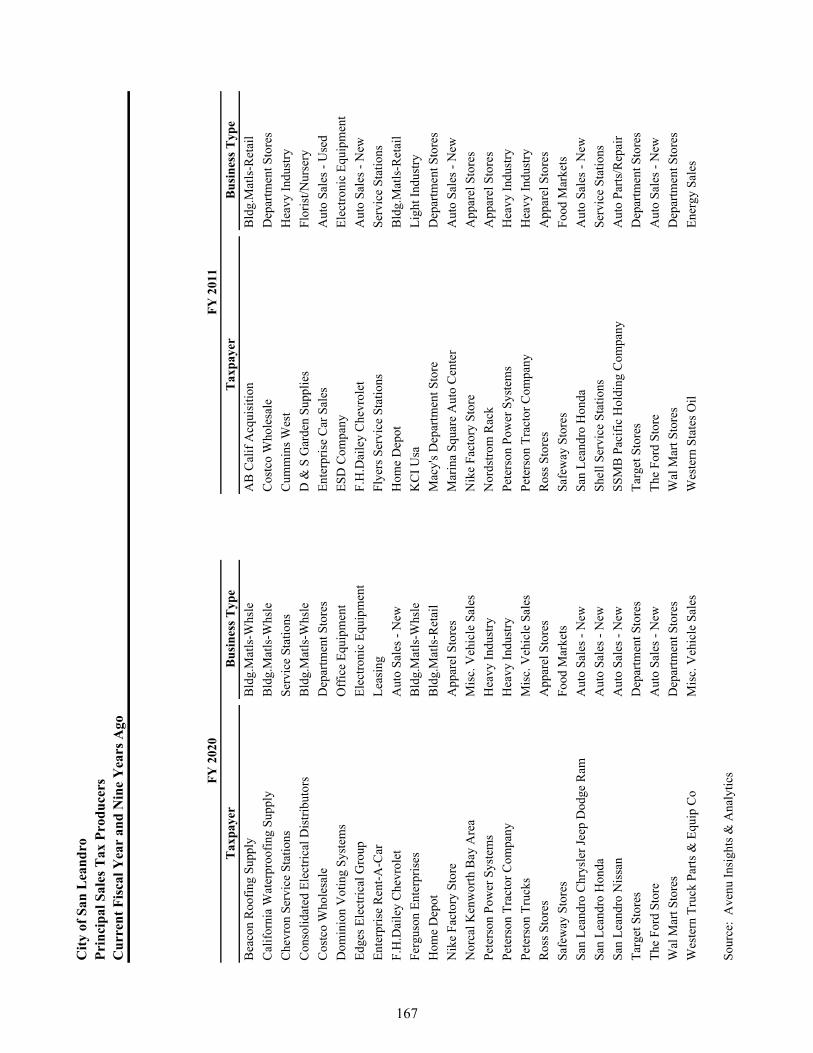
Cit
y of
San
Lea
nd
roP
rin
cip
al S
ales
Tax
Pro
du
cers
C
urr
ent
Fis
cal Y
ear
and
Nin
e Y
ears
Ago
Tax
pay
erB
usi
nes
s T
ype
Tax
pay
erB
usi
nes
s T
ype
Bea
con
Roo
fing
Sup
ply
Bld
g.M
atls
-Whs
leA
B C
alif
Acq
uisi
tion
Bld
g.M
atls
-Ret
ail
Cal
ifor
nia
Wat
erpr
oofi
ng S
uppl
yB
ldg.
Mat
ls-W
hsle
Cos
tco
Who
lesa
leD
epar
tmen
t Sto
res
Che
vron
Ser
vice
Sta
tion
sS
ervi
ce S
tati
ons
Cum
min
s W
est
Hea
vy I
ndus
try
Con
soli
date
d E
lect
rica
l Dis
trib
utor
sB
ldg.
Mat
ls-W
hsle
D &
S G
arde
n S
uppl
ies
Flo
rist
/Nur
sery
Cos
tco
Who
lesa
leD
epar
tmen
t Sto
res
Ent
erpr
ise
Car
Sal
esA
uto
Sal
es -
Use
d
Dom
inio
n V
otin
g S
yste
ms
Off
ice
Equ
ipm
ent
ES
D C
ompa
nyE
lect
roni
c E
quip
men
t
Edg
es E
lect
rica
l Gro
upE
lect
roni
c E
quip
men
tF
.H.D
aile
y C
hevr
olet
Aut
o S
ales
- N
ew
Ent
erpr
ise
Ren
t-A
-Car
Lea
sing
Fly
ers
Ser
vice
Sta
tion
sS
ervi
ce S
tati
ons
F.H
.Dai
ley
Che
vrol
etA
uto
Sal
es -
New
Hom
e D
epot
Bld
g.M
atls
-Ret
ail
Fer
guso
n E
nter
pris
esB
ldg.
Mat
ls-W
hsle
KC
I U
saL
ight
Ind
ustr
y
Hom
e D
epot
Bld
g.M
atls
-Ret
ail
Mac
y's
Dep
artm
ent S
tore
Dep
artm
ent S
tore
s
Nik
e F
acto
ry S
tore
App
arel
Sto
res
Mar
ina
Squ
are
Aut
o C
ente
rA
uto
Sal
es -
New
Nor
cal K
enw
orth
Bay
Are
aM
isc.
Veh
icle
Sal
esN
ike
Fac
tory
Sto
reA
ppar
el S
tore
s
Pet
erso
n P
ower
Sys
tem
sH
eavy
Ind
ustr
yN
ords
trom
Rac
kA
ppar
el S
tore
s
Pet
erso
n T
ract
or C
ompa
nyH
eavy
Ind
ustr
yP
eter
son
Pow
er S
yste
ms
Hea
vy I
ndus
try
Pet
erso
n T
ruck
sM
isc.
Veh
icle
Sal
esP
eter
son
Tra
ctor
Com
pany
Hea
vy I
ndus
try
Ros
s S
tore
sA
ppar
el S
tore
sR
oss
Sto
res
App
arel
Sto
res
Saf
eway
Sto
res
Foo
d M
arke
tsS
afew
ay S
tore
sF
ood
Mar
kets
San
Lea
ndro
Chr
ysle
r Je
ep D
odge
Ram
Aut
o S
ales
- N
ewS
an L
eand
ro H
onda
Aut
o S
ales
- N
ew
San
Lea
ndro
Hon
daA
uto
Sal
es -
New
She
ll S
ervi
ce S
tati
ons
Ser
vice
Sta
tion
s
San
Lea
ndro
Nis
san
Aut
o S
ales
- N
ewS
SM
B P
acif
ic H
oldi
ng C
ompa
nyA
uto
Par
ts/R
epai
r
Tar
get S
tore
sD
epar
tmen
t Sto
res
Tar
get S
tore
sD
epar
tmen
t Sto
res
The
For
d S
tore
Aut
o S
ales
- N
ewT
he F
ord
Sto
reA
uto
Sal
es -
New
Wal
Mar
t Sto
res
Dep
artm
ent S
tore
sW
al M
art S
tore
sD
epar
tmen
t Sto
res
Wes
tern
Tru
ck P
arts
& E
quip
Co
Mis
c. V
ehic
le S
ales
Wes
tern
Sta
tes
Oil
Ene
rgy
Sal
es
Sou
rce:
Ave
nu I
nsig
hts
& A
naly
ticsF
Y 2
020
FY
201
1
167

Cit
y of
San
Lea
nd
roS
ewer
Rat
esL
ast
Ten
Fis
cal Y
ears
Fis
cal
Sin
gle
Mul
ti-
Yea
rF
amil
yF
amil
yIn
stit
utio
nal
2011
26.2
9
18.6
5
2.45
-6.
40
2.
45
2012
28.9
7
20.5
6
3.19
-6.
67
2.
62
2013
29.9
8
21.2
8
3.30
-6.
90
2.
71
2014
32.2
7
22.9
0
3.55
-7.
45
2.
92
2015
33.0
7
23.5
4
3.65
-7.
66
3.
00
2016
33.1
7
23.5
4
3.65
-7.
66
3.
00
2017
34.0
3
24.1
5
3.74
-7.
86
3.
08
2018
34.7
1
24.6
3
3.81
-8.
02
3.
14
2019
35.7
5
25.3
7
3.92
-8.
26
3.
23
2020
37.1
3
26.3
5
4.07
-8.
58
3.
36
Not
es: C
omm
erci
al a
nd I
nsti
tuti
onal
cha
rge
is b
ased
upo
n th
e vo
lum
e of
wat
er u
sed.
Sou
rce:
Cit
y of
San
Lea
ndro
Pub
lic
Wor
ks D
epar
tmen
t and
Mas
ter
Fee
Sch
edul
e
Sew
erN
on-R
esid
enti
al
Com
mer
cial
168

City of San LeandroNumber of Permits and Valuation of Taxable TransactionsLast Ten Calendar Years
Retail Stores
Taxable Taxable
Calendar Number Transactions Number Transactions
Year of Permits (in thousands) of Permits (in thousands)
2011 1,312 1,203,146$ 2,309 1,775,210$
2012 1,341 1,273,883 2,322 1,867,865
2013 1,304 1,348,729 2,273 2,026,119
2014 1,290 1,378,120 2,258 2,246,508
2015 1,309 1,478,697 2,425 2,483,400
2016 1,362 1,598,459 2,508 2,584,669
2017 1,374 1,662,454 2,513 2,650,938
2018 1,373 1,688,378 2,555 2,665,437
2019 1,379 1,702,666 2,618 2,718,393
2020 1,379 1,580,927 2,618 2,573,889
Note: Data 2015 and beyond is provided by California Dept. of Tax and Fee Administration
Prior to 2015, data provided by State Board of Equalization (BOE), Taxable Sales in California (Sales and Use Tax).
Total All Outlets
Note for 2020: The Number of Permits for Retail Stores and for All Outlets was not available for disclosure at the time of Financial Reporting and the 2019 year amounts were used for the number of permits.
169

DEBT CAPACITY
Direct and Overlapping Debt - As of June 30, 2020
Pledged-Revenue Coverage - Last Ten Fiscal Years
Computation of Legal Debt Margin - Last Ten Fiscal Years
Ratios of Outstanding Debt by Type - Last Ten Fiscal Years
Ratios of General Bonded Debt Outstanding - Last Ten Fiscal Years
These schedules present information to help the reader assess the affordability of the city's current levels of outstanding debt and the city's ability to issue additional debt in the future.
171


Direct and Overlapping DebtAs of June 30, 2020
2019-20 Assessed Valuation 14,205,469,618$
Total Debt City's Share ofOVERLAPPING TAX AND ASSESSMENT DEBT: 6/30/2020 % Applicable (1) Debt 6/30/20Alameda County 218,000,000$ 4.577% 9,977,860$ Bay Area Rapid Transit District 1,282,740,000 1.765 22,640,361 Chabot-Las Positas Community College District 626,920,000 10.653 66,785,788 San Leandro Unified School District 327,835,109 89.637 293,861,557 San Lorenzo Unified School District 152,420,000 22.212 33,855,530 East Bay Regional Park District 155,835,000 2.815 4,386,755 City of San Leandro Cherrywood Community Facilities District 2,160,000 100.000 2,160,000
TOTAL OVERLAPPING TAX AND ASSESSMENT DEBT 433,667,851$
DIRECT AND OVERLAPPING GENERAL FUND DEBT:Alameda County General Fund Obligations 830,130,000$ 4.577% 37,995,050$ Alameda-Contra Costa Transit District Certificates of Participation 11,655,000 5.431 632,983 San Lorenzo Unified School District Certificates of Participation 9,490,000 22.212 2,107,919 City of San Leandro General Fund Obligations 40,989,022 100 40,989,022 City of San Leandro Pension Obligation Bonds 8,405,000 100 8,405,000
TOTAL DIRECT AND OVERLAPPING GENERAL FUND DEBT 90,129,974$
OVERLAPPING TAX INCREMENT DEBT (Successor Agencies):San Leandro Tax Allocation Bonds 12,577,000$ 100.000% 12,577,000$ Alameda County – San Leandro Tax Allocation Bonds 18,425,000 56.718 10,353,745
TOTAL OVERLAPPING TAX INCREMENT DEBT $22,930,745
TOTAL DIRECT DEBT 49,394,022$ TOTAL OVERLAPPING DEBT 497,334,548$
COMBINED TOTAL DEBT 546,728,570$ (2)
Ratios to 2019-20 Assessed Valuation:Total Overlapping Tax and Assessment Debt 3.05%Total Direct Debt ($49,394,022) 0.35%Combined Total Debt 3.85%
Ratios to Redevelopment Successor Agency Incremental Valuation ($2,813,261,462):Total Overlapping Tax Increment Debt 0.82%
City of San Leandro
(1) The percentage of overlapping debt applicable to the city is estimated using taxable assessed property value. Applicable percentageswere estimated by determining the portion of the overlapping district's assessed value that is within the boundaries of the city divided bythe district's total taxable assessed value.
(2) Excludes tax and revenue anticipation notes, enterprise revenue, mortgage revenue and non-bonded capital lease obligations.
173

Cit
y of
San
Lea
nd
roP
led
ged
-Rev
enu
e C
over
age
Las
t T
en F
isca
l Yea
rs Spe
cial
F
isca
lA
sses
smen
tY
ear
Col
lect
ions
Pri
ncip
alIn
tere
stC
over
age
2011
- -
- -
2012
- -
- -
2013
- -
- -
2014
- -
- -
2015
- -
- -
2016
- -
- -
2017
- -
- -
2018
- -
- -
2019
- -
- -
2020
- -
- -
Not
es: D
urin
g F
isca
l Yea
r 20
09-1
0 an
d be
yond
no
asse
ssm
ents
wer
e ne
cess
ary
due
to th
e av
aila
bili
ty o
f fu
nds
to p
ay th
e de
bt.
Sou
rce:
Cit
y of
San
Lea
ndro
Spe
cial
Ass
essm
ent B
onds
Deb
t Ser
vice
174

Cit
y of
San
Lea
nd
roC
omp
uta
tion
of
Leg
al D
ebt
Mar
gin
Las
t T
en F
isca
l Yea
rs
2011
2012
2013
2014
2015
2016
2017
2018
2019
2020
Ass
esse
d V
alua
tion
:
Sec
ured
pro
pert
y as
sess
ed v
alue
8,88
3,40
0,00
0$
8,88
5,53
5,00
0$
9,34
9,15
4,00
0$
9,94
2,21
8,00
0$
9,
900,
077,
000
$
10,6
23,1
78,2
19$
11,0
98,8
68,6
06$
11,8
10,2
49,3
91$
12,4
57,9
95,9
12$
13,2
57,9
32,1
34$
A
ddba
ck: E
xem
ptio
ns21
8,84
5,00
0
22
4,00
7,00
0
23
6,91
7,00
0
32
2,59
6,00
0
1,10
4,63
0,00
0
1,
071,
154,
402
1,13
9,77
5,18
3
1,
160,
687,
336
1,25
0,02
6,10
3
1,
319,
190,
336
Tot
al A
sses
sed
Val
uati
on9,
102,
245,
000
$ 9,
109,
542,
000
$ 9,
586,
071,
000
$ 10
,264
,814
,000
$
11,0
04,7
07,0
00$
11
,694
,332
,621
$ 12
,238
,643
,789
$ 12
,970
,936
,727
$ 13
,708
,022
,015
$ 14
,577
,122
,470
$
Bon
ded
debt
(15
% o
f A
sses
sed
Val
ue)
1,36
5,33
6,75
0$
1,36
6,43
1,30
0$
1,43
7,91
0,65
0$
1,53
9,72
2,10
0$
1,
650,
706,
050
$
1,75
4,14
9,89
3$
1,
835,
796,
568
$
1,94
5,64
0,50
9$
2,
056,
203,
302
$
2,18
6,56
8,37
1$
Tot
al B
onde
d D
ebt
5,20
9,43
6
3,
980,
825
980,
820
69
4,99
2
715,
441
42
,066
,944
42,4
04,3
98
37
,374
,715
37,3
74,7
15
50
,714
,022
Les
s:S
peci
al a
sses
smen
t bon
ds-
- -
- -
- -
- -
-
Lea
se R
even
ue D
ebt
(34,
420,
000)
(2
9,51
5,00
0)
(28,
340,
000)
(3
0,44
0,00
0)
(26,
208,
000)
(2
5,19
8,00
0)
(27,
410,
045)
(2
0,49
5,00
0)
(37,
904,
000)
(3
6,36
8,00
0)
Cap
ital
Lea
ses
(772
,883
)
(2
87,7
90)
(980
,820
)
(6
94,9
92)
(7
15,4
41)
(6
78,9
44)
(2
40,3
53)
(5
,254
,715
)
(4
,941
,178
)
(4
,621
,022
)
A
mou
nt o
f D
ebt s
ubje
ct to
Lim
it(2
9,98
3,44
7)
(25,
821,
965)
(2
8,34
0,00
0)
(30,
440,
000)
(2
6,20
8,00
0)
16,1
90,0
00
14
,754
,000
11,6
25,0
00
(5
,470
,463
)
9,
725,
000
Leg
al D
ebt M
argi
n1,
395,
320,
197
$ 1,
392,
253,
265
$ 1,
466,
250,
650
$ 1,
570,
162,
100
$
1,67
6,91
4,05
0$
1,
737,
959,
893
$
1,82
1,04
2,56
8$
1,
934,
015,
509
$
2,06
1,67
3,76
5$
2,
176,
843,
371
$
Sou
rce:
Cou
nty
Ass
esso
r D
ata,
Ave
nu I
nsig
hts
& A
naly
tics
S
ourc
e: C
ount
y of
Ala
med
a of
fice
of
Aud
itor
-Con
trol
ler
and
Sta
tem
ent o
f D
irec
t and
Ove
rlap
ping
Deb
t
175
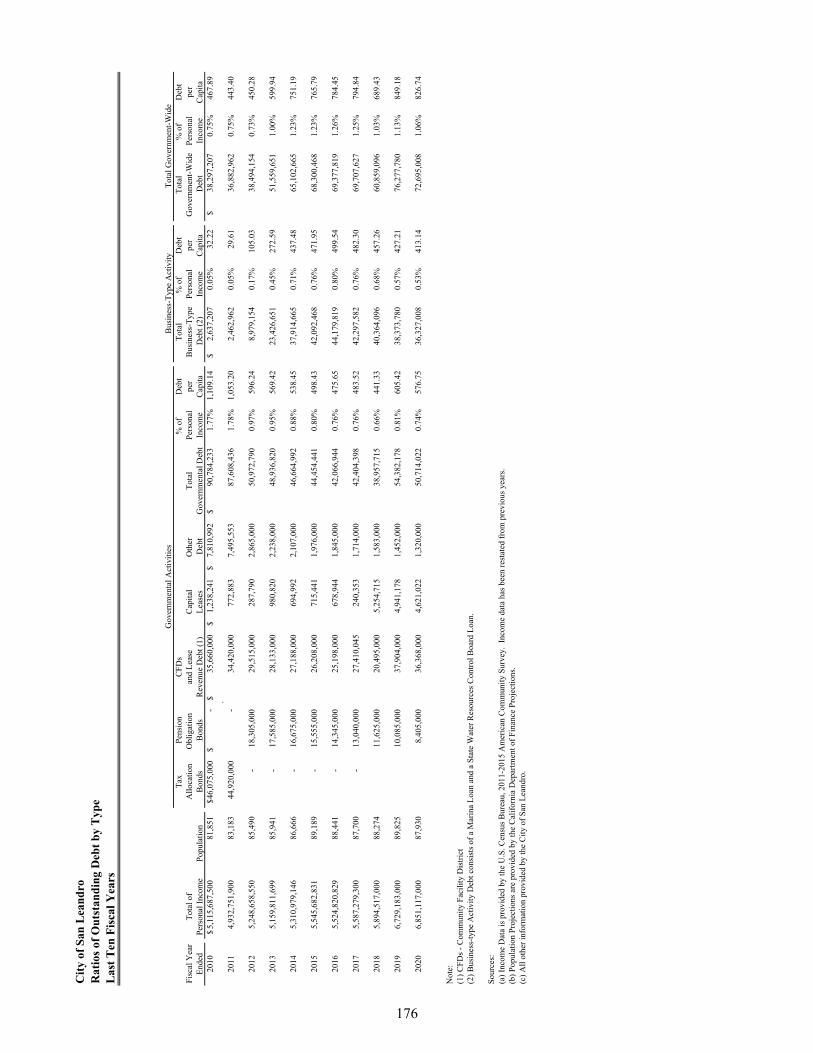
Cit
y of
San
Lea
nd
roR
atio
s of
Ou
tsta
nd
ing
Deb
t b
y T
ype
Las
t T
en F
isca
l Yea
rs
Tax
Pen
sion
CF
Ds
% o
f D
ebt
Tot
al%
of
Deb
tT
otal
% o
f D
ebt
Fis
cal Y
ear
Tot
al o
fA
lloc
atio
nO
blig
atio
n an
d L
ease
Cap
ital
Oth
er
Tot
alP
erso
nal
per
Bus
ines
s-T
ype
Per
sona
lpe
rG
over
nmen
t-W
ide
Per
sona
lpe
rE
nded
Per
sona
l Inc
ome
Pop
ulat
ion
Bon
dsB
onds
Rev
enue
Deb
t (1)
Lea
ses
Deb
tG
over
nmen
tal D
ebt
Inco
me
Cap
ita
Deb
t (2)
Inco
me
Cap
ita
Deb
tIn
com
eC
apit
a20
105,
115,
687,
500
$ 81
,851
46,0
75,0
00$
-$
35
,660
,000
$
1,
238,
241
$
7,
810,
992
$
90
,784
,233
$
1.
77%
1,10
9.14
2,
637,
207
$
0.
05%
32.2
2
38,2
97,2
07$
0.
75%
467.
89
.
2011
4,93
2,75
1,90
0
83,1
83
44
,920
,000
-
34,4
20,0
00
772,
883
7,49
5,55
3
87,6
08,4
36
1.78
%1,
053.
20
2,46
2,96
2
0.05
%29
.61
36
,882
,962
0.75
%44
3.40
2012
5,24
8,65
8,55
0
85,4
90
-
18,3
05,0
00
29,5
15,0
00
287,
790
2,86
5,00
0
50,9
72,7
90
0.97
%59
6.24
8,97
9,15
4
0.17
%10
5.03
38,4
94,1
54
0.
73%
450.
28
2013
5,15
9,81
1,69
9
85,9
41
-
17,5
85,0
00
28,1
33,0
00
980,
820
2,23
8,00
0
48,9
36,8
20
0.95
%56
9.42
23,4
26,6
51
0.45
%27
2.59
51,5
59,6
51
1.
00%
599.
94
2014
5,31
0,97
9,14
6
86,6
66
-
16,6
75,0
00
27,1
88,0
00
694,
992
2,10
7,00
0
46,6
64,9
92
0.88
%53
8.45
37,9
14,6
65
0.71
%43
7.48
65,1
02,6
65
1.
23%
751.
19
2015
5,54
5,68
2,83
1
89,1
89
-
15,5
55,0
00
26,2
08,0
00
715,
441
1,97
6,00
0
44,4
54,4
41
0.80
%49
8.43
42,0
92,4
68
0.76
%47
1.95
68,3
00,4
68
1.
23%
765.
79
2016
5,52
4,82
0,82
9
88,4
41
-
14,3
45,0
00
25,1
98,0
00
678,
944
1,84
5,00
0
42,0
66,9
44
0.76
%47
5.65
44,1
79,8
19
0.80
%49
9.54
69,3
77,8
19
1.
26%
784.
45
2017
5,58
7,27
9,30
0
87,7
00
-
13,0
40,0
00
27,4
10,0
45
240,
353
1,71
4,00
0
42,4
04,3
98
0.76
%48
3.52
42,2
97,5
82
0.76
%48
2.30
69,7
07,6
27
1.
25%
794.
84
2018
5,89
4,51
7,00
0
88,2
74
11
,625
,000
20
,495
,000
5,
254,
715
1,
583,
000
38
,957
,715
0.
66%
441.
33
40
,364
,096
0.
68%
457.
26
60
,859
,096
1.03
%68
9.43
2019
6,72
9,18
3,00
0
89,8
25
10
,085
,000
37
,904
,000
4,
941,
178
1,
452,
000
54
,382
,178
0.
81%
605.
42
38
,373
,780
0.
57%
427.
21
76
,277
,780
1.13
%84
9.18
2020
6,85
1,11
7,00
0
87,9
30
8,
405,
000
36
,368
,000
4,
621,
022
1,
320,
000
50
,714
,022
0.
74%
576.
75
36
,327
,008
0.
53%
413.
14
72
,695
,008
1.06
%82
6.74
Not
e:
(1)
CF
Ds
- C
omm
unit
y F
acil
ity
Dis
tric
t(2
) B
usin
ess-
type
Act
ivit
y D
ebt c
onsi
sts
of a
Mar
ina
Loa
n an
d a
Sta
te W
ater
Res
ourc
es C
ontr
ol B
oard
Loa
n.
Sou
rces
: (a
) In
com
e D
ata
is p
rovi
ded
by th
e U
.S. C
ensu
s B
urea
u, 2
011-
2015
Am
eric
an C
omm
unit
y S
urve
y. I
ncom
e da
ta h
as b
een
rest
ated
fro
m p
revi
ous
year
s.(b
) P
opul
atio
n P
roje
ctio
ns a
re p
rovi
ded
by th
e C
alif
orni
a D
epar
tmen
t of
Fin
ance
Pro
ject
ions
.(c
) A
ll o
ther
info
rmat
ion
prov
ided
by
the
Cit
y of
San
Lea
ndro
.
Gov
ernm
enta
l Act
ivit
ies
Bus
ines
s-T
ype
Act
ivit
yT
otal
Gov
ernm
ent-
Wid
e
176
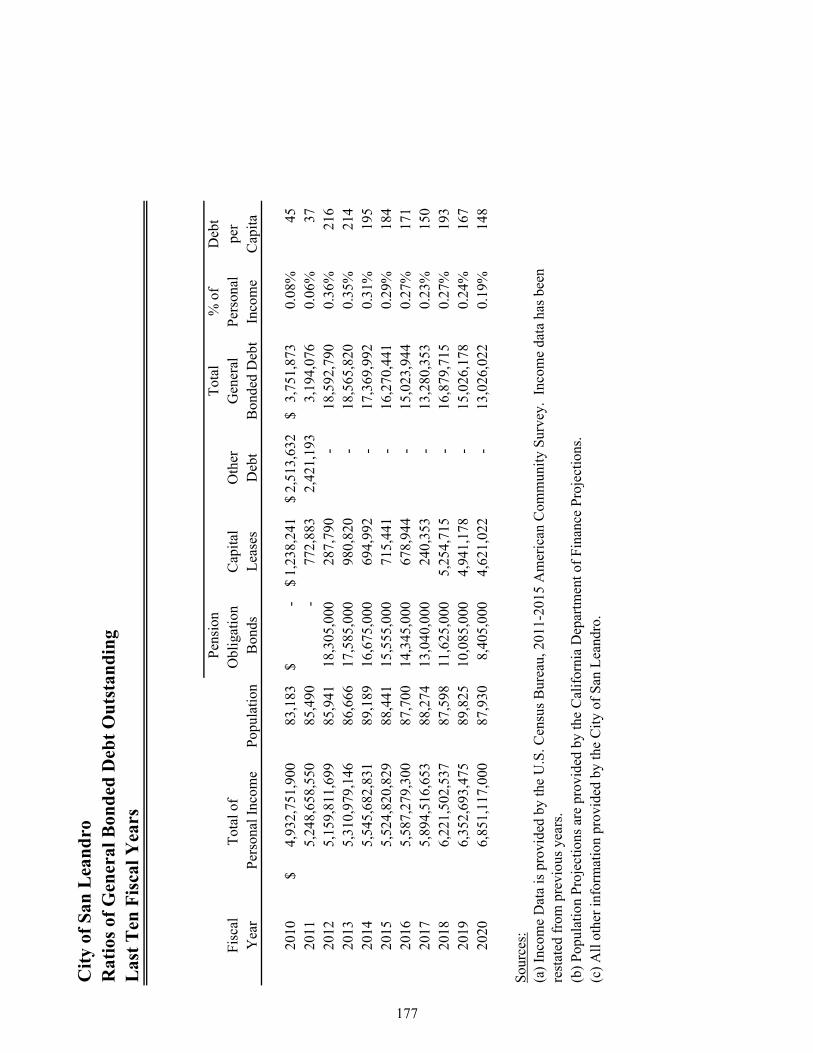
Cit
y of
San
Lea
nd
roR
atio
s of
Gen
eral
Bon
ded
Deb
t O
uts
tan
din
gL
ast
Ten
Fis
cal Y
ears
Pen
sion
Tot
al%
of
Deb
tF
isca
lT
otal
of
Obl
igat
ion
Cap
ital
Oth
erG
ener
alP
erso
nal
per
Yea
rP
erso
nal I
ncom
eP
opul
atio
nB
onds
Lea
ses
Deb
tB
onde
d D
ebt
Inco
me
Cap
ita
2010
4,93
2,75
1,90
0$
83,1
83
-$
1,
238,
241
$ 2,
513,
632
$ 3,
751,
873
$
0.08
%45
2011
5,24
8,65
8,55
0
85,4
90
- 77
2,88
32,
421,
193
3,
194,
076
0.06
%37
2012
5,15
9,81
1,69
9
85,9
41
18,3
05,0
00
287,
790
-
18,5
92,7
900.
36%
216
20
135,
310,
979,
146
86
,666
17
,585
,000
98
0,82
0-
18
,565
,820
0.35
%21
4
2014
5,54
5,68
2,83
1
89,1
89
16,6
75,0
00
694,
992
-
17,3
69,9
920.
31%
195
20
155,
524,
820,
829
88
,441
15
,555
,000
71
5,44
1-
16
,270
,441
0.29
%18
4
2016
5,58
7,27
9,30
0
87,7
00
14,3
45,0
00
678,
944
-
15,0
23,9
440.
27%
171
20
175,
894,
516,
653
88
,274
13
,040
,000
24
0,35
3-
13
,280
,353
0.23
%15
0
2018
6,22
1,50
2,53
7
87,5
98
11,6
25,0
00
5,25
4,71
5
- 16
,879
,715
0.27
%19
3
2019
6,35
2,69
3,47
5
89,8
25
10,0
85,0
00
4,94
1,17
8
- 15
,026
,178
0.24
%16
7
2020
6,85
1,11
7,00
0
87,9
30
8,40
5,00
0
4,62
1,02
2
- 13
,026
,022
0.19
%14
8
Sou
rces
:
(b)
Pop
ulat
ion
Pro
ject
ions
are
pro
vide
d by
the
Cal
ifor
nia
Dep
artm
ent o
f F
inan
ce P
roje
ctio
ns.
(c)
All
oth
er in
form
atio
n pr
ovid
ed b
y th
e C
ity
of S
an L
eand
ro.
(a)
Inco
me
Dat
a is
pro
vide
d by
the
U.S
. Cen
sus
Bur
eau,
201
1-20
15 A
mer
ican
Com
mun
ity
Sur
vey.
Inc
ome
data
has
bee
nre
stat
ed f
rom
pre
viou
s ye
ars.
177

DEMOGRAPHIC AND ECONOMIC INFORMATION
Demographic and Economic Statistics - Last Ten Fiscal Years
Principal Employers - Current Year and Eight Years Ago
These schedules offer demographic and economic indicators to help the reader understand the environment within which the city's financial activities take place.
179


Cit
y of
San
Lea
nd
roD
emog
rap
hic
an
d E
con
omic
Sta
tist
ics
Las
t T
en F
isca
l Yea
rs
Fis
cal Y
ear
Pop
ula
tion
(1)
Per
son
al
Inco
me
(
in t
hou
san
ds)
(2
)
Per
Cap
ita
Per
son
al
Inco
me
(2)
Med
ian
Age
Pu
bli
c S
choo
l E
nro
llm
ent
(3)
Med
ian
Hom
e P
rice
Con
sum
er
Pri
ce I
nd
ex
Cit
y U
nem
plo
ymen
t R
ate
(4)
2011
85,4
905,
248,
659
$
61
,395
$
39
.59,
000
309,
800
$
232
$
10.0
%20
1285
,941
5,15
9,81
2
60,0
39
37.6
8,77
632
0,00
0
22
8.11
09.
3%20
1386
,666
5,31
0,97
9
61,2
81
39.1
8,76
940
0,00
0
24
5.93
57.
4%20
1489
,189
5,54
5,68
3
62,1
79
39.2
8,66
844
0,00
0
25
3.31
76.
3%20
1588
,441
5,52
4,82
1
62,4
69
39.2
8,61
751
0,00
0
23
8.65
44.
8%20
1687
,700
5,58
7,27
9
63,7
09
40.5
8,56
052
9,00
0
23
9.81
05.
1%20
1788
,274
5,89
4,51
7
66,7
75
40.5
8,63
858
5,40
0
24
4.78
64.
6%20
1887
,598
6,22
1,50
3
71,0
23
43.9
8,88
067
1,20
0
25
1.84
63.
1%20
1989
,825
6,72
9,18
3
74,9
14
40.8
8,92
664
7,50
0
25
6.16
12.
8%20
2087
,930
6,85
1,11
7
77,9
16
40.5
9,06
769
4,29
5
25
9.10
117
.7%
Sou
rce:
Ave
nu I
nsig
hts
& A
naly
tics
, U.S
. Cen
sus
Bur
eau,
201
1-20
15 A
mer
ican
Com
mun
ity
Sur
vey.
Sou
rce:
201
3-14
and
pri
or, p
revi
ous
publ
ishe
d C
AF
R
Not
es:
1.)
Pop
ulat
ion
Pro
ject
ions
are
pro
vide
d by
the
Cal
ifor
nia
Dep
artm
ent o
f F
inan
ce P
roje
ctio
ns.
2)In
com
e D
ata
is p
rovi
ded
by th
e U
.S. C
ensu
s B
urea
u, 2
011-
2015
Am
eric
an C
omm
unit
y S
urve
y. I
ncom
e da
ta h
as b
een
rest
ated
fro
m p
revi
ous
year
s.
4)U
nem
ploy
men
t Dat
a is
pro
vide
d by
the
ED
D's
Bur
eau
of L
abor
Sta
tist
ics
Dep
artm
ent.
The
Cal
ifor
nia
Dep
artm
ent o
f F
inan
ce d
emog
raph
ics
esti
mat
es n
ow in
corp
orat
e 20
10 C
ensu
s co
unts
as
the
benc
hmar
k. T
here
fore
, the
est
imat
es f
or 2
010
thro
ugh
2012
pu
blis
hed
in th
is r
epor
t mig
ht b
e no
tice
ably
dif
fere
nt f
rom
the
prev
ious
yea
r es
tim
ates
.
3)S
tude
nt E
nrol
lmen
t ref
lect
s th
e to
tal n
umbe
r of
stu
dent
s en
roll
ed in
the
San
Lea
ndro
Uni
fied
Sch
ool D
istr
ict.
Any
oth
er s
choo
l dis
tric
ts w
ithi
n th
e C
ity
are
not
acco
unte
d fo
r in
this
sta
tist
ic.
181
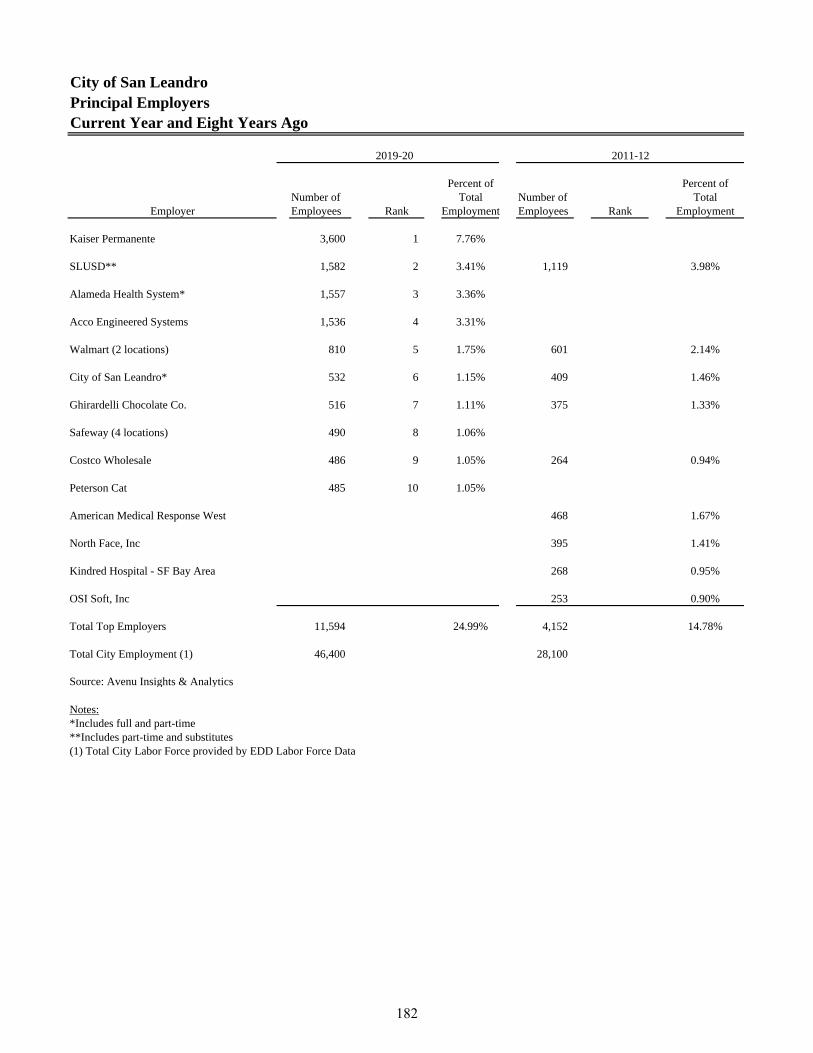
City of San LeandroPrincipal EmployersCurrent Year and Eight Years Ago
Percent of Percent ofNumber of Total Number of Total
Employer Employees Rank Employment Employees Rank Employment
Kaiser Permanente 3,600 1 7.76%
SLUSD** 1,582 2 3.41% 1,119 3.98%
Alameda Health System* 1,557 3 3.36%
Acco Engineered Systems 1,536 4 3.31%
Walmart (2 locations) 810 5 1.75% 601 2.14%
City of San Leandro* 532 6 1.15% 409 1.46%
Ghirardelli Chocolate Co. 516 7 1.11% 375 1.33%
Safeway (4 locations) 490 8 1.06%
Costco Wholesale 486 9 1.05% 264 0.94%
Peterson Cat 485 10 1.05%
American Medical Response West 468 1.67%
North Face, Inc 395 1.41%
Kindred Hospital - SF Bay Area 268 0.95%
OSI Soft, Inc 253 0.90%
Total Top Employers 11,594 24.99% 4,152 14.78%
Total City Employment (1) 46,400 28,100
Source: Avenu Insights & Analytics
Notes:*Includes full and part-time**Includes part-time and substitutes(1) Total City Labor Force provided by EDD Labor Force Data
2019-20 2011-12
182
OPERATING INFORMATION
Full-Time and Part-Time City Employees by Function - Last Ten Fiscal Years
Operating Indicators by Function - Last Ten Fiscal Years
Capital Assets by Function - Last Ten Fiscal Years
These schedules contain service and infrastructure data to help the reader understand how the information in the city's financial report relates to the services the city provides and the activities it performs.
183

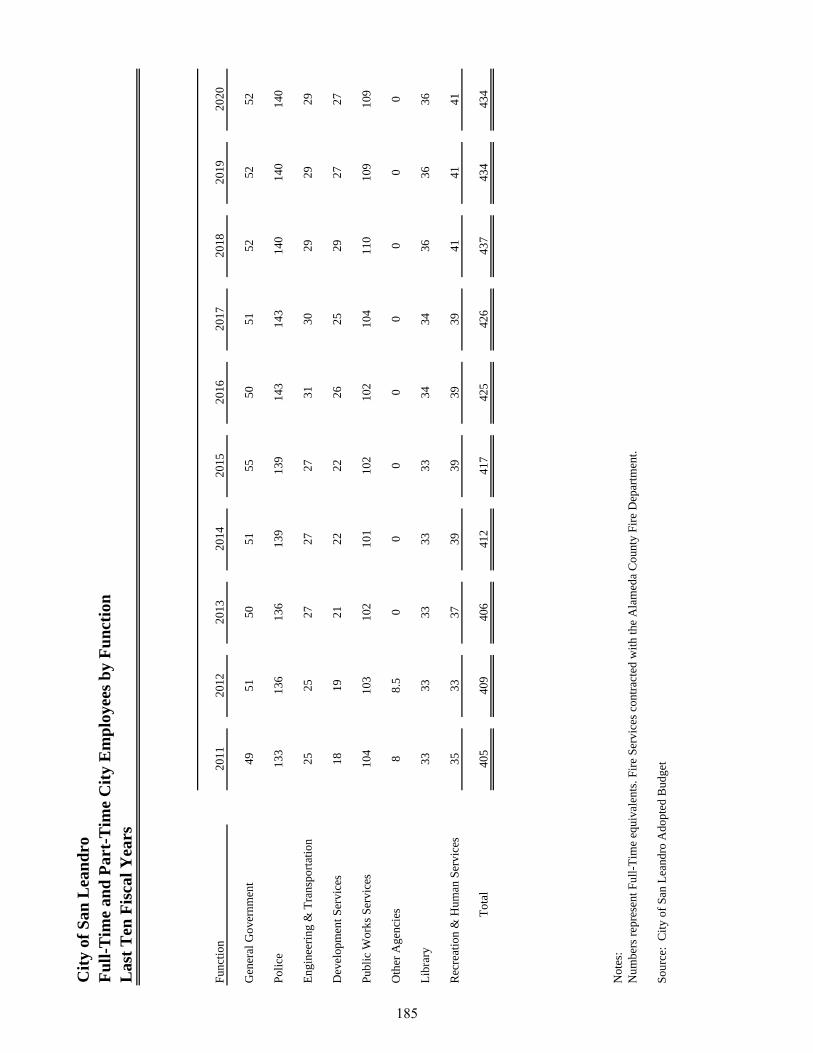
City
of S
an L
eand
roFu
ll-T
ime
and
Part
-Tim
e C
ity E
mpl
oyee
s by
Func
tion
Las
t Ten
Fis
cal Y
ears
Func
tion
2011
2012
2013
2014
2015
2016
2017
2018
2019
2020
Gen
eral
Gov
ernm
ent
4951
5051
5550
5152
5252
Polic
e13
313
613
613
913
914
314
314
014
014
0
Engi
neer
ing
& T
rans
porta
tion
2525
2727
2731
3029
2929
Dev
elop
men
t Ser
vice
s18
1921
2222
2625
2927
27
Publ
ic W
orks
Ser
vice
s10
410
310
210
110
210
210
411
010
910
9
Oth
er A
genc
ies
88.
50
00
00
00
0
Libr
ary
3333
3333
3334
3436
3636
Rec
reat
ion
& H
uman
Ser
vice
s35
3337
3939
3939
4141
41
Tota
l40
540
940
641
241
742
542
643
743
443
4
Not
es:
Num
bers
repr
esen
t Ful
l-Tim
e eq
uiva
lent
s. Fi
re S
ervi
ces c
ontra
cted
with
the
Ala
med
a C
ount
y Fi
re D
epar
tmen
t.
Sour
ce:
City
of S
an L
eand
ro A
dopt
ed B
udge
t
185

City
of S
an L
eand
roO
pera
ting
Indi
cato
rs b
y Fu
nctio
nL
ast T
en F
isca
l yea
rs
2011
2012
2013
2014
2015
2016
2017
2018
2019
2020
Polic
e D
epar
tmen
t:
Arr
ests
3,48
6
3,
299
3,27
9
3,
036
2,14
8
2,
789
2,
799
2,51
3
2,
151
1,96
8
Bui
ldin
g D
epar
tmen
t:
Per
mits
Issu
ed2,
446
2,50
3
2,
564
2,62
4
1,
961
2,89
1
2,76
2
4,
080
2,27
5
2,
065
Publ
ic W
orks
Dep
artm
ent:
S
treet
reco
nstru
ctio
n (m
iles)
0.55
1.
39
- 1.
35
0.26
0.
74
2.24
1.
42
1.77
1.
25
Stre
et re
surf
acin
g (m
iles)
4.00
8.
68
- 17
.94
5.
39
4.12
5.
21
4.69
7.
33
0.67
Park
s and
Rec
reat
ion:
N
umbe
r of r
egis
trant
s17
,099
20,2
36
21
,324
18,9
14
17
,737
17,1
14
16
,742
14,7
03
14
,261
9,74
8
N
umbe
r of f
acili
ty re
ntal
s1,
190
1,28
2
1,
999
2,65
6
3,
830
2,43
9
2,22
2
2,
465
2,37
3
1,
209
Gol
f Cou
rse:
G
olf r
ound
s pla
yed
98,0
00
97
,310
95,9
95
96
,450
102,
534
99
,185
98,9
87
10
5,04
3
100,
409
97
,803
Not
es:
Fire
Ser
vice
s are
con
tract
ed w
ith th
e A
lam
eda
Cou
nty
Fire
Dep
artm
ent.
Bui
ldin
g D
epar
tmen
t: M
etho
dolo
gy c
hang
ed in
201
5 fr
om is
suin
g pe
rmits
for e
ach
disc
iplin
e to
one
con
solid
ated
per
mit
per p
roje
ct.
Sour
ce:
City
of S
an L
eand
ro R
ecre
atio
n D
epar
tmen
t, Po
lice
Dep
artm
ent,
Publ
ic W
orks
, and
Bui
ldin
g R
egul
atio
ns.
186

Cit
y of
San
Lea
nd
roC
apit
al A
sset
Sta
tist
ics
by
Fu
nct
ion
Las
t T
en F
isca
l Yea
rs
2011
2012
2013
2014
2015
2016
2017
2018
2019
2020
Pol
ice:
S
tati
ons
1
1
1
1
1
1
1
1
1
1
Fir
e:
Fir
e S
tati
ons
5
5
5
5
5
5
5
5
5
5
Par
k an
d R
ecre
atio
n:
P
arks
16
16
16
16
16
16
16
16
16
16
Com
mun
ity
Cen
ter
2
2
2
2
2
2
2
2
2
2
Pub
lic
wor
ks:
S
tree
ts (
mil
es)
175
175
175
175
175
175
175
175
175
175
S
tree
tlig
hts
5,50
0
5,50
0
5,50
0
5,50
0
5,50
0
5,50
0
5,50
0
6,00
0
6,00
0
6,00
0
T
raff
ic s
igna
ls75
5
75
5
75
5
75
5
75
5
75
5
75
5
1,
254
1,
254
1,
254
Was
tew
ater
:
San
itar
y S
ewer
Lin
es (
mil
es)
130
130
130
130
130
128
128
128
128
128
S
torm
Dra
inag
e L
ines
In
the
Cit
y (m
iles
)17
5
17
5
17
5
17
5
17
5
18
0
18
0
18
0
18
0
18
0
Gol
f C
ours
e:
Cou
rses
2
2
2
2
2
2
2
2
2
2
Sou
rces
: C
ity
of S
an L
eand
ro: P
ubli
c W
orks
Dep
artm
ent,
Eng
inee
ring
& T
rans
port
atio
n D
epar
tmen
t, R
ecre
atio
n D
epar
tmen
t
187