Embed Size (px)
Citation preview


CITY OF SAN LEANDRO, CALIFORNIA
COMPREHENSIVE ANNUAL FINANCIAL REPORT FOR THE FISCAL YEAR ENDED
JUNE 30, 2018
PREPARED BY: City of San Leandro - Finance Department
David Baum, Finance Director

CITY OF SAN LEANDRO Comprehensive Annual Financial Report
For the Year Ended June 30, 2018
Table of Contents
I INTRODUCTORY SECTION
Table of Contents ........................................................................................................................................... i
Letter of Transmittal. ..................................................................................................................................... v
Organizational Chart .................................................................................................................................... xi
Principal Officers ....................................................................................................................................... . xii
Location Map ............................................................................................................................................ xiii
Government Finance Officers Association (GFOA) Award ...................................................................... xiv
I FINANCIAL SECTION I Independent Auditors' Report .................................................................................................................................... 1
Management's Discussion and Analysis .................................................................................................... 5
Basic Financial Statements:
Government-Wide Financial Statements: Statement of Net Position .................................... , ............................................................. 23 Statement of Activities and Changes in Net Position ........................................................ 24
Fund Financial Statements: Government Funds Financial Statements:
Balance Sheet .................................................................................................................... 30 Reconciliation of the Governmental Funds Balance Sheet with the
Statement of Net Position .................................................................................................. 31 Statement of Revenues, Expenditures and Changes in Fund Balances ............................. 32 Reconciliation of the Net Change in Fund Balances -Total Governmental Funds
with the Statement of Activities ........................................................................................ 33
Proprietary Funds Financial Statements: Statement of Net Position .................................................................................................. 36 Statement of Revenues, Expenses and Changes in Fund Net Position ............................. 37 Statement of Cash Flows ................................................................................................... 3 8
Fiduciary Fund Financial Statement: Statement of Fiduciary Net Position ................................................................................. 40 Statement of Changes in Fiduciary Net Position .............................................................. .41

CITY OF SAN LEANDRO Comprehensive Annual Financial Report
For the Year Ended June 30, 2018
Table of Contents
I FINANCIAL SECTION (Continued)
Index to Notes to Basic Financial Statements ............................................................................................. 43
Notes to Basic Financial Statements ........................................................................................................... 45
Required Supplementary Information:
Schedule of Changes in the Net Pension Liability and Related Ratios ............................. 94
Schedule of Contributions - Miscellaneous Plan .............................................................. 95
Schedule of the Plan's Proportionate Share of the Net Pension Liability and Related Ratios as of the Measurement Date .................................................................... 96
Schedule of Contributions - Safety Plan ........................................................................... 97
Schedule of Changes in the Net OPEB Liability and Related Ratios ............................... 98
Schedule of Contributions- Single-Employer Plan .......................................................... 99
Schedule of Revenues, Expenditures and Changes in Fund Balances-Budget and Actual - General Fund .................................................................................................. 100
Notes to Required Supplementary Information ............................................................... 101
Supplementary Information:
Schedule of Revenues, Expenditures and Changes in Fund Balances - Budget and Actual - Capital Improvement Capital Projects Fund ................................................... 104
Non-Major Governmental Funds: Combining Balance Sheet ............................................................................................... 108 Combining Statement of Revenue, Expenditures and Changes in Fund Balances ......... 112 Schedule of Revenues, Expenditures and Changes in Fund Balances -Budget and Actual-Non-Major Governmental Funds .................................................................... 116
Non-Major Enterprise Funds: Combining Statement of Net Position ............................................................................. 140 Combining Statement of Revenues, Expenses, and Changes in Net Position ................. 141 Combining Statement of Cash Flows .............................................................................. 142
11
CITY OF SAN LEANDRO Comprehensive Annual Financial Report
For the Year Ended June 30, 2018
Table of Contents
I FINANCIAL SECTION (Continued)
Internal Service Funds: Combining Statement of Net Position ............................................................................. 144 Combining Statement of Revenues, Expenses and Changes in Fund Net Position ........ 145 Combining Statement of Cash Flows .............................................................................. 146
Fiduciary Fund Financial Statements: Combining Statement of Assets and Liabilities -Agency Funds .................................. 148 Combining Statement of Changes in Assets and Liabilities - Agency Funds ................ 149
STATISTICAL SECTION
Net Position by Component - Last Ten Fiscal Years ................................................................................ 154 Changes in Net Position-Last Ten Fiscal Years ..................................................................................... 155 Program Revenues by Function/Program - Last Ten Fiscal Years ........................................................... 156 Fund Balance of Governmental Funds - Last Ten Fiscal Years ............................................................... 157 General Governmental Revenues by Source -Last Ten Fiscal Years ...................................................... 158 Changes in Fund Balance of Governmental Funds - Last Ten Years ....................................................... 159 Direct and Overlapping Property Tax Rates - Last Ten Fiscal Years ....................................................... 162 Assessed Value of Taxable Property-Last Ten Fiscal Years .................................................................. 163 Net Assessed Value of Property by Use Code, Citywide Last Three Fiscal Years ................................ 164 Principal Property Tax Payers - Current Fiscal Year and Nine Years Ago .............................................. 165 Property Tax Levies and Collections - Last Ten Fiscal Years ................................................................. 166 Historical Sales Tax Amount by Benchmark Year - Last Nine Fiscal Years at Quarter 1 ( Q 1) .............. 167 Principal Sales Tax Produces - Last Fiscal Year and Nine Years Ago .................................................... 168 Sewer Rates - Last Ten Fiscal Years ........................................................................................................ 169 Number of Permits and Valuation of Taxable Transactions -Last Ten Calendar Years .......................... 170 Direct and Overlapping Debt-As of June 30, 2018 ................................................................................ 172 Pledged-Revenue Coverage Last Ten Fiscal Years ................................................................................ 173 Computation of Legal Debt Margin - Last Ten Fiscal Years ................................................................... 17 4 Ratios of General Bonded Debt Outstanding ............................................................................................ 17 5 Ratios of Outstanding Debt by Type - Last Ten Fiscal Years .................................................................. 176 Demographic and Economic Statistics - Last Ten Fiscal Years ............................................................... 178 Principals Employers - Current Year and Eight Years Ago ..................................................................... 179 Full-Time and Part-Time City Employees by Function - Last Ten Fiscal Years ..................................... 182 Operating Indicators by Function - Last Ten Fiscal Years ....................................................................... 183 Capital Asset Statistics by Function - Last Ten Fiscal Years ................................................................... 184
iii


City of San Leandro Civic Center, 835 E. 14th Street San Leandro, California 94577
April 26, 2019
Honorable Mayor and Members of the City Council City of San Leandro San Leandro, CA 94577
Dear Mayor and Members of the City Council:
It is a pleasure to submit for your consideration the City of San Leandra's Comprehensive Annual Financial Report (CAFR) for the fiscal year ended June 30, 2018. Responsibility for both the accuracy of the data and the completeness and fairness of the presentation, including all disclosures, rests with the City's management. To the best ofmy knowledge and belief, the enclosed information is accurate in all material respects and is reported in a manner designed to present fairly the financial position and results of operations of the various activities of the City. All disclosures necessary to enable the reader to gain an understanding of the City's financial activities have been included.
The City's Charter requires an annual audit by an independent audit firm selected by the City Council of the books of account and financial records and reports of the City and that the City publish a complete set of audited financial statements after the close of each fiscal year. This report is published to fulfill this requirement for the fiscal year ended June 30, 2018.
This report presents management's representations concerning the finances of the City. Consequently, management assumes full responsibility for the completeness and reliability of all of the inf01mation presented in this report. To provide a reasonable basis for making these representations, management has established a comprehensive internal control framework that is designed both to protect the City's assets from loss, theft, or misuse and to compile sufficient reliable information for the preparation of the City's financial statements in conformity with generally accepted accounting principles (GAAP). Because the costs of internal controls should not outweigh the benefits, the City's comprehensive framework of internal controls has been designed to provide reasonable rather than absolute assurance that the financial statements will be free from material misstatement.
Maze & Associates, a public accounting firm fully licensed and qualified to perform audits of local governments within California, has audited the City's basic financial statements. The goal of the independent audit is to provide reasonable assurance that the basic financial statements for the fiscal year ended June 30, 2018 are free of material misstatement. The independent audit involved examining, on a test basis, evidence supporting the amounts and disclosures in the financial statements, assessing the accounting principles used and significant estimates made by management, and evaluating the overall financial statement presentation. The independent auditors concluded, based upon the audit, that there was a reasonable basis for rendering an unmodified opinion that the City's basic financial statements for the fiscal year ended June 30, 2018 are fairly presented in conformity with accounting principles generally accepted in the United States. The independent auditor's report is presented as the first component of the financial section of this report.
V

In addition to the annual financial audit, the City provides for a federally mandated Single Audit designed to meet the special needs of Federal grantor agencies. The standards governing Single Audit engagements require the independent auditor to report on the audited government's internal controls and compliance with legal requirements, with special emphasis on the administration of Federal awards. These reports are available in the City's separately issued Single Audit Report.
GAAP requires that management provide a narrative introduction, overview, and analysis to accompany the basic financial statement in the form of Management's Discussion and Analysis (MD&A). The MD&A compliments this letter of transmittal and should be read in conjunction with it. The City's MD&A can be found immediately following the report of the independent auditors in the financial section of the CAFR.
CITY PROFILE
The City of San Leandro was incorporated in 1872 and is one of the oldest communities in the San Francisco Bay Area. The City occupies fifteen square miles between the cities of Oakland and Hayward and is bordered on the west by the San Francisco Bay. San Leandro offers its approximately 88,300 residents the quiet charm and character of a community that has been established for 145 years. Once an agricultural community, the City has been successful in attracting significant industrial, manufacturing and retail development to the area.
City Structure The City functions under a Mayor-Council-Manager form of government and is governed by a sevenmember council elected by City residents. Municipal services provided include public safety, streets and roads, recreation and cultural services, library, health services, public infrastructure improvements, planning and zoning, and general administrative services. The scope of the City Council's power and influence includes, but is not limited to the following:
• The authority to establish and modify operating and capital budgets • The power to appoint voting members to other governing authorities • The power to appoint the City Manager and City Attorney • The ability to plan and direct operations • The authority to veto, modify, and overrule decisions
Another significant example of control is the nature of financial interdependency between the various City funds. Manifestations of financial interdependency include taldng responsibility for financing deficits, being entitled to operating surpluses, and giving implied guarantees (moral responsibility) for debt obligations.
Component Units As of June 30, 2018, there were no discretely reportable component units. The City's blended component units include operations of the San Leandro Parldng Authority and the San Leandro Public Financing Authority.
Vl

The CAFR for the year ending June 30, 2018 provides a financial account of those activities, organizational elements, and City functions for which the City Council provides policy direction and general oversight. It presents financial info1mation on the activities of the City itself and the component units of the City upon which the City Council is authorized to impose its will. The operating nature of the City's component units dete1mines how they are reported in the fmancial statements. The activities of component units that provide financial benefit or create fmancial burden for the City are blended within the City's general financial statements. Component units that have no discemable financial impact upon the City are presented separately.
ECONOMIC CONDITION OF THE CITY
The City of San Leandro has a diverse and strong economy, with its business community comprised of varied businesses ranging from neighborhood coffee houses and fine restaurants, large food processing centers, and regional shopping opportunities, to cutting edge technology. While the economic base has dramatically changed from its agricultural early years, San Leandro continues to expand on its sound business base with the ongoing development of such projects as a multi-family housing development, a new high-rise office complex, and the continuing revitalization of downtown San Leandro.
The recession resulting from the global fmancial and credit market meltdown in late 2008 has had a direct and dramatic impact on the City's local revenues. However, current data indicates median home prices are $689,000, near the median price at the 2006 peak. The unemployment rate is 3%.
The City's General Fund supports many of the City's key services, such as public safety, library and parks and recreation. Revenue to this critical fund, generated largely from sales and property taxes, has grown to higher levels due to voter-approved tax measures in 2014 and 2016. Low mortgage rates have spurred investment in housing. The improving housing market, which represents 63 % of the City's tax roll, led to a 5.7% growth in taxable assessed value for Fiscal year 2017-18. Sales tax increased 3% in the City. With the passage of Measure HH (0.5% sales tax increase) effective April 1, 2015, the half-cent sales tax added $11. 9 million sales tax revenue in the fiscal year.
City operations are also supported by other funds, including enterprise funds. Key enterprise funds include the Water Pollution Control Plant and Shoreline Enterprise Funds. Both of these funds have seen revenues slightly improving over the last year. The Water Pollution Control Plant Enterprise fund was established to account for the City's sewers, which protect public health and preserve water quality through collection, treatment, and disposal of the community's wastewater and wastewater solids. Program revenues to this fund in 2017-18 totaled $12.6 million, a 4% decrease from the prior year. The Shoreline Enterprise Fund was established in 2002-03 and combined the Marina Enterprise and the Golf Course Enterprise Funds. Program revenues to this fund in 2017-18 totaled $2 million, which is unchanged from the prior year.
While the City has implemented considerable expenditure/service reductions to balance its budget, it continues to face increased operating costs. For example, the City's contribution rates for employee pensions continue to rise due to prior portfolio losses and a change in actuarial assumptions by CalPERS, with additional increases projected in future years. The City has offset some of these increases with staff reductions in recent years, and will be working with employee groups over the next couple of years to address this growing cost. Partially mitigating the double digit increases in annual CalPERS funding are extra contributions to the pension from employees, which are up to 11 % of salary.
Vll

Long-term perspective The City adopts an annual budget, but employs long-term planning as the framework for its fiscal decisions. While San Leandra's underlying economy is viewed as positive in the long-term, today's economic challenges, notably in the General Fund, must be dealt with now to ensure long-term fiscal stability. The City Council has implemented various cost cutting measures after staffing peaked in 2008-09 to produce recurring budget savings to address unfunded liabilities. Passage of Measure Zin November 2010, Measure HH in 2014 and Measures 00, PP and NN in 2016 have improved revenues enough to restore selective services, such as the community care initiative and emergency preparedness.
City Council unrestricted reserves total $36.6 million in the General Fund at June 30, 2018. The restricted reserve balance is $16.6 million.
MAJOR INITIATIVES AND ACCOMPLISHMENTS
In its role of providing policy direction and general oversight, the City Council establishes major goals for City service delivery. These goals are identified and quantified in the City's annual budget. The City can boast of an impressive list of major initiatives and accomplishments during 2017-18 that helped achieve the City's mission of serving the public and enhancing the quality of life in San Leandro. Some of these major initiatives and accomplishments include:
Capital Improvements Energy and Water Efficiency Improvements As part of City Council's goal to maintain and enhance San Leandra's infrastructure, the City entered into a $5.2 million contract to replace streetlights with brighter, energy efficient LED lights, new lighting systems at 23 City buildings, including the main Library, new HV AC systems at three City buildings and new irrigation for City-owned landscape. The contractor has guaranteed the savings will be sufficient to pay the cost of the project over its useful life. This project was completed in November 2018.
Streets and Road Projects As part of the City's overall Pavement Management strategy, the rehabilitation of city streets through the construction of overlay, pothole repairs, and various street resurfacing treatments, continue to improve the streets and roads that enhances the City's road quality and durability.
Affordable Housing and Downtown Office Construction The 200-unit mixed use, transit oriented development Marea Alta rental construction on the fo1mer BART parking lot site (1400 San Leandro Boulevard) provides affordable rental housing. The project developer is BRIDGE Housing Corporation, a nationally recognized nonprofit affordable housing developer and property manager. Simultaneously, Westlal<e Development Partners is constructing a multi-phased downtown technology campus on property it owns west of the San Leandro BART Station, which was originally intended for affordable rental housing by BRIDGE Housing. Marea Alta and the San Leandro Tech Campus are now distinct development projects on separate planning and construction schedules. The first fully leased, 132,000 square feet and six level parking garage was opened in November 2016 by Westlake Development Partners and the first 115 units of the Marea Alta project opened in May 2017 and the fmal 85 units will open in 2019. Similarly, Westlake' s second office building has finished construction and provides another 132,000 square feet of office space. Ghiradelli Chocolate Co has leased the top floor of this building. A third office building or hotel is expected to commence construction in the coming year.
vm
COUNCIL FINANCIAL POLICIES
Over the years, the San Leandro City Council has followed a series of Financial Values that provide guidance to budget administration, capital financing and debt management - which are also used to guide the budget process. In addition, the City Council adopted, by resolution, specific budget administration guidelines which set out guidance for fund balance designations and reserves management.
The budget guidelines recommend sufficient fund balance to provide for: a) Economic unce1iainties, local disasters, and other financial hardships or downturns in the local or national economy, b) contingencies for unforeseen operating or capital needs and c) cash flow requirements. Further, the guidelines call for such designated fund balances to be at least 16.67% of General Fund operating expenditures (budgeted expenditures for the following year). Consequently, based on the General Fund's budgeted operating expenditures for 2018-19 the guideline requirement is approximately $19 .6 million.
The 2017-18 financial statements reflect unrestricted reserves thattotal $36.6 million. The Unassigned Fund Balance aligns with the Council's fund balance guideline to provide at least 16.7% unrestricted, General Fund reserve, as a percentage of next fiscal year's General fund Operating Budget.
FINANCIAL INFORMATION
City Budget & Budgetary Controls The City Council is required to adopt a final budget through the passage of a resolution no later than June 30, the close of the fiscal year, following a public hearing process conducted to obtain taxpayer comments. This annual budget serves as the foundation for the City's financial planning and control. The budget is prepared by fund, function (e.g., public safety) and department (e.g., police). The legal level of budgetary control is at the fund level. The City Manager is authorized to transfer budgeted amounts between departments and line items within any fund; however, any revisions which alter the total expenditures of any fund must be approved by the City Council. Transfers between funds must be approved by the City Council. At the end of the fiscal year, encumbered appropriations are canied fo1ward and become part of the following year's budget while appropriations that have not been encumbered lapse, unless otherwise authorized by the City Council and the City Manager.
Accounting System The City's accounting records for general government operations are maintained on a modified accrual basis, with the revenues being recorded when measurable and available. Expenditures are recorded when the services or goods are received and the liabilities incurred. Accounting records for the City's proprietary activities are maintained on the full accrual basis, with revenues recorded when earned and expenses when incurred. In maintaining the City's accounting system, consideration is given to the adequacy of internal controls. Internal controls are designed to provide reasonable assurance regarding the safeguarding of assets and to ensure the reliability of financial records and maintaining accountability for assets. The concept of reasonable assurance recognizes that the cost of control should not exceed the benefits likely to be derived. The evaluation of costs and benefits requires continuing estimates and judgments by City management. We believe that the City's system of internal accounting controls continues to adequately safeguard assets and provide reasonable assurance that financial transactions are properly recorded.
lX

Risk Management The City maintains a program of commercial insurance combined with self-insurance for substantially all of its governmental operations, except for major constrnction projects and contractor-supplied services. In such circumstances, insurance to protect the City is provided by each contractor. The City is a member of the Local Agency Workers' Compensation Excess Joint Powers Authority (LAWCX). The City is also a member of California Joint Powers Risk Management Authority (CJPRMA), which provides annual general liability coverage in an aggregate up to $40 million. Additional infmmation on the City's risk management activity can be found in the notes to the financial statements.
OTHER INFORMATION
Certificate of Achievement The Government Finance Officers Association of the United States and Canada (GFOA) awarded a Certificate of Achievement for Excellence in Financial Reporting to the City of San Leandro for its CAFR for the fiscal year ended June 30, 2017. This was the 22nd consecutive year that the City of San Leandro has received this prestigious award. In order to be awarded a Certificate of Achievement, a government must publish an easily readable and efficiently organized CAFR. This repmi must satisfy both generally accepted accounting principles and applicable legal requirements.
A Ce1iificate of Achievement is valid for a pe1iod of one year. We believe that our cmTent CAFR continues to meet the Certificate of Achievement Program's requirements and we are submitting it to the GFOA to dete1mine its eligibility for another certificate.
Acknowledgements This CAFR represents the culmination of numerous hours of hard work expended by the dedicated staff in the Accounting Division of the Finance Department. In particular, I would like to express appreciation to Norite Vong, Rita Gurule-Salcido, Susan Nunes, and Sally Perez whose suppmi and dedication made the report possible. Furthermore, I would like to thank Maze & Associates for their professional assistance and cooperation.
Finally, I want to thank the City Manager and the City Council for their continued interest and suppmi in planning and conducting the City's financial operations.
Respectfully submitted,
David Baum Finance Director
X

This organizational chart reflects relationships between policy-making responsibility (Mayor, City Council, and Advisory Boards and Commissions)
Personnel Relations
Board
City Manager's Office
and administrative officers and departments.
Board of Zoning
Adjustments
Planning Commission
Rent Review Board
I I I
I
Residents San Leandro
City Council
Library Historical
Commission
Human Services
Commission
Recreation and Parks
Commission
Youth Advisory
Commission
Senior Commission
Arts Commission
I I I I I I I I I
I I I I ~--------1 ________________ J ________________ l ________________ J I I I I l ___________ -------~--J
-------· J ~-~--~ I I
!
r-------------------
! I I
Community Development
Finance Library
Services
City Manager
Fire
Police
XI
City Attorney
Public Works
Engineering and
Transportation
Recreation and Human
Services
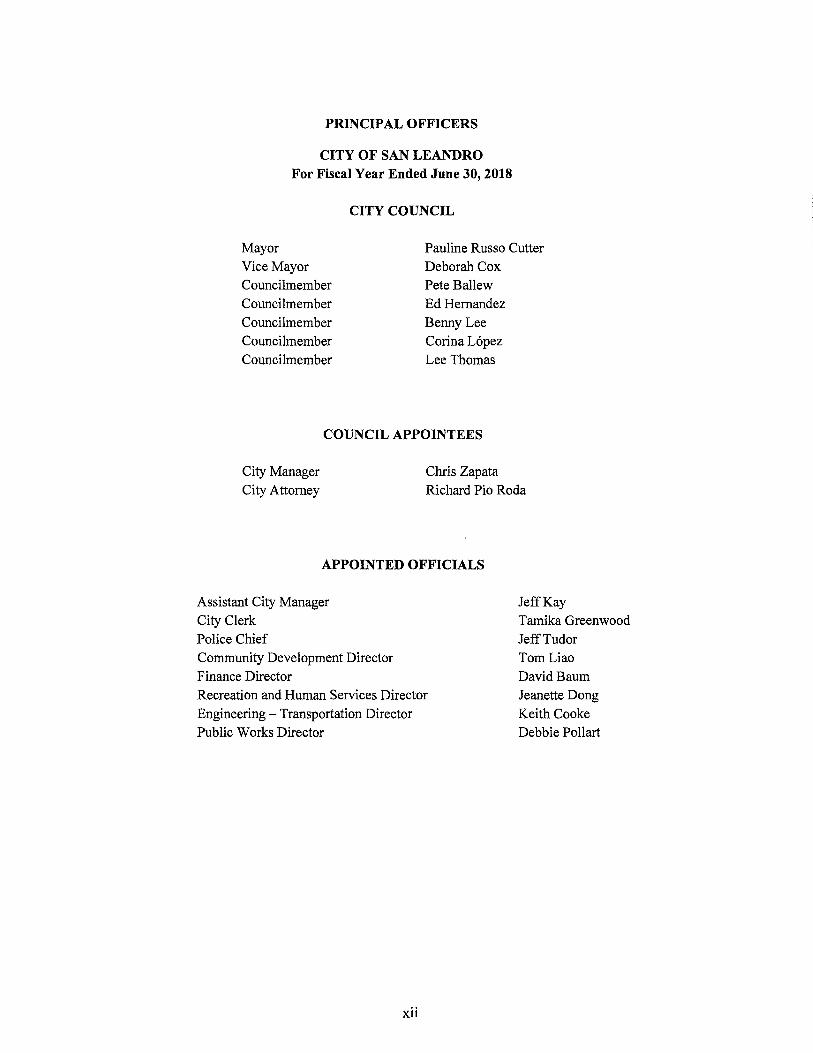
PRINCIPAL OFFICERS
CITY OF SAN LEANDRO For Fiscal Year Ended June 30, 2018
CITY COUNCIL
Mayor Pauline Russo Cutter Vice Mayor Deborah Cox Councilmember Pete Ballew Councilmember Ed Hernandez Councilmember Benny Lee Councilmember Corina Lopez Councilmember Lee Thomas
COUNCIL APPOINTEES
City Manager City Attorney
Chris Zapata Richard Pio Roda
APPOINTED OFFICIALS
Assistant City Manager City Clerk Police Chief Community Development Director Finance Director Recreation and Human Services Director Engineering - Transportation Director Public Works Director
xii
Jeff Kay Tamika Greenwood Jeff Tudor Tom Liao David Baum Jeanette Dong Keith Cooke Debbie Pollart

0 5
Miles
Berkeley
SAN LEANDRO
San Jose
xm

Government Finance Officers Association
Certificate of Achievement for Excellence
in Financial Reporting
Presented to
City of San Leandro
California
For its Comprehensive Annual Financial Report
for the Fiscal Year Ended
June 30, 2017
Executive Director/CEO
xiv
INDEPENDENT AUDITOR'S REPORT
To the Honorable Members of City Council City of San Leandro, California
Report on Financial Statements
We have audited the accompanying financial statements of the governmental activities, the business-type activities, each major fund, and the aggregate remaining fund information of the City of San Leandro (City), California, as of and for the year ended June 30, 2018, and the related notes to the financial statements, which collectively comprise the City's basic financial statements as listed in the Table of Contents.
Management's Responsibility for the Financial Statements
Management is responsible for the preparation and fair presentation of these financial statements in accordance with accounting principles generally accepted in the United States of America; this includes the design, implementation, and maintenance of internal control relevant to the preparation and fair presentation of the financial statements that are free from material misstatement, whether due to fraud or error.
Auditor's Responsibility
Our responsibility is to express opinions on these financial statements based on our audit. We conducted our audit in accordance with auditing standards generally accepted in the United States of America and the standards applicable to financial audits contained in Government Auditing Standards, issued by the Comptroller General of the United States. Those standards require that we plan and perform the audit to obtain reasonable assurance about whether the financial statements are free from material misstatement.
An audit involves performing procedures to obtain audit evidence about the amounts and disclosures in the financial statements. The procedures selected depend on the auditor' s judgment, including the assessment of the risks of material misstatement of the financial statements, whether due to fraud or error. In making those risk assessments, the auditor considers internal control relevant to the City' s preparation and fair presentation of the financial statements in order to design audit procedures that are appropriate in the circumstances, but not for the purpose of expressing an opinion on the effectiveness of the City's internal control. Accordingly, we express no such opinion. An audit also includes evaluating the appropriateness of accounting policies used and the reasonableness of significant accounting estimates made by management, as well as evaluating the overall presentation of the financial statements.
We believe that the audit evidence we have obtained is sufficient and appropriate to provide a basis for our audit opinions.
Accountancy Corporation 3478 Buskirk Avenue, Suite 215
Pleasant Hill , CA 94523
T 925,930.0902
F 925.930.0135 E [email protected]
w mazeassociates.com

Opinions
In our opinion, the financial statements referred to above present fairly, in all material respects, the respective financial position of the governmental activities, the business-type activities, each major fund, and the aggregate remaining fund information of the City as of June 30, 2018 and the respective changes in financial position and, where applicable, cash flows thereof for the year then ended in accordance with accounting principles generally accepted in the United States of America.
Change in Accounting Principles
Management adopted the provisions of Governmental Accounting Standards Board Statement No. 75, Accounting and Financial Reporting for Postemployment Benefits Other than Pensions, which became effective during the year ended June 30, 2018 and required a restatement of the beginning net position balance of the Governmental Activities as discussed in Note 9E.
Other Matters
Required Supplementary Information
Accounting principles generally accepted in the United States of America require that Management's Discussion and Analysis and other required supplementary information as listed in the Table of Contents be presented to supplement the basic financial statements. Such information, although not a part of the basic financial statements, is required by the Governmental Accounting Standards Board, who considers it to be an essential part of financial reporting for placing the basic financial statements in an appropriate operational, economic or historical context. We have applied certain limited procedures to the required supplementary information in accordance with auditing standards generally accepted in the United States of America, which consisted of inquiries of management about the methods of preparing the information and comparing the information for consistency with management's responses to our inquiries, the basic financial statements, and other knowledge we obtained during our audit of the basic financial statements. We do not express an opinion or provide any assurance on the information because the limited procedures do not provide us with sufficient evidence to express an opinion or provide any assurance.
Other Information
Our audit was conducted for the purpose of forming opinions on the financial statements that collectively comprise the City's basic financial statement. The Introductory Section, Supplementary Information, and Statistical Section as listed in the Table of Contents are presented for purposes of additional analysis and are not required parts of the basic financial statements.
The Supplementary Information is the responsibility of management and was derived from and relates directly to the underlying accounting and other records used to prepare the basic financial statements. Such information has been subjected to the auditing procedures applied in the audit of the basic financial statements and certain additional procedures, including comparing and reconciling such information directly to the underlying accounting and other records used to prepare the financial statements or to the basic financial statements themselves, and other additional procedures in accordance with auditing standards generally accepted in the United States of America. In our opinion, the Supplementary Information is fairly stated, in all material respects in relation to the basic financial statements as a whole.
The Introductory and Statistical Sections have not been subjected to the auditing procedures applied in the audit of the basic financial statements and, accordingly, we do not express an opinion or provide any assurance on them.
2
Other Reporting Required by Government Auditing Standards
In accordance with Government Auditing Standards, we have also issued our report dated April 26, 2019, on our consideration of the City's internal control over financial reporting and on our tests of its compliance with certain provisions of laws, regulations, contracts, and grant agreements and other matters. The purpose of that report is to describe the scope of our testing of internal control over financial reporting and compliance and the results of that testing, and not to provide an opinion on internal control over financial reporting or on compliance. That report is an integral part of an audit performed in accordance with Government Auditing Standards in considering the City's internal control over financial reporting and compliance.
~~(, ~ ~~1)~ Pleasant Hill, California April 26, 2019
3


CITY OF SAN LEANDRO, CALIFORNIA Management's Discussion and Analysis
For the Fiscal Year Ended June 30, 2018
The Management's Discussion and Analysis (MD&A) provides an overview of the City of San Leandro's activities and financial performance for the fiscal year ended June 30, 2018. To obtain a complete picture of the City's financial condition, this document should be read in conjunction with the accompanying Transmittal Letter and Basic Financial Statements.
FINANCIAL HIGHLIGHTS
Infmmation about net position is presented in the summary schedule, below:
• At the close of the most recent fiscal year, the City's assets exceeded its liabilities by $190.2 million (net position), a $16.1 million decrease from the prior year. Of the net position, $216.1 million was invested in capital assets, $41.1 million was restricted for other purposes, and ($67.0) million was unrestricted. While Net Investment in Capital Assets and Unrestricted Net Position saw a decrease of $5.5 million and $20.1 million, respectively, restrict net position increased by $9.5 million.
• Assets and Defeffed Outflow of Resources saw an increase of $1.5 million from the prior fiscal year, fully offset by an increase in Liabilities and Defe1red Inflow of Resources of $17. 7 million. The increase in Liabilities is in paii due to an increase in the net pension liability and the implementation of GASB Statement Number 75, which recognizes the net OPEB liability within the Statement of Net Position.
• As of June 30, 2018, the City's total net position decrease of $16.1 million is comprised of a $17.3 million decrease in governmental activities and a $1.2 million increase in Business-Type activities.
• Per GASB Statement Number 54, governments are obligated to enhance the financial reporting of the fund balance categories. Fund balances are described and presented in Note 9, which details the classifications of the City's new fund balance categories. The City's governmental fund balance, which include the general, special revenue, debt service, and capital projects funds, increased by $11. 7 million for an ending fund balance of $94.3 million.
a) Approximately 11.9% of the amount ($11.3 million) is Nonspendable because the funds are not available or spendable due to advances and loans to other funds.
b) Approximately 43. 7% of the amount ($41.2 million) is Restricted due to the constraints placed on the use of resources or imposed by law through constitutional provisions or enabling legislation. This includes capital projects and debt service payments.
c) Approximately 5.6% of the amount ($5.3 million) is Assigned which are General fund encumbrances from prior fiscal year and a reserve to fund anticipated Other Post Employment Benefits (OPEB) costs resulting from the City's contract for Fire Services with Alameda County.
d) Approximately 38.8% of the amount ($36.5 million) is Unassigned and available for spending in the future. Unassigned is further categorized by Compensated Absences, Major Emergencies, Economic Uncertainties and offsets from other fund deficits.
5

OVERVIEW OF THE BASIC FINANCIAL STATEMENTS
Management's Discussion and Analysis gives an introduction to the City's basic financial statements. The City's basic financial statements are comprised of three components: I) government-wide financial statements, 2) fund financial statements, and 3) notes to the financial statements. The repo1i also contains other supplementary information in addition to the basic financial statements.
Government-Wide Financial Statements The government-wide financial statements are designed to provide readers a broad overview of the City's finances in a manner similar to statements of a private-sector business. The Statements are comprised of the Statement of Net Position and Statement of Activities and Changes in Net Position.
The Statement of Net Position presents information on all of the City's assets and liabilities, with the difference between the two reported as net position. Over a period of time, increases or decreases in net position may serve as a useful indicator of changes in the City's financial reporting.
The Statement of Activities and Changes in Net Position presents information showing how the government's net position changed during the fiscal year. All changes in net position are reported as soon as the underlying event giving rise to the change occurs, regardless of the timing of the related cash flows. Thus, revenues and expenses are rep01ied in this statement for some items that will only result in cash flows in future fiscal periods ( e.g. uncollected taxes, earned but unused vacation leave, and other compensated absences).
The government-wide financial statements distinguish functions of the City that are principally supp01ied by taxes and intergovernmental revenue (governmental activities) from other functions that are intended to recover all or a significant portion of their costs through user fees and charges (business-type activities).
Both of the above financial statements have separate sections for two different types of programs or activities. These two types of activities are:
Governmental Activities - The activities in this section are mostly supp01ied by taxes and charges for services. The governmental activities of the City include General Government (City Council, City Manager, City Clerk, Human Resources, Information Technologies, and Finance), Public Safety (Police and Fire), Engineering & Transportation (includes Public Works), Recreation and Culture (includes Library), and Community Development.
Business-Type Activities - These functions normally are intended to recover all or a significant portion of their costs through user fees and charges to external users of goods and services. The business-type activities of the City include the Water Pollution Control Plant, Environmental Services, Shoreline Enterprise, and Storm Water Utility.
Fund Financial Statements A fund is a grouping of related accounts that is used to maintain control over resources that have been segregated for specific activities or objectives. The City, like other state and local governments, uses fund accounting to ensure and demonstrate compliance with finance-related legal requirements. All of the funds of the City can be divided into three categories: governmental funds, proprietary funds, and fiduciary funds.
6

Governmental Funds - Governmental funds are used to account for essentially the same functions reported as governmental activities in the government-wide financial statements. However, unlike the government-wide financial statements, governmental fund statements focus on near-term inflows and outflows of spendable resources, as well as on balances of spendable resources available at the end of the fiscal year. Such information may be useful in evaluating a government's near-term financial capacity.
Because the focus of governmental funds is narrower than that of the government-wide financial statements, it is useful to compare the information presented for government funds with similar information presented for governmental activities in the government-wide financial statements. By doing so, readers may better understand the long-term impact of the government's near-term financing decisions. Both the governmental fund balance sheet and the governmental fund statement of revenues, expenditures, and changes in fund balances provide a reconciliation to facilitate this comparison between governmental funds and governmental activities. These reconciliations are presented on the page immediately following each governmental fund financial statement.
The City has 25 governmental funds, of which two are considered a major fund for presentation purposes. Major funds are presented separately in the governmental fund balance sheet and in the governmental fund statement of revenues, expenditures, and changes in fund balances. The City's two major funds are the General Fund and the Capital Improvement Capital Project Fund. Individual fund data for each of the non-major governmental funds are provided in the form of combining statements elsewhere in this report.
The City adopts an annual appropriated budget for its General Fund and all other major and non-major funds. Budgetary comparison statements are elsewhere in this report to demonstrate compliance with the adopted budget.
Proprietary Funds - The City maintains two different types of proprietary funds: enterprise funds and internal service funds. Enterprise funds are used to report the functions presented as business-type activities in the government-wide financial statements. The City uses an enterprise fund to account for its Water Pollution Control Plant, Shoreline, Storm Water Utility, and Environmental Services. Internal service funds are used to accumulate and allocate costs internally among various City functions. The City uses internal service funds to account for the fleet of vehicles, building and facilities maintenance, insurance services, and information systems. Because these services primarily benefit governmental rather than business-type functions, these are included within governmental activities in the governmentalwide financial statements.
Proprietary funds provide the same type of information as the government-wide financial statements, but in greater detail. The proprietary fund financial statements provide separate information for the entire City's proprietary funds. Conversely, internal service funds are combined into a single, aggregated presentation in the proprietary financial statements. Individual fund data for the proprietary and internal service funds are provided in the form of combining statements elsewhere in the report.
Fiduciary Funds - Fiduciary funds, consisting solely of trust and agency funds, are used to account for resources held for the benefit of pmiies outside the government. Fiduciary funds are not reflected in the government-wide financial statements because the resources of these funds are not available to supp01i the City's own progrmns. The accounting used for these funds is much like that used for governmental funds. These funds are reported in a separate statement of fiduciary assets.
7

Notes to the Basic Financial Statements The notes to the basic financial statements provide additional information that is essential to a full understanding of the data provided in the government-wide and fund financial statements. The notes to the financial statements follow the basic financial statements.
Other Information In addition to the basic financial statements and accompanying notes, this report also presents certain required supplemental information. This information includes budgetary comparison schedules, more detailed info1mation about the City's agreement with the California Public Employees Retirement System (CalPERS) for the defined benefit pension plan, and more detailed information on the City's Other Post Employment Benefit Plan (OPEB).
GOVERNMENT-WIDE FINANCIAL ANALYSIS
Net Position - As noted earlier, net position may serve over time as a useful indicator of the City's financial position. In the case of the City, total assets exceeded liabilities by $190.2 million at the close of fiscal year 2017-18, a decrease of7.8% due to reasons noted earlier.
City of San Leandro
Net Assets at June 30, 2018
(in thousands)
Governrrental Activities Business-Type Activities Total
% % % 2018 2017 change 2018 2017 change 2018 2017 change
Current Assets $111,605 $ 99,803 11.8% 34,636 38,217 -9.4% $146,241 $138,020 6.0% Non-Current Assets 8,597 16,363 -47.5% (3,888) (3,351) 16.0% 4,709 13,012 -63.8% Capital Assets 210,047 217,635 -3.5% 75,236 73,354 2.6% 285,283 290,989 -2.0%
Total assets 330,249 333,801 -1.1% 105,984 108,220 -2.1% 436,233 442,021 -1.3%
Deferred Outflows of Resources 42,627 35,263 20.9% 2,719 2,772 -1.9% 45,346 38,035 19.2%
Current and other liabilities 15,761 16,003 -1.5% 3,033 4,572 -33.7% 18,794 20,575 -8.7% Long-term liabilities 213,070 192,001 11.0% 52,733 54,562 -3.4% 265,803 246,563 7.8%
Total liabilities 228,831 208,004 10.0% 55,766 59,134 -5.7% 284,597 267,138 6.5%
Deferred Inflows of Resources 6,725 6,401 5.1% 102 185 -44.9% 6,827 6,586 3.7%
Net assets:
Net investrrent in capital assets 181,179 190,556 -4.9% 34,872 31,056 12.3% 216,051 221,612 -2.5% Restricted 41,104 31,648 29.9% NIA 41,104 31,648 29.9% Unrestricted (84,963) (67,544) 25.8% 17,963 20,616 -12.9% (67,000) (46,928) 42.8%
Total net position $137,320 $154,660 -11.2% 52,835 51,672 2.3% $190,155 $206,332 -7.8%
The City's $216.1 million net investment in capital assets such as infrastructure, land, buildings, machinery, and equipment is by far the largest portion of the City's net position. Because the City uses these capital assets to provide services to residents, these assets are not available for future spending. Although investment in its capital assets is reported net of related debt, it should be noted that the resources needed to repay must be provided from other sources (future income), since the capital assets themselves cannot be used to liquidate these liabilities.
8

Of the City's total net position, $41.1 million represents resources that are subject to external restriction on how they may be used. The remaining balance of ($67.0) million represents an unrestricted net position, which may be used to meet the City's ongoing obligations to citizens and creditors within the restrictions set forth by various funding sources.
Year over year, the City's total net position for both governmental and business-type activities decreased by $16.1 million during the cunent fiscal year. Information about changes in net position is presented in the summary schedule below:
City of San Leandro
Changes in Net Activities
Year Ended June 30, 2018
(in thousands)
Governmental Activities Business-Type Activities Total
2018 2017 % Change 2018 2017 %Change 2018 2017 %Change Revenues Program revenues:
Charges for Services $ 18,675 $ 16,957 10.1% $ 16,369 $ 16,859 -2.9% $ 35,044 $ 33,8 I 6 3.6% Operating grants and 6,579 5,334 23.3% 0.0% 6,579 5,334 23.3%
contributions
Capital grants and 9,395 9,457 -0.7% 369 243 51.9% 9,764 9,700 0.7%
contributions
General revenues:
Property taxes 22,994 20,858 10.2% 0.0% 22,994 20,858 10.2% Sales tax 42,990 41,728 3.0% 0.0% 42,990 41,728 3.0% Franchise Fee 5,269 5,103 3.3% 0.0% 5,269 5,103 3.3% Utility users Tax I 0, 719 10,975 -2.3% 0.0% 10,719 I 0,975 -2.3% Property Transfer Tax 5,177 5,459 -5.2% 0.0% 5,177 5,459 -5.2% 911 communication 3,035 2,890 5.0% 0.0% 3,035 2,890 5.0%
Access Tax Other taxes 1,008 908 11.0% 806 629 28.1% 1,814 1,537 18.0% Investment Earnings 1,692 1,560 8.5% 284 180 57.8% 1,976 1,740 13.6% Gain or loss on sale of assets 1,021 3 33933.7% 0.0% 1,021 3 33933.7% Miscellaneous 5,427 1,703 218.7% 0.0% 5,427 1,703 218.7%
Total Revenues 133,981 122,935 9.0% 17,828 17,911 -0.5% 151,809 140,846 7.8%
Expenses General Government 13,659 8,525 60.2% 0.0% 13,659 8,525 60.2% Public safety 64,972 54,510 19.2% 0.0% 64,972 54,510 19.2% Engineering & Transportati< 32,933 28,124 17.1% 0.0% 32,933 28,124 17.1% Recreation and Culture 14,756 13,228 11.6% 0.0% 14,756 13,228 11.6% Community Development 10,217 8,135 25.6% 0.0% 10,217 8,135 25.6% Interest on Long-Term Deb1 1,677 2,218 -24.4% 0.0% 1,677 2,218 -24.4% Water Pollution Control 0.0% 12,185 10,796 12.9% 12,185 I 0,796 12.9% Shoreline 0.0% 1,786 1,755 1.8% 1,786 1,755 1.8% Storm Water Utility 0.0% 1,412 1,106 27.7% 1,412 1,106 27.7% Environmental Services 0.0% 1,095 1,066 2.7% 1,095 1,066 2.7%
Total Expenses 138,214 114,740 20.5% 16,478 14,723 11.9% 154,692 129,463 19.5%
Excess( deficiency)of revenues over expenses before transfe (4,233) 8,195 -151.7% 1,350 3,188 -57.7% (2,883) 11,383 -125.3%
Transfer 188 0.0% (188) 0.0% 0.0% Increase in net position (4,045) 8,195 -149.4% 1,162 3,188 -63.6% (2,883) 11,383 -125.3%
Beginning net position 141,365 146,464 -3.5% 51,673 48,485 6.6% 193,038 194,949 -1.0%
Ending net position $ 137,320 $ 154,659 -11.2% $ 52,835 $ 51,673 2.2% $190,155 $206,332 -7.8%
9
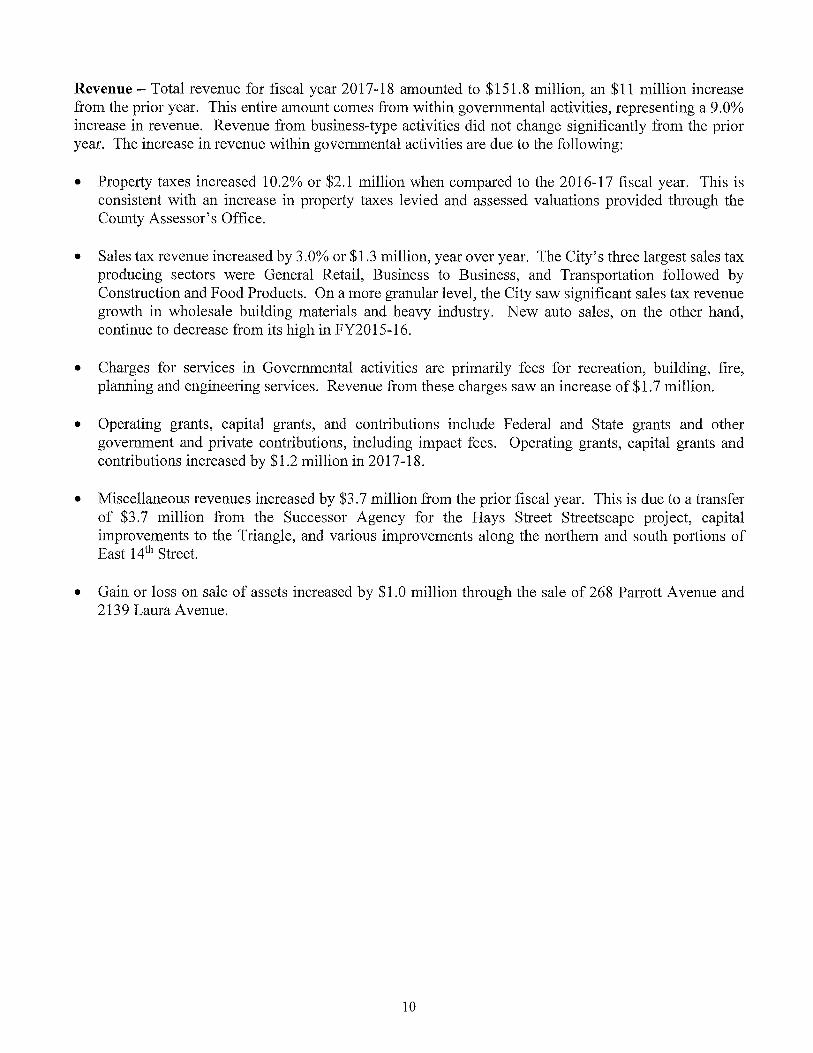
Revenue -Total revenue for fiscal year 2017-18 amounted to $151.8 million, an $11 million increase from the prior year. This entire amount comes from within governmental activities, representing a 9.0% increase in revenue. Revenue from business-type activities did not change significantly from the prior year. The increase in revenue within governmental activities are due to the following:
• Prope1iy taxes increased 10 .2% or $2.1 million when compared to the 2016-1 7 fiscal year. This is consistent with an increase in prope1iy taxes levied and assessed valuations provided through the County Assessor's Office.
• Sales tax revenue increased by 3. 0% or $1.3 million, year over year. The City's three largest sales tax producing sectors were General Retail, Business to Business, and Transportation followed by Construction and Food Products. On a more granular level, the City saw significant sales tax revenue growth in wholesale building materials and heavy industry. New auto sales, on the other hand, continue to decrease from its high in FY2015-16.
• Charges for services in Governmental activities are primarily fees for recreation, building, fire, planning and engineering services. Revenue from these charges saw an increase of $1. 7 million.
• Operating grants, capital grants, and contributions include Federal and State grants and other government and private contributions, including impact fees. Operating grants, capital grants and contributions increased by $1.2 million in 2017-18.
• Miscellaneous revenues increased by $3. 7 million from the prior fiscal year. This is due to a transfer of $3.7 million from the Successor Agency for the Hays Street Streetscape project, capital improvements to the Triangle, and various improvements along the nmihern and south portions of East 14th Street.
• Gain or loss on sale of assets increased by $1.0 million through the sale of 268 Pan-ott Avenue and 2139 Laura Avenue.
10
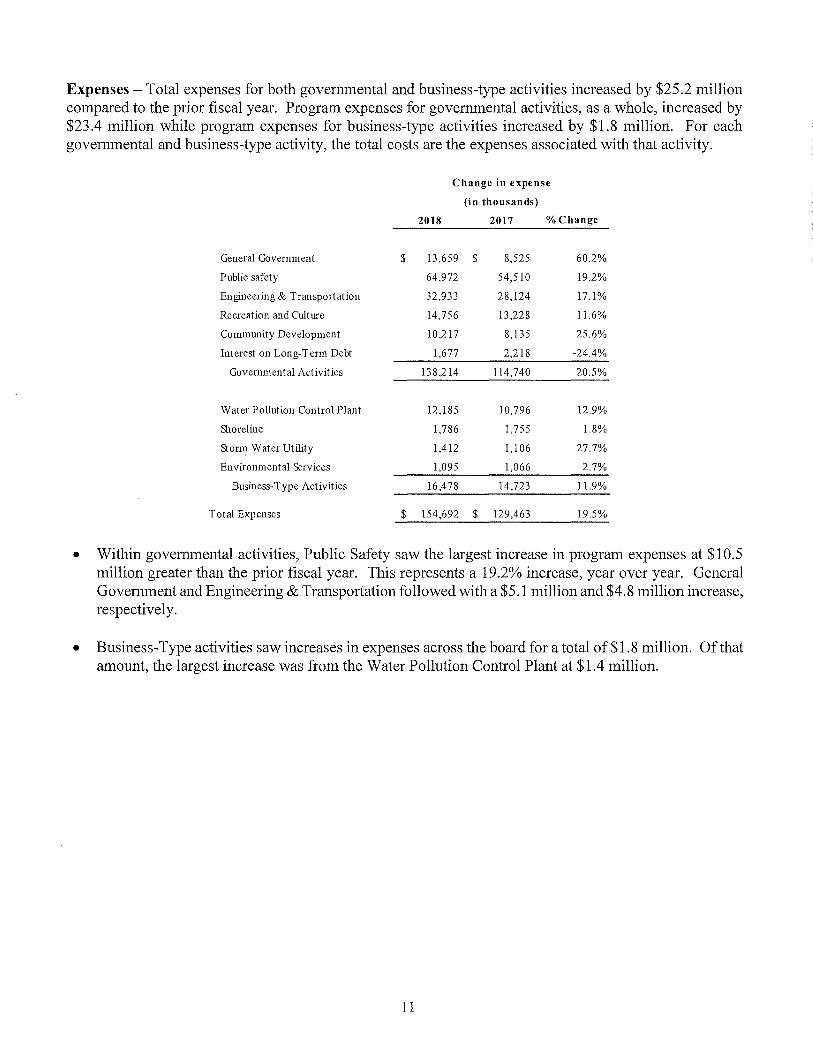
Expenses - Total expenses for both governmental and business-type activities increased by $25.2 million compared to the prior fiscal year. Program expenses for governmental activities, as a whole, increased by $23.4 million while program expenses for business-type activities increased by $1.8 million. For each governmental and business-type activity, the total costs are the expenses associated with that activity.
Change in expense
(in thousands)
2018 2017 % Change
General Government $ 13,659 $ 8,525 60.2%
Public safety 64,972 54,510 19.2%
Engineering & Transportation 32,933 28,124 17.1%
Recreation and Culture 14,756 13,228 11.6%
Community Development 10,217 8,135 25.6%
Interest on Long-Tenn Debt 1,677 2,218 -24.4%
Governmental Activities 138,214 114,740 20.5%
Water Pollution Control Plant 12,185 10,796 12.9%
Shoreline 1,786 1,755 1.8%
Storm Water Utility 1,412 1,106 27.7%
Environmental Services 1,095 1,066 2.7%
Business-Type Activities 16,478 14,723 11.9%
Total Expenses $ 154,692 $ 129,463 19.5%
• Within governmental activities, Public Safety saw the largest increase in program expenses at $10.5 million greater than the prior fiscal year. This represents a 19.2% increase, year over year. General Government and Engineering & Transportation followed with a $5.1 million and $4.8 million increase, respectively.
• Business-Type activities saw increases in expenses across the board for a total of $1. 8 million. Of that amount, the largest increase was from the Water Pollution Control Plant at $1.4 million.
11

Business-Type Activities-The City's business-type activities include the Water Pollution Control Plant, Shoreline, Sto1m Water Utility and Environmental Services. Business-Type activities net position increased by $1.2 million from prior fiscal year mainly due to the Shoreline Fund's operating income, before transfers, of $1.1 million. The Shoreline Fund's net position increased from $97,122 to $1.1 million.
Expenses by Function - Business-Type Activities
Environment al Services
13%
Water Pollution Contro l Plant 74%
Revenues by Source - Business-Type Activities
Capital Grants and Contributio
2%
Charges for Services
92%
FINANCIAL ANALYSIS OF INDIVIDUAL FUNDS
Governmental Funds The focus of the City's governmental funds is to provide inf01mation on near-term inflows, outflows, and balances of spendable resources. Such information is useful in assessing the City's financial requirements. In particular, unassigned fund balance may serve as a useful measure of a government's net resources available for spending at the end of the fiscal year. However, it should be noted that most of the unassigned amounts are designated by the City Council for specific uses.
At the end of fiscal year 2017-18, the City's governmental funds reported combined ending fund balances of $94. 3 million, an increase of $11. 7 million in comparison with the prior year. Approximately 11. 9% or $11.3 million of the fund balance represents Nonspendable; 43.7% or $41.2 million represents Restricted; 5.6% or $5.3 million represents Assigned; and 38.8% or $36.5 million is Unassigned and is available for spending at the Council's discretion.
12
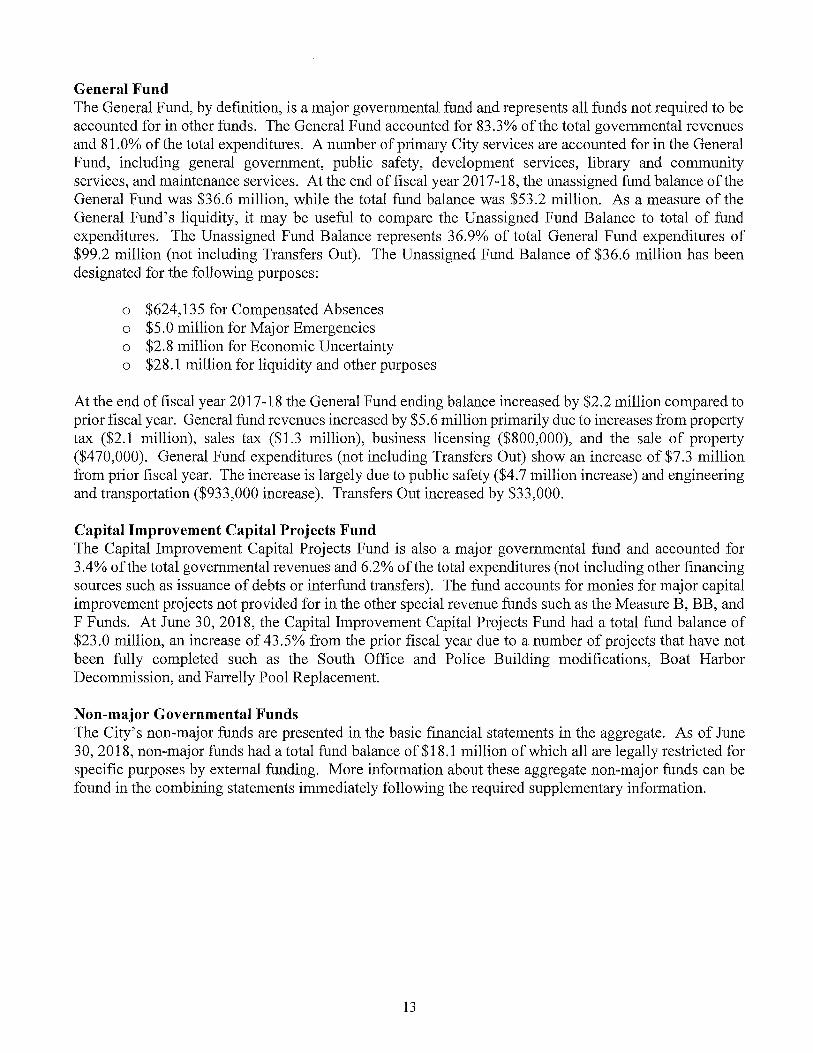
General Fund The General Fund, by definition, is a major governmental fund and represents all funds not required to be accounted for in other funds. The General Fund accounted for 83.3% of the total governmental revenues and 81.0% of the total expenditures. A number of primary City services are accounted for in the General Fund, including general government, public safety, development services, library and community services, and maintenance services. At the end of fiscal year 2017-18, the unassigned fund balance of the General Fund was $36.6 million, while the total fund balance was $53.2 million. As a measure of the General Fund's liquidity, it may be useful to compare the Unassigned Fund Balance to total of fund expenditures. The Unassigned Fund Balance represents 36.9% of total General Fund expenditures of $99.2 million (not including Transfers Out). The Unassigned Fund Balance of $36.6 million has been designated for the following purposes:
o $624,135 for Compensated Absences o $5.0 million for Major Emergencies o $2.8 million for Economic Unce1iainty o $28.1 million for liquidity and other purposes
At the end of fiscal year 2017-18 the General Fund ending balance increased by $2.2 million compared to prior fiscal year. General fund revenues increased by $5 .6 million primarily due to increases from prope1iy tax ($2.1 million), sales tax ($1.3 million), business licensing ($800,000), and the sale of prope1iy ($470,000). General Fund expenditures (not including Transfers Out) show an increase of $7.3 million from prior fiscal year. The increase is largely due to public safety ($4.7 million increase) and engineering and transportation ($933,000 increase). Transfers Out increased by $33,000.
Capital Improvement Capital Projects Fund The Capital Improvement Capital Projects Fund is also a major governmental fund and accounted for 3.4% of the total governmental revenues and 6.2% of the total expenditures (not including other financing sources such as issuance of debts or interfund transfers). The fund accounts for monies for major capital improvement projects not provided for in the other special revenue funds such as the Measure B, BB, and F Funds. At June 30, 2018, the Capital Improvement Capital Projects Fund had a total fund balance of $23.0 million, an increase of 43.5% from the prior fiscal year due to a number of projects that have not been fully completed such as the South Office and Police Building modifications, Boat Harbor Decommission, and Farrelly Pool Replacement.
Non-major Governmental Funds The City's non-major funds are presented in the basic financial statements in the aggregate. As of June 30, 2018, non-major funds had a total fund balance of$18.1 million of which all are legally restricted for specific purposes by external funding. More information about these aggregate non-major funds can be found in the combining statements immediately following the required supplementary information.
13

Proprietary Funds The City's proprietary funds provide the same type of inf01mation found in the government-wide financial statements but in greater detail.
The total net position of the enterprise funds was $52.8 million at the end on June 30, 2018, an increase of $1.2 million from the prior fiscal year. The total net position of the internal service funds was $11.8 million at the end on June 30, 2018, an increase of only $2.4 million from the prior fiscal year.
Water Pollution Control Plant Enterprise Fund The Water Pollution Control Plant Enterprise Fund was established to account for the City's sewers, which protect public health and preserve water quality through collection, treatment, and disposal of wastewater and wastewater solids. As of June 30, 2018, the fund's net position totaled $50.6 million, an increase of nearly $500,000 or 1.0%.
Shoreline Enterprise Fund The Shoreline Enterprise Fund was established in 2002-03 by combining the Marina Enterprise and the Golf Course Enterprise Funds. The fund accounts for the operation of recreational berthing, food service facilities, and the public golf course. As of June 30, 2018, the fund's net position totaled $1.1 million. Net position for the prior year was $97,122. This increase of $1.0 million is due to an improving and increasing annual operating income.
Non-major Enterprise Funds The City's non-major enterprise funds include the Storm Water Utility and Environmental Services. Year over year, ending net position for non-major enterprise funds decreased by 19.3%, or $290,000. This decrease is solely due to the St01m Water Utility fund, which ends with a negative net position of $290,439. The fund had an operating loss of $356,000 for the year ending June 30, 2018. More information about these aggregate non-major enterprise funds can be found in the combining statements following the required supplementary info1mation.
14

GENERAL FUND BUDGETARY HIGHLIGHTS
The General Fund ended the fiscal year with actual revenues 2.2% above final budget projections. In total, general fund revenue was $2.5 million greater than projected, largely due to Prope1iy Transfer Tax which were $2.0 million above projections. Expenditures were 7.8% or $8.3 million below projections.
CITY OF SAN LEANDRO Summary Analysis of General Fund Budget, Fiscal Year 2017-18
(in thousands)
REVENUES: Property taxes and other taxes Licenses and pennits Fines and forfeitures Services charges Intergovernmental Use of money and property Interdepartmental charges Other
Total revenues
EXPENDITURES: Current:
General government Public safety Engineering and transportation Recreation and culture Co111111unity development
Debt service: Principal Interest and fees
Total expenditures
EXCESS (DEFICIENCY) OF REVENUES 0 VER EXPENDITURES
OTHER FINANCING SOURCES (USES): Transfers (out)
Total other financing sources (uses)
NET CHANGE IN FUND BALANCE
FUND BALANCES:
Beginning of year
End of year
$
$
Budgeted Amounts
Adopted
89,292 8,632 1,495 3,347 1,080 1,267 2,000 1,914
109,027
12,173 61,955 10,049 10,848 6,303
2,060 810
104,198
4,829
(10,179)
(10,179)
$
Final
89,291 8,632 1,495 3,347 1,119 1,285 2,000 1,957
109,126
13,387 62,321 10,112 10,997 7,808
2,059 810
107,494
1,632
(10,206)
(10,206)
(5,350) $ (8,574) ======
15
$
$
Actual
91,066 9,583 1,688 3,207 1,211 1,633 2,000 1,201
111,589
11,659 59,428 9,476
10,534 5,699
1,569 808
99,173
12,416
(10,206)
(10,206)
2,210
50,962
53,172
Variance with Final Budget
Positive (Negative)
$ 1,775 951 193
(140) 92
348 (0)
(756)
2,463
1,728 2,893
636 463
2,109
490 2
8,321
10,784

CAPITAL ASSETS AND DEBT ADMINISTRATION
Capital Assets The City's capital assets for its governmental and business-type activities as of June 30, 2018 amount to $285.3 million, net of accumulated depreciation. This represents a decrease of $5.7 million due to an annual depreciation expense of over $18 .4 million offset by construction in progress of the Water Pollution Control Plant, the Climatec project, and a brand new Fire Ladder Truck.
Investment in capital assets includes land, buildings, improvements, machinery and equipment, infrastructure and construction in progress. Infrastructure assets are items that are normally immovable and of value only to the City such as roads, bridges, streets and sidewalks, drainage systems, lighting systems, and similar infrastructure.
The following is a summary of the City's capital assets:
City of San Leandro
Capital Assets (net of depreciation)
Year Ended June 30, 2018
(in thousands)
Governmental Activities Business-Type Activities Total 2018 2017 2018 2017 2018 2017
Land $ 16,550 $ 16,648 $ 5,234 $ 5,234 $ 21,784 $ 21,882 Construction in progress 8,593 1,316 3,482 12,075 1,316
Total non-depreciable assets 25,143 17,964 8,716 5,234 33,859 23,198
Depreciable asets (net of depreciation)
Buildings 55,963 57,716 58,424 59,737 114,387 117,453 Improvements other than buildings 2,738 2,940 2,738 2,940 Machinery and equipment 2,446 1,916 2,748 2,903 5,194 4,819 Licensed Vehicles 4,813 4,524 34 36 4,847 4,560 Infrastructure 118,944 132,575 5,315 5,443 124,259 138,018
Total depreciable assets 184,904 199,671 66,521 68,119 251,425 267,790
Total capital assets $ 210,047 $ 217,635 $ 75,237 $ 73,353 $ 285,284 $ 290,988
Additional information on the City's capital assets can be found in Note 5 of the notes to the financial statements.
16
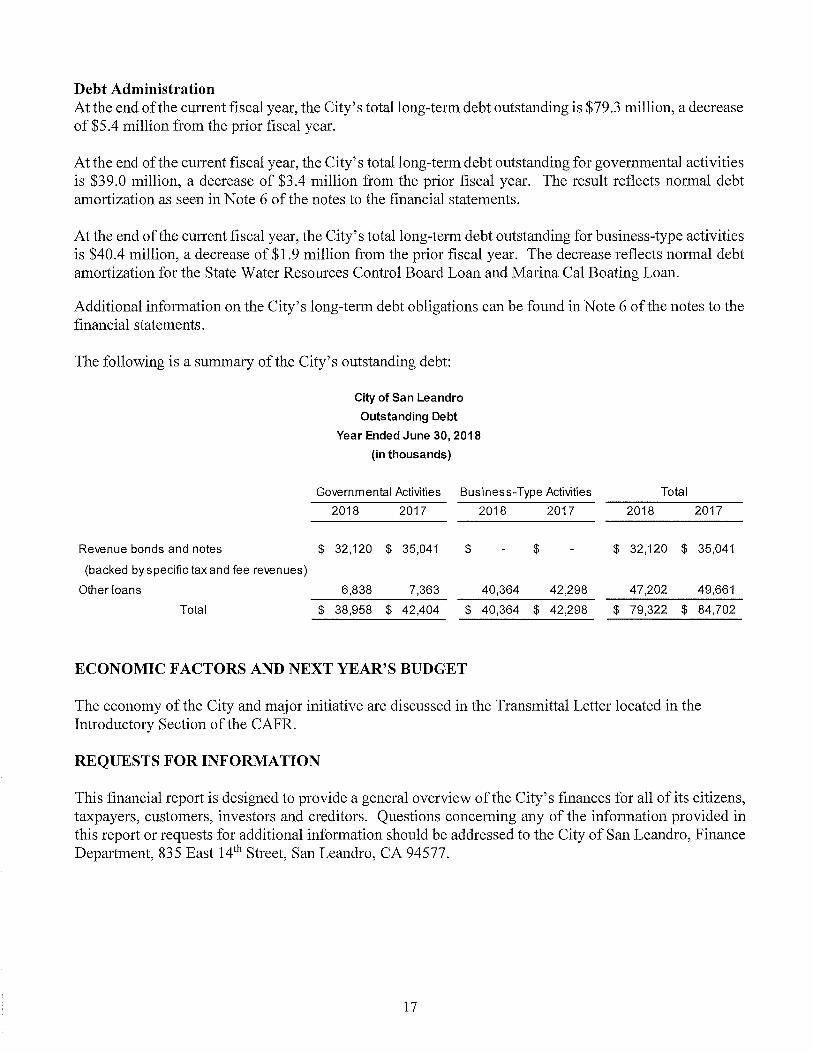
Debt Administration At the end of the cunent fiscal year, the City's total long-term debt outstanding is $79.3 million, a decrease of $5 .4 million from the prior fiscal year.
At the end of the current fiscal year, the City's total long-term debt outstanding for governmental activities is $39.0 million, a decrease of $3.4 million from the prior fiscal year. The result reflects normal debt amortization as seen in Note 6 of the notes to the financial statements.
At the end of the current fiscal year, the City's total long-term debt outstanding for business-type activities is $40.4 million, a decrease of $1.9 million from the prior fiscal year. The decrease reflects normal debt amortization for the State Water Resources Control Board Loan and Marina Cal Boating Loan.
Additional information on the City's long-term debt obligations can be found in Note 6 of the notes to the financial statements.
The following is a summary of the City's outstanding debt:
Revenue bonds and notes
(backed by specific tax and fee revenues)
Other loans
Total
City of San Leandro
Outstanding Debt
Year Ended June 30, 2018
(in thousands)
Governmental Activities Business-Type Activities
2018 2017 2018 2017
$ 32,120 $ 35,041 $ $
6,838 7,363 40,364 42,298
$ 38,958 $ 42,404 $ 40,364 $ 42,298
ECONOMIC FACTORS AND NEXT YEAR'S BUDGET
Total
2018 2017
$ 32,120 $ 35,041
47,202 49,661
$ 79,322 $ 84,702
The economy of the City and major initiative are discussed in the Transmittal Letter located in the Introductory Section of the CAFR.
REQUESTS FOR INFORMATION
This financial report is designed to provide a general overview of the City's finances for all of its citizens, taxpayers, customers, investors and creditors. Questions concerning any of the information provided in this report or requests for additional information should be addressed to the City of San Leandro, Finance Department, 835 East 14th Street, San Leandro, CA 94577.
17


BASIC FINANCIAL STATEMENTS


GOVERNMENT-WIDE FINANCIAL STATEMENTS

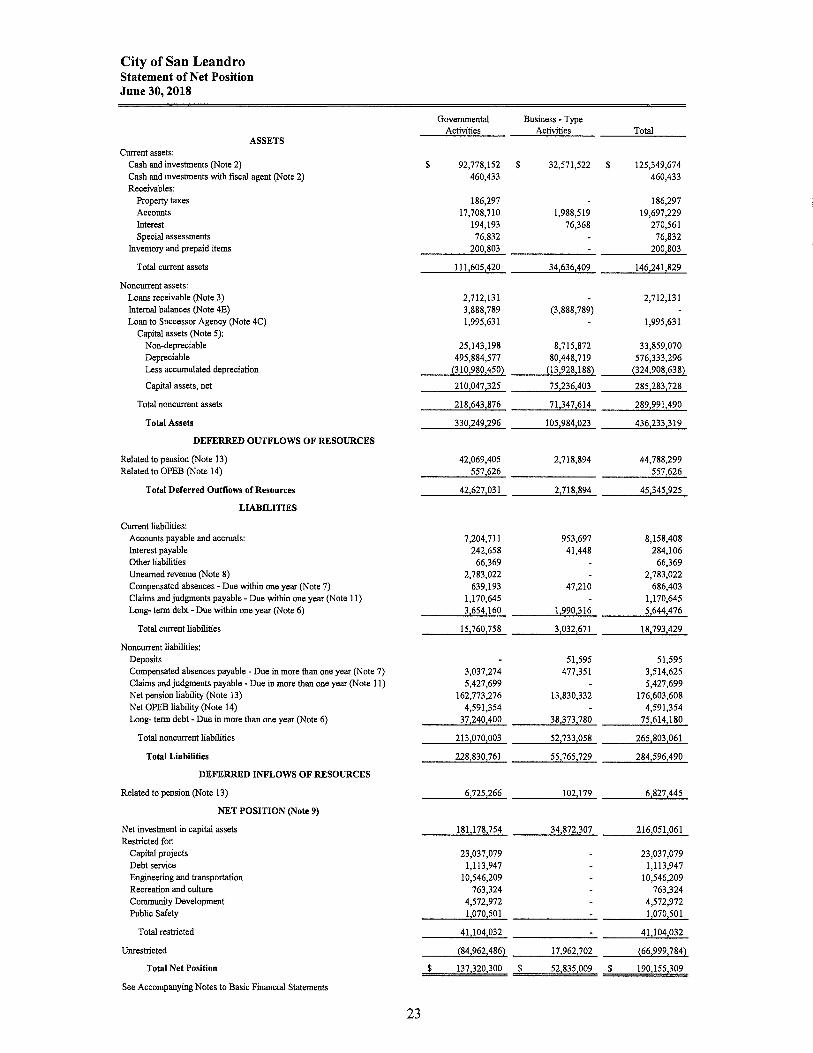
City of San Leandro Statement of Net Position June 30, 2018
Governmental Business - Type Activities Activities Total
ASSETS Current assets:
Cash and investments (Note 2) $ 92,778,152 $ 32,571,522 $ 125,349,674 Cash and investments with fiscal agent (Note 2) 460,433 460,433 Receivables:
Property taxes 186,297 186,297 Accounts 17,708,710 1,988,519 19,697,229 Interest 194,193 76,368 270,561 Special assessments 76,832 76,832
Inventory and prepaid items 200 803 200 803
Total current assets 111605420 34 636 409 146 241 829
Noncurrent assets: Loans receivable (Note 3) 2,712,131 2,712,131 Internal balances (Note 4E) 3,888,789 (3,888,789) Loan to Successor Agency (Note 4C) 1,995,631 1,995,631
Capital assets (Note 5): Non-depreciable 25,143,198 8,715,872 33,859,070 Depreciable 495,884,577 80,448,719 576,333,296 Less accumulated depreciation {3 I 0,980,450) (13,928,188) (324,908,638)
Capital assets, net 210 047 325 75 236 403 285 283 728
Total noncurrent assets 218 643 876 71347614 289 991490
Total Assets 330 249 296 105 984 023 436 233 319
DEFERRED OUTFLOWS OF RESOURCES
Related to pension (Note 13) 42,069,405 2,718,894 44,788,299 Related to OPEB (Note 14) 557 626 557 626
Total Deferred Outflows of Resources 42 627 031 2 718 894 45 345 925
LIABILITIES
Current liabilities: Accounts payable and accruals: 7,204,711 953,697 8,158,408 Interest payable 242,658 41,448 284,106 Other liabilities 66,369 66,369 Unearned revenue (Note 8) 2,783,022 2,783,022 Compensated absences • Due within one year (Note 7) 639,193 47,210 686,403 Claims and judgments payable - Due within one year (Note 11) 1,170,645 1,170,645 Long- term debt - Due within one year (Note 6) 3 654 !60 1990 316 5 644 476
Total current liabilities 15 760 758 3 032 671 18 793 429
N oncurrent liabilities: Deposits 51,595 51,595 Compensated absences payable - Due in more than one year (Note 7) 3,037,274 477,351 3,514,625 Claims and judgments payable - Due in more than one year (Note 11) 5,427,699 5,427,699 Net pension liability (Note 13) 162,773,276 13,830,332 176,603,608 Net OPEB liability (Note 14) 4,591,354 4,591,354 Long- term debt - Due in more than one year (Note 6) 37 240 400 38 373 780 75 614 180
Total noncurrent liabilities 213 070 003 52 733 058 265 803 061
Total Liabilities 228 830 761 55 765 729 284 596 490
DEFERRED INFLOWS OF RESOURCES
Related to pension (Note 13) 6 725 266 102 179 6 827 445
NET POSITION (Note 9)
Net investment in capital assets 181 178 754 34 872 307 216 051 061 Restricted for:
Capital projects 23,037,079 23,037,079 Debt service 1,113,947 1,113,947 Engineering and transportation 10,546,209 10,546,209 Recreation and culture 763,324 763,324 Community Development 4,572,972 4,572,972 Public Safety I 070 501 1 070 501
Total restricted 41 104 032 41104 032
Unrestricted (84,962,486) 17962702 (66,999,784)
Total Net Position $ 137 320 300 $ 52 835 009 $ 190 155 309
See Accompanying Notes to Basic Financial Statements
23

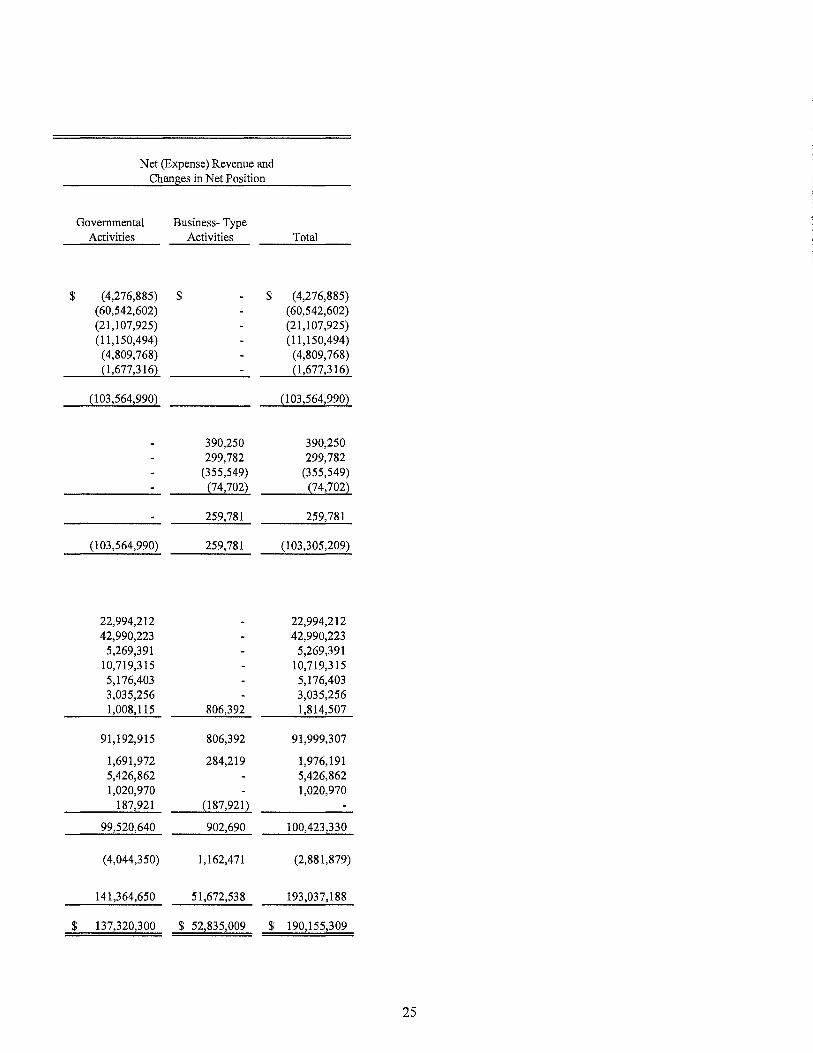
City of San Leandro Statement of Activities and Changes in Net Position
For the year ended June 30, 2018
Program Revenues
Functions/Programs
Primary government: Governmental Activities:
General government Public safety Engineering and transportation Recreation and culture Community development Interest on long-term debt
Total Governmental Activities
Business-type activities: Water Pollution Control Plant Shoreline Storm Water Utility Environmental Services
Total business-type Activities
Total primary government
Expenses
$ 13,658,584 64,971,782 32,933,260 14,756,277 10,216,834
1,677,316
138,214,053
12,184,473 1,786,193 1,412,257 1,095,232
16,478,155
$154,692,208
$
$
Charges for Services
8,508,558 3,828,340
991,464 1,501,391 3,845,202
18,674,955
12,574,723 2,012,934 1,056,708
724,484
16,368,849
35,043,804
Operating Grants and
Contributions
$ 600,840
3,809,279 607,242
1,561,864
6,579,225
$ 6,579,225
General revenues: Taxes:
Property taxes Sales tax Franchise fees Utility users tax Property transfer tax 911 communication access tax Other taxes
Total Taxes
Investment earnings Miscellaneous Gain on sale of assets Transfers
Total general revenues
Change in net position
Capital Grants and
Contributions
$ 873,141
7,024,592 1,497,150
9,394,883
73,041
296,046
369,087
$ 9,763,970
Total
$ 9,381,699 4,429,180
11,825,335 3,605,783 5,407,066
34,649,063
12,574,723 2,085,975 1,056,708 1,020,530
16,737,936
$ 51,386,999
Net position - Beginning of year, restated (Note 9E)
Net position - End of year
See Accompanying Notes to Basic Financial Statements
24
$
Net (Expense) Revenue and Changes in Net Position
Governmental Activities
(4,276,885) (60,542,602) (21,107,925) (11,150,494)
(4,809,768) {1,677,3162
(103,564,9902
(103,564,990)
22,994,212 42,990,223
5,269,391 10,719,315 5,176,403 3,035,256 1,008,115
91,192,915
1,691,972 5,426,862 1,020,970
187,921
99,520,640
(4,044,350)
141,364,650
Business- Type Activities
$
390,250 299,782
(355,549) (74,7022
259,781
259,781
806,392
806,392
284,219
(187,9212
902,690
1,162,471
51,672,538
$
$ 137,320,300 $ 52,835,009 $
Total
(4,276,885) (60,542,602) (21,107,925) (11,150,494)
(4,809,768) (1,677,3162
(103,564,9902
390,250 299,782
(355,549) (74,7022
259,781
(103,305,209)
22,994,212 42,990,223
5,269,391 10,719,315 5,176,403 3,035,256 1,814,507
91,999,307
1,976,191 5,426,862 1,020,970
100,423,330
(2,881,879)
193,037,188
190,155,309
25


FUND FINANCIAL STATEMENTS
Governmental Fund Financial Statements Proprietary Fund Financial Statements Fiduciary Fund Financial Statements


GOVERNMENTAL FUND FINANCIAL STATEMENTS
The General Fund - Accounts for all general revenues of the City not specifically levied or collected for other City funds and the related expenditures. The General Fund accounts for all financial resources of a governmental unit which are not accounted for in other funds.
Capital Improvement Projects Capital Projects Fund - This fund accounts monies for major capital improvement projects not provided for in the other capital improvement projects fund.
29
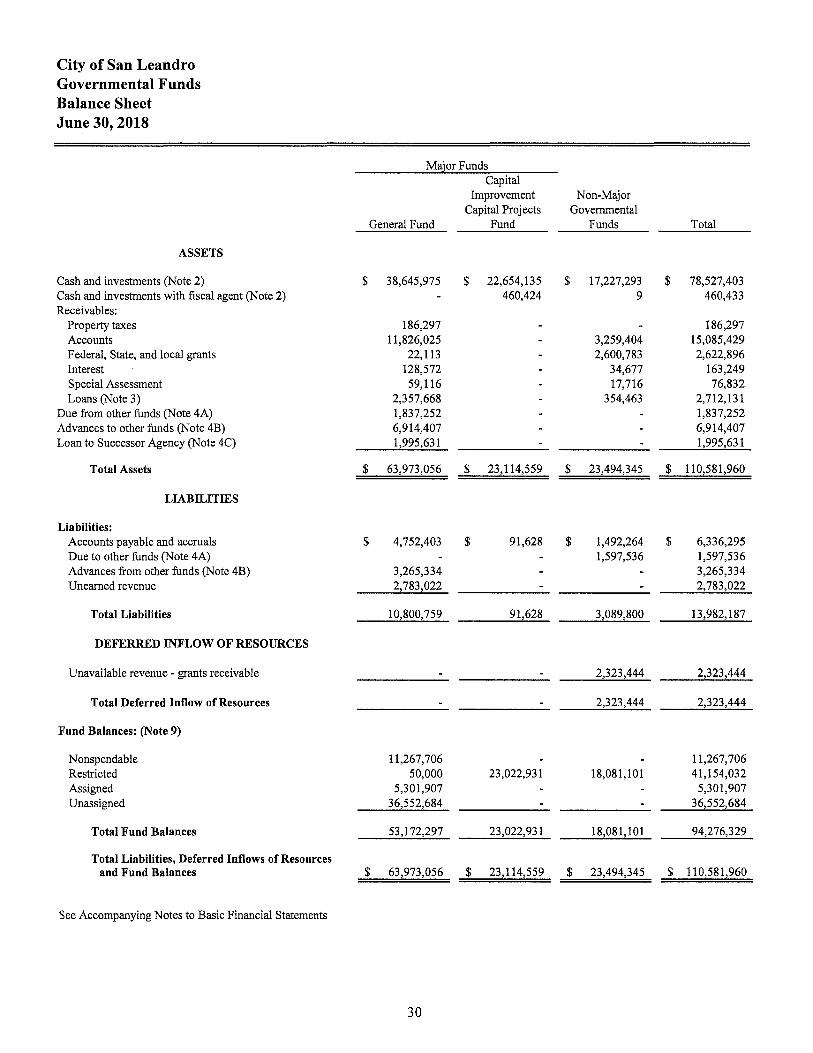
City of San Leandro Governmental Funds Balance Sheet June 30, 2018
Major Funds Capital
Improvement Non-Major Capital Projects Governmental
General Fund Fund Funds Total
ASSETS
Cash and investments (Note 2) $ 38,645,975 $ 22,654,135 $ 17,227,293 $ 78,527,403 Cash and investments with fiscal agent (Note 2) 460,424 9 460,433 Receivables:
Property taxes 186,297 186,297 Accounts 11,826,025 3,259,404 15,085,429 Federal, State, and local grants 22,113 2,600,783 2,622,896 Interest 128,572 34,677 163,249 Special Assessment 59,116 17,716 76,832 Loans (Note 3) 2,357,668 354,463 2,712,131
Due from other funds (Note 4A) 1,837,252 1,837,252 Advances to other funds (Note 4B) 6,914,407 6,914,407 Loan to Successor Agency (Note 4C) 1,995,631 1,995,631
Total Assets $ 63,973,056 $ 23,114,559 $ 23,494,345 $ 110,581,960
LIABILITIES
Liabilities: Accounts payable and accruals $ 4,752,403 $ 91,628 $ 1,492,264 $ 6,336,295 Due to other funds (Note 4A) 1,597,536 1,597,536 Advances from other funds (Note 4B) 3,265,334 3,265,334 Unearned revenue 2,783,022 2,783,022
Total Liabilities 10,800,759 91,628 3,089,800 13,982,187
DEFERRED INFLOW OF RESOURCES
Unavailable revenue - grants receivable 2,323,444 2,323,444
Total Deferred Inflow of Resources 2,323,444 2,323,444
Fund Balances: (Note 9)
Nonspendable 11,267,706 11,267,706 Restricted 50,000 23,022,931 18,081,101 41,154,032 Assigned 5,301,907 5,301,907 Unassigned 36,552,684 36,552,684
Total Fund Balances 53,172,297 23,022,931 18,081,101 94,276,329
Total Liabilities, Deferred Inflows of Resources and Fund Balances $ 63,973,056 $ 23,114,559 $ 23,494,345 $ 110,581,960
See Accompanying Notes to Basic Financial Statements
30

City of San Leandro Reconciliation of the Governmental Funds Balance Sheet
with the Statement of Net Position June 30, 2018
Total fund balances reported on the governmental funds balance sheet
Amounts reported for Governmental Activities in the Statement of Net Position are different from those reported in the Governmental Funds above because of the following:
CAPITAL ASSETS Capital assets used in Governmental Activities are not current assets or financial resources and therefore are not reported in the Governmental Funds.
ALLOCATION OF INTERNAL SERVICE FUND NET POSITION Internal service funds are not governmental funds. However, they are used by management to charge the costs of certain activities, such as insurance and central services and maintenance to individual governmental funds. The net current assets of the Internal Service Funds are therefore included in Governmental Statement of Activities.
LONG-TERM ASSETS AND LIABILITIES The assets and liabilities below are not due and payable in the current period and therefore are not reported in the Funds:
Net OPEB liability, related deferred outflows and inflows of resources Net pension liability, related deferred outflows and inflows ofresources Long-term debt Interest payable Compensated absences Recognition of grants revenue
NET POSITION OF GOVERNMENTAL ACTIVITIES
See Accompanying Notes to Basic Financial Statements
31
$
$
94,276,329
205,039,213
11,790,556
(4,033,728) (127,429,137)
(40,894,560) (242,658)
(3,509,159) 2,323,444
137,320,300

City of San Leandro Statement of Revenues, Expenditures and Changes in Fund Balances Governmental Funds
For the year ended June 30, 2018
Major Fund Capital
Improvement Capital Projects
General Fund
REVENUES
Property and other taxes $ 91,065,635 $ Licenses and permits 9,582,916 Fines and forfeitures 1,688,351 Service charges 3,207,368 234,982 Intergovernmental 1,210,883 Use of money and property 1,638,505 629 Interdepartmental charges 1,999,878 Other 1,195,732 4,331,576
Total Revenues 111,589,268 4,567,187
EXPENDITURES
Current: General Government 11,658,959 Public safety 59,427,666 Engineering and transportation 9,475,575 6,147,340 Recreation and culture 10,534,497 166,989 Community development 5,698,625 1,326,702
Debt service: Principal 1,569,330 Interest and fees 808,323
Total Expenditures 99,172,975 7,641,031
REVENUES OVER (UNDER) EXPENDITURES 12,416,293 (3,073,844)
OTHER FINANCING SOURCES (USES) Transfers in (Note 4D) 10,056,989 Transfers (out) (Note 4D) (10,205,889)
Total Other Financing Sources (Uses) (10,205,889) 10,056,989
NET CHANGE IN FUND BALANCES 2,210,404 6,983,145
FUND BALANCES
Beginning of year 50,961,893 16,039,786
End of year $ 53,172,297 $ 23,022,931
See Accompanying Notes to Basic Financial Statements
32
Non-Major Governmental
Funds Total
$ 582,877 $ 91,648,512 1,143,599 10,726,515
1,688,351 348,635 3,790,985
11,632,219 12,843,102 2,506,767 4,145,901
1,999,878 1,611,230 7,138,538
17,825,327 133,981,782
20,113 11,679,072 606,697 60,034,363
10,025,858 25,648,773 1,196,835 11,898,321 1,218,729 8,244,056
1,637,000 3,206,330 935,759 1,744,082
15,640,991 122,454,997
2,184,336 11,526,785
288,889 10,345,878 (10,205,889)
288,889 139,989
2,473,225 11,666,774
15,607,876 82,609,555
$ 18,081,101 $ 94,276,329

City of San Leandro Reconciliation of the Net Change in Fund Balances - Total Government Funds with
the Statement of Activities For the year ended June 30, 2018
The schedule below reconciles the Net Changes in Fund Balances reported on the Governmental Funds Statement of Revenues, Expenditures and Changes in Fund Balance, which measures only changes in current assets and current liabilities on the modified accrual basis, with the Change in Net Position of Governmental Activities reported in the Statement of Activities, which is prepared on the full accrual basis.
NET CHANGE lN FUND BALANCES - TOTAL GOVERNMENTAL FUNDS
Amounts reported for governmental activities in the Statement of Activities are different because of the following:
CAPITAL ASSET TRANSACTIONS
Governmental Funds report capital outlays as expenditures. However, in the Statement of Activities the cost of those assets is capitalized and allocated over their estimated useful lives and reported as depreciation expense.
Capital expenditures are therefore added back to fund balance Loss on disposal of capital assets is deducted from fund balance Depreciation expense is deducted from the fund balance. The amount excludes the depreciation of$791,321,
which is reported in the Internal Service Funds.
ACCRUAL OF NON-CURRENT ITEMS
The amounts below included in the Statement of Activities do not provide or (require) the use of current financial resources and therefore are not reported as revenue or expenditures in governmental funds (net change):
Unearned revenue Long-term debt Bond discount Bond premium Interest payable Compensated absences Net pension liabilities, related deferred outflows and inflows of resources Net OPEB liabilities, related deferred outflows and inflows of resources
ALLOCATION OF lNTERNAL SERVICE FUND ACTMTY
Internal Service Funds are used by management to charge the costs of certain activities, 'such as equipment acquisition, maintenance, and insurance to individual funds. The portion of the net revenue (expense) of these Internal Service Funds arising out of their transactions with governmental funds is reported with governmental activities, because they service those activities.
Change in Net Position - All Internal Service Funds
CHANGE IN NET POSITION OF GOVERNMENTAL ACTIVITIES
See Accompanying Notes to Basic Financial Statements
33
$ 11,666,774
7,930,476 (867,050)
(15,968,046)
(517,222) 3,206,330
(10,119) 183,741 (38,668) 172,344
(13,306,047) 1,136,479
2,366,658
$ (4,044,350)

PROPRIETARY FUND FINANCIAL STATEMENTS
Water Pollution Control Plant - This fund accounts for the City's sewers which protect public health and preserve water quality through the collection, treatment and disposal of the community's wastewater and wastewater solids.
Shoreline - The City operates various recreational facilities which include golf and marina berthing as well as providing food service facilities for the general public in an area connected to the San Francisco Bay.
Internal Service Funds - These funds are used to account for special activities and services performed by a designated City department for other departments on a cost reimbursement basis.
35

City of San Leandro Statement of Net Position Proprietary Funds June 30, 2018
Major Ent~rise Funds Governmental Water Non-Major Activities-
Pollution Enterprise Internal Service Control Plant Shoreline Funds Total Funds
ASSETS
Current Assets: Cash and investments (Note 2) $ 28,241,643 $ 2,856,480 $ 1,473,399 $ 32,571,522 $ 14,250,749 Receivables:
Accounts 1,340,074 484,966 163,479 1,988,519 385 Interest 66,224 6,979 3,165 76,368 30,944
Inventory 200,803
Total current assets 29,647,941 3,348,425 1,640,043 34,636,409 14,482,881
Noncurrent assets: Advance to other fund (Note 4B) 3,265,334 3,265,334 Capital assets (Note 5)
Non-Depreciable 5,138,062 3,577,810 8,715,872 Depreciable 74,650,004 5,778,252 20,463 80,448,719 16,666,113 Less accumulated depreciation {10,382,421} {3,545,116} {651} {13,928,188} {ll,658,001}
Total capital assets, net 69,405,645 5,810,946 19,812 75,236,403 5,008,ll2
Total noncurrent assets 72,670,979 5,810,946 19,812 78,501,737 5,008,ll2
Total Assets 102,318,920 9,159,371 1,659,855 ll3,138,146 19,490,993
DEFERRED OUTFLOWS OF RESOURCES
Related to pension (Note 13) 2,718,894 2,718,894
LIABILITIES
Current Liabilities: Accounts payable 905,379 22,132 26,186 953,697 868,416 Interest payable 41,448 41,448 Due to other funds (Note 4A) 239,716 239,716 Other liabilities 66,369 Clams and judgments - due in I year (Note 11) 1,170,645 Compensated absences - due in I year (Note 7) 24,567 6,736 15,907 47,210 15,058 Notes payable - due in I year (Note 6) 1,742,522 247,794 1,990,316
Total current liabilities 2,672,468 318,ll0 281,809 3,272,387 2,120,488
Non-current Liabilities: Deposits payable 3,000 48,595 51,595 Advances from other funds (Note 4B) 6,914,407 6,914,407 Claims and judgments - due in more than I year (Note 11) 5,427,699 Compensated absences - due in more than I year (Note 7) 248,401 68,109 160,841 477,351 152,250 Net pension liability (Note 13) 13,830,332 13,830,332 Long-term debt - due in more than I year (Note 6) 37,616,782 756,998 38,373,780
Total noncurrent liabilities 51,698,515 7,788,109 160,841 59,647,465 5,579,949
Total liabilities 54,370,983 8,106,219 442,650 62,919,852 7,700,437
DEFERRED INFLOWS OF RESOURCES
Related to pension (Note 13) 102,179 102,179
NET POSITION (Note 9)
Net investment in capital asset 30,046,341 4,806,154 19,812 34,872,307 5,008,ll2 Unrestricted 20,518,311 {3,753,002} 1,197,393 17,962,702 6,782,444
Total Net Position $ 50,564,652 $ 1,053,152 $ 1,217,205 $ 52,835,009 $ ll,790,556
See Accompanying Notes to Basic Financial Statements
36

City of San Leandro Statement of Revenues, Expenses, and Changes in Fund Net Position Proprietary Funds For the year ended June 30, 2018
Major Ente!]2rise Funds Water Non-Major
Pollution Enterprise Control Plant Shoreline Funds
OPERA TING REVENUES: Charges for services $ 11,890,380 $ 424,465 $ 1,414,292 Licenses and permits 104,523 18,664 354,339 Rents and concessions 1,569,585 Other operating revenues 579,820 220 12,561
Total Operating Revenues 12,574,723 2,012,934 1,781,192
OPERATING EXPENSES: Salaries and benefits 5,025,363 569,950 1,412,865 Contractual and other services 1,540,240 332,620 340,304 Materials and supplies 906,224 25,205 66,891 Depreciation 1,487,507 113,889 86 Other operating costs 2,157,640 331,416 687,343
Total Operating Expenses 11,116,974 1,373,080 2,507,489
OPERATING INCOME (LOSS) 1,457,749 639,854 {726,297}
NONOPERATING REVENUES (EXPENSES): Property and other taxes 806,392 Intergovernmental 73,041 296,046 Investment income 260,364 16,845 7,010 Interest expense {1,067,499} {413,113}
Total Nonoperating Revenues (Expenses) {807,135) 483,165 303,056
INCOME BEFORE TRANSFERS 650,614 1,123,019 {423,241}
TRANSFERS: Transfers in (Note 4D) 132,782 Transfers out (Note 4D) {153,714} {166,989)
Total operating transfers {153,714} {166,989) 132,782
Change in net position 496,900 956,030 (290,459)
NET POSITION: Net Position-Beginning of year 50,067,752 97,122 1,507,664
Net Position-Ending of year $ 50,564,652 $ 1,053,152 $ 1,217,205
See Accompanying Notes to Basic Financial Statements
37
Governmental Activities-
Internal Service Total Funds
$ 13,729,137 $ 16,750,712 477,526
1,569,585 592,601 284,568
16,368,849 17,035,280
7,008,178 3,475,039 2,213,164 7,693,977
998,320 855,158 1,601,482 867,515 3,176,399 1,925,687
14,997,543 14,817,376
1,371,306 2,217,904
806,392 369,087 284,219 105,434
{1,480,612} {4,612}
{20,914) 100,822
1,350,392 2,318,726
132,782 47,932 {320,703)
{187,921) 47,932
1,162,471 2,366,658
51,672,538 9,423,898
$ 52,835,009 $ 11,790,556

Citv of San Leandro Statement of Cash Flows
Proprietary Funds
For the year ended June 30, 2018
Major Ente!Erise Funds Governmental Water Non-Major Activities-
Pollution Enterprise Internal Service Control Plant Shoreline Funds Total Funds
CASH FLOWS FROM OPERATING ACTIVITIES: Cash received from customers $ 12,763,144 $ 1,875,724 $ 1,689,232 $ 16,328,100 $ 583,011 Cash received from other funds 239,716 239,716 Receipts from interfund charges 16,786,172 Cash payments to suppliers and service providers (5,917,354) (690,773) (1,124,622) (7,732,749) (9,448,861) Cash payments to employees for services {5,134, 7222 {603,6102 {1,372,0582 {7,110,3902 {3,387,2522
Net cash provided (used) by operating activities 1,711,068 581,341 (567,7322 1,724,677 4,533,070
CASH FLOWS FROM NONCAPITAL FINANCING ACTIVITIES:
Property and other taxes received 806,392 806,392 Intergovernmental revenue received 73,041 296,046 369,087 Interfund loan 490,109 (191,985) 298,124 Transfers in from other funds 132,782 132,782 47,932 Transfer out to other funds {153,7142 {166,9892 {320,7032
Net cash provided (used) by noncapital financing activities 336,395 520,459 428,828 1,285,682 47,932
CASH FLOWS FROM CAPITAL AND RELATED FINANCING ACTIVITIES:
Principal paid on capital debt (1,698,365) (235,120) (1,933,485) (240,353) Acquisition of capital assets (3,484,193) 2 (3,484,191) (2,184,461) Interest payments on bonds and notes payable {1,067,4992 {422,8942 {1,490,3932
Net cash provided (used) by capital and related financing activities {6,250,0572 {658,0122 (6,908,0692 {2,424,8142
CASH FLOWS FROM INVESTING ACTIVITIES: Change in market values of investments (137,216) (14,296) (6,549) (158,061) (63,847) Interest income (expense) 372,953 27,396 12,221 412,570 151,277
Net cash provided (used) by investing activities 235,737 13,100 5,672 254,509 87,430
Net increase (decrease) in cash and cash equivalents {3,966,8572 456,888 {133,2322 {3,643,2012 2,243,618
CASH AND CASH EQUIVALENTS:
Cash and investments at beginning of year 32,208,500 2,399,592 1,606,631 36,214,723 12,007,131
Cash and investments at end of year $ 28,241,643 $ 2,856,480 $ 1,473,399 $ 32,571,522 $ 14,250,749
RECONCILIATION OF OPERATING INCOME/ (LOSS) TO NET CASH PROVIDED BY OPERATING ACTIVITIES:
Operating income (loss) $ 1,457,749 $ 639,854 $ (726,297) $ 1,371,306 $ 2,217,904 Adjustments to reconcile operating income to
net cash provided by operating activities: Depreciation 1,487,507 113,889 86 1,601,482 867,515 Change in assets and liabilities:
(Increase) decrease in accounts receivable 188,421 (129,219) (91,960) (32,758) 298,443 (Increase) decrease in inventories 54,465 (Decrease) increase in accounts payable 594,042 (1,532) (30,084) 562,426 457,681 (Decrease) increase in other liabilities 66,369 (Decrease) increase due to other funds 239,716 239,716 (Decrease) increase in deposits payable (7,991) (7,991) (Decrease) increase claims and judgments payable (2,138,000) (2,138,000) 549,275 (Decrease) increase in compensated absences (109,359) (33,660) 40,807 (102,212) 21,418 (Decrease) increase in deferred outflow 53,536 53,536 (Decrease) increase in deferred inflow (82,930) (82,930) (Decrease) increase in net pension liability 260,102 260,102
Total adjustments 253,319 {58,5132 158,565 353,371 2,315,166
Net cash provided (used) by operating activities $ 1,711,068 $ 581,341 $ {567,7322 $ 1,724,677 $ 4,533,070
See Accompanying Notes to Basic Financial Statements
38

FIDUCIARY FUND FINANCIAL STATEMENTS
Agency Funds are custodial in nature ( assets equal liabilities) and do not involve measurement of results of operations. They are used to account for assets held in an agency capacity for others and therefore cannot be used to support the City's programs.
Private Purpose Trust Funds are fiduciary fund types used to report all trust arrangements, other than those properly reported in pension trust funds or investment trust funds, under which principal and income benefit individuals, private organizations, or other governments.
OPEB Trust Fund is used to account for assets held in an irrevocable trust and related activities. This trust is administered by Public Agency Retirement Services (PARS) for the purpose of funding postemployment health care benefits provided by the City.
39
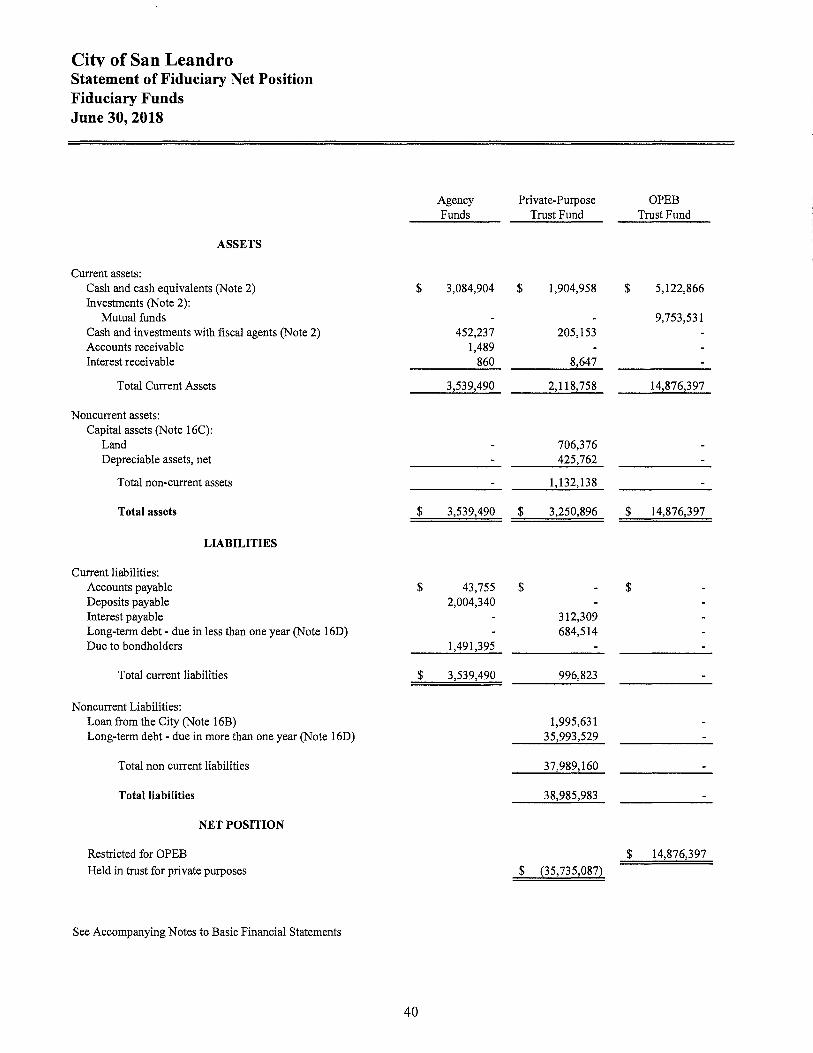
City of San Leandro Statement of Fiduciary Net Position Fiduciary Funds June 30, 2018
ASSETS
Current assets: Cash and cash equivalents (Note 2) Investments (Note 2):
Mutual funds Cash and investments with fiscal agents (Note 2) Accounts receivable Interest receivable
Total Current Assets
Noncurrent assets: Capital assets (Note 16C):
Land Depreciable assets, net
Total non-current assets
Total assets
LIABILITIES
Current liabilities: Accounts payable Deposits payable Interest payable Long-term debt - due in less than one year (Note 16D) Due to bondholders
Total current liabilities
Noncurrent Liabilities: Loan from the City (Note 16B) Long-term debt- due in more than one year (Note 16D)
Total non current liabilities
Total liabilities
NET POSITION
Restricted for OPEB
Held in trust for private purposes
See Accompanying Notes to Basic Financial Statements
$
$
$
$
40
Agency Private-Purpose OPEB Funds Trust Fund Trust Fund
3,084,904 $ 1,904,958 $ 5,122,866
9,753,531 452,237 205,153
1,489 860 8,647
3,539,490 2,118,758 14,876,397
706,376 425,762
1,132,138
3,539,490 $ 3,250,896 $ 14,876,397
43,755 $ $ 2,004,340
312,309 684,514
1,491,395
3,539,490 996,823
1,995,631 35,993,529
37,989,160
38,985,983
$ 14,876,397
$ {35,735,087)

City of San Leandro Statement of Changes in Fiduciary Net Position For the year ended June 30, 2018
Additions:
Property taxes Use of money and property Investment earnings:
Investment earnings
Contributions to OPEB Trust-Employer Other revenue
Total additions
Deductions:
Community development Depreciation Debt service interest and fiscal agent fees
Total deductions
Change in net position
NET POSITION HELD IN TRUST
Net position - beginning
Net position - end
See Accompanying Notes to Basic Financial Statements
41
Successor Agency to the Redevelopment
Agency Private-Purpose OPEB
Trust Fund Trust Fund
$ 4,461,568 $ 60,861
528,900
750,000 490,965
5,013,394 1,278,900
5,516,430 14,237
2,195,939 67,811
7,726,606 67,811
(2,713,212) 1,211,089
{33,021,875) 13,665,308
$ {35,735,087) $ 14,876,397


City of San Leandro Index to Notes to Basic Financial Statements For the year ended June 30, 2018
NOTE 1- SIGNIFICANT ACCOUNTING POLICIES ...................................................................... 45
A. Financial Reporting Entity ........................................................................................................ 45 B. Government-Wide Financial Statements .................................................................................. 45 C. Measurement Focus, Basis of Accounting, and Financial Statement Presentation .................. 46 D. Recognition of Interest Liability .............................................................................................. 47 E. Use of Restricted and Unrestricted Net Position ..................................................................... .48 F. Cash, Cash Equivalents and Investments .................................................................................. 48 G. Inventory .................................................................................................................................. 48 H. Capital Assets ........................................................................................................................... 49 I. Long-Term Debt ........................................................................................................................ 49 J. Compensated Absences ............................................................................................................. 50 K. Property Taxes .......................................................................................................................... 50 L. Deferred Inflows/Outflows of Resources .................................................................................. 5 0 M. Use of Estimates ...................................................................................................................... 50 N. Fair Value Measurements .......................................................................................................... 51 0. Implementation of New Governmental Accounting Standards Board
(GASB) Pronouncements ....................................................................................................... 51
NOTE 2 - CASH AND INVESTMENTS ............................................................................................... 52
A. Cash Deposits ............................................................................................................................ 52 B. Investments ............................................................................................................................... 53
NOTE 3 - LOANS RECEIVABLE ........................................................................................................ 57
NOTE 4 - INTERFUND TRANSACTIONS ......................................................................................... 58
A. Fund Financial Statements Interfund Receivables and Payables .......................................... 58 B. Fund Financial Statements -Long-Term Advances ................................................................ 58 C. Fund Financial Statements - Loan to Successor Agency ......................................................... 59 D. Fund Financial Statements - Transfers .................................................................................... 59 E. Fund Financial Statements - Internal Balances ........................................................................ 60
NOTE 5-CAPITAL ASSETS ................................................................................................................ 60
A. Government-Wide Financial Statements ................................................................................... 60 B. Funds Financial Statements ...................................................................................................... 62
NOTE 6- LONG-TERM DEBT .............................................................................................................. 63
A. Governmental Activities Long-Term Debt .............................................................................. 63 B. Long-Term Debt of Business-Type and Proprietary Funds ...................................................... 67 C. Debt Covenants and Restrictions .............................................................................................. 68
NOTE 7 - COMPENSATED ABSENCES ............................................................................................. 68
NOTE 8 - UNEARNED REVENUE ....................................................................................................... 69
A. Government-Wide Financial Statements .................................................................................. 69
43
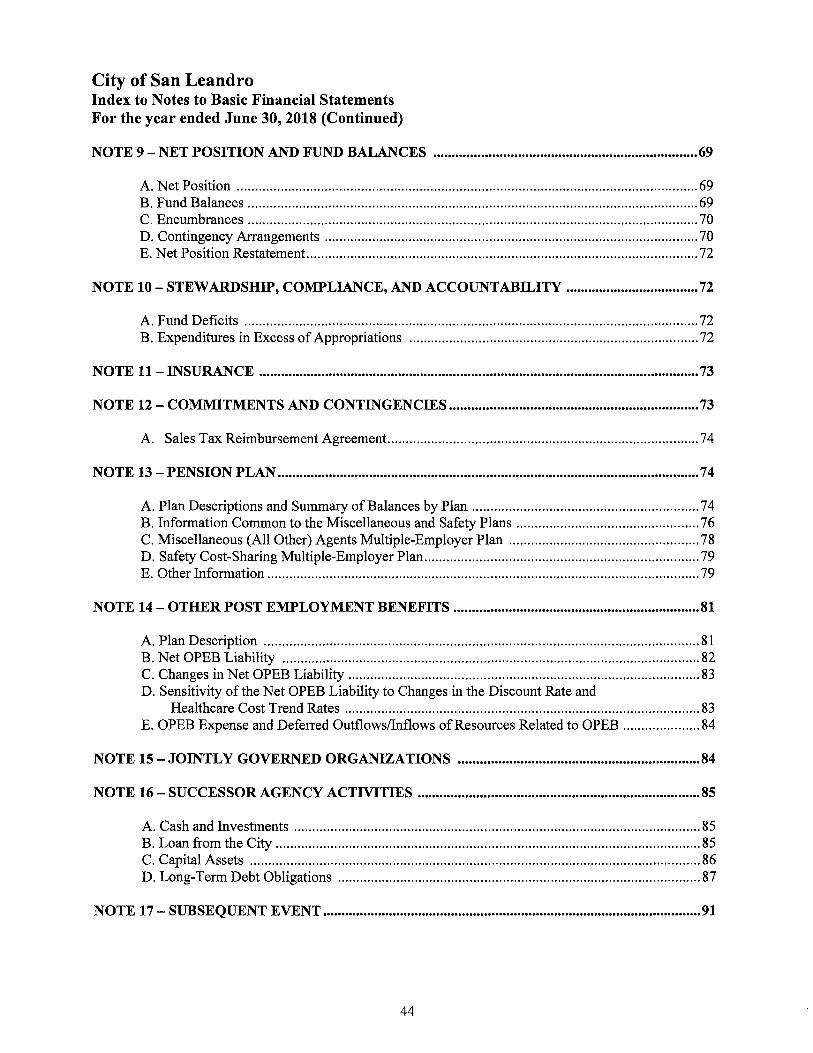
City of San Leandro Index to Notes to Basic Financial Statements For the year ended June 30, 2018 (Continued)
NOTE 9 - NET POSITION AND FUND BALANCES ........................................................................ 69
A. Net Position .............................................................................................................................. 69 B. Fund Balances ........................................................................................................................... 69 C. Encumbrances ........................................................................................................................... 70 D. Contingency Arrangements ...................................................................................................... 70 E. Net Position Restatement ........................................................................................................... 72
NOTE 10 - STEWARDSHIP, COMPLIANCE, AND ACCOUNTABILITY .................................... 72
A. Fund Deficits ............................................................................................................................ 72 B. Expenditures in Excess of Appropriations ............................................................................... 72
NOTE 11- INSURANCE ........................................................................................................................ 73
NOTE 12 - COMMITMENTS AND CONTINGENCIES .................................................................... 73
A. Sales Tax Reimbursement Agreement. .................................................................................... 74
NOTE 13-PENSION PLAN ................................................................................................................... 74
A. Plan Descriptions and Summary of Balances by Plan .............................................................. 74 B. Information Common to the Miscellaneous and Safety Plans .................................................. 76 C. Miscellaneous (All Other) Agents Multiple-Employer Plan .................................................... 78 D. Safety Cost-Sharing Multiple-Employer Plan ........................................................................... 79 E. Other Information ...................................................................................................................... 79
NOTE 14 - OTHER POST EMPLOYMENT BENEFITS ................................................................... 81
A. Plan Description ....................................................................................................................... 81 B. Net OPEB Liability .................................................................................................................. 82 C. Changes in Net OPEB Liability ................................................................................................ 83 D. Sensitivity of the Net OPEB Liability to Changes in the Discount Rate and
Healthcare Cost Trend Rates ................................................................................................. 83 E. OPEB Expense and Deferred Outflows/Inflows of Resources Related to OPEB ..................... 84
NOTE 15 - JOINTLY GOVERNED ORGANIZATIONS .................................................................. 84
NOTE 16 - SUCCESSOR AGENCY ACTIVITIES ............................................................................. 85
A. Cash and Investments ............................................................................................................... 85 B. Loan from the City .................................................................................................................... 85 C. Capital Assets ........................................................................................................................... 86 D. Long-Term Debt Obligations ................................................................................................... 87
NOTE 17-SUBSEQUENT EVENT ....................................................................................................... 91
44

CITY OF SAN LEANDRO NOTES TO BASIC FINANCIAL STATEMENTS
For The Year Ended June 30, 2018
I NOTE 1- SIGNIFICANT ACCOUNTING POLICIES
The basic financial statements of the City of San Leandro, California, (City) have been prepared in conformity with generally accepted accounting principles (GAAP) as applied to governmental agencies in the United States. The Governmental Accounting Standards Boards (GASB) is the accepted standard setting body for establishing governmental accounting and financial reporting principles. The more significant of the City's accounting policies are described below.
A. Financial Reporting Entity
The City of San Leandro, California (City) was incorporated in 1872 and is situated between the cities of Oakland and Hayward in the East Bay of the San Francisco Bay Area. The City operates under the Mayor-Council-Manager form of government created by charter in 1978 and provides the following services: public safety (police, fire, disaster preparedness and hazardous waste disposal), highways and streets, sanitation, health services, public improvements, planning and zoning and general administration services.
The City is governed by a seven-member council elected by City residents. The City is legally separate and fiscally independent, which means it can issue debt, set and modify budgets and fees and sue or be sued. As required by generally accepted accounting principles, the financial statements include the financial activities of the City- the primary government - and its component units.
Component units are legally separate organizations for which the elected officials of the primary government are financially accountable. In addition, component units can be other organizations for which the primary government's exclusion would cause the reporting entity's financial statements to be misleading or incomplete.
The component units below are included in the City's basic financial statements using the blended method since the governing body of these component units are substantially the same as the governing body of the City and these component units provide services entirely to the City.
The City of San Leandro Parking Authority (Parking Authority) was established to issue debt for downtown parking structures and lots. There are no financial activities to be accounted for in the Parking Authority Debt Service Fund in this fiscal year.
The San Leandro Public Financing Authority (Financing Authority) was established to issue debt for the Seismic Retrofitting capital project and other community related financing programs. The financial activities are accounted for in the San Leandro Public Financing Authority Debt Service Fund in the accompanying basic financial statements.
B. Government-Wide Financial Statements
The government-wide financial statements (i.e., the statement of net position and the statement of activities) report information on all of the non-fiduciary activities of the primary government and its components units. For the most part, the effect of interfund activity has been removed from these statements except in the case of interfund services provided and used, which are not eliminated in the consolidation process. Governmental activities, which normally are supported by taxes and intergovernmental revenues, are reported separately from business-type activities, which rely to a significant extent on fees and charges for support. Likewise, the primary government is reported separately from certain legally separate component units for which the primary government is financially accountable.
45
CITY OF SAN LEANDRO NOTES TO BASIC FINANCIAL STATEMENTS
For The Year Ended June 30, 2018
I NOTE 1 - SIGNIFICANT ACCOUNTING POLICIES (Continued)
The statement of activities demonstrates the degree to which the direct expenses of a given function or segments are offset by program revenues. Direct expenses are those that are clearly identifiable with a specific function or segment. Our policy is to allocate indirect costs to a specific function or segment. Program revenues include 1) charges to customers or applicants who purchase, use, or directly benefit from goods, services, or privileges provided by a given function or segment and 2) grants and contributions that are restricted to meeting the operational or capital requirements or a particular function or segment. Taxes and other items not properly included among program revenues are reported instead as general revenues.
Separate fund financial statements are provided for governmental funds, proprietary funds, and fiduciary funds, even though the latter are excluded from the government-wide financial statements. Major individual governmental funds and major individual enterprise funds are reported as separate columns in the fund financial statements.
C. Measurement Focus, Basis of Accounting, and Financial Statement Presentation
The government-wide financial statements are reported using the economic resources measurement focus and the accrual basis of accounting, as are the proprietary fund and fiduciary fund financial statements. Revenues are recorded when earned and expenses are recorded when a liability is incurred, regardless of the timing of related cash flows. Property taxes are recognized as revenues in the year for which they are levied. Grants and similar items are recognized as revenue as soon as all eligibility requirements imposed by the provider have been met.
Governmental fund financial statements are reported using the current financial resources measurement focus and the modified accrual basis of accounting. Revenues are recognized as soon as they are both measurable and available. Revenues are considered to be available when they are collectible within the current period or soon enough thereafter to pay liabilities of the current period. For this purpose, the City considers revenues to be available if they are collected within 30 days of the end of the current fiscal period. The City considers sales taxes and property taxes as available if they are collected within 60 days after year end. Expenditures generally are recorded when a liability is incurred, as under accrual accounting. However, debt service expenditures, as well as expenditures related to compensated absences and claims and judgments, are recorded only when payment is due.
Sales taxes, property taxes, licenses, and interest associated within the current period are all considered to be susceptible to accrual and so have been recognized as revenues of the current fiscal period. Only the portion of special assessment receivable due within the current fiscal period is considered to be susceptible to accrual as revenue of the current period. All other revenue items are considered to be measurable and available only when cash is received by the City.
The City reports the following major governmental funds:
The General Fund is the government's primary operating fund. It accounts for all financial resources of the general government, except those required to be accounted for in another fund.
Capital Improvement Projects Capital Projects Fund accounts monies for major capital improvements projects not provided for in the other capital projects fund.
46

CITY OF SAN LEANDRO NOTES TO BASIC FINANCIAL STATEMENTS
For The Year Ended June 30, 2018
I NOTE 1 - SIGNIFICANT ACCOUNTING POLICIES (Continued)
The Reconciliation of the Fund Financial Statements to the Government-Wide Financial Statements is provided to explain the differences created by the integrated approach of GASB Statement No. 34.
The City also reports the following major proprietary funds:
Water Pollution Control Plant Fund accounts for the City's sewers which protect public health and preserve water quality.
Shoreline Fund accounts for various recreational facilities which include golf and marina berthing as well as providing food service facilities for the general public in an area connected to the San Francisco Bay.
A separate column representing internal service funds is also presented in these statements. However, internal service balances and activities have been combined with the governmental activities in the government-wide financial statements. The City's Internal Service Funds account for Building Maintenance, Information Management Systems, Self-Insurance and Equipment Maintenance which provides service to other departments of the City on a cost reimbursement basis.
Proprietary funds are accounted for using the "economic resources" measurement focus and the accrual basis of accounting. Accordingly, all assets and liabilities (whether current or noncurrent) are included on the Statement of Net Position. The Statement of Revenues, Expenses and Changes in Net Position presents increases (revenues) and decreases (expenses) in total Net Position. Under the accrual basis of accounting, revenues are recognized in the period in which they are earned while expenses are recognized in the period in which the liability is incurred.
Operating revenues in the proprietary funds are those revenues that are generated from the primary operations of the fund. All other revenues are reported as non-operating revenues. Operating expenses are those expenses that are essential to the primary operations of the fund. All other expenses are reported as non-operating expenses.
The Fiduciary fund financial statements normally include a Statement of Net Position and a Statement of Changes in Fiduciary Net Position. The City's fiduciary funds represent a private purpose trust fund, an OPEB Trust Fund and agency funds. Agency funds are custodial in nature (assets equal liabilities) and do not involve measurement of results of operations. The City's Fiduciary Funds includes the Deposits Fund which accounts for all deposits held on behalf of other persons and businesses and the Cherrywood Fund accounts for monies accumulated for payments of special assessment bonds.
D. Recognition of Interest Liability
In the government-wide financial statements, interest payable of long-term debt is recognized as the liability is incurred for governmental fund types as wells as proprietary fund types.
In the fund financial statements, the Governmental fund types do not recognize the interest payable when the liability is incurred. Interest on long-term debt is recorded in the fund statement when payment is made. Proprietary fund types recognize the interest payable when the liability is incurred.
47

CITY OF SAN LEANDRO NOTES TO BASIC FINANCIAL STATEMENTS
For The Year Ended June 30, 2018
I NOTE 1 - SIGNIFICANT ACCOUNTING POLICIES (Continued)
E. Use of Restricted and Unrestricted Net Position
When an expense is incurred for purposes for which both restricted and unrestricted net positions are available, the City's policy is to apply restricted net position first.
F. Cash, Cash Equivalents and Investments
The City pools cash and investments from all sources, except the fiscal agent cash and investments, for the purpose of increasing income through investment activities. Interest income on investments is allocated on the basis of average month-end cash and investment balances in each fund. Cash and cash equivalents represent cash and investments and restricted cash and investments with an original maturity term of three months or less. Pooled cash and investments allocated to proprietary fund types are considered cash and cash equivalents since specific investments held in the City's pooled cash and investments are not allocated to each fund.
The City invests in the California Local Agency Investment Fund ("LAIF"), which is part of the Pooled Money Investment Account operated by the California State Treasurer. LAIF funds are invested in high quality money market securities and are managed to insure the safety of the portfolio. A portion of LAIF's investments are in structured notes and asset-backed securities.
In accordance with GASB Statement No. 31, highly liquid money market investments with maturities of one year or less at time of purchase are stated at amortized cost.
G. Inventory
Inventory is held for consumption and is valued at average cost. Internal service fund supplies consist of materials and supplies for the various City vehicles (tires, batteries, etc.) and building maintenance, which are used for replacement parts for vehicle service and to maintain City buildings. Information management service inventory consists of postage for department use and a monthly count is performed to adjust this account to actual at the appropriate month-end.
48

CITY OF SAN LEANDRO NOTES TO BASIC FINANCIAL STATEMENTS
For The Year Ended June 30, 2018
I NOTE 1 - SIGNIFICANT ACCOUNTING POLICIES (Continued)
H. Capital Assets
Contributed capital assets are valued at their estimated fair market value on the date contributed. Donated capital assets, donated works of art and similar items, and capital assets received in a service concession arrangement are recorded at acquisition value. All other capital assets are valued at historical cost or estimated historical cost if actual historical cost is not available. City policy has set the capitalization threshold for reporting capital assets at $7,500. Depreciation is recorded on a straight-line basis over estimated useful lives of the assets as follows:
Buildings Improvements other than buildings Machinery and equipment Licensed Vehicles Infrastructure
50 years 20 years 5-15 years 3-15 years 20-50 years
The City defines infrastructure as the basic physical assets that allow the City to function. The assets include streets, sewer, and park lands. Each major infrastructure system can be divided into subsystems. For example the street system can be subdivided into pavement, curb and gutters, sidewalks, medians, streetlights, landscaping and land. These subsystems were not delineated in the basic financial statements. The appropriate operating department maintains information regarding the subsystems.
Interest accrued during capital assets construction, if any, is capitalized for the business-type and proprietary funds as part of the asset cost.
For all infrastructure systems, the City elected to use the Basic Approach as defined by GASB Statement No. 34 for infrastructure reporting. Original costs were developed in one of three ways: (1) historical records; (2) standard unit costs appropriate for the construction/acquisition date; or (3) present cost indexed by a reciprocal factor of the price increase from the construction/acquisition date to the current date. The accumulated depreciation, defined as the total depreciation from the date of construction/acquisition to the current date on a straight line, un-recovered cost method was computed using industry accepted life expectancies for each infrastructure subsystem. The book value was then computed by deducting the accumulated depreciation from the original cost.
L Long-Term Debt
In Government-Wide Financial Statements, long-term debt and other financed obligations are reported as liabilities in the appropriate activities.
Bond premiums and discounts are deferred and amortized over the life of the bonds using the effective interest method. Bonds Payable are reported net of the applicable premium or discount.
In Fund Financial Statements long-term debt is not presented but is instead shown in the Reconciliation of the Governmental Funds Balance Sheet to the Government-Wide Statement of Net Position.
49
CITY OF SAN LEANDRO NOTES TO BASIC FINANCIAL STATEMENTS
For The Year Ended June 30, 2018
I NOTE 1 - SIGNIFICANT ACCOUNTING POLICIES (Continued)
J. Compensated Absences
Vested vacation, sick leave, compensatory time, and related benefits are accrued as appropriate. For governmental funds, compensated absence obligations are recorded in the appropriate governmental funds when due. The portion not currently due is recorded in the government-wide financial statements. For enterprise funds, compensated absences are expensed when earned by employees. At year-end, the accrued but unpaid compensated absence obligations are recorded as current and non-current liabilities in the appropriate enterprise funds.
K. Property Taxes
Property taxes are placed on lien on January 1st for the following fiscal year. Taxes are payable in two installments, due on November 1 and February 1, becoming delinquent on December 10 (for November) and April 10 (for February), respectively. The Alameda County Tax Collector bills and collects property taxes and allocates a portion to the City as billed. Property tax revenues are recognized in the fiscal year, for which the taxes have been levied, provided they become available. In January 1994, the City elected to continue collection of interest and penalties on delinquent taxes and recognizes these revenues when available. Available means when due or past due and collected within the current period, or expected to be collected soon thereafter, and to be used to pay liabilities of the current period.
L. Deferred Inflows/Outflows of Resources
In addition to assets, the statement of financial position or balance sheets reports a separate section for deferred outflows ofresources. This separate financial statement element, deferred outflows of resources, represents a consumption of net position or fund balance that applies to a future period( s) and so will not be recognized as an outflow of resources (expense/expenditure) until then.
In addition to liabilities, the statement of financial position or balance sheet reports a separate section for deferred inflows of resources. This separate financial statement element, deferred inflows of resources, represents an acquisition of net position or fund balance that applies to a future period( s) and so will not be recognized as an inflow of resources (revenue) until that time.
M. Use of Estimates
The preparation of financial statements in conformity with generally accepted accounting principles requires City management to make estimates and assumptions that affect certain amounts and disclosures. Accordingly, actual results could differ from those estimates.
50

CITY OF SAN LEANDRO NOTES TO BASIC FINANCIAL STATEMENTS
For The Year Ended June 30, 2018
I NOTE 1 - SIGNIFICANT ACCOUNTING POLICIES (Continued)
N. Fair Value Measurements
Fair value is defined as the price that would be received to sell an asset or paid to transfer a liability in an orderly transaction between market participants at the measurement date. The City categorizes its fair value measurements within the fair value hierarchy established by generally accepted accounting principles. The fair value hierarchy categorizes the inputs to valuation techniques used to measure fair value into three levels based on the extent to which inputs used in measuring fair value are observable in the market.
Level 1 inputs are quoted prices (unadjusted) in active markets for identical assets or liabilities.
Level 2 inputs are inputs - other than quoted prices included within level 1 that are observable for an asset or liability, either directly or indirectly.
Level 3 inputs are unobservable inputs for an asset or liability.
If the fair value of an asset or liability is measured using inputs from more than one level of the fair value hierarchy, the measurement is considered to be based on the lowest priority level input that is significant to the entire measurement.
0. Implementation of New Governmental Accounting Standards Board (GASB) Pronouncements
Management adopted the provisions of the following Governmental Accounting Standards Board (GASB) Statements which became effective during the year ended June 30, 2018.
GASB Statement No. 75 - In June 2015, GASB issued Statement No. 75, Accounting and Financial Reporting for Postemployment Benefits Other Than Pensions. Statement 75 establishes new accounting and financial reporting requirements for governments whose employees are provided with OPEB, as well as for certain nonemployer governments that have a legal obligation to provide financial support for OPEB provided to the employees of other entities. The provisions in statement 75 are effective for fiscal years beginning after June 15, 2017. The City implemented this statement in current year. See additional information in Notes 9E and 14.
GASB Statement No. 81 - In March 2016, the GASB issued Statement No. 81, Irrevocable Split-Interest Agreements. The objective of this Statement is to improve accounting and financial reporting for irrevocable split-interest agreements by providing recognition and measurement guidance for situations in which a government is a beneficiary of the agreement. This Statement requires that a government that receives resources pursuant to an irrevocable split-interest agreement recognize assets, liabilities, and deferred inflows of resources at the inception of the agreement. Furthermore, this Statement requires that a government recognize assets representing its beneficial interests in irrevocable split-interest agreements that are administered by a third party, if the government controls the present service capacity of the beneficial interests. This Statement requires that a government recognize revenue when the resources become applicable to the reporting period. The requirements of this Statement are effective for financial statements for periods beginning after December 15, 2016 and should be applied retroactively. This statement had no impact on the City's financial statements.
51

CITY OF SAN LEANDRO NOTES TO BASIC FINANCIAL STATEMENTS
For The Year Ended June 30, 2018
I NOTE 1 - SIGNIFICANT ACCOUNTING POLICIES (Continued)
GASB Statement No. 85 - In March 2017, the GASB issued Statement No. 85, Omnibus 2017. The objective of this Statement is to address practice issues that have been identified during implementation and application of certain GASB Statements. This Statement addresses a variety of topics including issues related to blending component units, goodwill, fair value measurement and application, and postemployment benefits (pensions and other postemployment benefits [OPEB]). The requirements of this Statement are effective for reporting periods beginning after June 15. 2017. The City implemented this statement in current year. See additional information in Note 14.
GASB Statement No. 86-In May 2017, the GASB issued Statement No. 86, Certain Debt Extinguishment Issues. The primary objective of this Statement is to improve consistency in accounting and financial reporting for in-substance defeasance of debt by providing guidance for transactions in which cash and other monetary assets acquired with only existing resources-resources other than the proceeds of refunding debt-are placed in an irrevocable trust for the sole purpose of extinguishing debt. This Statement also improves accounting and financial reporting for prepaid insurance on debt that is extinguished and notes to the financial statements for debt that is defeased in substance. The requirements of this Statement are effective for reporting periods beginning after June 15, 2017. This statement had no impact on the City's financial statements.
I NOTE 2 - CASH AND INVESTMENTS
The City maintains a cash and investment pool, which includes cash balances and authorized investments of all funds, which the Finance Director invests to enhance interest earnings. The pooled interest earned is allocated to the funds based on average daily cash and investment balance in these funds.
A. Cash Deposits
The carrying amount of the City's cash deposits is $4,012,260 at June 30, 2018. Bank balances before reconciling items were $4,901,047, at that date, the total amount of which was insured or collateralized with securities held by the pledging financial institutions in the City's name as discussed below.
The California Government Code requires California banks and savings and loan associations to secure the City's cash deposits by pledging securities as collateral. This Code states that collateral pledged in this manner shall have the effect of perfecting a security interest in such collateral superior to those of a general creditor. Thus, collateral for cash deposits is considered to be held in the City's name.
The fair value of pledged securities must equal at least 110% of the City's cash deposits. California law also allows institutions to secure City deposits by pledging first trust deed mortgage notes having a value of 150% of the City's total cash deposits. The City may waive collateral requirements for cash deposits, which are fully insured up to $250,000 by the Federal Deposit Insurance Corporation. The City, however, has not waived the collateralization requirements.
The City follows the practice of pooling cash and investments of all funds, except for funds required to be held by fiscal agents under the provisions of bond indentures. Interest income earned on pooled cash and investments is allocated on an accounting period basis to the various funds based on the period-end cash and investment balances. Interest income from cash and investments with fiscal agents is credited directly to the related fund.
52

CITY OF SAN LEANDRO NOTES TO BASIC FINANCIAL STATEMENTS
For The Year Ended June 30, 2018
I NOTE 2 - CASH AND INVESTMENTS (Continued)
B. Investments
Under the provisions of the City's investment policy, and in accordance with California Government Code, the City's Cash and investments as of June 30, 2018, are classified as follows:
Statement of net position:
Cash and investments
Cash and investments held by trustee
Fiduciary Funds:
Cash and investments
Cash and investments with fiscal agents
Total cash and investments
Cash and investments as ofJune 30, 2018, are classified as follows:
Interest Rate Risk
Deposits with financial institutions
fuvestments
Total cash and investments
$ 125,349,674
460,433
19,866,259
657,390
$ 146,333,756
$ 4,097,224
142,236,532
$ 146,333,756
Interest rate risk is the risk that changes in market interest rates will adversely affect the fair value of an investment. Generally, the longer the maturity of an investment, there is a greater sensitivity of its fair value to changes in market interest rates. One of the ways that the City manages its exposure to interest rate risk is by purchasing a combination of shorter term and longer-term investments and by timing cash flow from maturities so that a portion of the portfolio is maturing or coming close to maturity evenly over time as necessary to provide cash flow and liquidity needed for operations.
In accordance with the Policy, the City manages its exposure to declines in fair values by limiting the weighted average maturity of its investment portfolio to 5 years or less. The City is in compliance with this provision of the Policy.
Information about the sensitivity of the fair values of the City's Investments to market interest rate fluctuations is provided by the following table that shows the distribution of the City's investment by maturity:
12Months or Investment Type Fair Value Less 13 to 24 Months 25 to 60 Months
Federal Agency Securities $ 18,225,360 $ 6,892,790 $ 7,079,175 $ 4,253,395 Money Market Fund 14,930,759 14,930,759 U.S. Treasury Notes 23,835,115 11,008,235 2,078,446 10,748,434 Local Agency Investment Fund (lAIF) 61,320,822 61,320,822 Medium-Term Notes 14,517,363 9,048,578 689,290 4,779,495 Asset Backed Securities 3,061,187 3,061,187 Supranationals 5,227,927 896,976 987,245 3,343,706 Held by fiscal agent:
U.S. Treasury Money Market Funds 1,117,999 1,117,999
Total $ 142,236,532 $ 105,216,159 $ 10,834,156 $ 26,186,217
53

CITY OF SAN LEANDRO NOTES TO BASIC FINANCIAL STATEMENTS
For The Year Ended June 30, 2018
I NOTE 2 - CASH AND INVESTMENTS (Continued) I Investments Authorized by the City's Investment Policy and California Government Code
The table below identifies the investment types that are authorized for the City by the City's Investment Policy. The table also identifies certain provisions of the California Government Code that address interest rate risk, credit risk, and concentration of credit risk. This table does not address investments of debt proceeds held by bond trustee that are governed by the provisions of the related bond documents.
Investment Tr:ee Maximum Maturitr Maximum Percentage of*Portfolio U.S. Treasury Obligations 5 years None U.S. Agency Securities 5 years None Bankers Acceptances 180 days 40% Commercial Paper 270 days 25% Negotiable Certificate ofDeposit 5 years 30% Repurchase Agreements 1 year 20% Reverse Repurchase Agreements 92 days 20% Medium -Term Notes 5 years 30% Mutual Funds NIA 20% Money Market Mutual Funds NIA 20% Local Agency Investment Fund (IAIF) NIA $65 million per account Passbook Accounts 5 years None City Issued Securities NIA None Supranational Securities 5 years 30% Asset Backed Securities 5 years 20% Mortgage Backed/Pass-Through Securities 5 years 20% Collateralized Mortgage Obligations Syears 20% Other investment pools NIA None
*excluding amounts held by bond trustee that are not subject to California Government Code restrictions.
Investments in Local Agency Investment Fund
The City invests in the Local Agency Investment Fund (LAIF), a State of California external investment pool.
The fair value is calculated by multiplying the account balance with LAIF times a fair value factor of 0.998126869 which is determined by LAIF. This fair value factor was determined by dividing all LAIF participants' total aggregate amortized cost by total aggregate fair value.
The City's investments with Local Agency Investment Funds (LAIF) at June 30, 2018, included a portion of the pool funds invested in Structured Notes and Asset-Backed Securities. These investments included the following:
• Structured Notes are debt securities (other than asset-backed securities) whose cash-flow characteristics (coupon rate, redemption amount, or stated maturity) depend on one or more indices and/or that have embedded forwards or options.
54
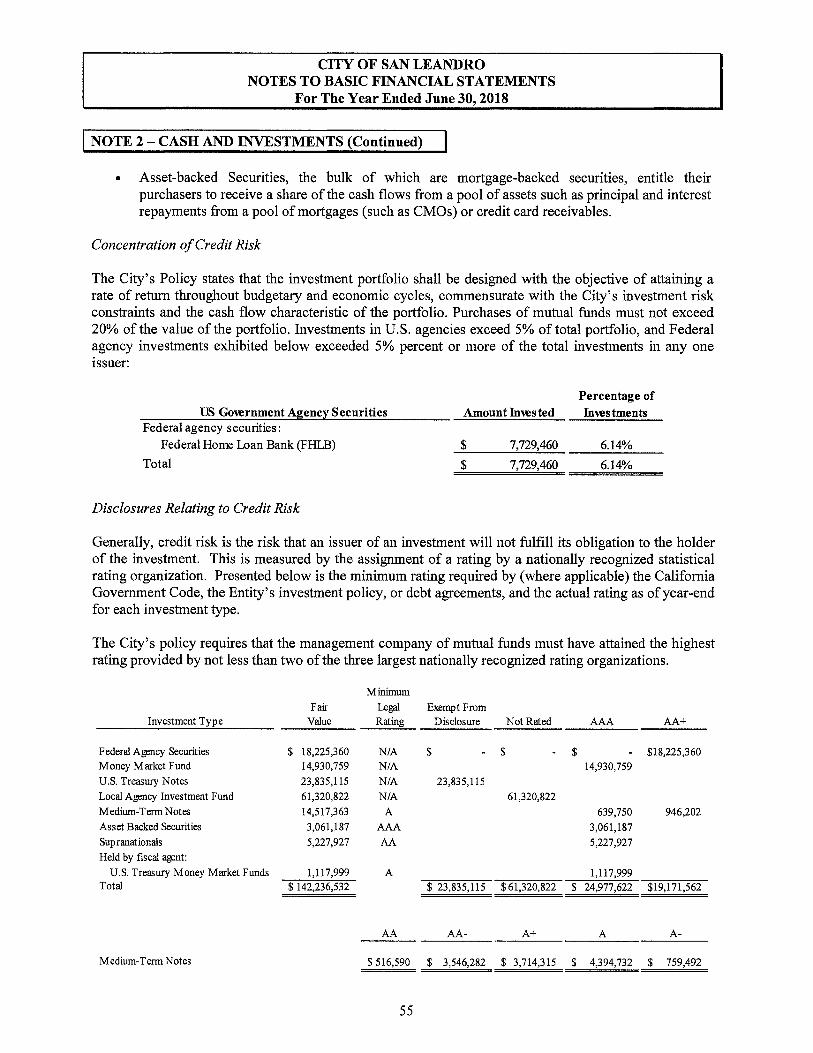
CITY OF SAN LEANDRO NOTES TO BASIC FINANCIAL STATEMENTS
For The Year Ended June 30, 2018
I NOTE 2 - CASH AND INVESTMENTS (Continued)
• Asset-backed Securities, the bulk of which are mortgage-backed securities, entitle their purchasers to receive a share of the cash flows from a pool of assets such as principal and interest repayments from a pool of mortgages (such as CMOs) or credit card receivables.
Concentration of Credit Risk
The City's Policy states that the investment portfolio shall be designed with the objective of attaining a rate of return throughout budgetary and economic cycles, commensurate with the City's investment risk constraints and the cash flow characteristic of the portfolio. Purchases of mutual funds must not exceed 20% of the value of the portfolio. Investments in U.S. agencies exceed 5% of total portfolio, and Federal agency investments exhibited below exceeded 5% percent or more of the total investments in any one issuer:
US Government Agency Securities Federal agency securities:
Federal Home Loan Bank (FI-ILB)
Total
Disclosures Relating to Credit Risk
Amount Invested
$ 7,729,460
$ 7,729,460
Percentage of Investments
6.14%
6.14%
Generally, credit risk is the risk that an issuer of an investment will not fulfill its obligation to the holder of the investment. This is measured by the assignment of a rating by a nationally recognized statistical rating organization. Presented below is the minimum rating required by (where applicable) the California Government Code, the Entity's investment policy, or debt agreements, and the actual rating as of year-end for each investment type.
The City's policy requires that the management company of mutual funds must have attained the highest rating provided by not less than two of the three largest nationally recognized rating organizations.
Minimum Fair Legal Exempt From
Investment Type Value Rating Disclosure Not Rated AAA AA+
Federal Agency Securities $ 18,225,360 NIA $ - $ - $ - $18,225,360 Money Market Fund 14,930,759 NIA 14,930,759 U.S. Treasury Notes 23,835,115 NIA 23,835,115
Local Agency Investment Fund 61,320,822 NIA 61,320,822
Medium-Term Notes 14,517,363 A 639,750 946,202
Asset Backed Securities 3,061,187 AAA 3,061,187
Supranationals 5,227,927 AA 5,227,927
Held by fiscal agent: U.S. Treasury Money Market Funds 1,117,999 A 1,117,999
Total $ 142,236,532 $ 23,835,115 $61,320,822 $ 24,977,622 $19,171,562
AA AA- A+ A A-
Medium-Term Notes $ 516,590 $ 3,546,282 $ 3,714,315 $ 4,394,732 $ 759,492
55

CITY OF SAN LEANDRO NOTES TO BASIC FINANCIAL STATEMENTS
For The Year Ended June 30, 2018
I NOTE 2 - CASH AND INVESTMENTS (Continued)
Fair Value Hierarchy
The City categorizes its fair value measurements within the fair value hierarchy established by generally accepted accounting principles. The hierarchy is based on the valuation inputs used to measure fair value of the assets. Level 1 inputs are quoted prices in an active market for identical assets; Level 2 inputs are significant other observable inputs; and Level 3 inputs are significant unobservable inputs.
The following is a summary of the fair value hierarchy of the fair value of investments of the City as of June 30, 2018:
Level 1 Level2 Total Investments By Fair Value Level:
Federal Agency Securities $ $ 18,225,360 $ 18,225,360 U.S. Treasury Notes 23,835,115 23,835,115 Medium-Term Notes 14,517,363 14,517,363 Asset Backed Securities 3,061,187 3,061,187 Supranationals 5,227,927 5,227,927
Total Investments $ 23,835,115 $ 41,031,837 64,866,952
Investments Exempt from Fair Value Hierarchy:
Local Agency Investment Fund (LAIF) 61,320,822
Investments Measured at Amortized Cost: Held by fiscal agent:
U.S. Treasury Money Market Funds 1,117,999 Money Market Fund 14,930,759
Total $ 142,236,532
U.S. Treasury Notes classified in Level 1 of the fair value hierarchy, are valued using quoted prices in active markets. Federal agency securities, medium term notes, and supranationals, classified in Level 2 of the fair value hierarchy, are valued using matrix pricing techniques maintained by various pricing vendors. Matrix pricing is used to value securities based on the securities' relationship to benchmark quoted prices. The California Local Agency Investment Fund (LAIF) is valued based on the fair value factor provided by the Treasurer of the State of California, which is calculated as fair value divided by the amortization cost of the investment pool and is exempt from the Fair Value hierarchy. Fair value is defined as the quoted market value on the last trading day of the period. These prices are obtained from various pricing sources by our custodian bank.
56

CITY OF SAN LEANDRO NOTES TO BASIC FINANCIAL STATEMENTS
For The Year Ended June 30, 2018
I NOTE 3 - LOANS RECEIVABLE
At June 30, 2018, the City had loans receivable in the following funds:
Governmental Funds:
General Fund Non Major Special Revenue Funds:
Affordable Housing Asset Special Revenue Fund Community Development Block Grant (CDBG) HOME Fund Housing In-Lieu
Less allowance for uncollectible loans
Total net loans receivable
$
$
2,357,668
7,344,052 306,395
3,335,000 637,000
(11,267,984)
2,712,131
At June 30, 2018, the City was owed, in the General Fund, $858,072 for a loan made by the City to the San Leandro Unified School District related to property acquisition. The loan is for purchase of a property in the City that will be used to directly support the educational and administrative function of the District. The loan is evidenced by a promissory note with a term of 15 years and is to be repaid in full on August 1, 2028. The interest rates range from 1.5% to a maximum of 5%.
At June 30, 2018, the City was owed, in the General Fund, $831,564 for a loan made by the City to Alameda County Industries Inc. (ACI). The loan is to refurbish ACI's Materials Recovery Facility in order to expand operations to take in more solid waste, recyclable, and green waste tonnage. The loan is evidenced by a promissory note with a term of 10 years and is to be repaid in full on July 1, 2025. The interest rate is 2.5% per annum.
At June 30, 2018, the City was owed, in the General Fund, $12,050 for loans made by the City to employees as part of the Employee Computer Purchase Loan Program. The loans are to assist regular full-time employees after completion of the one-year probationary period, "permanent" part-time employees as defined in the relevant MOU and City Council Members with the purchase of a home computer or laptop. The loans range from $500 to $3,000, are repaid over a 1 or 2 year period, and are interest free. Payments on the loans are handled as standard payroll deduction.
At June 30, 2018, the City was owed, in the General Fund, $260,139 for a loan made by the City to San Leandro Improvement Agency. The loan is to fund Downtown San Leandro capital improvements. The loan is evidenced by a promissory note with a term of 10 years. The interest rate is 3% per annum.
At June 30, 2018, the City was owed, in the General Fund, $395,843 for a loan made by the City to the Historic BAL Theatre. The loan is to promote the performing arts, music, and City's culture, which is vital to the public health and economic vitality of the City. The loan is evidenced by a promissory note with a term of 30 years. The interest rate is 3% per annum.
During fiscal year 2018, the City was owed, in its Low/Moderate Asset Housing Fund, $7,344,052 which includes (1) loans made to the City property owners who meet the HUD requirements for financial assistance for property improvements and first time home buyer loans; (2) a loan made to Ruth Rogers and Sara Bagwell; (3) a loan made to Eden Housing, Inc.; (4) a loan made to San Leandro Senior Housing; (5) a loan made to Citizens' Housing Corporation for property improvements; and (6) a loan made to Mercy Housing for the construction of the Casa Verde. The total loan receivable amount was reduced by an allowance for uncollectible loans in the amount of $6,989,589 leaving a balance of $354,463 as of June 30, 2018.
57

CITY OF SAN LEANDRO NOTES TO BASIC FINANCIAL STATEMENTS
For The Year Ended June 30, 2018
I NOTE 3 - LOANS RECEIVABLE (Continued)
At June 30, 2018, the City was owed, in its Community Development Block Grant Special Revenue Fund, $306,395 for various housing assistance loans made by the City. The terms ofrepayment vary. All of the loans receivable was reduced by allowance for uncollectible loans.
At June 30, 2018, the City was owed, in its HOME Special Revenue Fund, $3,335,000 which includes (1) two housing assistance loans made by the City to Citizens' Housing Corporation; (2) a loan made to Estabrook Senior Housing for construction of senior housing facility; (3) a loan made to Hello Housing for the rehabilitation of a single family home; ( 4) a housing assistance loan made to Allied Housing. The terms of repayment vary. All of the loans receivable were reduced by allowance for uncollectible loans.
At June 30, 2018, the City was owed, in its Housing In-Lieu Special Revenue Fund, $637,000 for a housing assistance loan made by the City to the Estabrook Senior Housing for low-moderate housing construction. The terms of repayment vary. The entire loan receivable was reduced by allowance for uncollectible loans.
I NOTE 4 - INTERFUND TRANSACTIONS
A. Inter/ und Receivables and Payables
At June 30, 2018, the City had the following short-term receivables and payables:
Receivable Fund
General Fund
Payable Fund
Non-Major Governmental Funds
Non-Major Enterprise Funds
Total
$
$
Amount
1,597,536
239,716
1,837,252
The City has recorded due to/due from all funds requiring cash at the end of June 30, 2018 to the funds that had deficit year-end balances which will be repaid back to the General Fund during the 2018-19 fiscal year.
B. Long-TermAdvances
Long-term advances to be repaid out of future earnings or charges at June 30, 2018, consisted of:
Receivable Fund Payable Fund Amount
General Fund Shoreline Enterprise Fund $ 6,914,407
Water Pollution Control Plant Enterprise Fund General Fund 3,265,334
Total $ 10,179,741
58
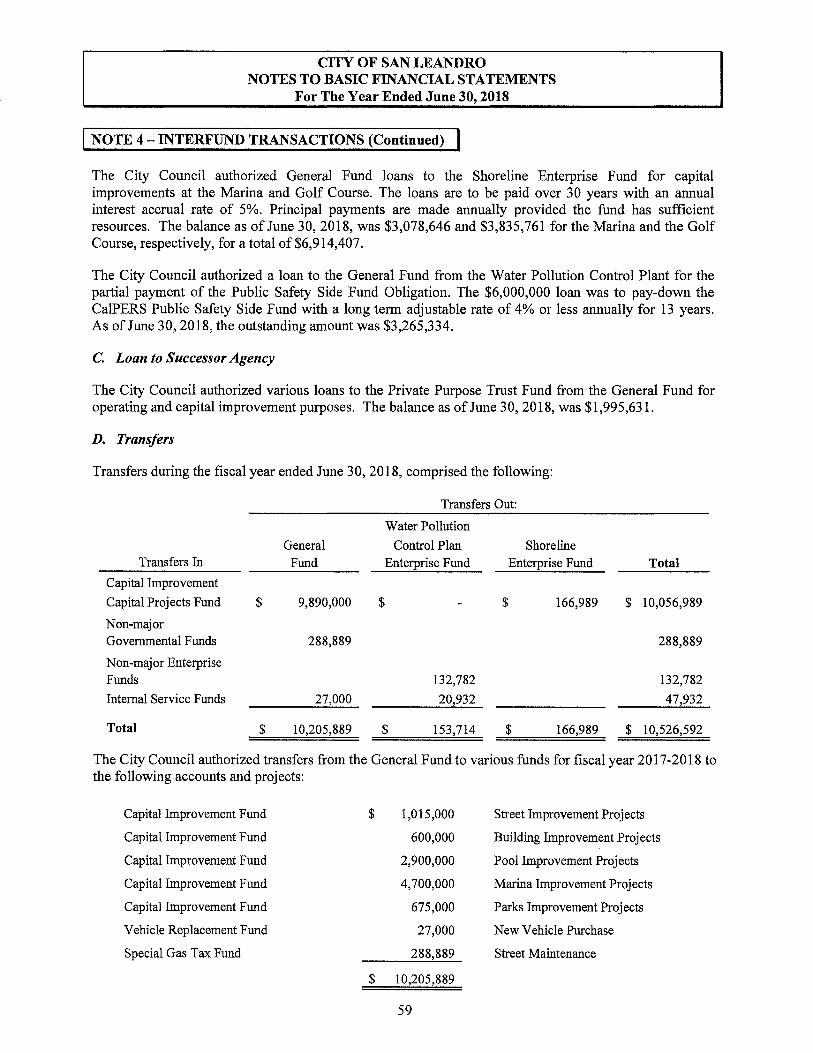
CITY OF SAN LEANDRO NOTES TO BASIC FINANCIAL STATEMENTS
For The Year Ended June 30, 2018
I NOTE 4 - INTERFUND TRANSACTIONS (Continued) I The City Council authorized General Fund loans to the Shoreline Enterprise Fund for capital improvements at the Marina and Golf Course. The loans are to be paid over 30 years with an annual interest accrual rate of 5%. Principal payments are made annually provided the fund has sufficient resources. The balance as of June 30, 2018, was $3,078,646 and $3,835,761 for the Marina and the Golf Course, respectively, for a total of $6,914,407.
The City Council authorized a loan to the General Fund from the Water Pollution Control Plant for the partial payment of the Public Safety Side Fund Obligation. The $6,000,000 loan was to pay-down the CalPERS Public Safety Side Fund with a long term adjustable rate of 4% or less annually for 13 years. As of June 30, 2018, the outstanding amount was $3,265,334.
C. Loan to Successor Agency
The City Council authorized various loans to the Private Purpose Trust Fund from the General Fund for operating and capital improvement purposes. The balance as of June 30, 2018, was $1,995,631.
D. Transfers
Transfers during the fiscal year ended June 30, 2018, comprised the following:
Transfers Out:
Water Pollution General Control Plan Shoreline
Transfers In Fund Enterprise Fund Enterprise Fund Total
Capital Improvement
Capital Projects Fund $ 9,890,000 $ $ 166,989 $ 10,056,989
Non-major Governmental Funds 288,889 288,889
Non-major Enterprise Funds 132,782 132,782
Internal Service Funds 27,000 20,932 47,932
Total $ 10,205,889 $ 153,714 $ 166,989 $ 10,526,592
The City Council authorized transfers from the General Fund to various funds for fiscal year 2017-2018 to the following accounts and projects:
Capital Improvement Fund $ 1,015,000 Street Improvement Projects
Capital Improvement Fund 600,000 Building Improvement Projects
Capital Improvement Fund 2,900,000 Pool Improvement Projects
Capital Improvement Fund 4,700,000 Marina Improvement Projects
Capital Improvement Fund 675,000 Parks Improvement Projects
Vehicle Replacement Fund 27,000 New Vehicle Purchase
Special Gas Tax Fund 288,889 Street Maintenance
$ 10,205,889
59
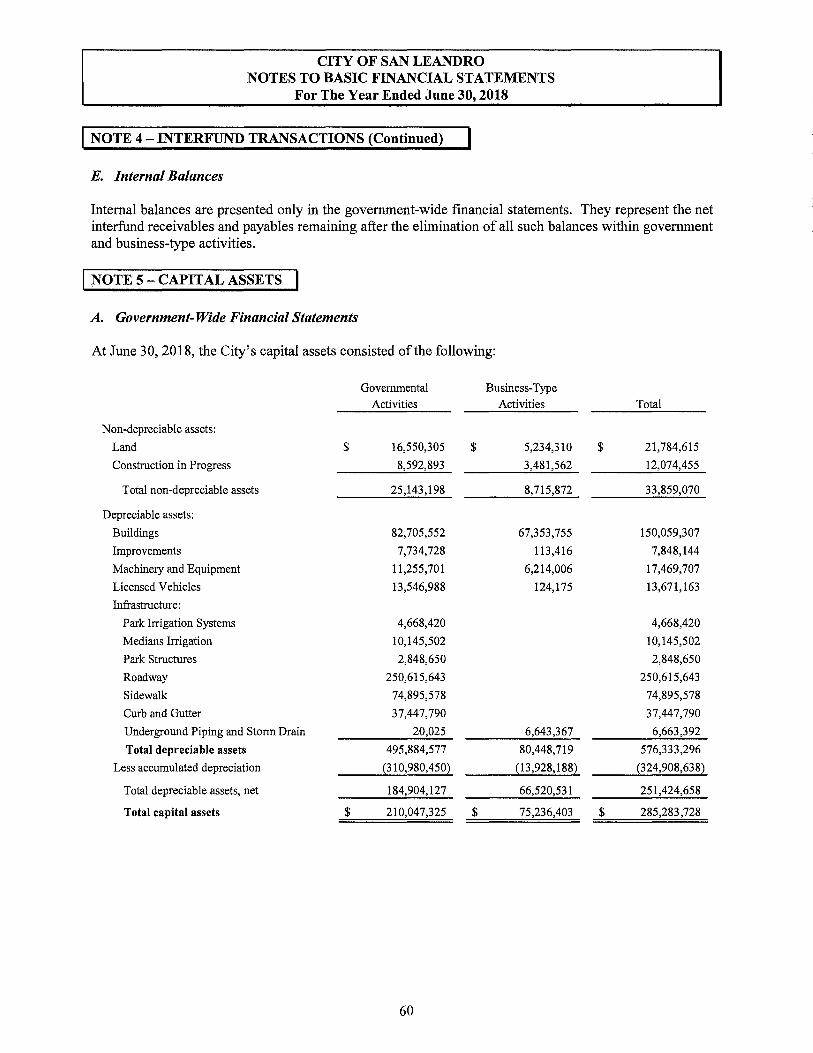
CITY OF SAN LEANDRO NOTES TO BASIC FINANCIAL STATEMENTS
For The Year Ended June 30, 2018
I NOTE 4 - INTERFUND TRANSACTIONS (Continued)
E. Internal Balances
Internal balances are presented only in the government-wide financial statements. They represent the net interfund receivables and payables remaining after the elimination of all such balances within government and business-type activities.
I NOTE 5 - CAPITAL ASSETS
A. Government-Wide Financial Statements
At June 30, 2018, the City's capital assets consisted of the following:
Governmental Business-Type
Activities Activities Total
Non-depreciable assets:
Land $ 16,550,305 $ 5,234,310 $ 21,784,615
Construction in Progress 8,592,893 3,481,562 12,074,455
Total non-depreciable assets 25,143,198 8,715,872 33,859,070
Depreciable assets:
Buildings 82,705,552 67,353,755 150,059,307
Improvements 7,734,728 113,416 7,848,144
Machinery and Equipment 11,255,701 6,214,006 17,469,707
Licensed Vehicles 13,546,988 124,175 13,671,163
Infrastructure:
Park Irrigation Systems 4,668,420 4,668,420
Medians Irrigation 10,145,502 10,145,502
Park Structures 2,848,650 2,848,650
Roadway 250,615,643 250,615,643
Sidewalk 74,895,578 74,895,578
Curb and Gutter 37,447,790 37,447,790
Underground Piping and Storm Drain 20,025 6,643,367 6,663,392
Total depreciable assets 495,884,577 80,448,719 576,333,296
Less accumulated depreciation (310,980,450) (13,928,188) (324,908,638)
Total depreciable assets, net 184,904,127 66,520,531 251,424,658
Total capital assets $ 210,047,325 $ 75,236,403 $ 285,283,728
60

CITY OF SAN LEANDRO NOTES TO BASIC FINANCIAL STATEMENTS
For The Year Ended June 30, 2018
I NOTE 5 - CAPITAL ASSETS (Continued)
The following is a summary of capital assets for governmental activities:
Balance Additions and Deletions and Balance
July 1, 2017 Transfers Transfers June 30, 2018
Non-Depreciable Assets: Land $ 16,648,489 $ 497,059 $ (595,243) $ 16,550,305
Construction in progress 1,315,680 7,277,213 8,592,893
Total Non-Depreciable Assets 17,964,169 7,774,272 (595,243) 25,143,198
Depreciable Assets:
Building.5 82,949,468 116,284 (360,200) 82,705,552
Improvements 7,734,728 7,734,728
Machinery and equipment 10,228,199 1,031,648 (4,146) 11,255,701
Licensed vehicles 13,111,909 1,214,940 (779,861) 13,546,988
Infrastructure 380,641,608 380,641,608
Total Depreciable Assets 494,665,912 2,362,872 (1,144,207) 495,884,577
Accumulated Depreciation:
Building.5 (25,233,346) (1,597,460) 88,392 (26,742,414)
Improvements (4,794,243) (202,792) (4,997,035)
Machinery and equipment (8,312,405) (501,212) 4,038 (8,809,579)
Licensed vehicles (8,588,161) (903,661) 757,763 (8,734,059)
Infrastructure (248,066,927) (13,630,436) (261,697,363)
Total Accumulated Depreciation (294,995,082) (16,835,561) 850,193 (310,980,450)
Depreciable Assets, Net 199,670,830 (14,472,689) (294,014) 184,904,127
Total Governmental Activities
Capital Assets, Net $ 217,634,999 $ (6,698,417) $ (889,257) $ 210,047,325
Governmental activities depreciation expenses for capital assets for the year ended June 30, 2018, are as follows:
General Government $ 319,361
Public Safety 479,041
Engineering and Transportation 13,253,478
Recreation and Human services 1,596,805
Community Development 319,361
Subtotal 15,968,046
Capital assets held by the City's Internal Service Funds 867,515
Total Depreciation Expense $ 16,835,561
61

CITY OF SAN LEANDRO NOTES TO BASIC FINANCIAL STATEMENTS
For The Year Ended June 30, 2018
I NOTE 5 - CAPITAL ASSETS (Continued)
The following is a summary of capital assets for business-type activities:
Balance Additions and Jull'. 1, 2017 Transfers
Non-Depreciable Assets: Land $ 5,234,310 $ Construction in progress 3,481,562
Total Non-Depreciable Assets 5,234,310 3,481,562
Depreciable Assets:
Buildings 67,353,755
Improvements 113,416
Machinery and equipment 6,214,006
Licensed vehicles 124,175
Infrastructure 6,640,738 2,629
Total Depreciable Assets 80,446,090 2,629
Accumulated Depreciation:
Buildings (7,616,454) (1,313,799)
Improvements (113,416)
Machinery and equipment (3,310,646) (155,306)
Licensed vehicles (88,397) (1,895)
Infrastructure (1,197,793) (130,482)
Total Accumulated Depreciation (12,326,706) (1,601,482)
Total Business-Type Activities
Capital Assets, Net $ 73,353,694 $ 1,882,709
B. Funds Financial Statements
Balance June 30, 2018
$ 5,234,310 3,481,562
8,715,872
67,353,755
113,416
6,214,006
124,175
6,643,367
80,448,719
(8,930,253)
(113,416)
(3,465,952)
(90,292)
(1,328,275)
(13,928,188)
$ 75,236,403
The Funds Financial Statements do not present General Government Capital Assets but are shown in the Reconciliation of the Governmental Funds Balance Sheet to the Government-Wide Statement of Net Position.
62
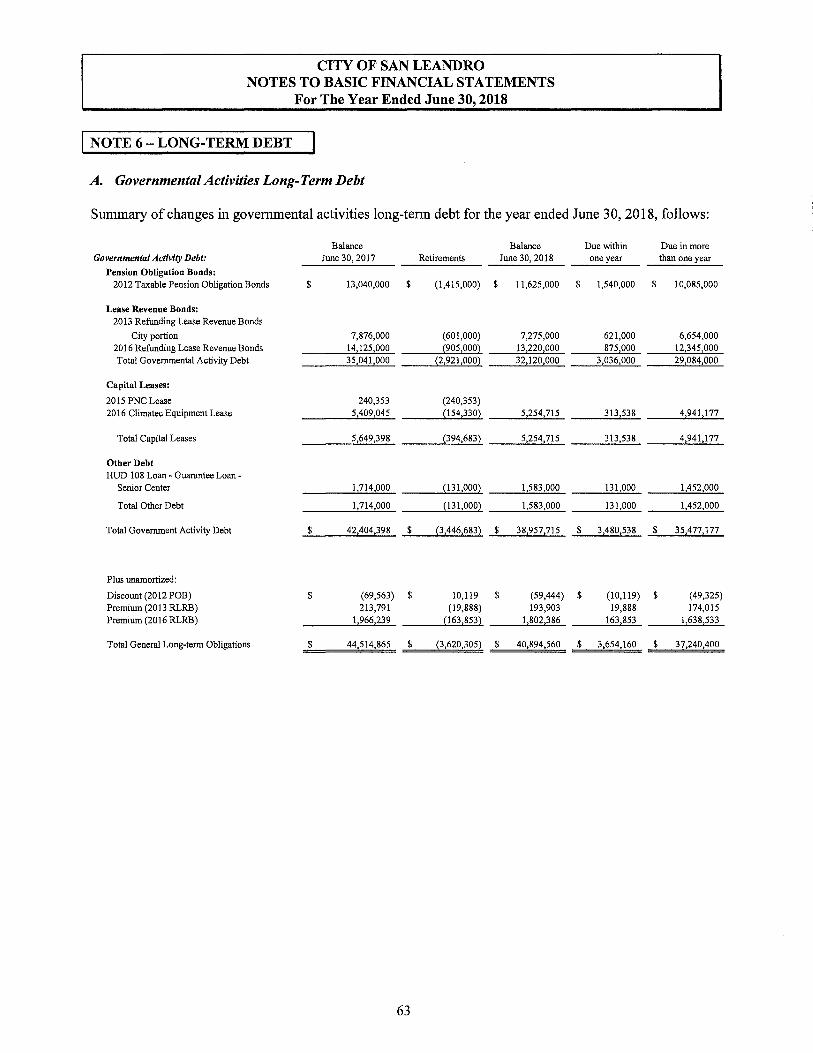
CITY OF SAN LEANDRO NOTES TO BASIC FINANCIAL STATEMENTS
For The Year Ended June 30, 2018
NOTE 6 - LONG-TERM DEBT
A. Governmental Activities Long-Term Debt
Summary of changes in governmental activities long-term debt for the year ended June 30, 2018, follows:
Balance Balance Due within Due in more Governmental Activity Debt: June 30, 2017 Retirements June 30, 2018 one year than one year
Pension Obligation Bonds: 2012 Taxable Pension Obligation Bonds $ 13,040,000 $ (1,415,000) $ 11,625,000 $ 1,540,000 $ 10,085,000
Lease Revenue Bonds: 2013 Refunding Lease Revenue Bonds
City portion 7,876,000 (601,000) 7,275,000 621,000 6,654,000 2016 Refunding Lease Revenue Bonds 14,125,000 {905,000} 13,220,000 875,000 12,345,000 Total Governmental Activity Debt 35,041,000 {2,921,000} 32,120,000 3,036,000 29,084,000
Capital Leases:
2015 PNC Lease 240,353 (240,353) 2016 Clirnatec Equipment Lease 5,409,045 {154,330} 5,254,715 313,538 4,941,177
Total Capital Leases 5,649,398 {394,683} 5,254,715 313,538 4,941,177
Other Debt HUD 108 Loan - Guarantee Loan -
Senior Center 1,714,000 {131,000} 1,583,000 131,000 1,452,000
Total Other Debt 1,714,000 (131,000} 1,583,000 131,000 1,452,000
Total Government Activity Debt $ 42,404,398 $ {3,446,683} $ 38,957,715 $ 3,480,538 $ 35,477,177
Plus unamortized:
Discount (2012 POB) $ (69,563) $ 10,119 $ (59,444) $ (10,119) $ (49,325) Premium (2013 RLRB) 213,791 (19,888) 193,903 19,888 174,015 Premium (2016 RLRB) 1,966,239 (163,853} 1,802,386 163,853 1,638,533
Total General Long-term Obligations $ 44,514,865 $ {3,620,305} $ 40,894,560 $ 3,654,160 $ 37,240,400
63

CITY OF SAN LEANDRO NOTES TO BASIC FINANCIAL STATEMENTS
For The Year Ended June 30, 2018
I NOTE 6 - LONG-TERM DEBT (Continued)
2012 Taxable Pension Obligation Bonds
In 2012, the City issued $18,305,000 principal amount of 2012 Taxable Pension Obligation Bonds (2012 POB). The purpose of the 2012 POB is to save the City money, the interest rate, including the cost of issuance, must be significantly less than the interest rate the CalPERS charges to amortize the public safety side fund which is distinct from the City's other CalPERS plans. Side funds are retired over a fixed term with a fixed amortization schedule based on CalPERS actuarial earnings assumption rate (7.65%). Principal is due annually on December 1 and the interest is due semi-annually on June 1 and December 1 through June 2024. Debt service is payable from available City resources.
At June 30, 2018, future debt service requirements for the City's portion of the 2012 Taxable Pension Obligations Bonds follows:
For The Year Ending June 30 Principal Interest Total
2019 $ 1,540,000 $ 585,644 $ 2,125,644 2020 1,680,000 519,116 2,199,116 2021 1,835,000 441,164 2,276,164 2022 2,000,000 350,516 2,350,516 2023 2,185,000 247,716 2,432,716 2024 2,385,000 132,127 2,517,127
$ 11,625,000 $ 2,276,283 $ 13,901,283
2013 Refunding Lease Revenue Bonds
In April 2013, the City issued $8,883,000 principal amount of 2013 Refunding Lease Revenue Bonds (2013 RLRB). The purpose of the 2013 RLRBs was to refund and retire the City's 2003 COPs and 2001 COPs. The 2013 RLRBs bear interest rates ranging from 2.00% to 5.00% and are payable semiannually on each June 1 and December 1. Principal payments are payable annually on December 1.
At June 30, 2018, future debt service requirements for the City's portion of the 2013 RLRB follows:
For The Year Ending June 30 Principal Interest Total
2019 $ 621,000 $ 253,811 $ 874,811 2020 641,000 234,881 875,881 2021 661,000 215,351 876,351 2022 681,000 191,816 872,816
2023 710,000 163,996 873,996 2024- 2028 3,961,000 412,792 4,373,792
$ 7,275,000 $ 1,472,647 $ 8,747,647
64

CITY OF SAN LEANDRO NOTES TO BASIC FINANCIAL STATEMENTS
For The Year Ended June 30, 2018
I NOTE 6 - LONG-TERM DEBT (Continued)
2016 Refunding Lease Revenue Bonds
In fiscal year 2016-17, the San Leandro Public Financing Authority issued $14,125,000 principal amount of 2016 Refunding Lease Revenue Bonds (2016 RLRB). The purpose of the 2016 RLRBs was to refinance the City's 2007 COPs. The 2016 RLRBs bear interest rates ranging from 2.0% to 5.0% and are payable semiannually on each May 1 and November 1. Principal payments are payable annually on November 1.
At June 30, 2018, future debt service requirements for the 2016 RLRBs follows:
For The Year Ending June 30 Principal
2019 $ 875,000 2020 895,000 2021 930,000 2022 970,000 2023 1,015,000
2024- 2028 5,840,000 2029- 2030 2,695,000
$ 13,220,000
2015 PNC Egui:gment Lease
Interest
$ 569,975 538,950 502,450 459,600 409,975
1,296,825 136,375
$ 3,914,150
Total
$ 1,444,975 1,433,950 1,432,450 1,429,600 1,424,975 7,136,825 2,831,375
$ 17,134,150
On September 18, 2015, the City entered into a Lease/Purchase Agreement with PNC Equipment Finance, LLC to Lease/Purchase Equipment in the amount of $720,000. The Equipment was for eleven Police SUV Ford Explorers, two Police Interceptors and two Police Ford Fusions. The interest is 1.91 % payable over 3 years.
During fiscal year 2018, the City repaid the final installment of the 2015 PNC Equipment Lease.
65

CITY OF SAN LEANDRO NOTES TO BASIC FINANCIAL STATEMENTS
For The Year Ended June 30, 2018
I NOTE 6-LONG-TERM DEBT (Continued)
2016 Bank of America Equipment Lease
On July 21, 2016, the City entered into a Lease/Purchase Agreement with Bank of America, LLC to Lease/Purchase Equipment in the amount of $5,409,045. The Equipment was for the installation of energy efficiency improvements on various City-owned facilities. The interest is 2.10% payable over 16 years.
At June 30, 2018, future debt service requirements for the 2016 equipment lease follows:
For The Year Ending June 30 Principal
2019 $ 313,538 2020 320,156 2021 326,915 2022 333,816 2023 340,864
2024- 2028 1,815,340 2029- 2033 1,804,086
$ 5,254,715
HUD 108 Guarantee Loan- Senior Center
Interest
$ 108,712 102,092 95,334 88,433 81,389
295,907 96,031
$ 867,898
$
$
Total
422,250 422,248 422,249 422,249 422,253
2,111,247 1,900,117
6,122,613
In 2011, the City received a $2,500,000 20-year federal loan from HUD, at an interest rate of3% to finance the acquisition and construction of senior center facility within the City of San Leandro. The loan is secured and payable from the Community Development Block Grant Fund.
At June 30, 2018 future debt service requirements for the HUD 108 Guarantee loan follows:
For The Year Ending June 30 Principal
2019 $ 131,000 2020 132,000 2021 132,000 2022 132,000 2023 132,000
2024-2028 660,000
2029- 2030 264,000
$ 1,583,000
66
Interest
$ 59,635 55,414 50,972 46,246 41,256
126,892
11,604
$ 392,019
Total
$ 190,635 187,414 182,972 178,246 173,256 786,892
275,604
$ 1,975,019

CITY OF SAN LEANDRO NOTES TO BASIC FINANCIAL STATEMENTS
For The Year Ended June 30, 2018
I NOTE 6 - LONG-TERM DEBT (Continued)
B. Long-Term Debt of Business-Type and Proprietary Funds
Summary of changes in long-term debt of business-type and proprietary funds for the year ended June 30, 2018:
Due Due in Balance Balance Within more than
June 30, 2017 Retirements June 30, 2018 one year one year
State Water Resources Control Board $ 41,057,669 $ (1,698,365) $ 39,359,304 $ 1,742,522 $ 37,616,782
Marina Note 1,239,912 (235,120) 1,004,792 247,794 756,998
Total $ 42,297,581 $ (1,933,485) $ 40,364,096 $ 1,990,316 $ 38,373,780
State Water Resources Control Board
On August 4, 2011, the City entered into a Finance Agreement with the State Water Resources Control Board in the total principal amount of $43,000,000, for the purpose of financing the Wastewater System Expansion and Improvement Project. The loan bears an interest rate of 2.6%. Principal and interest payments are payable annually on July 1. The debt is secured by the WPCP Enterprise Fund operating revenues. The project was completed in fiscal year 2016-17.
Pursuant to the agreement, the City is expected to obtain net revenues of the Water system to be equal to at least 1.20 times the total annual debt service in such fiscal year. In fiscal year 2017-18, net revenues amounted to $2,138,121 which represented coverage of 77% under the $2,765,864 in debt service. Future debt service is expected to average $3 million per year through fiscal year 2035-36 for a total of $52.6 million. The City is preparing a report to propose an increase in sewer rates to meet the coverage expectation. Cash and investments are sufficient to meet any debt service requirement, until rates increased.
At June 30, 2018, future debt service requirements for the State Water Resources Control Board loan are as follows:
For The Year Ending June 30 Principal Interest Total
2019 $ 1,742,522 $ 1,023,342 $ 2,765,864 2020 1,787,828 978,036 2,765,864 2021 1,834,312 931,553 2,765,865 2022 1,882,004 883,861 2,765,865 2023 1,930,936 834,929 2,765,865
2024- 2028 10,434,365 3,394,958 13,829,323 2029- 2033 11,863,227 1,966,095 13,829,322 2034- 2036 7,884,110 413,481 8,297,591
$39,359,304 $ 10,426,255 $49,785,559
67

CITY OF SAN LEANDRO NOTES TO BASIC FINANCIAL STATEMENTS
For The Year Ended June 30, 2018
I NOTE 6- LONG-TERM DEBT (Continued)
Marina Cal Boating Notes Payable
The City entered into various construction loan agreements with the California Department of Boating and Waterways in the total principal amount of $5,331,032. The loans bear an average interest rate of 4.50%. Principal and interest payments are payable annually on each August 1. The debt is secured by Shoreline Enterprise Fund operating revenues.
At June 30, 2018, future debt service requirements for the Marina Cal Boating Notes Payable are as follows:
For The Year Ending Principal Interest Total
2019 $ 247,794 $ 45,216 $ 293,010 2020 258,944 34,065 293,009 2021 270,587 22,413 293,000 2022 93,273 10,236 103,509 2023 45,334 6,039 51,373
2024-2027 88,860 10,217 99,077 $ 1,004,792 $ 128,186 $ 1,132,978
C. Debt Covenants and Restrictions
For fiscal year 2017-18, the City complied with all general and specific covenants regarding debt proceeds usage and debt repayment. In accordance with bond official statements, the City also maintained adequate reserves for all debt issues.
I NOTE 7 - COMPENSATED ABSENCES I The City's compensated absences consist of accrued vacation pay, sick leave, and accrued compensatory time. The total amount of the accrued liability is recorded in the Government-wide Financial Statements and charges for compensated absences expense is charged to the various program activities in the Governmental funds, primarily General fund and Internal Service funds, and all Proprietary funds.
Summary of changes in compensated absences for the year ended June 3 0, 2018, follows:
Balance Balance Due within Due in more
July 1, 2017 Additions Retirements June 30, 2018 one year than one year
Governmental Activities $3,827,393 $ 792,239 $ (943,165) $ 3,676,467 $ 639,193 $ 3,037,274
Business-type Activities 626,773 40,806 (143,018) 524,561 47,210 477,351
Total $ 4,454,166 $ 833,045 $ (1,086,183) $ 4,201,028 $ 686,403 $ 3,514,625
68

CITY OF SAN LEANDRO NOTES TO BASIC FINANCIAL STATEMENTS
For The Year Ended June 30, 2018
I NOTE 8 - UNEARNED REVENUE
A. Governmental-Wide Financial Statements
Unearned revenue in the Government-Wide Financial Statements represents amounts for which revenues have not been earned. At June 30, 2018, unearned revenue in the Government-Wide Financial Statements was $2,783,022.
I NOTE 9 - NET POSITION AND FUND BALANCES
A. Net Position
Net Position is the excess of all the City's assets and deferred outflows ofresources over all its liabilities, and deferred inflows of resources regardless of fund. Net Position is divided into three captions. These captions apply only to Net Position, which is determined only at the Government-wide level, and are described below:
Net investment in capital assets describes the portion of Net Position which is represented by the current net book value of the City's capital assets, less the outstanding balance of any debt issued to finance these assets.
Restricted net position describes the portion of Net Position which is restricted as to use by the terms and conditions of agreements with outside parties, governmental regulations, laws, or other restrictions which the City cannot unilaterally alter. These principally include capital projects, debt service requirements, and special revenue programs restricted to special revenue purposes such as Measure B, special Gas Tax, Grant funds, and other special revenue funds.
Unrestricted describes the portion of Net Position which is not restricted to use.
B. Fund Balances
Governmental fund balances represent the net current assets of each fund. Net current assets generally represent a fund's cash and receivables, less its liabilities.
The City's fund balances are classified in accordance with Governmental Accounting Standards Board Statement Number 54 (GASB 54), Fund Balance Reporting and Governmental Fund Type Definitions, which requires the City to classify its fund balances based on spending constraints imposed on the use of resources. For programs with multiple funding sources, the City prioritizes and expends funds in the following order: Restricted, Committed, Assigned, and Unassigned. Each category in the following hierarchy is ranked according to the degree of spending constraint:
Nonspendable represents balances set aside to indicate items do not represent available, spendable resources even though they are a component of assets. Fund balances required to be maintained intact, such as Permanent Funds, and assets not expected to be converted to cash, such as prepaid, notes receivable, and land held for redevelopment are included. However, if proceeds realized from the sale or collection of nonspendable assets are restricted, committed or assigned, then Nonspendable amounts are required to be presented as a component of the applicable category.
69

CITY OF SAN LEANDRO NOTES TO BASIC FINANCIAL STATEMENTS
For The Year Ended June 30, 2018
I NOTE 9 - NET POSITION AND FUND BALANCES (Continued) I Restricted fund balances have external restrictions imposed by creditors, granters, contributors, laws, regulations, or enabling legislation which requires the resources to be used only for a specific purpose. Encumbrances and nonspendable amounts subject to restrictions are included along with spendable resources.
Committed fund balances have constraints imposed by formal action of the City's highest level decisionmaking authority. The City Council is the highest level of decision-making authority for the City that can, by adoption of a resolution prior to end if the fiscal year, commit fund balance. Once adopted, the limitation imposed by the resolution remains in place until a similar action is taken to remove or revise the limitation. Encumbrances and nonspendable amounts subject to council commitments are included along with spendable resources. As of June 30, 2018, the City does not have committed fund balance.
Assigned fund balances are amounts constrained by the City's intent to be used for a specific purpose, but are neither restricted nor committed. Intent is expressed through City Council resolution and/or budget document or its designee (City Manager) and may be changed at the discretion of the City Council or its designee. This category includes encumbrances; Nonspendable, when it is the City's intent to use proceeds or collections for a specific purpose, and residual fund balances, if any, of Special Revenue, Capital Projects and Debt Service Funds which have not been restricted or committed.
Unassigned fund balance represents residual amounts that have not been restricted, committed, or assigned. This includes the residual general fund balance and residual fund deficits, if any, of other governmental funds.
C. Encumbrances
The City uses an encumbrance system as an extension of normal budgetary accounting for governmental funds. Under this system, purchase orders, contracts, and other commitments for the expenditure of monies are recorded in order to reserve that portion of applicable appropriations. Encumbrances outstanding at year-end are recorded as restricted, committed or assigned fund balance, depending on the classification of the resources to be used to liquidate the encumbrance, since they do not constitute expenditures or liabilities. Outstanding encumbrances at year-end are automatically reappropriated for the following year. Unencumbered and unexpended appropriations lapse at year-end.
As of June 30, 2018, the General Fund had outstanding encumbrances of $1,223,907.
D. Contingency Arrangements
The City's annual budget requires the City to implement and maintain fund balance to handle any unforeseen contingencies in the future, rather than continued reliance on the City's operating General Fund reserves. These unforeseen contingencies include Economic Uncertainty, major Emergencies and Contingencies. As of June 30, 2018, the following are reported within the unassigned fund balance of the General Fund:
Compensated Absences Major Emergencies F.conomic Uncertainty Other
Total
70
$
$
624,135 5,000,000 2,828,721
28,099,828
36,552,684

CITY OF SAN LEANDRO NOTES TO BASIC FINANCIAL STATEMENTS
For The Year Ended June 30, 2018
NOTE 9 - NET POSITION AND FUND BALANCES (Continued)
Detailed classifications of the City's Fund Balances, as of June 30, 2018, are below:
Capital
Improvement Non-Major
General Capital Project Governmental
Fund Fund Funds Total Nonspendables:
Advances to Other Funds $ 6,914,407 $ $ $ 6,914,407 Loans receivable 2,357,668 2,357,668 Loan to Successor Agency 1,995,631 1,995,631
Total Nonspendable Fund Balances 11,267,706 11,267,706
Restricted for: Internship 50,000 50,000
Capital Projects Capital Improvement Projects 23,022,931 23,022,931 Subtotal 50,000 23,022,931 23,072,931
Non-Major Governmental Funds Debt Service 121 121 San Leandro Public Financing Authority 750,913 750,913 GRAD 14,148 14,148 Affordable Housing 1,977,217 1,977,217 Street/ Traffic Improvements 1,787,700 1,787,700 Park Development Fees 332,699 332,699 Underground Utility 2,593,656 2,593,656 Parking 271,222 271,222 Special Gas Tax 1,417,091 1,417,091 Cherry wood Maintenance 393,897 393,897 Measure B - Paratransit 362,913 362,913 Asset Seizure 1,070,501 1,070,501 Heron Bay 961,293 961,293 Proposition 1B - Local Streets & Roads 13,139 13,139 Special Grants 206,214 206,214 MeasureB 2,430,665 2,430,665 MeasureF 775,695 775,695 Measure BB 718,128 718,128 CDBG 377,050 377,050 HOME 497,795 497,795 Housing In- Lieu 240,548 240,548 Business Improvement District 125,172 125,172 Public Education and Government 763,324 763,324
Subtotal 18,081,101 18,081,101
Total Restricted Fund Balances 50,000 23,022,931 18,081,101 41,154,032
Assigned to:
Encumbrances - departmental projects 1,223,907 1,223,907 ACFDOPEB 4,078,000 4,078,000
Total Assigned Fund Balances 5,301,907 5,301,907
Unassigned:
General fund - Compensated Absences 624,135 624,135 General fund - Major Emergencies 5,000,000 5,000,000 General fund - Economic Uncertainty 2,828,721 2,828,721 General fund - Other 28,099,828 28,099,828
Total Unassigned Fund Balances 36,552,684 36,552,684
Total Fund Balances $ 53,172,297 $ 23,022,931 $ 18,081,101 $ 94,276,329
71
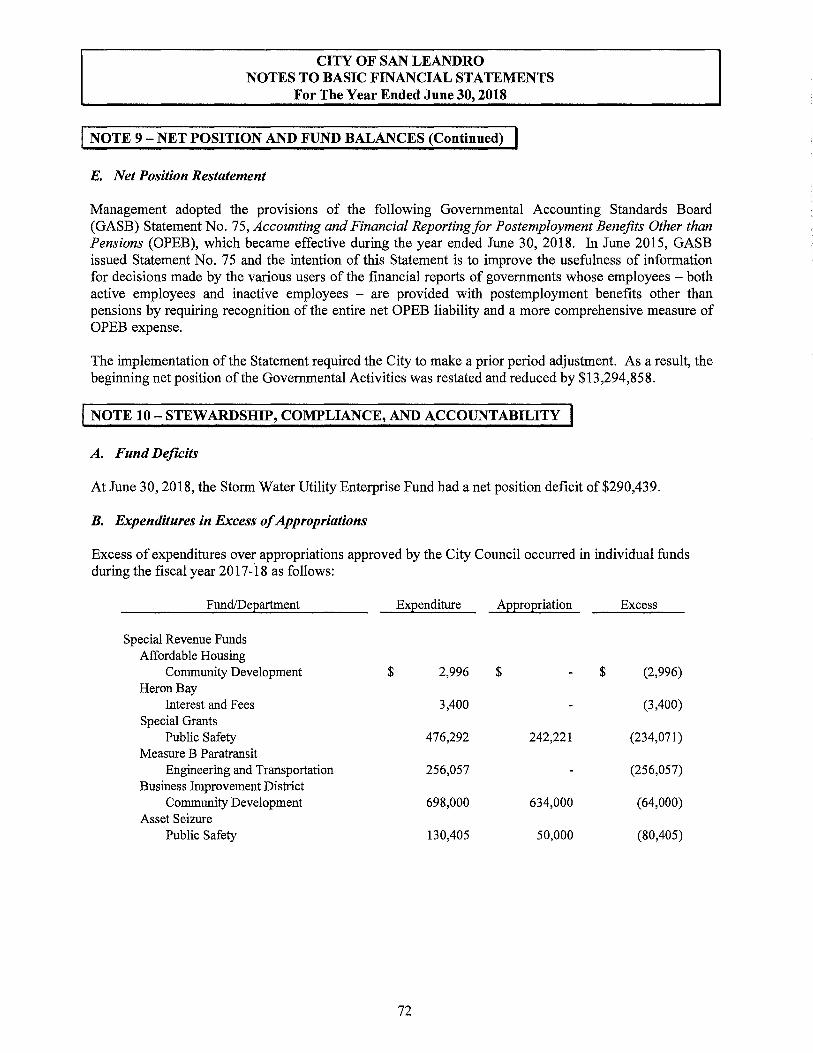
CITY OF SAN LEANDRO NOTES TO BASIC FINANCIAL STATEMENTS
For The Year Ended June 30, 2018
I NOTE 9 - NET POSITION AND FUND BALANCES (Continued) ! E. Net Position Restatement
Management adopted the provisions of the following Governmental Accounting Standards Board (GASB) Statement No. 75, Accounting and Financial Reporting for Postemployment Benefits Other than Pensions (OPEB), which became effective during the year ended June 30, 2018. In June 2015, GASB issued Statement No. 75 and the intention of this Statement is to improve the usefulness of information for decisions made by the various users of the financial reports of governments whose employees - both active employees and inactive employees - are provided with postemployment benefits other than pensions by requiring recognition of the entire net OPEB liability and a more comprehensive measure of OPEB expense.
The implementation of the Statement required the City to make a prior period adjustment. As a result, the beginning net position of the Governmental Activities was restated and reduced by $13,294,858.
I NOTE 10- STEWARDSHIP, COMPLIANCE, AND ACCOUNTABILITY I A. Fund Deficits
At June 30, 2018, the Storm Water Utility Enterprise Fund had a net position deficit of $290,439.
B. Expenditures in Excess of Appropriations
Excess of expenditures over appropriations approved by the City Council occurred in individual funds during the fiscal year 2017-18 as follows:
Fund/Department
Special Revenue Funds Affordable Housing
Community Development Heron Bay
Interest and Fees Special Grants
Public Safety Measure B Paratransit
Engineering and Transportation Business Improvement District
Community Development Asset Seizure
Public Safety
$
Expenditure
2,996
3,400
476,292
256,057
698,000
130,405
72
Appropriation
$
242,221
634,000
50,000
$
Excess
(2,996)
(3,400)
(234,071)
(256,057)
(64,000)
(80,405)
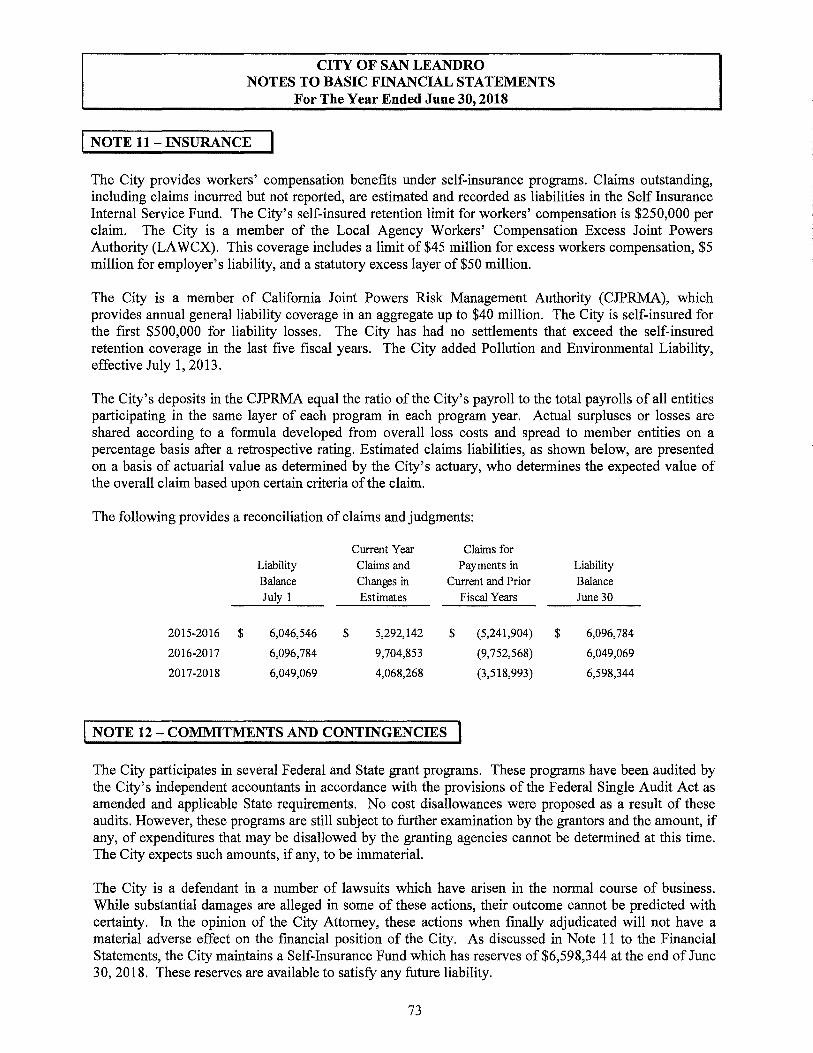
CITY OF SAN LEANDRO NOTES TO BASIC FINANCIAL STATEMENTS
For The Year Ended June 30, 2018
I NOTE 11-INSURANCE
The City provides workers' compensation benefits under self-insurance programs. Claims outstanding, including claims incurred but not reported, are estimated and recorded as liabilities in the Self Insurance Internal Service Fund. The City's self-insured retention limit for workers' compensation is $250,000 per claim. The City is a member of the Local Agency Workers' Compensation Excess Joint Powers Authority (LA WCX). This coverage includes a limit of $45 million for excess workers compensation, $5 million for employer's liability, and a statutory excess layer of $50 million.
The City is a member of California Joint Powers Risk Management Authority (CJPRMA), which provides annual general liability coverage in an aggregate up to $40 million. The City is self-insured for the first $500,000 for liability losses. The City has had no settlements that exceed the self-insured retention coverage in the last five fiscal years. The City added Pollution and Environmental Liability, effective July 1, 2013.
The City's deposits in the CJPRMA equal the ratio of the City's payroll to the total payrolls of all entities participating in the same layer of each program in each program year. Actual surpluses or losses are shared according to a formula developed from overall loss costs and spread to member entities on a percentage basis after a retrospective rating. Estimated claims liabilities, as shown below, are presented on a basis of actuarial value as determined by the City's actuary, who determines the expected value of the overall claim based upon certain criteria of the claim.
The following provides a reconciliation of claims and judgments:
Current Year Claims for
Liability Claims and Payments in Liability
Balance Changes in Current and Prior Balance
July 1 Estimates Fiscal Years June 30
2015-2016 $ 6,046,546 $ 5,292,142 $ (5,241,904) $ 6,096,784
2016-2017 6,096,784 9,704,853 (9,752,568) 6,049,069
2017-2018 6,049,069 4,068,268 (3,518,993) 6,598,344
I NOTE 12 - COMMITMENTS AND CONTINGENCIES
The City participates in several Federal and State grant programs. These programs have been audited by the City's independent accountants in accordance with the provisions of the Federal Single Audit Act as amended and applicable State requirements. No cost disallowances were proposed as a result of these audits. However, these programs are still subject to further examination by the grantors and the amount, if any, of expenditures that may be disallowed by the granting agencies cannot be determined at this time. The City expects such amounts, if any, to be immaterial.
The City is a defendant in a number of lawsuits which have arisen in the normal course of business. While substantial damages are alleged in some of these actions, their outcome cannot be predicted with certainty. In the opinion of the City Attorney, these actions when finally adjudicated will not have a material adverse effect on the financial position of the City. As discussed in Note 11 to the Financial Statements, the City maintains a Self-Insurance Fund which has reserves of $6,598,344 at the end of June 30, 2018. These reserves are available to satisfy any future liability.
73
CITY OF SAN LEANDRO NOTES TO BASIC FINANCIAL STATEMENTS
For The Year Ended June 30, 2018
I NOTE 12 - COMMITMENTS AND CONTINGENCIES (Continued)
A. Sales Tax Reimbursement Agreement
The City has entered into a sales tax reimbursement agreement in order to encourage construction and improvement of property sites within the City. In return, the City is expected to make annual reimbursement payments until the full amount of assistance has been remitted or over a twenty (20) year period, whichever comes sooner. The annual cost of each reimbursement payment commitment is equal to 50% of the net sales tax generated and received by the City above a base amount of $277,000 as stipulated in the approved agreements.
For financial reporting purposes, the GASB Statement No. 77 defines a tax abatement as resulting from an agreement between a government and an individual or entity in which the government promises to forgo tax revenues and the individual or entity promises to subsequently take a specific action that contributes to economic development or otherwise benefits the government or its citizens. According to GASB Statement No. 77, the substance of this sales-tax reimbursement agreement meets the definition of "tax abatements."
For the fiscal year ended June 30, 2018, under this sales-tax reimbursement agreement, the City has abatements totaling $183,309.
Pursuant to the Sales and Use Tax law (chapter 8 Article 1 - section 7056), in order to protect the confidential information of the sales taxes collected and abatements provided to each of the specific agencies, the City has presented the aggregate amount abated during the current fiscal year.
I NOTE 13 - PENSIONS PLAN I For purposes of measuring the net pension liability and deferred outflows/inflows of resources related to pensions, and pension expense, information about the fiduciary net position of the City's California Public Employees' Retirement System (CalPERS) plans (Plans) and additions to/deductions from the Plans' fiduciary net position have been determined on the same basis as they are reported by CalPERS. For this purpose, benefit payments (including refunds of employee contributions) are recognized when due and payable in accordance with the benefit terms. Investments are reported at fair value.
A. Plan Descriptions and Summary of Balances by Plan
All qualified permanent employees are eligible to participate in the City's defined benefit pension plans: • Miscellaneous (all other) agent multiple-employer plan • Safety cost-sharing multiple-employer plan
These plans are administered by the California Public Employees' Retirement System (CalPERS), which acts as a common investment and administrative agent for its participating member employers. Benefit provisions under the Plans are established by State statute and City resolution. CalPERS issues publicly available reports that include a full description of the pension plans regarding benefit provisions, assumptions and membership information that can be found on the CalPERS website.
74

CITY OF SAN LEANDRO NOTES TO BASIC FINANCIAL STATEMENTS
For The Year Ended June 30, 2018
I NOTE 13 - PENSIONS PLAN (Continued) I Below is a summary of the deferred outflows of resources, net pension liabilities, and deferred inflows of resources by Plan for the year ended June 3 0, 2018:
Deferred Deferred
Outflows Net Pension Inflows
of Resources Liability ofResources
Miscellaneous $ 18,113,881 $ 92,140,784 $ 680,738
Safety 26,674,418 84,462,824 6,146,707
Total $ 44,788,299 $ 176,603,608 $ 6,827,445
Benefits Provided - CalPERS provides service retirement and disability benefits, annual cost of living adjustments and death benefits to plan members, who must be public employees and beneficiaries. Benefits are based on years of credited service, equal to one year of full time employment. Members with five years of total service are eligible to retire at age 50 with statutorily reduced benefits. All members are eligible for non-duty disability benefits after 10 years of service. The cost of living adjustments for each plan are applied as specified by the Public Employees' Retirement Law. The Pension Reform Act of 2013 (PEPRA), Assembly Bill 340, is applicable to employees new to CalPERS and hired after December 31, 2012. The Plans' provisions and benefits in effect at June 30, 2018, are summarized as follows:
Hire date
Benefit formula
Benefit vesting schedule
Benefit payments
Retirement age
Monthly benefits, as a % of eligible compensation
Required employee contribution rates
Required employer contribution rates, (blended)
Hire date
Benefit formula
Benefit vesting schedule
Benefit payments
Retirement age
Monthly benefits, as a% of eligible compensation
Required employee contnbution rates
Required employer contnbution rates
Prior to May 6, 2010
2.5%@55
5 years service
monthly for life
50 to 55
2.000% - 2.500%
8.000%
29.404%
Safety
Prior to January 1, 2013
3%@50
5 years service
monthly for life
50
3%
9.000%
55.802%
Miscellaneous
On or after May 6, 2010 to On or after
January 1, 2013 January 1, 2013
2%@55 2%@62
5 years service 5 years service
monthly for life monthly for life
50 to 63 52 to 67
1.426%- 2.418% 1.000% - 2.500%
7.000% 6.750%
29.404% 29.404%
On or after January 1, 2013
2.7@57
5 years service
monthly for life
50to 57
2%-2.7%
12.250%
12.861%
Beginning in fiscal year 2016, CalPERS collects employer contributions for the Plan as a percentage of payroll for the normal cost portion as noted in the rates above and as a dollar amount for contributions toward the unfunded accrued liability (UAL). The dollar amounts are billed on a monthly basis. The City's required contribution for the UAL was $3,580,957 in fiscal year 2018, as shown in the table above.
75

CITY OF SAN LEANDRO NOTES TO BASIC FINANCIAL STATEMENTS
For The Year Ended June 30, 2018
I NOTE 13 - PENSIONS PLAN (Continued) I Employees Covered - As of the June 30, 2016 actuarial valuation date and the June 30, 2017 measurement date, the following employees were covered by the benefit terms for the plan:
Miscellaneous Safety
Active employees 176 81
Inactive employees entitled
but not yet receiving benefits 291 41
Inactive employees or beneficiaries currently receiving benefits 599 293
Total 1,066 415
Contributions - Section 20814( c) of the California Public Employees' Retirement Law requires that the employer contribution rates for all public employers be determined on an annual basis by the actuary and shall be effective on the July 1 following notice of a change in the rate. Funding contributions for both Plans are determined annually on an actuarial basis as of June 30 by CalPERS. The actuarially determined rate is the estimated amount necessary to finance the costs of benefits earned by employees during the year, with an additional amount to finance any unfunded accrued liability. The City is required to contribute the difference between the actuarially determined rate and the contribution rate of employees.
For the year ended June 30, 2018, the contributions recognized as part of pension expense for the Plan were as follows:
Miscellaneous Safety Total
Contributions - employer $ 6,873,205 $ 6,062,560 $ 12,935,765
B. Information Common to the Miscellaneous and Safety Plans
The City's net pension liability for each Plan is measured as the total pension liability, less the pension plan's fiduciary net position. The net pension liability of each of the Plan is measured as of June 30, 2017, using an annual actuarial valuation as of June 3 0, 2016 rolled forward to June 3 0, 2017 using standard update procedures. A summary of principal assumptions and methods used to determine the net pension liability is shown below.
76

CITY OF SAN LEANDRO NOTES TO BASIC FINANCIAL STATEMENTS
For The Year Ended June 30, 2018
I NOTE 13 - PENSIONS PLAN (Continued) I Actuarial Assumptions The total pension liabilities in the June 30, 2016 actuarial valuations were determined using the following actuarial assumptions:
Valuation Date Measurement Date Actuarial Cost Method Actuarial Assumptions:
Discount Rate Inflation Payroll Growth Projected Salary Increase Investment Rate of Return Mortality
(1) Depending on age, service and type of employment
All Plans June 30, 2016 June 30, 2017
Entry-Age Normal Cost Method
7.15% 2.75%
3.0% 3.2% - 12.2% (1)
7.15% (2) Derived using CalPERS Membership
Data for all Funds (3)
(2) Net of pension plan investment expenses, including inflation (3) The probabilities of mortality are based on the 2010 CalPERS Experience Study for the period from 1997 to 2007. Pre-retirement and Post-retirement mortality rates include 5 years of projected mortality improvement using Scale AA published by the Society of Actuaries.
For the measurement date of June 30, 2017, the accounting discount rate was reduced from 7.65 to 7.15 percent.
Discount Rate - The discount rate used to measure the total pension liability was 7.15% for each Plan. To determine whether the municipal bond rate should be used in the calculation of a discount rate for each plan, CalPERS stress tested plans that would most likely result in a discount rate that would be different from the actuarially assumed discount rate. Based on the testing, none of the tested plans run out of assets. Therefore, the current 7 .15 percent discount rate is adequate and the use of the municipal bond rate calculation is not necessary. The long term expected discount rate of 7.15 percent will be applied to all plans in the Public Employees Retirement Fund (PERF). The stress test results are presented in a detailed report that can be obtained from the CalPERS website.
The long-term expected rate of return on pension plan investments was determined using a building-block method in which best-estimate ranges of expected future real rates of return ( expected returns, net of pension plan investment expense and inflation) are developed for each major asset class.
In determining the long-term expected rate of return, CalPERS took into account both short-term and long-term market return expectations as well as the expected pension fund cash flows. Using historical returns of all the funds' asset classes, expected compound returns were calculated over the short-term (first 10 years) and the long-term (11-60 years) using a building-block approach. Using the expected nominal returns for both short-term and long-term, the present value of benefits was calculated for each fund. The expected rate of return was set by calculating the single equivalent expected return that arrived at the same present value of benefits for cash flows as the one calculated using both short-term and longterm returns. The expected rate of return was then set equivalent to the single equivalent rate calculated above and rounded down to the nearest one quarter of one percent.
77

CITY OF SAN LEANDRO NOTES TO BASIC FINANCIAL STATEMENTS
For The Year Ended June 30, 2018
I NOTE 13 - PENSION PLAN (Continued) I The table below reflects the long-term expected real rate of return by asset class. The rate of return was calculated using the capital market assumptions applied to determine the discount rate and asset allocation. These rates of return are net of administrative expenses.
New Strategic Real Return Real Return
Asset Class Allocation Years 1 - lO(a) Years 11 +(b)
Global Equity 47.0%
Global Fixed Income 19.0%
Inflation Sensitive 6.0%
Private Equity 12.0%
Real Estate 11.0%
Infrastructure and Forestland 3.0%
Liquidity 2.0%
Total 100%
(a) An expected inflation of2.5% used for this period.
(b) An expected inflation of 3. 0% used for this period.
C. Miscellaneous (All Other) Agents Multiple-Employer Plan
4.90% 5.38%
0.80% 2.27%
0.60% 1.39%
6.60% 6.63%
2.80% 5.21%
3.90% 5.36%
-0.40% -0.90%
The changes in the Net Pension Liability for the City's Miscellaneous Plan are as follows:
Increase (Decrease)
Total Pension Plan Fiduciary Net Pension
Liabilit~ Net Position Liability/(Asset)
Balance at June 30, 2016 $ 268,595,247 $ 186,151,563 $ 82,443,684
Changes in the year:
Service cost 4,044,169 4,044,169
Interest on the total pension liability 19,808,061 19,808,061
Changes of benefit tenns
Changes of assumptions 15,476,760 15,476,760
Differences between expected and actual
experience (1,248,019) (1,248,019)
Plan to plan resource movement
Contributions - employer 6,399,288 (6,399,288)
Contributions - employees 1,695,139 (1,695,139)
Net investment income 20,564,284 (20,564,284) Benefit payments, including refunds of employee contributions (15,620,511) (15,620,511)
Administrative expense (274,840) 274,840
Net changes 22,460,460 12,763,360 9,697,100
Balance at June 30, 2017 $ 291,055,707 $ 198,914,923 $ 92,140,784
78
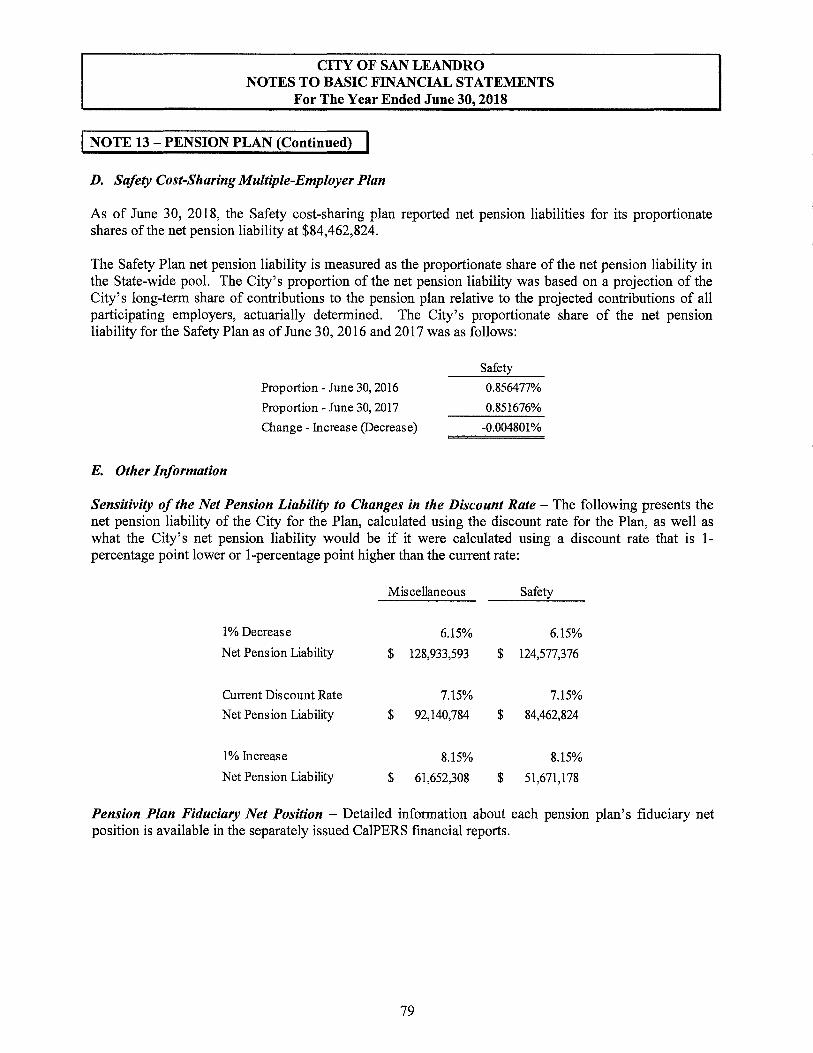
CITY OF SAN LEANDRO NOTES TO BASIC FINANCIAL STATEMENTS
For The Year Ended June 30, 2018
I NOTE 13 - PENSION PLAN (Continued) ! D. Safety Cost-Sharing Multiple-Employer Plan
As of June 30, 2018, the Safety cost-sharing plan reported net pension liabilities for its proportionate shares of the net pension liability at $84,462,824.
The Safety Plan net pension liability is measured as the proportionate share of the net pension liability in the State-wide pool. The City's proportion of the net pension liability was based on a projection of the City's long-term share of contributions to the pension plan relative to the projected contributions of all participating employers, actuarially determined. The City's proportionate share of the net pension liability for the Safety Plan as of June 30, 2016 and 2017 was as follows:
E. Other Information
Proportion - June 30, 2016
Proportion -June 30, 2017
Change - Increase (Decrease)
Safety
0.856477%
0.851676%
-0.004801%
Sensitivity of the Net Pension Liability to Changes in the Discount Rate The following presents the net pension liability of the City for the Plan, calculated using the discount rate for the Plan, as well as what the City's net pension liability would be if it were calculated using a discount rate that is 1-percentage point lower or I-percentage point higher than the current rate:
Miscellaneous Safety
1% Decrease 6.15% 6.15%
Net Pension Liability $ 128,933,593 $ 124,577,376
Current Discount Rate 7.15% 7.15%
Net Pension Liability $ 92,140,784 $ 84,462,824
1% fucrease 8.15% 8.15%
Net Pension Liability $ 61,652,308 $ 51,671,178
Pension Plan Fiduciary Net Position - Detailed information about each pension plan's fiduciary net position is available in the separately issued CalPERS financial reports.
79
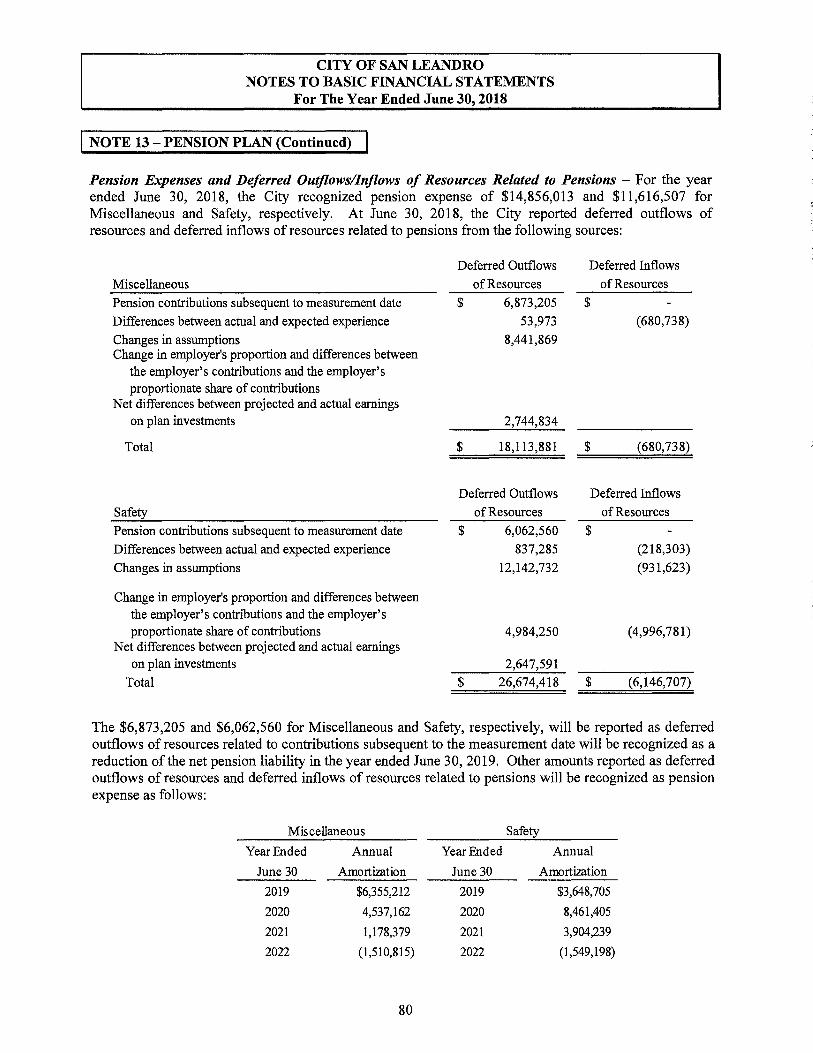
CITY OF SAN LEANDRO NOTES TO BASIC FINANCIAL STATEMENTS
For The Year Ended June 30, 2018
I NOTE 13 - PENSION PLAN (Continued) ! Pension Expenses and Deferred Outflows/Inflows of Resources Related to Pensions - For the year ended June 30, 2018, the City recognized pension expense of $14,856,013 and $11,616,507 for Miscellaneous and Safety, respectively. At June 30, 2018, the City reported deferred outflows of resources and deferred inflows of resources related to pensions from the following sources:
Miscellaneous
Pension contributions subsequent to measurement date
Differences between actual and expected experience
Changes in assumptions Change in employer's proportion and differences between
the employer's contributions and the employer's proportionate share of contributions
Net differences between projected and actual earnings on plan investments
Total
Safety
Pension contributions subsequent to measurement date
Differences between actual and expected experience
Changes in assumptions
Change in employer's proportion and differences between the employer's contributions and the employer's proportionate share of contributions
Net differences between projected and actual earnings on plan investments
Total
Deferred Outflows
of Resources
$
$
6,873,205
53,973
8,441,869
2,744,834
18,113,881
Deferred Outflows
of Resources
$
$
6,062,560
837,285
12,142,732
4,984,250
2,647,591
26,674,418
Deferred Inflows
of Resources
$
(680,738)
$ (680,738)
Deferred Inflows
of Resources
$
$
(218,303)
(931,623)
(4,996,781)
(6,146,707)
The $6,873,205 and $6,062,560 for Miscellaneous and Safety, respectively, will be reported as deferred outflows of resources related to contributions subsequent to the measurement date will be recognized as a reduction of the net pension liability in the year ended June 30, 2019. Other amounts reported as deferred outflows of resources and deferred inflows of resources related to pensions will be recognized as pension expense as follows:
Miscellaneous Safety
Year Ended Annual YearEnded Annual
June 30 Amortization June 30 Amortization
2019 $6,355,212 2019 $3,648,705
2020 4,537,162 2020 8,461,405
2021 1,178,379 2021 3,904,239
2022 (1,510,815) 2022 (1,549,198)
80
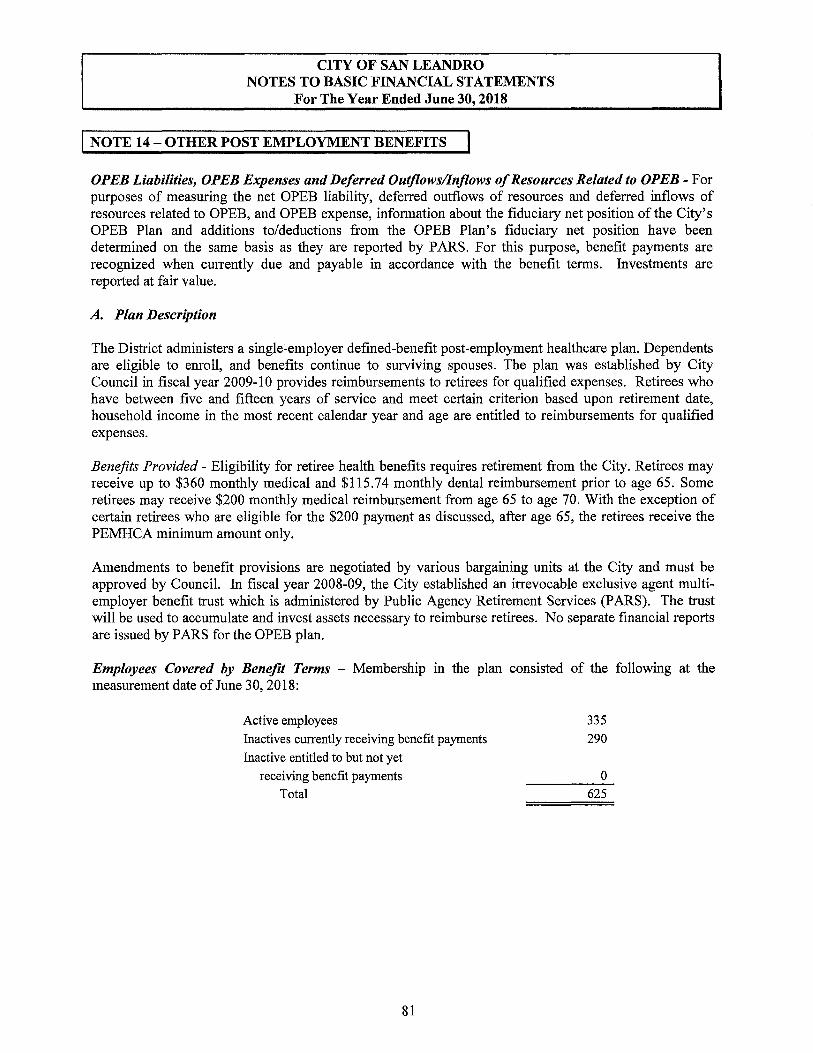
CITY OF SAN LEANDRO NOTES TO BASIC FINANCIAL STATEMENTS
For The Year Ended June 30, 2018
I NOTE 14 - OTHER POST EMPLOYMENT BENEFITS
OPEB Liabilities, OPEB Expenses and Deferred Outflows/Inflows of Resources Related to OPEB - For purposes of measuring the net OPEB liability, deferred outflows of resources and deferred inflows of resources related to OPEB, and OPEB expense, information about the fiduciary net position of the City's OPEB Plan and additions to/deductions from the OPEB Plan's fiduciary net position have been determined on the same basis as they are reported by PARS. For this purpose, benefit payments are recognized when currently due and payable in accordance with the benefit terms. Investments are reported at fair value.
A. Plan Description
The District administers a single-employer defined-benefit post-employment healthcare plan. Dependents are eligible to enroll, and benefits continue to surviving spouses. The plan was established by City Council in fiscal year 2009-10 provides reimbursements to retirees for qualified expenses. Retirees who have between five and fifteen years of service and meet certain criterion based upon retirement date, household income in the most recent calendar year and age are entitled to reimbursements for qualified expenses.
Benefits Provided - Eligibility for retiree health benefits requires retirement from the City. Retirees may receive up to $360 monthly medical and $115.74 monthly dental reimbursement prior to age 65. Some retirees may receive $200 monthly medical reimbursement from age 65 to age 70. With the exception of certain retirees who are eligible for the $200 payment as discussed, after age 65, the retirees receive the PEMHCA minimum amount only.
Amendments to benefit provisions are negotiated by various bargaining units at the City and must be approved by Council. In fiscal year 2008-09, the City established an irrevocable exclusive agent multiemployer benefit trust which is administered by Public Agency Retirement Services (PARS). The trust will be used to accumulate and invest assets necessary to reimburse retirees. No separate financial reports are issued by PARS for the OPEB plan.
Employees Covered by Benefit Terms - Membership in the plan consisted of the following at the measurement date ofJune 30, 2018:
Active employees
Inactives currently receiving benefit payments
Inactive entitled to but not yet
receiving benefit payments
Total
81
335 290
0
625

CITY OF SAN LEANDRO NOTES TO BASIC FINANCIAL STATEMENTS
For The Year Ended June 30, 2018
I NOTE 14 - OTHER POST EMPLOYMENT BENEFITS (Continued) ! B. Net OPEB Liability
Actuarial Methods and Assumptions - The City's net OPEB liability was measured as of June 30, 2018 and the total OPEB liability used to calculate the net OPEB liability was determined on actuarial valuation date that was rolled forward using standard update procedures to determine the total OPEB liability as of the measurement date, based on the following actuarial methods and assumptions:
Actuarial Assumptions June 30, 2018 Measurement Date Valuation Date • June 30, 2017 Actuarial Cost Method • Fntry Age Normal Level Percentage of Payroll
Funding Policy • City contnbutes full Actuarial Determined Contnbution Discount Rate • 5.5 %
General Inflation • 2.5% per annum Mortality, Retirement, Disability, Termination • Same as CalPERS
Salary Increases • 2.875% • Additional merit-based on CallPERS merit salary increase tables.
Healthcare Cost Trend • 7.0% in the first year, trending down to 3.84% over 58 years
The long-term expected rate of return on OPEB plan investments ( comprised of capital appreciation and reinvestment of dividends, interest, and other distributions) is determined through a combination of historical rates of returns, valuation projections, and economic expectations. The expected return is then calculated by weighting the returns for each asset class according to the exposure as determined by HighMark' s current strategic allocation. Expected returns are developed and annually reviewed. The target allocation and best estimates of arithmetic real rates of return for each major asset class are summarized in the following table:
Long-Term Target Expected Real
Asset Class Allocation Rate of Return Equity 30.35%
Large Cap 14.76% 6.70% Mid Cap 2.25% 7.00% Small Cap 5.14% 7.90% Real Estate 0.82% 5.70% International 5.25% 7.30% Emerging Markets 2.13% 9.70%
Fixed income 66.33%
Short-term 12.03% 3.80% Intermediate-term 54.30% 4.60%
Cash 3.32% 2.10% Total 100.0%
Discount Rate - The discount rate used to measure the total OPEB liability is 5.50%. This is the expected long-term rate of return on District assets using a Moderately Conservative Highmark PLUS fund within the Public Agency Retirement Services (PARS). The projection of cash flows used to determine the discount rate assumed that the City contribution will be made at rates equal to the actuarially determined contribution rates. Based on those assumptions, the OPEB plan's fiduciary net position is projected to cover all future OPEB payments. Therefore, the discount rate was set equal to the long-term expected rate of return.
82
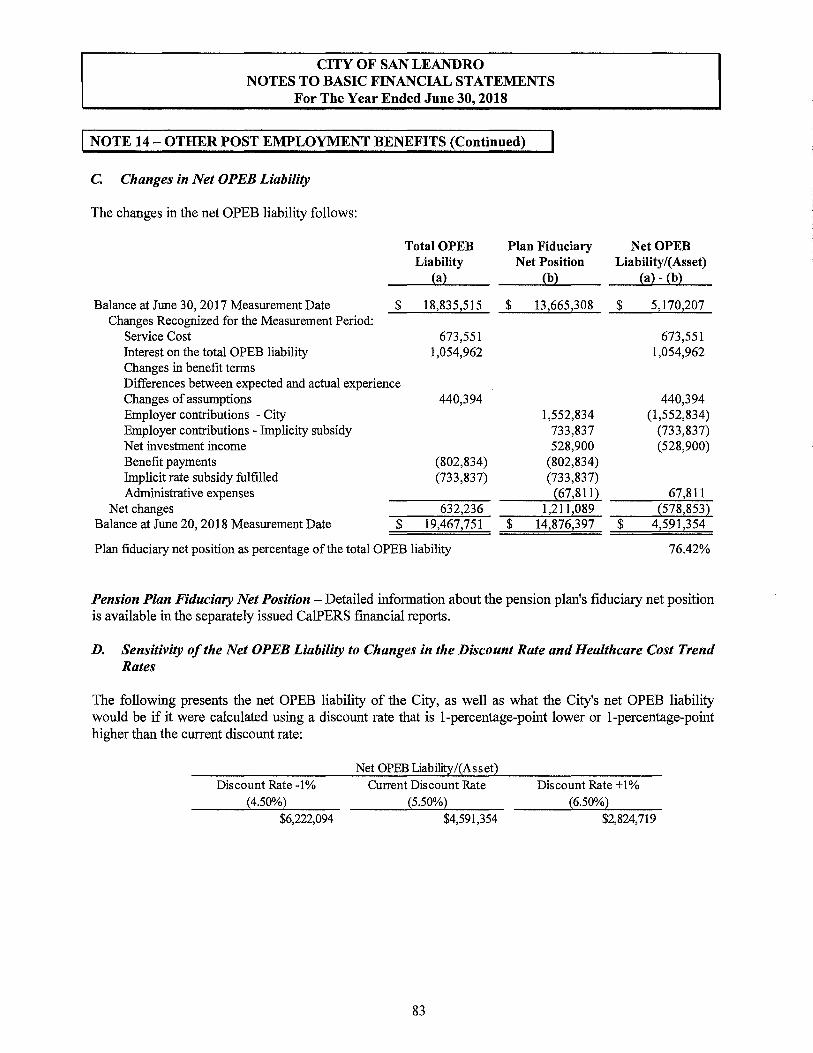
CITY OF SAN LEANDRO NOTES TO BASIC FINANCIAL STATEMENTS
For The Year Ended June 30, 2018
I NOTE 14 - OTHER POST EMPLOYMENT BENEFITS (Continued)
C. Changes in Net OPEB Liability
The changes in the net OPEB liability follows:
TotaIOPEB Plan Fiduciary Liability Net Position
(a} (b}
Balance at June 30, 2017 Measurement Date $ 18,835,515 $ 13,665,308 Changes Recognized for the Measurement Period:
Service Cost 673,551 Interest on the total OPEB liability 1,054,962 Changes in benefit terms Differences between expected and actual experience Changes of assumptions 440,394 Employer contributions - City 1,552,834 Employer contributions - Implicity subsidy 733,837 Net investment income 528,900 Benefit payments (802,834) (802,834) Implicit rate subsidy fulfilled (733,837) (733,837) Administrative expenses {67,811)
Net changes 632,236 1,211,089 Balance at June 20, 2018 Measurement Date $ 19,467,751 $ 14,876,397
Plan fiduciary net position as percentage of the total OPEB liability
NetOPEB Liability/(Asset)
(a} - (b}
$ 5,170,207
673,551 1,054,962
440,394 (1,552,834)
(733,837) (528,900)
67,811 {578,853)
$ 4,591,354
76.42%
Pension Plan Fiduciary Net Position - Detailed information about the pension plan's fiduciary net position is available in the separately issued CalPERS financial reports.
D. Sensitivity of the Net OPEB Liability to Changes in the Discount Rate and Healthcare Cost Trend Rates
The following presents the net OPEB liability of the City, as well as what the City's net OPEB liability would be if it were calculated using a discount rate that is I-percentage-point lower or I-percentage-point higher than the current discount rate:
Discount Rate -1% (4.50%)
$6,222,094
Net OPEB Liability/(Asset) Current Discount Rate
(5.50%) $4,591,354
83
Dis count Rate + 1 % (6.50%)
$2,824,719

CITY OF SAN LEANDRO NOTES TO BASIC FINANCIAL STATEMENTS
For The Year Ended June 30, 2018
I NOTE 14 - OTHER POST EMPLOYMENT BENEFITS (Continued)
The following presents the net OPEB liability of the City, as well as what the City's net OPEB liability would be if it were calculated using healthcare cost trend rates that are I-percentage-point lower or 1-percentage-point higher than the current healthcare cost trend rates (7.0% in the first year, trending down to 3.84% over 58 years):
!%Decrease
$2,764,795
Net OPEB Liability/(Asset) Current Healthcare Cost
Trend Rates $4,591,354
1% Increase
$6,381,026
E. OPEB Expense and Deferred Outflows/Inflows of Resources Related to OPEB
For the year ended June 30, 2018, the City recognized OPEB expense of $1,150,192. At June 30, 2018, the City reported deferred outflows and inflows of resources related to OPEB from the following sources:
Changes of assumptions Net differences between projected and actual earnings on
plan investments
Total
Deferred Outflows Deferred Inflows of Resources of Resources
$ 364,464 $
193,162
$ 557,626 $ ======
The deferred outflows of resources and deferred inflows of resources related to OPEB will be recognized as part ofOPEB expense as follows:
Year Ended June 30
2019 2020 2021 2022 2023
Total
Annual Amortization
$ 124,220 124,220 124,220 124,222 60 744
$ 557,626
I NOTE 15 - JOINTLY GOVERNED ORGANIZATIONS I The City of San Leandro participates in the East Bay Dischargers Authority established on February 15, 1974. The Agency Members of the Joint Powers are the City of Hayward, City of San Leandro, Oro Loma Sanitary District, Castro Valley Sanitary District, and Union Sanity District. The authority has the powers to plan for, acquire, construct, manage, maintain, operate, and control facilities for the collection, transmission, treatment, reclamation, sale and disposal of waste water. No debt, liability, or obligation of the Authority shall constitute a debt, liability or obligation of any Agency.
84
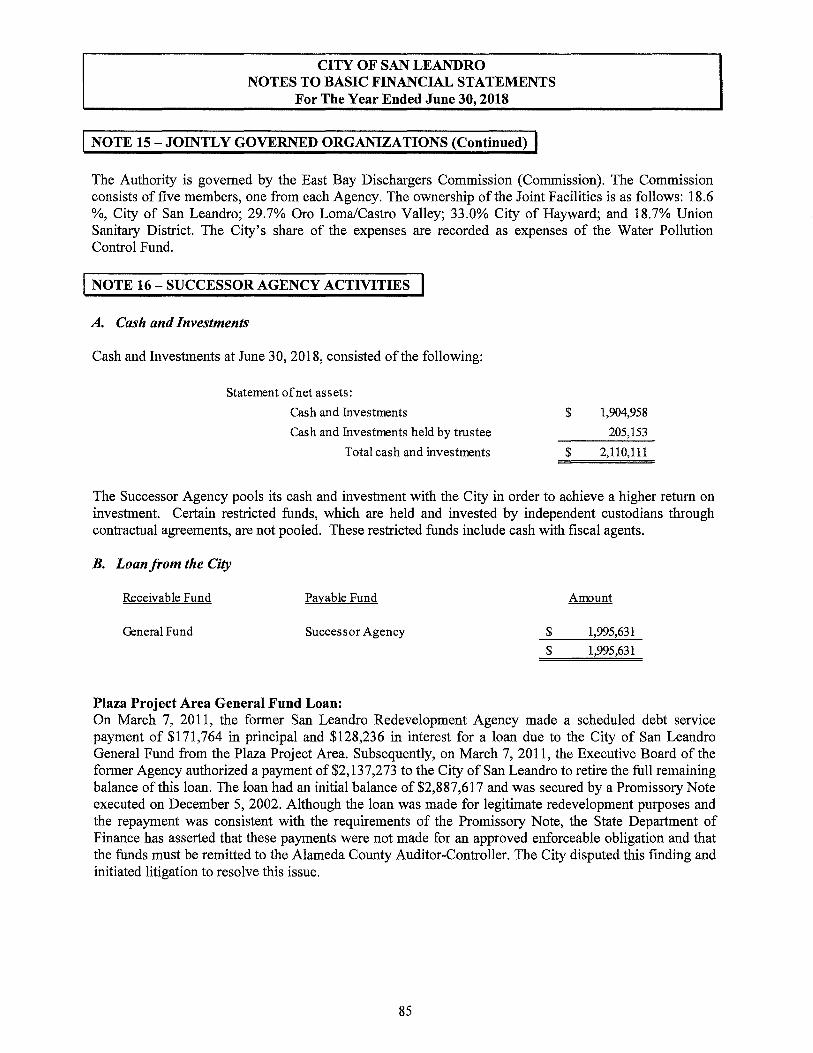
CITY OF SAN LEANDRO NOTES TO BASIC FINANCIAL STATEMENTS
For The Year Ended June 30, 2018
I NOTE 15 - JOINTLY GOVERNED ORGANIZATIONS (Continued) I The Authority is governed by the East Bay Dischargers Commission (Commission). The Commission consists of five members, one from each Agency. The ownership of the Joint Facilities is as follows: 18.6 %, City of San Leandro; 29.7% Oro Loma/Castro Valley; 33.0% City of Hayward; and 18.7% Union Sanitary District. The City's share of the expenses are recorded as expenses of the Water Pollution Control Fund.
I NOTE 16 - SUCCESSOR AGENCY ACTMTIES
A. Cash and Investments
Cash and Investments at June 30, 2018, consisted of the following:
Statement of net assets:
Cash and Investments
Cash and Investments held by trustee
Total cash and investments
$
$
1,904,958
205,153
2,110,111
The Successor Agency pools its cash and investment with the City in order to achieve a higher return on investment. Certain restricted funds, which are held and invested by independent custodians through contractual agreements, are not pooled. These restricted funds include cash with fiscal agents.
B. Loan from the City
Receivable Fund Payable Fund Amount
General Fund Successor Agency $ 1,995,631
$ 1,995,631
Plaza Project Area General Fund Loan: On March 7, 2011, the former San Leandro Redevelopment Agency made a scheduled debt service payment of $171,764 in principal and $128,236 in interest for a loan due to the City of San Leandro General Fund from the Plaza Project Area. Subsequently, on March 7, 2011, the Executive Board of the former Agency authorized a payment of $2,137,273 to the City of San Leandro to retire the full remaining balance of this loan. The loan had an initial balance of $2,887,617 and was secured by a Promissory Note executed on December 5, 2002. Although the loan was made for legitimate redevelopment purposes and the repayment was consistent with the requirements of the Promissory Note, the State Department of Finance has asserted that these payments were not made for an approved enforceable obligation and that the funds must be remitted to the Alameda County Auditor-Controller. The City disputed this finding and initiated litigation to resolve this issue.
85

CITY OF SAN LEANDRO NOTES TO BASIC FINANCIAL STATEMENTS
For The Year Ended June 30, 2018
I NOTE 16 - SUCCESSOR AGENCY ACTMTIES (Continued) I A ruling issued by the Superior Court of California on September 23, 2014 sided with the State Department of Finance on this issue and indicates that the City will be required to remit a payment of $2,437,273 as a "claw back" of General Fund loan payments made after January 1, 2011. While an appeal was pending, the City and the Department of Finance agreed to abide by the initial court ruling on this matter and the Department of Finance ultimately issued a revised determination letter on June 23, 2015 that yielded to the City's position on other issues but maintained the demand for the $2,437,273 "claw back." The City made that payment in October 2015, after which the City, as a taxing entity itself, received approximately 12% of the funds.
On October 28, 2015, the Successor Agency was issued a finding of Completion, which permits the agency to place loan agreements between the former redevelopment agency and its sponsoring entity on the Recognized Obligation Payment Schedule (ROPS), as an enforceable obligation, provided the oversight board makes a finding that the loan was made for legitimate redevelopment purposes. On January 27, 2016, the Oversight Board made such finding, which was approved by the Department of Finance, and the loan was placed on the 2016-17 ROPS.
The current outstanding balance on the loan is $1,995,631. Including interest, the City will receive approximately $3,369,000 in payments towards the loan. Of this, approximately $2,695,000 will be remitted to the General Fund and $674,000 (20%) will be remitted to the Low and Moderate Income Housing Asset Fund. In keeping with State law, a defined repayment schedule was developed with annual payments of $574,829. Payments will be made based upon availability of funds after payment of other enforceable obligations on the ROPS and the yearly cap. Based upon this requirement, sufficient funds are projected to be available to begin payments in fiscal year 2017-18 and complete loan payoff by fiscal year 2022-23.
C. Capital Assets
The Successor Agency assumed the capital assets of the former Redevelopment Agency as of February 1, 2012. All capital assets are valued at historical cost or estimated historical cost if actual historical cost is not available. Contributed capital assets are valued at their estimated fair market value on the date contributed. The Successor Agency's policy is to capitalize all assets with costs exceeding certain minimum thresholds and with useful lives exceeding two years.
All capital assets with limited useful lives are depreciated over their estimated useful lives. The purpose of depreciation is to spread the cost of capital assets equitably among all users over the life of these assets. The amount charged to depreciation expense each year represents that year's pro rata share of the cost of capital assets.
86
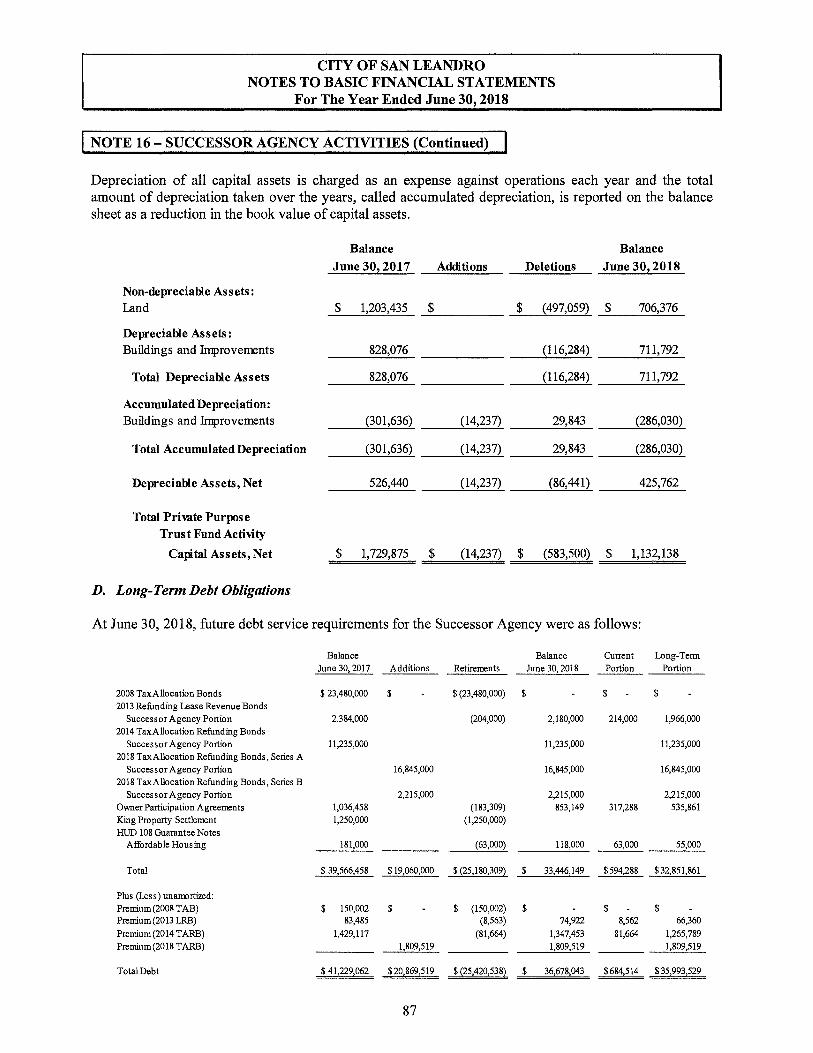
CITY OF SAN LEANDRO NOTES TO BASIC FINANCIAL STATEMENTS
For The Year Ended June 30, 2018
NOTE 16 - SUCCESSOR AGENCY ACTIVITIES (Continued)
Depreciation of all capital assets is charged as an expense against operations each year and the total amount of depreciation taken over the years, called accumulated depreciation, is reported on the balance sheet as a reduction in the book value of capital assets.
Balance Balance
June 30, 2017 Additions Deletions June 30, 2018
Non-depreciable Assets: Land $ 1,203,435 $ $ (497,059) $ 706,376
Depreciable Assets: Buildings and Improvements 828,076 (116,284) 711,792
Total Depreciable Assets 828,076 (116,284) 711,792
Accumulated Depreciation: Buildings and Improvements (301,636) (14,237) 29,843 (286,030)
Total Accumulated Depreciation (301,636) (14,237) 29,843 (286,030)
Depreciable Assets, Net 526,440 (14,237) (86,441) 425,762
Total Private Purpose Trust Fund Activity
Capital Assets, Net $ 1,729,875 $ (14,237) $ (583,500) $ 1,132,138
D. Long-Term Debt Obligations
At June 3 0, 2018, future debt service requirements for the Successor Agency were as follows:
Balance Balance Current Long-Term June 30, 2017 Additions Retirements June 30, 2018 Portion Portion
2008 TaxAllocation Bonds $ 23,480,000 $ $ (23,480,000) $ $ $ 2013 Refunding Lease Revenue Bonds
Successor Agency Portion 2,384,000 (204,000) 2,180,000 214,000 1,966,000 2014 TaxAllocation Refunding Bonds
Successor Agency Portion 11,235,000 11,235,000 11,235,000 2018 TaxAllocation Refunding Bonds, Series A
Successor Agency Portion 16,845,000 16,845,000 16,845,000 2018 TaxA!location Refunding Bonds, Series B
Successor Agency Portion 2,215,000 2,215,000 2,215,000 Owner Participation Agreements 1,036,458 (183,309) 853,149 317,288 535,861 King Property Settlement 1,250,000 {1,250,000) HUD 108 Guarantee Notes
Affordable Housing 181,000 (63,000) 118,000 63,000 55,000
Total $ 39,566,458 $ 19,060,000 $ (25,180,309) $ 33,446,149 $594,288 $32,851,861
Plus (Less) unarrortiz.ed: Premium(2008 TAB) $ 150,002 $ $ {150,002) $ $ $ Premium (2013 LRB) 83,485 (8,563) 74,922 8,562 66,360 Premium(2014 TARB) 1,429,117 (81,664) 1,347,453 81,664 1,265,789 Premium(2018 TARB) 1,809,519 1,809,519 1,809,519
TotalDebt $ 41,229,062 $20,869,519 $ (25,420,538) $ 36,678,043 $684,514 $35,993,529
87

CITY OF SAN LEANDRO NOTES TO BASIC FINANCIAL STATEMENTS
For The Year Ended June 30, 2018
I NOTE 16 - SUCCESSOR AGENCY ACTMTIES (Continued)
2008 Tax Allocation Bonds
In 2008, $27,530,000 principal amount of 2008 Tax Allocation Bond (2008 TABs) was issued. The purpose of the 2008 TABs was to provide funds to finance capital projects in the Alameda County-City of San Leandro former Redevelopment Project Area. A portion of the 2008 TABs were used to finance projects that meet the goals and objectives set forth in the former Redevelopment Plan. These include, but not limited to, design and construction of a senior center, a proposed parking garage, and infrastructure improvements on East 14th Street. Interest rates vary from 4.70% to a maximum of 5.00% and are payable annually. Principal payments are payable annually on November 1.
In fiscal year 2018, the City refunded the outstanding 2008 Tax Allocation Bonds with the issuance of the 2018 Tax Allocation Refunding Bonds, Series A and B. See below.
2013 Refunding Lease Revenue Bonds
In 2013, the City issued $11,995,000 principal amount of 2013 Refunding Lease Revenue Bonds (2013 RLRB) was issued. The purpose of the 2013 RLRBs was to refund the 2003 COPs and 2001 COPs. The 2013 RLRBs bear interest rates ranging from 2.0% to 5.00% and are payable semiannually on each June 1 and December 1. Principal payments are payable annually on December 1.
At June 30, 2018, future debt service requirements for the Successor Agency's portion of the 2013 Refunding Lease Revenue Bonds were as follows:
For The Year
Ending June 30 Principal Interest Total
2019 $ 214,000 $ 75,370 $ 289,370 2020 219,000 68,875 287,875
2021 224,000 62,230 286,230 2022 234,000 54,190 288,190
2023 240,000 44,710 284,710
2024-2027 1,049,000 88,683 1,137,683 $ 2,180,000 $ 394,058 $ 2,574,058
2014 Tax Allocation Refunding Bonds
On September 30, 2014, the Successor Agency issued $11,235,000 of Tax Allocation Bonds (2014 TABs) to prepay the 2002 and 2004 Tax Allocation Bonds and to pay issuance costs. The 2014 TABs are payable and secured by a pledge of tax revenues from tax increment generated in the Plaza Project Area and the West San Leandro/MacArthur Boulevard Project Area. The 2014 TABs bear interest rates ranging from 3.5% to 5.00% and are payable semiannually on each Marsh 1st and September 1st. Principal payments are payable on September 1st.
Proceeds were deposited in an irrevocable trust with an escrow agent to provide funds to fully redeem, on October 30, 2014, the principal and accrued interest of the 2002 and 2004 Tax Allocation Bonds. As a result, the 2002 and 2004 Tax Allocation Bonds are considered redeemed ( current refunding) and the liability for those bonds has been removed from the statement of fiduciary net position.
88

CITY OF SAN LEANDRO NOTES TO BASIC FINANCIAL STATEMENTS
For The Year Ended June 30, 2018
I NOTE 16 - SUCCESSOR AGENCY ACTIVITIES (Continued)
On the date of issuance of the 2014 Bonds, the Successor Agency deposited into the reserve account for the 2014 Bonds a municipal bond debt service insurance policy in the amount of $1,121,078, which is equal to the "Reserve Requirement" for the 2014 Bonds. Neither the balance in the reserve account nor the Reserve Requirement for the 2014 Bonds has changed since such date.
At June 30, 2018, future debt service requirements for the 2014 Tax Allocation Refunding Bonds were as follows:
For The Year Ending June 30 Principal Interest Total
2019 $ $ 537,825 $ 537,825 2020 405,000 527,700 932,700 2021 485,000 505,450 990,450 2022 675,000 476,450 1,151,450 2023 720,000 441,575 1,161,575
2024- 2028 3,920,000 1,638,375 5,558,375
2029- 2033 4,280,000 607,213 4,887,213 2034- 2035 750,000 26,425 776,425
$ 11,235,000 $ 4,761,013 $ 15,996,013
2018 Tax Allocation Refunding Bonds Series A
On May 8, 2018, the Successor Agency issued Tax Allocation Refunding Bonds (2018A TABs) in the amount of $16,845,000. The proceeds of the bonds will be used to refund the 2008 Tax Allocation Bonds, Series 2008. Principal payments of the 2018A TABs are due annually on September from 2023 to 2039 in amounts ranging from $430,000 to $1,370,000 and bear interest at rates ranging from 3.375% to 5.000%. Interest is payable semiannually March 1 and September 1. The Bonds are payable solely from tax increment revenue generated in the Alameda County - City of San Leandro Redevelopment Project Area. Total principal and interest remaining to be paid on the Bonds was $26,170,146 as of June 30, 2018.
The refunding resulted in an overall debt service savings of $5,396,926. The net present value of the debt service savings, called an economic gain, amounted to $3,752,681.
The bonds were issued at a premium of $1,809,519 which is being amortized over the 21-year life of the bonds resulting in an annual amortization of $86,168.
On the date of issuance of the 2018A TABs, the Successor Agency deposited into the reserve account for the 2018A TABs a municipal bond debt service insurance policy in the amount of $1,431,438, which is equal to the "Reserve Requirement" for the 2018A T ABs.
Proceeds from the 2018A T ABs were deposited in an irrevocable trust with an escrow agent to provide funds to fully redeem, on June 5, 2018, the outstanding principal and accrued interest of the 2008 Tax Allocation Bonds.
89
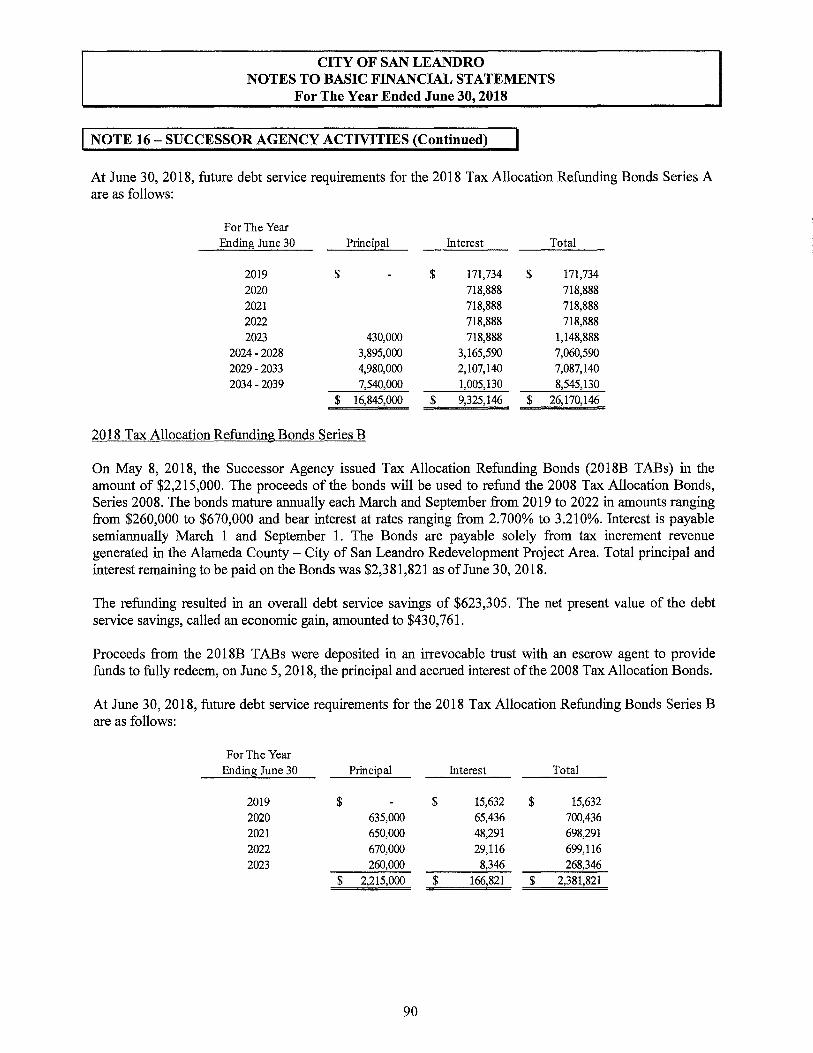
CITY OF SAN LEANDRO NOTES TO BASIC FINANCIAL STATEMENTS
For The Year Ended June 30, 2018
I NOTE 16 - SUCCESSOR AGENCY ACTMTIES (Continued)
At June 30, 2018, future debt service requirements for the 2018 Tax Allocation Refunding Bonds Series A are as follows:
For The Year Ending June 30 Principal Interest Total
2019 $ $ 171,734 $ 171,734 2020 718,888 718,888 2021 718,888 718,888 2022 718,888 718,888 2023 430,000 718,888 1,148,888
2024-2028 3,895,000 3,165,590 7,060,590 2029-2033 4,980,000 2,107,140 7,087,140 2034-2039 7,540,000 1,005,130 8,545,130
$ 16,845,000 $ 9,325,146 $ 26,170,146
2018 Tax Allocation Refunding Bonds Series B
On May 8, 2018, the Successor Agency issued Tax Allocation Refunding Bonds (2018B TABs) in the amount of $2,215,000. The proceeds of the bonds will be used to refund the 2008 Tax Allocation Bonds, Series 2008. The bonds mature annually each March and September from 2019 to 2022 in amounts ranging from $260,000 to $670,000 and bear interest at rates ranging from 2.700% to 3.210%. Interest is payable semiannually March 1 and September 1. The Bonds are payable solely from tax increment revenue generated in the Alameda County - City of San Leandro Redevelopment Project Area. Total principal and interest remaining to be paid on the Bonds was $2,381,821 as of June 30, 2018.
The refunding resulted in an overall debt service savings of $623,305. The net present value of the debt service savings, called an economic gain, amounted to $430,761.
Proceeds from the 2018B T ABs were deposited in an irrevocable trust with an escrow agent to provide funds to fully redeem, on June 5, 2018, the principal and accrued interest of the 2008 Tax Allocation Bonds.
At June 30, 2018, future debt service requirements for the 2018 Tax Allocation Refunding Bonds Series B are as follows:
For The Year Ending June 30 Principal Interest Total
2019 $ $ 15,632 $ 15,632 2020 635,000 65,436 700,436 2021 650,000 48,291 698,291 2022 670,000 29,116 699,116 2023 260,000 8,346 268,346
$ 2,215,000 $ 166,821 $ 2,381,821
90

CITY OF SAN LEANDRO NOTES TO BASIC FINANCIAL STATEMENTS
For The Year Ended June 30, 2018
I NOTE 16 - SUCCESSOR AGENCY ACTMTIES (Continued)
Owner Participation Agreements with Agency Commitment
The Agency entered into the following agreements which represent contingency liabilities for the Agency:
Ford Motor Company Owner Participation Agreement
The agreement required the Agency to make annual payment equivalent to 50% of the sales tax generated above a base of $277,000 by the sale of vehicles as part of the Ford Store San Leandro development. The amount due is paid over several years depending on the volume of auto sales at no interest.
King Property Settlement Agreement
The Successor Agency of the former Redevelopment Agency of the City of San Leandro had agreements with the King parties who are owners of a 3.7 acre parcel on East 14th Street which is a portion of the Bayfair Shopping Center. The King had demanded payment from the Successor Agency of the City of San Leandro as a guarantor of the lease payments. During the fiscal year 2013, the Successor Agency entered into a settlement agreement in the amount of $7,750,000.
During fiscal year 2018 the City made the final installment payment.
HUD 108 Guarantee Notes
In 2000, the City received a $1,000,000 20-year federal loan from Housing and Urban Development (HUD 108 Guarantor loan), at an interest rate of 5.6% to finance the acquisition and construction of affordable housing for seniors within the City of San Leandro. The loan is secured and payable from the Agency's 20% Housing Set-Aside Fund. The debt was assumed by the Successor Agency. Future debt service payments for the HUD 108 Guarantee loan were as follows:
For The Year
Ending June 30 Principal Interest Total
2019 $ 63,000 $ 2,798 $ 65,798
2020 55,000 908 55,908 $ 118,000 $ 3,706 $ 121,706
I NOTE 17 - SUBSEQUENT EVENT
On December 3, 2018, the City Council of the City and the Board of Directors of the San Leandro Public Financing Authority approved the issuance, by the Authority, of lease revenue bonds in the amount of $18,905,000 for the purposes of financing certain capital improvement projects of the City, anticipated to consist of improvements to the Police Headquarters and South Office Building, the Mulford-Marina Branch Library, Manor Park Competition Pool, Farrelly Pool, and Casa Peralta. The 2018 Lease Revenue Bonds bear interest rates ranging from 3.5% to 5.0% and are payable semiannually on each May 1 and November 1. Principal payments are payable annually on November 1.
91


REQUIRED SUPPLEMENTARY INFORMATION

CITY OF SAN LEANDRO Notes to Required Supplementary Information
For the year ended June 30, 2018
City of San Leandro Agent Multiple Employer Defined Benefit Retirement Plan - Miscellaneous Plan
As offiscal year ending June 30, 2018 SCHEDULE OF CHANGES IN THE NET PENSION LIABILITY AND RELATED RATIOS
Last 10 Years*
Total Pension lial:i.lity Service Cost Differences between expected and actual
experience Changes in assumptions Interest Benefit payments, including refunds of
employee contnbutions
Net change in total pension liability Total pension lial:i.lity- beginning Total pension liali.lity- ending (a)
Plan fiduciary net position Contnbutions - employer Contnbutions - employee Net investment income Benefit payments, including refunds of
employee contnbutions Plan to Plan Resource Movement Plan to Plan Resource Movement Net change in plan fiduciary net position Plan fiduciary net position - beginning Plau fiduciary net position - ending (b)
Net pension liability - ending (a)-(b)
Plan fiduciary net position as a percentage of the total pension liability
Covered payroll
Plan fiduciary net position as a percentage ofcovered payroll
Notes to Schedule:
$
$
$
$
$
$
2014
3,921,445
18,796,998
$
2015
3,570,669
(8,034,544) (4,335,946) 18,867,111
(13,777,288) (14,563,306)
8,941,155 (4,496,016) 255,554,562 264,495 717 264,495,717 _$.;...__2_59-',,9..;.9.;._9,...,70_1_
4,594,523 $ 2,010,061
29,807,971
(13,777,288)
5,043,060 1,672,356 4,385,312
(14,563,306) (572)
(217,263) 22,635,267 (3,680,413)
174,078,874 196,714,141 196,714,141 _$ __ 19_3.._,0_33.._,7_2_8
67,781,576 =$=====66==,9=6='5,=97=3=
25.63% 25.76%
20,167,441 $ 19,979,507
336.09% 335.17%
$
2016
3,522,248
593,697
19,495,753
(15,016,152)
8,595,546 259,999,701
$ 268,595,247
$ 5,638,865 1,618,186
994,580
(15,016,152)
(117,644) (6,882,165)
193,033,728 $ 186,151,563
$ 82,443,684
$
30.69%
21,037,041
391.90%
$
2017
4,044,169
(1,248,019) 15,476,760 19,808,061
(15,620,511)
22,460,460 268,595,247
$ 291,055,707
$ 6,399,288 1,695,139
20,564,284
(15,620,511)
(274,840) 12,763,360
186,151,563 $ 198,914,923
$ 92,140,784
31.66%
$ 21,903,698
420.66%
Benefit changes - The figures above do not include any liability impact that 1my have resulted from plan changes which occurred after the actuarial valuation date. This applies for voluntary benefit changes as well as any offers of Two Years Additional Service Credit (a.ka. Golden
Handshakes).
Changes in assumptions - In 2017, the accounting discount rate reduced from 7.65 percent to 7.15 percent. In 2016, there were no changes. In 2015, amounts reported reflect an adjustment of the discount rate from 7.5 percent (net of administrative expense) to 7.65 percent (without a
reduction for pension plan administrative expense). In 2014, amounts reported were based on the 7.5 percent discount rate.
* Fiscal year 2015 was the 1st year of implementation.
94
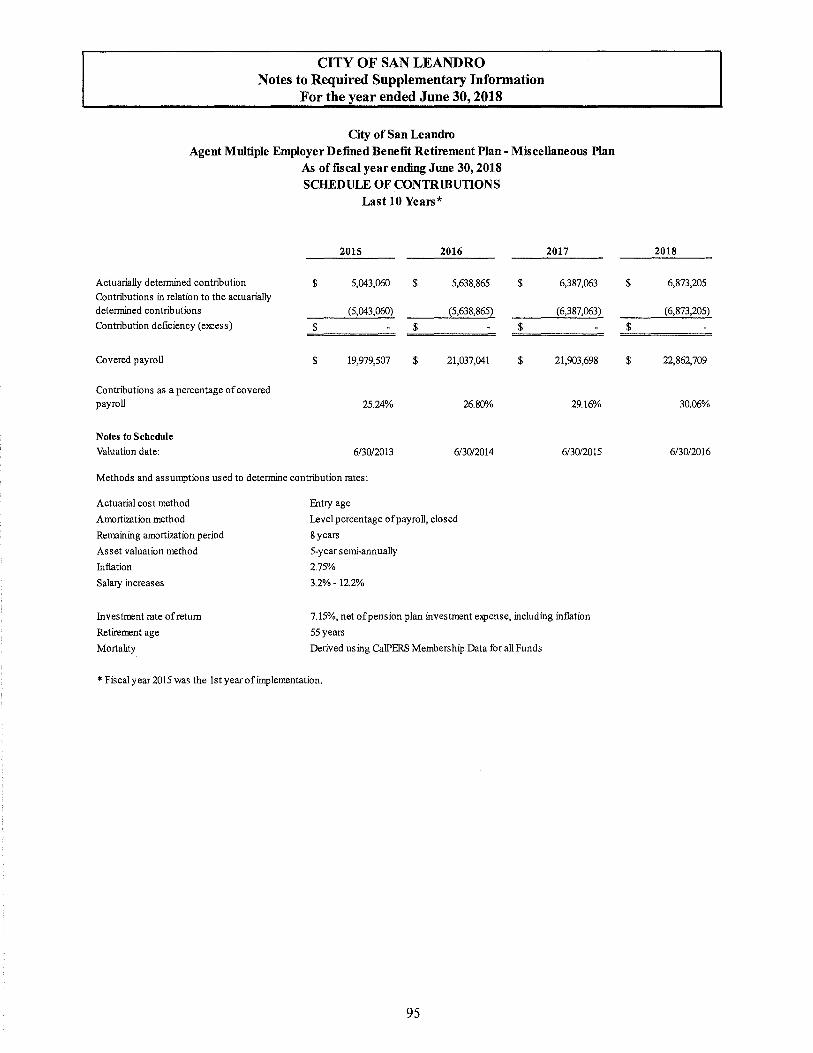
CITY OF SAN LEANDRO Notes to Required Supplementary Information
For the year ended June 30, 2018
Gty of San Leandro Agent Multiple Employer Defmed Benefit Retirement Plan - Miscellaneous Plan
As of fiscal year ending June 30, 2018 SCHEDULE OF CONTRIBUTIONS
Last 10 Years*
2015 2016 2017
Actuarially determined contribution $ 5,043,060 $ 5,638,865 $ 6,387,063 Contributions in relation to the actuarially detennined contnbutions (5,043,060) (5,638,865) (6,387,063)
Contribution deficiency (excess) $ $ $
Covered payroll $ 19,979,507 $ 21,037,041 $ 21,903,698
Contributions as a percentage ofcovered payroll 25.24% 26.80% 29.16%
Notes to Schedule
Valuation date: 6/30/2013 6/30/2014 6/30/2015
Methods and assumptions used to detennine contribution rates:
Actuarial cost method
Amortization method
Remaining amortization period
Asset valuation method
Inflation
Salary increases
Investment rate of return
Retirement age
Mortality
Entry age
Level percentage of payroll, closed
8years
5-year semi-annually
2.75%
3.2%-12.2%
7.15%, net of pension plan investment expense, including inflation
55 years
Derived using Ca!PERS Membership Data for all Funds
* Fiscal year 2015 was the 1st year of implementation.
95
2018
$ 6,873,205
(6,873,205)
$
$ 22,862,709
30.06%
6/30/2016

CITY OF SAN LEANDRO Notes to Required Supplementary Information
For the year ended June 30, 2018
City of San Leandro Cost-Sharing Mnltiple-Fmployer Defined Pension Plan - Safety Plan
SCHIDULEOFTHEPIAN'S PROPORTIONATESHAREOFTHENEf PFNSIONLlABILITY
AND REI.ATID RATIOS AS OF THE MEASUREMENT DATE
Plan's proportion of the Net Pension Llability (Asset) Plan's proportion share of the Net Pension Liability (Asset) Plan's Covered Payroll Plan's Proportionate Share of the Net Pension Liability/(Asset) as a Percentage of its Covered Payroll Plan's Proportionate Share of the Fiduciary Net Position as a Percentage of the Plan's Total Pension Liability
* -Fiscal year 2015 was the 1st yearof implemmtation.
$ $
Last 10 Years*
6/30/2014
0.77754%
48,381,880 $ 10,789,007 $
450.15%
79.82%
96
6/30/2015 6/30/2016
0.84138% 0.85648%
57,751,630 $ 74,111,802 10,794,582 $ 11,439,904
535.01% 647.84%
78.40% 74.06%
6/30/2017
0.85168%
$ 84,462,824 $ 11,316,753
746.35%
73.31%

CITY OF SAN LEANDRO Notes to Required Supplementary Information
For the year ended June 30, 2018
City of San Leandro Cost-Sharing Multipe ~poyer Defined Pension Plan - Safety Plan
For the Fiscal Year Ended June 30, 2018 SCHEDULE OF CONTRIBUTIONS
LastlO Years*
2015 2016 2017
Actuarially determined contnbution $ 2,992,821 $ 5,482,854 $ 5,233,646
Contnbutions in relation to the actuarially determined contnbutions (2,992,821) (5,482,854) (5,233,646) Contnbution deficiency (excess) $ $ $
Covered payroll $ 10,794,582 $ 11,439,904 $ 11,316,753
Contnbutions as a percentage of covered payroll 27.73% 47.93% 46.25%
* - Fiscal year 2015 was the 1st year of implementation.
97
2018
$ 6,062,560
(6,062,560)
$ 12,839,365
47.22%

CITY OF SAN LEANDRO Notes to Required Supplementary Information
For the year ended June 30, 2018
Other Postemployment Benefits - Single-Employer Plan Schedule of Changes in the Net OPEB Liability and Related Ratios
Last Ten Fiscal Years (1)(2)
For the Measurement Period Ended June 30
Total OPEB Liability Service Cost Interest Changes of benefit terms Differences between expected and actual experience Changes of assumptions Implicit rate subsidy fulfilled Benefit Payments Net change in Total OPEB Liability Total OPEB Liability at beginning of year
Total OPEB Liability at end of year
Plan Fiduciary Net Position Contributions - employer Contributions - employer for implicit subsidy Contributions - member Net investment income Benefit payments Impicit subsidy fulfilled Administrative expenses Net change in Plan Fiduciary Net Position Plan Fiduciary Net Position at beginning of year
Plan Fiduciary Net Position at end of year
Authority's Net OPEB Liability (Asset) at end of year
Plan's Fiduciary Net Position as percentage of Total OPEB Liability
Covered employee payroll
Net OPEB Liability as percentage of covered payroll
Notes:
$
$
$
$
$
(1) Fiscal year 2017 was the first year of implementation for GASB 74 (2) Fiscal year 2018 was the first year of implementation for GASB 75
2017 2018
709,979 $ 673,551
1,027,370 1,054,962
440,394
(733,837)
(1,538,260) (802,834)
199,089 632,236
18,636,426 18,835,515
18,835,515 $ 19,467,751
8,488,260 $ 1,552,834
733,837
640,483 528,900
(1,538,260) (802,834)
(733,837)
(40,605) (67,811)
7,549,878 1,211,089
6,115,430 13,665,308
13,665,308 $ 14,876,397
5,170,207 $ 4,591,354
72.6% 76.4%
$34,267,955 $33,357,709
15.09% 13.76%
The Plans' actuarial values, which differ from fair values, and funding progress over the most recent past three years available, are set forth below at their actuarial valuation date of June 30:
98

CITY OF SAN LEANDRO Notes to Required Supplementary Information
For the year ended June 30, 2018
Other Postemployment Benefits - Single-Employer Plan Schedule of Contributions
Last Ten Fiscal Years (1)(2)
Fiscal Year TodedJune 30, 2017 2018
Actuarially detennined contribution
Contributions in relation to the
actuarially detennined contribution
Contribution deficiency (excess)
Covered-employee payroll
Contributions as a percentage of
covered-employee payroll
Notes:
$
$
$
892,618
(7,788,327)
(6,895,709}
34,267,955
22.73%
(1) Fiscal year 2017 was the first year of implementation for GASB 74 (2) Fiscal year 2018 was the first year of implementation for GASB 75
99
$ 1,121,087
(2,286,671}
$ (1,165,584}
$ 33,357,709
6.86%

City of San Leandro Required Supplementary Information For the year ended June 30, 2018
BUDGETS AND BUDGETARY ACCOUNTING
Schedule of Revenues, Expenditures and Changes in Fund Balances - Budget and Actual General Fund
Budgeted Amounts
Adopted Final Actual
REVENUES: Property taxes and other taxes $ 89,291,427 $ 89,291,427 $ 91,065,635 Licenses and permits 8,631,920 8,631,920 9,582,916 Fines and forfeitures 1,495,000 1,495,000 1,688,351 Services charges 3,346,674 3,346,674 3,207,368 Intergovernmental 1,080,000 1,118,580 1,210,883 Use of money and property 1,267,300 1,285,300 1,638,505 Interdepartmental charges 2,000,000 2,000,000 1,999,878 Other 1,914,300 1,956,776 1,195,732
Total revenues 109,026,621 109,125,677 111,589,268
EXPENDITURES: Current:
General government 12,173,233 13,387,297 11,658,959 Public safety 61,955,325 62,320,647 59,427,666 Engineering and transportation 10,049,262 10,140,873 9,475,575 Recreation and culture 10,847,922 10,997,220 10,534,497 Community development 6,302,484 7,778,385 5,698,625
Debt service: Principal 2,059,439 2,059,439 1,569,330 Interest and fees 809,826 809,826 808,323
Total expenditures 104,197,491 107,493,687 99,172,975
EXCESS (DEFICIENCY) OF REVENUES OVER EXPENDITURES 4,829,130 1,631,990 12,416,293
OTHER FINANCING SOURCES (USES): Transfers ( out) {l 0, 178,889) {10,205,889) {10,205,889)
Total other financing sources (uses) {l 0, 178,889) {10,205,889) {l 0,205,889)
NET CHANGE IN FUND BALANCE $ {5,349,759) $ {8,573,899) 2,210,404
FUND BALANCES:
Beginning of year 50,961,893
End of year $ 53,172,297
100
Variance with Final Budget
Positive (Negative)
$ 1,774,208 950,996 193,351
(139,306) 92,303
353,205 (122)
{761,044)
2,463,591
1,728,338 2,892,981
665,298 462,723
2,079,760
490,109 1,503
8,320,712
10,784,303
$ 10,784,303
CITY OF SAN LEANDRO Notes to Required Supplementary Information
For the year ended June 30, 2018
Budgets and Budgetary Accounting
The City adopts a biennial budget annually for all governmental fund types. This budget is effective July 1 through June 30 for each of the ensuing fiscal years. The second year of the biennial budget is amended during the mid-biennial budget cycle process. From the effective date of the budget, which is adopted and controlled at the department level, the amounts stated therein as proposed expenditures become appropriations to the various City departments. The City Council may amend the budget by resolution during the fiscal year. The City Manager is authorized to transfer budgeted amounts between departments and line items within any fund; however, any revisions that alter the total expenditures of any fund must be approved by the City Council. Transfers between funds must be approved by the City Council. All appropriations lapse at year-end, unless otherwise authorized by the City Council and the City Manager, except for capital improvement funds for which appropriations may be carried over for not more than five (5) fiscal years as per the City of San Leandro Charter, Section 520. The City did not budget Proposition lB-Local Streets and Roads Fund and Housing In Lieu Fund.
Annual budgets are adopted on a basis consistent with generally accepted accounting principles except for capital projects funds, which are adopted on a project length basis, which means budgets, are used until the project's completion, not to exceed five fiscal years, for the entire project amount.
Under encumbrance accounting, purchase orders, contracts and other commitments for the expenditures of monies are recorded in order to reserve that portion of the applicable appropriation. Encumbrance accounting is employed as an extension of the formal budgetary process. Encumbrances outstanding at year-end are carried over to the next fiscal year as part of that year's budget resolution.
GAAP serves as the budgetary basis of accounting.
101

SUPPLEMENTARY INFORMATION
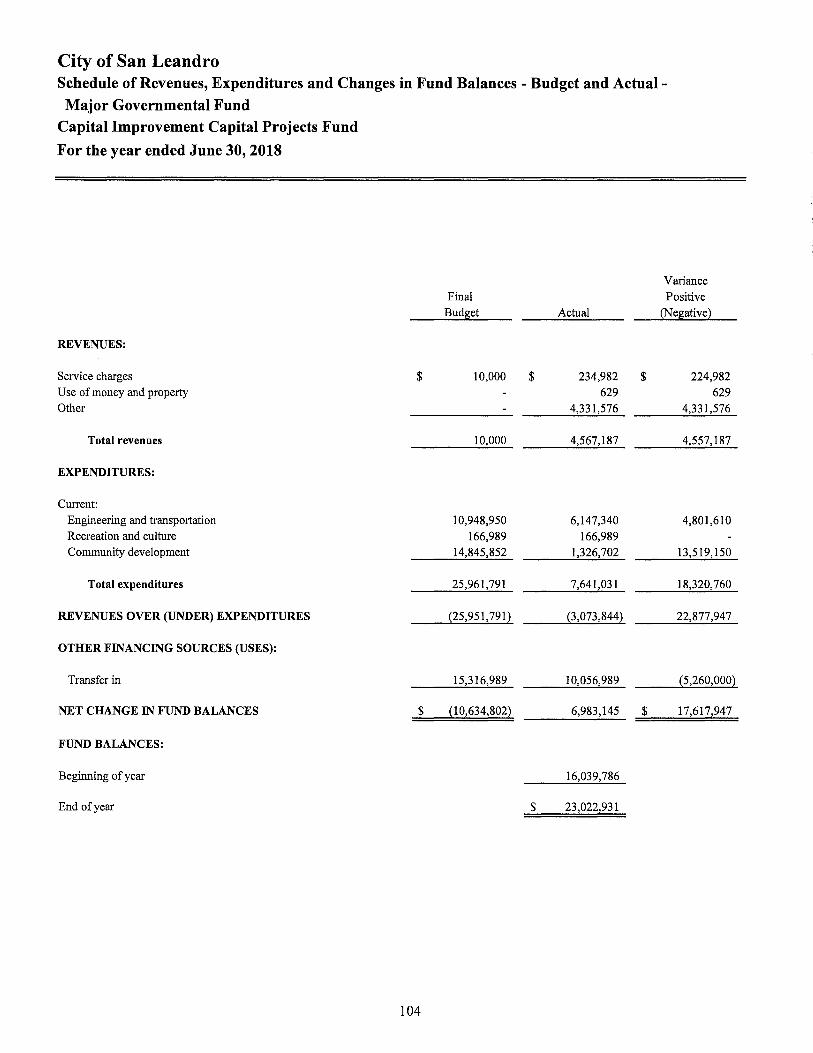
City of San Leandro Schedule of Revenues, Expenditures and Changes in Fund Balances - Budget and Actual -
Major Governmental Fund Capital Improvement Capital Projects Fund
For the year ended June 30, 2018
REVENUES:
Service charges Use of money and property Other
Total revenues
EXPENDITURES:
Current: Engineering and transportation
Recreation and culture Community development
Total expenditures
REVENUES OVER (UNDER) EXPENDITURES
OTHER FINANCING SOURCES (USES):
Transfer in
NET CHANGE IN FUND BALANCES
FUND BALANCES:
Beginning of year
End of year
Final
Budget
$ 10,000
10,000
10,948,950
166,989 14,845,852
25,961,791
(25,951,791)
15,316,989
$ (10,634,802)
104
Variance Positive
Actual (Negative)
$ 234,982 $ 224,982 629 629
4,331,576 4,331,576
4,567,187 4,557,187
6,147,340 4,801,610
166,989 1,326,702 13,519,150
7,641,031 18,320,760
(3,073,844) 22,877,947
10,056,989 (5,260,000)
6,983,145 $ 17,617,947
16,039,786
$ 23,022,931

NON-MAJOR GOVERNMENTAL FUNDS
SPECIAL REVENUE FUNDS
Affordable Housing Asset Fund - This fund accounts for assets received from affordable housing activities from the former Redevelopment Agency's Low/Moderate Housing Fund and acts as its Successor Agency.
Street/Traffic Improvements - This fund accounts for development fee assessments levied to provide for partial funding of street and traffic improvements associated with commercial and residential growth.
Park Development Fee - This fund accounts for park development fee assessments levied to provide for partial funding for park development needs associated with residential growth.
Underground Utilities Fees - This fund accounts for utility conversion project assessments levied to provide for the placement of overhead facilities underground. Assessment shall be expended only for expansion of, maintenance of or construction of Underground Utility Districts and facilities.
Parking - This fund accounts for parking meter and parking lot collections for maintenance of downtown parking facilities and other public parking locations.
Special Gas Tax - This fund accounts for revenues and expenditures received from the State of California under Street and Highways Code. The allocations must be spent for street maintenance and construction and a limited amount for engineering.
Cherrywood Maintenance District - This fund is used to account for the special assessment funding for the on-going maintenance of public facilities at the Cherrywood development.
Measure B Paratransit - This fund accounts for the City's share of proceeds of a one-half cent sales tax increase originally approved by the voters in November 1986. The program is administered by the Alameda County Transportation Authority. The tax provides funds for AC transit and paratransit operations.
Asset Seizure - This fund accounts for funds received from asset forfeiture and used for public safety purposes. Asset Seizure funds previously reported under General Fund and separated as of FY 2010-11.
Heron Bay - This fund accounts for maintenance assessments to fund ongoing maintenance of wetlands impacted by residential growth.
Proposition IB Local Streets & Roads - This fund accounts for Proposition IB funds for safety improvements and repairs to local streets and roads.
Special Grants - This fund accounts for various grants from the State of California and the Federal Government to be expended for a specific purpose, activity or facility.
Measure B - This fund accounts for the City's share of proceeds on a one-half cent sales tax increase originally approved by the voters in November 1986. The program is administered by the Alameda County Transportation Authority. The tax provides funds for eight specific projects within Alameda County including major freeway improvements and a major rail extension.
105
NON-MAJOR GOVERNMENTAL FUNDS (Continued)
SPECIAL REVENUE FUNDS (Continued)
Measure BB - This fund accounts for the City's share of revenues earned and expenditure incurred under the City paratransit, streets and roads, and bike and pedestrian programs.
Measure F - This fund accounts for the City's share of proceeds on a $10 increase in Vehicle Registration fees originally approved by the voters in November 2010. The program is administered by the Alameda County Transportation Authority. The tax provides funds for projects to reduce traffic congestion and vehicle related pollution.
C.D.B. G. - This fund accounts for federally funded grants through the Community Development Block Grant Program from the U.S. Department of Housing and Urban Development.
HOME-This fund accounts for federally funded grants from the U.S. Department of Housing and Urban Development to provide for community housing renovation programs.
Housing In-Lieu - This fund accounts for Housing In-Lieu assessments levied to provide for partial funding of low/moderate housing projects.
Business Improvement District - This fund accounts for service fees charged to business owners to provide a shuttle service from BART to the downtown business district.
Public Education & Government (PEG) Fund - This fund accounts for the Digital Infrastructure and Video Competition Act (DIVCA) of 2006, collecting 1 % of gross revenues from state franchise holders. The fund accounts for user fees charged to cable television customers to provide public education on government programs.
DEBT SERVICE FUND
Special Assessment District - This fund accumulates monies for payments of special assessment bonds which are fmanced by assessments placed on the Alameda County tax roll.
San Leandro Public Financing Authority Debt Service Fund - This fund accounts for the Certificates of Participation issued for the library and fire stations seismic retrofit. These Certificates of Participation were refunded by the issuance of the 2016 Lease Revenue Bonds. The debt will be paid back pursuant to lease agreements between the City of San Leandro and the San Leandro Public Finance Authority.
CAPITAL PROJECTS FUNDS
San Leandro Hillside Geological Hazardous Abatement District (GHAD) -This fund is used to account for the finances of the collaborative between the City of San Leandro and the Geological Hazardous Abatement.
106

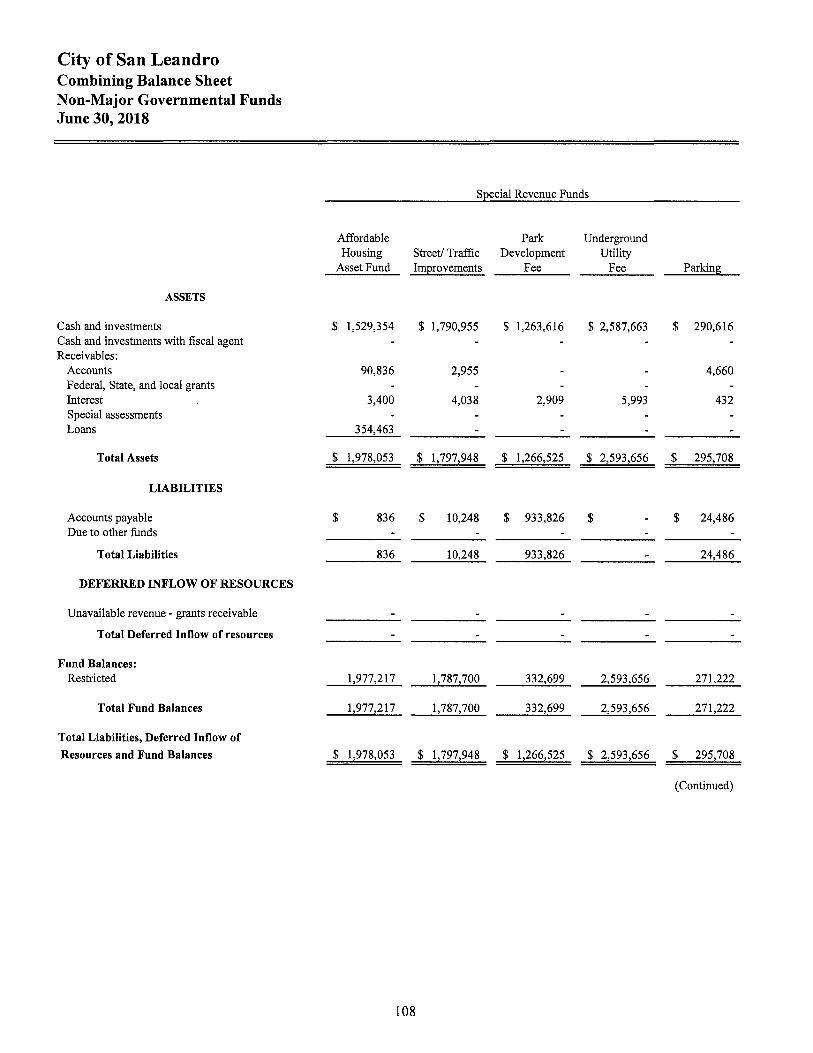
City of San Leandro Combining Balance Sheet Non-Major Governmental Funds June 30, 2018
ASSETS
Cash and investments Cash and investments with fiscal agent Receivables:
Accounts Federal, State, and local grants Interest Special assessments Loans
Total Assets
LIABILITIES
Accounts payable Due to other funds
Total Liabilities
DEFERRED INFLOW OF RESOURCES
Unavailable revenue - grants receivable
Total Deferred Inflow of resources
Fund Balances: Restricted
Total Fund Balances
Total Liabilities, Deferred Inflow of
Resources and Fund Balances
Affordable Housing
Asset Fund
$ 1,529,354
90,836
3,400
354,463
$ 1,978,053
$ 836
836
1,977,217
1,977,217
$ 1,978,053
Special Revenue Funds
Park Underground Street/ Traffic Development Utility Improvements Fee Fee Parkin~
$ 1,790,955 $ 1,263,616 $ 2,587,663 $ 290,616
2,955 4,660
4,038 2,909 5,993 432
$ 1,797,948 $ 1,266,525 $ 2,593,656 $ 295,708
$ 10,248 $ 933,826 $ $ 24,486
10,248 933,826 24,486
1,787,700 332,699 2,593,656 271,222
1,787,700 332,699 2,593,656 271,222
$ 1,797,948 $ 1,266,525 $ 2,593,656 $ 295,708
(Continued)
108
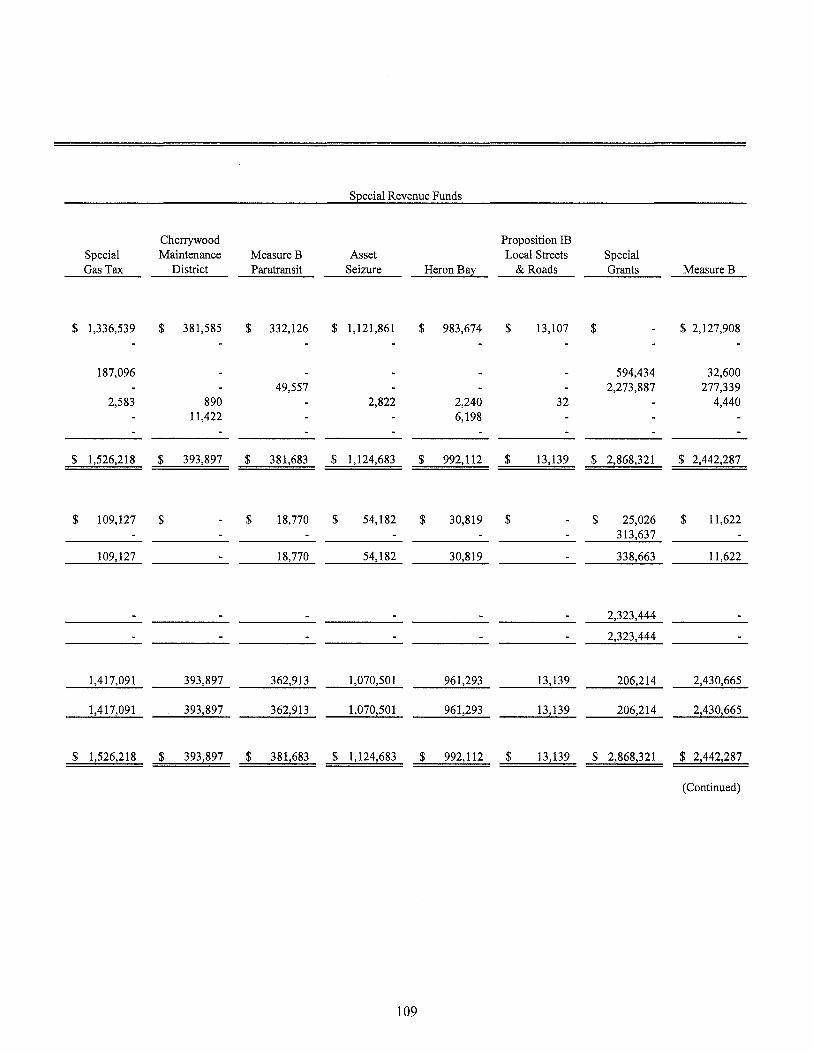
$
$
Special Gas Tax
1,336,539
187,096
2,583
1,526,218
Cherrywood Maintenance
District
$ 381,585
890 11,422
$ 393,897
$ 109,127 $
109,127
1,417,091 393,897
1,417,091 393,897
$ 1,526,218 $ 393,897
MeasureB Paratransit
$ 332,126
49,557
$ 381,683
$
$
$ 18,770 $
18,770
362,913
362,913
$ 381,683 $
Special Revenue Funds
Asset Seizure
1,121,861
2,822
1,124,683
Heron Bay
$ 983,674
2,240 6,198
$ 992,112
Proposition IB Local Streets
& Roads
$ 13,107
32
$ 13,139
54,182 $ 30,819 $
54,182 30,819
1,070,501 961,293 13,139
1,070,501 961,293 13,139
1,124,683 $ 992,112 $ 13,139
109
$
$
Special Grants
594,434 2,273,887
2,868,321
$ 25,026 313,637
338,663
2,323,444
2,323,444
206,214
206,214
$ 2,868,321
Measure B
$ 2,127,908
32,600 277,339
4,440
$ 2,442,287
$ 11,622
11,622
2,430,665
2,430,665
$ 2,442,287
(Continued)

City of San Leandro Combining Balance Sheet Non-Major Governmental Funds June 30, 2018
ASSETS
Cash and investments Cash and investments with fiscal agent Receivables:
Accounts Federal, State, and local grants Interest Special assessments Loans
Total Assets
LIABILITIES
Accounts payable Due to other funds
Total Liabilities
DEFERRED INFLOW OF RESOURCES
Unavailable revenue - grants receivable
Total Deferred Inflow of resources
Fund Balances: Restricted
Total Fund Balances
Total Liabilities, Deferred Inflow of
Resources and Fund Balances
Measure BB
$
2,148,614
61
$ 2,148,675
$ 146,648 1,283,899
1,430,547
718,128
718,128
$ 2,148,675
110
Special Revenue Funds
Housing MeasureF C.D.B.G. HOJ\1E In-Lieu
$ 700,624 $ 399,505 $ 496,885 $ 239,977
73,679
1,392 910 571
$ 775,695 $ 399,505 $ 497,795 $ 240,548
$ $ 22,455 $ $
22,455
775,695 377,050 497,795 240,548
775,695 377,050 497,795 240,548
$ 775,695 $ 399,505 $ 497,795 $ 240,548
(Continued)

Special Revenue Funds
Business Improvement
District
$ 173,083
49,564
429 96
$ 223,172
$ 98,000
98,000
125,172
125,172
Public Education and Government
$ 693,042
74,966
1,535
$ 769,543
$
$
$ 6,219 $
6,219
763,324
763,324
$ 223,172 $ 769,543 $
Debt Service Funds
Special Assessment
District
121
121
121
121
121
San Leandro Public Financing
Authority
$ 750,904 9
$ 750,913
$
750,913
750,913
$ 750,913 =====
111
Capital Projects Fund
GHAD
$ 14,148
$ 14,148
$
14,148
14,148
Total Non-Major
Governmental Funds
$17,227,293 9
3,259,404 2,600,783
34,677 17,716
354,463
$ 23,494,345
$ 1,492,264 1,597,536
3,089,800
2,323,444
2,323,444
18,081,101
18,081,101
14,148 $ 23,494,345 =======
$
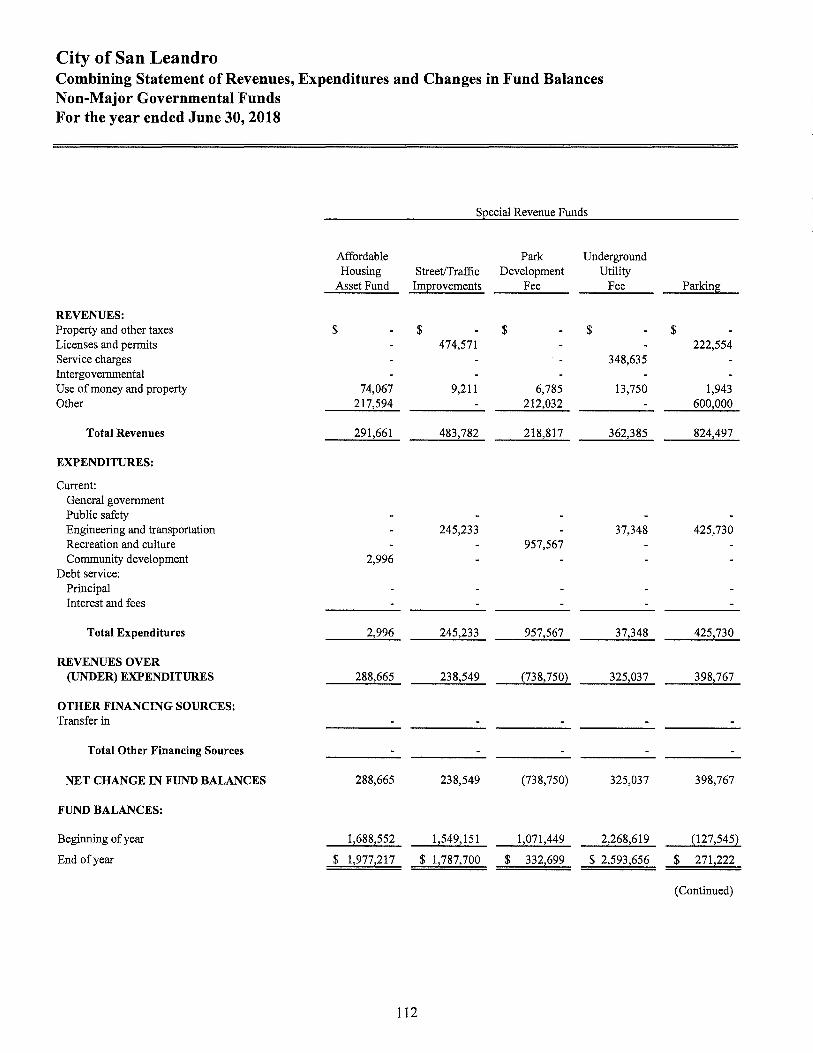
City of San Leandro Combining Statement of Revenues, Expenditures and Changes in Fund Balances Non-Major Governmental Funds For the year ended June 30, 2018
Special Revenue Funds
Affordable Park Underground Housing Street/Traffic Development Utility
Asset Fund Improvements Fee Fee
REVENUES: Property and other taxes $ $ $ $ Licenses and permits 474,571 Service charges 348,635 Intergovernmental Use of money and property 74,067 9,211 6,785 13,750 Other 217,594 212,032
Total Revenues 291,661 483,782 218,817 362,385
EXPENDITURES:
Current: General government Public safety Engineering and transportation 245,233 37,348 Recreation and culture 957,567 Community development 2,996
Debt service: Principal Interest and fees
Total Expenditures 2,996 245,233 957,567 37,348
REVENUES OVER (UNDER)EXPENDITURES 288,665 238,549 (738,750) 325,037
OTHER FINANCING SOURCES: Transfer in
Total Other Financing Sources
NET CHANGE IN FUND BALANCES 288,665 238,549 (738,750) 325,037
FUND BALANCES:
Beginning of year 1,688,552 1,549,151 1,071,449 2,268,619
End of year $ 1,977,217 $ 1,787,700 $ 332,699 $ 2,593,656
112
Parking
$ 222,554
1,943 600,000
824,497
425,730
425,730
398,767
398,767
(127,545)
$ 271,222
(Continued)
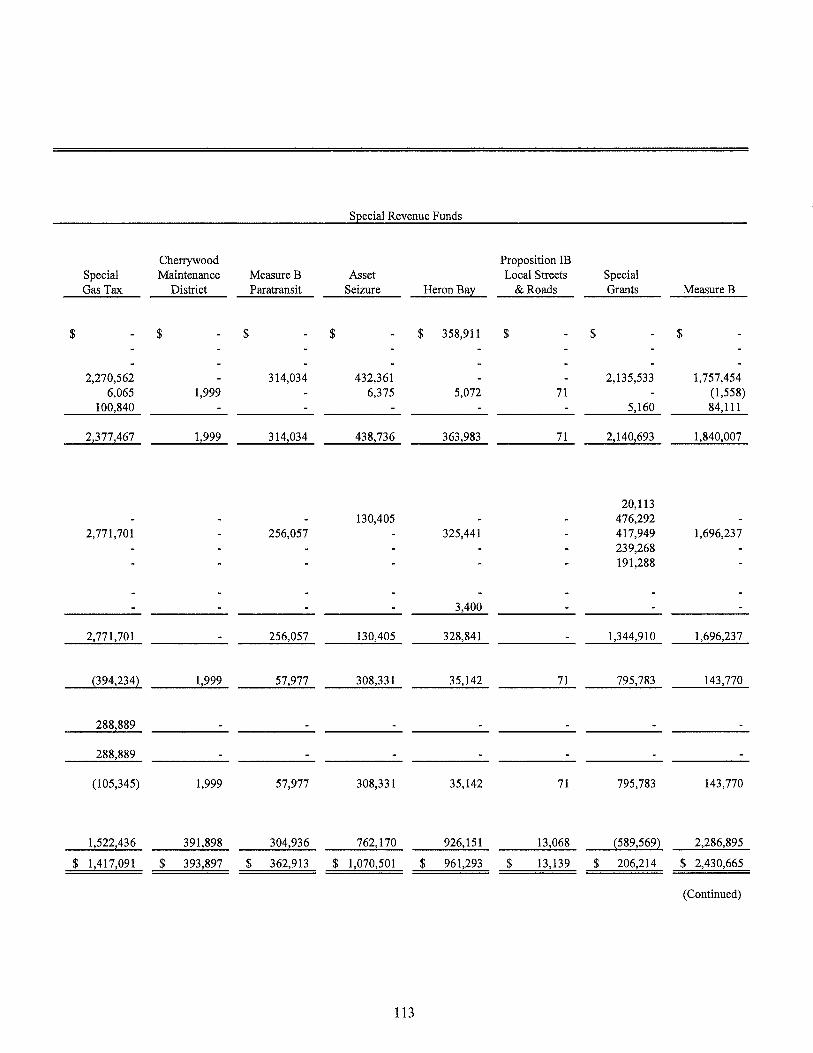
Special Gas Tax
$
2,270,562 6,065
100,840
2,377,467
2,771,701
2,771,701
(394,234)
288,889
288,889
(105,345)
1,522,436
$ 1,417,091
Special Revenue Funds
Cherrywood Maintenance MeasureB Asset
District P aratransit Seizure Heron Bay
$ $ $ $ 358,911
314,034 432,361 1,999 6,375 5,072
1,999 314,034 438,736 363,983
130,405 256,057 325,441
3,400
256,057 130,405 328,841
1,999 57,977 308,331 35,142
1,999 57,977 308,331 35,142
391,898 304,936 762,170 926,151
$ 393,897 $ 362,913 $ 1,070,501 $ 961,293
113
Proposition IB Local Streets Special
&Roads Grants MeasureB
$ $ $
2,135,533 1,757,454 71 (1,558)
5,160 84,111
71 2,140,693 1,840,007
20,113 476,292 417,949 1,696,237 239,268 191,288
1,344,910 1,696,237
71 795,783 143,770
71 795,783 143,770
13,068 (589,569) 2,286,895
$ 13,139 $ 206,214 $ 2,430,665
(Continued)

City of San Leandro Combining Statement of Revenues, Expenditures and Changes in Fund Balances Non-Major Governmental Funds For the year ended June 30, 2018
Special Revenue Funds
Measure BB MeasureF C.D.B.G. HOME
REVENUES: Property and other taxes $ $ $ $ Licenses and permits Service charges Intergovernmental 3,447,965 425,568 383,850 270,983 Use of money and property 4,090 556 2,270 Other 300,000 91,493
Total Revenues 3,452,055 426,124 683,850 364,746
EXPENDITURES:
Current: General government Public safety Engineering and transportation 3,627,883 222,279 Recreation and culture Community development 248,653 9,160
Debt service: Principal 131,000 Interest and fees 63,585
Total Expenditures 3,627,883 222,279 443,238 9,160
REVENUES OVER (UNDER)EXPENDITURES {175,828} 203,845 240,612 355,586
OTHER FINANCING SOURCES: Transfer in
Total Other Financing Sources
NET CHANGE IN FUND BALANCES (175,828) 203,845 240,612 355,586
FUND BALANCES:
Beginning of year 893,956 571,850 136,438 142,209
End of year $ 718,128 $ 775,695 $ 377,050 $ 497,795
114
Housing In-Lieu
$ 46,093
1,312
47,405
47,405
47,405
193,143
$ 240,548
(Continued)

Special Revenue Funds Debt Service Funds Capital Projects
Fund
Business Improvement
District
$ 400,381
193,909 924
595,214
698,000
698,000
(102,786)
(102,786)
227,958
Public Education and Government
$ 223,966 $
3,515
227,481
68,632
68,632
158,849
158,849
604,475
Special Assessment
District
121
$ 125,172 $ 763,324 $ 121 =====
San Leandro Public Financing
Authority
$ $
2,370,320
2,370,320
1,506,000 868,774
2,374,774
(4,454)
(4,454)
755,367
$ 750,913 $
115
GHAD
14,148
14,148
Total Nonmajor
Governmental Funds
$ 582,877 1,143,599
348,635 11,632,219 2,506,767 1,611,230
17,825,327
20,113 606,697
10,025,858 1,196,835 1,218,729
1,637,000 935,759
15,640,991
2,184,336
288,889
288,889
2,473,225
15,607,876
$ 18,081,101

City of San Leandro Schedule of Revenues, Expenditures and Changes in Fund Balances - Budget and Actual -Non Major Governmental Fund
Affordable Housing Special Revenue Fund For the year ended June 30, 2018
Variance Final Positive
Bud8et Actual (Ne8ative2
REVENUES:
Use of money and property $ 20,000 $ 74,067 $ 54,067 Other 90,000 217,594 127,594
Total Revenues 110,000 291,661 181,661
EXPENDITURES:
Current: Community development 2,996 (2,9962
Total Expenditures 2,996 (2,9962
NET CHANGE IN FUND BALANCES $ 110,000 288,665 $ 178,665
FUND BALANCES:
Beginning of year 1,688,552
End of year $ 1,977,217
116

City of San Leandro Schedule of Revenues, Expenditures and Changes in Fund Balances - Budget and Actual -
Non Major Governmental Fund
Street/Traffic Improvements Special Revenue Fund For the year ended June 30, 2018
Final
Budget
REVENUES:
Licenses and permits $ 80,000 Use of money and property 7,000
Total Revenues 87,000
EXPENDITURES:
Current: Engineering and transportation 1,087,318
Total Expenditures 1,087,318
NET CHANGE IN FUND BALANCES $ {1,000,318}
FUND BALANCES:
Beginning of year
End of year
117
Variance Positive
Actual (Negative}
$ 474,571 $ 394,571 9,211 2,211
483,782 396,782
245,233 842,085
245,233 842,085
238,549 $ 1,238,867
1,549,151
$ 1,787,700

City of San Leandro Schedule of Revenues, Expenditures and Changes in Fund Balances - Budget and Actual -
Non Major Governmental Fund
Park Development Fee Special Revenue Fund For the year ended June 30, 2018
REVENUES:
Use of money and property Other
Total Revenues
EXPENDITURES:
Current: Recreation and culture
Total Expenditures
NET CHANGE IN FUND BALANCES
FUND BALANCES:
Beginning of year
End of year
Final Budget
$ 3,000 380,000
383,000
1,303,088
1,303,088
$ {920,088)
118
Variance Positive
Actual (Negative),
$ 6,785 $ 3,785 212,032 {167,968)
218,817 {164,183)
957,567 345,521
957,567 345,521
(738,750) $ 181,338
1,071,449
$ 332,699
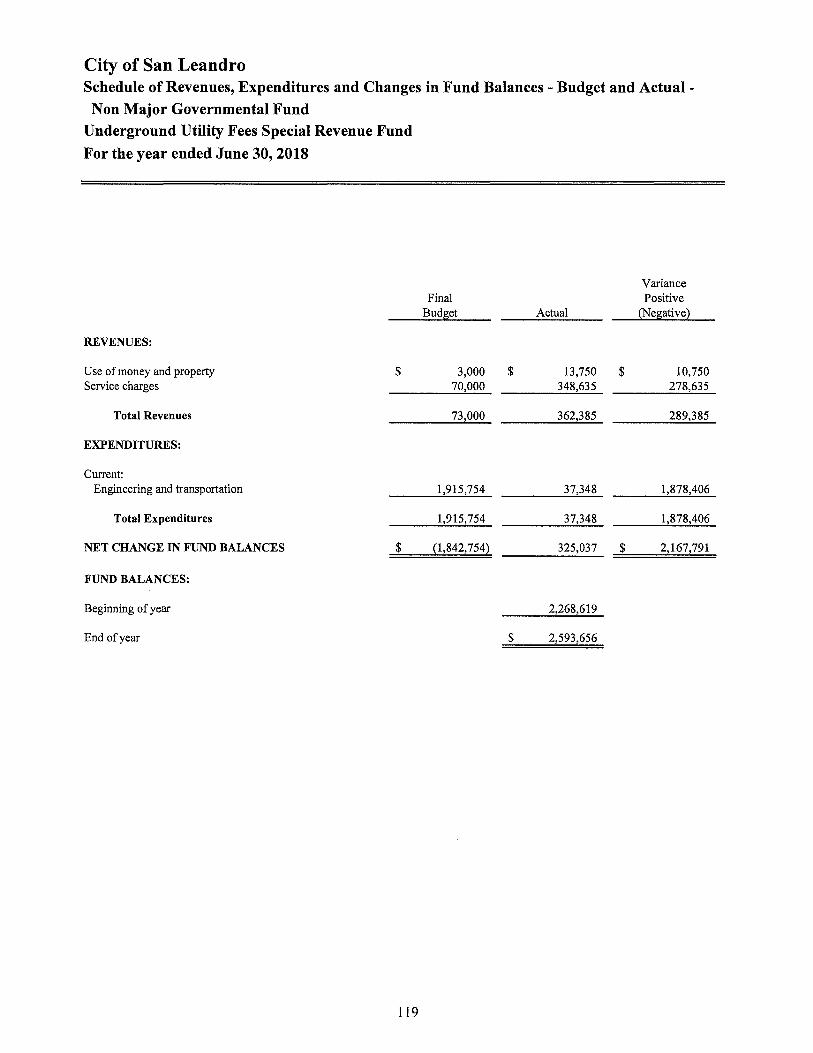
City of San Leandro Schedule of Revenues, Expenditures and Changes in Fund Balances - Budget and Actual -Non Major Governmental Fund
Underground Utility Fees Special Revenue Fund
For the year ended June 30, 2018
REVENUES:
Use of money and property $ Service charges
Total Revenues
EXPENDITURES:
Current: Engineering and transportation
Total Expenditures
NET CHANGE IN FUND BALANCES $
FUND BALANCES:
Beginning of year
End of year
119
Final Budliiet
3,000 70,000
73,000
1,915,754
1,915,754
{1,842,7542
Variance Positive
Actual (Neliiative2
$ 13,750 $ 10,750 348,635 278,635
362,385 289,385
37,348 1,878,406
37,348 1,878,406
325,037 $ 2,167,791
2,268,619
$ 2,593,656

City of San Leandro Schedule of Revenues, Expenditures and Changes in Fund Balances - Budget and Actual -Non Major Governmental Fund
Parking Special Revenue Fund
For the year ended June 30, 2018
Variance Final Positive
Budget Actual (Negative)
REVENUES:
Licenses and permits $ 242,000 $ 222,554 $ (19,446) Use of money and property 1,943 1,943 Other revenue 600,000 600,000
Total revenues 242,000 824,497 582,497
EXPENDITURES:
Current: Engineering and transportation 913,178 425,730 487,448
Total expenditures 913,178 425,730 487,448
NET CHANGE IN FUND BALANCES $ {671,178) 398,767 $ 1,069,945
FUND BALANCES:
Beginning of year {127,545)
End of year $ 271,222
120
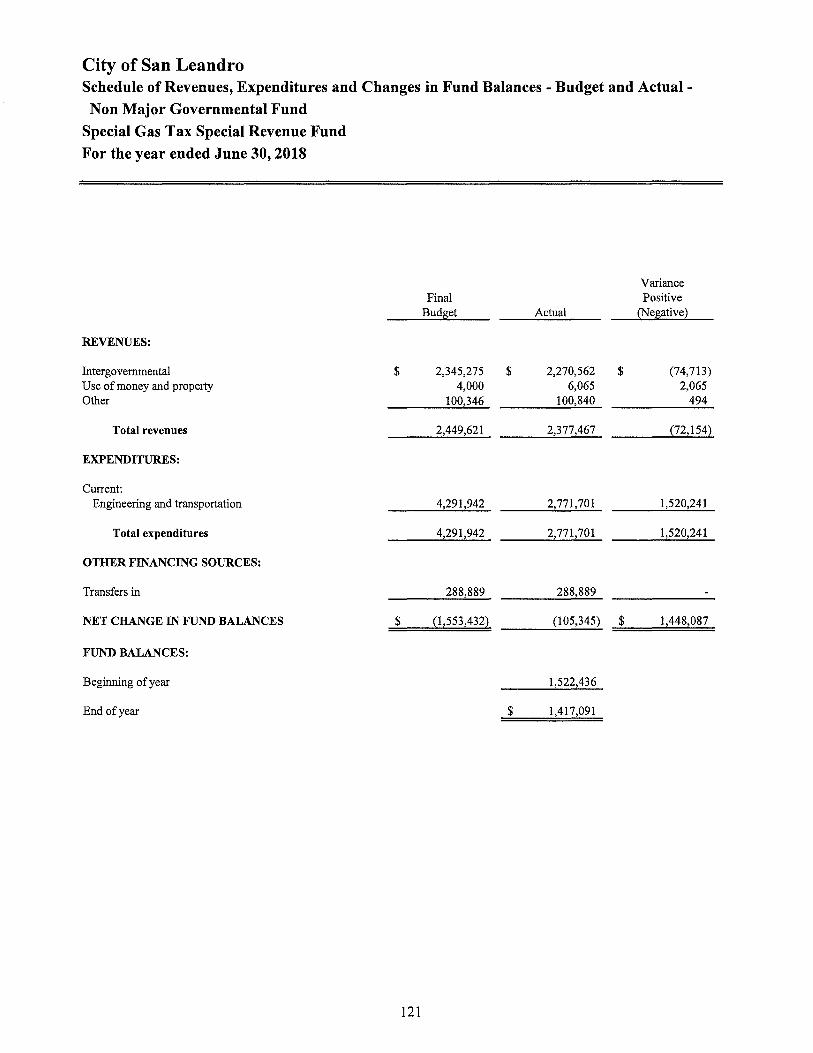
City of San Leandro Schedule of Revenues, Expenditures and Changes in Fund Balances - Budget and Actual -
Non Major Governmental Fund Special Gas Tax Special Revenue Fund
For the year ended June 30, 2018
Variance Final Positive
Bud!!;et Actual (Ne!l;ative}
REVENUES:
Intergovernmental $ 2,345,275 $ 2,270,562 $ (74,713) Use of money and property 4,000 6,065 2,065 Other 100,346 100,840 494
Total revenues 2,449,621 2,377,467 {72,154}
EXPENDITURES:
Current: Engineering and transportation 4,291,942 2,771,701 1,520,241
Total expenditures 4,291,942 2,771,701 1,520,241
OTHER FINANCING SOURCES:
Transfers in 288,889 288,889
NET CHANGE IN FUND BALANCES $ {1,553,432} (105,345) $ 1,448,087
FUND BALANCES:
Beginning of year 1,522,436
End of year $ 1,417,091
121

City of San Leandro Schedule of Revenues, Expenditures and Changes in Fund Balances - Budget and Actual -
Non Major Governmental Fund Cherrywood Maintenance District Special Revenue Fund
For the year ended June 30, 2018
Final
Budget
REVENUES:
Property and other taxes $ 23,300 Use of money and property 500
Total revenues 23,800
NET CHANGE IN FUND BALANCES $ 23,800
FUND BALANCES:
Beginning of year
End of year
122
Variance
Positive
Actual (Negative)
$ $ (23,300) 2,001 1,501
2,001 {21,799)
1,999 $ {21,801)
391,898
$ 393,897
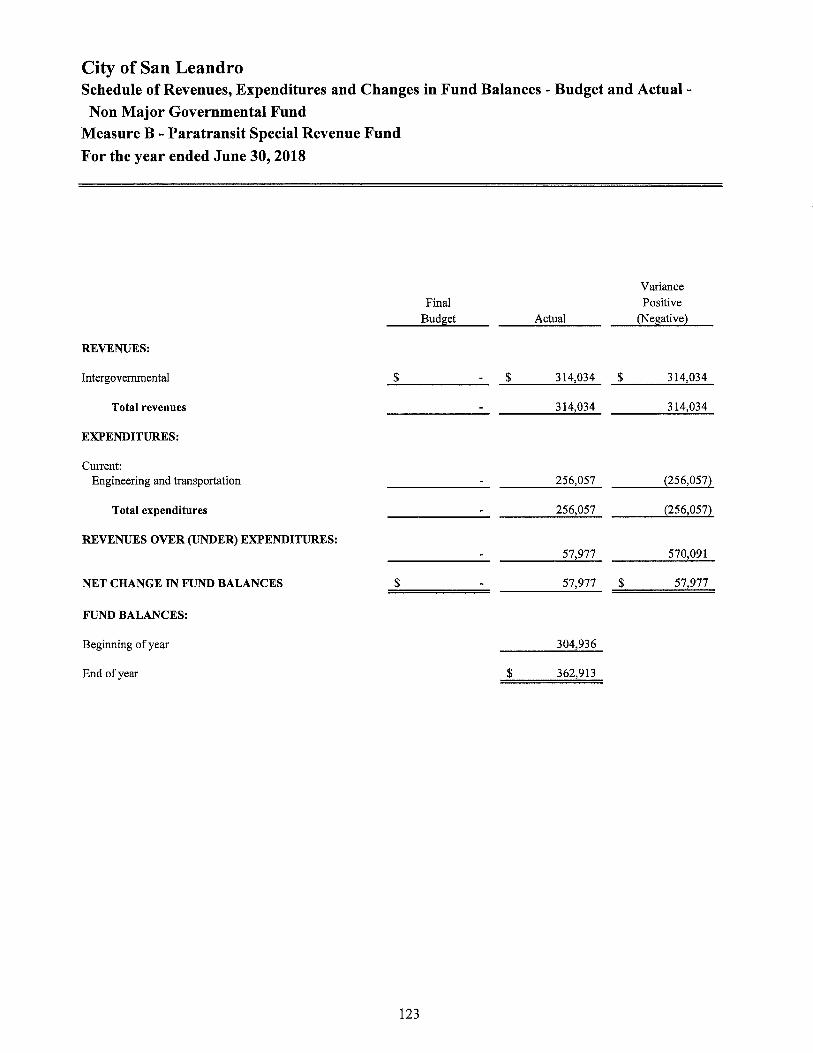
City of San Leandro Schedule of Revenues, Expenditures and Changes in Fund Balances - Budget and Actual -
Non Major Governmental Fund Measure B - Paratransit Special Revenue Fund
For the year ended June 30, 2018
REVENUES:
Intergovernmental $
Total revenues
EXPENDITURES:
Current: Engineering and transportation
Total expenditures
REVENUES OVER (UNDER) EXPENDITURES:
NET CHANGE IN FUND BALANCES $
FUND BALANCES:
Beginning of year
End of year
123
Final Budget
Variance Positive
Actual (Negative)
$ 314,034 $ 314,034
314,034 314,034
256,057 {256,057)
256,057 {256,057)
57,977 570,091
57,977 $ 57,977
304,936
$ 362,913

City of San Leandro Schedule of Revenues, Expenditures and Changes in Fund Balances - Budget and Actual -
Non Major Governmental Fund Asset Seizure Special Revenue Fund
For the year ended June 30, 2018
Variance Final Positive
Bud~et Actual (Ne~ative}
REVENUES:
Intergovernmental $ 270,000 $ 432,361 $ 162,361 Use of money and property 2,000 6,375 4,375
Total revenues 272,000 438,736 166,736
EXPENDITURES:
Current: Public safety 50,000 130,405 {80,405}
Total expenditures 50,000 130,405 {80,405}
NET CHANGE IN FUND BALANCES $ 222,000 308,331 $ 86,331
FUND BALANCES:
Beginning of year 762,170
End of year $ 1,070,501
124

City of San Leandro Schedule of Revenues, Expenditures and Changes in Fund Balances - Budget and Actual -
Non Major Governmental Fund Heron Bay Special Revenue Fund
For the year ended June 30, 2018
Variance
Final Positive
Budget Actual (Negative)
REVENUES:
Property and other taxes $ 350,000 $ 358,911 $ 8,911 Use of money and property 2,000 5,072 3,072
Total revenues 352,000 363,983 11,983
EXPENDITURES:
Current: Engineering and transportation 939,118 325,441 613,677
Debt service: Interest and fees 3,400 (3,400)
Total expenditures 939,118 328,841 610,277
NET CHANGE IN FUND BALANCES $ (587,118) 35,142 $ (622,260)
FUND BALANCES:
Beginning of year 926,151
End of year $ 961,293
125
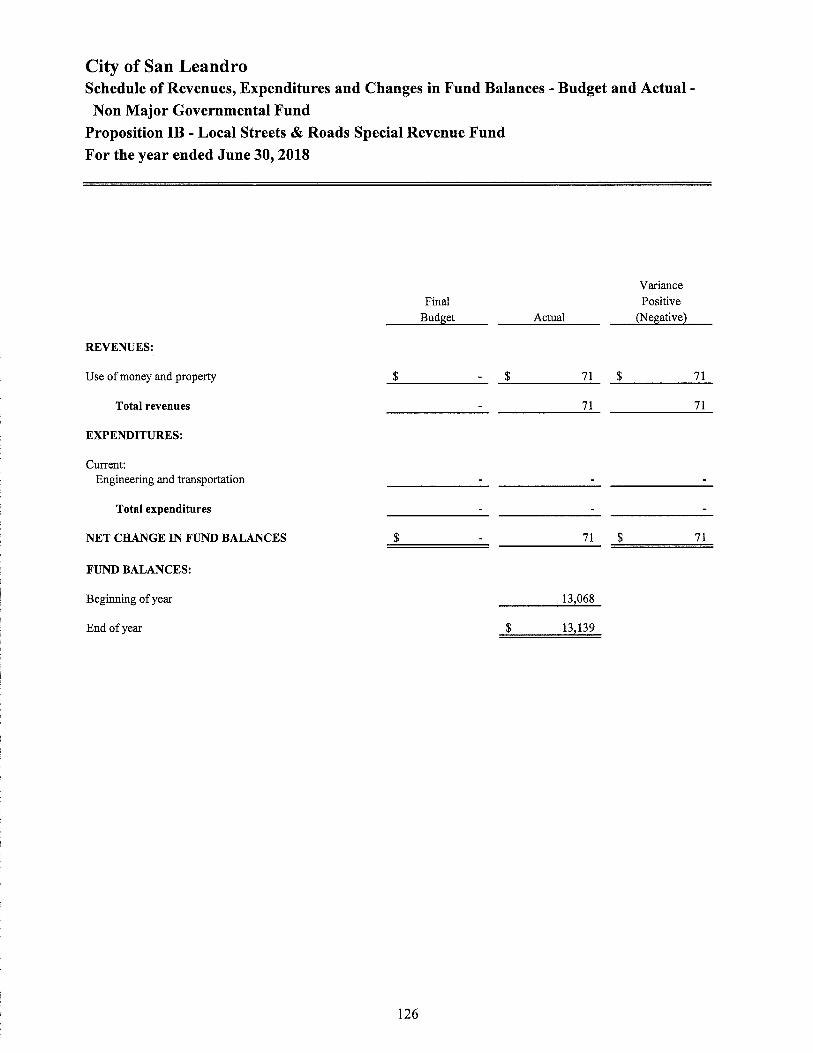
City of San Leandro Schedule of Revenues, Expenditures and Changes in Fund Balances - Budget and Actual -
Non Major Governmental Fund Proposition IB - Local Streets & Roads Special Revenue Fund
For the year ended June 30, 2018
Final
Budget
REVENUES:
Use of money and property $ $
Total revenues
EXPENDITURES:
Current: Engineering and transportation
Total expenditures
NET CHANGE IN FUND BALANCES $
FUND BALANCES:
Beginning of year
End of year $
126
Variance
Positive
Actual (Negative)
71 $ 71
71 71
71 $ 71
13,068
13,139
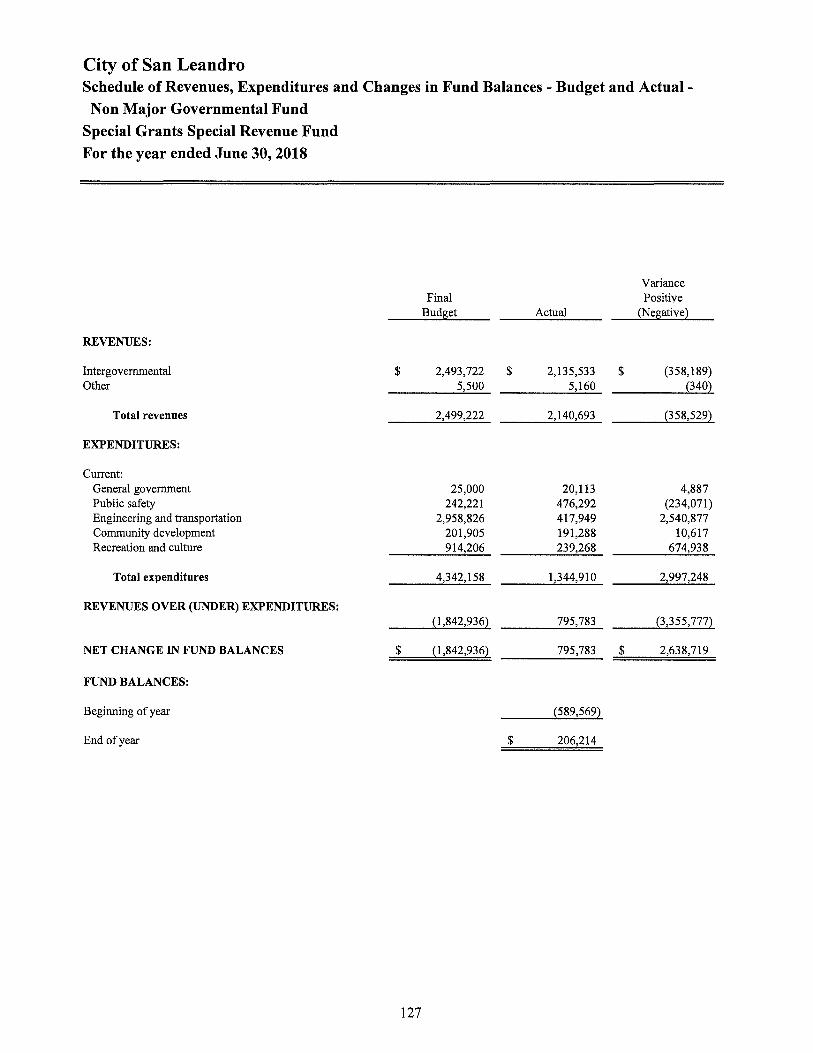
City of San Leandro Schedule of Revenues, Expenditures and Changes in Fund Balances - Budget and Actual -Non Major Governmental Fund
Special Grants Special Revenue Fund For the year ended June 30, 2018
Variance Final Positive
Bud!!;et Actual (Ne!l;ative)
REVENUES:
Intergovernmental $ 2,493,722 $ 2,135,533 $ (358,189) Other 5,500 5,160 (340)
Total revenues 2,499,222 2,140,693 (358,529)
EXPENDITURES:
Current: General government 25,000 20,113 4,887 Public safety 242,221 476,292 (234,071) Engineering and transportation 2,958,826 417,949 2,540,877 Community development 201,905 191,288 10,617 Recreation and culture 914,206 239,268 674,938
Total expenditures 4,342,158 1,344,910 2,997,248
REVENUES OVER (UNDER) EXPENDITURES: (1,842,936) 795,783 (3,355,777)
NET CHANGE IN FUND BALANCES $ (1,842,936) 795,783 $ 2,638,719
FUND BALANCES:
Beginning of year (589,569)
End of year $ 206,214
127
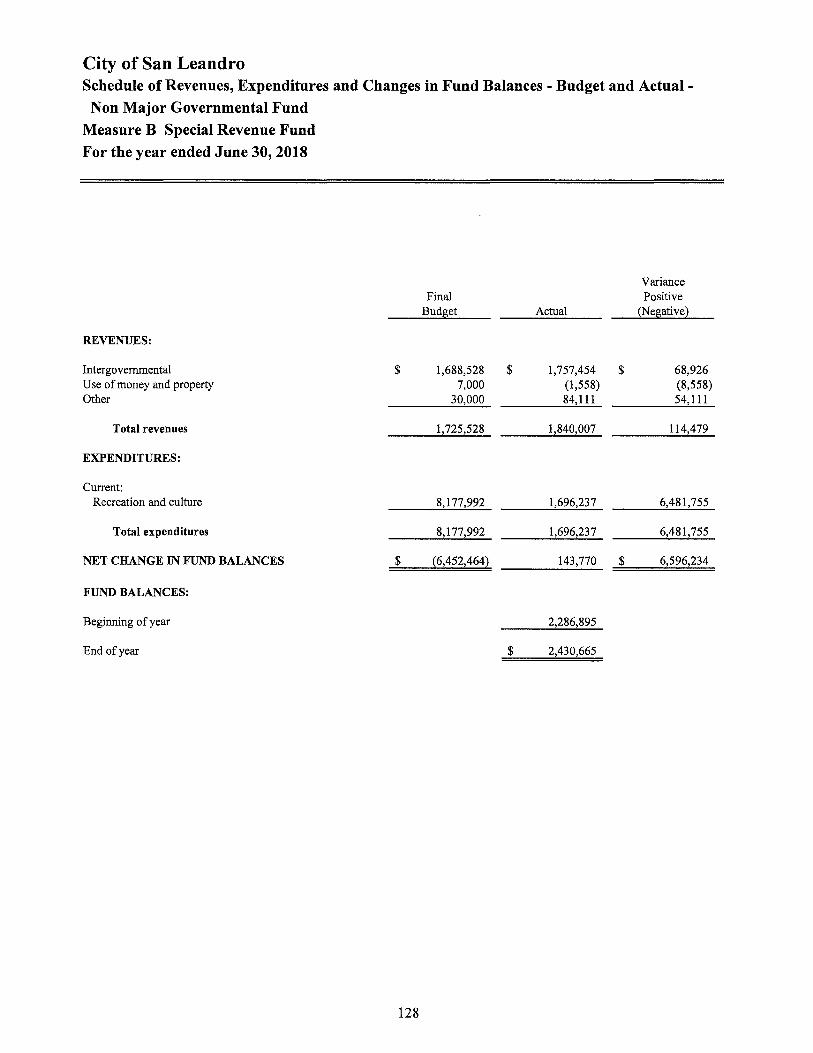
City of San Leandro Schedule of Revenues, Expenditures and Changes in Fund Balances - Budget and Actual -Non Major Governmental Fund
Measure B Special Revenue Fund For the year ended June 30, 2018
Variance Final Positive
Budliiet Actual (Neliiative2
REVENUES:
Intergovernmental $ 1,688,528 $ 1,757,454 $ 68,926 Use of money and property 7,000 (1,558) (8,558) Other 30,000 84,111 54,111
Total revenues 1,725,528 1,840,007 114,479
EXPENDITURES:
Current: Recreation and culture 8,177,992 1,696,237 6,481,755
Total expenditures 8,177,992 1,696,237 6,481,755
NET CHANGE IN FUND BALANCES $ {6,452,4642 143,770 $ 6,596,234
FUND BALANCES:
Beginning of year 2,286,895
End of year $ 2,430,665
128

City of San Leandro Schedule of Revenues, Expenditures and Changes in Fund Balances - Budget and Actual -
Non Major Governmental Fund Measure BB Special Revenue Fund
For the year ended June 30, 2018
Variance Final Positive
Budget Actual (Negative)
REVENUES:
Intergovernmental $ 7,494,852 $ 3,447,965 $ (4,046,887) Use of money and property 7,000 4,090 (2,910)
Total revenues 7,501,852 3,452,055 (4,049,797)
EXPENDITURES:
Current: Engineering and transportation 12,717,624 3,627,883 9,089,741
Total expenditures 12,717,624 3,627,883 9,089,741
NET CHANGE IN FUND BALANCES $ (5,215,772) (175,828) $ 5,039,944
FUND BALANCES:
Beginning of year 893,956
End of year $ 718,128
129
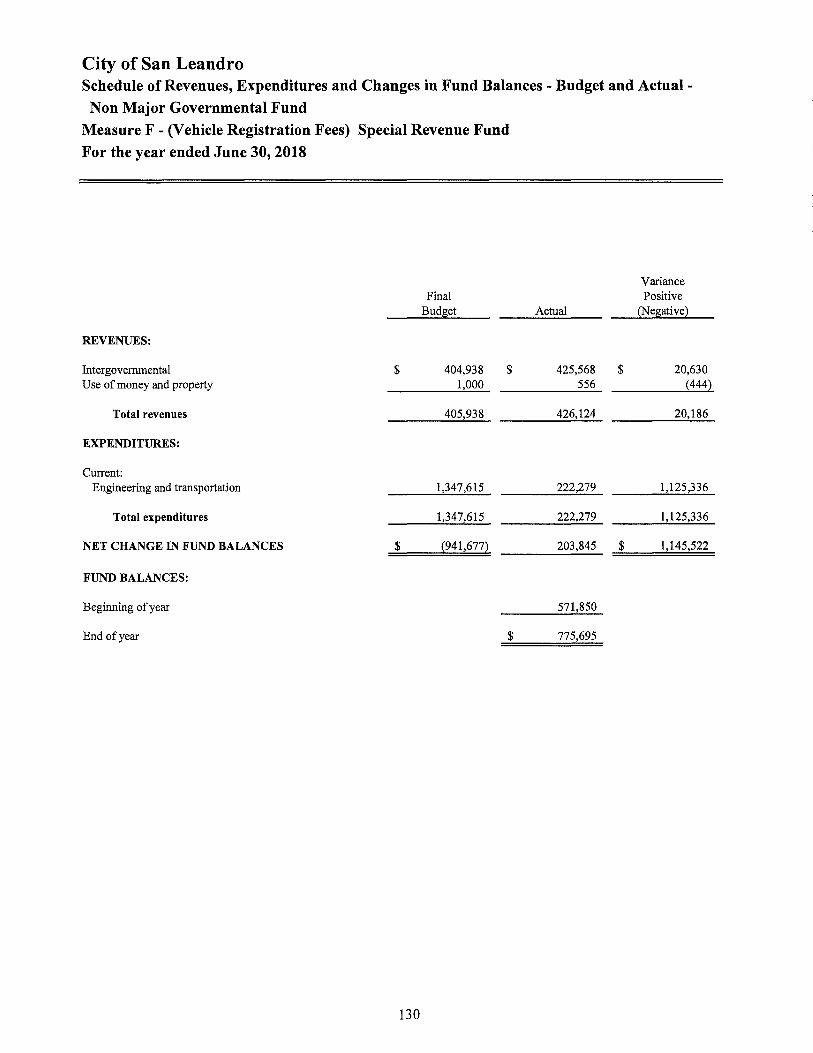
City of San Leandro Schedule of Revenues, Expenditures and Changes in Fund Balances - Budget and Actual -
Non Major Governmental Fund
Measure F - (Vehicle Registration Fees) Special Revenue Fund For the year ended June 30, 2018
Final Bud£1iet
REVENUES:
Intergovernmental $ 404,938 $ Use of money and property 1,000
Total revenues 405,938
EXPENDITURES:
Current: Engineering and transportation 1,347,615
Total expenditures 1,347,615
NET CHANGE IN FUND BALANCES $ (941,677)
FUND BALANCES:
Beginning of year
End of year $
130
Variance Positive
Actual (Ne£1iative)
425,568 $ 20,630 556 (444)
426,124 20,186
222,279 1,125,336
222,279 1,125,336
203,845 $ 1,145,522
571,850
775,695
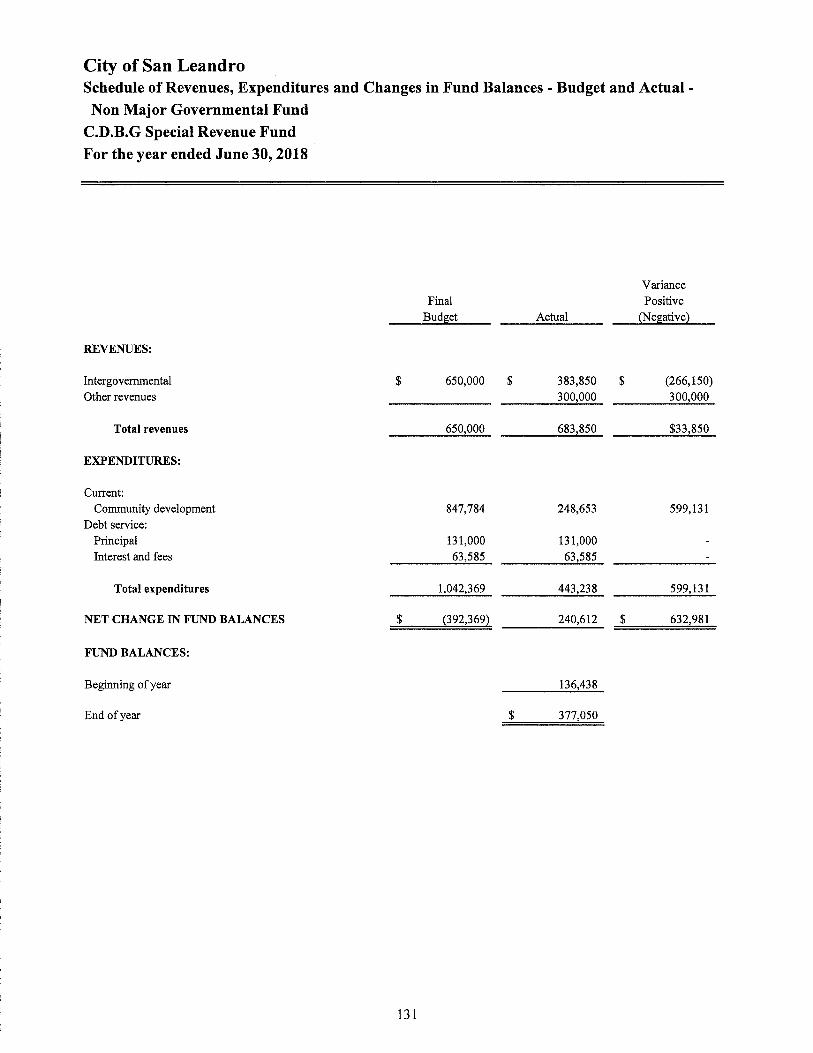
City of San Leandro Schedule of Revenues, Expenditures and Changes in Fund Balances - Budget and Actual -
Non Major Governmental Fund C.D.B.G Special Revenue Fund For the year ended June 30, 2018
Variance
Final Positive
Budget Actual (Negative)
REVENUES:
Intergovernmental $ 650,000 $ 383,850 $ (266,150)
Other revenues 300,000 300,000
Total revenues 650,000 683,850 $33,850
EXPENDITURES:
Current:
Community development 847,784 248,653 599,131
Debt service:
Principal 131,000 131,000
Interest and fees 63,585 63,585
Total expenditures 1,042,369 443,238 599,131
NET CHANGE IN FUND BALANCES $ (392,369) 240,612 $ 632,981
FUND BALANCES:
Beginning of year 136,438
End of year $ 377,050
131

City of San Leandro Schedule of Revenues, Expenditures and Changes in Fund Balances - Budget and Actual -
Non Major Governmental Fund HOME Special Revenue Fund
For the year ended June 30, 2018
Variance
Final Positive
Budget Actual (Negative)
REVENUES:
Intergovernmental $ 156,000 $ 270,983 $ 114,983
Use of money and property 1,000 2,270 1,270
Other 30,000 91,493 61,493
Total revenues 187,000 364,746 177,746
EXPENDITURES:
Current: Community development 22,952 9,160 13,792
Total expenditures 22,952 9,160 13,792
NET CHANGE IN FUND BALANCES $ 164,048 355,586 $ 191,538
FUND BALANCES:
Beginning of year 142,209
End of year $ 497,795
132

City of San Leandro Schedule of Revenues, Expenditures and Changes in Fund Balances - Budget and Actual -
Non Major Governmental Fund Housing In-Lieu Special Revenue Fund
For the year ended June 30, 2018
Variance Final Positive
Budget Actual (Negative)
REVENUES:
Licenses and grants $ $ 46,093 $ 46,093 Use of money and property 1,312 1,312
Total revenues 47,405 47,405
NET CHANGE IN FUND BALANCES $ 47,405 $ 47,405
FUND BALANCES:
Beginning of year 193,143
End of year $ 240,548
133

City of San Leandro Schedule of Revenues, Expenditures and Changes in Fund Balances - Budget and Actual -Non Major Governmental Fund
Business Improvement District Special Revenue Fund
For the year ended June 30, 2018
Final
Budget
REVENUES:
Licenses and permits $ 349,000
Intergovernmental 285,000 Use of money and property
Total revenues 634,000
EXPENDITURES:
Current: Community development 634,000
Total expenditures 634,000
OTHER FINANCING SOURCES:
Transfers in
NET CHANGE IN FUND BALANCES $
FUND BALANCES:
Beginning of year
End of year
134
Variance
Positive
Actual (Negative)
$ 400,381 $ 51,381
193,909 (91,091)
924 924
595,214 (38,786)
698,000 (64,000)
698,000 (64,000)
(102,786) $ (102,786)
227,958
$ 125,172

City of San Leandro Schedule of Revenues, Expenditures and Changes in Fund Balances - Budget and Actual -Non Major Governmental Fund
Public Education and Government Special Revenue Fund For the year ended June 30, 2018
Final Budget
REVENUES:
Property and other taxes $ 200,000 Use of money and property 450
Total revenues 200,450
EXPENDITURES:
Current: Community development 97,013
Total expenditures 97,013
NET CHANGE IN FUND BALANCES $ 103,437
FUND BALANCES:
Beginning of year
End of year
135
Variance Positive
Actual (Negative)
$ 223,966 $ 23,966 3,515 3,065
227,481 27,031
68,632 28,381
68,632 28,381
158,849 $ 55,412
604,475
$ 763,324

City of San Leandro Schedule of Revenues, Expenditures and Changes in Fund Balances - Budget and Actual -Non Major Governmental Fund
Special Assessment District Debt Service Fund
For the year ended June 30, 2018
REVENUES:
Property and other taxes $ Use of money and property
Total revenues
EXPENDITURES:
Debt service:
Interest and fees
Total expenditures
NET CHANGE IN FUND BALANCES $
FUND BALANCES:
Beginning of year
End of year
136
Final
Budget Actual
$
$
121
121
$
$
Variance
Positive
(Negative)

City of San Leandro Schedule of Revenues, Expenditures and Changes in Fund Balances - Budget and Actual -
Non Major Governmental Fund
San Leandro Public Financing Authority Debt Service Fund For the year ended June 30, 2018
Final
Budget
REVENUES:
Use of money and property $ 2,327,571
Total revenues 2,327,571
EXPENDITURES:
Debt service: Principal 1,506,000 Interest and fees 868,891
Total expenditures 2,374,891
OTHER FINANCING SOURCES:
Proceeds from issuance of debt Premium on issuance of debt
NET CHANGE IN FUND BALANCES $ (47,320)
FUND BALANCES:
Beginning of year
End of year
137
Variance Positive
Actual (Negative)
$ 2,370,320 $ 42,749
2,370,320 42,749
1,506,000 868,774 117
2,374,774 117
(2,130,092) (2,130,092) 2,130,092 2,130,092
(4,454) $ 42,866
755,367
$ 750,913
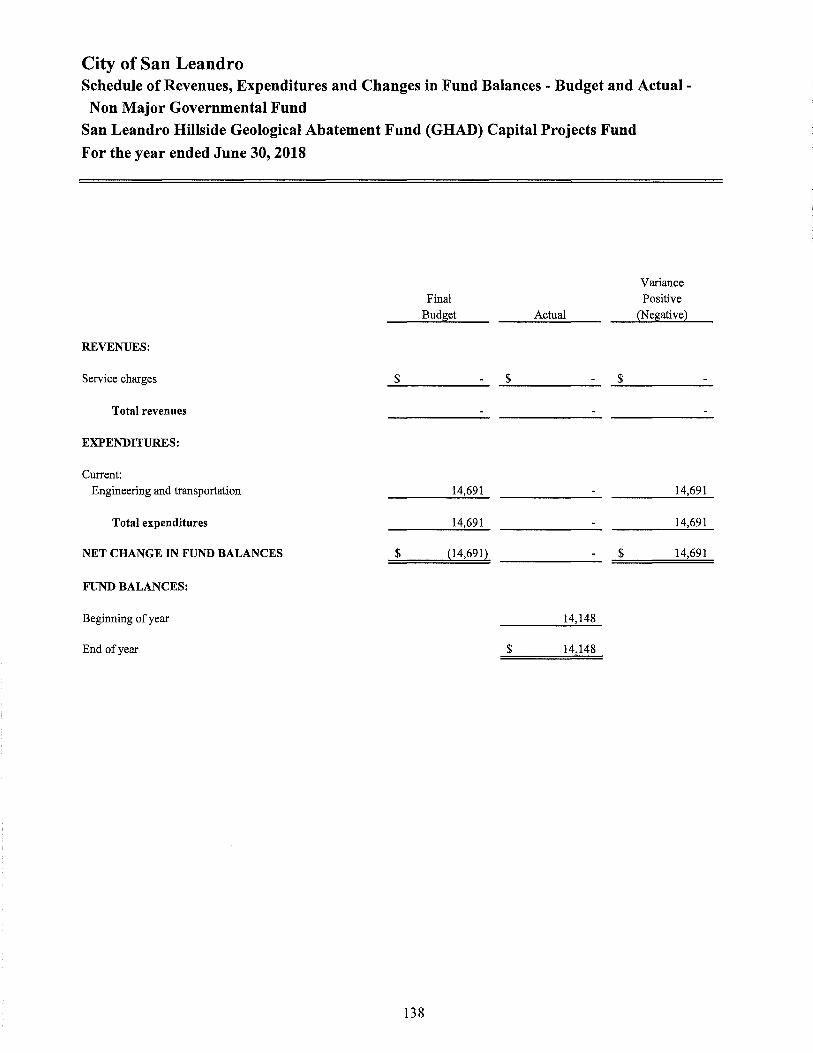
City of San Leandro Schedule of Revenues, Expenditures and Changes in Fund Balances - Budget and Actual -Non Major Governmental Fund
San Leandro Hillside Geological Abatement Fund (GHAD) Capital Projects Fund
For the year ended June 30, 2018
Final
Budget Actual
REVENUES:
Service charges $ $ $
Total revenues
EXPENDITURES:
Current: Engineering and transportation 14,691
Total expenditures 14,691
NET CHANGE IN FUND BALANCES $ {14,691) $
FUND BALANCES:
Beginning of year 14,148
End of year $ 14,148
138
Variance Positive
(Negative)
14,691
14,691
14,691

NON-MAJOR ENTERPRISE FUNDS
Storm Water Utility - Provides for the City's storm water program in conjunction with the National Pollutant Discharge and Emissions Services Act.
Environmental Services - Accounts for the regulation of hazardous materials, wastewater discharge, storm water runoff, solid waste and recycling, and the landfill at the Marina.
139

City of San Leandro Combining Statement of Net Position
Non-Major Enterprise Funds June 30, 2018
Total Non-Major
Storm Water Environmental Enterprise Utili~ Services Funds
ASSETS
Current Assets: Cash and investments $ $ 1,473,399 $ 1,473,399 Receivables:
Accounts 8,186 155,293 163,479 Interest 3,165 3,165
Total current assets 8,186 1,631,857 1,640,043
Noncurrent assets: Capital assets:
Depreciable 15,590 4,873 20,463 Less accumulated depreciation p51} {500} {651}
Total noncurrent assets 15,439 4,373 19,812
Total Assets 23,625 1,636,230 1,659,855
LIABILITIES
Current Liabilities: Accounts payable 8,948 17,238 26,186 Due to other funds 239,716 239,716 Compensated absences - due in one year 5,886 10,021 15,907
Total current liabilities 254,550 27,259 281,809
Non-current Liabilities: Compensated absences - due in more than one year 59,514 101,327 160,841
Total Liabilities 314,064 128,586 442,650
NET POSITION
Net investment in capital asset 15,439 4,373 19,812 Unrestricted {305,878} 1,503,271 1,197,393
Total Net Position $ {290,439} $ 1,507,644 $ 1,217,205
140

City of San Leandro Combining Statement of Revenues, Expenses, and Changes in Net Position Non-Major Enterprise Funds For the year ended June 30, 2018
Storm Water Environmental Utili~ Services
OPERA TING REVENUES Charges for services $ 1,053,829 $ 360,463 Licenses and permits 354,339 Other operating revenue 2,879 9,682
Total operating revenues 1,056,708 724,484
OPERATING EXPENSES Salaries and benefits 744,309 668,556 Contractual and other services 213,429 126,875 Material and supplies 38,818 28,073 Other operating costs 415,673 271,670 Depreciation 28 58
Total operating expenses 1,412,257 1,095,232
OPERATING INCOME (LOSS) (355,549) (370,748)
NONOPERATING REVENUES (EXPENSES): Investment income (14) 7,024 Intergovernmental 296,046
Total Nonoperating Revenues (Expenses) (14) 303,070
INCOME (LOSS) BEFORE TRANSFERS: p55,563) (67,678)
Transfers in 132,782
Change in net position (355,563) 65,104
NET POSITION:
Beginning of year 65,124 1,442,540
End of year $ (290,439) $ 1,507,644
141
Total Non-Major Enterprise
Funds
$ 1,414,292 354,339
12,561
1,781,192
1,412,865 340,304
66,891 687,343
86
2,507,489
(726,297)
7,010 296,046
303,056
(423,241)
132,782
(290,459)
1,507,664
$ 1,217,205

City of San Leandro Combining Statement of Cash Flows
Non-Major Enterprise Funds For the year ended June 30, 2018
Total Non-Major
Storm Water Environmental Enterprise Utili~ Services Funds
CASH FLOWS FROM OPERATING ACTIVITIES Cash received from customers $ 1,057,944 $ 631,288 $ 1,689,232 Cash received from other funds 239,716 239,716 Cash payments to suppliers and service providers (670,820) (453,802) (1,124,622) Cash payments to employees for services {730,276) {641,7822 {1,372,058)
Net cash provided (used) by operating activities {103,436) (464,2962 (567,7322
CASH FLOWS FROM NONCAPITAL FINANCING ACTIVITIES:
Intergovernmental revenue received 296,046 296,046 Transfers in from other funds 132,782 132,782
Net cash provided (used) by noncapital financing activities 428,828 428,828
CASH FLOWS FROM INVESTING ACTIVITIES: Change in market values of investments (14) (6,535) (6,549) Interest income 12,221 12,221
Net cash provided (used) by investing activities (142 5,686 5,672
Net increase (decrease) in cash and cash equivalents (103,4502 (29,7822 (133,232)
CASH AND CASH EQUIVALENTS:
Beginning of year 103,450 1,503,181 1,606,631
End of year $ $ 1,473,399 $ 1,473,399
RECONCILIATION OR OPERATING INCOME (LOSS) TO NET CASH PROVIDED (USED) BY OPERA TING ACTIVITIES:
Operating income (loss) $ (355,549) $ (370,748) $ (726,297) Depreciation 28 58 86
Adjustments to reconcile operating income (loss) to net cash provided (used) by operating activities: Changes in assets and liabilities: (Increase) decrease in accounts receivable 1,236 (93,196) (91,960) (Decrease) increase in accounts payable (2,900) (27,184) (30,084) (Decrease) increase due to other funds 239,716 239,716 (Decrease) increase in compensated absences 14,033 26,774 40,807
Total adjustments (103,4362 (464,2962 (567,7322
Net cash provided (used) by operating activities $ (103,4362 $ (464,2962 $ (567,732)
142

INTERNAL SERVICE FUNDS
Internal Service Funds are used to account for special activities and services performed by a designated City department for other departments on a cost reimbursement basis.
Building Maintenance - This fund accounts for the City's custodial maintenance and minor building modifications performed on various City complexes. The source of revenue is reimbursement of costs for services performed to the departments.
Information Management Services - The fund accounts for centralized data processing and the maintenance, acquisition and replacement of computerized systems. Sources of revenue for this fund are reimbursement of costs for services and equipment purchased by other departments.
Self Insurance - This fund accounts for the administration of the City's self-insurance programs, payment of worker's compensation and liability claims payments.
Equipment Maintenance - This fund accounts for the maintenance and replacement of vehicles and equipment used by all City departments. Source of revenues for this fund is reimbursement of costs for services and supplies purchased by other departments.
143

City of San Leandro Combining Statement of Net Position Internal Service Funds
June 30, 2018
Information Building Management Self- Equipment
Maintenance Services Insurance Maintenance Total
ASSETS Cash and investments $ 2,573,203 $ 1,639,808 $ 8,801,467 $ 1,236,271 $ 14,250,749 Receivables:
Accounts 85 300 385 Interest 5,713 3,144 20,249 1,838 30,944
Inventory 38,576 15,192 147,035 200,803
Total current assets 2,617,577 1,658,444 8,821,716 1,385,144 14,482,881
Capital assets: Depreciable 62,563 5,856,840 10,746,710 16,666,113 Less accumulated depreciation (13,948) (5,780,258) (5,863,795) (11,658,001)
Total Net capital assets 48,615 76,582 4,882,915 5,008,112
Total noncurrent assets 48,615 76,582 4,882,915 5,008,112
Total Assets 2,666,192 1,735,026 8,821,716 6,268,059 19,490,993
LIABILITIES
Current Liabilities:
Accounts payable 242,751 80,745 37,429 507,491 868,416 Other liabilities 66,369 66,369 Claims and judgments - due in one year 1,170,645 1,170,645 Compensated absences payable - due in one year 4,677 8,592 651 1,138 15,058
Total current liabilities 247,428 89,337 1,275,094 508,629 2,120,488
Noncurrent Liabilities: Claims and judgments - due in more than one year 5,427,699. 5,427,699 Compensated absences - due in more than one year 47,294 86,870 6,581 11,505 152,250
Total noncurrent liabilities 47,294 86,870 5,434,280 11,505 5,579,949
Total Liabilities 294,722 176,207 6,709,374 520,134 7,700,437
NET POSITION
Net investment in capital assets 48,615 76,582 4,882,915 5,008,112 Unrestricted 2,322,855 1,482,237 2,112,342 865,010 6,782,444
Total Net Position $ 2,371,470 $ 1,558,819 $ 2,112,342 $ 5,747,925 $ 11,790,556
144
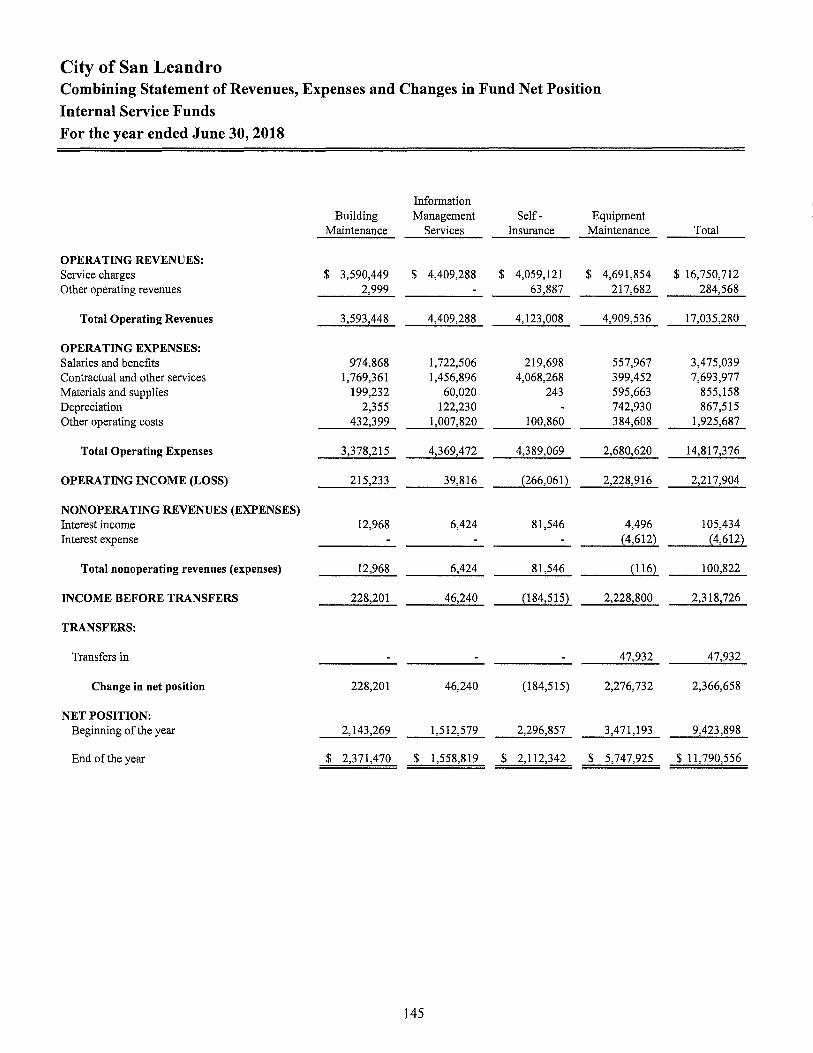
City of San Leandro Combining Statement of Revenues, Expenses and Changes in Fund Net Position
Internal Service Funds
For the year ended June 30, 2018
Information Building Management Self- Equipment
Maintenance Services Insurance Maintenance
OPERATING REVENUES: Service charges $ 3,590,449 $ 4,409,288 $ 4,059,121 $ 4,691,854 Other operating revenues 2,999 63,887 217,682
Total Operating Revenues 3,593,448 4,409,288 4,123,008 4,909,536
OPERATING EXPENSES: Salaries and benefits 974,868 1,722,506 219,698 557,967 Contractual and other services 1,769,361 1,456,896 4,068,268 399,452 Materials and supplies 199,232 60,020 243 595,663 Depreciation 2,355 122,230 742,930 Other operating costs 432,399 1,007,820 100,860 384,608
Total Operating Expenses 3,378,215 4,369,472 4,389,069 2,680,620
OPERATING INCOME (LOSS) 215,233 39,816 (266,061) 2,228,916
NONOPERATING REVENUES (EXPENSES) Interest income 12,968 6,424 81,546 4,496 Interest expense (4,612)
Total nonoperating revenues (expenses) 12,968 6,424 81,546 (116)
INCOME BEFORE TRANSFERS 228,201 46,240 (184,515) 2,228,800
TRANSFERS:
Transfers in 47,932
Change in net position 228,201 46,240 (184,515) 2,276,732
NET POSITION: Beginning of the year 2,143,269 1,512,579 2,296,857 3,471,193
End of the year $ 2,371,470 $ 1,558,819 $ 2,112,342 $ 5,747,925
145
Total
$ 16,750,712 284,568
17,035,280
3,475,039 7,693,977
855,158 867,515
1,925,687
14,817,376
2,217,904
105,434 (4,612)
100,822
2,318,726
47,932
2,366,658
9,423,898
$ 11,790,556
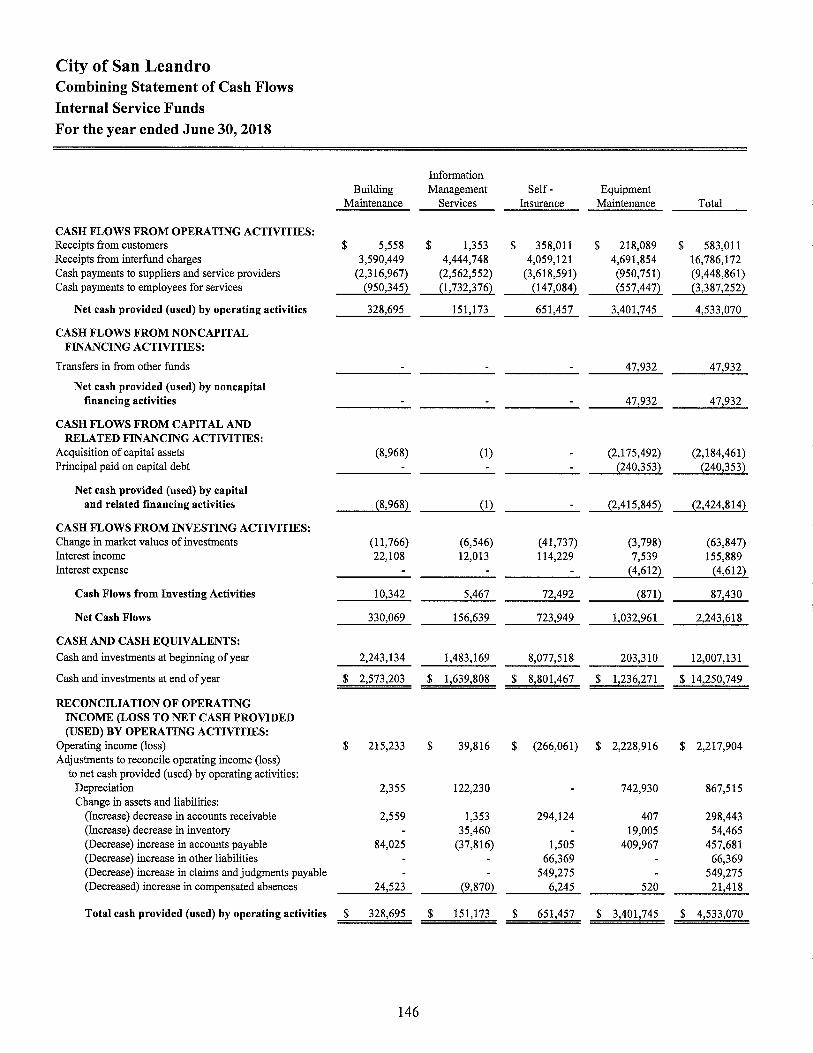
City of San Leandro Combining Statement of Cash Flows Internal Service Funds For the year ended June 30, 2018
Information Building Management Self- Equipment
Maintenance Services Insurance Maintenance Total
CASH FLOWS FROM OPERATING ACTIVITIES: Receipts from customers $ 5,558 $ 1,353 $ 358,011 $ 218,089 $ 583,011 Receipts from interfund charges 3,590,449 4,444,748 4,059,121 4,691,854 16,786,172 Cash payments to suppliers and service providers (2,316,967) (2,562,552) (3,618,591) (950,751) (9,448,861) Cash payments to employees for services {950,3452 {1,732,3762 {147,084} {557,4472 (3,387,2522
Net cash provided (used) by operating activities 328,695 151,173 651,457 3,401,745 4,533,070
CASH FLOWS FROM NONCAPITAL FINANCING ACTIVITIES:
Transfers in from other funds 47,932 47,932
Net cash provided (used) by noncapital financing activities 47,932 47,932
CASH FLOWS FROM CAPITAL AND RELATED FINANCING ACTIVITIES:
Acquisition of capital assets (8,968) (1) (2,175,492) (2,184,461) Principal paid on capital debt {240,3532 {240,353}
Net cash provided (used) by capital and related financing activities {8,9682 {12 {2,415,845} {2,424,8142
CASH FLOWS FROM INVESTING ACTIVITIES: Change in market values of investments (11,766) (6,546) (41,737) (3,798) (63,847) Interest income 22,108 12,013 114,229 7,539 155,889 Interest expense {4,6122 {4,6122
Cash Flows from Investing Activities 10,342 5,467 72,492 {8712 87,430
Net Cash Flows 330,069 156,639 723,949 1,032,961 2,243,618
CASH AND CASH EQUIVALENTS:
Cash and investments at beginning of year 2,243,134 1,483,169 8,077,518 203,310 12,007,131
Cash and investments at end of year $ 2,573,203 $ 1,639,808 $ 8,801,467 $ 1,236,271 $ 14,250,749
RECONCILIATION OF OPERATING INCOME (LOSS TO NET CASH PROVIDED (USED) BY OPERATING ACTIVITIES:
Operating income (loss) $ 215,233 $ 39,816 $ (266,061) $ 2,228,916 $ 2,217,904 Adjustments to reconcile operating income (loss)
to net cash provided (used) by operating activities: Depreciation 2,355 122,230 742,930 867,515 Change in assets and liabilities:
(Increase) decrease in accounts receivable 2,559 1,353 294,124 407 298,443 (Increase) decrease in inventory 35,460 19,005 54,465 (Decrease) increase in accounts payable 84,025 (37,816) 1,505 409,967 457,681 (Decrease) increase in other liabilities 66,369 66,369 (Decrease) increase in claims and judgments payable 549,275 549,275 (Decreased) increase in compensated absences 24,523 {9,870} 6,245 520 21,418
Total cash provided (used) by operating activities $ 328,695 $ 151,173 $ 651,457 $ 3,401,745 $ 4,533,070
146

FIDUCIARY FUND FINANCIAL STATEMENTS
AGENCY FUNDS
Deposits Fund - Accounts for all deposits held on behalf of other persons and businesses under the control of City departments.
Cherrywood - Accounts for monies accumulated for payments of special assessment bonds which are financed by assessments placed on the Alameda County tax roll for the Cherrywood housing development.
147
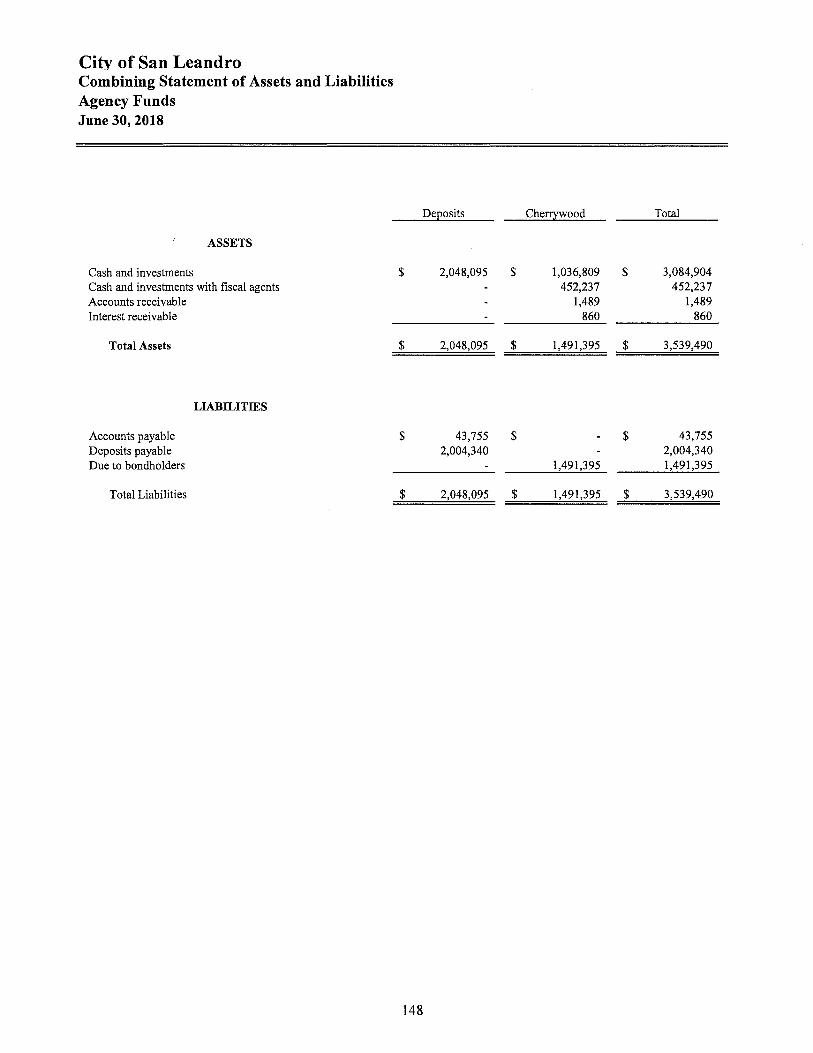
City of San Leandro Combining Statement of Assets and Liabilities Agency Funds June 30, 2018
ASSETS
Cash and investments Cash and investments with fiscal agents Accounts receivable Interest receivable
Total Assets
LIABILITIES
Accounts payable Deposits payable Due to bondholders
Total Liabilities
Deposits
$ 2,048,095
$ 2,048,095
$ 43,755 2,004,340
$ 2,048,095
148
Cherrywood Total
$ 1,036,809 $ 3,084,904 452,237 452,237
1,489 1,489 860 860
$ 1,491,395 $ 3,539,490
$ $ 43,755 2,004,340
1,491,395 1,491,395
$ 1,491,395 $ 3,539,490

City of San Leandro Combining Statement of Changes in Assets and Liabilities
Agency Funds
For the year ended June 30, 2018
Balance Balance Jul;y 1, 2017 Additions Deductions June 30, 2018
Deposits
Assets: Cash and investments $ 1,878,236 $ 290,107 $ 120,248 $ 2,048,095 Accounts receivable 7,013 7,013
Total assets $ 1,885,249 $ 290,107 $ 127,261 $ 2,048,095
Liabilities: Accounts payable $ 120,248 $ 43,755 $ 120,248 $ 43,755 Deposits payable 1,765,001 246,352 7,013 2,004,340
Total liabilities $ 1,885,249 $ 290,107 $ 127,261 $ 2,048,095
Cherrywood
Assets: Cash and investments $ 1,022,443 $ 14,366 $ $ 1,036,809 Cash and investments with fiscal agent 449,160 3,077 452,237 Accounts receivable 2,070 1,489 2,070 1,489 Interest receivable 522 860 522 860
Total assets $ 1,474,195 $ 19,792 $ 2,592 $ 1,491,395
Liabilities: Due to bondholders $ 1,474,195 $ 19,792 $ 2,592 $ 1,491,395
Total liabilities $ 1,474,195 $ 19,792 $ 2,592 $ 1,491,395
All Agency Funds
Assets: Cash and investments $ 2,900,679 $ 304,473 $ 120,248 $ 3,084,904 Cash and investments with fiscal agent 449,160 3,077 452,237 Accounts receivable 9,083 1,489 9,083 1,489 Interest receivable 522 860 522 860
Total assets $ 3,359,444 $ 309,899 $ 129,853 $ 3,539,490
Liabilities: Accounts payable $ 120,248 $ 43,755 $ 120,248 $ 43,755 Deposits payable 1,765,001 246,352 7,013 2,004,340 Due to bondholders 1,474,195 19,792 2,592 1,491,395
Total liabilities $ 3,359,444 $ 309,899 $ 129,853 $ 3,539,490
149

STATISTICAL SECTION
This section of the City of San Leandra's comprehensive annual financial report presents detailed information as a context for understanding what the information in the financial statements, note disclosures, and required supplementary information says about the city's overall financial health.
Contents
Financial Trends
These schedules contain trend information to help the reader understand how the city's financial performance and well-being have changed over time.
Revenue Capacity
These schedules contain information to help the reader assess the city's most significant local revenue sources, sales tax and property tax.
Debt Capacity
These schedules present information to help the reader assess the affordability of the city's current levels of outstanding debt and the city's ability to issue additional debt in the future.
Demographic and Economic Information
These schedules offer demographic and economic indicators to help the reader understand the environment within which the city's financial activities take place.
Operating Information
These schedules contain service and infrastructure data to help the reader understand how the information in the city's financial report relates to the services the city provides and the activities it performs.
151
153
161
171
177
181

FINANCIAL TRENDS
These schedules contain trend information to help the reader understand how the city's financial performance and well-being have changed over time.
Net Position by Component Unit - Last Ten Fiscal Years
Changes in Net Position - Last Ten Fiscal Years
Program Revenues by Function / Program - Last Ten Fiscal Years
Fund Balances of Governmental Funds - Last Ten Fiscal Years
General Governmental Revenues by Source - Last Ten Fiscal Years
Changes in Fund Balance of Governmental Funds - Last Ten Fiscal Years
153
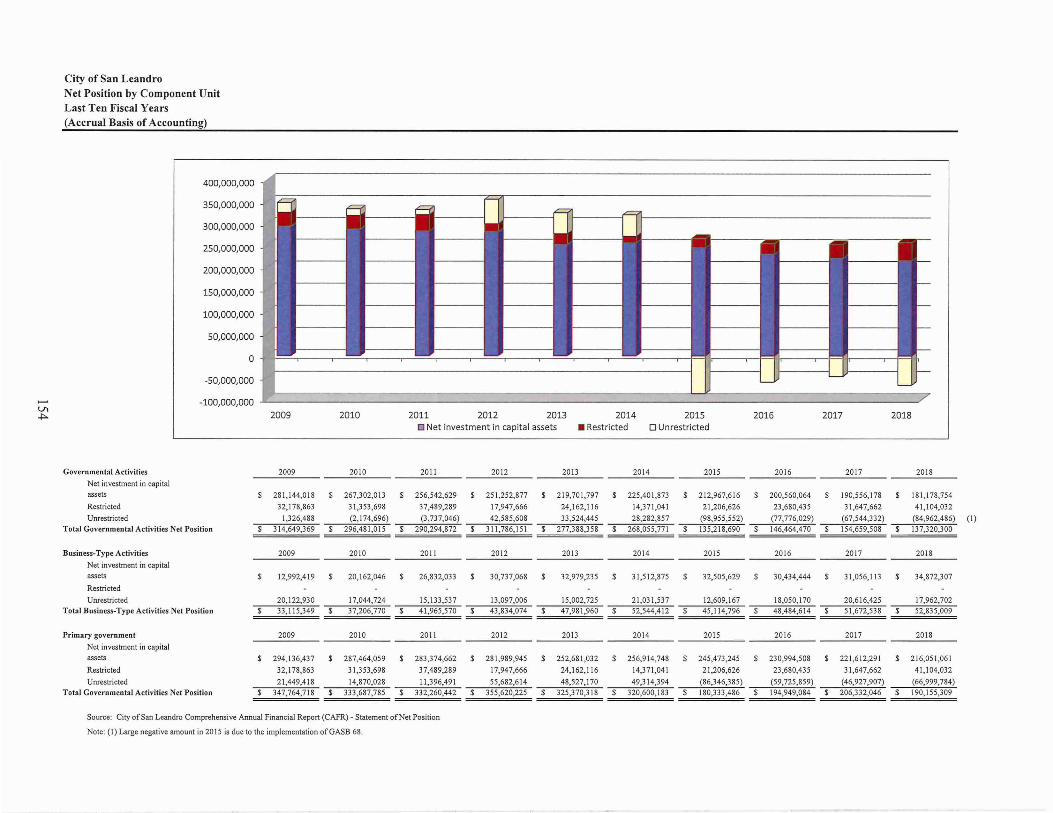
....... V, .j:s.
City of San Leandro Net Position by Component Unit Last Ten Fiscal Years (Accrual Basis of Accounting)
400,000,000
350,000,000
300,000,000
250,000,000
200,000,000
150,000,000
100,000,000
50,000,000
0
-50,000,000
-100,000,000 2009 2010 2011 2012 2013
• Net investment in capital assets 2014
• Restricted 2015
D Unrestricted
Governmental Activities 2009 2010 2011 2012 2013 2014 2015
Net investment in capital assets $ 281,144,018 $ 267,302,013 $ 256,542,629 $ 251,252,877 $ 219,701,797 $ 225,401 ,873 $ 212,967,616
Restricted 32, 178,863 31,353 ,698 37,489,289 17,947,666 24,162,116 14,371,041 21,206,626
Unrestricted 1,326,488 (2,174,696) (3,737,046) 42,585,608 33,524,445 28,282,857 (98,955,552) Total Governmental Activities Net Position $ 314,649,369 $ 296,481,015 $ 290,294,872 $ 311,786, 151 $ 277,388,358 $ 268,055,771 $ 135,218,690
Business-Type Activities 2009 2010 2011 2012 2013 2014 2015
Net investment in capital assets $ 12,992,419 $ 20,162,046 $ 26,832,033 $ 30,737,068 $ 32,979,235 $ 31 ,512,875 $ 32,505,629
Restricted
Unrestricted 20, 122,930 17,044,724 15,133,537 13 ,097,006 15,002,725 21 ,031 ,537 12,609,167 Total Business-Type Activities Net Position $ 33, 115,349 $ 37,206,770 $ 41,965,570 $ 43,834,074 $ 47,981,960 $ 52,544,412 $ 45,114,796
Primary government 2009 2010 2011 2012 2013 2014 2015
Net investment in capital assets $ 294,136,437 $ 287,464,059 $ 283 ,374,662 $ 281,989,945 $ 252,681,032 $ 256,914,748 $ 245,473,245
Restricted 32, 178,863 31,353,698 37,489,289 17,947,666 24,162,116 14,371,041 21,206,626
Unrestricted 21 ,449,418 14,870,028 11,396,491 55,682,614 48,527,170 49,314,394 (86,346,385) Total Governmental Activities Net Position $ 347,764,718 $ 333,687,785 $ 332,260,442 $ 355,620,225 $ 325,370,318 $ 320,600,183 $ 180,333,486
Source: City of San Leandro Comprehensive Annual Financial Report (CAFR) - Statement of Net Position
Note: ( I) Large negative amount in 2015 is due to the implementation of GASB 68.
2016 2017 2018
2016 2017 2018
$ 200,560,064 $ 190,556,1 78 $ 181,178,754
23,680,435 31,647,662 41,104,032
(77,776,029) (67,544,332) (84,962,486) (1) $ 146,464,470 $ 154,659,508 $ 137,320,300
2016 2017 2018
$ 30,434,444 $ 31,056,113 $ 34,872,307
18,050,170 20,616,425 17,962,702 $ 48,484,614 $ 51,672,538 $ 52,835,009
2016 2017 2018
$ 230,994,508 $ 221,612,291 $ 216,051 ,061
23,680,435 31,647,662 41 ,104,032
(59,725,859) (46,927,907) (66,999,784) $ 194,949,084 $ 206,332,046 $ 190,155,309

City of San Leandro Changes in Net Position Last Ten Fiscal Years (accrual basis of accounting)
Expenses: 2009 2010 2011 2012 2013 2014 2015 2016 ______1Q!7 2018
Governmental activities: General government $ 16,572,072 $ 11,989,774 $ 10,759,754 $ 10,238,787 $ 13,166,855 $ 11,609,391 $ 10,896,679 $ 7,923,300 $ 8,524,377 $ 13,658,584 Public safety 44,229,183 45,063,334 45,936,832 43,574,011 45,465,294 47,180,237 47,989,126 52,944,433 54,510,194 64,971,782 Engineering & Transportation 15,101,806 18,209,182 22,720,292 23,903,746 25,662,305 31,712,176 30,566,925 31,476,280 28,124,152 32,933,260 Recreation & Culture 11,416,088 9,906,448 11,042,582 9,894,015 11,586,223 11,786,787 11,667,158 13,824,385 13,228,291 14,756,277 Community Development 28,119,209 24,202,918 17,541,521 8,178,377 4,904,402 5,389,381 5,704,907 6,840,393 8,134,895 10,216,834 Interest on long-term debt 5,349,826 4,525,710 4,182,409 2,317,753 2,548,119 2,097,257 2,156,400 1,764,322 2,218,025 1,677,316 Total governmental activities expenses 120,788,184 113,897,366 112,183,390 98,106,689 103,333,198 109,775,229 108,981,195 114,773,113 114,739,934 138,214,053
Business-type activities: Water PoUution Control 9,248,677 6,231,639 5,856,452 8,395,692 7,499,555 7,978,058 8,802,564 13,534,488 10,795,950 12,184,473 Shoreline 2,244,002 2,180,794 1,997,753 1,848,428 1,861,532 1,922,489 1,691,932 1,839,667 1,754,842 1,786,193 Storm Water Utility 993,330 886,379 844,604 919,998 978,816 1,078,252 1,105,054 1,212,469 1,106,011 1,412,257 Environmental Services 1,544,564 1,348,181 1,333,145 1,222,543 1,175,257 1,027,054 1,020,388 1,189,985 1,065,885 1,095,232
Total business-type activities expenses 14,030,573 10,646,993 10,031,954 12,386,661 11,515,160 12,005,853 12,619,938 17,776,609 14,722,688 16,478,155
Total primary government expenses 134,818,757 124,544,359 122,215,344 110,493,350 114,848,358 121,781,082 121,601,133 132,549,722 129,462,622 154,692,208
Program revenues: Governmental activities:
General government Property taxes 27,654,817 27,087,224 26,720,790 22,357,186 17,631,582 18,514,127 18,898,038 20,044,219 20,858,027 22,994,212 Sales taxes 19,095,799 17,594,934 21,811,494 24,126,105 26,304,583 29,097,614 32,948,155 42,336,643 41,727,835 42,990,223 Franchise Fees 4,125,705 4,005,464 4,124,846 4,231,420 4,444,251 4,581,920 4,845,086 4,968,614 5,102,904 5,269,391 Utility Users Tax 10,103,090 9,783,055 9,932,893 9,968,546 9,888,123 10,157,762 10,359,050 10,807,581 10,975,234 10,719,315 - Property Transfer Tax 2,870,441 2,297,145 2,528,604 2,981,685 2,956,419 3,282,026 4,112,030 4,460,568 5,459,316 5,176,403
VI 911 Communication Access Tax 2,711,671 2,694,149 2,684,591 2,723,255 2,804,181 2,974,313 2,917,993 2,890,302 3,035,256 VI
Other taxes 294,496 333,079 381,122 555,988 591,016 652,866 733,867 811,619 907,651 1,008,115 Motors Vehicle License Fees 278,615 242,416 506,280 42,294 44,112 36,768 35,936 Investment 3,025,658 1,419,378 1,300,123 1,098,406 919,213 1,255,043 1,191,893 1,882,764 1,560,277 1,691,972 Community Impact Reimbursement 3,100,000 Miscellaneous 1,597,574 599,189 1,158,044 988,126 962,356 514,851 825,082 4,225,123 1,702,501 5,426,862 Gain on sale of assets 20,914 3,353 393,741.00 16,196 6,902 7,060 3,004 1,020,970 Transfers 85,874 (67,942) 240,484 234,349 (72,135) 25,000 187,921 Charges for Service 15,971,619 12,568,443 17,062,792 12,200,726 13,735,756 14,989,867 16,063,276 16,552,308 16,956,990 18,674,955 Capital grants and contributions 8,590,057 10,830,576 6,581,532 11,416,356 7,216,114 10,009,842 10,516,591 11,421,781 9,456,976 9,394,883 Operating grants and contributions 3,490,973 4,224,429 3,783,171 5,585,461 5,672,929 4,529,539 8,038,949 5,557,620 5,333,955 6,579,225
Total Governmental activities program revenues 97,184,718 96,729,061 98,847,238 98,474,592 93,411,315 100,442,602 111,549,168 126,018,893 122,934,972 134,169,703
Business-type activities: Charges for services 14,275,135 13,716,608 14,267,658 14,895,604 14,813,211 15,635,395 16,878,752 15,991,142 16,858,465 16,368,849 Capital Grants and Contributions 243,304 369,087
Other taxes 296,184 233,880 257,977 323,430 360,246 417,231 477,190 520,321 629,411 806,392 Investment Earnings 928,796 454,893 167,407 141,980 209,659 264,904 259,724 425,834 179,432 284,219 Miscellaneous 532,897 265,091 338,196 418,969 207,795 250,775 268,689 4,234,130 Gain or loss on sale of assets (1,290,470) Transfers (85,874) 67,942 (240,484) (234,349) 72,135 (25,000) (187,921)
Total Business activities program revenues 15,947,138 14,738,414 14,790,754 14,255,164 15,663,046 16,568,305 17,884,355 21,146,427 17,910,612 17,640,626
Total primary government program revenues 113,131,856 111,467,475 113,637,992 112,729,756 109,074,361 1 I 7,010,907 129,433,523 147,165,320 140,845,584 151,810,329
Extraordinary Items 21,123,375 Net revenues (expenses):
Governmental Activities (23,603,466) (17,168,305) (13,336,152) 367,903 (9,921,883) (9,332,627) 2,567,973 11,245,780 8,195,038 (4,044,350) Business-type activities 1,916,565 4,091,421 4,758,800 1,868,503 4,147,886 4,562,452 5,264,417 3,369,818 3,187,924 1,162,471
Total net revenues (expenses) $ (21,686,901) $ (13,076,884) $ (8,577,352) $ 2,236,406 $ (5,773,997) $ (4,770,175) $ 7,832,390 $ 14,615,598 $ 11,382,962 $ (2,881,879)
Source: City of San Leandro Comprehensive Annual Financial Report (CAFR) - Statement of Activities

-Vt 0\
City of San Leandro Program Revenues by Function/ Program Last Ten Fiscal Years (Accrual Basis of Accounting)
Program/ Function
Governmental Activities:
General Government $
Public Safety
Engineering and transportation
Recreation and culture
Community development
Interest on long-term debt Subtotal governmental activities $
Business-Type Activities
Water Pollution Control Plant $
Shoreline
Storm Water Utility
Environmental Services Subtotal business-type activities $
Total primary government $
2009 2010
4,871,544 $ 5,342,619 $
5,111,223 3,475,388
11,376,411 13,195,059
3,414,103 3,614,696
3,279,368 1,995,686
5,349,826 4,525,710 33,402,475 $ 32,149,158 $
10,445,163 $ 10,081,964 $
2,062,949 1,941,119
1,052,608 1,079,178
714,415 614,347 14,275,135 $ 13,716,608 $
47,677,610 $ 45,865,766 $
Source: City of San Leandro Comprehensive Annual Financial Report (CAFR)- Statement of Activities
2011 2012
5,242,934 $ 7,367,750
3,423,176 4,585,001
7,469,186 10,661,253
4,368,731 4,551,617
6,923,466 2,036,922
4,182,409 2,317,753 31,609,902 $ 31,520,296
10,478,066 $ 11,189,362
1,944,513 1,968,839
1,098,114 1,078,455
746,965 658,948 14,267,658 $ 14,895,604
45,877,560 $ 46,415,900
2013 2014 2015 2016 2017 2018
$ 7,436,918 $ 7,310,491 $ 7,887,476 $ 10,326,562 $ 8,550,928 $ 9,381,699
4,482,346 3,749,814 3,623,194 3,897,568 3,801,944 4,429,180
6,723,903 9,607,387 8,668,597 10,897,823 10,772,477 11,825,335
4,022,452 5,114,524 4,493,916 4,385,376 4,062,763 3,605,783
3,959,180 3,747,032 9,945,633 4,024,380 4,559,809 5,407,066
$ 26,624,799 $ 29,529,248 $ 34,618,816 $ 33,531,709 $ 31,747,921 $ 34,649,063
$ 11,266,178 $ 11,961,374 $ 12,996,465 $ 12,467,570 $ 13,068,979 $ 12,574,723
1,846,750 1,928,280 2,038,388 1,702,955 1,994,642 2,085,975
1,086,070 1,072,146 1,070,154 1,093,460 1,084,122 1,056,708
614,213 673,595 773,745 727,157 954,026 1,020,530 $ 14,813,211 $ 15,635,395 $ 16,878,752 $ 15,991,142 $ 17,101,769 $ 16,737,936
$ 41,438,010 $ 45,164,643 $ 51,497,568 $ 49,522,851 $ 48,849,690 $ 51,386,999

City of San Leandro Fund Balance of Governmental Funds Last Ten Fiscal Years (modified accrual basis of accounting)
2009 2010 2011 2012 2013 2014 2015 2016 2017 2018
General Fund: Reserved $ 14,614,515 $ 13,730,510 $ $ $ $ $ $ $ $
Unreserved 15,074,450 12,672,277 Nonspendable 10,377,840 10,147,160 10,147,160 10,147,160 13,849,630 14,448,674 12,552,626 11,267,706 Restricted 50,000 50,000 50,000 50,000 50,000 50,000 50,000 50,000 Assigned 3,437,827 3,555,009 264,275 662,973 1,766,700 3,128,977 4,577,831 5,301,907 Unassigned 11,814,319 10,717,313 14,836,844 18,762,223 19,145,226 29,378,795 33,781,436 36,552,684
Total General Fund $ 29,688,965 $ 26,402,787 $ 25,679,986 $ 24,469,482 $ 25,298,279 $ 29,622,356 $ 34,811,556 $ 47,006,446 $ 50,961,893 $ 53,172,297
All other governmental funds: Reserved $ 33,916,323 $ 21,700,213 $ $ $ $ $ $ $ $
Unreserved, designated Unreserved, undesignated, reported in:
Special revenue funds 5,760,645 6,827,714 Capital projects funds 3,973,218.00 4,803,372
Nonspendable 2,475,000 Restricted 33,274,967 17,809,532 17,417,246 16,083,695 22,590,294 25,002,605 32,364,776 41,104,032 Assigned (948,387) Unassigned (132,601) (1,646,590) (1,712,654) (1,383,668) (1,322,170) (717,114)
-V, Total all other governmental funds $ 43,650,186 $ 33,331,299 -.J
$ 34,801,580 $ 17,676,931 $ 15,770,656 $ 14,371,041 $ 21,206,626 $ 23,680,435 $ 31,647,662 $ 41,104,032
Total All Governmental Funds $ 73,339,151 $ 59,734,086 $ 60,481,566 $ 42,146,413 $ 41,068,935 $ 43,993,397 $ 56,018,182 $ 70,686,881 $ 82,609,555 $ 94,276,329
Source: City of San Leandro Comprehensive Annual Financial Report (CAFR) - Governmental Funds Balance Sheet Note: GASB 54 was implemented in fiscal year 2011 and onwards. Fund balances prior to fiscal year 2011 were not restated.
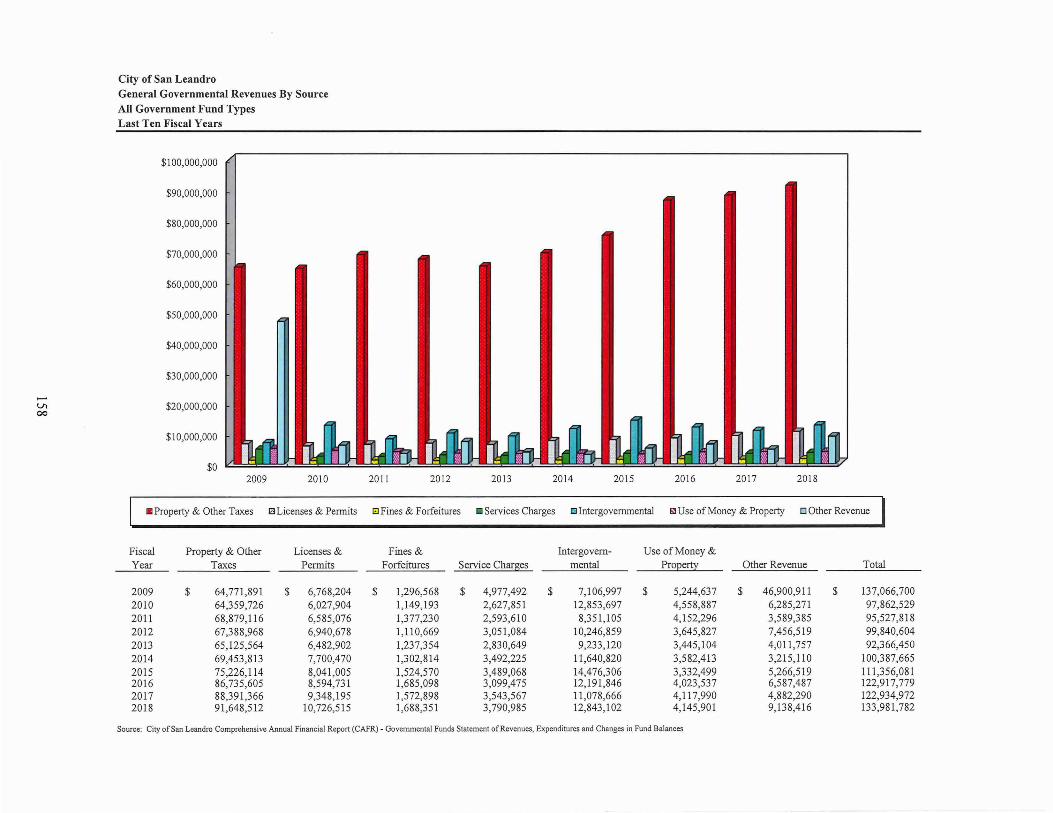
V, 00
City of San Leandro General Governmental Revenues By Source All Government Fund Types Last Ten Fiscal Years
$100,000,000
$90,000,000
$80,000,000
$70,000,000
$60,000,000
$50,000,000
$40,000,000
$30,000,000
$20,000,000
$10,000,000
$0 2009
• Property & Other Taxes
Fiscal Property & Other Year Taxes
2009 $ 64,771,891 2010 64,359,726 2011 68,879,116 2012 67,388,968 2013 65,125,564 2014 69,453,813 2015 75,226,114 2016 86,735,605 2017 88,391,366 2018 91 ,648,512
2010
i<!Licenses & Pennits
Licenses & Permits
$ 6,768,204 6,027,904 6,585,076 6,940,678 6,482,902 7,700,470 8,041,005 8,594,731 9,348,195
10,726,515
2011 2012 2013 2014 2015 2016 2017 2018
El Fines & Forfeitures • Services Charges l!l Intergovernmental li:IUse of Money & Property • Other Revenue
Fines & Intergovem- Use of Money &
Forfeitures Service Char~ mental Proeerty Other Revenue Total
$ 1,296,568 $ 4,977,492 $ 7,106,997 $ 5,244,637 $ 46,900,911 $ 137,066,700 1,149,193 2,627,851 12,853,697 4,558,887 6,285,271 97,862,529 1,377,230 2,593,610 8,351 ,105 4,152,296 3,589,385 95,527,818 1,110,669 3,051,084 10,246,859 3,645,827 7,456,519 99,840,604 1,237,354 2,830,649 9,233,120 3,445,104 4,011,757 92,366,450 1,302,814 3,492,225 11 ,640,820 3,582,413 3,215,110 I 00,387,665 1,524,570 3,489,068 14,476,306 3,332,499 5,266,519 111,356,081 1,685,098 3,099,475 12,191,846 4,023,537 6,587,487 122,917,779 1,572,898 3,543,567 11,078,666 4,117,990 4,882,290 122,934,972 1,688,351 3,790,985 12,843,102 4,145,901 9,138,416 133,981,782
Source: City of San Leandro Comprehensive Annual Financial Report (CAFR) - Governmental Funds Statement of Revenues, Expenditures and Changes in Fund Balances

City of San Leandro Changes in Fund Balance of Governmental Funds Last Ten Fiscal Years
2009 2010 2011 2012 2013 2014 2015 2016 2017 2018 Revenues:
Property and other truces $ 64,771,891 $ 64,359,726 $ 68,879,116 $ 67,388,968 $ 65,125,564 $ 69,453,813 $ 75,226,114 $ 86,735,605 $ 88,391,366 $ 91,648,512 Licenses and permits 6,768,204 6,027,904 6,585,076 6,940,678 6,482,902 7,700,470 8,041,005 8,594,731 9,348,195 10,726,515 Fines and forfeitures 1,296,568 1,149,193 1,377,230 1,110,669 1,237,354 1,302,814 1,524,570 1,685,098 1,572,898 1,688,351 Service charges 4,977,492 2,627,851 2,593,610 3,051,084 2,830,649 3,492,225 3,489,068 3,099,475 3,543,567 3,790,985 Intergovernmental 7,106,997 12,853,697 8,351,105 10,246,859 9,233,120 11,640,820 14,476,306 12,191,846 11,078,666 12,843,102 Use of money and property 5,244,637 4,558,887 4,152,296 3,645,827 3,445,104 3,582,413 3,340,946 4,023,537 4,117,990 4,145,901 Intergovernmental 1,858,477 2,272,568 2,295,293 2,401,869 2,001,928 2,002,139 2,250,266 1,999,878 1,999,878 1,999,878 Other 5,542,756 4,012,703 1,294,092 5,054,650 2,009,829 1,212,971 3,007,806 4,587,609 2,882,412 7,138,538
Total revenues 97,567,022 97,862,529 95,527,818 99,840,604 92,366,450 100,387,665 111,356,081 122,917,779 122,934,972 133,981,782
Expenditures: Current:
General government 10,866,088 10,353,861 9,684,293 9,943,871 12,993,178 11,350,118 11,720,994 11,846,864 11,493,208 11,679,072 Public safety 45,409,707 45,420,060 43,727,641 68,789,652 46,437,960 46,983,838 49,441,422 52,258,892 54,732,167 60,034,363 Engineering and transportation 15,641,026 18,203,786 12,231,307 9,778,421 14,550,085 19,310,489 17,905,896 19,185,657 19,487,997 25,648,773 Recreation and culture 12,100,517 9,854,633 9,560,878 8,373,427 10,274,496 10,244,659 10,481,528 12,214,366 11,845,986 11,898,321 Community development 27,126,823 24,397,598 11,342,937 9,236,773 4,311,194 5,138,376 5,708,945 6,480,125 7,700,158 8,244,056
Capital Outlay 5,763,826 Debt service:
- Principal 3,372,481 3,305,968 3,175,797 3,511,866 1,577,051 2,271,828 2,524,833 2,549,397 18,960,762 3,206,330 V, Interest and fees 4,917,152 4,578,463 4,247,973 3,043,070 2,605,761 2,163,895 2,299,286 1,963,779 2,196,157 1,744,082 '-0
Total expenditures 119,433,794 116,114,369 93,970,826 118,440,906 92,749,725 97,463,203 100,082,904 106,499,080 126,416,435 122,454,997
Excess (deficiency of revenues over (under)
expenditures (21,866,772) (18,251,840) 1,556,992 (18,600,302) (383,275) 2,924,462 11,273,177 16,418,699 (3,481,463) 11,526,785
Other financing Sources (uses): Issuance of capital lease Proceeds from refunding of bonds (9,817,009) Payment to refunded bonds escrows agents
Transfers in 11,774,023 8,598,106 8,290,220 6,029,970 577,000 776,000 2,604,156 3,877,017 4,193,000 10,345,878 Transfers out (9,615,363) (6,913,048) (9,099,736) (5,775,621) (1,606,599) (776,000) (2,604,156) (5,627,017) (10,453,000) (10,205,889) Bonds Proceeds 27,725,655 Loan Proceeds 2,500,000
Lease Proceeds 461,717 Issuance of Debt 18,305,000 10,152,405 21,664,137
Total other financing sources (uses) 29,884,315 4,646,775 (809,516) 18,559,349 (694,203) (1,750,000) 15,404,137 139,989
Prior period restatement
Net change in fund balances $ 8,017,543 $ (13,605,0652 $ 747,476 $ (40,953) $ (1,077,4782 $ 2,924,462 $ 11,273,177 $ 14,66ll_,_6~_ $ 11,922,674 $ 11,666,774
Debt Services as a percentage of noncapital expenditures 7.40% 7.37% 9.29% 5.64% 4.81% 4.78% 4.83% 4.39% 17.40% 4.32%
Sources: City of San Leandro Comprehensive Annual Financial Report (CAFR) - Governmental Funds Statement of Revenues, Expenditures and Changes in Fund Balances
City of San Leandro Comprehensive Annual Financial Report (CAFR) - Reconciliation of the Net Change in Fund Balances - Total Government Funds with the Statement of Activities


REVENUE CAP A CITY
These schedules contain information to help the reader assess the city's most significant local revenue sources, sales tax and property tax.
Direct and Overlapping Property Tax Rates - Last Ten Fiscal Years
Assessed Value of Taxable Property- Last Ten Fiscal Years
Net Assessed Value of Property by Use Code, Citywide - Last Three Fiscal Year
Principal Property Tax Payers - Current Fiscal Year and Nine Years Ago
Property Tax Levies and Collections - Last Ten Fiscal Years
Historical Sales Tax Amount by Benchmark Year - Last Nine Fiscal Years at Quarter 1 (Q 1)
Principal Sales Tax Producers - Last Fiscal Year and Nine Years Ago
Sewer Rates - Last Ten Fiscal Years
Number of Permits and Valuation of Taxable Transactions - Last Ten Calendar Years
161
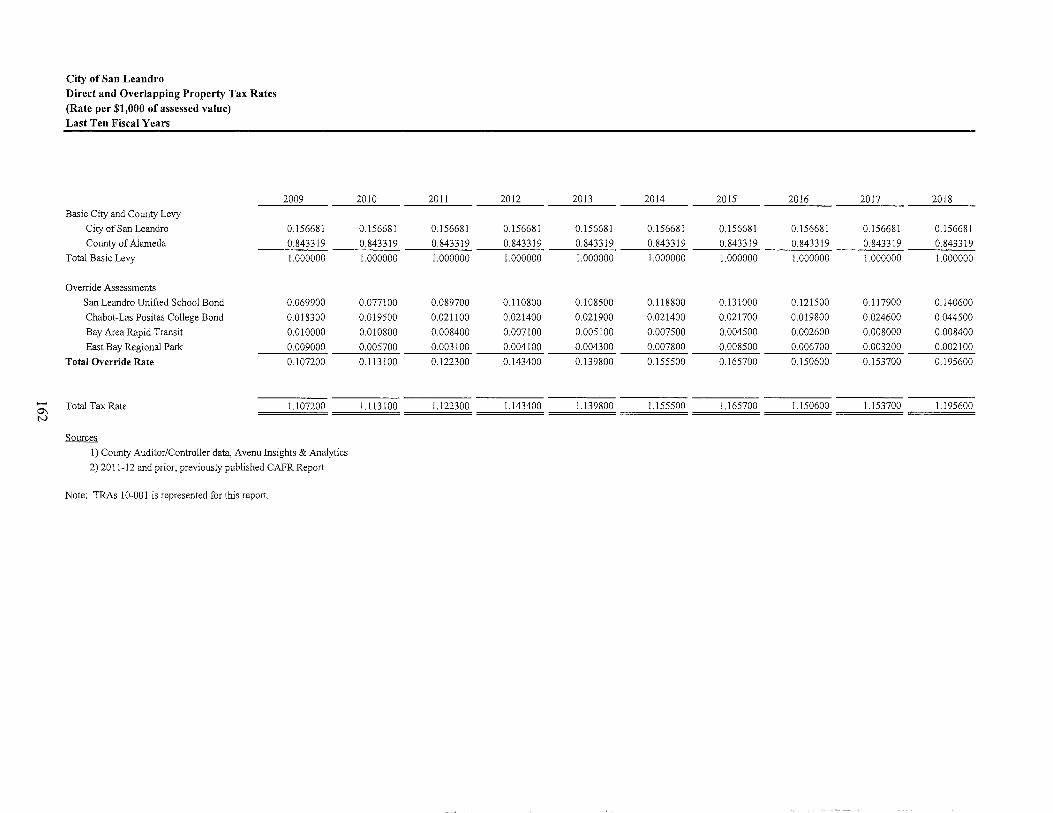
-0\ tv
City of San Leandro Direct and Overlapping Property Tax Rates (Rate per $1,000 of assessed value) Last Ten Fiscal Years
Basic City and County Levy
City of San Leandro
County of Alameda
Total Basic Levy
Override Assessments
San Leandro Unified School Bond
Chabot-Las Positas College Bond
Bay Area Rapid Transit
East Bay Regional Park
Total Override Rate
Total Tax Rate
Sources
2009
0.156681
0.843319
1.000000
0.069900
0.018300
0.010000
0.009000
0.107200
1.107200
1) County Auditor/Controller data, A venu Insights & Analytics
2) 2011-12 and prior, previously published CAFR Report
Note: TRAs 10-001 is represented for this report.
2010 2011
0.156681 0.156681
0.843319 0.843319
1.000000 1.000000
0.077100 0.089700
0.019500 0.021100
0.010800 0.008400
0.005700 0.003100
0.113100 0.122300
l.113100 1.122300
2012 2013 2014 2015 2016 2017 2018
0.156681 0.156681 0.156681 0.156681 0.156681 0.156681 0.156681
0.843319 0.843319 0.843319 0.843319 0.843319 0.843319 0.843319
1.000000 1.000000 1.000000 1.000000 1.000000 1.000000 1.000000
0.110800 0.108500 0.118800 0.131000 0.121500 0.117900 0.140600
0.021400 0.021900 0.021400 0.021700 0.019800 0.024600 0.044500
0.007100 0.005100 0.007500 0.004500 0.002600 0.008000 0.008400
0.004100 0.004300 0.007800 0.008500 0.006700 0.003200 0.002100
0.143400 0.139800 0.155500 0.165700 0.150600 0.153700 0.195600
1.143400 l.139800 l.155500 1.165700 l.150600 1.153700 l.195600

_. 0\ w
City of San Leandro
Assessed Value of Taxable Property
Last Ten Fiscal Years (In Thousands)
Cify {!xcl Successor Agenc:l'.2 Fiscal Year Ended June Secured Unsecured Less:
30 Property Property Exemptions 2009 $ 5,728,648 $ 142,161 $ 113,699 2010 5,659,301 162,942 120,044 2011 5,502,600 175,345 108,033 2012 5,540,713 126,353 15,376 2013 6,015,787 147,948 113,086 2014 5,899,077 153,300 183,511 2015 6,310,548 152,421 196,657 2016 7,795,139 197,971 178,848 2017 8,243,336 235,839 334,516 2018 8,775,315 229,625 319,941
Source: County Assessor Data, Avenu Insights & Analytics Source: 2010-11 and prior, previously published CAFR Report
Taxable Assessed Secured
Value Property $ 5,757,110 $ 3,337,069
5,702,199 3,593,007 5,569,912 3,599,645 5,651,690 3,568,829 6,050,649 3,570,284 5,868,866 4,365,737 6,266,312 4,694,159 7,814,262 3,899,194 8,144,659 3,995,308 8,684,999 4,195,622
Table has been restated from previous years to show city and successor agency values exclusively Table does not include state unitary value of$2,702,056
Notes:
(-) Data Unavailable ( 1) Total direct tax rate is represented by TRA 10-001
Successor Agenc;i::
Unsecured Less: Taxable Assessed Property Exemptions Value
$ 396,034 $ 66,847 $ 3,666,256 393,869 87,613 3,899,263 395,243 110,812 3,884,076 406,084 208,631 3,766,282 382,532 123,831 3,828,985 359,508 139,085 4,586,160 367,800 907,973 4,153,986 371,143 892,306 3,378,031 404,452 851,651 3,548,110 413,077 880,570 3,728,128
(2)Estimated Actual Value is derived from a series of calculations comparing median assessed values from 1940 to current median sale prices. Based on these calculations a multiplier value was extrapolated and applied to current assessed values.
CicyWide Estimated
Total Tax Taxable Assessed Actual Taxable Factor of Taxable Rate('l) Value Value (2) Assessed Value (2)
$ 9,423,366 $ 9,601,462
1.1223 9,453,988 1.1434 9,417,972 1.1398 9,879,634 1.1555 10,455,026 1.1657 10,420,298 13,808,666 1.3252 1.1657 11,192,293 15,938,474 1.4241 1.1537 11,692,768 20,767,772 1.7761 1.1956 12,413,128 18,025,239 1.4521

...... °' .,1::..
City of San Leandro Net Assessed Value of Property by Use Code, Citywide Last Three Fiscal Year
Category FY2016 FY2017 Residential $ 7,356,513,744 $ 7,821,980,485 Industrial 1,950,631,782 1,986,123,545 Commercial 1,260,959,808 1,300,649,480 Vacant 1,024,907,890 1,046,767,041 Institution 77,698,430 79,864,033 Recreation 4,232,993 3,256,676 Unknown 19,387,974 2,529
Net Secured Value 11,694,332,621 12,238,643,789
Unsecured 569,114,530 640,291,329 Exemptions 1,071,154,402 1,186,166,647
Net Assessed Value $ 11,192,292,749 $ 11,692,768,471_
Source: County Assessor data, A venu Insights & Analytics
Use code categories are based on County Assessor's data
Note: Secured Property does not includes state unitary value of$1,702,056.
FY2018 $ 8,296,777,137
2,074,436,546 1,392,380,761 1,113,483,702
88,285,180 5,570,897
2,504 12,970,936,727
642,702,645 1,200,511,766
$_12,413,127,606

City of San Leandro Principal Property Tax Payers June 30, 2018 Current Fiscal Year and Nine Years Ago
2018 2009
Percent of Percent of Total City Total City Taxable Taxable
Taxpayer Rank Taxable Value($) Value(%) Rank Taxable Value($) Value(%) Amb Sgp CifI LLC 1 $ 191,854,280 1.55% I $ 126,977,089 1.29% Ghirardelli Chocolate Company 2 ll 8,510,488 0.95% 2 99,741,907 1.01% Kaiser Foundation Hospitals 3 115,372,821 0.93% 3 98,105,867 0.99% Bci Coca Cola Bottling Co OfL 4 86,874,345 0.70% 5 58,181,164 0.59% Waste Mgmt Of Alameda County I 5 85,582,369 0.69% 17 28,178,639 0.29% Bpp Pacific Industrial Ca Reit 6 80,444,899 0.65% Mm Pg Bayfair Properties LLC 7 78,782,745 0.63% Safeway Stores Inc .. 8 72,543,259 0.58% 9 35,595,384 0.36% Wl Westgate Venture LLC 9 57,731,912 0.47% SltcLLC 10 56,706,878 0.46% Prologis Uslv Newca 7 LLC II 52,111,463 0.42% Chill Build San Leandro LLC 12 52,087,442 0.42% Creekside Plaza Partners LLC 13 46,045,684 0.37% Bigge Crane Rigging Co A Corp 14 45,104,243 0.36% 12 33,486,823 0.34% Gateway Buena Park Inc. 15 39,437,374 0.32% 10 34,846,830 0.35% - 21 St Amendment Brewery Cafe 16 39,248,280 0.32% 0\
Vl Georgia Pacific Corrugated LLC 17 36,047,526 0.29% II 34,253,273 0.35% DC 1717 Doolittle Sub LLC 18 34,202,839 0.28% Fpa Woodchase Apts LLC 19 32,103,616 0.26% 15 28,434,000 0.29% World Savings Loan Assoc 20 31,986,837 0.26% 20 23,459,882 0.24% Brcp San Leandro Industrial LI 21 29,185,975 0.24% 22 21,930,000 0.22% General Foods Corp 22 29,014,837 0.23% 6 57,477,865 0.58% Pk I Fashion Faire Place Lp 23 29,012,183 0.23% 19 25,635,354 0.26% Balco Properties Ltd. LLC 24 27,246,166 0.22% LitEnvp LP 25 26,550,000 0.21% Batarse Anthony A Jr Tr 8 38,332,791 0.39% City Of San Leandro 13 29,295,090 0.30% Emerald Properties 14 28,705,338 0.29% Heritage Associates Lie Eta! 21 21,949,491 0.22% Lakeside Village Associates 18 25,787,600 0.26% Madison Bay Fair LLC 4 73,050,940 0.74% Peterson Power Systms Inc. 16 28,384,689 0.29% Price Company 25 20,723,974 0.21% Skb Westgate Investments Lie & 7 46,121,103 0.47% Target Corporation 24 20,960,552 0.21% Wri Greenhouse LP 23 21,045,920 0.21%
Total Top 25 Taxpayers 1,493,788,461 12.03% 1,060,661,565 10.74%
Total Taxable Value $ 12,413,127,606 100.00% $ 9,874,461,606 100.00%
Source: County Assessor data, A venu Insights & Analytics
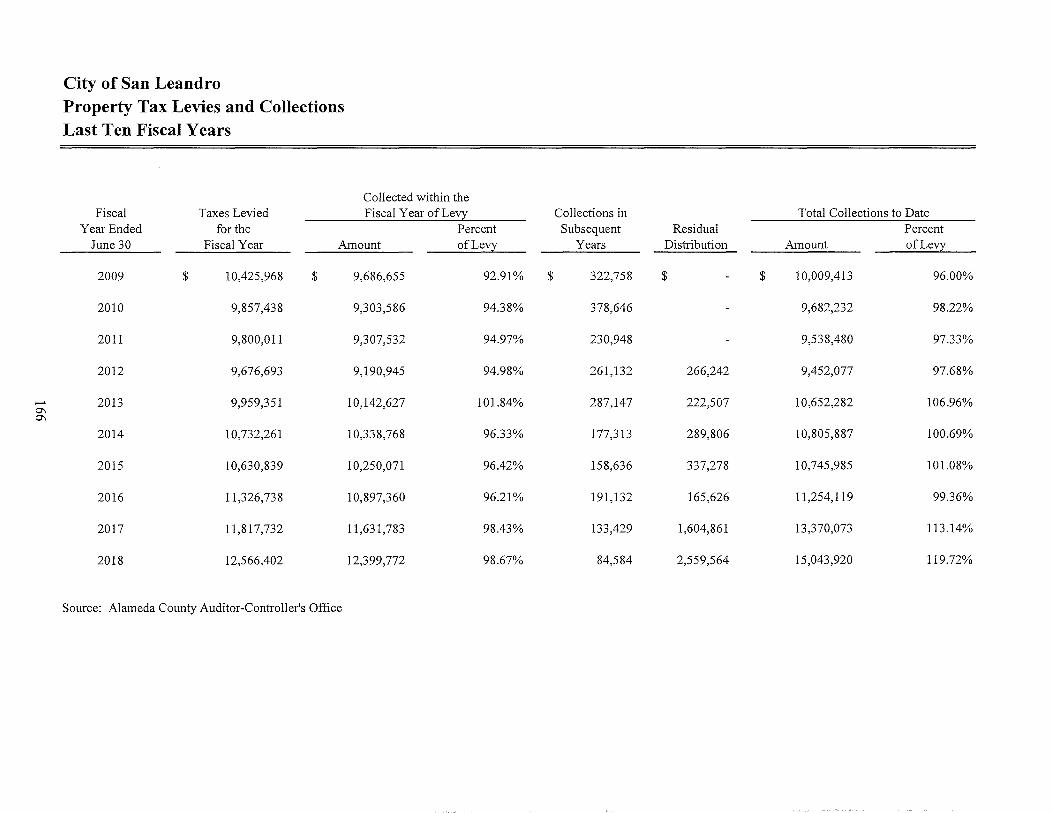
-°' °'
City of San Leandro Property Tax Levies and Collections Last Ten Fiscal Years
Fiscal TIDCes Levied Year Ended for the
Collected within the Fiscal Year of Levy
Percent June 30 Fiscal Year Amount of Levy
2009 $ 10,425,968 $ 9,686,655 92.91%
2010 9,857,438 9,303,586 94.38%
2011 9,800,011 9,307,532 94.97%
2012 9,676,693 9,190,945 94.98%
2013 9,959,351 10,142,627 101.84%
2014 10,732,261 10,338,768 96.33%
2015 10,630,839 10,250,071 96.42%
2016 11,326,738 10,897,360 96.21%
2017 11,817,732 11,631,783 98.43%
2018 12,566,402 12,399,772 98.67%
Source: Alameda County Auditor-Controller's Office
Collections in Total Collections to Date Subsequent Residual Percent
Years Distribution Amount of Levy
$ 322,758 $ $ 10,009,413 96.00%
378,646 9,682,232 98.22%
230,948 9,538,480 97.33%
261,132 266,242 9,452,077 97.68%
287,147 222,507 10,652,282 106.96%
177,313 289,806 10,805,887 100.69%
158,636 337,278 10,745,985 101.08%
191,132 165,626 11,254,119 99.36%
133,429 1,604,861 13,370,073 113.14%
84,584 2,559,564 15,043,920 119.72%

-0\ -..J
City of San Leandro Historical Sales Tax Amount by Benchmark Year Last Nine Fiscal Years at Quarter 1 (Ql) (In Thci_usands)
Accommodation and Food Services
Administrative and Support and Waste Management and Remediation Services
Agriculture, Forestry, Fishing and Hunting
Arts, Entertainment, and Recreation
Construction
Educational Services
Finance and Insurance
Health Care and Social Assistance
Information
Management of Companies and Enterprises
Manufacturing
Mining, Quarrying, and Oil and Gas Extraction
Other Services ( except Public Administration)
Professional, Scientific, and Technical Services
Public Administration
Real Estate and Rental and Leasing
Retail Trade
Transportation and Warehousing
Utilities
Wholesale Trade
Not Classified by CDTFA
TOTAL
Source: Avenu Insights & Analytics
Note:
2018 Ql
$ 2,121,239
73,027
149
14,563
272,460
4,460
(698)
46,263
139,384
805,953
433,409
62,642
31,140
757,242
14,662,760
78,802
6,930,617
182,300
$ 26,615,712
2017 QI 2016 Ql
$ 1,929,329 $ 1,787,395 $
76,806 82,774
297 1,036
14,357 15,507
202,764 288,552
5,638 6,002
(525) (239)
51,783 42,641
144,180 158,250
400
871,613 1,078,414
393,780 388,661
83,872 70,284
12,312 16,431
722,337 736,920
14,199,277 13,409,864
76,158 72,941
6,972,669 7,067,646
318,299 142,590
$ 26,075,346 $ 25,365,669 $
The data contained in this report is economic and therefore constantly changing as adjustments, fund transfers, late filings and audits are recorded.
The categories listed in previous reports were based on SBOE NAJCS codes and have been updated to reflect current updated CDTF A standards.
2015 QI
1,566,105
76,355
1,092
12,787
242,706
5,426
(192)
21,247
211,884
1,062,260
325,338
88,222
16,675
708,042
12,484,644
68,447
6,242,394
241,346
23,374,778
2014 QI 2013 QI 2012 QI 2011 Ql 2010 QI
$ 1,451,555 $ 1,263,850 $ 1,182,256 $ 1,120,628 $ 1,080,232
105,843 104,404 88,469 54,273 52,857
400 170 47
10,297 11,416 89,573 94,935 84,758
252,394 175,306 176,314 137,611 146,653
5,232 4,806 6,084 8,093 9,086
(86) (572) (2,760) 714 (921)
13,771 18,348 28,249 18,032 15,844
199,451 174,757 180,373 150,896 154,657
5
980,354 963,869 958,905 816,814 839,626
289,129 241,930 225,783 210,714 216,986
80,356 83,039 60,276 73,896 63,147
9,222 5,409 6,941 7,795 (13,530)
568,222 519,101 511,478 542,111 561,067
12,335,109 11,636,202 11,270,517 10,220,607 9,655,197
71,220 62,165 55,714 40,872 30,220
(327) 21,634
4,300,001 3,683,888 3,470,389 3,161,189 2,911,906
170,226 123,382 157,032 86,360 353,495
$ 20,842,301 $ 19,071,700 $ 18,465,436 $ 16,745,540 $ 16,182,961

City of San Leandro Principal Sales Tax Producers Last Fiscal Year and Nine Years Ago
FY 2018 FY 2009
Taxpayer Business Type Taxpayer Business Type
Allied Building Products Bldg.Matls-Whsle Acoustical Matera! Services Bldg.Matls-Whsle
Autocom Nissan East Bay Auto Sales - New Costco Wholesale Department Stores
Bigge Crane & Rigging Orat Heavy Industry Cummins West Heavy Industry
Chevron Service Stations Service Stations Enterprise Rent-A-Car Leasing
Consolidated Electrical Dstr Bldg.Matls-Whsle F .H. Dailey Chevrolet Auto Sales - New
Costco Wholesale Department Stores Home Depot Bldg.Mads-Retail
Cummins Pacific Heavy Industry K Mart Stores Department Stores
F H Dailey Chevrolet Auto Sales - New Macy'S Department Store Department Stores
Ferguson Enterprises Bldg.Matls-Whsle Marina Square Auto Center Auto Sales - New -°' Home Depot B ldg.Matls-Retail Nordstrom Rack Apparel Stores 00
Living Spaces Furniture Furniture/ Appliance Peterson Power Systems Heavy Industry
Nike Factory Store Apparel Stores Peterson Tractor Heavy Industry
Norcal Kenworth Bay Area Auto Parts/Repair Rexel Electronic Equipment
Nordstrom Apparel Stores Ross Stores Apparel Stores
Peterson Power Systems Electronic Equipment Royal Whole Sale Electric Bldg.Matls-Whsle
Peterson Tractor Co Heavy Industry Safeway Stores Food Markets
Peterson Trucks Auto Parts/Repair San Leandro Honda Auto Sales - New
Rexel Electronic Equipment Shell Service Stations Service Stations
Roofing Supply Group Bldg.Matls-Whsle Target Stores Department Stores
Ross Dress For Less Apparel Stores The Ford Store Auto Sales - New
San Leandro Chrysler Jeep Dodge Ram Auto Sales - New W.W. Grainger Bldg.Matls-Whsle
San Leandro Honda Auto Sales - New Wal Mart Stores Department Stores
Target Stores Department Stores Western States Oil Energy Sales
The Ford Store Auto Sales - New White Cap Industries Bldg.Matls-Whsle
W almart Store Department Stores White GMC Truck Center Auto Sales - New
Source: Avenu Insights & Analytics

...... °' '-0
City of San Leandro Sewer Rates Last Ten Fiscal Years
Fiscal Single
Sewer Non-Residential
Multi-Year Famil Family Commercial
2009 26.29 18.65 3.13 - 6.40
2010 27.60 19.59 3.04 - 6.36
2011 26.29 18.65 2.45 - 6.40
2012 28.97 20.56 3.19 - 6.67
2013 29.98 21.28 3.30 - 6.90
2014 32.27 22.90 3.55 - 7.45
2015 33.07 23.54 3.65 - 7.66
2016 33.17 23.54 3.65 - 7.66
2017 34.03 24.15 3.74 - 7.86
2018 34.71 24.63 3.81 - 8.02
Notes: Commercial and Institutional charge is based upon the volume of water used.
Source: City of San Leandro Public Works Department and Master Fee Schedule
Institutional
2.45
2.50
2.45
2.62
2.71
2.92
3.00
3.00
3.08
3.14
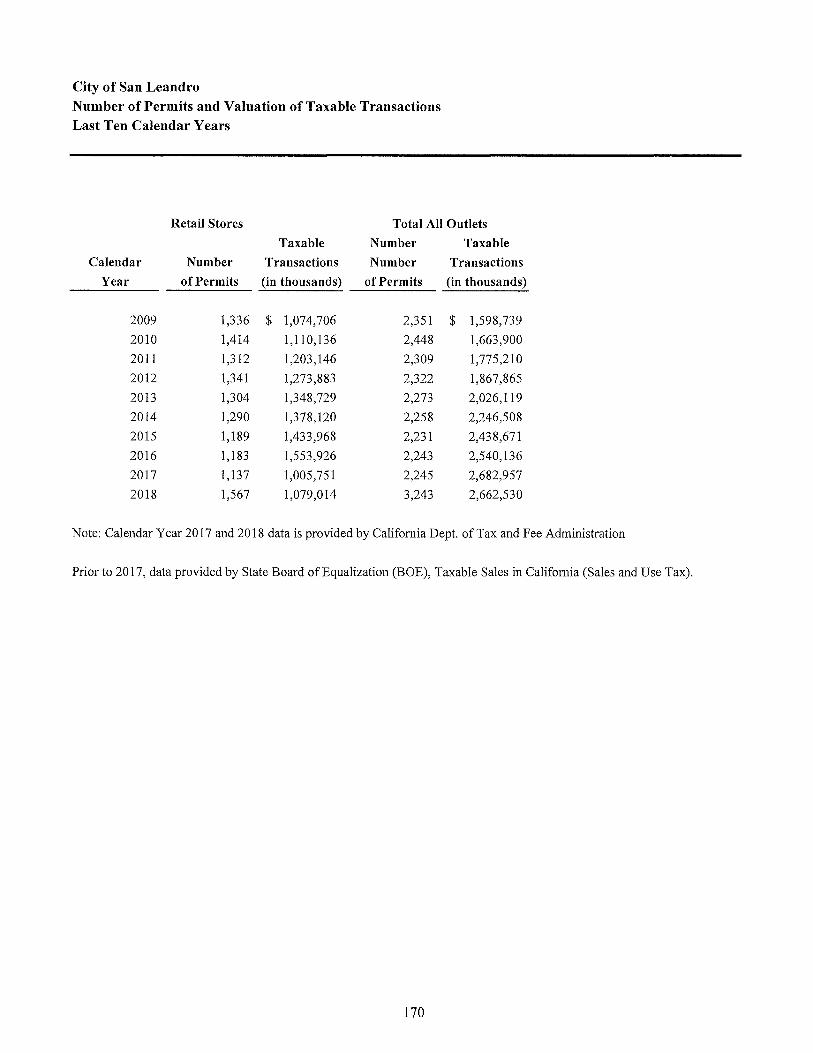
City of San Leandro Number of Permits and Valuation of Taxable Transactions Last Ten Calendar Years
Retail Stores Total All Outlets
Taxable Number Taxable
Calendar Number Transactions Number Transactions
Year of Permits (in thousands) of Permits (in thousands)
2009 1,336 $ 1,074,706 2,351 $ 1,598,739
2010 1,414 1,110,136 2,448 1,663,900
2011 1,312 1,203,146 2,309 1,775,210
2012 1,341 1,273,883 2,322 1,867,865
2013 1,304 1,348,729 2,273 2,026,119
2014 1,290 1,378,120 2,258 2,246,508
2015 1,189 1,433,968 2,231 2,438,671
2016 1,183 1,553,926 2,243 2,540,136
2017 1,137 1,005,751 2,245 2,682,957
2018 1,567 1,079,014 3,243 2,662,530
Note: Calendar Year 2017 and 2018 data is provided by California Dept. of Tax and Fee Administration
Prior to 2017, data provided by State Board of Equalization (BOE), Taxable Sales in California (Sales and Use Tax).
170

DEBT CAP A CITY
These schedules present information to help the reader assess the affordability of the city's current levels of outstanding debt and the city's ability to issue additional debt in the future.
Direct and Overlapping Debt - As of June 30, 2018
Pledged-Revenue Coverage - Last Ten Fiscal Years
Computation of Legal Debt Margin - Last Ten Fiscal Years
Ratios of Outstanding Debt by Type - Last Ten Fiscal Years
Ratios of General Bonded Debt Outstanding - Last Ten Fiscal Years
171

City of San Leandro Direct and Overlapping Debt As of June 30, 2018
2017-18 Assessed Valuation $ 12,516,l 14,346
Total Debt City's Share of OVERLAPPING TAX AND ASSESSMENT DEBT: 6/30/2018 % A1mlicable (I} Debt 6/30/18 Alameda County $ 240,000,000 4.618% $ 11,083,200 Bay Area Rapid Transit District 837,820,000 1.799 15,072,382 Chabot-Las Positas Community College District 693,595,000 10.693 74,166,113 San Leandro Unified School District 219,634,079 89.685 196,978,824 San Lorenzo Unified School District 115,335,000 22.495 25,944,608 East Bay Regional Park District 187,800,000 2.813 5,282,814 City of San Leandro Cherrywood Community Facilities District 2,720,000 100.000 2,720,000
TOTAL OVERLAPPING TAX AND ASSESSMENT DEBT $ 331,247,941
DIRECT AND OVERLAPPING GENERAL FUND DEBT: Alameda County General Fund Obligations $ 905,132,500 4.618% $ 41,799,019 Alameda County Pension Obligation Bonds 8,937,324 4.618 412,726 Alameda-Contra Costa Transit District Certificates of Participation 13,795,000 5.466 754,035 San Leandro Unified School District Ce1tificates of Paiticipation 4,530,000 89.685 4,062,731 San Lorenzo Unified School District Ce1tificates of Participation 10,305,000 22.495 2,318,110 City of San Leandro General Fund Obligations 25,749,715 100.000 25,749,715 City of San Leandro Pension Obligation Bonds 11,625,000 100.000 11,625,000 City of San Leandro HUD Section 108 Loan 1,583,000 100.000 1,583,000
TOTAL DIRECT AND OVERLAPPING GENERAL FUND DEBT $ 88,304,336
OVERLAPPING TAX INCREMENT DEBT (Successor Agencies}: San Leandro Tax Allocation Bonds $ 13,415,000 100.000% $ 13,415,000 Alameda County San Leandro Tax Allocation Bonds 19,060,000 56.639 10,795,393
TOTAL OVERLAPPING TAX INCREMENT DEBT $24,210,393
TOTAL DIRECT DEBT $ 38,957,715 TOTAL OVERLAPPING DEBT $ 404,804,955
COMBINED TOTAL DEBT $ 443,762,670
(!) The percentage of overlapping debt applicable to the city is estimated using taxable assessed property value. Applicable percentages were estimated by detennining the portion of the overlapping district's assessed value that is within the boundaries of the city divided by the district's total taxable assessed value.
(2) Excludes tax and revenue anticipation notes, enterprise revenue, mortgage revenue and non-bonded capital lease obligations.
Ratios to 2017-18 Assessed Valuation: Total Overlapping Tax and Assessment Debt Total Direct Debt ($38,957,715) Combined Total Debt
Ratios to Redevelopment Successor Agency Incremental Valuation ($2,261,725,145}: Total Overlapping Tax Increment Debt
172
2.65% 0.31% 3.55%
1.07%
(2)

--.J w
City of San Leandro Pledged-Revenue Coverage Last Ten Fiscal Years
Fiscal
Year
2009
2010
2011
2012
2013
2014
2015
2016
2017
2018
$
Special
Assessment
Collections
S_p_ecial Assessment Bonds
66 $
Debt Service
Principal Interest
145,000
155,000
$ 16,416
5,592
Coverage
0.00
Notes: During Fiscal Year 2009-10 and beyond no assessments were necessary due to the availability of funds to pay the debt.
Source: City of San Leandro

City of San Leandro Computation of Legal Debt Margin Last Ten Fiscal Years
2009 2010 2011 2012 2013 2014 2015 2016 2017 2018 Assessed Valuation:
Secured property assessed value $8,885,171,000 $9,044,651,000 $ 8,883,400,000 $8,885,535,000 $9,349,154,000 $ 9,942,218,000 $ 9,900,077,000 $ 10,623,178,219 $11,098,868,606 $11,810,249,391 Addback: Exemptions 180,546,000 207,657,000 218,845,000 224,007,000 236,917,000 322,596,000 1,104,630,000 1,071,154,402 1,139,775,183 1,160,687,336
Total Assessed Valuation $9,065,717,000 $9,252,308,000 $9,102,245,000 $9,109,542,000 $9,586,071,000 $10,264,814,000 $ 11,004,707,000 $11,694,332,621 $12,238,643,789 $12,970,936,727
Bonded debt (15% of Assessed Value) $1,359,857,550 $1,387,846,200 $ 1,365,336,750 $1,366,431,300 $1,437,910,650 $ 1,539,722,100 $ 1,650,706,050 $ 1,754,149,893 $ 1,835,796,568 $ 1,945,640,509
Total Bonded Debt 88,653,126 87,662,234 84,549,436 99,120,825 46,698,820 44,557,992 42,478,441 42,066,944 42,404,398 37,374,715 Less:
Special assessment bonds (155,000) Lease Revenue Debt (36,860,000) (35,660,000) (34,420,000) (29,515,000) (28,340,000) (30,440,000) (26,208,000) (25,198,000) {27,410,045) (20,495,000) Capital Leases ~1,237,267) ~1,238,241) ~772,883) ~287,790) ~980,820) ~694,992) ~715,441) ~678,944) ~240,353) ~5,254,715)
Amount of Debt subject to Limit 50,400,859 50,763,993 49,356,553 69,318,035 17,378,000 13,423,000 15,555,000 16,190,000 14,754,000 11,625,000
Legal Debt Margin $1,309,456,691 $1,337,082,207 $1,315,980,197 $1,297,113,265 $1,420,532,650 $ 1,526,299,100 $ 1,635,151,050 $ 1,737,959,893 $ 1,821,042,568 $ 1,934,015,509
--..J .;::.
Source: County of Alameda office of Auditor-Controller and Statement of Direct and Overlapping Debt

>-' -..) U)
City of San Leandro Ratios of Outstanding Debt by Type Last Ten Fiscal Years
Fiscal Year Total of Ended Personal Income Poeulation
2009 4,750,387,200 82,472
2010 4,932,751,900 83,183
2011 5,248,658,550 85,490
2012 5,159,811,699 85,941
2013 5,310,979,146 86,666
2014 5,545,682,831 89,189
2015 5,524,820,829 88,441
2016 5,587,279,300 87,700
2017 5,894,517,000 88,274
2018 6,221,503,000 87,598
Note: (1) CFDs - Community Facility District
Tax Allocation
Bonds
47,050,000
46,075,000
44,920,000
Governmental Activities Pension CFDs
Obligation and Lease Capital Other Bonds Revenue Debt {I 2 Leases Debt
37,015,000 1,237,265 5,826,219
35,660,000 1,238,241 7,810,992
34,420,000 772,883 7,495,553
18,305,000 29,515,000 287,790 2,865,000
17,585,000 28,133,000 980,820 2,238,000
16,675,000 27,188,000 694,992 2,107,000
15,555,000 26,208,000 715,441 1,976,000
14,345,000 25,198,000 678,944 1,845,000
13,040,000 27,410,045 240,353 1,714,000
11,625,000 20,495,000 5,254,715 1,583,000
(2) Business-type Activity Debt consists of a Marina Loan and a State Water Resources Control Board Loan.
Sources:
Total Governmental Debt
91,128,484
90,784,233
87,608,436
50,972,790
48,936,820
46,664,992
44,454,441
42,066,944
42,404,398
38,957,715
(a) Income Data is provided by the U.S. Census Bureau, 2011-2015 American Community Survey. Income data bas been restated from previous years. (b) Population Projections are provided by the California Department of Finance Projections. (c) All other information provided by the City of San Leandro.
Business-TYEe Activi!Y Total Government-Wide %of Debt Total %of Debt Total %of Debt
Personal per Business-Type Personal per Government-Wide Personal per Income C!!eita Debt(2) Income Caeita Debt Income Caeita
1.92% 1,104.96 2,803,948 0.06% 34.00 39,818,948 0.84% 482.82
1.84% 1,091.38 2,637,207 0.05% 31.70 38,297,207 0.78% 460.40
1.67% 1,024.78 2,462,962 0.05% 28.81 36,882,962 0.70% 431.43
0.99% 593.11 8,979,154 0.17% 104.48 38,494,154 0.75% 447.91
0.92% 564.66 23,426,651 0.44% 270.31 51,559,651 0.97% 594.92
0.84% 523.21 37,914,665 0.68% 425.10 65,102,665 1.17% 729.94
0.80% 502.65 42,092,468 0.76% 475.94 68,300,468 1.24% 772.27
0.75% 479.67 44,179,819 0.79% 503.76 69,377,819 1.24% 791.08
0.72% 480.37 42,297,582 0.72% 479.16 69,707,627 1.18% 789.67
0.63% 444.73 40,364,096 0.65% 460.79 60,859,096 0.98% 694.75

---.J 0\
City of San Leandro Ratios of General Bonded Debt Outstanding Last Ten Fiscal Years
Pension Fiscal Total of Obligation Year Personal Income Population Bonds
2009 4,750,387,200 82,472 -2010 4,932,751,900 83,183 -2011 5,248,658,550 85,490 -2012 5,159,811,699 85,941 18,305,000 2013 5,310,979,146 86,666 17,585,000 2014 5,545,682,831 89,189 16,675,000 2015 5,524,820,829 88,441 15,555,000 2016 5,587,279,300 87,700 14,345,000
2017 5,894,516,653 88,274 13,040,000
2018 6,221,502,537 87,598 11,625,000
Sources:
Total %of Capital Other General Personal Leases Debt Bonded Debt Income
1,237,265 2,555,859 3,793,124 0.08%
1,238,241 2,513,632 3,751,873 0.08%
772,883 2,421,193 3,194,076 0.06%
287,790 - 18,592,790 0.36%
980,820 - 18,565,820 0.35%
694,992 - 17,369,992 0.31% 715,441 - 16,270,441 0.29% 678,944 - 15,023,944 0.27%
240,353 - 13,280,353 0.23%
5,254,715 - 16,879,715 0.27%
(a) Income Data is provided by the U.S. Census Bureau, 2011-2015 American Community Survey. Income data has been restated from previous years.
(b) Population Projections are provided by the California Department of Finance Projections. ( c) All other information provided by the City of San Leandro.
Debt per
Capita
46 45 37
216 214 195 184 171 150
193

DEMOGRAPHIC AND ECONOMIC INFORMATION
These schedules offer demographic and economic indicators to help the reader understand the environment within which the city's financial activities take place.
Demographic and Economic Statistics - Last Ten Fiscal Years
Principal Employers - Current Year and Eight Years Ago
177

...... -..J 00
City of San Leandro Demographic and Economic Statistics Last Ten Fiscal Years
Personal Income
( in thousands) Fiscal Year Population (1) (2)
2009 82,472 $ 4,750,387 2010 83,183 4,932,752 2011 85,490 5,248,659 2012 85,941 5,159,812 2013 86,666 5,310,979 2014 89,189 5,545,683 2015 88,441 5,524,821 2016 87,700 5,587,279 2017 88,274 5,894,517 2018 87,598 6,221,503
Per Capita Personal Public School
Income (2) Median Age Enrollment (3) $ 57,600 38.0 8,855
59,300 38.9 8,801 61,395 39.5 9,000 60,039 37.6 8,776 61,281 39.1 8,769 62,179 39.2 8,668 62,469 39.2 8,617 63,709 40.5 8,560 66,775 40.5 8,638 71,023 43.9 8,880
Source: Avenu Insights & Analytics, U.S. Census Bureau, 2011-2015 American Community Survey.
Source: 2013-14 and prior, previous published CAFR
City Median Home Consumer Price Unemployment
Price Index Rate (4) $ 305,000 225.692 10.3%
334,194 227.697 10.8% 309,800 232.082 10.0% 320,000 228.110 9.3% 400,000 245.935 7.4% 440,000 253.317 6.3% 510,000 238.654 4.8% 529,000 239.810 5.1%
585,400 244.786 4.6% 671,200 251.846 3.1%
The California Department of Finance demographics estimates now incorporate 2010 Census counts as the benchmark. Therefore, the estimates for 2010 through 2012 published in this report might be noticeably different from the previous year estimates.
Notes:
1.) Population Projections are provided by the California Department of Finance Projections. 2) Income Data is provided by the U.S. Census Bureau, 2011-2015 American Community Survey. Income data has been restated from previous years. 3) Student Enrollment reflects the total number of students enrolled in the San Leandro Unified School District. Any other school districts within the City are not accounted for in this statistic.
4) Unemployment Data is provided by the EDD's Bureau of Labor Statistics Department.

City of San Leandro Principal Employers Current Year and Eight Years Ago
Employer
Kaiser Permanente
Alameda Health Systems*
SLUSD**
Acco Engineered Systems
Walmart (2 locations)
City of San Leandro*
Ghiradelli Chocolate Co.
Paramedics Plus LLC
Peterson Cat
Safeway ( 4 locations)
American Medical Response West
Costco Wholesale
Coca Cola Bottling Co.
North Face, Inc
Kindred Hospital - SF Bay Area
OSI Soft, Inc
Total Top Employers
Total City Employment (I)
Source: Avenu Insights & Analytics
Notes: *Includes full and part-time **Includes part-time and substitutes
Number of Employees
3,400
1,534
1,171
1,000
830
589
517
490
487
449
10,467
47,700
(I) Total City Labor Force provided by EDD Labor Force Data
2017-18
Rank
2
3
4
5
6
7
8
9
10
179
2009-10
Percent of Percent of Total Number of Total
Employment Employees Rank Employment
7.13%
3.22%
2.45% 1,262 4.29%
2.10%
1.74% 540 1.83%
1.23% 453 1.54%
1.08%
1.03%
1.02%
0.94%
402 1.37%
333 1.13%
317 1.08%
314 1.07%
268 0.91%
238 0.81%
21.94% 4,127 14.01%
29,450


OPERATING INFORMATION
These schedules contain service and infrastructure data to help the reader understand how the information in the city's financial report relates to the services the city provides and the activities it performs.
Full-Time and Part-Time City Employees by Function - Last Ten Fiscal Years
Operating Indicators by Function - Last Ten Fiscal Years
Capital Asset Statistics by Function - Last Ten Fiscal Years
181
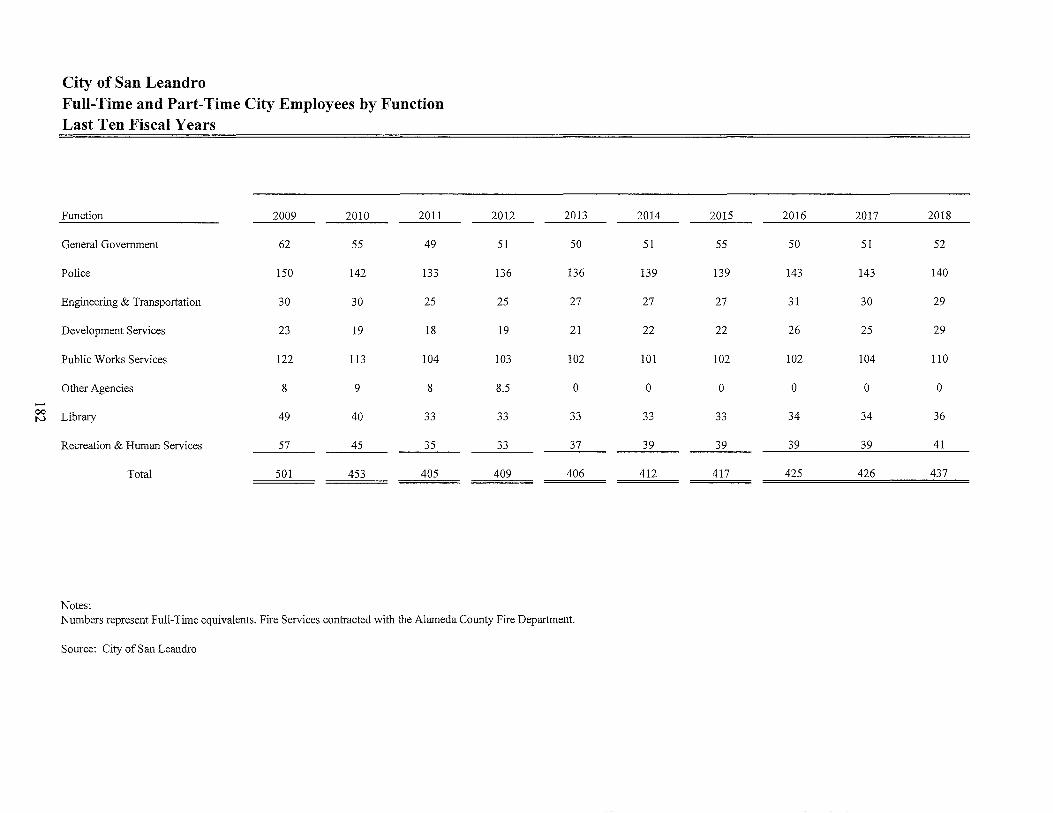
-00 N
City of San Leandro Full-Time and Part-Time City Employees by Function Last Ten Fiscal Years
Function 2009 2010 2011
General Government 62 55 49
Police 150 142 133
Engineering & Transportation 30 30 25
Development Services 23 19 18
Public Works Services 122 113 104
Other Agencies 8 9 8
Library 49 40 33
Recreation & Human Services 57 45 35
Total 501 453 405
Notes:
2012 2013
51 50
136 136
25 27
19 21
103 102
8.5 0
33 33
33 37
409 406
Numbers represent Full-Time equivalents. Fire Services contracted with the Alameda County Fire Department.
Source: City of San Leandro
2014 2015 2016 2017 2018
51 55 50 51 52
139 139 143 143 140
27 27 31 30 29
22 22 26 25 29
101 102 102 104 110
0 0 0 0 0
33 33 34 34 36
39 39 39 39 41
412 417 425 426 437

........ 00 w
City of San Leandro Operating Indicators by Function Last Ten Fiscal years
2009
Police De,12artment: Arrests 4,026
Building De,12artment: Permits Issued 2,541
Public Works De,12artment: Street reconstruction (miles) Street resurfacing (miles) -
Parks and Recreation: Number ofregistrants 18,413 Number of facility rentals 752
Golf Course: Golf rounds played 101,760
Notes:
2010 2011
3,722 3,486
2,507 2,446
2.34 0.55 2.72 4.00
16,584 17,099 705 1,190
98,000 98,000
Fire Services are contracted with the Alameda County Fire Department.
2012 2013 2014 2015
3,299 3,279 3,036 2,148
2,503 2,564 2,624 1,961
1.39 - 1.35 0.26 8.68 - 17.94 5.39
20,236 21,324 18,914 17,737 1,282 1,999 2,656 3,830
97,310 95,995 96,450 102,534
Building Department: Methodology changed in 2015 from issuing permits for each discipline to one consolidated permit per project.
Source: City of San Leandro Recreation Department, Police Department, Public Works, and Building Regulations.
2016 2017 2018
2,789 2,799 2,513
2,891 2,762 4,080
0.74 2.24 1.42 4.12 5.21 4.69
17,114 16,742 14,703 2,439 2,222 2,465
99,185 98,987 105,043
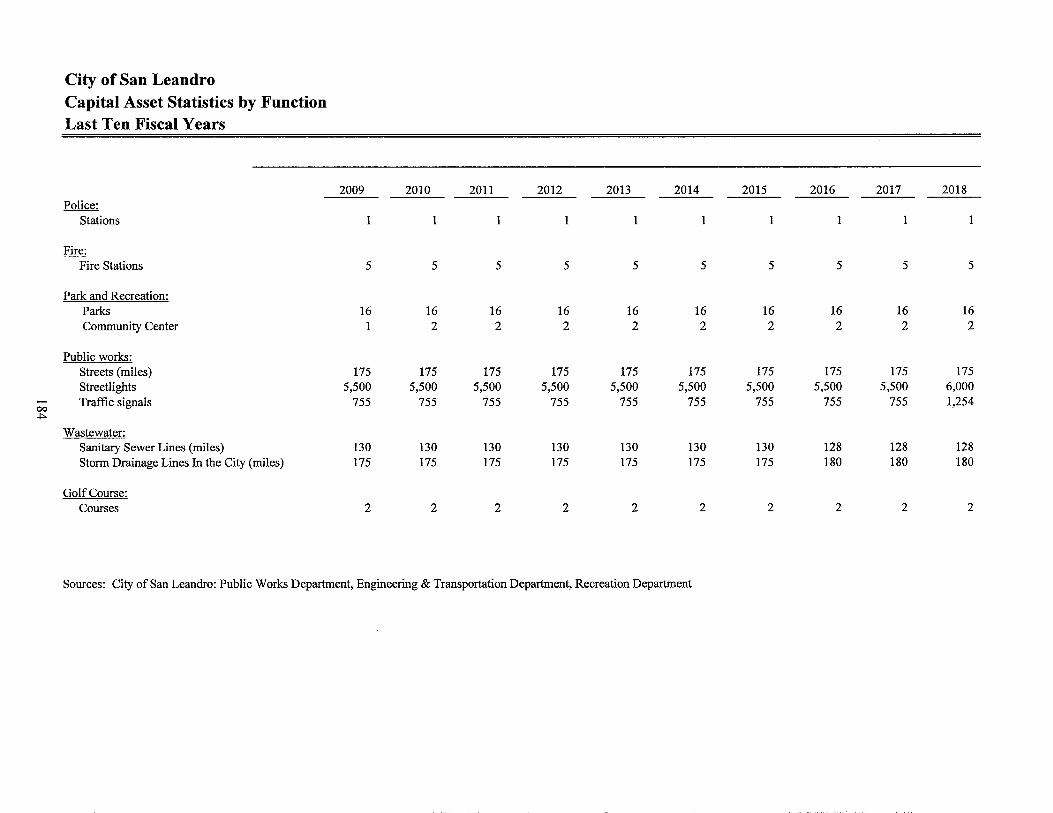
-00 ..j:,.
City of San Leandro Capital Asset Statistics by Function Last Ten Fiscal Years
Police: Stations
Fire: Fire Stations
Park and Recreation: Parks Community Center
Public works: Streets (miles) Streetlights Traffic signals
Wastewater: Sanitary Sewer Lines (miles) Storm Drainage Lines In the City (miles)
Golf Course: Courses
2009 2010
1 1
5 5
16 16 1 2
175 175 5,500 5,500
755 755
130 130 175 175
2 2
2011 2012 2013 2014
1 1 1 1
5 5 5 5
16 16 16 16 2 2 2 2
175 175 175 175 5,500 5,500 5,500 5,500
755 755 755 755
130 130 130 130 175 175 175 175
2 2 2 2
Sources: City of San Leandro: Public Works Department, Engineering & Transportation Department, Recreation Department
2015 2016 2017 2018
1 1 1 1
5 5 5 5
16 16 16 16 2 2 2 2
175 175 175 175 5,500 5,500 5,500 6,000
755 755 755 1,254
130 128 128 128 175 180 180 180
2 2 2 2