Embed Size (px)
Citation preview
CITY OF OREGON CITY, OREGON PARKS AND RECREATION MASTER PLAN UPDATE FIVE‐YEAR VISION IMPLEMENTATION PLAN
MAY 2008

Oregon City, Parks and Recreation Master Plan Update i
Acknowledgements CITY OF OREGON CITY, CITY COMMISSION
Alice Norr is , Mayor Daphne Wuest , Commiss ioner Trent Tidwel l , Commiss ioner Damon Mabee, Commiss ioner Doug Neeley, Commiss ioner
CITY OF OREGON CITY PARKS & RECREATION ADVISORY COMMITTEE
Karen Andrews James “Marty” Bertsch Shawn Dachtler Dan Kromer Ted Schumaker Martha Sumption Steve McAdoo Sarah Eubanks L isa Wright ‐Wilson, former member Havan Jones, former member
CITY OF OREGON CITY STAFF
Larry Patterson, City Manager Scott Archer , Community Services Director Larry Potter , Parks & Cemetery Operat ions Manager Denise Kai , Assistant Parks & Recreation Director Kathy Wiseman, Pioneer Center Supervisor Rochel le Parsch, Aquatic & Recreat ion Supervisor J im Row, Former Recreat ion Services Manager
CONSULTANT TEAM
GreenPlay, LLC Design Concepts Geowest ETC/Leisure Vis ion
For more information about this document, contact GreenPlay, LLC At: 3050 Industrial Lane, Suite 200, Broomfield, Colorado 80020, Telephone: 303‐439‐8369 Fax: 303‐439‐0628
Toll Free: 866‐849‐9959 Email: [email protected] Web: www.greenplayllc.com

Oregon City, Parks and Recreation Master Plan Update iii
Table of Contents I. Executive Summary.......................................................................................................................... 1 II. Past, Present, and Future – The Planning Context ........................................................................... 23
A. Vision and Mission..................................................................................................................... 23 B. Purpose of this Plan ................................................................................................................... 25 C. History of Oregon City Parks and Recreation ............................................................................ 25 D. Community Services Department Overview ............................................................................. 26 E. Related Planning Efforts and Integration................................................................................... 28 F. Methodology of this Planning Process....................................................................................... 28 G. Timeline for Completing the Master Plan ................................................................................. 29
III. What We Want ‐ Our Community and Identified Needs............................................................... 31 A. Community Profile and Demographic Information ................................................................... 31 B. Current Park and Recreation Trends ......................................................................................... 37 C. Community and Stakeholder Input............................................................................................ 48 D. Statistically Valid Survey............................................................................................................ 53
IV. What We Have Now – An Analysis of Programs and Spaces .......................................................... 81 A. Recreation Programs and Services ............................................................................................ 81 B. Inventory.................................................................................................................................... 88 C. The GRASP® Level of Service Analysis........................................................................................ 91 D. Level of Service Capacity ......................................................................................................... 103
V. How We Manage ‐ Findings on Administration and Funding ...................................................... 105 A. Administrative, Budgetary, and Programming Analysis .......................................................... 105 B. Alternative Funding Sources.................................................................................................... 111 C. Potential Funding Sources ....................................................................................................... 112 D. Summary of Key Finance and Funding Findings ...................................................................... 121
VI. Recommendations and Action Plans ........................................................................................... 121 A. Recommendations................................................................................................................... 122 B. Recommendation Cost Estimates............................................................................................ 135
iv Oregon City, Parks and Recreation Master Plan Update
List of Tables Table 1: Cost Estimates of Renovations and Additions ....................................................................... 10 Table 2: Cost Estimates of Improvements ........................................................................................... 10 Table 3: Estimated Trail Costs for 2007 ............................................................................................... 13 Table 4: Cost Estimates and Funding Sources for 2008‐2012 Recommended Priorities..................... 21 Table 5: Race Comparisons for 2006 ................................................................................................... 35 Table 6: Educational Attainment – 25 Years and Older (2000) ........................................................... 35 Table 7: Housing Units (2006).............................................................................................................. 36 Table 8: Top 10 Activities Ranked by 2004 National Participation Levels ........................................... 38 Table 9: Selected Sports Ranked by Percent Change from 1999 to 2004 ........................................... 38 Table 10: 2004 vs. 1994 Selected Sports National Participation by Age Group .................................. 39 Table 11: 2004 vs. 1999 National Recreation Participation of Women in Selected Sports................. 40 Table 12: Recreation Activities for Adults 55 and Older (2002) .......................................................... 41 Table 13: Benchmarking – Parks and Trails ......................................................................................... 44 Table 14: Benchmarking – Outdoor Facilities ...................................................................................... 44 Table 15: Benchmarking ‐ Indoor Facilities.......................................................................................... 46 Table 16: Benchmarking – Operating Budget ...................................................................................... 48 Table 17: Strengths of Oregon City’s Parks and Recreation ................................................................ 85 Table 18: Weaknesses of Oregon City’s Parks and Recreation........................................................... 86 Table 19: Opportunities for the Oregon City Community ................................................................... 87 Table 20: Threats to the Oregon City Community ............................................................................... 88 Table 21: Inventory Summary.............................................................................................................. 89 Table 22: Staffing Level Benchmark................................................................................................... 105 Table 23: Fiscal Year 2006/2007 Budget Allocations ......................................................................... 107 Table 24: Cost Recovery by Program Area......................................................................................... 108 Table 25: Program Participation ........................................................................................................ 108 List of Figures Figure 1: Population Projections 2006 to 2011 ..................................................................................... 4 Figure 2: Population Projections 2006 to 2011 ................................................................................... 32 Figure 3: Population Age Distribution – Oregon City, Oregon (2006) ................................................ 33 Figure 4: Population Comparisons: Oregon City, State of Oregon, and US (2006).............................. 34 Figure 5: Household Income– Oregon City compared to Oregon State and the US (2006) ................ 36 Figure 6: LOS Summary Sub‐Area Analysis Matrix.............................................................................. 96 Figure 7: Level of Service Capacities .................................................................................................. 104 Figure 8: Organizational Chart ........................................................................................................... 106
Oregon City, Parks and Recreation Master Plan Update v
Appendices I. Survey Results Crosstabs
A. By Household Size, Park Visitation, Program Participation B. By Paying Additional Maintenance Fees and Property Taxes C. By Years Lived in Oregon City, Household Type, Gender II. Oregon City Pool Assessment III. GRASP® Scoring Method IV. GRASP® Inventory Summary V. GRASP® Perspectives PERSPECTIVE A: GRASP® Inventory PERSPECTIVE B: GRASP® Analysis Sub‐Areas PERSPECTIVE C: GRASP® Perspective – Walkable Access to All Components PERSPECTIVE D: GRASP® Perspective – Access to Indoor Components PERSPECTIVE E: GRASP® Perspective – Access to Outdoor Components PERSPECTIVE F: GRASP® Perspective – Access to Passive Components PERSPECTIVE G: GRASP® Perspective – Access to Active Components GRASP®‐ RECOMMENDATION PERSPECTIVE VI. Cost Recovery Pyramid Methodology VII. Grant Opportunities Related to Parks and Recreation VIII. Sample Partnership Policy IX. Sample Sponsorship Policy

Oregon City, Parks and Recreation Master Plan Update 1
I. Executive Summary Purpose of this Plan The Oregon City Parks and Recreation Master Plan Update is intended to help meet the needs of current and future residents by positioning Oregon City to build on the community’s unique parks and recreation assets and identify new opportunities. The citizen driven five‐year Implementation Plan establishes a clear direction to guide city staff, advisory committees, and elected officials in their efforts to enhance the community’s parks and recreation programs, services and facilities. Although the Community Services Department is also responsible for the library and the cemetery, the Master Plan Update specifically does not address this portion of department operations and is focused strictly on parks and recreation issues.
Mission Statement The benefits of parks and recreation are necessary to develop healthy individuals and communities when the economy is strong, and are even more important when we face economic and social challenges. The mission of parks and recreation was crafted from feedback obtained throughout the Master Plan Update. Oregon Recreation and Parks Association's (ORPA) mission describes the primary purpose or "business" of parks and recreation in Oregon: Strengthen community Parks, recreation facilities, programs, and community events are key factors in strengthening community image and creating a sense of place. Protect natural resources By acquiring, managing, and restoring valuable resources as open space such as: rivers, streams, greenways, view sheds, forests and other habitat areas, natural resources are protected and habitat required for the survival of diverse species is preserved. Foster human development Parks and recreation services foster social, intellectual, physical, and emotional development. Strengthen safety and security Park and recreation professionals provide safe environments for recreation and design programs and services specifically to reduce criminal activity. Support economic development Recreation programs and facilities attract and retain businesses and residents, as well as attract tourists. Parks and recreation provides jobs and generates income for the community and for local businesses. Preserve cultural resources Parks and recreation professionals preserve our historical and cultural heritage for the enjoyment of citizens and future generations.
Oregon City, Parks and Recreation Master Plan Update 2
Provide recreational and educational experiences Through programmed and self‐facilitated recreation, a variety of benefits to individuals and society are achieved. Recreational and educational experiences can enhance ones current career and help inspire future career aspirations. Increase cultural unity Parks and recreation increases cultural unity through experiences that promote cultural understanding and celebrate diversity. Promote health and wellbeing Participation in recreation improves physical and emotional health. Facilitate community problem solving Park and recreation professionals have skills in facilitation and leadership that can be applied to resolve community problems and issues. Be good stewards of public resources Park and recreation professionals use resources effectively to ensure best use of public funds. Park maintenance staff preserves parks and community facilities to protect public investments.
Recent History of Oregon City Parks and Recreation Prior to 1999, the parks and recreation functions were fragmented under different city departments. The Community Activities Department included the Oregon City Pool, Pioneer Center, Carnegie Center (after it became an arts and community center in 1995), and recreation programs and activities. Parks and cemetery functions were under the management of the Public Works Department. Following the recommendations of the 1999 Parks and Recreation Master Plan (J.C. Dragoo & Associates), the various functions of parks and recreation services were consolidated into the Parks and Recreation Department in 2000. This created a more cohesive and coordinated approach to their operations and services, as well as being the catalyst for launching an emphasis on parks acquisition and development growth, which continues today. In spring 2002, following the retirement of the long‐time City Library Director, library operations were folded in with the Parks and Recreation Department to create the current Community Services Department.
Community Services Department Overview The City of Oregon City Community Services Department is responsible for the direction, operations, and maintenance of a wide variety of services, programs, and facilities, including:
• Mt. View Cemetery • Carnegie Center • Pioneer Adult Community Center • Oregon City Pool • Ermatinger House • Oregon City Public Library • Parks acquisition, planning, and development • Trail and park maintenance • Recreation programs, classes, and activities
Oregon City, Parks and Recreation Master Plan Update 3
Department Inventory Overview • Total properties maintained by Park staff = 47 properties • Total acreage of properties = approximately 250 acres • Total acreage mowed = approximately 120 acres
Department Staffing Levels The most significant challenge faced by the Parks Maintenance division is the ability to provide adequate system maintenance at current staffing and funding levels. This issue is magnified by the addition of new parks and facilities to meet the needs of the growing community. Throughout the public input process, information gathering, park and facility inventory and assessment, the common issue that continued to surface was the Department’s constant challenge resulting from extremely low staffing levels. The staffing levels are the product of severe funding source limitations, which have hindered the Department. Historically, the Department has been extremely dependent on volunteer efforts. All parks and cemetery operations and maintenance are accomplished with current parks and cemetery staff consisting of one manager, one part‐time office specialist, two full‐time parks maintenance specialists, and two full‐time cemetery staff. During the spring and summer there is funding for seasonal maintenance workers who split their time between cemetery and parks. As more parks and facilities are added to the maintenance inventory, service levels will reduce unless staff and resources are increased. In addition, the lack of specialized staff has restricted the number and variety of recreation programs and special events that the Department can provide for the community.
Community Profile Service Area and Population Oregon City also has a unique topography, which includes three terraces above the Willamette River. The City’s quality of life and recreation opportunities are highly valued by the community. This is evident by the City’s 21 parks, a historic cemetery, six indoor facilities, and 258.2 acres of parkland and open space located throughout Oregon City. Most residents can find a neighborhood or community park within easy walking distance of their home. For this study, several sources were examined to determine current and future population projections for the City of Oregon City:
• US Census (2000) • ESRI Business Information Solutions (demographic studies) • Portland State University – Population Research Center
The estimated population for the City of Oregon City in 2006 is 29,540 people, according to Portland State University’s Population Research Center estimates, as compared to ESRI Business Solutions’ estimate of 28,795. Although slight, it is important for the City to consider the difference in population estimates, so as to have a complete knowledge of the community profile, demographics, and recreation needs. Population Forecasts Although we can never know the future with complete certainty, it is helpful to make assumptions about it for economic reasons. According to ESRI Business Solutions, the population of Oregon City is
Oregon City, Parks and Recreation Master Plan Update 4
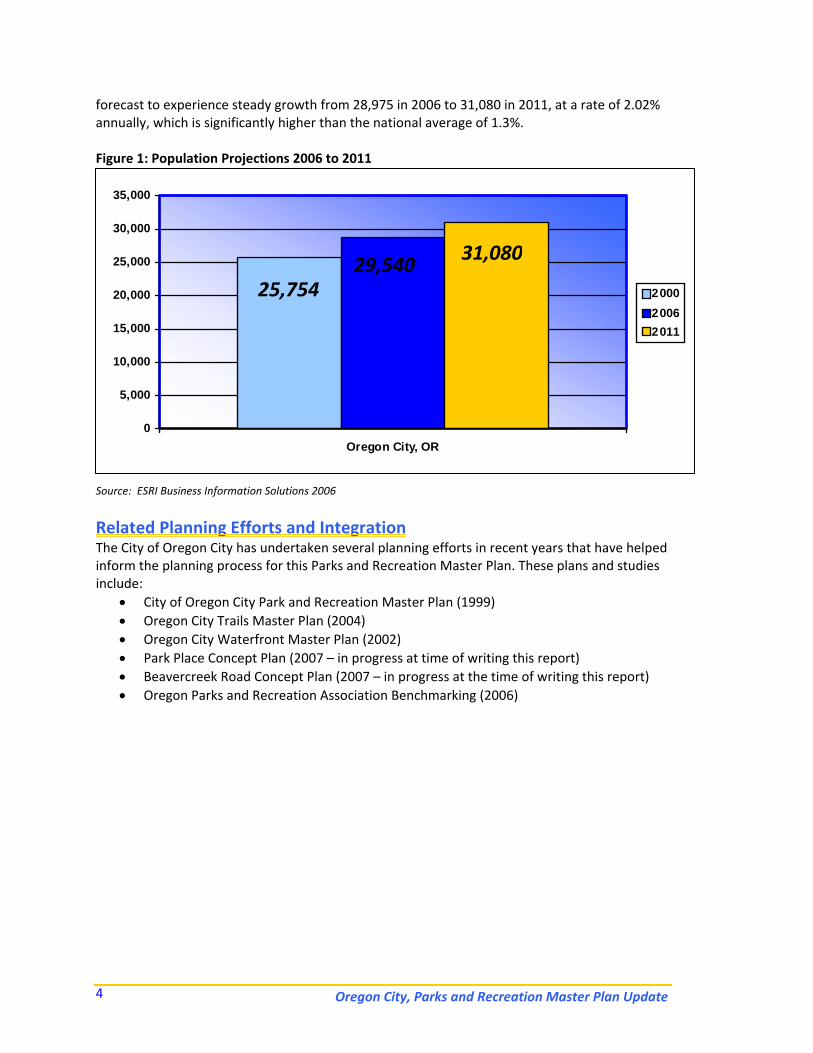
forecast to experience steady growth from 28,975 in 2006 to 31,080 in 2011, at a rate of 2.02% annually, which is significantly higher than the national average of 1.3%. Figure 1: Population Projections 2006 to 2011
Source: ESRI Business Information Solutions 2006
Related Planning Efforts and Integration The City of Oregon City has undertaken several planning efforts in recent years that have helped inform the planning process for this Parks and Recreation Master Plan. These plans and studies include:
• City of Oregon City Park and Recreation Master Plan (1999) • Oregon City Trails Master Plan (2004) • Oregon City Waterfront Master Plan (2002) • Park Place Concept Plan (2007 – in progress at time of writing this report) • Beavercreek Road Concept Plan (2007 – in progress at the time of writing this report) • Oregon Parks and Recreation Association Benchmarking (2006)
0
5,000
10,000
15,000
20,000
25,000
30,000
35,000
Oregon City, OR
200020062011
25,754 29,540 31,080
Oregon City, Parks and Recreation Master Plan Update 5
Methodology of this Planning Process This project has been guided by a project team, made up of city staff and the Parks and Recreation Advisory Committee. This team met with consultants from the GreenPlay team and provided input throughout the planning process. This collaborative effort creates a plan that fully utilizes the consultant’s expertise and incorporates the local knowledge and institutional history that only community members can provide. The project consisted of the following tasks: Needs Assessment and Public Involvement:
• Review of previous planning efforts and city historical information • Consideration of the profile of the community and demographics, including anticipated
population growth • Extensive community involvement effort, including focus groups, meetings with key
stakeholders, communitywide public meetings, and a statistically valid community interest and opinion survey
• Identification of alternative providers of recreation services to provide insight regarding the market opportunities in the area for potential new facilities and services
• Research of trends and statistics related to American lifestyles to help guide the efforts of programming staff
Level of Service Analysis:
• Interviews with staff to provide information about parks and recreations facilities and services, along with insight into the current practices and experiences of the City in serving its residents and visitors
• Analysis addressing recreation, parks, and related services
Inventory: • Inventory of parks and facilities using existing mapping, staff interviews, and onsite visits to
verify amenities and assess the condition of the facilities and surrounding areas Assessment and Analysis:
• Review and assess relevant plans • Organizational Analysis • Measurement of the current delivery of service using the GRASP® Level of Service Analysis
and allowing for a target level of service to be determined that is both feasible and aligned with the desires of citizens as expressed through the citizen survey. This analysis is also represented graphically through Perspectives.
• Exploration of finance and funding mechanisms to support development and sustainability of the system
Recommendations: Goals, Objectives, and Action Plan:
• Identification and categorization of recommendations into themes with goals, objectives, and an action plan for implementation
• Development of an action plan for capital improvements including cost, funding source potentials, and timeframe to support the implementation of the plan
Oregon City, Parks and Recreation Master Plan Update 6
Timeline for Completing the Master Plan Update Start‐up July 2006 Community Process September 2006 – January 2007 Demographic and Trends Analysis and Projections October ‐ December 2006 Community Needs Assessment Survey November 2006 ‐ February 2007 Inventory and assessment of existing facilities September ‐ December 2006 Organizational SWOT Analysis October ‐ December 2006 Financial Analysis October 2006 – April 2007 Findings Compilation Report and Presentation March 2007 Development of Draft Master Plan March ‐ April 2007 Presentation of Draft Master Plan July 2007 Presentation of Final Master Plan August 2007 – final adoption of Plan
Community Outreach As part of this planning effort, a complete parks, recreation, open space and trails needs assessment was conducted. Activities included obtaining community input through focus groups, stakeholders meetings, community wide public meetings, and the random distribution of a comprehensive statistically valid community survey; creating an in‐depth profile of demographics of the Oregon City area; and examining national and local recreational trends. A total of 40 citizens participated in two‐hour focus groups and an open public meeting the week of September 11, 2006. Participants represented a wide variety of community interests including park and recreation users, parents of children that participate in city programs, concerned residents, business representatives, and partnering organizations. The consultants facilitated the discussion and led the participants through a series of 20 questions to gain input on a broad range of issues about or affecting the City. The City of Oregon City conducted a Community Attitude and Interest Survey during December of 2006 and January of 2007 to help establish priorities for the future improvement of parks and recreation facilities, programs, and services within the community. The survey was designed to obtain statistically valid results from households throughout the City of Oregon City. The survey was administered by a combination of mail and phone. A survey firm, Leisure Vision, worked extensively with the City of Oregon City officials and members of the GreenPlay, LLC consultant team in the development of the survey questionnaire. This work allowed the survey to be tailored to issues of strategic importance to effectively plan the future system. In December 2006, surveys were mailed to a random sample of 1,500 households in Oregon City. Approximately three days after the surveys were mailed each household that received a survey also received an electronic voice message encouraging them to complete the survey. In addition, about two weeks after the surveys were mailed Leisure Vision began contacting households by phone either to encourage completion of the mailed survey or to administer the survey by phone.
Oregon City, Parks and Recreation Master Plan Update 7
The goal was to obtain a total of at least 300 completed surveys. This goal was far exceeded, with a total of 400 surveys completed. The results of the random sample of 400 households have a 95% level of confidence with a precision of at least +/‐ 5%.
Key Findings of the Community Attitude and Interest Survey
Overall Importance • Sixty‐eight percent of respondents indicated that parks and recreation services were
very, or somewhat, important. Funding & Pricing
• Fifty‐eight percent of respondents indicated they would/or might vote in favor of the bond election.
• Sixty‐eight percent of respondents indicated they would pay some additional property taxes per month.
• Seventy‐six percent of respondents indicated they would pay some additional maintenance utility fee per month.
High need and interest in parks and recreation programs include:
• Adult fitness and wellness programs • Citywide special events • Water fitness programs • Youth sports • Local history programs • Youth learn to swim programs
High need and desire for parks and recreation facilities include:
• Walking and biking trails • New parks • Open space and natural areas • Large picnic areas and shelters • Swimming pool • Playgrounds • Indoor Program Space
More detailed information can be found in Section III D.
Oregon City, Parks and Recreation Master Plan Update 8
Summary of Key Finance and Funding Findings Organizational Management The Oregon City Community Services Department resources are below standards for staffing resources. If Oregon City considers expanding recreation services and/or facilities in the future, staffing resources and allocations may need to be reevaluated. Finance and Cost Recovery The City of Oregon City has an average cost recovery for parks and recreation services. Current funding for park capital improvements is extremely limited. Ongoing operational and maintenance funding is very low and the level of service to the community is minimal. Partnerships Oregon City has no overall partnership policy or plan. There is substantial opportunity for additional partnerships and alternative funding, but no allocated staff or resources to procure these functions.
Recommendations and Action Plans
Goal 1: Maximize the Planning Effort First Steps Objective: Incorporate the action items of this plan into the City’s annual work plans to achieve the recommendations of this plan and to enhance effectiveness of staff effort. Strategy:
• Assign responsibility and time frame, and allocate resources necessary to complete each action identified in annual work plans.
Objective: Assure that all levels of staff are informed of and are set up to work together to implement the recommendations and strategies of the plan. Strategies:
• Inform all levels of staff of the direction of the Plan, allow for staff input, encourage buy‐in, and encourage input from all staff members.
• Provide cross‐departmental staff teams/team members, as appropriate, with education development opportunities, necessary equipment, and supplies.
Goal 2: Increase Level of Service in Parks and Facilities Objective: Increase level of maintenance throughout the parks system to increase the level of service. National averages show that park systems that have an average of one full‐time employee (FTE) per 7 to 10 developed acres are able to adequately maintain parks to a safe and publicly acceptable level. Oregon City has approximately one FTE for every 16 acres which shows a staffing level much below the national average. In order to meet the low end of national staffing averages Oregon City
Oregon City, Parks and Recreation Master Plan Update 9
would need to almost double maintenance staff by adding eight positions. Although the City’s financial situation may not allow the Department to add eight staff members, it is imperative that the maintenance staff increase not only to keep up with current parks, but also to be able to adequately maintain the parks that are planned for developments such as the Park Place, Beaver Creek, and the Cove. Without additional maintenance staff the Department will struggle to complete improvements listed as recommendations in this plan. Strategies:
• Increase staffing for parks maintenance. • Increase funding for parks maintenance by increasing the city maintenance utility fee
referenced in Goal 5, as well as Section V‐ C. • Provide consistent levels of maintenance throughout the parks system by implementing
standard maintenance procedures and developing budget‐planning tools where possible. • Develop a playground replacement schedule for all playground equipment. • Develop a maintenance equipment replacement schedule to plan for major expenditures.
Objective: Use available resources and partners to aid in park maintenance. Strategies:
• Continue the park host program, ballfield maintenance agreements with leagues, and partnerships with high school classes, and evaluate their effectiveness on an annual basis.
• Continue to look for opportunities to partner with community groups and volunteers to increase the quality of maintenance in parks.
Objective: As resources and opportunities exist, repair and renovate existing facilities to bring existing parks up to the level of community expectations. Strategies:
• Renovate the Oregon City Swimming Pool per the survey results, and as recommended in the Oregon City Pool Study (Appendix II).
• Improve the basketball court at Barclay Hills Park. • Replace the playground at Canemah Park. • Add a commercial caterer’s kitchen to Carnegie Center. • Evaluate the need for and possibly renovate the fitness course at Chapin Park.
Oregon City, Parks and Recreation Master Plan Update 10
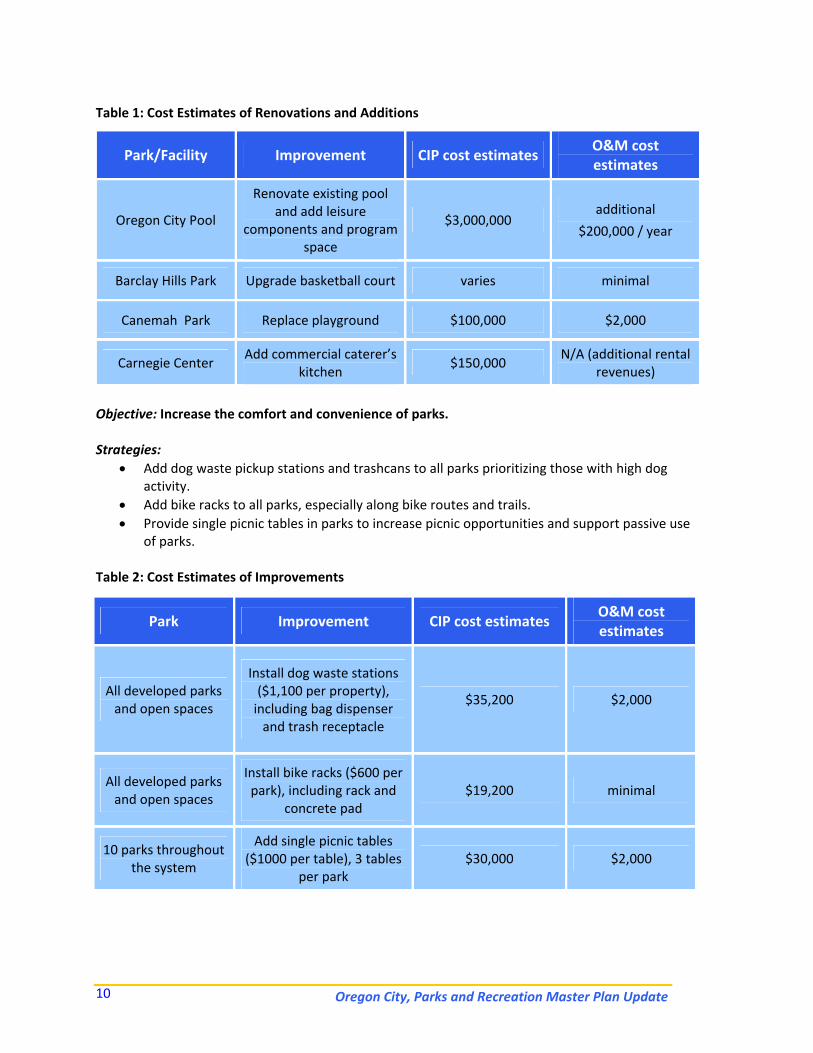
Table 1: Cost Estimates of Renovations and Additions
Park/Facility Improvement CIP cost estimates O&M cost estimates
Oregon City Pool
Renovate existing pool and add leisure
components and program space
$3,000,000 additional
$200,000 / year
Barclay Hills Park Upgrade basketball court varies minimal
Canemah Park Replace playground $100,000 $2,000
Carnegie Center Add commercial caterer’s
kitchen $150,000
N/A (additional rental revenues)
Objective: Increase the comfort and convenience of parks. Strategies:
• Add dog waste pickup stations and trashcans to all parks prioritizing those with high dog activity.
• Add bike racks to all parks, especially along bike routes and trails. • Provide single picnic tables in parks to increase picnic opportunities and support passive use
of parks. Table 2: Cost Estimates of Improvements
Park Improvement CIP cost estimates O&M cost estimates
All developed parks and open spaces
Install dog waste stations ($1,100 per property), including bag dispenser and trash receptacle
$35,200 $2,000
All developed parks and open spaces
Install bike racks ($600 per park), including rack and
concrete pad $19,200 minimal
10 parks throughout the system
Add single picnic tables ($1000 per table), 3 tables
per park $30,000 $2,000
Oregon City, Parks and Recreation Master Plan Update 11
Objective: Increase diversity of components in parks. Strategies:
• Increase the LOS provided to the community by adding new facilities like those found in other Oregon parks such as: leisure aquatic amenities, an off‐leash dog park, a nature center, and an amphitheater. Explore the idea of adding an adventure or destination playground, farmer’s market area, and outdoor performing arts space.
• Solicit public input in the development or renovation of all parks. Objective: Determine the best uses for neighborhood parks. This planning process recognizes that neighborhood parks are valued by the residents of Oregon City. Seventy percent of the survey respondents stated that they have a need for neighborhood parks. This facility was second only to walking and biking trails in terms of need. In addition, 34% of the respondents list neighborhood parks in the top four most important facilities to have in their parks system. Because neighborhood parks are so important to residents, it will be important to use these parcels to keep up with the needs of the community. However, it is recommended that the City should focus its efforts towards neighborhood parks of at least three acres in size. It is important that plans for these parks be developed with neighborhood input. These plans may call for some development or may call for the parks to be left undeveloped, depending on the feedback from the neighborhoods. Each existing or future neighborhood park should be considered on an individual basis for its current or potential recreational value. Strategies:
• Hold public meetings or visit with neighborhood groups to gain input about future of neighborhood parks.
• Create master plans for each park based on public input. • Implement master plans after funding has increased to keep up with maintenance.
Objective: Determine the most efficient action to reduce the number of mini‐parks or pocket parks owned and maintained by the City. Respondents to the survey also list their need for small neighborhood parks as being met. Currently the Oregon Community Services Department has several very small neighborhood (mini or pocket) parks that are either undeveloped or have a very low level of development. These parks, less than three acres, known as "mini‐parks" or "pocket parks,” should be discouraged because of their limited recreational value and high cost to maintain. There are a few cases of specialized park sites that are smaller than three acres, such as Jon Storm Park or Richard Bloom Tots' Park, where the parks should be developed and maintained because of other considerations. Each existing or future mini or pocket park should be considered on an individual basis for its current or potential recreational value. For these same reasons, the City should not assume the ownership or operations of any privately developed/owned parks which do not meet these same thresholds: at least three acres in size and built to City parks standards. Strategies:
• Explore opportunities for agreements with HOA's and neighborhood groups to maintain small neighborhood parks in exchange for development of the park.
Oregon City, Parks and Recreation Master Plan Update 12
• Hold public meetings or visit with neighborhood groups to gain input about future of neighborhood parks.
• The City should consider surplusing/disposing of existing mini‐parks/pocket parks where feasible, after the local neighborhood has been given the opportunity to assume maintenance and operation responsibilities for the site.
Objective: Continue to plan for parkland acquisition. Future park acquisition should be considered on an individual basis for its current or potential recreational value. Strategies:
• Purchase the Glen Oaks Road/high school acquisition area • Investigate and maximize opportunities presented by the Park Place, Beaver Creek, South
End, The Rivers, and Cove Developments to increase city park acres from 258.2 to meet the ORPA median of 422 park acres.
• Pursue the acquisition of Saunders property. • Look for land acquisition opportunities that are more than three acre parcels in the
southern part of the Hilltop east of Hwy 213, in the “South End” area near the edge of the current city boundary or in the Urban Growth Boundary (roughly between Central Pt. and S. End Roads), in the Hilltop area east of Clackamas Community College and Beavercreek Rd. (UGB/future growth areas), and in the eastern portion of the Middle Level.
• The City should not acquire or develop additional mini‐parks or pocket parks that are less than three acres in size. Mini/pocket parks may be developed within single‐family subdivisions as long as they are owned and maintained by homeowners associations.
See GRASP® Recommendation Perspective located in Appendix V.
Goal 3: Increase access to parks by implementing trails plan Objective: Use the 2004 Oregon City Trails Master Plan to seek out opportunities to increase miles of trails within Oregon City (currently six) to meet, if not greatly exceed, the ORPA median of nine miles of developed trail. Strategies:
• Work to fund Tier 1 local trails as identified in the 2004 Trails Master Plan. Place emphasis on constructing trails that connect parks to other parks, trails, or neighborhoods. For example: Park Place Development Trails (L4), Barclay Park Connection (L11), Parks Trail (L21), and Wesley Lynn – Chapin Trail (L23).
• Continue to fund planning and construction for Tier 1 Regional Trails as identified in the 2004 Trails Master Plan. Use the Trails Master Plan for priorities and specifics about implementation costs.
• As funding permits, determine the existing condition and location of the Oregon Trail‐Barlow Road Historic Corridor and review the existing standards within the Oregon City Municipal Code to determine if modifications to the development standards and/or City master plans are necessary to protect the corridor. If modifications to the existing code language are proposed, they should include methods to encourage property owners to preserve the historic corridor in the original condition while allowing the property to be
Oregon City, Parks and Recreation Master Plan Update 13
used in an economically viable manner. This strategy recommendation shall utilize/reference the Barlow Road Historic Corridor Westernmost Segment of the Oregon Trail Background Report & Management Plan (Clackamas County, 1993), or most current adopted report.
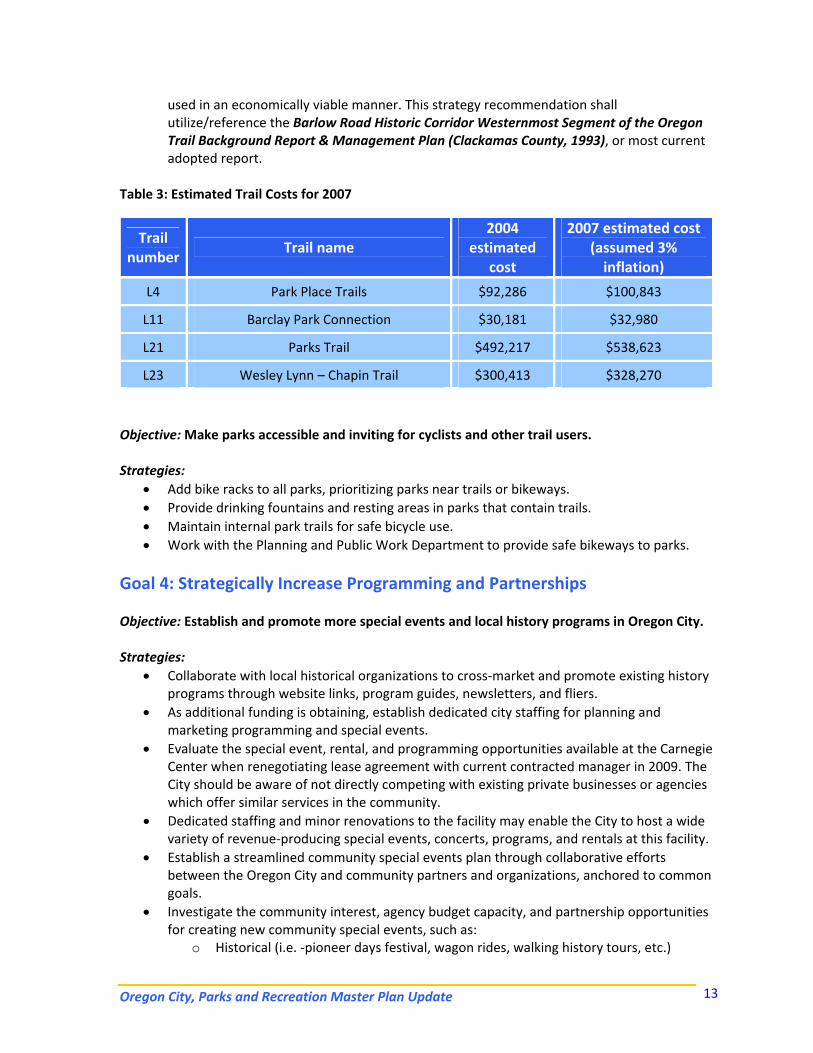
Table 3: Estimated Trail Costs for 2007
Objective: Make parks accessible and inviting for cyclists and other trail users. Strategies:
• Add bike racks to all parks, prioritizing parks near trails or bikeways. • Provide drinking fountains and resting areas in parks that contain trails. • Maintain internal park trails for safe bicycle use. • Work with the Planning and Public Work Department to provide safe bikeways to parks.
Goal 4: Strategically Increase Programming and Partnerships Objective: Establish and promote more special events and local history programs in Oregon City. Strategies:
• Collaborate with local historical organizations to cross‐market and promote existing history programs through website links, program guides, newsletters, and fliers.
• As additional funding is obtaining, establish dedicated city staffing for planning and marketing programming and special events.
• Evaluate the special event, rental, and programming opportunities available at the Carnegie Center when renegotiating lease agreement with current contracted manager in 2009. The City should be aware of not directly competing with existing private businesses or agencies which offer similar services in the community.
• Dedicated staffing and minor renovations to the facility may enable the City to host a wide variety of revenue‐producing special events, concerts, programs, and rentals at this facility.
• Establish a streamlined community special events plan through collaborative efforts between the Oregon City and community partners and organizations, anchored to common goals.
• Investigate the community interest, agency budget capacity, and partnership opportunities for creating new community special events, such as:
o Historical (i.e. ‐pioneer days festival, wagon rides, walking history tours, etc.)
Trail number
Trail name 2004
estimated cost
2007 estimated cost (assumed 3% inflation)
L4 Park Place Trails $92,286 $100,843
L11 Barclay Park Connection $30,181 $32,980
L21 Parks Trail $492,217 $538,623
L23 Wesley Lynn – Chapin Trail $300,413 $328,270
Oregon City, Parks and Recreation Master Plan Update 14
o Arts and Culture (i.e. ‐movies and concerts in the park, art festivals, children’s storytelling, etc.)
o Holiday related (i.e. ‐Halloween haunted forest, egg scrambles, holiday market, etc.) o Health and Wellness (i.e. ‐fun runs and walks, community bike rides, dance contests,
health fairs, etc.) Objective: Strategically Meet the Community’s Demand for New Programs and Services Provide a variety of recreational programming and opportunities to meet the various needs of the community. Strategies:
• Allocate resources to provide quality recreation programming, based on community input. • Gain input from recreation participants through post‐program or event evaluations. • Continue to gain information from the community as to what programs are desired and
popular through a statistically valid survey, at minimum every five years. • Initiate collaborations to provide a greater quantity of diverse, cost effective recreation
programs and activities. • Expand the number of community‐wide and regional special events which should be located
in parks and/or facilities best suited to accommodate the activity/event (i.e. –historical festivals, concerts, etc.)
• Expand fitness and wellness programs for the entire community, with a focus on aquatics and adult programs.
o Consider marketing the cardio and weight facilities at the Pioneer Center to all ages, to better serve the needs of the entire community.
o Provide additional health and wellness programs like yoga, Pilates, and aerobics. • Continue and expand youth learn‐to‐swim programs to meet the interests and safety needs
of the community. • Create additional opportunities for adult and youth “recreational” sports activities (soccer,
basketball, softball, baseball, and swimming programs). Objective: Collaborate to attract more residents and visitors to utilize and participate in Oregon City’s parks and recreation services and facilities Strategies:
• Work with local tourism organizations to attract private recreation companies to the Oregon City area to provide activities such as environmental and wildlife education, tours to nearby attractions, historical tours, guided hiking, and ecotourism.
• Partner with Fine Arts Starts to provide drop‐in single‐session activities such as: art workshops, culinary instruction, gallery tours, instructional dance classes, drama classes, and theatre/film viewings at the Carnegie Center.
• Continue and establish relationships with the following partner organizations to implement the recommendations of this master plan and to provide an increased number of and high quality recreation programs, activities, and services that will attract both residents and visitors:
o Local volunteers o Youth sports associations
Oregon City, Parks and Recreation Master Plan Update 15
o Clackamas Community College o Clackamas County Department of Aging o End of the Oregon Trail Interpretive Center o School District o John Inskeep Environmental Learning Center o National Park Service – McLoughlin House National Historic Site o Stevens‐Crawford Museum o Home Orchard Society Arboretum
Objective: Increase Partnerships and Collaborative Efforts Build partnerships within the community to take advantage of existing facilities, share new facilities, and provide additional programming and services to the community. Strategies:
• Continue dialogue between the Parks and Recreation Department and Public Works about the potential for staff sharing for responsibilities such as medians, landscaping, and grounds maintenance.
• Investigate partnerships with local medical and health organizations to increase fitness and health programming for the aging population within the community.
• Create new and formalize existing partnerships (see Sample Partnership Policy in Appendix VIII) with equity agreements that are reviewed annually.
• Strengthen and expand Intergovernmental Agreements (IGA's) with schools for use of fields, gyms, and multipurpose spaces.
• Explore the possibilities of revising and promoting an adopt‐a‐park program to help with park maintenance, beautification, and civic pride.
• Create a “Park Ambassador” program where residents living adjacent to parks are trained to inspect parks and then file a weekly report in exchange for a nominal fee or pass.
Goal 5: Increase Cost Recovery and Funding Objective: Research potential traditional funding opportunities. The City has the ability to use these mechanisms to enhance the quality of life in Oregon City and expand recreation, park, open space, trails, programs, and services to the community. The survey indicated initial support for additional fees and taxes to support current City operations and maintenance needs and to provide desired facilities, parks, trails, programs, and services.
Strategies: • Based on strong positive support from the community survey, work with the City
Commission to establish an additional five‐dollar maintenance utility fee (per household/per month) to build and operate City parks, recreation, and aquatic facilities. This maintenance utility fee is established for all households for the purpose of assisting in funding the operational and maintenance costs for facilities to enhance the level of service to the community. It is not considered a user fee for services.
• Work with residents and partners to establish additional revenue through a combination of the following sources to implement the recommendations of the Master Plan:
Oregon City, Parks and Recreation Master Plan Update 16
o City maintenance utility fees increase o System development charge increase o City sales tax increase o Bond referendum / city property tax o Redirection of existing City funds o Alternative funding (see Section V‐ C.) o Strategic partnerships o Fees and charges (particularly with athletic associations) o Program grants (see Appendix VII)
• Further investigate support for an education campaign for a ballot initiative to pass a tax increase or bond referendum for future capital improvements.
• Utilize additional funding gained to adequately staff the Department; increasing staffing levels from 11 FTE’s and 40 PTE’s (2007) by 100% over the next five years.
Objective: Pursue alternative funding to implement the Master Plan. Many departments within Oregon City have experienced challenging times in the recent past, with limited funding and staffing levels, and the Department should explore the best means of achieving its funding goals. Alternative funding methods may be instrumental to the operations of the City’s recreation programs and facilities on an ongoing basis. Allocating resources (assigning staff time, matching funds, etc.) to pursue alternative funding should be considered an investment in the future, with an outlined and expected positive rate of return. Strategies:
• Identify opportunities to increase community support and revenue opportunities such as grants, partnerships, sponsorships, volunteers and earned income (see Section V‐C. for Alternative Funding Resources).
• Assign staff resources and/or investigate the possibility of utilizing volunteer efforts to apply for such funding.
• Develop a “Wish List” to identify philanthropic opportunities that align with these needs. Once identified, aggressively apply for grant funding.
• Expand and formalize a volunteer program to include standards, recruiting, training, retaining, and rewarding volunteers in all program areas.
• Create new and formalize existing Sponsorships (see Sample Sponsorship Policy in Appendix IX) with equity agreements that are reviewed annually.
• Create an annual “Sponsorship Manual” listing all the opportunities for the year and distribute within the community in a menu format that creates a sense of urgency within the business community.
• Establish a 501 (c) (3) Parks and Recreation Foundation to facilitate the receipt of grant funds and other fundraising activities.
• Seek collaborations with developers for the Park Place, Beaver Creek, and Cove development projects to include recommended parks and recreation facilities and standards as outlined in the Improve Level of Service Section (Goal 2).
Oregon City, Parks and Recreation Master Plan Update 17
Objective: Create a cost recovery philosophy and policy. It is important for the City to develop a pricing and cost recovery philosophy that reflects the values of the community and the responsibility it has to the community. This philosophy will be especially important if the City moves forward in the development of new programs and additional and/or expanded facilities; and as it strives for sustainability and determines how much it is willing to subsidize operations. One means of accomplishing this goal is applying the Pyramid Methodology. This methodology develops and implements a refined cost recovery philosophy and pricing policy based on current “best practices” as determined by the mission of the agency and the program’s benefit to the community and/or individual. Critical to this philosophical undertaking is the support and understanding of elected officials and ultimately, its citizens. Whether or not significant changes are called for, the agency wants to be certain that it is philosophically aligned with its residents. The development of the core services and cost recovery philosophy and policy is built on a very logical foundation, using the understanding of who is benefiting from parks, recreation, and natural resources services to determine how the costs for that service should be paid. For an overview of the Pyramid Methodology, please review the contents in Appendix VI. Strategies: Develop ongoing systems that help measure cost recovery goals and anticipate potential pitfalls utilizing the following points:
• Understand current revenue systems and their sustainability. • Track all expenses and revenues for all programs, facilities, and services to understand
their contribution to overall department cost recovery. • Analyze who is benefiting from programs, facilities, and services, and to what degree
they should be subsidized. • Fees for programs should acknowledge the full cost of each program (those direct and
indirect costs associated with program delivery) and where the program fits on the scale of who benefits from the program of service to determine appropriate cost recovery target. Current cost recovery is at an average level and creating a cost recovery philosophy could enhance revenues to an above average level for operations and maintenance.
• Define direct costs as those that typically exist purely because of the program and change with the program.
• Define indirect costs as those that would exist anyway (like full time staff, utilities, administration, debt service, etc.)
• Define ability to pay as an implementation concern to be addressed through a fee reduction or scholarship program.
• Continue to encourage the pursuit of alternative funding for the Department.
Oregon City, Parks and Recreation Master Plan Update 18
Objective: Increase participation and revenue from current services. Strategies:
• Utilize the marketing strategies in the Marketing, Communications, and Credibility section (Goal 6), to work to increase participation numbers and user fee revenue.
• Evaluate participation numbers of current programming so as to increase marketing and participation in programs that are not currently at capacity.
• Establish user fees for adult athletic associations using city recreation facilities that cover all direct costs of the field or facility use. Seek means with youth athletic associations using city facilities that minimally cover the costs of their use.
Goal 6: Marketing, Communications, and Credibility Objective: Generate awareness and credibility about Community Service offerings and needs as expressed by the public. Strategies:
• Formalize an evaluation and annual in‐house benchmarking program to solicit participant feedback and drive programming efforts.
• Collect feedback data that supports the expressed desire for improvements to programs and activities.
• Create a “Mystery Shopper” program where secret shoppers evaluate services anonymously and results are tracked.
• Prepare an annual report providing information to the public about parks and recreation funding, stewardship of tax dollars and fees and charges, and distribute the report as widely as possible.
• Work with the Chamber of Commerce and the local Welcome Wagon to develop information packets that promote city services to tourists and new residents.
• Create an annual marketing plan for the Community Services Department. • Develop an evaluation process for marketing media such as newspaper, seasonal brochures,
website, direct mail, targeted e‐mails, radio, and television advertising to continuously determine effectiveness of marketing dollars.
• Create seamless product delivery for park and recreation services that delivers from a consumer vantage.
Objective: Create a seamless and cohesive customer service delivery system for the provision of all community services programs and services regardless of the location. Strategies:
• Continue expanding current registration system to a fully integrated fax, on‐line, and phone registration system.
• Network the registration system into all Community Services facilities for ease of registration for patrons.
• Develop a comprehensive cross training program for all staff and instructors including knowledge of all program areas as well as customer service.
Oregon City, Parks and Recreation Master Plan Update 19
• Use program tracking and evaluation tools to capacity by designing reports to readily identify life cycles of programs, identify programs not meeting minimum capacity (review all program minimums for cost effectiveness), identify waiting lists, etc.
Goal 7: Track Performance Measures Objective: Create standards for all community services activities and services. Strategies: Establish service standards for all community services activities. Suggested criteria for service standards include:
• Programs: o Participation levels o Revenue o Instructors o Customer satisfaction o Cost per experience (or per hour, per class) o Customer retention
• Instructors: o Experience o Knowledge o Friendliness o Recruiting o Rewarding o Training o Standards
• Volunteers: o Experience o Knowledge o Friendliness o Recruiting o Rewarding o Training o Standards
• Facilities: o Cleanliness o Aesthetics o Comfort
• Staff: o Experience o Knowledge o Friendliness o Rewarding o Training o Trends
Strategies: • Identify all major maintenance tasks including such things as:
o Turf /Mowing o Plantings o Restrooms
Oregon City, Parks and Recreation Master Plan Update 20
o Sidewalks and paths o Irrigation o Weed and insect control o Curb appeal o Playground and picnic equipment o Courts and fields o Litter control
• Evaluate and develop a scoring system for each task to meet desired and consistent service levels.
• Involve staff in the development of the standards and scoring system. • Conduct maintenance standards training for all staff. • Establish and monitor recordkeeping procedures to document the actual hours and
materials costs for each maintenance operation. • Apply appropriate maintenance standards and define set up/tear down requirements for all
special events, tournaments, or other activities that currently stress resources. Assure adequate staffing and funding to take on the task, prior to making a commitment.
Goal 8: Sustainability Objective: Follow the defined goals and adopted policies for sustainability set forth by the City Commission as this five‐year Plan is implemented. A sustainability effort within all city departments is a top priority of the City Commission. The City of Oregon City defines sustainability as “Sustainable development is development that meets the needs of the present without compromising the ability of future generations to meet their own needs”. This entire Plan Update is founded in sustainability in that it has a realistic five‐year implementation plan and strongly addresses the need to take care of that which we already have (e.g. deferred maintenance, and having a plan to maintain that in which we build). See recommendations for additional maintenance staff and resources (Goal 2). Strategies:
• Refer to and implement “The U. S. Mayors’ Climate Protection Agreement” adopted by the City of Oregon City Commission in January of 2007 wherever possible.
• Implement the Oregon Recreation and Parks VIP Strategic Plan (Vision) that has goals which address natural resource protection, public resource stewardship, cultural resources, economic development, and other sustainability related practices.
• Continue current sustainability practices in progress including: o Using alternative energy sources when possible o Minimize vehicle use o Recycle wherever possible o Minimize printing, utilize efficient printing practices o Use file sharing practices o Turn off all unnecessary electrical uses such as calculators, radios, etc. o Unplug chargers when not in use o Utilize Energy Saver features on machines when possible o Utilize biodegradable or recycled products where possible o Install motion sensor light switches in all buildings o Replace non‐energy efficient lights with fluorescent lights
Oregon City, Parks and Recreation Master Plan Update 21
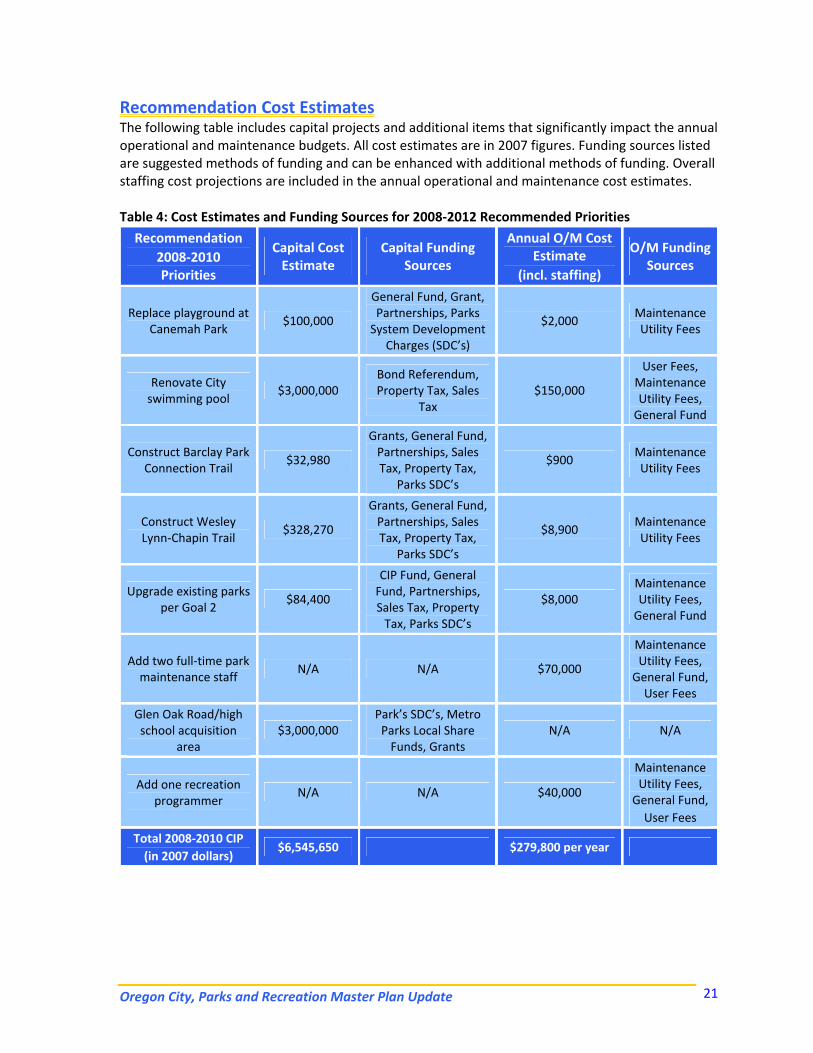
Recommendation Cost Estimates The following table includes capital projects and additional items that significantly impact the annual operational and maintenance budgets. All cost estimates are in 2007 figures. Funding sources listed are suggested methods of funding and can be enhanced with additional methods of funding. Overall staffing cost projections are included in the annual operational and maintenance cost estimates. Table 4: Cost Estimates and Funding Sources for 2008‐2012 Recommended Priorities
Recommendation 2008‐2010 Priorities
Capital Cost Estimate
Capital Funding Sources
Annual O/M Cost Estimate
(incl. staffing)
O/M Funding Sources
Replace playground at Canemah Park
$100,000
General Fund, Grant, Partnerships, Parks System Development
Charges (SDC’s)
$2,000 Maintenance Utility Fees
Renovate City swimming pool
$3,000,000 Bond Referendum, Property Tax, Sales
Tax $150,000
User Fees, Maintenance Utility Fees, General Fund
Construct Barclay Park Connection Trail
$32,980
Grants, General Fund, Partnerships, Sales Tax, Property Tax,
Parks SDC’s
$900 Maintenance Utility Fees
Construct Wesley Lynn‐Chapin Trail
$328,270
Grants, General Fund, Partnerships, Sales Tax, Property Tax,
Parks SDC’s
$8,900 Maintenance Utility Fees
Upgrade existing parks per Goal 2
$84,400
CIP Fund, General Fund, Partnerships, Sales Tax, Property Tax, Parks SDC’s
$8,000 Maintenance Utility Fees, General Fund
Add two full‐time park maintenance staff
N/A N/A $70,000
Maintenance Utility Fees, General Fund, User Fees
Glen Oak Road/high school acquisition
area $3,000,000
Park’s SDC’s, Metro Parks Local Share Funds, Grants
N/A N/A
Add one recreation programmer
N/A N/A $40,000
Maintenance Utility Fees, General Fund, User Fees
Total 2008‐2010 CIP (in 2007 dollars)
$6,545,650 $279,800 per year
Oregon City, Parks and Recreation Master Plan Update 22
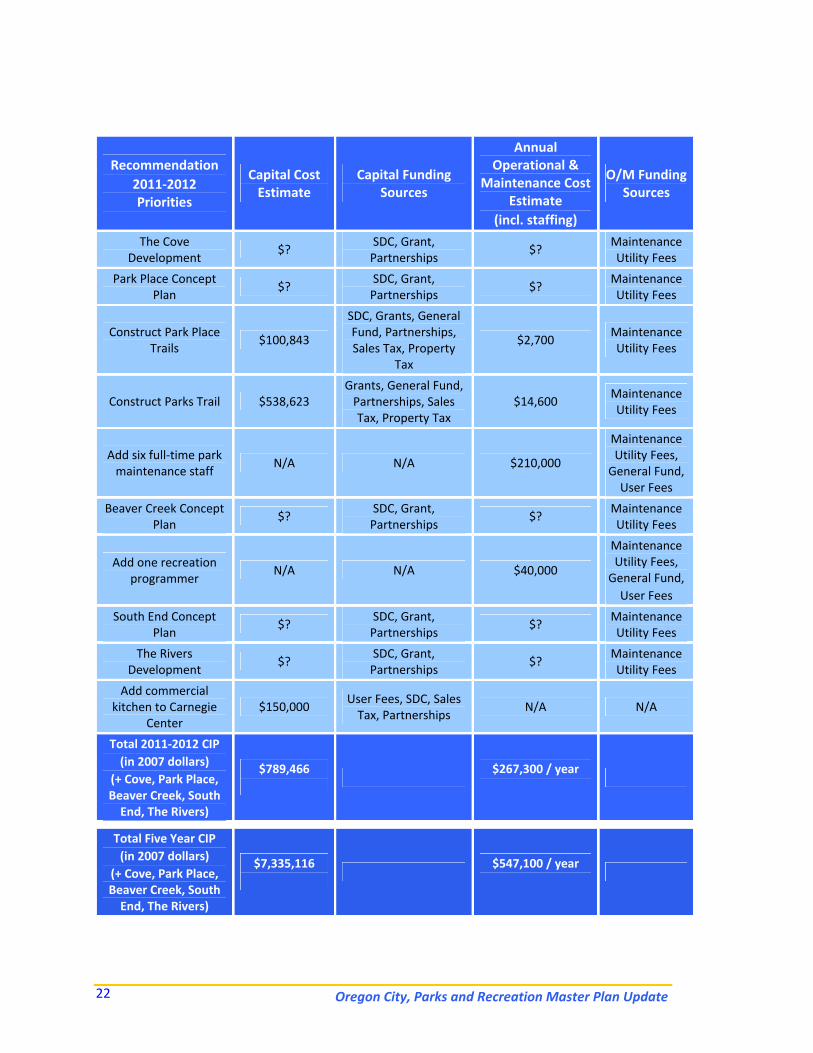
Recommendation 2011‐2012 Priorities
Capital Cost Estimate
Capital Funding Sources
Annual Operational &
Maintenance Cost Estimate
(incl. staffing)
O/M Funding Sources
The Cove Development
$? SDC, Grant, Partnerships
$? Maintenance Utility Fees
Park Place Concept Plan
$? SDC, Grant, Partnerships
$? Maintenance Utility Fees
Construct Park Place Trails
$100,843
SDC, Grants, General Fund, Partnerships, Sales Tax, Property
Tax
$2,700 Maintenance Utility Fees
Construct Parks Trail $538,623 Grants, General Fund, Partnerships, Sales Tax, Property Tax
$14,600 Maintenance Utility Fees
Add six full‐time park maintenance staff
N/A N/A $210,000
Maintenance Utility Fees, General Fund, User Fees
Beaver Creek Concept Plan
$? SDC, Grant, Partnerships
$? Maintenance Utility Fees
Add one recreation programmer
N/A N/A $40,000
Maintenance Utility Fees, General Fund, User Fees
South End Concept Plan
$? SDC, Grant, Partnerships
$? Maintenance Utility Fees
The Rivers Development
$? SDC, Grant, Partnerships
$? Maintenance Utility Fees
Add commercial kitchen to Carnegie
Center $150,000
User Fees, SDC, Sales Tax, Partnerships
N/A N/A
Total 2011‐2012 CIP (in 2007 dollars)
(+ Cove, Park Place, Beaver Creek, South End, The Rivers)
$789,466
$267,300 / year
Total Five Year CIP (in 2007 dollars)
(+ Cove, Park Place, Beaver Creek, South End, The Rivers)
$7,335,116
$547,100 / year
Oregon City, Parks and Recreation Master Plan Update 23
II. Past, Present, and Future – The Planning Context A. Vision and Mission The Oregon Parks and Recreation Association VIP Strategic Plan utilizes a vision statement that describes the preferred future of parks and recreation in Oregon. Oregon City Parks and Recreation wishes to adopt this vision statement. Oregon City has a rich society that can benefit immensely by increased attention to the interconnectedness of its parks and recreation programs and facilities and its people. From historic homes like Ermatinger House to the Oregon City Swimming Pool, from senior programs like those offered at Pioneer Center, to the Daddy Daughter Dinner Dance, the Parks and Recreation Department of Oregon City is committed to creating a sense of community. The Department strives to adopt a vision statement that reflects that strong commitment. This vision will be the cornerstone of the future strategic planning efforts for the City of Oregon City:
The VIP Plan is more than an action plan for ORPA and its members ‐ it is a plan to reposition the diverse profession of parks and recreation. As such, the plan must reflect the values and beliefs of our diverse profession. We, the parks and recreation profession, include commercial and for‐profit organizations, such as health clubs and equipment vendors; nonprofit organizations, such as the YMCA and Boys and Girls Club; natural resource agencies, such as the U.S. Forest Service, National Park Service and county/state parks; therapeutic recreation agencies, such as hospitals, reha‐bilitation centers and long‐term care facilities; community colleges and universities which prepare our future professionals; adult education providers who offer lifelong learning opportunities; park professionals who preserve the natural environment, enhance safety and protect our valuable resource investment; special districts and local recreation agencies that provide parks and recreation opportunities to local residents; students who are the professionals of the future; citizen volunteers who provide many direct services; and others. All are part of the vision for the future of Oregon’s parks and recreation. To create is to cause or bring into being. This word emphasizes the active role of parks and recreation in the task of creating community. Community is a sense of belonging, ownership, and common purpose that develops among people who live or work together as a social unit. Within parks and recreation, a community may be a city, a hospital ward, a park and recreation district, a senior center, a national park, a neighborhood for a for profit business or nonprofit agency. It includes both your co‐workers and the clients you serve. Parks and recreation often delivers services through people ‐ our staff and volunteers make connections with our clients and residents to improve lives. It is this person‐to‐person contact that
Oregon City, Parks and Recreation Master Plan Update 24
relieves the loneliness of senior citizens, reduces the stress and isolation of working adults, and inspires and teaches youth to become productive community members. Parks and recreation professionals mobilize people to solve community problems ‐ from building trails to coaching sports leagues to tutoring at‐risk youth. We are the essential connection to people and their needs in the communities and settings that we serve. As a profession, we are known for our parks and open space. They create a green infrastructure that is essential to Oregon’s economy ‐ from the peaks of Mount Hood to a neighborhood park in the midst of our largest city. We provide relief from urban development, preserve the environment, and provide opportunities for recreation through our facilities. In addition to parks, we provide many types of facilities today to meet the needs of our customers ‐ water parks, health clubs, wilderness areas, skate parks, community centers, etc. In the vision statement, the word "parks" can be interpreted as any facility provided by parks and recreation to meet needs. Programs can be recreation activities, services or organizational structures designed to produce specific outcomes or benefits to our clients. Historically, our programs have also been an important means of connecting with clients and creating community. As such, these programs must be acknowledged in our vision statement. Personal expenditures on recreation and leisure in the United States exceed $700 billion annually (NRPA, 1998). In addition, more than $10 billion is spent annually by local, state, and federal agencies on parks and recreation facilities, programs and services. A monumental difference is made in individuals, communities, the environment, and the economy through parks and recreation. The following mission statement describes why parks and recreation services exist ‐ the benefits provided by parks and recreation. This ORPA mission statement should also be adopted by Oregon City Parks and Recreation and customized to meet the unique needs of the local community. Mission Statement The benefits of parks and recreation are necessary to develop healthy individuals and communities when the economy is strong ‐ and are even more important when we face economic and social challenges. The mission of parks and recreation was crafted from feedback obtained throughout the Master Plan Update. ORPA's mission describes the primary purpose or "business" of parks and recreation in Oregon: Strengthen community Parks, recreation facilities, programs, and community events are key factors in strengthening community image and creating a sense of place. Protect natural resources By acquiring, managing, and restoring valuable resources as open space such as: rivers, streams, greenways, view sheds, forests and other habitat areas, natural resources are protected and habitat required for the survival of diverse species is preserved. Foster human development Parks and recreation services foster social, intellectual, physical, and emotional development.
Oregon City, Parks and Recreation Master Plan Update 25
Strengthen safety and security Park and recreation professionals provide safe environments for recreation and design programs and services specifically to reduce criminal activity. Support economic development Recreation programs and facilities attract and retain businesses and residents, as well as attract tourists. Parks and recreation provides jobs and generates income for the community and for local businesses. Preserve cultural resources Parks and recreation professionals preserve our historical and cultural heritage for the enjoyment of citizens and future generations. Provide recreational and educational experiences Through programmed and self‐facilitated recreation, a variety of benefits to individuals and society are achieved. Recreational and educational experiences can enhance ones current career and help inspire future career aspirations. Increase cultural unity Parks and recreation increases cultural unity through experiences that promote cultural understanding and celebrate diversity. Promote health and wellbeing Participation in recreation improves physical and emotional health. Facilitate community problem solving Park and recreation professionals have skills in facilitation and leadership that can be applied to resolve community problems and issues. Be good stewards of public resources Park and recreation professionals use resources effectively to ensure best use of public funds. Park maintenance staff preserves parks and community facilities to protect public investments.
B. Purpose of this Plan The Oregon City Parks and Recreation Master Plan Update is intended to help meet the needs of current and future residents by positioning Oregon City to build on the community’s unique parks and recreation assets and identify new opportunities. The citizen driven five‐year Implementation Plan establishes a clear direction to guide city staff, advisory committees, and elected officials in their efforts to enhance the community’s parks and recreation programs, services and facilities. Although the Community Services Department is also responsible for the library and the cemetery, the Master Plan Update specifically does not address this portion of department operations and is focused strictly on parks and recreation issues.
C. History of Oregon City Parks and Recreation Oregon City has a long history of providing parks for its citizens, dating back to the City's incorporation in the mid 1800's. Oregon City, sometimes referred to as the "First City,” was granted
Oregon City, Parks and Recreation Master Plan Update 26
a charter in 1844 making it the first and oldest city in the Pacific Northwest. Dr. John McLoughlin founded Oregon City and is often called the "father of Oregon" for his role in the State's early history. He donated land for parks on the "bluff" and "mid‐level" areas of town in the early history of the City. These have been protected as parkland in the city charter since this time. These early charter park sites are some of the oldest public parks in the region. In its earliest history, as the Oregon City community grew, new organized sports, recreation, and leisure opportunities were created. In fact, Oregon City can claim a number of firsts for many of these activities in the State of Oregon and Pacific Northwest. The first baseball game between two organized teams was held in Oregon City at Kelly Green (now the site of The End of Oregon Trail Interpretive Center) on October 13, 1866. The football rivalry between Oregon City High School and West Linn High School (originally known as West Oregon City High) is considered to be the oldest in the state dating to the 19th century. In the era of rail cars (interurban trains), the train carrying passengers from Portland, and other areas, would pass through Oregon City. Many passengers departed at a stop where they could traverse a series of steps to the grounds of (old) Canemah Park, which was the site of the first amusement park in Oregon. Canemah Park had a dance hall, bandstand, ballfields, play areas, and thrill rides including one of the original Ferris wheels. Old Canemah Park still exists, though all that remains today are trails, passive uses, and picnic areas. Prior to 1999, the parks and recreation functions were fragmented under different city departments. The Community Activities Department included the Oregon City Pool, Pioneer Center, Carnegie Center (after it became an arts and community center in 1995), and recreation programs and activities. Parks and cemetery functions were under the management of the Public Works Department. Following the recommendations of the 1999 Parks and Recreation Master Plan (J.C. Dragoo & Associates), the various functions of parks and recreation services were consolidated into the Parks and Recreation Department in 2000. This created a more cohesive and coordinated approach to their operations and services, as well as being the catalyst for launching an emphasis on parks acquisition and development growth, which continues today. In spring 2002, following the retirement of the long‐time City Library Director, library operations were folded in with the Parks and Recreation Department to create the current Community Services Department.
D. Community Services Department Overview The City of Oregon City Community Services Department is responsible for the direction, operations, and maintenance of a wide variety of services, programs, and facilities, including:
• Mt. View Cemetery • Carnegie Center • Pioneer Adult Community Center • Oregon City Pool • Ermatinger House • Oregon City Public Library • Parks acquisition, planning, and development • Trail and park maintenance • Recreation programs, classes, and activities
Oregon City, Parks and Recreation Master Plan Update 27
Park Acquisition, Planning, and Development The Department is responsible for the citywide planning and implementation of new parks and trails, acquisition of parklands, and improvements, additions, and expansion to existing parks and trails. A few examples of recently completed accomplishments or currently active projects include:
• Master planning and development of Jon Storm Park, including transient dock and restroom • Development of Wesley Lynn Park first phase – continue next phase of development • Rivercrest Park improvements, including new spray park and refurbished tennis and
basketball courts • Parks and Recreation Master Plan Update (this document) • Exploring property acquisitions in the High School Area, South End/Central Point Road Area,
Park Place, Holcomb and Maple Lane Areas. • Administering a 2006 Metro Parks Natural Spaces Bond
The majority of Oregon City’s parks acquisition, planning, and development efforts are funded primarily through Parks System Development Charges (SDC’s) on new residential and commercial construction. State, federal, and other grants also supplement this funding. State law and Oregon City Municipal code govern the City’s implementation and use of Parks SDC’s. The Capital Improvement Program and the adopted Parks and Recreation Master Plan identify priority projects for acquisition, planning, and development. The Parks and Recreation Master Plan is the Department’s comprehensive community planning document, developed with extensive study and community input. The Master Plan was most recently revised in 1999, prior to this update. Though the Department manages to have success in the park acquisition, planning, and development area of responsibility, lack of staff creates challenges in carrying out this department function. In most cases, the Department Director acts as the planner, project and construction supervisor, land acquisition specialist, and grant writer. Other staff members are assigned some of these responsibilities on top of their regular duties, to share the workload distribution. Additionally, the lack of administrative staff support compounds the challenges in carrying out the goals and mission of the Department and City. Parks and Mountain View Cemetery Operations Ongoing maintenance of parks facilities includes: mowing, litter pickup, restroom cleaning, pruning, spraying, painting, carpentry, irrigation repair, and playground inspections. The inventory of areas maintained includes:
• Parks and Cemetery Inventory* • 36 park properties maintained • Five city‐owned properties maintained (islands, right of ways) • Six Public Works properties maintained (reservoir grounds, utility right of ways)
*Note: The following properties are included in the above inventory
• One rental club house (Buena Vista Club House) • One cemetery (Mountain View Cemetery) • Three floating docks
Oregon City, Parks and Recreation Master Plan Update 28
Department Inventory Overview • Total properties maintained by Park staff = 47 properties • Total acreage of properties = approximately 250 acres • Total acreage mowed = approximately 120 acres
Operations of the Mountain View Cemetery include full body burials, the cremations garden, the mausoleum, mowing grounds, pruning, spraying weeds, repairing headstones, painting, and landscaping, watering grounds, cleaning restrooms, and maintaining equipment. This also includes maintaining the Historic Pioneer section of the cemetery. The most significant challenge faced by the Parks Maintenance division is the ability to provide adequate system maintenance at current staffing and funding levels. This issue is magnified by the addition of new parks and facilities to meet the needs of the growing community. Recent or anticipated additional maintenance responsibilities include Jon Storm Park (including new transient dock and restroom), Clackamas River Trail, Wesley Lynn Park, Rivercrest Park improvements, and others. All parks and cemetery operations and maintenance are accomplished with current parks and cemetery staff consisting of one manager, one part‐time office specialist, two full‐time parks maintenance specialists, and two full‐time cemetery staff. During the spring and summer there is funding for seasonal maintenance workers who split their time between cemetery and parks. As more parks and facilities are added to the maintenance inventory, service levels will reduce unless staff and resources are increased.
E. Related Planning Efforts and Integration The City of Oregon City has undertaken several planning efforts in recent years that have helped inform the planning process for this Parks and Recreation Master Plan. These plans and studies include:
• City of Oregon City Park and Recreation Master Plan (1999) • Oregon City Trails Master Plan (2004) • Oregon City Waterfront Master Plan (2002) • Park Place Concept Plan (2007 – in progress at time of writing this report) • Beavercreek Road Concept Plan (2007 – in progress at time of writing this report) • Oregon Parks and Recreation Association Benchmarking (2006)
F. Methodology of this Planning Process A project team, made up of city staff and the Parks and Recreation Advisory Committee, has guided this project. This team met with consultants from the GreenPlay team and provided input throughout the planning process. This collaborative effort creates a plan that fully utilizes the consultant’s expertise and incorporates the local knowledge and institutional history that only community members can provide. The project consisted of the following tasks: Needs Assessment and Public Involvement:
• Review of previous planning efforts and city historical information • Consideration of the profile of the community and demographics, including anticipated
population growth
Oregon City, Parks and Recreation Master Plan Update 29
• Extensive community involvement effort, including focus groups, meetings with key stakeholders, community‐wide public meetings, and a statistically‐valid community interest and opinion survey
• Identification of alternative providers of recreation services to provide insight regarding the market opportunities in the area for potential new facilities and services
• Research of trends and statistics related to American lifestyles to help guide the efforts of programming staff
Level of Service Analysis:
• Interviews with staff to provide information about parks and recreations facilities and services, along with insight into the current practices and experiences of the City in serving its residents and visitors
• Analysis addressing recreation, parks, and related services
Inventory: • Inventory of parks and facilities using existing mapping, staff interviews, and on‐site visits to
verify amenities and assess the condition of the facilities and surrounding areas Assessment and Analysis:
• Review and assess relevant plans • Organizational Analysis • Measurement of the current delivery of service using the GRASP® Level of Service Analysis
and allowing for a target level of service to be determined that is both feasible and aligned with the desires of citizens as expressed through the citizen survey. This analysis is also represented graphically through perspectives
• Exploration of finance and funding mechanisms to support development and sustainability of the system
Recommendations: Goals, Objectives, and Action Plan:
• Identification and categorization of recommendations into themes with goals, objectives, and an action plan for implementation; and
• Development of an action plan for capital improvements including cost, funding source potentials, and timeframe to support the implementation of the plan.
G. Timeline for Completing the Master Plan Start‐up July 2006 Community Process September 2006 – January 2007 Demographic and Trends Analysis and Projections October ‐ December 2006 Community Needs Assessment Survey November 2006 ‐ February 2007 Inventory and assessment of existing facilities September ‐ December 2006 Organizational SWOT Analysis October ‐ December 2006 Financial Analysis October 2006 – April 2007 Findings Compilation Report and Presentation March 2007 Development of Draft Master Plan March ‐ April 2007 Presentation of Draft Master Plan July 2007 Presentation of Final Master Plan August 2007 – final adoption date

Oregon City, Parks and Recreation Master Plan Update 30
Oregon City, Parks and Recreation Master Plan Update 31
III. What We Want ‐ Our Community and Identified Needs
Identification of current park resources, as well as recreation trends, community demographics, and needs help us better understand future recreational opportunities and identify the unique niche of the City of Oregon City. The community’s history, along with the park and recreation trends, creates a unique opportunity for Oregon City to plan and implement for the future. The following is an overview of the Oregon City community and a needs assessment of parks and recreation facilities and services. This section first describes the key demographic information and national and statewide trends in parks and recreation services. Additionally, community input from stakeholder interviews, focus groups and a community meeting is described and identifies strengths, weaknesses, and opportunities of Oregon City’s parks and recreation facilities and services. Next, results from a statistically valid community survey are highlighted to further clarify recreation needs and interests. Additionally the GRASP® inventory of current parks and recreation facilities is reviewed. All of this information provides a framework to understand Oregon City’s context, community needs, and future direction.
A. Community Profile and Demographic Information Market Analysis Service Area and Population The primary service area for this analysis is the City of Oregon City, Oregon. Oregon City, located at the confluence of the Willamette and Clackamas Rivers in NW Oregon, is the oldest incorporated city west of the Rockies. According to the City’s website (http://www.orcity.org/), Oregon City was established in 1829, officially incorporated in 1844, and became the capitol of the Oregon Territory in 1849. The City is rich in historical homes and buildings, and hosts several interpretive centers and museums dedicated to celebrating the pioneer spirit. Oregon City also has a unique topography, which includes three terraces above the Willamette River. The City’s quality of life and recreation opportunities are highly valued by the community. This is evident by the City’s 21 parks, a historic cemetery, 6 indoor facilities, and 258.2 acres of parkland and open space located throughout Oregon City. Most residents can find a neighborhood or community park within easy walking distance of their home. For this study, several sources were examined to determine current and future population projections for the City of Oregon City:
• US Census (2000) • ESRI Business Information Solutions (demographic studies) • Portland State University – Population Research Center
It was concluded that for consistency this study would utilize current and future population as provided by ESRI Business Solutions, with limited comparisons to the Portland State University Population Research Center. The use of ESRI instead of information provided by Portland State University is due to the fact that all population projections provided by the State are by county
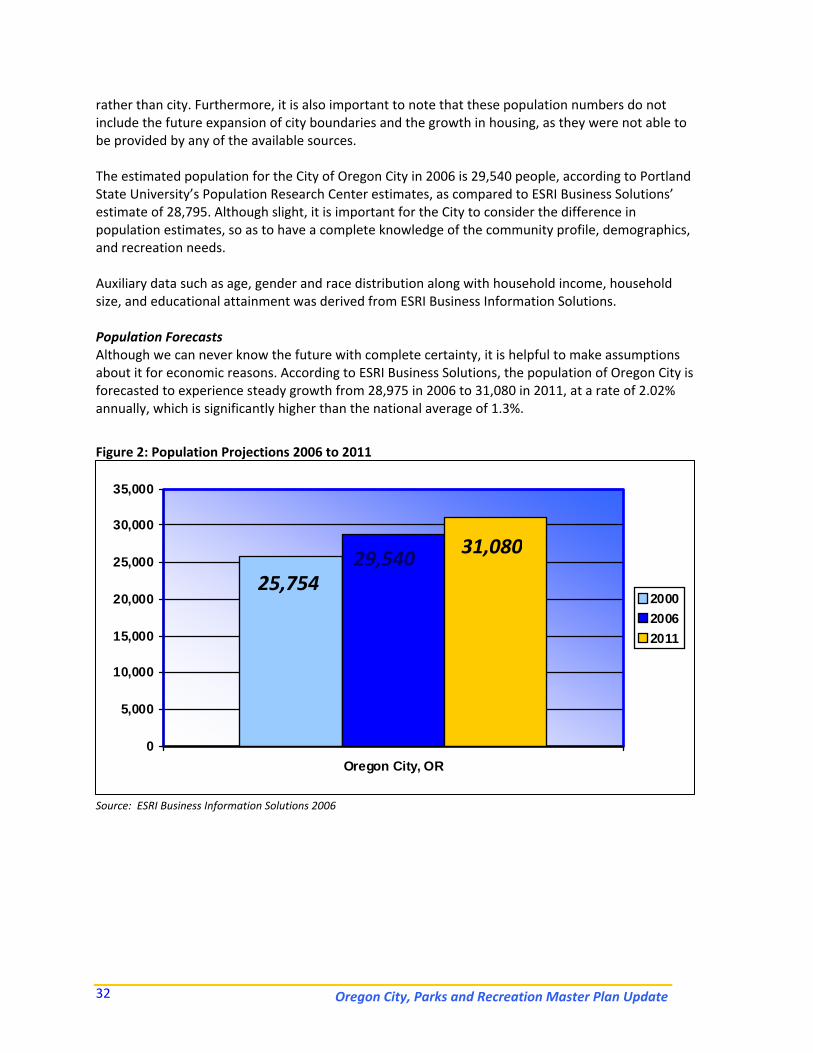
Oregon City, Parks and Recreation Master Plan Update 32
rather than city. Furthermore, it is also important to note that these population numbers do not include the future expansion of city boundaries and the growth in housing, as they were not able to be provided by any of the available sources. The estimated population for the City of Oregon City in 2006 is 29,540 people, according to Portland State University’s Population Research Center estimates, as compared to ESRI Business Solutions’ estimate of 28,795. Although slight, it is important for the City to consider the difference in population estimates, so as to have a complete knowledge of the community profile, demographics, and recreation needs. Auxiliary data such as age, gender and race distribution along with household income, household size, and educational attainment was derived from ESRI Business Information Solutions. Population Forecasts Although we can never know the future with complete certainty, it is helpful to make assumptions about it for economic reasons. According to ESRI Business Solutions, the population of Oregon City is forecasted to experience steady growth from 28,975 in 2006 to 31,080 in 2011, at a rate of 2.02% annually, which is significantly higher than the national average of 1.3%.
Figure 2: Population Projections 2006 to 2011
Source: ESRI Business Information Solutions 2006
0
5,000
10,000
15,000
20,000
25,000
30,000
35,000
Oregon City, OR
200020062011
25,754 29,540 31,080
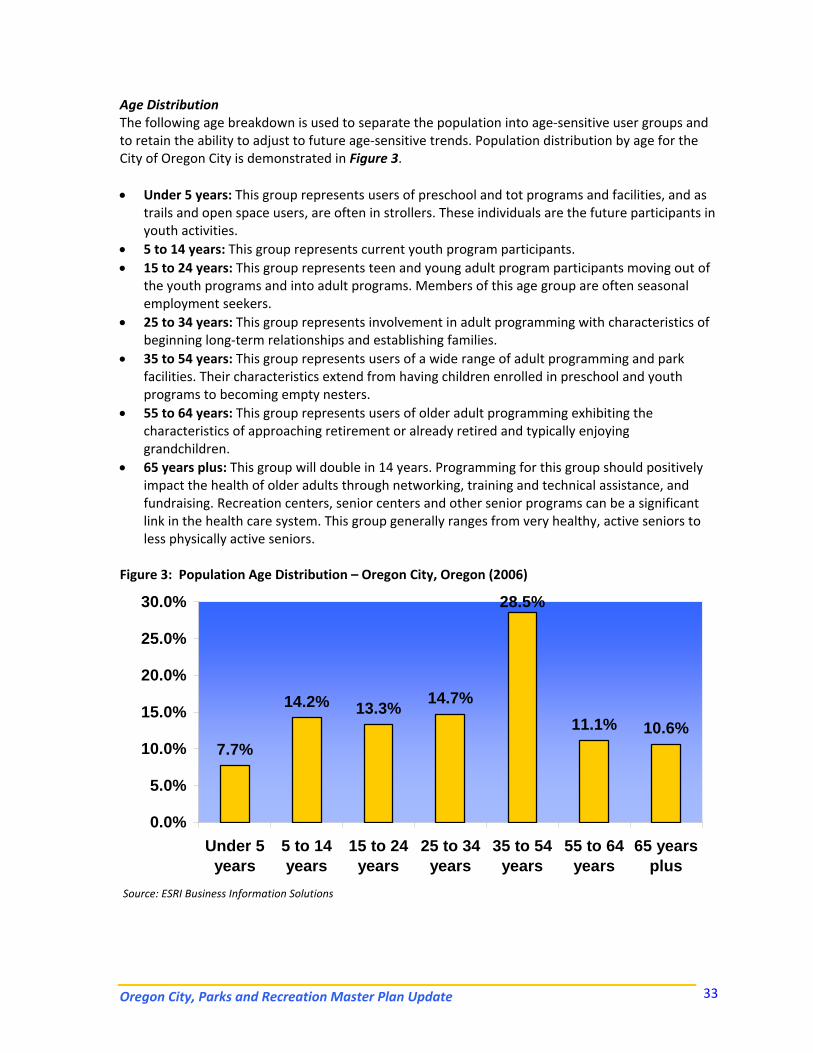
Oregon City, Parks and Recreation Master Plan Update 33
Age Distribution The following age breakdown is used to separate the population into age‐sensitive user groups and to retain the ability to adjust to future age‐sensitive trends. Population distribution by age for the City of Oregon City is demonstrated in Figure 3. • Under 5 years: This group represents users of preschool and tot programs and facilities, and as
trails and open space users, are often in strollers. These individuals are the future participants in youth activities.
• 5 to 14 years: This group represents current youth program participants. • 15 to 24 years: This group represents teen and young adult program participants moving out of
the youth programs and into adult programs. Members of this age group are often seasonal employment seekers.
• 25 to 34 years: This group represents involvement in adult programming with characteristics of beginning long‐term relationships and establishing families.
• 35 to 54 years: This group represents users of a wide range of adult programming and park facilities. Their characteristics extend from having children enrolled in preschool and youth programs to becoming empty nesters.
• 55 to 64 years: This group represents users of older adult programming exhibiting the characteristics of approaching retirement or already retired and typically enjoying grandchildren.
• 65 years plus: This group will double in 14 years. Programming for this group should positively impact the health of older adults through networking, training and technical assistance, and fundraising. Recreation centers, senior centers and other senior programs can be a significant link in the health care system. This group generally ranges from very healthy, active seniors to less physically active seniors.
Figure 3: Population Age Distribution – Oregon City, Oregon (2006)
7.7%
14.2% 13.3% 14.7%
28.5%
11.1% 10.6%
0.0%
5.0%
10.0%
15.0%
20.0%
25.0%
30.0%
Under 5years
5 to 14years
15 to 24years
25 to 34years
35 to 54years
55 to 64years
65 yearsplus
Source: ESRI Business Information Solutions
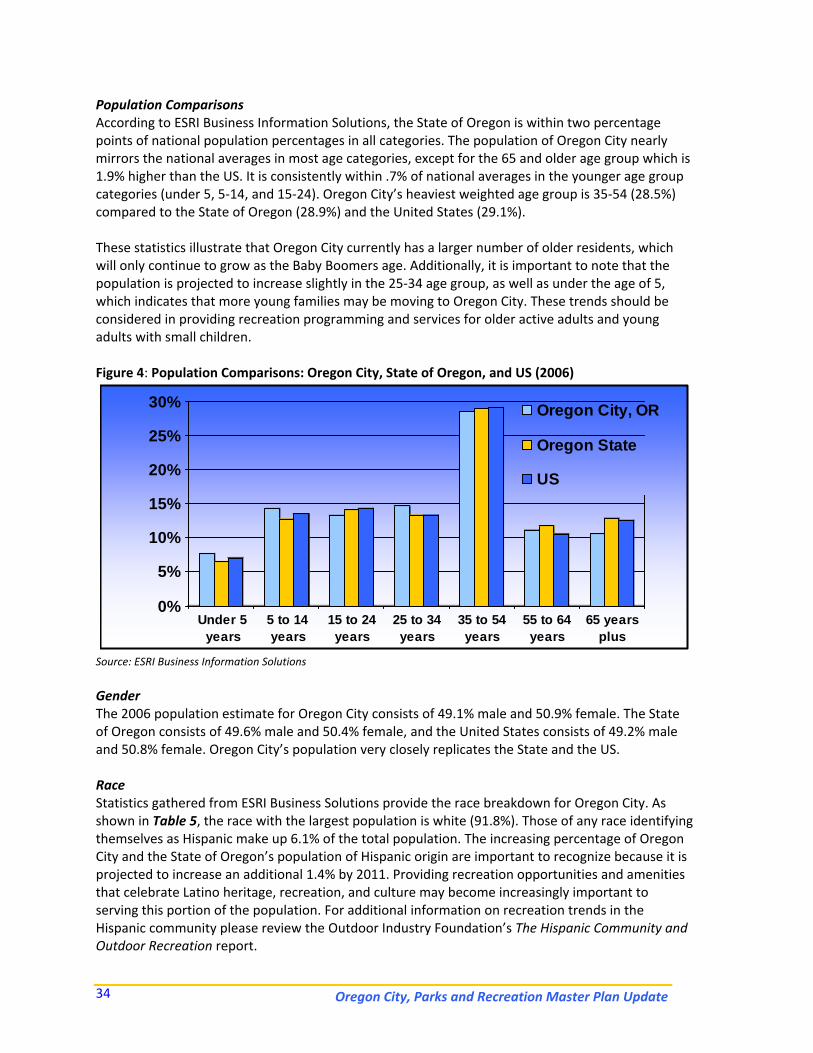
Oregon City, Parks and Recreation Master Plan Update 34
0%
5%
10%
15%
20%
25%
30%
Under 5years
5 to 14years
15 to 24years
25 to 34years
35 to 54years
55 to 64years
65 yearsplus
Oregon City, OR
Oregon State
US
Population Comparisons According to ESRI Business Information Solutions, the State of Oregon is within two percentage points of national population percentages in all categories. The population of Oregon City nearly mirrors the national averages in most age categories, except for the 65 and older age group which is 1.9% higher than the US. It is consistently within .7% of national averages in the younger age group categories (under 5, 5‐14, and 15‐24). Oregon City’s heaviest weighted age group is 35‐54 (28.5%) compared to the State of Oregon (28.9%) and the United States (29.1%). These statistics illustrate that Oregon City currently has a larger number of older residents, which will only continue to grow as the Baby Boomers age. Additionally, it is important to note that the population is projected to increase slightly in the 25‐34 age group, as well as under the age of 5, which indicates that more young families may be moving to Oregon City. These trends should be considered in providing recreation programming and services for older active adults and young adults with small children. Figure 4: Population Comparisons: Oregon City, State of Oregon, and US (2006)
Source: ESRI Business Information Solutions Gender The 2006 population estimate for Oregon City consists of 49.1% male and 50.9% female. The State of Oregon consists of 49.6% male and 50.4% female, and the United States consists of 49.2% male and 50.8% female. Oregon City’s population very closely replicates the State and the US. Race Statistics gathered from ESRI Business Solutions provide the race breakdown for Oregon City. As shown in Table 5, the race with the largest population is white (91.8%). Those of any race identifying themselves as Hispanic make up 6.1% of the total population. The increasing percentage of Oregon City and the State of Oregon’s population of Hispanic origin are important to recognize because it is projected to increase an additional 1.4% by 2011. Providing recreation opportunities and amenities that celebrate Latino heritage, recreation, and culture may become increasingly important to serving this portion of the population. For additional information on recreation trends in the Hispanic community please review the Outdoor Industry Foundation’s The Hispanic Community and Outdoor Recreation report.
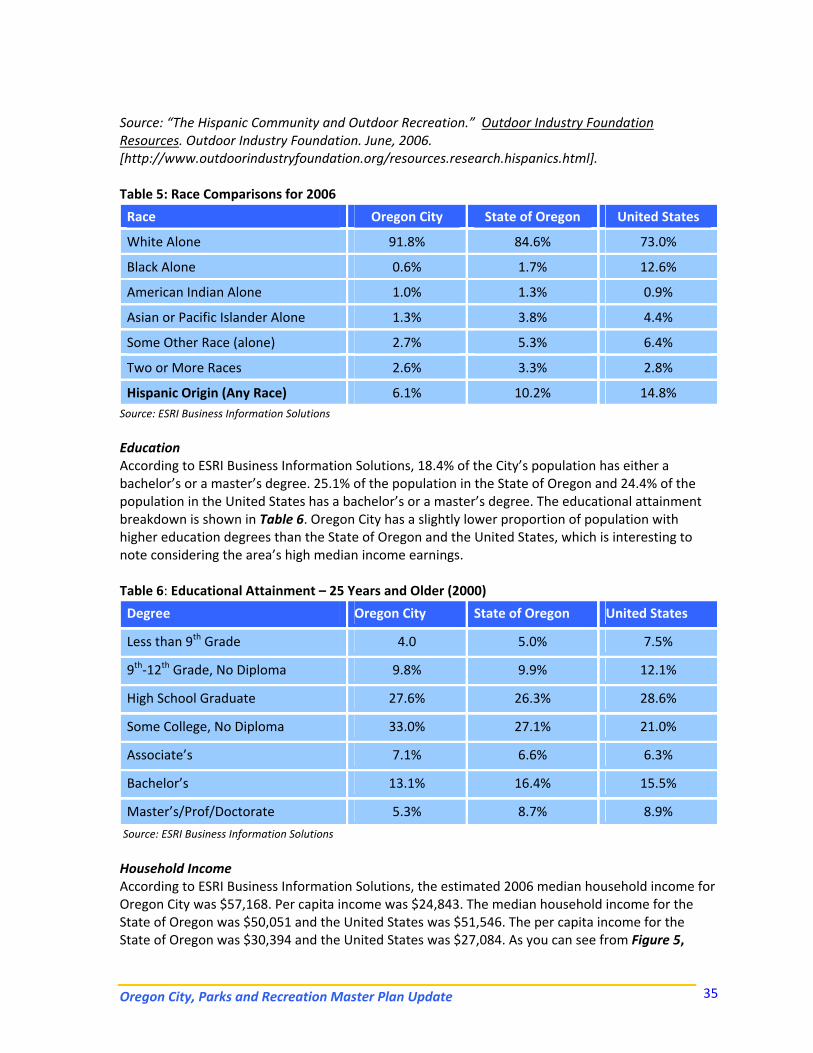
Oregon City, Parks and Recreation Master Plan Update 35
Source: “The Hispanic Community and Outdoor Recreation.” Outdoor Industry Foundation Resources. Outdoor Industry Foundation. June, 2006. [http://www.outdoorindustryfoundation.org/resources.research.hispanics.html]. Table 5: Race Comparisons for 2006
Race Oregon City State of Oregon United States
White Alone 91.8% 84.6% 73.0%
Black Alone 0.6% 1.7% 12.6%
American Indian Alone 1.0% 1.3% 0.9%
Asian or Pacific Islander Alone 1.3% 3.8% 4.4%
Some Other Race (alone) 2.7% 5.3% 6.4%
Two or More Races 2.6% 3.3% 2.8%
Hispanic Origin (Any Race) 6.1% 10.2% 14.8% Source: ESRI Business Information Solutions
Education According to ESRI Business Information Solutions, 18.4% of the City’s population has either a bachelor’s or a master’s degree. 25.1% of the population in the State of Oregon and 24.4% of the population in the United States has a bachelor’s or a master’s degree. The educational attainment breakdown is shown in Table 6. Oregon City has a slightly lower proportion of population with higher education degrees than the State of Oregon and the United States, which is interesting to note considering the area’s high median income earnings. Table 6: Educational Attainment – 25 Years and Older (2000)
Degree Oregon City State of Oregon United States
Less than 9th Grade 4.0 5.0% 7.5%
9th‐12th Grade, No Diploma 9.8% 9.9% 12.1%
High School Graduate 27.6% 26.3% 28.6%
Some College, No Diploma 33.0% 27.1% 21.0%
Associate’s 7.1% 6.6% 6.3%
Bachelor’s 13.1% 16.4% 15.5%
Master’s/Prof/Doctorate 5.3% 8.7% 8.9%
Source: ESRI Business Information Solutions
Household Income According to ESRI Business Information Solutions, the estimated 2006 median household income for Oregon City was $57,168. Per capita income was $24,843. The median household income for the State of Oregon was $50,051 and the United States was $51,546. The per capita income for the State of Oregon was $30,394 and the United States was $27,084. As you can see from Figure 5,
Oregon City, Parks and Recreation Master Plan Update 36
Oregon City has notably larger household incomes than both the State of Oregon and the nation. This could have a positive impact on the available disposable and investment income, which could translate into a higher ability pay for recreation activities and willingness to financially support (through fees or taxes) additional recreation infrastructure and services. Figure 5: Household Income– Oregon City compared to Oregon State and the US (2006) Source: ESRI Business Information Solutions The largest share of households (25.9%) earns $50,000‐$74,999, followed next by those earning $100,000 or more (17.1%). The smallest percentage of the population (8.2%) earns between $15,000 and $24,999. Household Size and Units The 2006 average household size in Oregon City area is 2.65 people. Nationally, the average size is 2.59 and in the State of Oregon it is 2.52. Table 7 shows that the majority of housing units (62.5%) are owner‐occupied in Oregon City, which reflects the fact that the City is a “bedroom” community. Therefore, almost all of Oregon City’s and the State of Oregon’s public funding are provided through property tax, rather than sales tax. Table 7: Housing Units (2006)
Degree Oregon City State of Oregon United States
Owner Occupied Housing Units 61.5% 60.2% 61.6%
Renter Occupied Housing Units 31.7% 30.6% 28.9%
Vacant Housing Units 6.8% 9.2% 9.0%
Source: ESRI Business Information Solutions
0%
5%
10%
15%
20%
25%
30%
< $15,000 $15,000 -$24,999
$25,000 -$34,999
$35,000 -$49,999
$50,000 -$74,999
$75,000 -$99,999
$100,000or more
Oregon City, OROregon StateUS
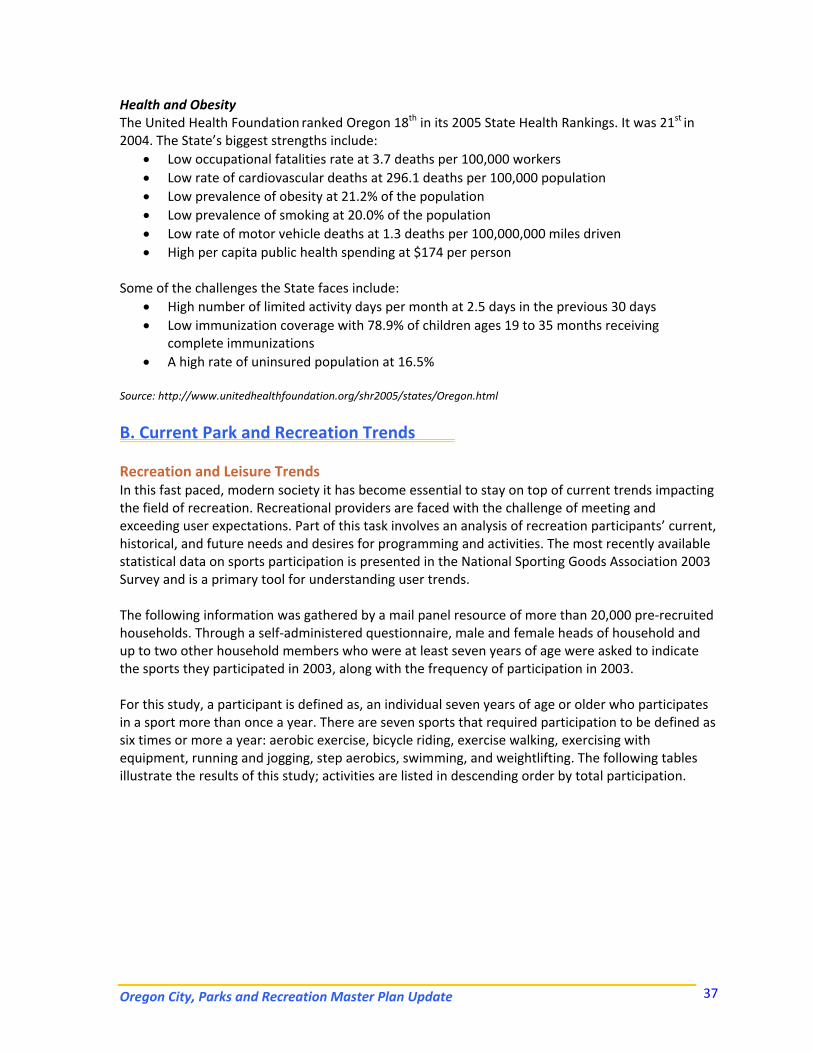
Oregon City, Parks and Recreation Master Plan Update 37
Health and Obesity The United Health Foundation ranked Oregon 18th in its 2005 State Health Rankings. It was 21st in 2004. The State’s biggest strengths include:
• Low occupational fatalities rate at 3.7 deaths per 100,000 workers • Low rate of cardiovascular deaths at 296.1 deaths per 100,000 population • Low prevalence of obesity at 21.2% of the population • Low prevalence of smoking at 20.0% of the population • Low rate of motor vehicle deaths at 1.3 deaths per 100,000,000 miles driven • High per capita public health spending at $174 per person
Some of the challenges the State faces include:
• High number of limited activity days per month at 2.5 days in the previous 30 days • Low immunization coverage with 78.9% of children ages 19 to 35 months receiving
complete immunizations • A high rate of uninsured population at 16.5%
Source: http://www.unitedhealthfoundation.org/shr2005/states/Oregon.html
B. Current Park and Recreation Trends Recreation and Leisure Trends In this fast paced, modern society it has become essential to stay on top of current trends impacting the field of recreation. Recreational providers are faced with the challenge of meeting and exceeding user expectations. Part of this task involves an analysis of recreation participants’ current, historical, and future needs and desires for programming and activities. The most recently available statistical data on sports participation is presented in the National Sporting Goods Association 2003 Survey and is a primary tool for understanding user trends. The following information was gathered by a mail panel resource of more than 20,000 pre‐recruited households. Through a self‐administered questionnaire, male and female heads of household and up to two other household members who were at least seven years of age were asked to indicate the sports they participated in 2003, along with the frequency of participation in 2003. For this study, a participant is defined as, an individual seven years of age or older who participates in a sport more than once a year. There are seven sports that required participation to be defined as six times or more a year: aerobic exercise, bicycle riding, exercise walking, exercising with equipment, running and jogging, step aerobics, swimming, and weightlifting. The following tables illustrate the results of this study; activities are listed in descending order by total participation.
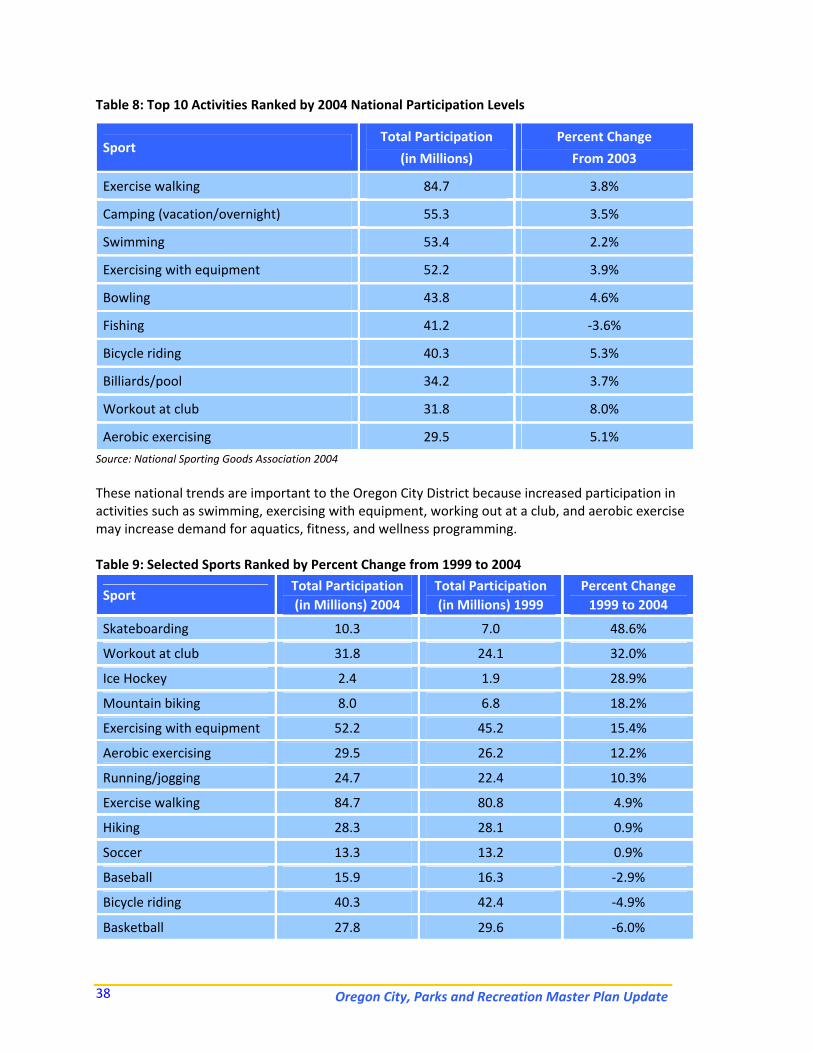
Oregon City, Parks and Recreation Master Plan Update 38
Table 8: Top 10 Activities Ranked by 2004 National Participation Levels
Sport Total Participation
(in Millions)
Percent Change
From 2003
Exercise walking 84.7 3.8%
Camping (vacation/overnight) 55.3 3.5%
Swimming 53.4 2.2%
Exercising with equipment 52.2 3.9%
Bowling 43.8 4.6%
Fishing 41.2 ‐3.6%
Bicycle riding 40.3 5.3%
Billiards/pool 34.2 3.7%
Workout at club 31.8 8.0%
Aerobic exercising 29.5 5.1%
Source: National Sporting Goods Association 2004 These national trends are important to the Oregon City District because increased participation in activities such as swimming, exercising with equipment, working out at a club, and aerobic exercise may increase demand for aquatics, fitness, and wellness programming. Table 9: Selected Sports Ranked by Percent Change from 1999 to 2004
Sport Total Participation (in Millions) 2004
Total Participation (in Millions) 1999
Percent Change 1999 to 2004
Skateboarding 10.3 7.0 48.6%
Workout at club 31.8 24.1 32.0%
Ice Hockey 2.4 1.9 28.9%
Mountain biking 8.0 6.8 18.2%
Exercising with equipment 52.2 45.2 15.4%
Aerobic exercising 29.5 26.2 12.2%
Running/jogging 24.7 22.4 10.3%
Exercise walking 84.7 80.8 4.9%
Hiking 28.3 28.1 0.9%
Soccer 13.3 13.2 0.9%
Baseball 15.9 16.3 ‐2.9%
Bicycle riding 40.3 42.4 ‐4.9%
Basketball 27.8 29.6 ‐6.0%
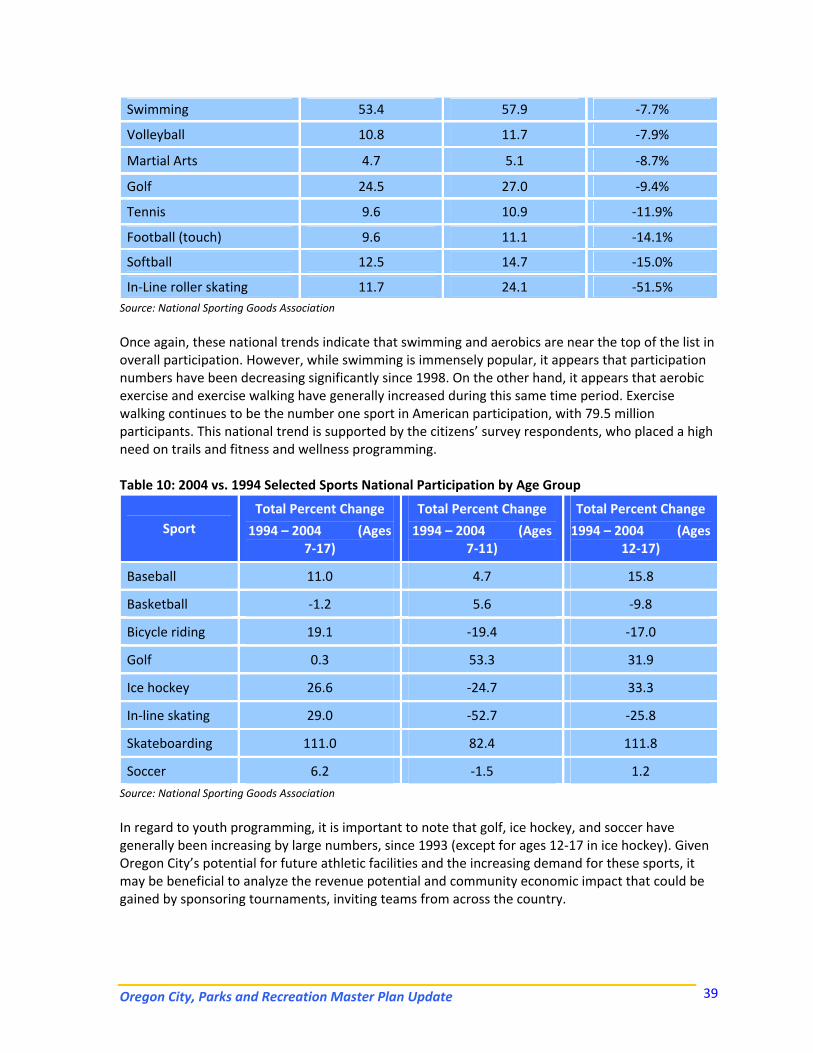
Oregon City, Parks and Recreation Master Plan Update 39
Swimming 53.4 57.9 ‐7.7%
Volleyball 10.8 11.7 ‐7.9%
Martial Arts 4.7 5.1 ‐8.7%
Golf 24.5 27.0 ‐9.4%
Tennis 9.6 10.9 ‐11.9%
Football (touch) 9.6 11.1 ‐14.1%
Softball 12.5 14.7 ‐15.0%
In‐Line roller skating 11.7 24.1 ‐51.5% Source: National Sporting Goods Association Once again, these national trends indicate that swimming and aerobics are near the top of the list in overall participation. However, while swimming is immensely popular, it appears that participation numbers have been decreasing significantly since 1998. On the other hand, it appears that aerobic exercise and exercise walking have generally increased during this same time period. Exercise walking continues to be the number one sport in American participation, with 79.5 million participants. This national trend is supported by the citizens’ survey respondents, who placed a high need on trails and fitness and wellness programming. Table 10: 2004 vs. 1994 Selected Sports National Participation by Age Group
Sport Total Percent Change
1994 – 2004 (Ages 7‐17)
Total Percent Change
1994 – 2004 (Ages 7‐11)
Total Percent Change
1994 – 2004 (Ages 12‐17)
Baseball 11.0 4.7 15.8
Basketball ‐1.2 5.6 ‐9.8
Bicycle riding 19.1 ‐19.4 ‐17.0
Golf 0.3 53.3 31.9
Ice hockey 26.6 ‐24.7 33.3
In‐line skating 29.0 ‐52.7 ‐25.8
Skateboarding 111.0 82.4 111.8
Soccer 6.2 ‐1.5 1.2
Source: National Sporting Goods Association
In regard to youth programming, it is important to note that golf, ice hockey, and soccer have generally been increasing by large numbers, since 1993 (except for ages 12‐17 in ice hockey). Given Oregon City’s potential for future athletic facilities and the increasing demand for these sports, it may be beneficial to analyze the revenue potential and community economic impact that could be gained by sponsoring tournaments, inviting teams from across the country.
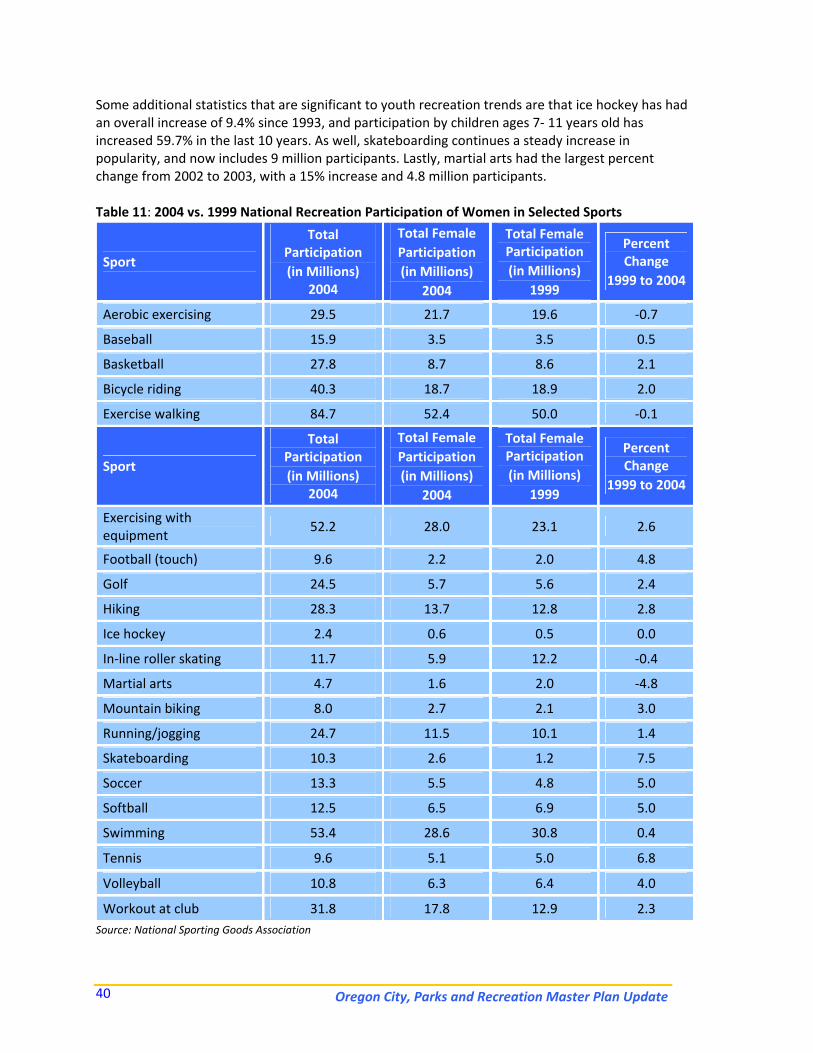
Oregon City, Parks and Recreation Master Plan Update 40
Some additional statistics that are significant to youth recreation trends are that ice hockey has had an overall increase of 9.4% since 1993, and participation by children ages 7‐ 11 years old has increased 59.7% in the last 10 years. As well, skateboarding continues a steady increase in popularity, and now includes 9 million participants. Lastly, martial arts had the largest percent change from 2002 to 2003, with a 15% increase and 4.8 million participants. Table 11: 2004 vs. 1999 National Recreation Participation of Women in Selected Sports
Sport
Total Participation (in Millions)
2004
Total Female Participation (in Millions)
2004
Total Female Participation (in Millions)
1999
Percent Change
1999 to 2004
Aerobic exercising 29.5 21.7 19.6 ‐0.7
Baseball 15.9 3.5 3.5 0.5
Basketball 27.8 8.7 8.6 2.1
Bicycle riding 40.3 18.7 18.9 2.0
Exercise walking 84.7 52.4 50.0 ‐0.1
Sport
Total Participation (in Millions)
2004
Total Female Participation (in Millions)
2004
Total Female Participation (in Millions)
1999
Percent Change
1999 to 2004
Exercising with equipment
52.2 28.0 23.1 2.6
Football (touch) 9.6 2.2 2.0 4.8
Golf 24.5 5.7 5.6 2.4
Hiking 28.3 13.7 12.8 2.8
Ice hockey 2.4 0.6 0.5 0.0
In‐line roller skating 11.7 5.9 12.2 ‐0.4
Martial arts 4.7 1.6 2.0 ‐4.8
Mountain biking 8.0 2.7 2.1 3.0
Running/jogging 24.7 11.5 10.1 1.4
Skateboarding 10.3 2.6 1.2 7.5
Soccer 13.3 5.5 4.8 5.0
Softball 12.5 6.5 6.9 5.0
Swimming 53.4 28.6 30.8 0.4
Tennis 9.6 5.1 5.0 6.8
Volleyball 10.8 6.3 6.4 4.0
Workout at club 31.8 17.8 12.9 2.3 Source: National Sporting Goods Association
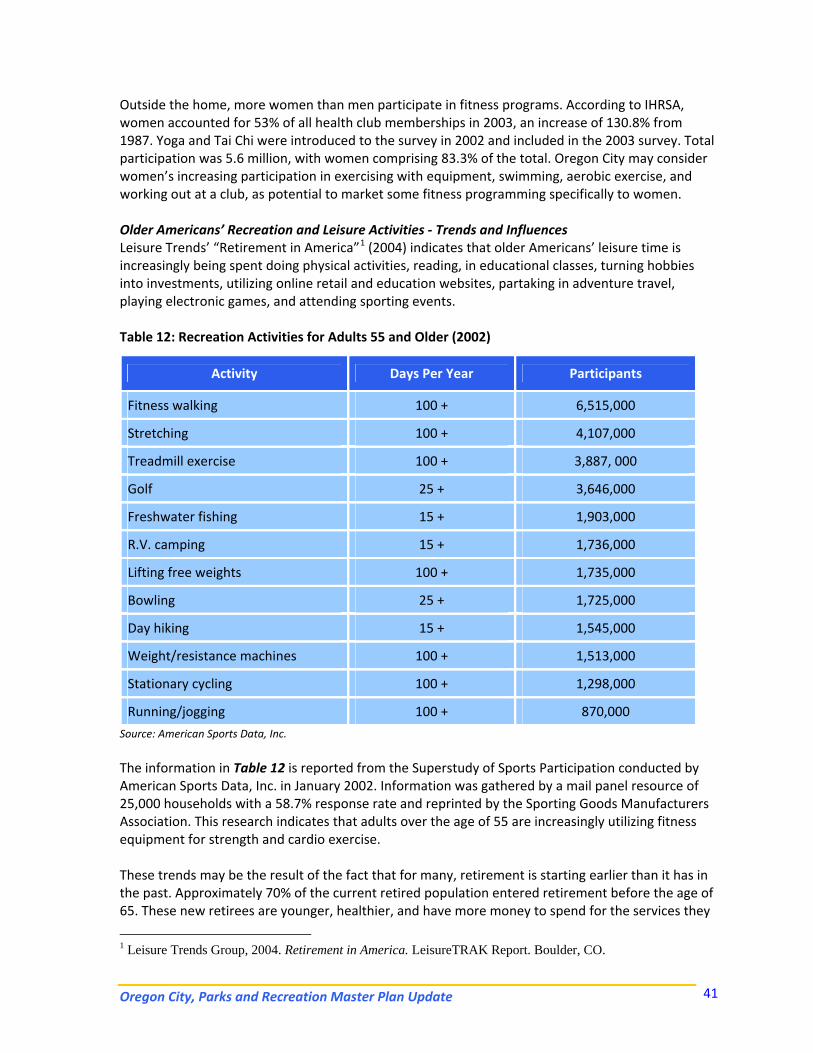
Oregon City, Parks and Recreation Master Plan Update 41
Outside the home, more women than men participate in fitness programs. According to IHRSA, women accounted for 53% of all health club memberships in 2003, an increase of 130.8% from 1987. Yoga and Tai Chi were introduced to the survey in 2002 and included in the 2003 survey. Total participation was 5.6 million, with women comprising 83.3% of the total. Oregon City may consider women’s increasing participation in exercising with equipment, swimming, aerobic exercise, and working out at a club, as potential to market some fitness programming specifically to women. Older Americans’ Recreation and Leisure Activities ‐ Trends and Influences Leisure Trends’ “Retirement in America”1 (2004) indicates that older Americans’ leisure time is increasingly being spent doing physical activities, reading, in educational classes, turning hobbies into investments, utilizing online retail and education websites, partaking in adventure travel, playing electronic games, and attending sporting events. Table 12: Recreation Activities for Adults 55 and Older (2002)
Source: American Sports Data, Inc. The information in Table 12 is reported from the Superstudy of Sports Participation conducted by American Sports Data, Inc. in January 2002. Information was gathered by a mail panel resource of 25,000 households with a 58.7% response rate and reprinted by the Sporting Goods Manufacturers Association. This research indicates that adults over the age of 55 are increasingly utilizing fitness equipment for strength and cardio exercise.
These trends may be the result of the fact that for many, retirement is starting earlier than it has in the past. Approximately 70% of the current retired population entered retirement before the age of 65. These new retirees are younger, healthier, and have more money to spend for the services they
1 Leisure Trends Group, 2004. Retirement in America. LeisureTRAK Report. Boulder, CO.
Activity Days Per Year Participants
Fitness walking 100 + 6,515,000
Stretching 100 + 4,107,000
Treadmill exercise 100 + 3,887, 000
Golf 25 + 3,646,000
Freshwater fishing 15 + 1,903,000
R.V. camping 15 + 1,736,000
Lifting free weights 100 + 1,735,000
Bowling 25 + 1,725,000
Day hiking 15 + 1,545,000
Weight/resistance machines 100 + 1,513,000
Stationary cycling 100 + 1,298,000
Running/jogging 100 + 870,000
Oregon City, Parks and Recreation Master Plan Update 42
want. Current retirees are more active and mobile; they enjoy dining out, foreign travel, and exercise. This is a trend which will only increase with Baby Boomer retirement. The oldest Boomers have turned 60 years old in 2006, and are about to retire in record numbers. Current retirees’ leisure interests are diverse and they are interested in purchasing experiences rather than material things.2 Although retired Americans are more active, they are also aging in place. Currently, 65% of retirees still live in the house they did prior to retirement, especially those with high household incomes. 79% of those with incomes over $80,000 a year stay in their current homes when retiring and 56% of those who earn less than $40,000 a year stay in their pre‐retirement home. Those who do relocate are looking for smaller homes in high quality communities, often resort communities. These trends are important to recognize and may explain the changing demands, nationally, from traditional low‐cost social services to more active programming for which older residents are willing to pay.3 It is important to point out that Oregon City needs to recognize this trend and offer additional active programs, rather than social programs. Furthermore, given that this age group does have more disposable income than older retirees, it is going to be increasingly important for the City to continually gauge the varying demands and trends in adult programming. Declining Participation in Senior Centers In 1990, Krout, Cutler, and Coward estimated that there were more than 10,000 senior centers serving at least five million older people.4 Participation in the activities at senior centers has declined in recent years. Approximately 15% of older persons use senior centers (Atchley, 1997). These participants are primarily in the 65‐85 age groups with low to middle incomes. According to Hooyman and Kiyak (2002) the reduction in participation is due in part to:
• Lack of interest in the center’s activities • Desire to be with people other than “old” people • Low proportion of male participants • Poor health • Inadequate transportation
Another study by Walker et al. indicated that the most significant predictor of participation in senior center activities was participation in faith‐based activities, the next was correlated preference for group size, the third was awareness about how many activities are provided, and lastly was the number of transportation types that were available.5 Relevance to Oregon City These participation findings support the input gained through the Master Plan focus groups, where participants indicated the need for additional programming for active older adults. It was expressed that there is a stigma associated with participating in “Senior Center” activities. Therefore, Oregon City may consider ways of providing active programs and marketing these to the older Baby Boomers.
2 Ibid. 3 Ibid. 4 Krout, Cutler, Coward. 1990. Correlates of Senior Center Participation: a national analysis. The Gerontologist 30: 72-79. 5 Walker, J. et al. 2004. Increasing Practitioners’ Knowledge of Participation Among Elderly Adults in Senior Activities. Educational Gerontology 30: 353-366.
Oregon City, Parks and Recreation Master Plan Update 43
Oregon Park and Recreation Agency Trends It is beneficial for municipal agencies to evaluate the level of service that they are providing to their community by comparing their services to similar and nearby communities. The Oregon Recreation and Park Association, in conjunction with Leisure Vision, conducted a “Parks, Facilities, Staffing, and Budgeting Benchmarking” survey of parks and recreation organizations in the State of Oregon during calendar year 2006. The information from this survey provides the Department with a picture of Oregon City’s recreation needs in comparison to other communities. Methodology and Response ORPA mailed surveys to over 116 park and recreation organizations throughout the State of Oregon, with a stamped envelope for return and three email reminders to the recipient. A total of 39 organizations completed the survey. The overall response rate was 34%. The survey was intended to gather information about park types and acreage, trail types and mileage, outdoor and indoor recreation facilities, budgeting, cooperative agreements, and funding sources. Key Findings Parks Oregon City is almost exactly in the middle of the range of the population size of those communities that participated in the survey. It appears that Oregon City (258.2) is quite a bit lower than the average (1,006) and median (422) park acres within a single agency or organization’s system, which also results in lower than average park numbers per 1000 residents. Yet, of those park acres approximately 60% are developed, which is slightly higher than the average of the other 38 communities. Trails In regard to trails, Oregon City is again notably lower in the range of communities that participated. Oregon City manages and maintains approximately six miles of trails, compared the survey average of 19.7 and median of 9.05. However, it may be important to consider that residents are also served by a large number of regional trails that are accessible from the City. Furthermore, Oregon City more closely matches up with the median for the survey for the miles of trail per 1000 residents, which indicates that the City is comparably serving the City’s needs, based on the population. For a summary of the results of benchmarking parks and trails, as provided by the ORPA Parks, Facilities, Staffing, and Budgeting Benchmarking survey, please review the information in Table 13.
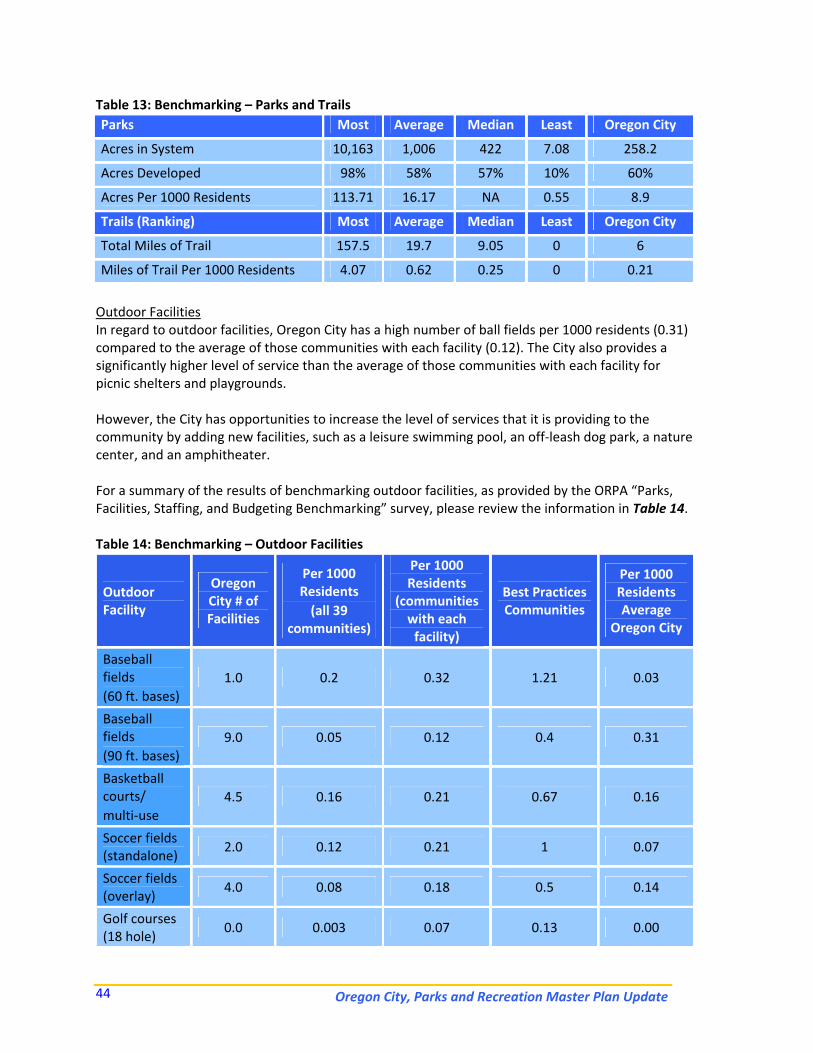
Oregon City, Parks and Recreation Master Plan Update 44
Table 13: Benchmarking – Parks and Trails Parks Most Average Median Least Oregon City
Acres in System 10,163 1,006 422 7.08 258.2
Acres Developed 98% 58% 57% 10% 60%
Acres Per 1000 Residents 113.71 16.17 NA 0.55 8.9
Trails (Ranking) Most Average Median Least Oregon City
Total Miles of Trail 157.5 19.7 9.05 0 6
Miles of Trail Per 1000 Residents 4.07 0.62 0.25 0 0.21
Outdoor Facilities In regard to outdoor facilities, Oregon City has a high number of ball fields per 1000 residents (0.31) compared to the average of those communities with each facility (0.12). The City also provides a significantly higher level of service than the average of those communities with each facility for picnic shelters and playgrounds. However, the City has opportunities to increase the level of services that it is providing to the community by adding new facilities, such as a leisure swimming pool, an off‐leash dog park, a nature center, and an amphitheater. For a summary of the results of benchmarking outdoor facilities, as provided by the ORPA “Parks, Facilities, Staffing, and Budgeting Benchmarking” survey, please review the information in Table 14. Table 14: Benchmarking – Outdoor Facilities
Outdoor Facility
Oregon City # of Facilities
Per 1000 Residents (all 39
communities)
Per 1000 Residents
(communities with each facility)
Best Practices Communities
Per 1000 Residents Average
Oregon City
Baseball fields (60 ft. bases)
1.0 0.2 0.32 1.21 0.03
Baseball fields (90 ft. bases)
9.0 0.05 0.12 0.4 0.31
Basketball courts/ multi‐use
4.5 0.16 0.21 0.67 0.16
Soccer fields (standalone)
2.0 0.12 0.21 1 0.07
Soccer fields (overlay)
4.0 0.08 0.18 0.5 0.14
Golf courses (18 hole)
0.0 0.003 0.07 0.13 0.00
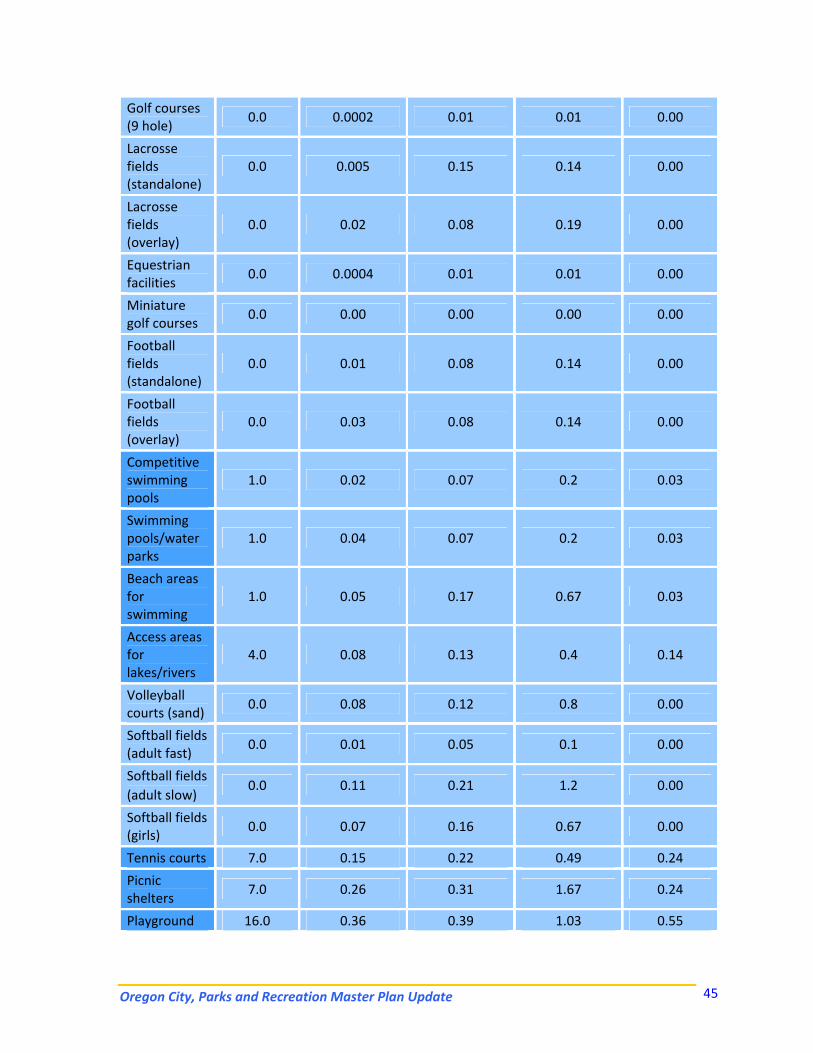
Oregon City, Parks and Recreation Master Plan Update 45
Golf courses (9 hole)
0.0 0.0002 0.01 0.01 0.00
Lacrosse fields (standalone)
0.0 0.005 0.15 0.14 0.00
Lacrosse fields (overlay)
0.0 0.02 0.08 0.19 0.00
Equestrian facilities
0.0 0.0004 0.01 0.01 0.00
Miniature golf courses
0.0 0.00 0.00 0.00 0.00
Football fields (standalone)
0.0 0.01 0.08 0.14 0.00
Football fields (overlay)
0.0 0.03 0.08 0.14 0.00
Competitive swimming pools
1.0 0.02 0.07 0.2 0.03
Swimming pools/water parks
1.0 0.04 0.07 0.2 0.03
Beach areas for swimming
1.0 0.05 0.17 0.67 0.03
Access areas for lakes/rivers
4.0 0.08 0.13 0.4 0.14
Volleyball courts (sand)
0.0 0.08 0.12 0.8 0.00
Softball fields (adult fast)
0.0 0.01 0.05 0.1 0.00
Softball fields (adult slow)
0.0 0.11 0.21 1.2 0.00
Softball fields (girls)
0.0 0.07 0.16 0.67 0.00
Tennis courts 7.0 0.15 0.22 0.49 0.24
Picnic shelters
7.0 0.26 0.31 1.67 0.24
Playground 16.0 0.36 0.39 1.03 0.55
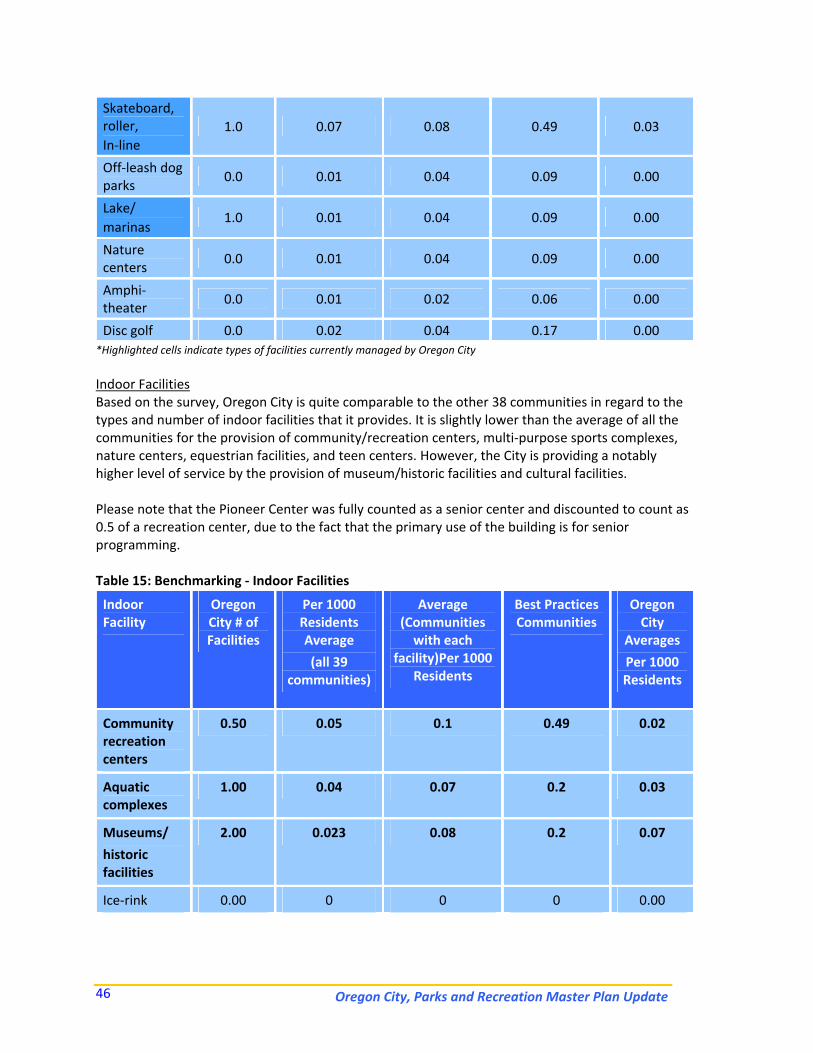
Oregon City, Parks and Recreation Master Plan Update 46
Skateboard, roller, In‐line
1.0 0.07 0.08 0.49 0.03
Off‐leash dog parks
0.0 0.01 0.04 0.09 0.00
Lake/ marinas
1.0 0.01 0.04 0.09 0.00
Nature centers
0.0 0.01 0.04 0.09 0.00
Amphi‐theater
0.0 0.01 0.02 0.06 0.00
Disc golf 0.0 0.02 0.04 0.17 0.00 *Highlighted cells indicate types of facilities currently managed by Oregon City Indoor Facilities Based on the survey, Oregon City is quite comparable to the other 38 communities in regard to the types and number of indoor facilities that it provides. It is slightly lower than the average of all the communities for the provision of community/recreation centers, multi‐purpose sports complexes, nature centers, equestrian facilities, and teen centers. However, the City is providing a notably higher level of service by the provision of museum/historic facilities and cultural facilities. Please note that the Pioneer Center was fully counted as a senior center and discounted to count as 0.5 of a recreation center, due to the fact that the primary use of the building is for senior programming. Table 15: Benchmarking ‐ Indoor Facilities
Indoor Facility
Oregon City # of Facilities
Per 1000 Residents Average
(all 39 communities)
Average (Communities with each
facility)Per 1000 Residents
Best Practices Communities
Oregon City
Averages
Per 1000 Residents
Community recreation centers
0.50 0.05 0.1 0.49 0.02
Aquatic complexes
1.00 0.04 0.07 0.2 0.03
Museums/
historic facilities
2.00 0.023 0.08 0.2 0.07
Ice‐rink 0.00 0 0 0 0.00
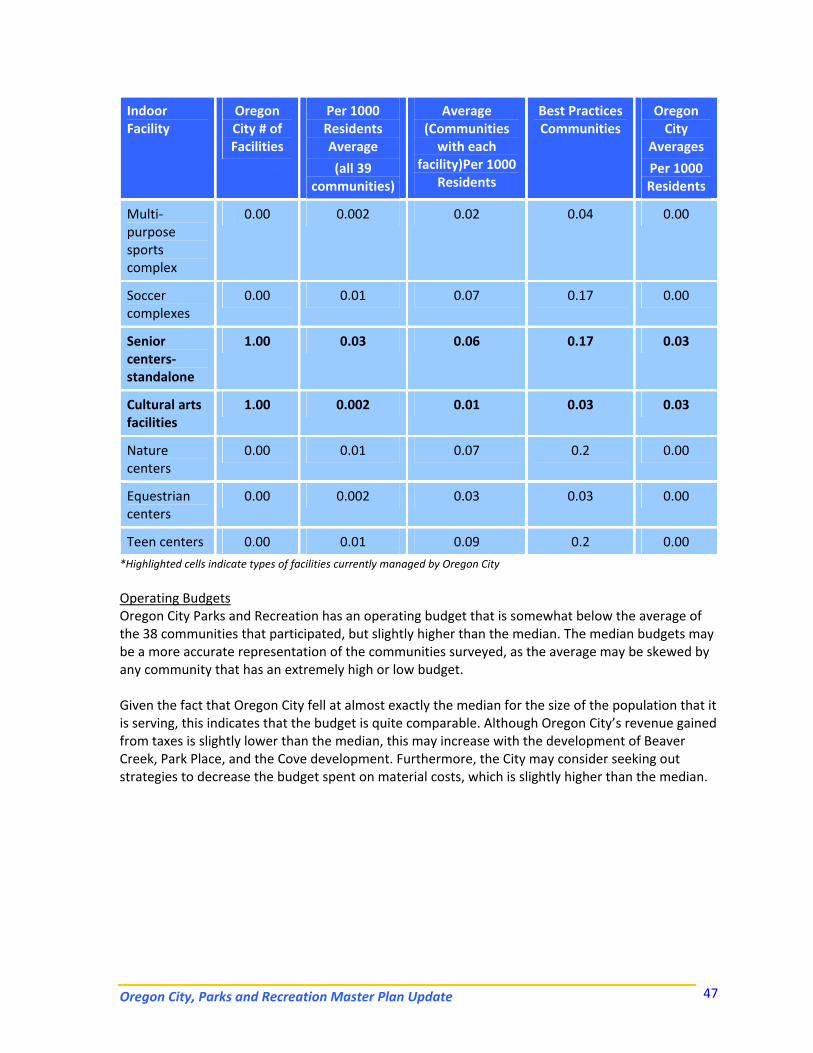
Oregon City, Parks and Recreation Master Plan Update 47
Indoor Facility
Oregon City # of Facilities
Per 1000 Residents Average
(all 39 communities)
Average (Communities with each
facility)Per 1000 Residents
Best Practices Communities
Oregon City
Averages
Per 1000 Residents
Multi‐purpose sports complex
0.00 0.002 0.02 0.04 0.00
Soccer complexes
0.00 0.01 0.07 0.17 0.00
Senior centers‐standalone
1.00 0.03 0.06 0.17 0.03
Cultural arts facilities
1.00 0.002 0.01 0.03 0.03
Nature centers
0.00 0.01 0.07 0.2 0.00
Equestrian centers
0.00 0.002 0.03 0.03 0.00
Teen centers 0.00 0.01 0.09 0.2 0.00
*Highlighted cells indicate types of facilities currently managed by Oregon City Operating Budgets Oregon City Parks and Recreation has an operating budget that is somewhat below the average of the 38 communities that participated, but slightly higher than the median. The median budgets may be a more accurate representation of the communities surveyed, as the average may be skewed by any community that has an extremely high or low budget. Given the fact that Oregon City fell at almost exactly the median for the size of the population that it is serving, this indicates that the budget is quite comparable. Although Oregon City’s revenue gained from taxes is slightly lower than the median, this may increase with the development of Beaver Creek, Park Place, and the Cove development. Furthermore, the City may consider seeking out strategies to decrease the budget spent on material costs, which is slightly higher than the median.
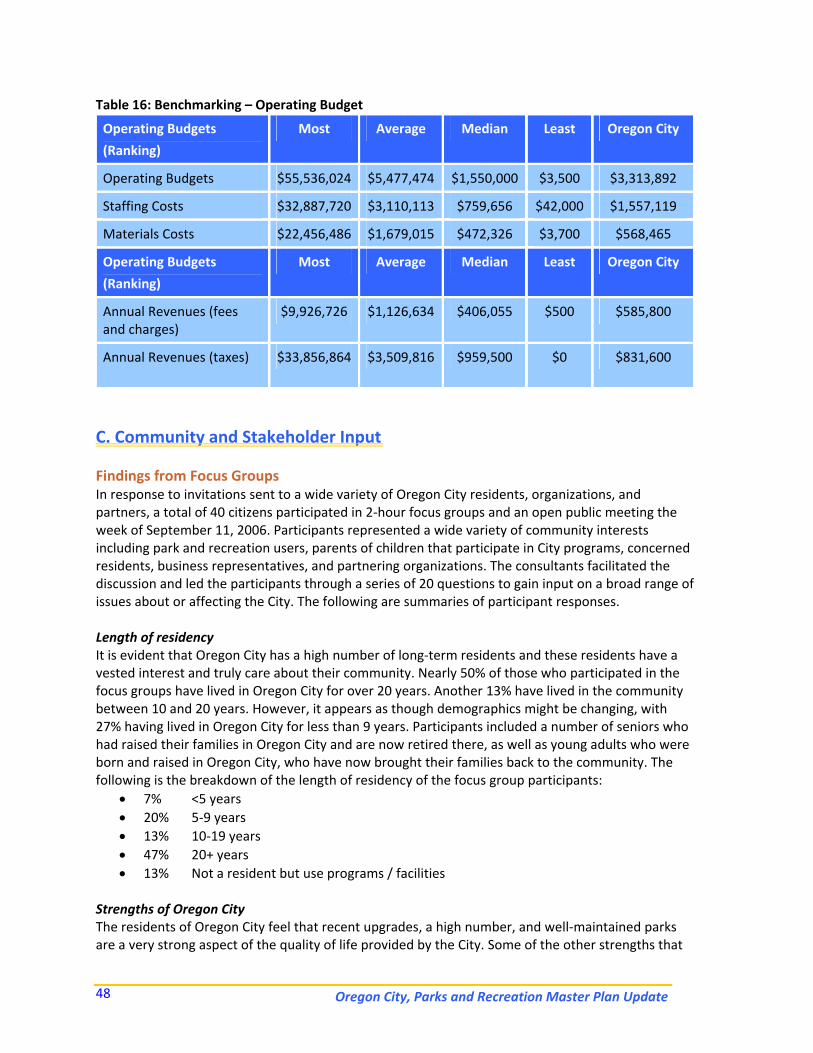
Oregon City, Parks and Recreation Master Plan Update 48
Table 16: Benchmarking – Operating Budget
Operating Budgets
(Ranking)
Most Average Median Least Oregon City
Operating Budgets $55,536,024 $5,477,474 $1,550,000 $3,500 $3,313,892
Staffing Costs $32,887,720 $3,110,113 $759,656 $42,000 $1,557,119
Materials Costs $22,456,486 $1,679,015 $472,326 $3,700 $568,465
Operating Budgets
(Ranking)
Most Average Median Least Oregon City
Annual Revenues (fees and charges)
$9,926,726 $1,126,634 $406,055 $500 $585,800
Annual Revenues (taxes) $33,856,864 $3,509,816 $959,500 $0 $831,600
C. Community and Stakeholder Input Findings from Focus Groups In response to invitations sent to a wide variety of Oregon City residents, organizations, and partners, a total of 40 citizens participated in 2‐hour focus groups and an open public meeting the week of September 11, 2006. Participants represented a wide variety of community interests including park and recreation users, parents of children that participate in City programs, concerned residents, business representatives, and partnering organizations. The consultants facilitated the discussion and led the participants through a series of 20 questions to gain input on a broad range of issues about or affecting the City. The following are summaries of participant responses. Length of residency It is evident that Oregon City has a high number of long‐term residents and these residents have a vested interest and truly care about their community. Nearly 50% of those who participated in the focus groups have lived in Oregon City for over 20 years. Another 13% have lived in the community between 10 and 20 years. However, it appears as though demographics might be changing, with 27% having lived in Oregon City for less than 9 years. Participants included a number of seniors who had raised their families in Oregon City and are now retired there, as well as young adults who were born and raised in Oregon City, who have now brought their families back to the community. The following is the breakdown of the length of residency of the focus group participants:
• 7% <5 years • 20% 5‐9 years • 13% 10‐19 years • 47% 20+ years • 13% Not a resident but use programs / facilities
Strengths of Oregon City The residents of Oregon City feel that recent upgrades, a high number, and well‐maintained parks are a very strong aspect of the quality of life provided by the City. Some of the other strengths that
Oregon City, Parks and Recreation Master Plan Update 49
were identified were the dedicated staff members, who work extremely hard to provide quality programs and parks with very limited funding and staffing resources. This dedication is recognized by the public, who describe the City staff as “friendly,” “helpful,” and state that they “provide great customer service.” These limited resources are also stretched by partnering and using volunteers. Without this community support, the Department would not be able to provide the quality services that it is known for. Oregon City is a community that values its history and natural resources‐ as it was established as the end of the Oregon Trail and its unique terrace topography. These attributes and the quality of life provided make Oregon City a desirable place to live. It is recognized that change and growth are coming, which leaves the City in a position to address how to best serve its growing population. Weaknesses of Oregon City that need to be addressed through the Master Plan Oregon City residents recognize the budgetary limitations of the City, but if resources are to become available they would like to take action to increase the quality and amenities of current facilities. In addition, residents also recognize that limited funding has placed strict limitations on the City to adequately staff the Department. Participants also feel that some recreation facilities are currently underutilized because they are in need of upgrades such as parking and picnic tables. Participants stated that the City should partner and have more shared‐use facilities to more efficiently use resources and provide services. The most commonly mentioned weakness was not in respect to the City, but to the culture of the residents. It was expressed that Oregon City has historically been strongly politically influenced by the “old guard” and that some residents are very adverse to change. This has led to a distrust of the government, which has at times hindered progressive planning. Satisfaction with current Programs Participants were asked how satisfied they are with current programs, the rating system was on a scale of 1 through 5, with 1= “Poor,” 3= “Good,” and 5= “Excellent.” Nearly 100% of those in the focus groups responded that their rating of the City’s programs were “Good” to “Excellent,” with the average rating being 2.6. Many of the participants stated their high level of satisfaction with specific programs and facilities. Additional Programs Participants are fairly pleased with the programming that is provided, given the limited resources to provide them. Yet, some suggestions for new programs that would benefit the community include:
• Competitive youth sports (soccer, baseball, football, softball, lacrosse, basketball/volleyball, and swimming programs)
• Youth sports tournaments • Teen activities (social activities like the Jr. High dances) • Health, fitness, and wellness programs (yoga, Pilates, aerobics, etc.) • Active older adult programs (fitness, dancing, etc.) • Adult continuing education (computer, language, etc.)
Oregon City, Parks and Recreation Master Plan Update 50
One major concern with providing additional programs and activities was the limitations and lack of capacity of current facilities, such as the aging swimming pool and lack of health and fitness resources. Overall Quality of Existing Parks and Recreation Facilities It is evident that Oregon City residents feel that there are changes and upgrades that could be made to many of the older recreation buildings to increase the quality and maintenance of current facilities. The average rating was 2.6, with 1 ‐ “Poor,” 3 ‐ “Good,” and 5 ‐“Excellent.” Some of the general comments about the existing facilities included:
• Many of the older indoor facilities, such as the pool, are not meeting the needs of the community
• Recently, the upgrades to park amenities and maintenance are noticeable and appreciated • Parking at facilities is an issue of concern
Overall Maintenance of the Department’s facilities Participants were asked how they would rate the overall level of maintenance of the Department’s facilities. Survey results show that Oregon City residents recognize the budgetary limitations of the City, yet feel that there are a few changes that could be made to increase the quality of current facilities. For example, residents are very pleased with recent upgrades and maintenance of parks, but feel that some of the indoor facilities are not kept in adequate condition. It was interesting that some members of the focus group were knowledgeable enough about the City to bring up the fact that there is no dedicated funding source for preventative maintenance. Participants’ ratings of the existing facilities were still quite high, averaging 2.6. Municipal Swimming Pool Participants were strongly in support of building a new aquatic center at a different location, possibly one near a future recreation center and/or the public high school. It was suggested that the City partner with a community organization or the Oregon City School District in order to build and run an aquatic facility. Those who attended the focus groups had specific amenities that they would like to see as part of a new facility, including:
• 25 yard competitive pool • Therapeutic pool • Slides, spray pads, wading pool • Zero depth entry • New showers and lockers • Solar heating
Improvements to Existing Facilities Focus group participants’ major concerns, in regard to improvements for facilities, were largely about aging facilities, preventative maintenance, and parking. Examples were provided about past issues with maintenance, need for lighting and security, need for upgrades to park, facility infrastructure, and irrigation or artificial turf for athletic fields. One of the most prevalent issues discussed was the lack of parking at facilities and parks and the problems that this causes for general access, athletic competitions, and programming capacity. Some of the specific issues discussed for infrastructure replacement included:
• Park restrooms • Resurfaced pathways
Oregon City, Parks and Recreation Master Plan Update 51
• Increased parking • New playgrounds • Addition of picnic tables • Renovated tennis courts • New elevator at the Pioneer Center
Underserved Populations in Oregon City Those who participated in the focus groups felt that there are some areas and groups within the Oregon City community that are underserved. The groups and areas that were identified as such include:
• Teens –teen programs and teen events (high school kids need something like “Teen Scene”) • Toddlers – need will increase with young families entering the community • Active older adults‐ lack programming for physical fitness and there is a stigma associated
with senior centers • Adults‐ have a need for more cultural, fitness, and education programming • Newly developing areas
o Singer Creek o Caufield o Park Place o Beaver Creek
New Facilities Focus group participants feel that a new aquatic center should be the highest priority for the development of new recreation facilities for the City. However, it was also mentioned that the City is lacking indoor facility space, such as a multi‐purpose recreation center that could contain components like a gymnasium, fitness area, indoor track, multi‐purpose space, and indoor playground. It was also stated that there is a need for community sports complex with multi‐purpose athletic fields to provide for regional tournaments and competitions. Some additional suggestions for outdoor recreation amenities included trails, an off‐leash dog park, outdoor amphitheater, more natural areas, an outdoor covered basketball court, and a disc golf course. Aquatic and Recreation Center Owned and Operated by YMCA Those who participated in the focus groups feel that there is a strong need for a multi‐purpose recreation center. However, they expressed some concern about the public’s perception of YMCA’s as a faith‐based organization. It was suggested that the City potentially use a similar structure, with another organization such as the community college, school district, private fitness organization, or the Boys and Girls Club of America to operate a facility built and owned by the city. Some other suggested models to use included the City of Astoria and the North Clackamas Recreation District as partners in building a facility in exchange for resident usage. No matter who the partnering organization may be, it was strongly stated that a new aquatic and recreation center would need to be priced like a public facility, so that it was accessible to everyone. A few participants expressed concern about the possibility of this facility competing with current providers, as well as the City potentially losing out on revenue opportunities by allowing another organization to run the facility.
Oregon City, Parks and Recreation Master Plan Update 52
Programs to Be Eliminated When participants were asked what programs should be eliminated, the respondents consistently answered “none.” It is evident that residents are pleased with the programs and activities that are being provided, and would like to see these expanded. The only mention of programs and facilities to eliminate were in regard to the pool, but it was expressed that most community members would want the current facility replaced with a new one. Overall Quality of Customer Service When questioned about the opinion of the customer service provided by the City, attendees expressed that they are very pleased and think highly of the staff and the jobs that they are doing. Again, nearly 100% of those participating rated customer service as “Good” to “Excellent,” with the average rating being 2.5. Some of the specific input provided was that the City and staff:
• Are very helpful and responsive • Are doing a great job with limited resources • Need to increase collaborative efforts with other government and community organizations
Effectiveness of the City in Seeking Feedback The focus group participants provided a positive response about the effectiveness of the City in seeking feedback. They stated that these efforts have greatly improved in recent years and that staff has been very good about seeking input from program and facility users. The average rating was very high at 2.8, utilizing the same rating scale as previous questions. Community Support for Tax Increase or Bond When posed with the question about community support for a tax increase, there was a mixed response with a high amount of concern. The majority of participants said that they would NOT support a bond referendum. This was largely due to a distrust of the government, based on historical events with the firehouse. Accountability is very important to the community and the City needs to gain public support and credibility before a tax increase or bond issue would pass. Yet, some participants said that they would support a bond issue if it was done in the “right way,” with a positive message and if the community would be involved in the specifics of where the money was being allocated, the amount, timeframe for the project, and if it had universal appeal for the community. This process would need to include a lot of public information and involvement to gain support. It was recommended that in the future the City work to mobilize younger new residents to provide support for parks and recreation development and maintenance. Key Partners and Stakeholders Participants of the focus groups were quite cognizant of the budgetary constraints of the City. Therefore, they were very supportive of collaborative efforts to provide park and recreation services to the community. Some of consistently mentioned groups and organizations for partnerships included:
• YMCA • Boys and Girls Club of America • School districts • Clackamas Community College • Private sports and fitness groups
Oregon City, Parks and Recreation Master Plan Update 53
• Local arts commission • Clackamas County Tourism Development Council • Local businesses and corporate sponsors
Key Issues and Values When posed with the question about the key or “sensitive” issues that should be considered in this master plan, there were very few mentioned that had not been brought up from previous questions. This may illustrate that Oregon City is a fairly small community, where issues are widely known and discussed. Some of these included the City’s changing demographics, where it’s apparent that recently and in the future younger residents have and will move to Oregon City. This is a trend that many want to promote, in order to increase development and the tax base. However, there is concern that there are discrepancies about what new and old residents want to support and fund through the City. The historically conservative resident base, as well as restrictions on funding sources (SDC’s and urban growth areas) has resulted in difficulties in getting funding and support for park and recreation facilities, operations, and maintenance. This tied with a high percentage of non‐taxable land has been very limiting for the Department. This Master Plan needs to address identifying and educating the public about park and recreation funding sources. Priorities for the Next 10 Years Although many of the focus group participants were there to voice their concern about specific issues and programs, some common issues were identified to be taken into consideration or addressed in the Master Plan. Some of these include the following issues:
• Addressing the needs of the young families to attract and keep residents • Funding additional staff, operations, and maintenance
o Implementing maintenance utility fees • Establishing more partnerships to stretch funding • Addressing development land requirements
o Changing SDC use requirements • Taking action to renovate or build a pool • Upgrading infrastructures of parks and facilities • Providing for accessibility and walkability of the community; • Providing a broad range of facilities and activities • Building a multipurpose sports complex • Creating or joining a special recreation district
D. Statistically Valid Survey Introduction/Methodology The City of Oregon City conducted a Community Attitude and Interest Survey during December of 2006 and January of 2007 to help establish priorities for the future improvement of parks and recreation facilities, programs and services within the community. The survey was designed to obtain statistically valid results from households throughout the City of Oregon City. The survey was administered by a combination of mail and phone.
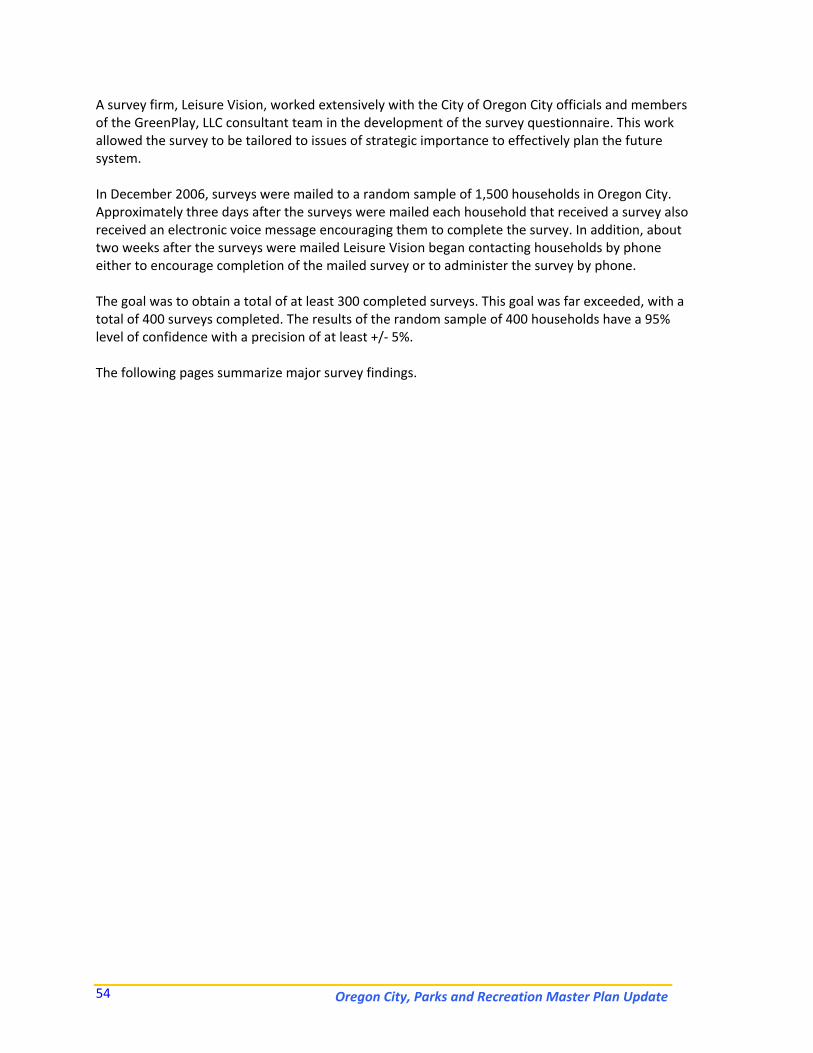
Oregon City, Parks and Recreation Master Plan Update 54
A survey firm, Leisure Vision, worked extensively with the City of Oregon City officials and members of the GreenPlay, LLC consultant team in the development of the survey questionnaire. This work allowed the survey to be tailored to issues of strategic importance to effectively plan the future system. In December 2006, surveys were mailed to a random sample of 1,500 households in Oregon City. Approximately three days after the surveys were mailed each household that received a survey also received an electronic voice message encouraging them to complete the survey. In addition, about two weeks after the surveys were mailed Leisure Vision began contacting households by phone either to encourage completion of the mailed survey or to administer the survey by phone. The goal was to obtain a total of at least 300 completed surveys. This goal was far exceeded, with a total of 400 surveys completed. The results of the random sample of 400 households have a 95% level of confidence with a precision of at least +/‐ 5%. The following pages summarize major survey findings.
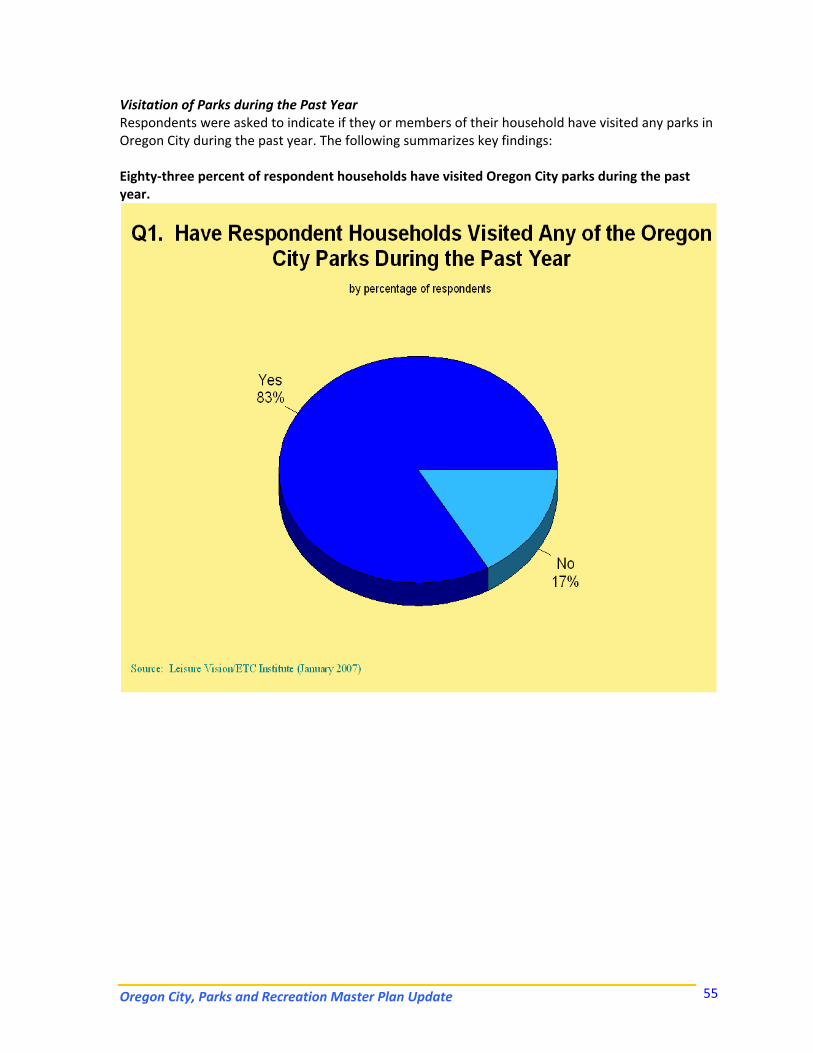
Oregon City, Parks and Recreation Master Plan Update 55
Visitation of Parks during the Past Year Respondents were asked to indicate if they or members of their household have visited any parks in Oregon City during the past year. The following summarizes key findings: Eighty‐three percent of respondent households have visited Oregon City parks during the past year.
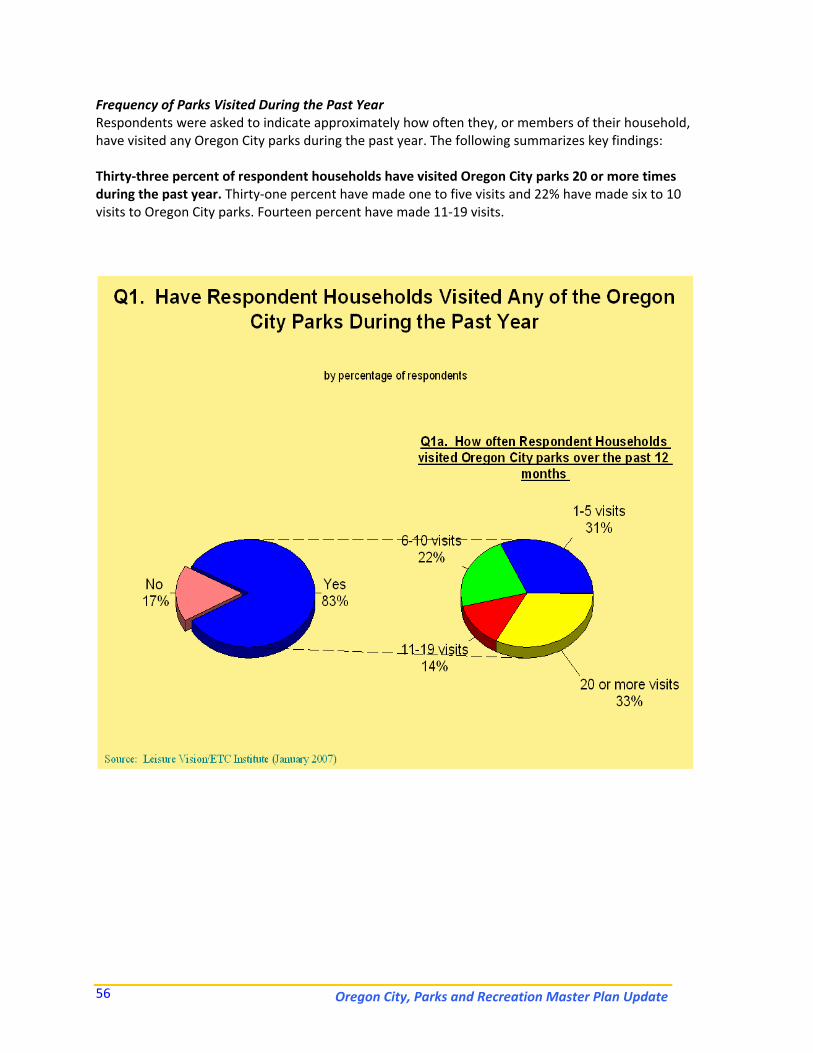
Oregon City, Parks and Recreation Master Plan Update 56
Frequency of Parks Visited During the Past Year Respondents were asked to indicate approximately how often they, or members of their household, have visited any Oregon City parks during the past year. The following summarizes key findings: Thirty‐three percent of respondent households have visited Oregon City parks 20 or more times during the past year. Thirty‐one percent have made one to five visits and 22% have made six to 10 visits to Oregon City parks. Fourteen percent have made 11‐19 visits.
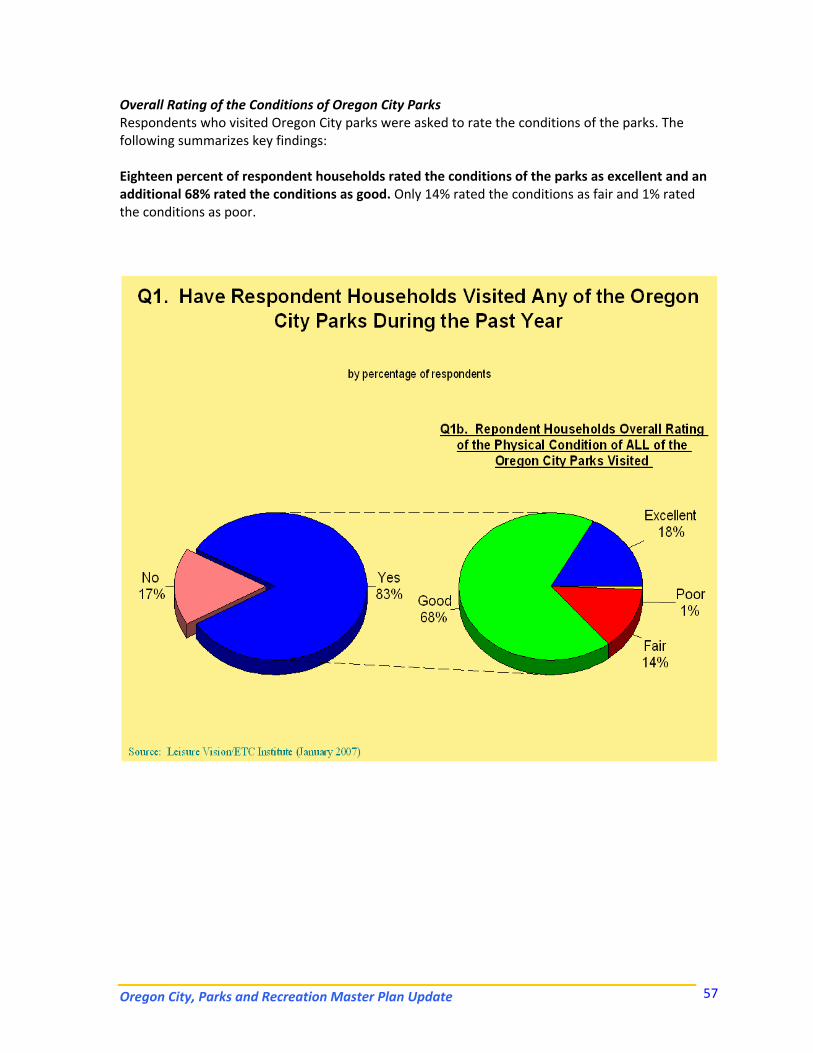
Oregon City, Parks and Recreation Master Plan Update 57
Overall Rating of the Conditions of Oregon City Parks Respondents who visited Oregon City parks were asked to rate the conditions of the parks. The following summarizes key findings: Eighteen percent of respondent households rated the conditions of the parks as excellent and an additional 68% rated the conditions as good. Only 14% rated the conditions as fair and 1% rated the conditions as poor.
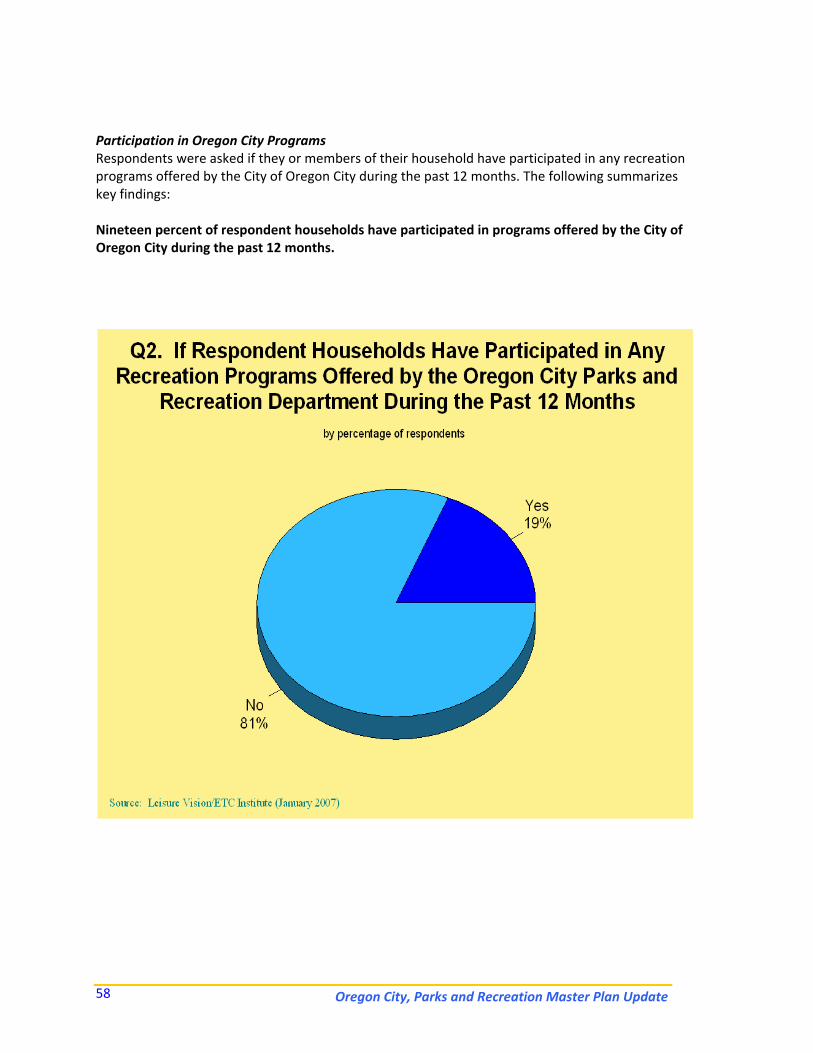
Oregon City, Parks and Recreation Master Plan Update 58
Participation in Oregon City Programs Respondents were asked if they or members of their household have participated in any recreation programs offered by the City of Oregon City during the past 12 months. The following summarizes key findings: Nineteen percent of respondent households have participated in programs offered by the City of Oregon City during the past 12 months.
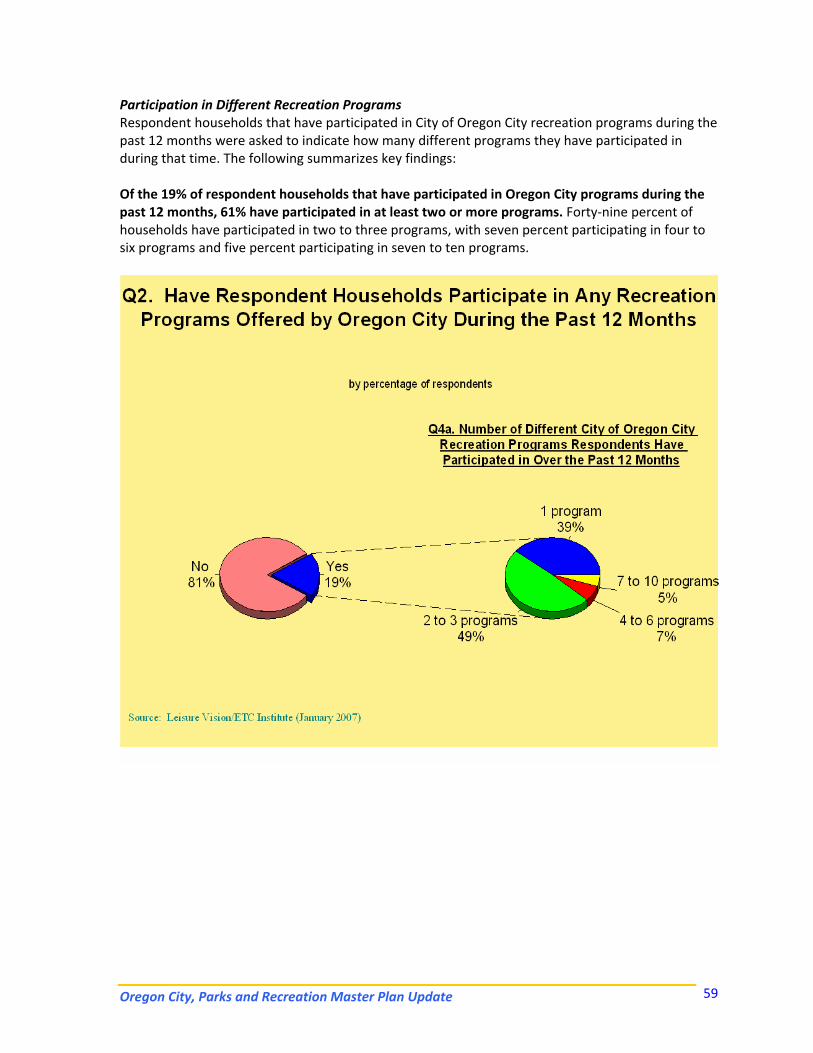
Oregon City, Parks and Recreation Master Plan Update 59
Participation in Different Recreation Programs Respondent households that have participated in City of Oregon City recreation programs during the past 12 months were asked to indicate how many different programs they have participated in during that time. The following summarizes key findings: Of the 19% of respondent households that have participated in Oregon City programs during the past 12 months, 61% have participated in at least two or more programs. Forty‐nine percent of households have participated in two to three programs, with seven percent participating in four to six programs and five percent participating in seven to ten programs.
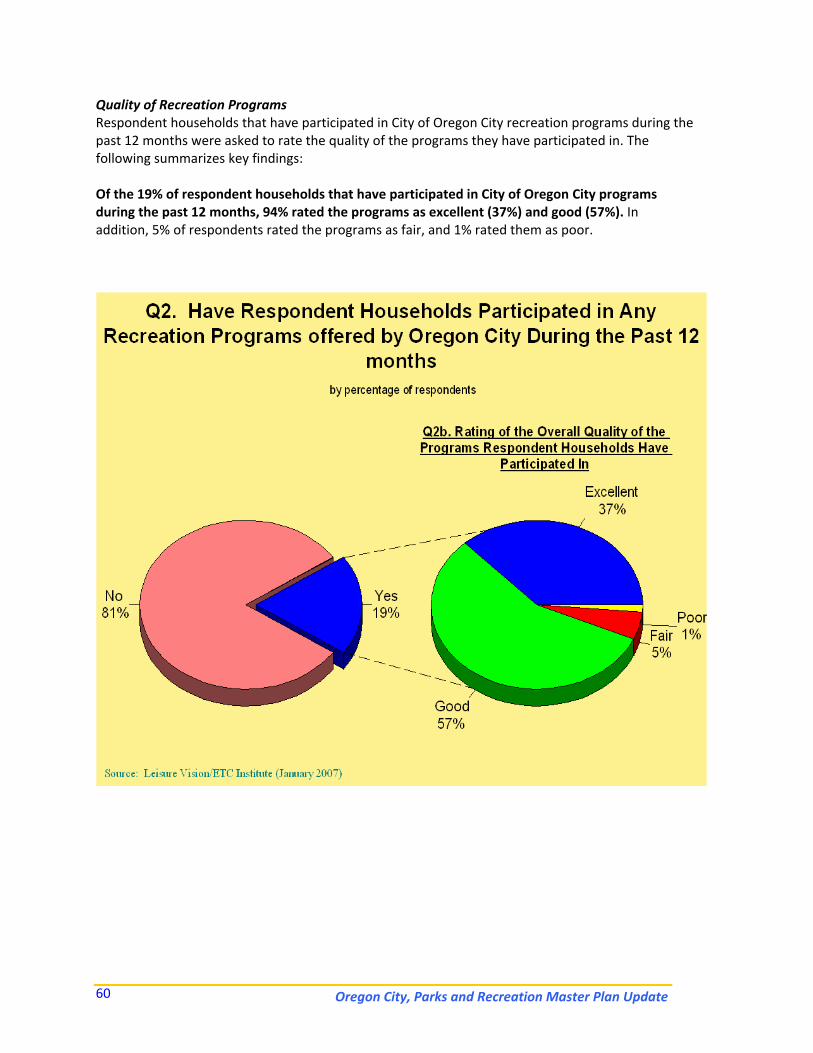
Oregon City, Parks and Recreation Master Plan Update 60
Quality of Recreation Programs Respondent households that have participated in City of Oregon City recreation programs during the past 12 months were asked to rate the quality of the programs they have participated in. The following summarizes key findings: Of the 19% of respondent households that have participated in City of Oregon City programs during the past 12 months, 94% rated the programs as excellent (37%) and good (57%). In addition, 5% of respondents rated the programs as fair, and 1% rated them as poor.
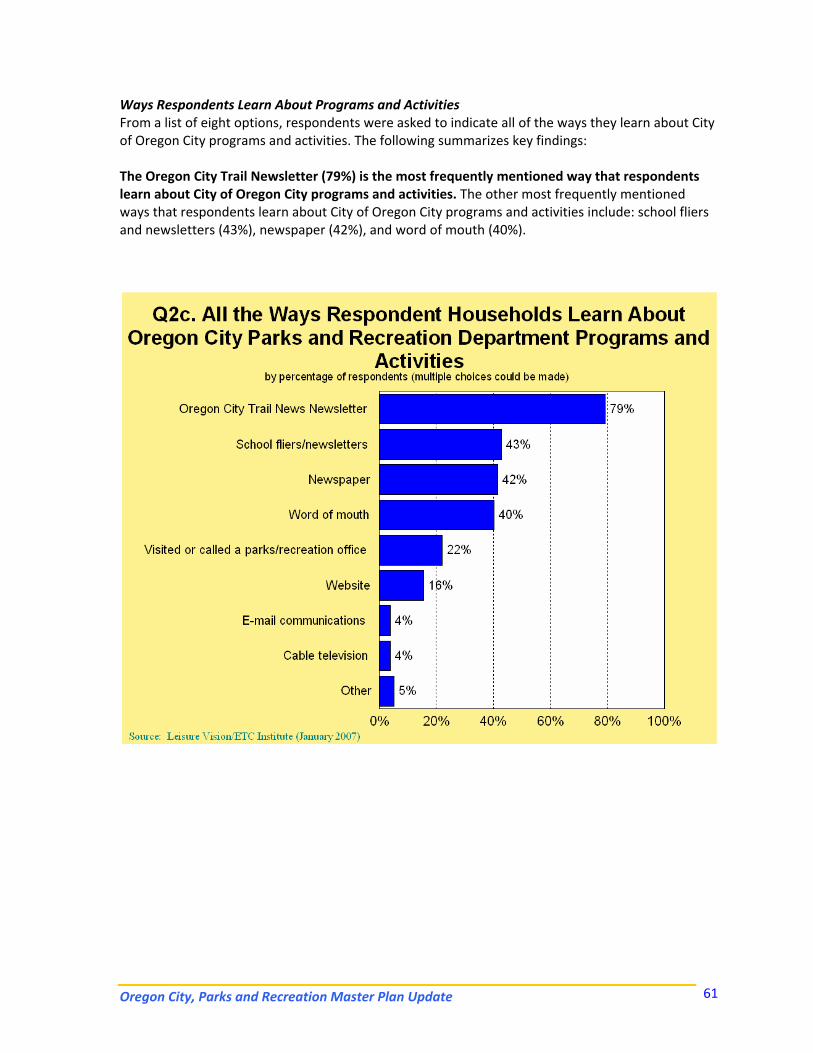
Oregon City, Parks and Recreation Master Plan Update 61
Ways Respondents Learn About Programs and Activities From a list of eight options, respondents were asked to indicate all of the ways they learn about City of Oregon City programs and activities. The following summarizes key findings: The Oregon City Trail Newsletter (79%) is the most frequently mentioned way that respondents learn about City of Oregon City programs and activities. The other most frequently mentioned ways that respondents learn about City of Oregon City programs and activities include: school fliers and newsletters (43%), newspaper (42%), and word of mouth (40%).
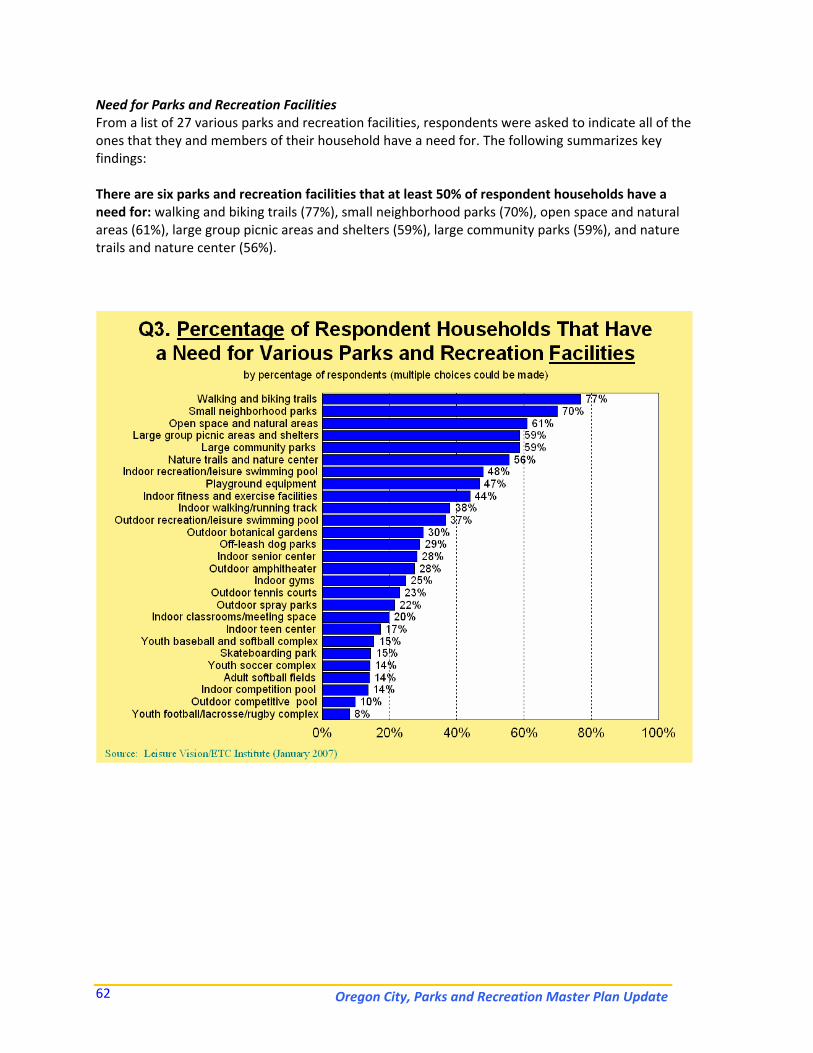
Oregon City, Parks and Recreation Master Plan Update 62
Need for Parks and Recreation Facilities From a list of 27 various parks and recreation facilities, respondents were asked to indicate all of the ones that they and members of their household have a need for. The following summarizes key findings: There are six parks and recreation facilities that at least 50% of respondent households have a need for: walking and biking trails (77%), small neighborhood parks (70%), open space and natural areas (61%), large group picnic areas and shelters (59%), large community parks (59%), and nature trails and nature center (56%).
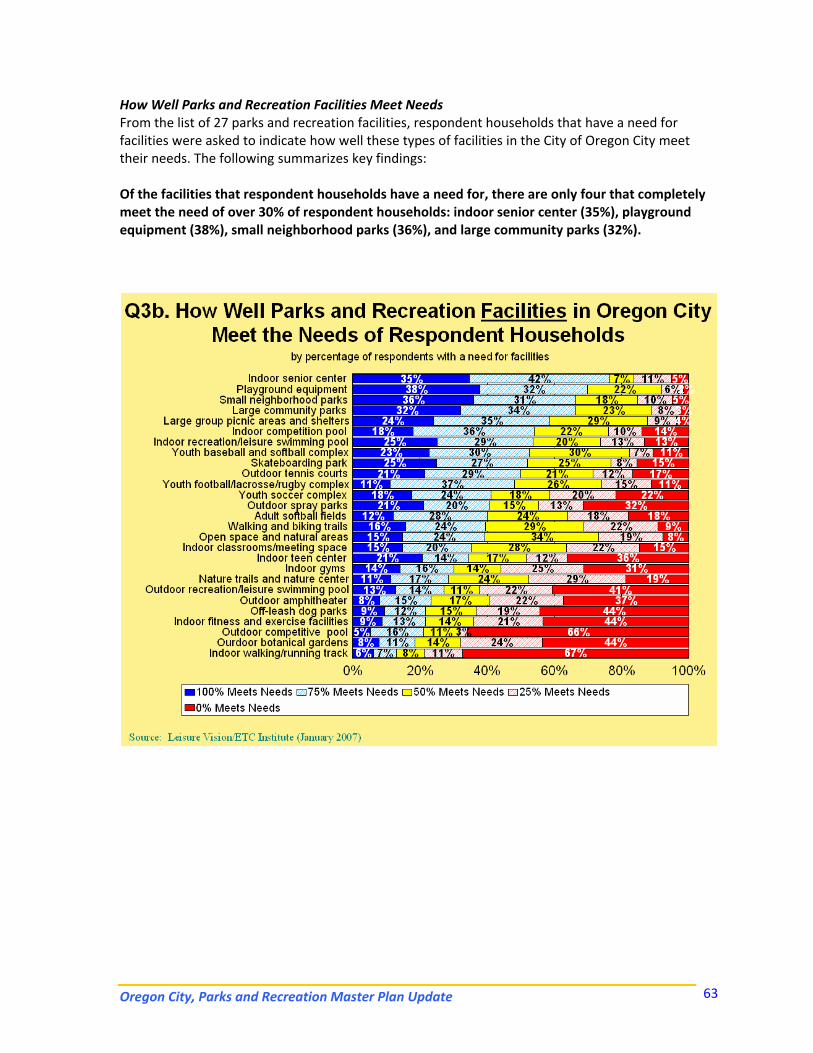
Oregon City, Parks and Recreation Master Plan Update 63
How Well Parks and Recreation Facilities Meet Needs From the list of 27 parks and recreation facilities, respondent households that have a need for facilities were asked to indicate how well these types of facilities in the City of Oregon City meet their needs. The following summarizes key findings: Of the facilities that respondent households have a need for, there are only four that completely meet the need of over 30% of respondent households: indoor senior center (35%), playground equipment (38%), small neighborhood parks (36%), and large community parks (32%).
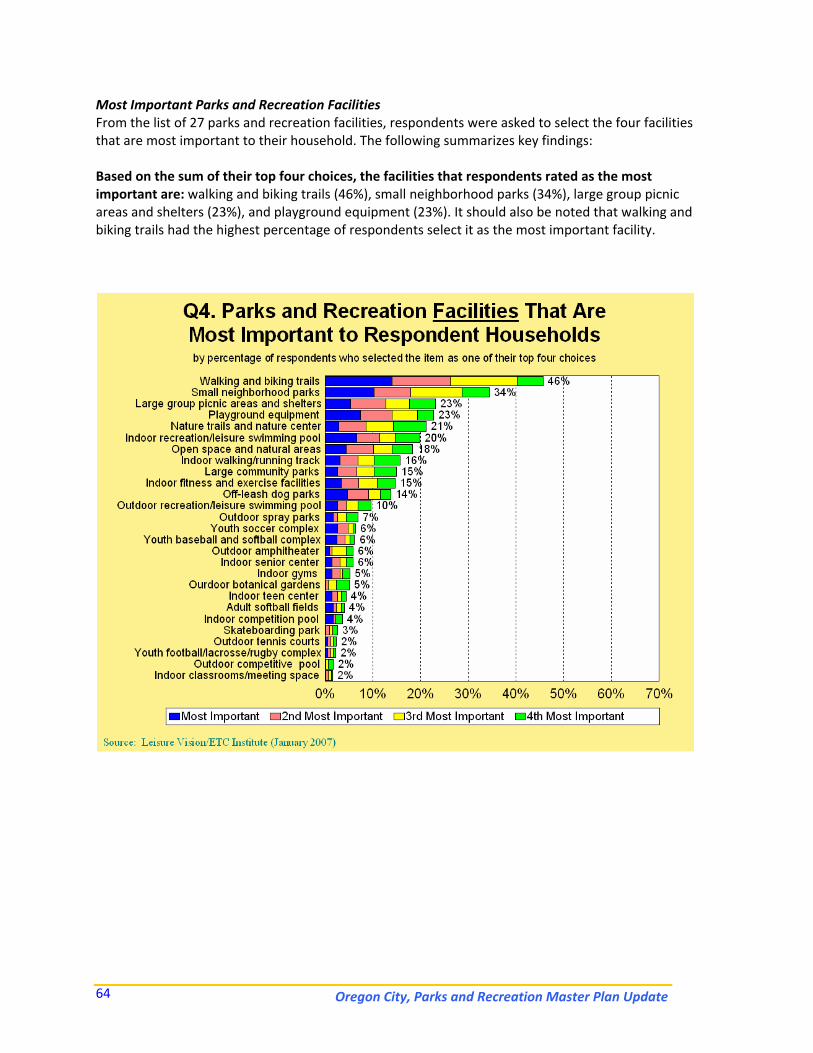
Oregon City, Parks and Recreation Master Plan Update 64
Most Important Parks and Recreation Facilities From the list of 27 parks and recreation facilities, respondents were asked to select the four facilities that are most important to their household. The following summarizes key findings: Based on the sum of their top four choices, the facilities that respondents rated as the most important are: walking and biking trails (46%), small neighborhood parks (34%), large group picnic areas and shelters (23%), and playground equipment (23%). It should also be noted that walking and biking trails had the highest percentage of respondents select it as the most important facility.
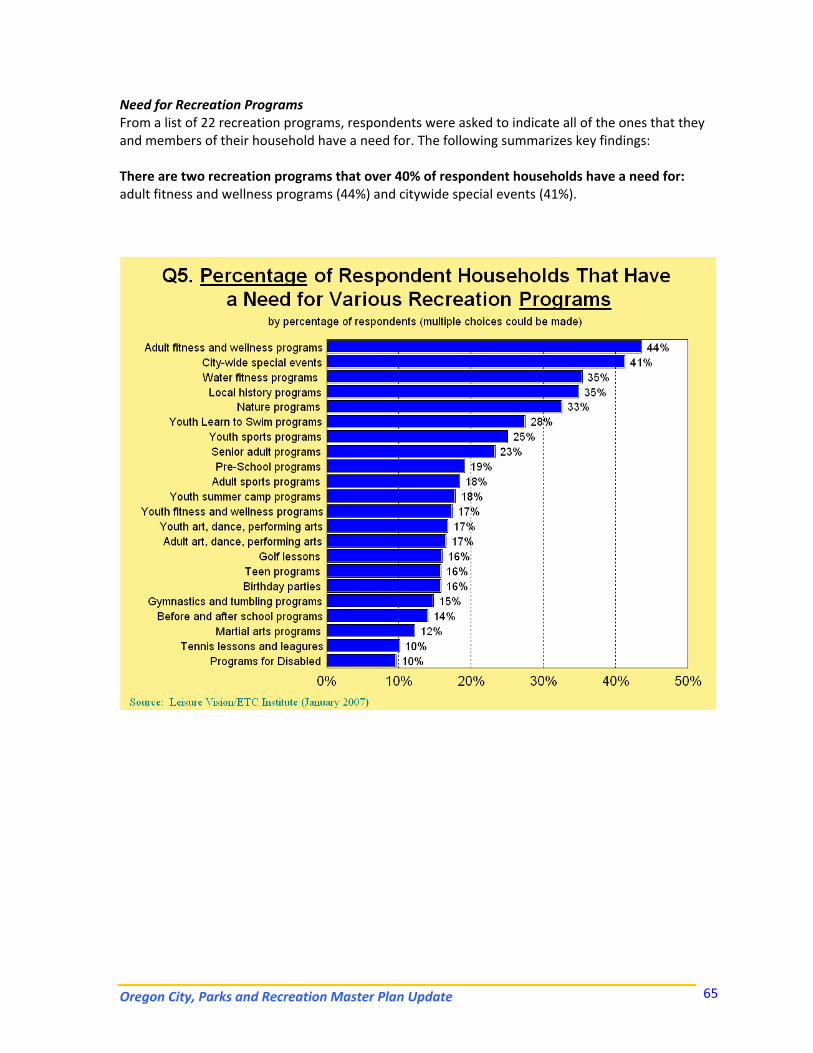
Oregon City, Parks and Recreation Master Plan Update 65
Need for Recreation Programs From a list of 22 recreation programs, respondents were asked to indicate all of the ones that they and members of their household have a need for. The following summarizes key findings: There are two recreation programs that over 40% of respondent households have a need for: adult fitness and wellness programs (44%) and citywide special events (41%).
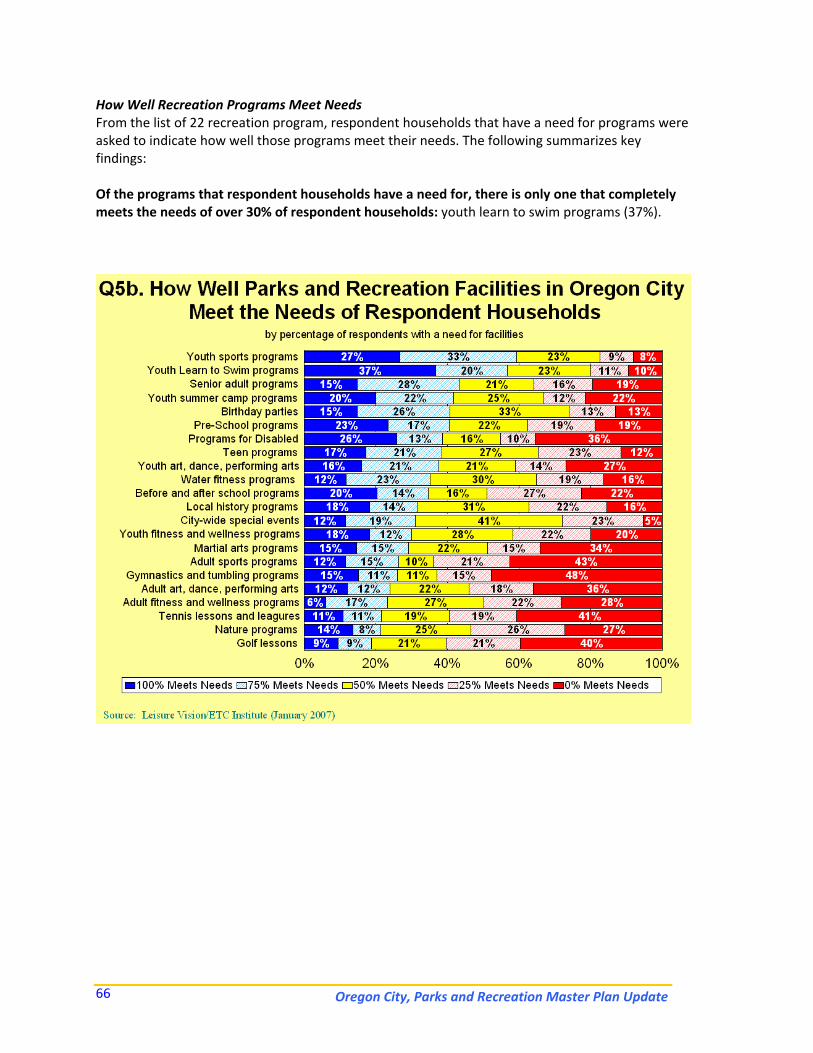
Oregon City, Parks and Recreation Master Plan Update 66
How Well Recreation Programs Meet Needs From the list of 22 recreation program, respondent households that have a need for programs were asked to indicate how well those programs meet their needs. The following summarizes key findings: Of the programs that respondent households have a need for, there is only one that completely meets the needs of over 30% of respondent households: youth learn to swim programs (37%).
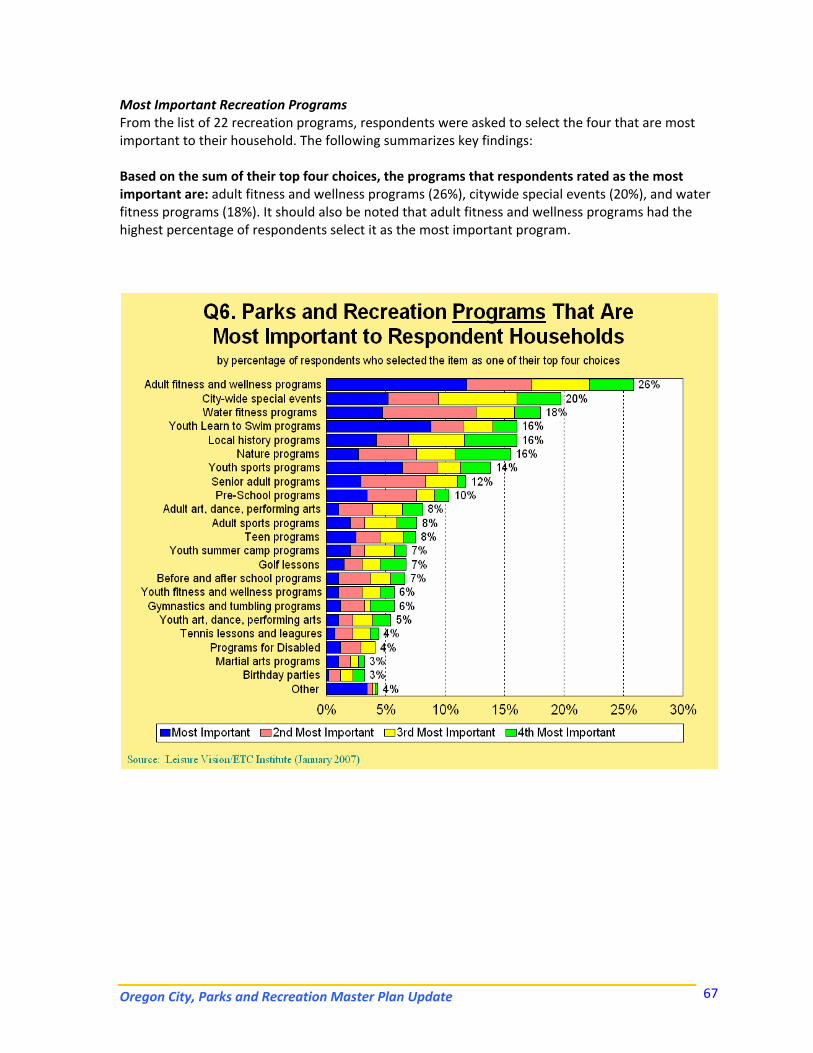
Oregon City, Parks and Recreation Master Plan Update 67
Most Important Recreation Programs From the list of 22 recreation programs, respondents were asked to select the four that are most important to their household. The following summarizes key findings: Based on the sum of their top four choices, the programs that respondents rated as the most important are: adult fitness and wellness programs (26%), citywide special events (20%), and water fitness programs (18%). It should also be noted that adult fitness and wellness programs had the highest percentage of respondents select it as the most important program.
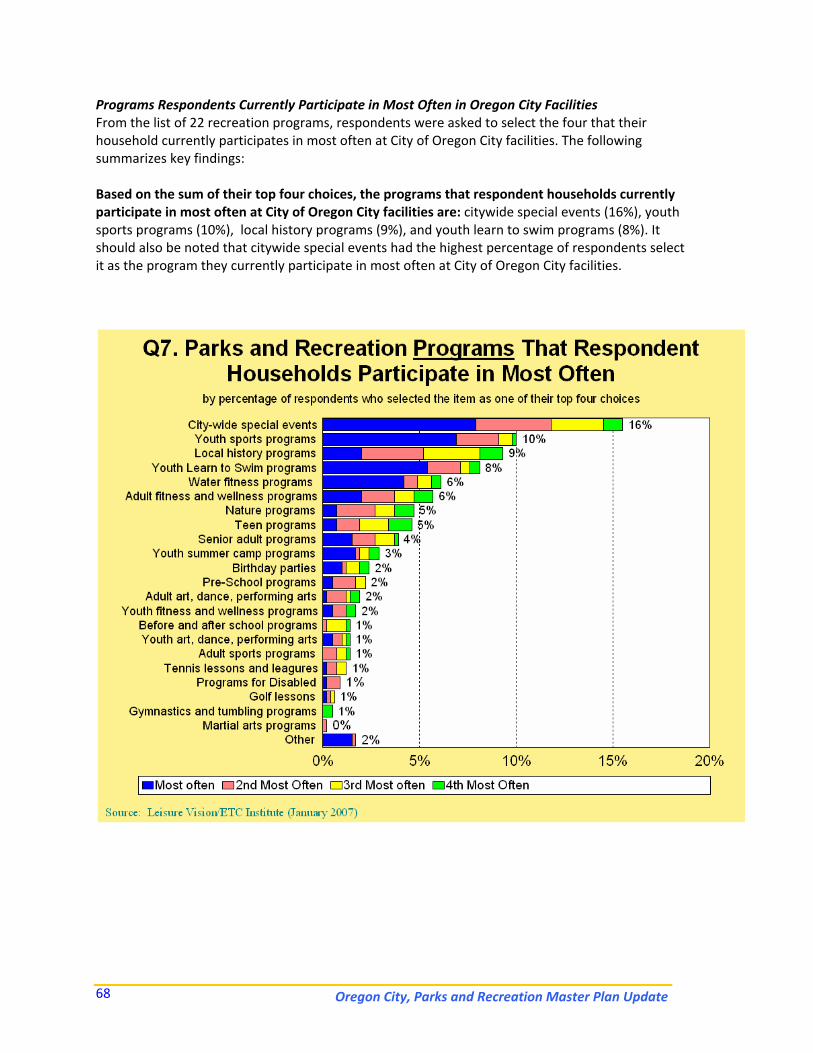
Oregon City, Parks and Recreation Master Plan Update 68
Programs Respondents Currently Participate in Most Often in Oregon City Facilities From the list of 22 recreation programs, respondents were asked to select the four that their household currently participates in most often at City of Oregon City facilities. The following summarizes key findings: Based on the sum of their top four choices, the programs that respondent households currently participate in most often at City of Oregon City facilities are: citywide special events (16%), youth sports programs (10%), local history programs (9%), and youth learn to swim programs (8%). It should also be noted that citywide special events had the highest percentage of respondents select it as the program they currently participate in most often at City of Oregon City facilities.
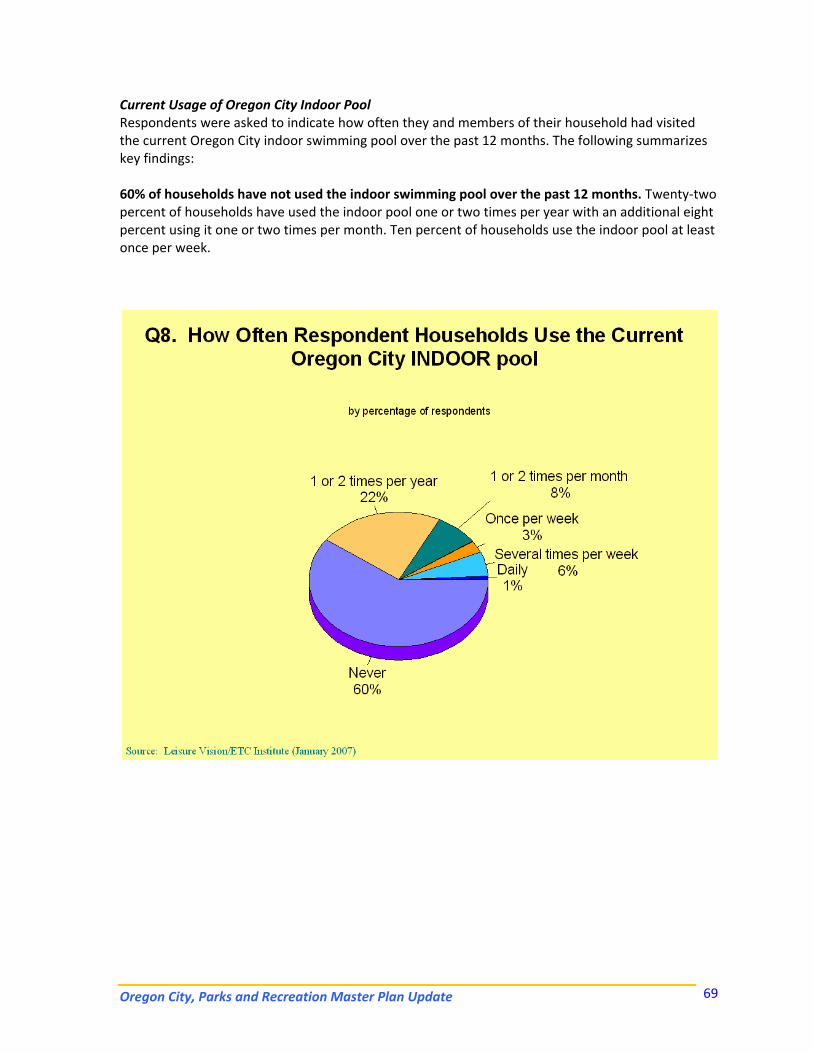
Oregon City, Parks and Recreation Master Plan Update 69
Current Usage of Oregon City Indoor Pool Respondents were asked to indicate how often they and members of their household had visited the current Oregon City indoor swimming pool over the past 12 months. The following summarizes key findings: 60% of households have not used the indoor swimming pool over the past 12 months. Twenty‐two percent of households have used the indoor pool one or two times per year with an additional eight percent using it one or two times per month. Ten percent of households use the indoor pool at least once per week.
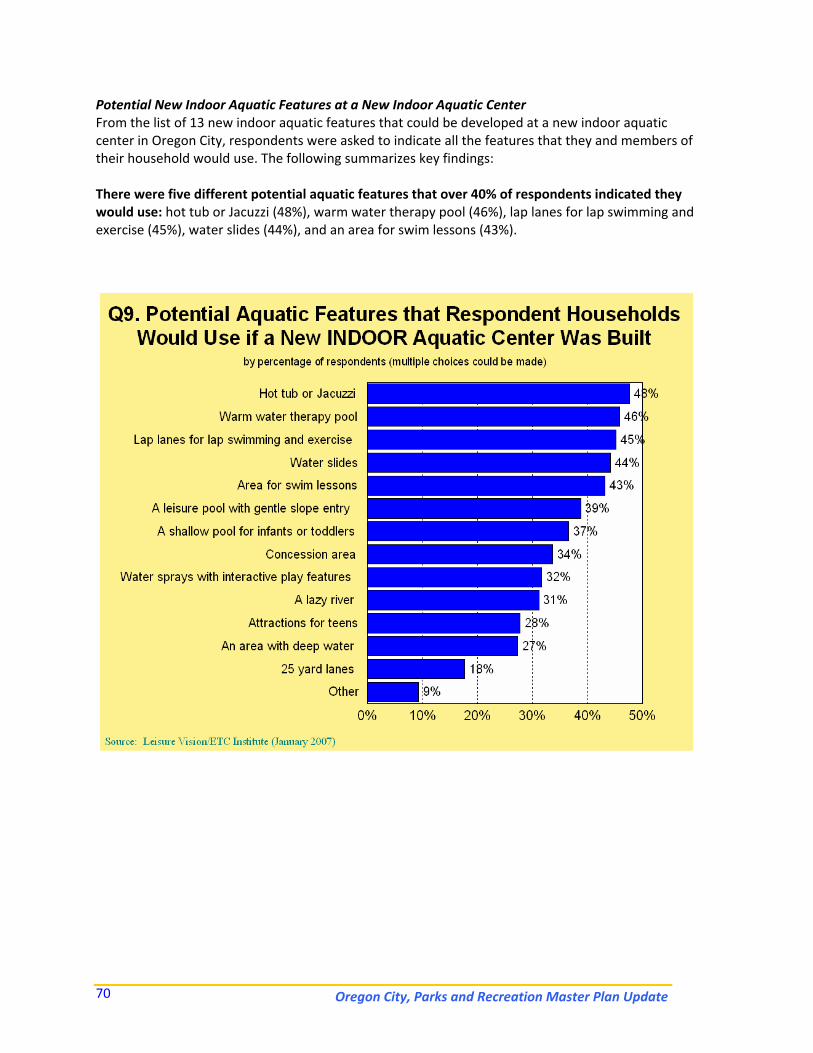
Oregon City, Parks and Recreation Master Plan Update 70
Potential New Indoor Aquatic Features at a New Indoor Aquatic Center From the list of 13 new indoor aquatic features that could be developed at a new indoor aquatic center in Oregon City, respondents were asked to indicate all the features that they and members of their household would use. The following summarizes key findings: There were five different potential aquatic features that over 40% of respondents indicated they would use: hot tub or Jacuzzi (48%), warm water therapy pool (46%), lap lanes for lap swimming and exercise (45%), water slides (44%), and an area for swim lessons (43%).
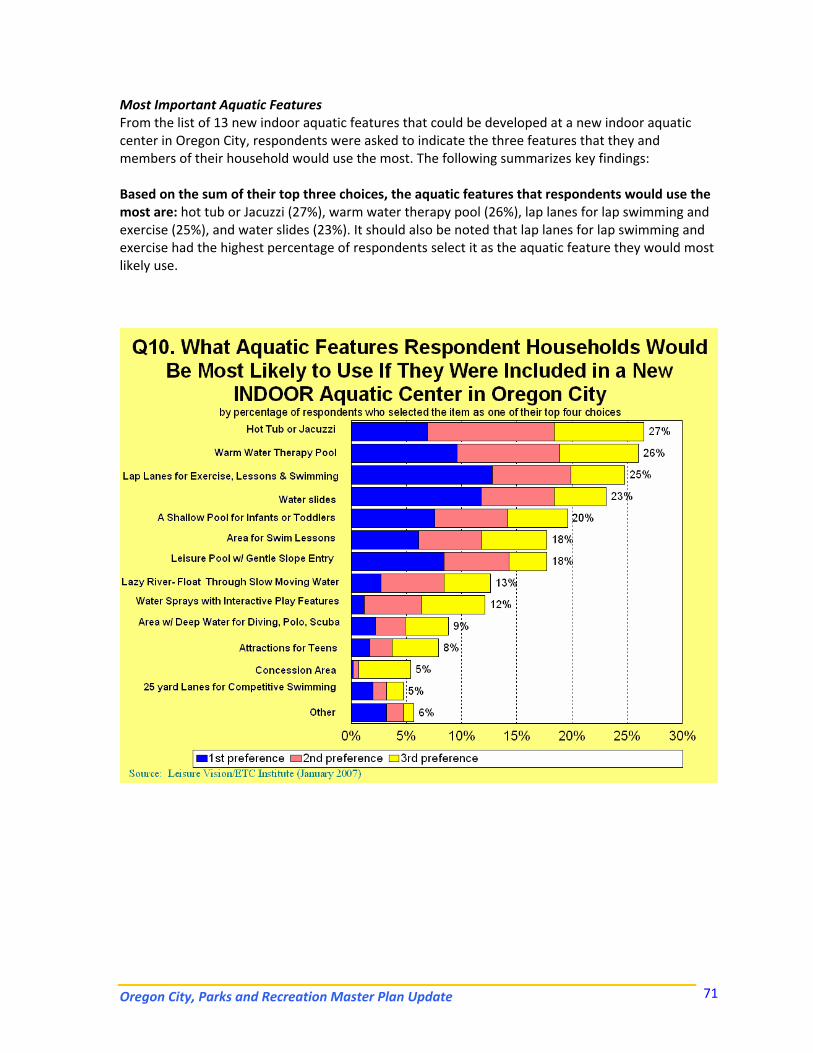
Oregon City, Parks and Recreation Master Plan Update 71
Most Important Aquatic Features From the list of 13 new indoor aquatic features that could be developed at a new indoor aquatic center in Oregon City, respondents were asked to indicate the three features that they and members of their household would use the most. The following summarizes key findings: Based on the sum of their top three choices, the aquatic features that respondents would use the most are: hot tub or Jacuzzi (27%), warm water therapy pool (26%), lap lanes for lap swimming and exercise (25%), and water slides (23%). It should also be noted that lap lanes for lap swimming and exercise had the highest percentage of respondents select it as the aquatic feature they would most likely use.
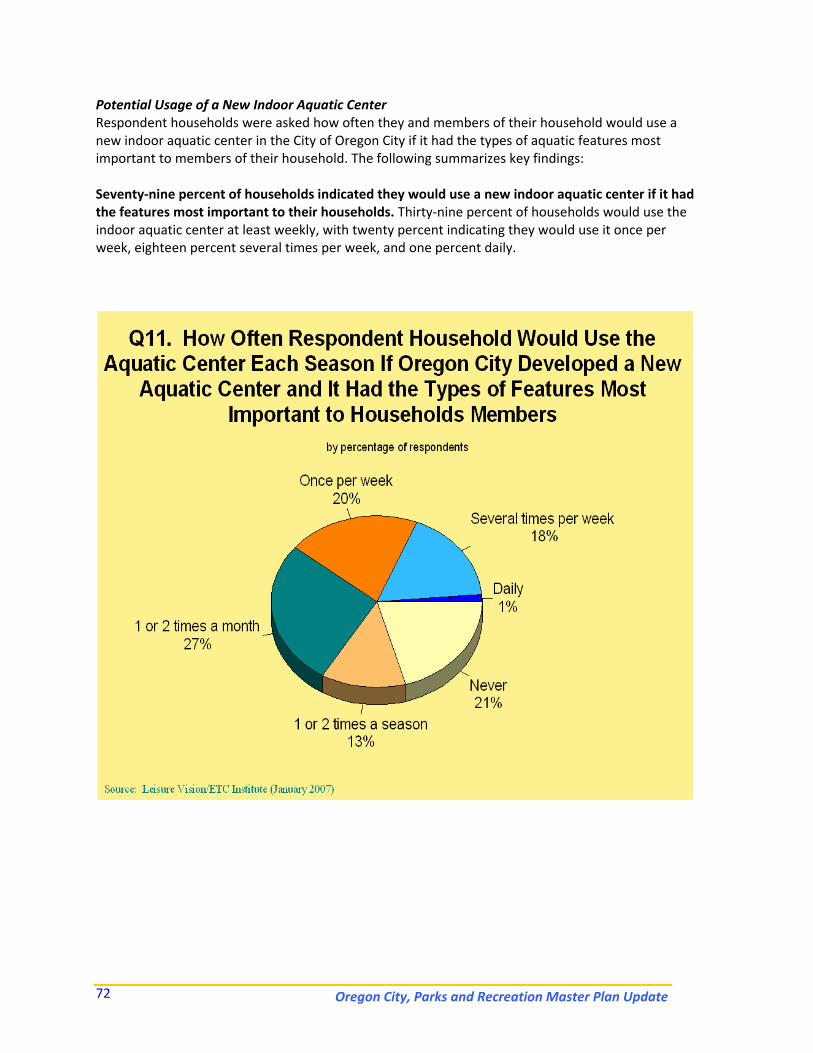
Oregon City, Parks and Recreation Master Plan Update 72
Potential Usage of a New Indoor Aquatic Center Respondent households were asked how often they and members of their household would use a new indoor aquatic center in the City of Oregon City if it had the types of aquatic features most important to members of their household. The following summarizes key findings: Seventy‐nine percent of households indicated they would use a new indoor aquatic center if it had the features most important to their households. Thirty‐nine percent of households would use the indoor aquatic center at least weekly, with twenty percent indicating they would use it once per week, eighteen percent several times per week, and one percent daily.
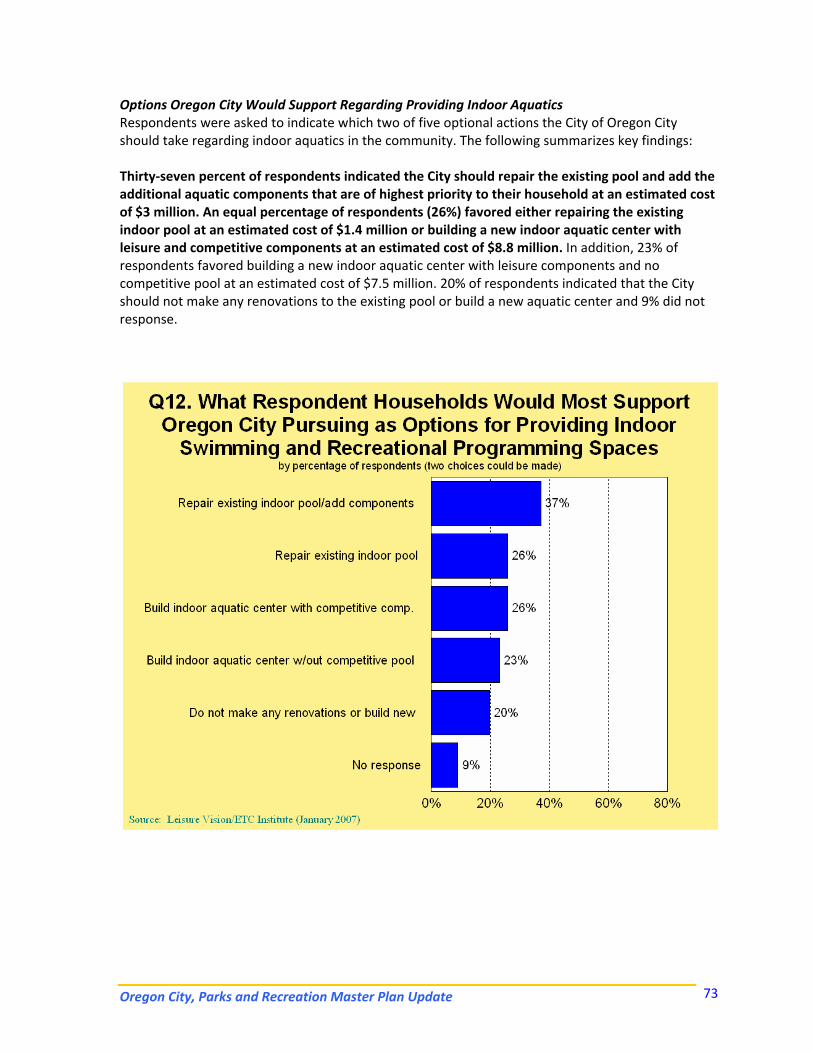
Oregon City, Parks and Recreation Master Plan Update 73
Options Oregon City Would Support Regarding Providing Indoor Aquatics Respondents were asked to indicate which two of five optional actions the City of Oregon City should take regarding indoor aquatics in the community. The following summarizes key findings: Thirty‐seven percent of respondents indicated the City should repair the existing pool and add the additional aquatic components that are of highest priority to their household at an estimated cost of $3 million. An equal percentage of respondents (26%) favored either repairing the existing indoor pool at an estimated cost of $1.4 million or building a new indoor aquatic center with leisure and competitive components at an estimated cost of $8.8 million. In addition, 23% of respondents favored building a new indoor aquatic center with leisure components and no competitive pool at an estimated cost of $7.5 million. 20% of respondents indicated that the City should not make any renovations to the existing pool or build a new aquatic center and 9% did not response.
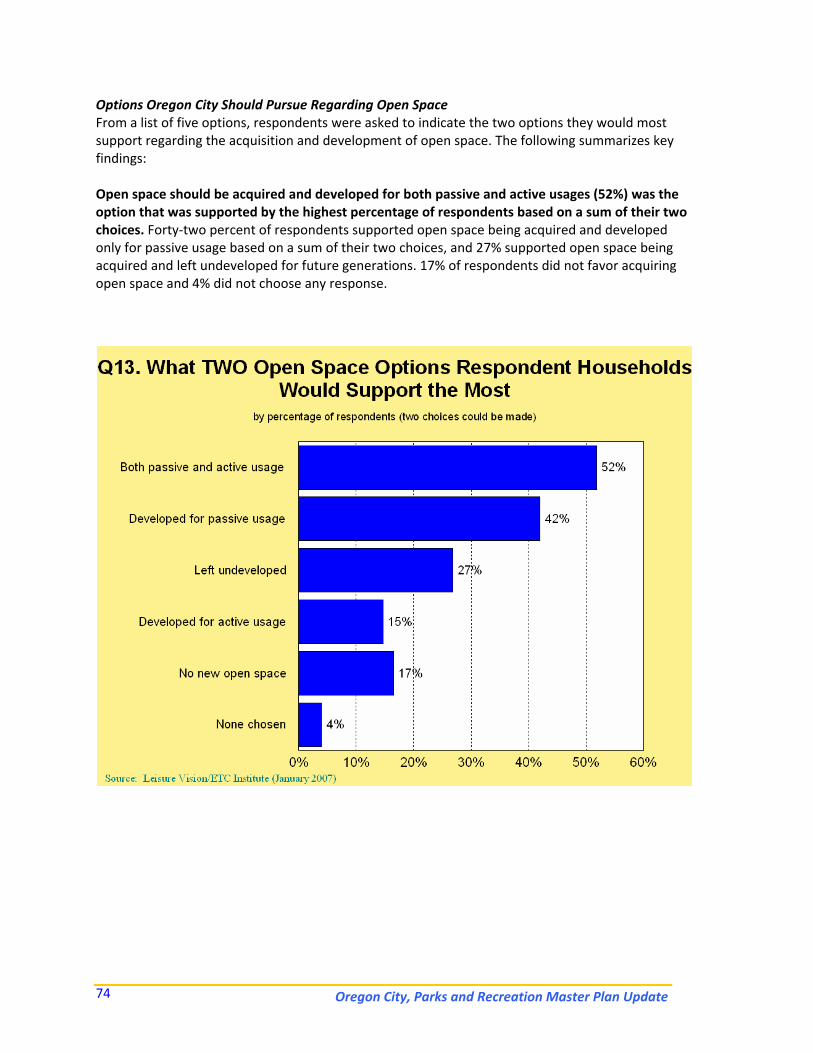
Oregon City, Parks and Recreation Master Plan Update 74
Options Oregon City Should Pursue Regarding Open Space From a list of five options, respondents were asked to indicate the two options they would most support regarding the acquisition and development of open space. The following summarizes key findings: Open space should be acquired and developed for both passive and active usages (52%) was the option that was supported by the highest percentage of respondents based on a sum of their two choices. Forty‐two percent of respondents supported open space being acquired and developed only for passive usage based on a sum of their two choices, and 27% supported open space being acquired and left undeveloped for future generations. 17% of respondents did not favor acquiring open space and 4% did not choose any response.
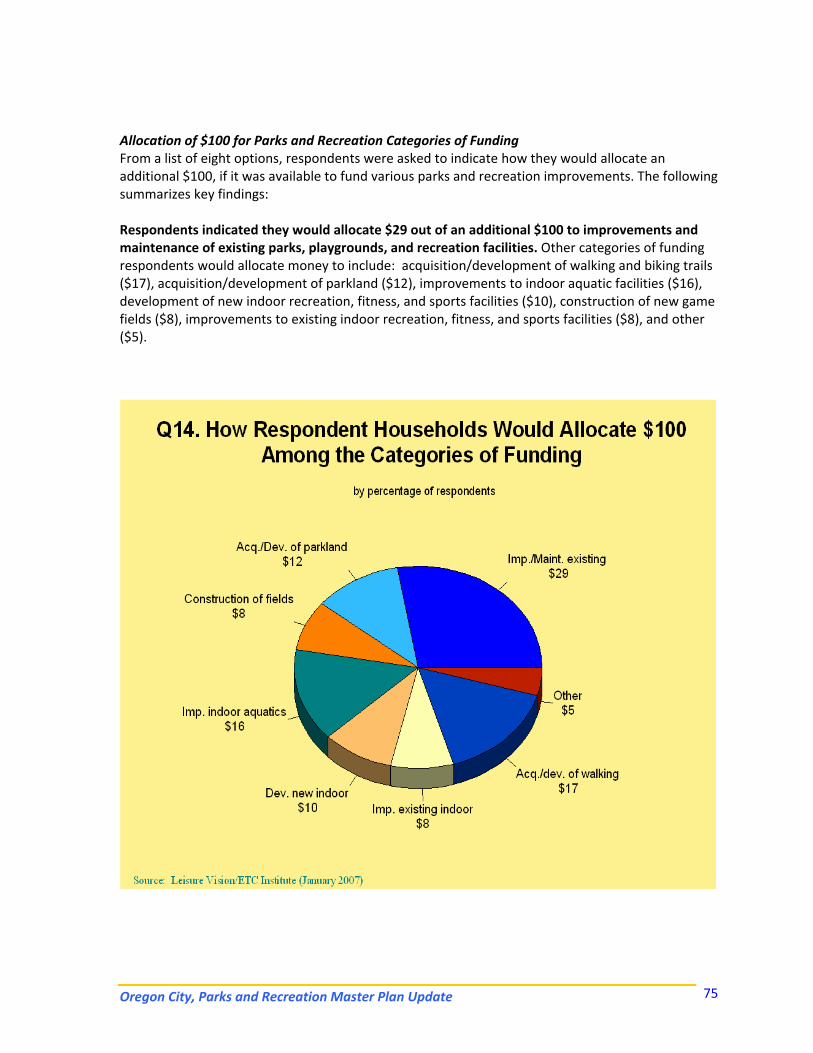
Oregon City, Parks and Recreation Master Plan Update 75
Allocation of $100 for Parks and Recreation Categories of Funding From a list of eight options, respondents were asked to indicate how they would allocate an additional $100, if it was available to fund various parks and recreation improvements. The following summarizes key findings: Respondents indicated they would allocate $29 out of an additional $100 to improvements and maintenance of existing parks, playgrounds, and recreation facilities. Other categories of funding respondents would allocate money to include: acquisition/development of walking and biking trails ($17), acquisition/development of parkland ($12), improvements to indoor aquatic facilities ($16), development of new indoor recreation, fitness, and sports facilities ($10), construction of new game fields ($8), improvements to existing indoor recreation, fitness, and sports facilities ($8), and other ($5).
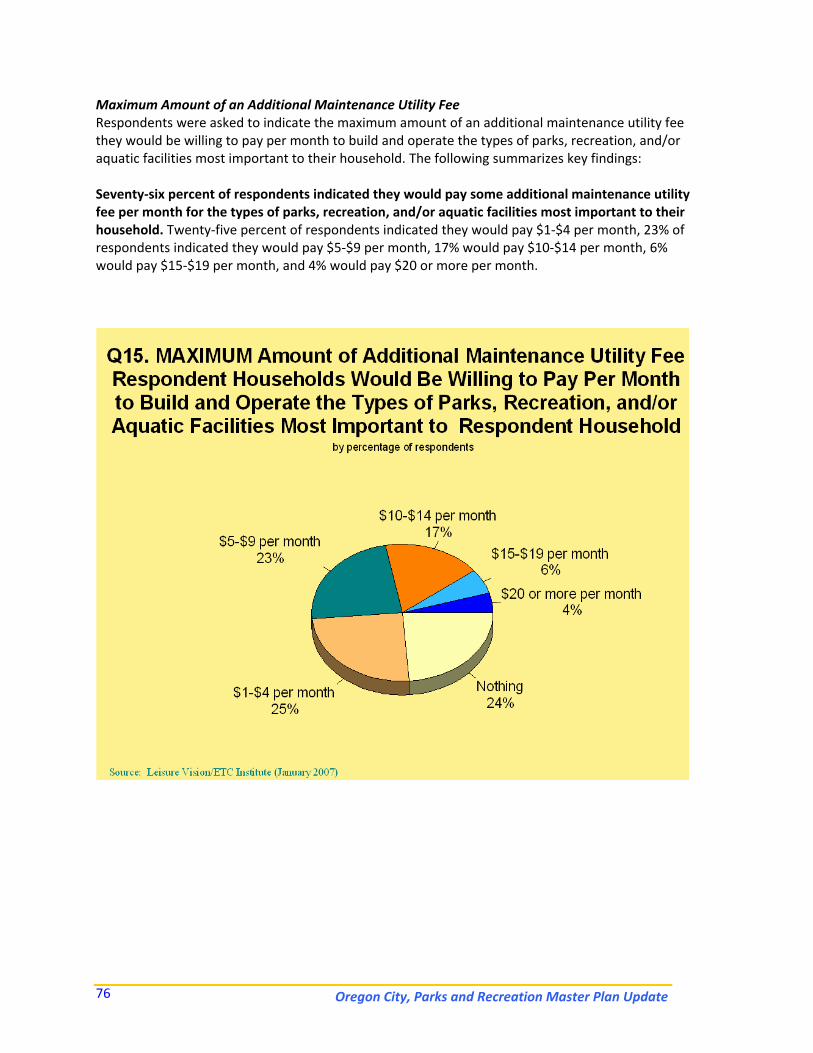
Oregon City, Parks and Recreation Master Plan Update 76
Maximum Amount of an Additional Maintenance Utility Fee Respondents were asked to indicate the maximum amount of an additional maintenance utility fee they would be willing to pay per month to build and operate the types of parks, recreation, and/or aquatic facilities most important to their household. The following summarizes key findings: Seventy‐six percent of respondents indicated they would pay some additional maintenance utility fee per month for the types of parks, recreation, and/or aquatic facilities most important to their household. Twenty‐five percent of respondents indicated they would pay $1‐$4 per month, 23% of respondents indicated they would pay $5‐$9 per month, 17% would pay $10‐$14 per month, 6% would pay $15‐$19 per month, and 4% would pay $20 or more per month.
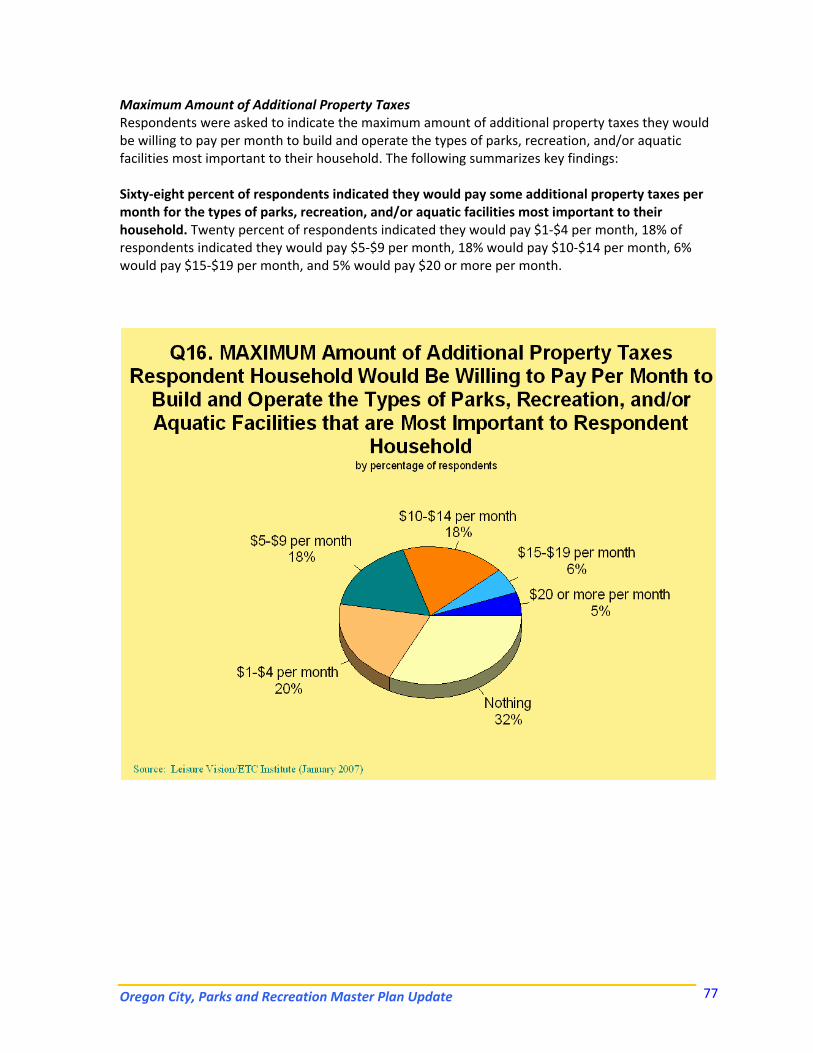
Oregon City, Parks and Recreation Master Plan Update 77
Maximum Amount of Additional Property Taxes Respondents were asked to indicate the maximum amount of additional property taxes they would be willing to pay per month to build and operate the types of parks, recreation, and/or aquatic facilities most important to their household. The following summarizes key findings: Sixty‐eight percent of respondents indicated they would pay some additional property taxes per month for the types of parks, recreation, and/or aquatic facilities most important to their household. Twenty percent of respondents indicated they would pay $1‐$4 per month, 18% of respondents indicated they would pay $5‐$9 per month, 18% would pay $10‐$14 per month, 6% would pay $15‐$19 per month, and 5% would pay $20 or more per month.
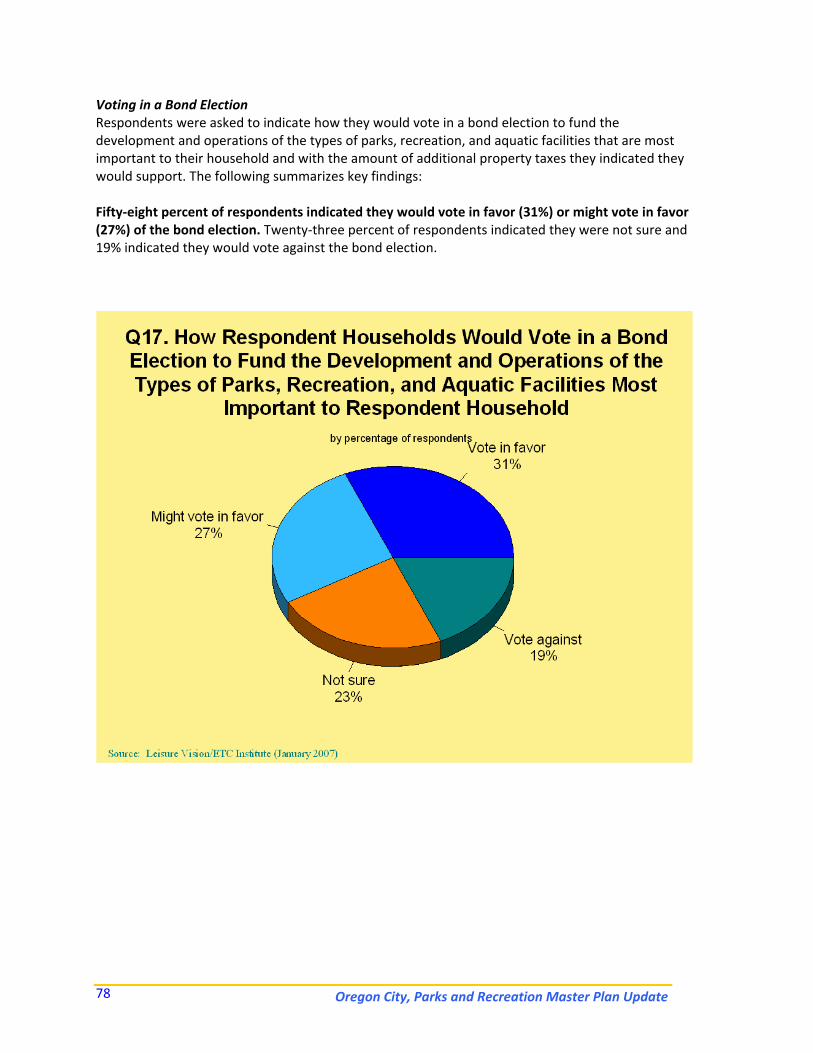
Oregon City, Parks and Recreation Master Plan Update 78
Voting in a Bond Election Respondents were asked to indicate how they would vote in a bond election to fund the development and operations of the types of parks, recreation, and aquatic facilities that are most important to their household and with the amount of additional property taxes they indicated they would support. The following summarizes key findings: Fifty‐eight percent of respondents indicated they would vote in favor (31%) or might vote in favor (27%) of the bond election. Twenty‐three percent of respondents indicated they were not sure and 19% indicated they would vote against the bond election.
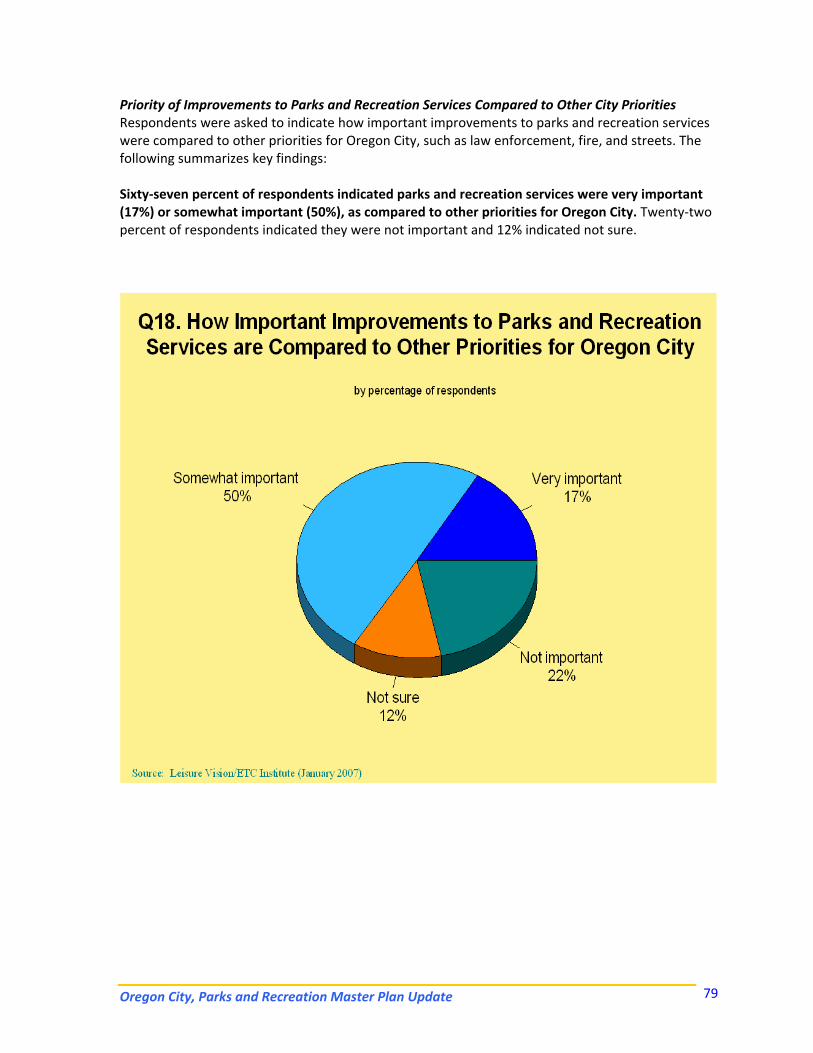
Oregon City, Parks and Recreation Master Plan Update 79
Priority of Improvements to Parks and Recreation Services Compared to Other City Priorities Respondents were asked to indicate how important improvements to parks and recreation services were compared to other priorities for Oregon City, such as law enforcement, fire, and streets. The following summarizes key findings: Sixty‐seven percent of respondents indicated parks and recreation services were very important (17%) or somewhat important (50%), as compared to other priorities for Oregon City. Twenty‐two percent of respondents indicated they were not important and 12% indicated not sure.
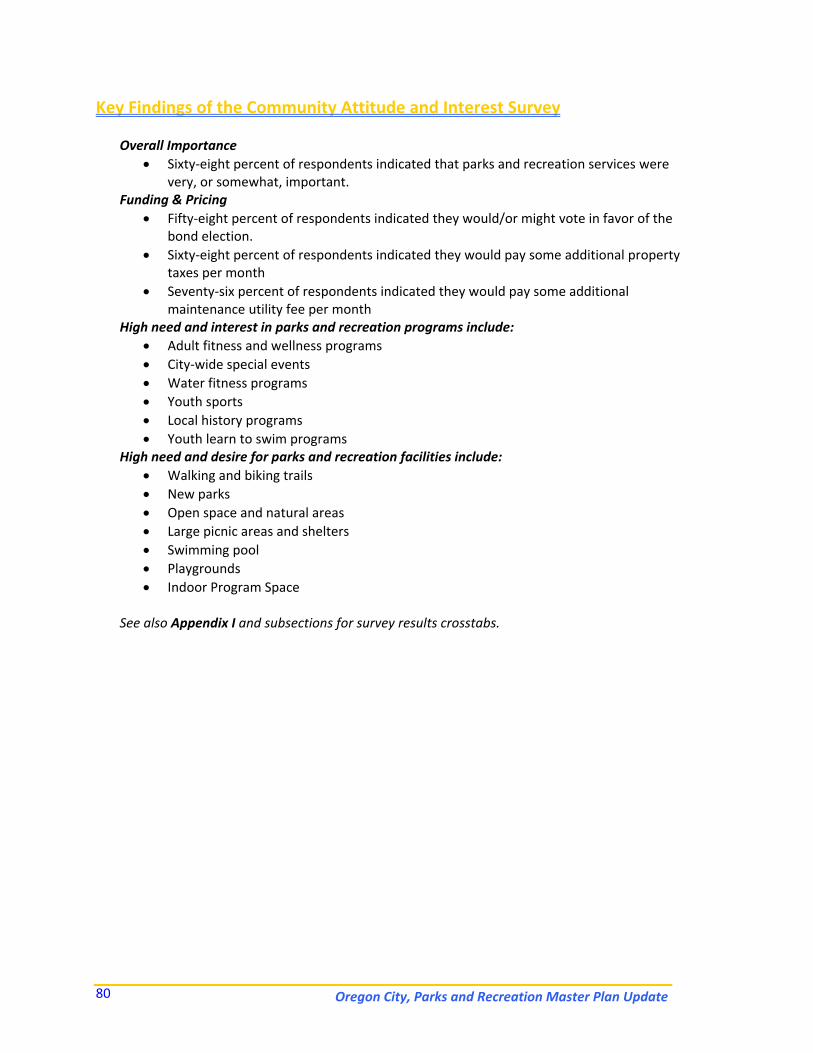
Oregon City, Parks and Recreation Master Plan Update 80
Key Findings of the Community Attitude and Interest Survey
Overall Importance • Sixty‐eight percent of respondents indicated that parks and recreation services were
very, or somewhat, important. Funding & Pricing
• Fifty‐eight percent of respondents indicated they would/or might vote in favor of the bond election.
• Sixty‐eight percent of respondents indicated they would pay some additional property taxes per month
• Seventy‐six percent of respondents indicated they would pay some additional maintenance utility fee per month
High need and interest in parks and recreation programs include: • Adult fitness and wellness programs • City‐wide special events • Water fitness programs • Youth sports • Local history programs • Youth learn to swim programs
High need and desire for parks and recreation facilities include: • Walking and biking trails • New parks • Open space and natural areas • Large picnic areas and shelters • Swimming pool • Playgrounds • Indoor Program Space
See also Appendix I and subsections for survey results crosstabs.
Oregon City, Parks and Recreation Master Plan Update 81
IV. What We Have Now – An Analysis of Programs and Spaces
Following is a description and analysis of Oregon City’s current special event programs, parks and special use facilities, trails and open space, including an overview of other publicly owned open space land surrounding Oregon City. Additional findings related to these program areas, facilities, uses, and Level of Service analysis follow in the GRASP® Analysis section to provide insights into how these parks and recreation facilities are meeting current needs and will meet future needs. This section of the report concludes with a description of some of the key area recreation providers to help assess how these alternative providers impact and complement Oregon City’s future opportunities for expanded parks and recreation services as a mountain resort city.
A. Recreation Programs and Services The City’s recreational program provides opportunities, activities, special events, and programs to the community. The Department currently offers adult programs such as Karate, Yoga, Pilates, Scottish Single Stick (a form of fencing), and Tribal Dance. The youth offerings include summer outdoor day camps, sports camps, performing arts camps, sports classes, and field trips. Teen Scene, a Friday night dance for middle school kids has been operating successfully for over eight years. However the department has seen a significant decline in attendance over the last year. In the years prior to the past year, from 150‐250 middle school age youth attended this ongoing activity at the swimming pool each week to socialize and dance in a safe, supervised environment. Programming for this age group is being revised to gain more participation. Several special events are offered annually by the Department, including the 4th of July Celebration, and the very popular Summer Concerts in the Park. The newest special event, the Daddy Daughter Dinner Dance, has been well attended the past three winters. This program provides fathers with an opportunity to spend some quality time with their daughters at a Valentine’s Day themed event. Additionally, the Department plays a supporting role or has played a role in forming other popular community events such as the Pioneer Family Festival, the Oregon City Farmers Market, the First City Arts Fair and others. The lack of a community recreation center poses a significant challenge to programming. The City does not have a public facility available to host many of the activities that may otherwise be offered to the community. Past budget reductions have also resulted in the elimination of the recreation programmer’s position. As a result, the City is limited in their capacity to offer more programs and activities than they currently do.
Carnegie Center The Carnegie Center originally opened in 1913 as the site of the Oregon City Public Library and operated as such until 1994. It has since been reopened as a community center. In 2001, the Carnegie underwent a major renovation. The yearlong, $1.4 million project restored the building’s original façade as well as updated the building to current safety, ADA, and construction standards. In 2005, the City decided to issue a request for proposals to organizations interested in partnering with the City in managing the Carnegie Center. This process resulted in the City entering into a
Oregon City, Parks and Recreation Master Plan Update 82
multi‐year management agreement with Fine Art Starts to operate the center. This management agreement nearly eliminates all city subsidies to the operation of the facility, while maintaining its use as a public community center with an art‐based focus. Pioneer Adult Community Center The Pioneer Adult Community Center is a multi‐purpose facility offering nutritional, educational, recreational, and social services to older adults in the community. It is a focal point nutrition site, which provides needed services to low income and homebound seniors, as well as provides opportunities to the elderly to maintain independent lifestyle. Nutrition Program The Pioneer Center provides nutrition service to those 60 and older and to disabled clients referred by Medicaid. The nutrition program includes both congregate (dining room) and home delivered meals (meals on wheels). The program provides approximately 28,000 meals a year to homebound clients. For Clackamas County, it is second only to the Milwaukie center in the number of home bound meals provided. Seniors who are more independent participate in the center’s lunchtime congregate meal program. We provide approximately 6,360 congregate meals on‐site annually. Transportation A door‐to‐door transportation system provides service to those 55 and older as well as younger disabled clients. Rides are provided for personal business, medical appointments, shopping, and to the center for classes, exercise, and activities. The center provides approximately 12,500 rides annually. Client Services Outreach and in‐house services are available for seniors and their families in need of information and referrals to other agencies. The center provides assistance completing applications requesting energy assistance, medication assistance, and county and federal services. The client services include approximately 10,000 served annually. This includes both on‐site (Pioneer Center) and home visits for homebound seniors who need nutritional assistance, are at risk, or need referrals to other services provided in the community. Activities and Recreation Programs Educational and recreational programs are provided by the Pioneer Center. Some are free of charge and others have a class fee to cover the expense of instructors and materials. Some programs are co‐sponsored with other community organizations. Also offered are day trips (2‐3 per month), dine out trips to local restaurants, ballroom dancing, games and exercise classes. The center also provides the community with space for meetings, church programs, fund raising events, support groups, and individual rentals. It serves approximately 32,000 participants annually through these programs and activities.
Oregon City, Parks and Recreation Master Plan Update 83
Oregon City Pool/Aquatics The Oregon City Municipal Swimming Pool was constructed in 1965 with the multi‐purpose room, kitchen, and offices added in the late 1970’s. The facility serves to provide the community with a wide variety of aquatic and recreational programming. The swimming pool provides basic, learn to swim instruction to roughly 3,000 Oregon City area school children each year through a partnership with the Oregon City School District. For many kids, this program provides the only structured swimming lesson instruction they will receive. In addition, the pool’s public swimming lesson program serves approximately 2,000 additional children annually. The swimming pool also offers water exercise classes, lap swim programs, and recreational swim times. Aqua Camp is a very popular summer program. The facility is also rented to the Oregon City Swim Team (a not‐for‐profit swim club) and play host to swim teams from Oregon City and Gladstone High Schools. Annual attendance for all programs totals approximately 90,000. The Oregon City Pool is an aging facility that continues to deteriorate over time. Much of the facility’s needed routine maintenance has been deferred, due to lack of budgeted capital improvement funding. While the facility is still operational, the costs of maintenance have become quite high. In addition, the size of the community has grown substantially since the swimming pool was first opened. A pool facility assessment was conducted as part of the Park and Recreation Master Plan Update. It is the opinion of the assessment team that the existing facility is basically sound. However, it is not without problems and is in need of specific improvements in order to meet code standards, serviceability requirements, and the long‐term recreational needs of Oregon City residents. If the facility repairs and improvements noted above are performed, the facility could serve the community well for another 30 years. Of course, ongoing maintenance, equipment repair, and in some cases replacements will be required over this time. The complete Oregon City Pool Assessment report can be found in Appendix II. Ermatinger House The Ermatinger House is the oldest existing house in Clackamas County, and one of the most historically significant. Originally sited on Main Street on the lower level, the house was among the historic homes from Oregon City’s earliest years which were relocated to save it from encroaching development around Willamette Falls. It was moved first in 1910 from Singer Hill to Center Street. In 1987 it was moved again, to its current location, where it was restored. The Ermatinger House is operated by the City, in cooperation through the efforts of dedicated volunteers. It is the desire of the Department to shift the management of the Ermatinger House to an organization that is better suited to manage and curate heritage and historical sites. Staff is continuing to explore these potential opportunities
Oregon City, Parks and Recreation Master Plan Update 84
Miscellaneous Sportcraft Landing Marina License Agreement The Department is responsible for negotiating and managing the long‐standing license agreement with Sportcraft Landing, Inc., a private for‐profit business operating a marina and related services on city‐owned or controlled waterfront property. A new license agreement was entered into in April 2007 between the City of Oregon City and Sportcraft. The new agreement is for five years with optional three‐year renewal periods. Significant improvements were made to the new agreement which increase the revenue received by the City and which enhance waterfront usage and aesthetics. Trail News City Newsletter The Department coordinates this important city publication. It doubles as a programs and services guide and a general city news and information publication. Over the past year, the layout and design of the Trail News has shifted from an in‐house publication to one utilizing the services of a professional graphic design contractor. This has vastly improved the quality of the publication.
Library Board and Parks and Recreation Advisory Committee The Department provides coordination and staff support to these two city boards and committees.
SWOT Analysis – Staff Interviews Strengths Although Oregon City’s recreation facilities are aging, staff does feel that the facilities have served the community fairly well. For example, the Department has made upgrades to some of the parks in recent years, such as playgrounds, restrooms, and landscaping. The staff has heard very positive feedback from the community in regard to the increase in level of service through these upgrades and maintenance efforts, much of which have been provided through partnerships and volunteer efforts. The Department also prides itself on providing strong youth aquatics programs and well‐attended senior programs. Oregon City Parks and Recreation has done very well to serve the community with the limited resources and staffing that it has available. The City has access to funding for park and facility development, but very limited funding for operations and maintenance. The accomplishments of the Department are largely due to the dedication and hard work of the staff to provide high quality programs and facilities.
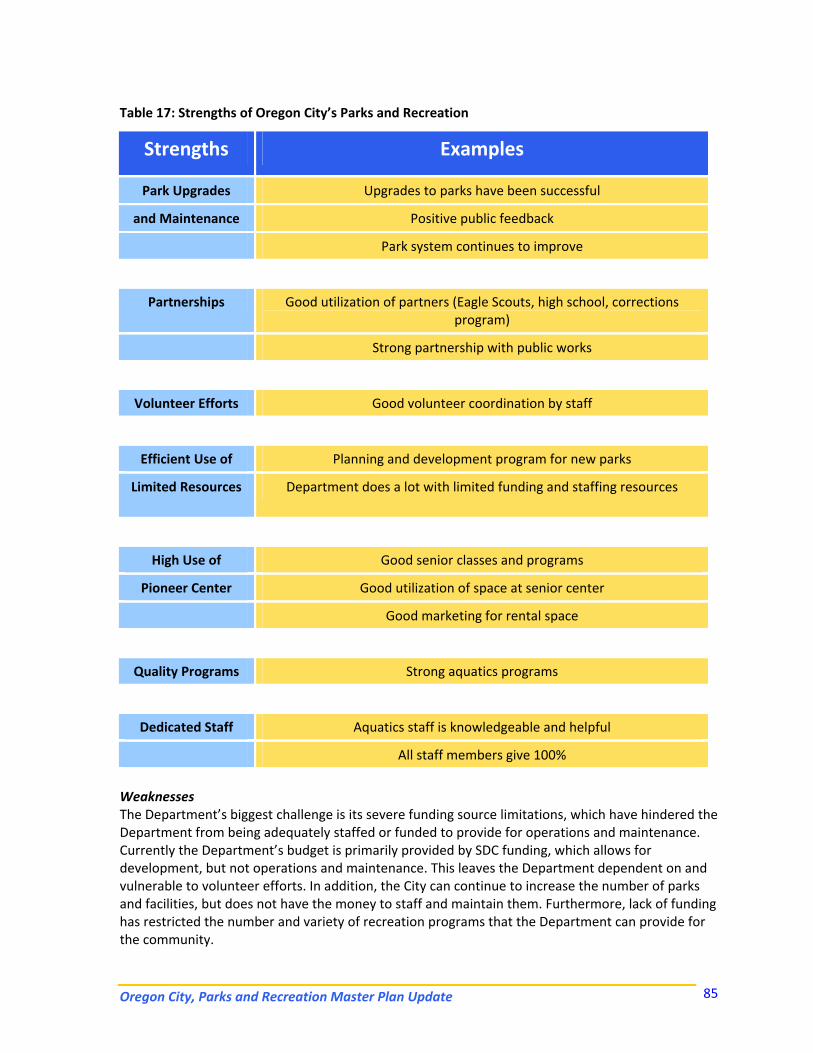
Oregon City, Parks and Recreation Master Plan Update 85
Table 17: Strengths of Oregon City’s Parks and Recreation
Strengths Examples
Park Upgrades Upgrades to parks have been successful
and Maintenance Positive public feedback
Park system continues to improve
Partnerships Good utilization of partners (Eagle Scouts, high school, corrections program)
Strong partnership with public works
Volunteer Efforts Good volunteer coordination by staff
Efficient Use of Planning and development program for new parks
Limited Resources Department does a lot with limited funding and staffing resources
High Use of Good senior classes and programs
Pioneer Center Good utilization of space at senior center
Good marketing for rental space
Quality Programs Strong aquatics programs
Dedicated Staff Aquatics staff is knowledgeable and helpful
All staff members give 100%
Weaknesses The Department’s biggest challenge is its severe funding source limitations, which have hindered the Department from being adequately staffed or funded to provide for operations and maintenance. Currently the Department’s budget is primarily provided by SDC funding, which allows for development, but not operations and maintenance. This leaves the Department dependent on and vulnerable to volunteer efforts. In addition, the City can continue to increase the number of parks and facilities, but does not have the money to staff and maintain them. Furthermore, lack of funding has restricted the number and variety of recreation programs that the Department can provide for the community.
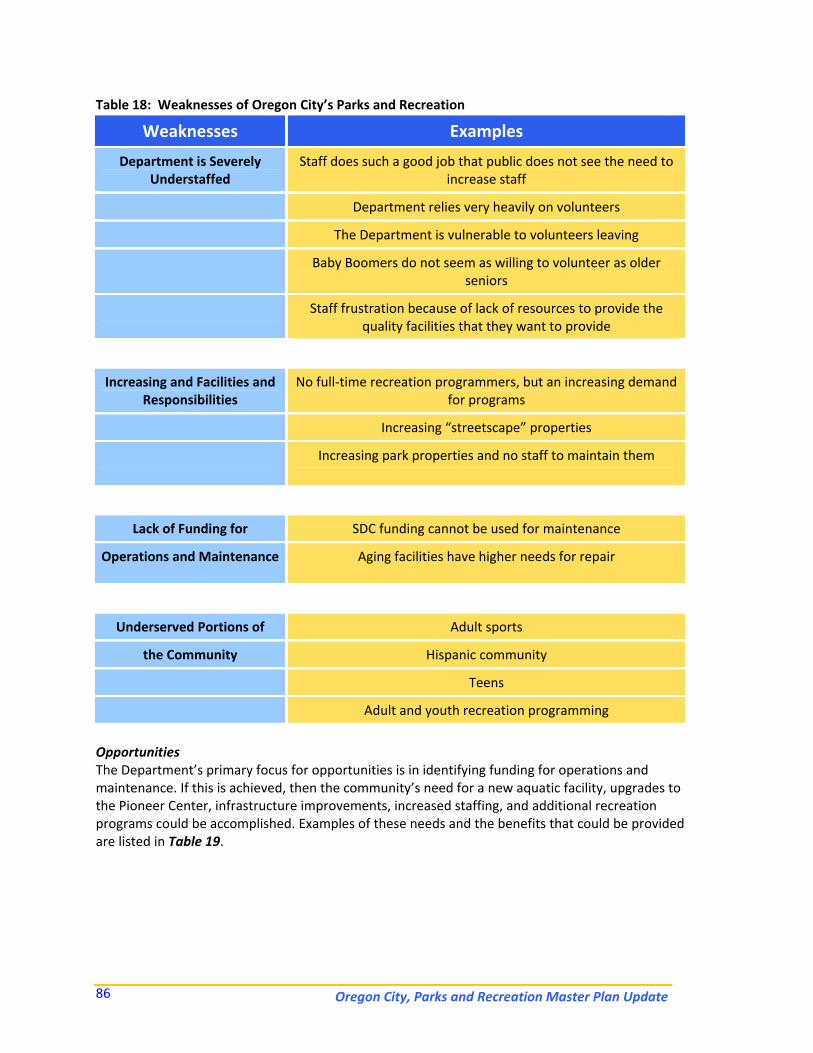
Oregon City, Parks and Recreation Master Plan Update 86
Table 18: Weaknesses of Oregon City’s Parks and Recreation
Weaknesses Examples
Department is Severely Understaffed
Staff does such a good job that public does not see the need to increase staff
Department relies very heavily on volunteers
The Department is vulnerable to volunteers leaving
Baby Boomers do not seem as willing to volunteer as older seniors
Staff frustration because of lack of resources to provide the quality facilities that they want to provide
Increasing and Facilities and Responsibilities
No full‐time recreation programmers, but an increasing demand for programs
Increasing “streetscape” properties
Increasing park properties and no staff to maintain them
Lack of Funding for SDC funding cannot be used for maintenance
Operations and Maintenance Aging facilities have higher needs for repair
Underserved Portions of Adult sports
the Community Hispanic community
Teens
Adult and youth recreation programming
Opportunities The Department’s primary focus for opportunities is in identifying funding for operations and maintenance. If this is achieved, then the community’s need for a new aquatic facility, upgrades to the Pioneer Center, infrastructure improvements, increased staffing, and additional recreation programs could be accomplished. Examples of these needs and the benefits that could be provided are listed in Table 19.
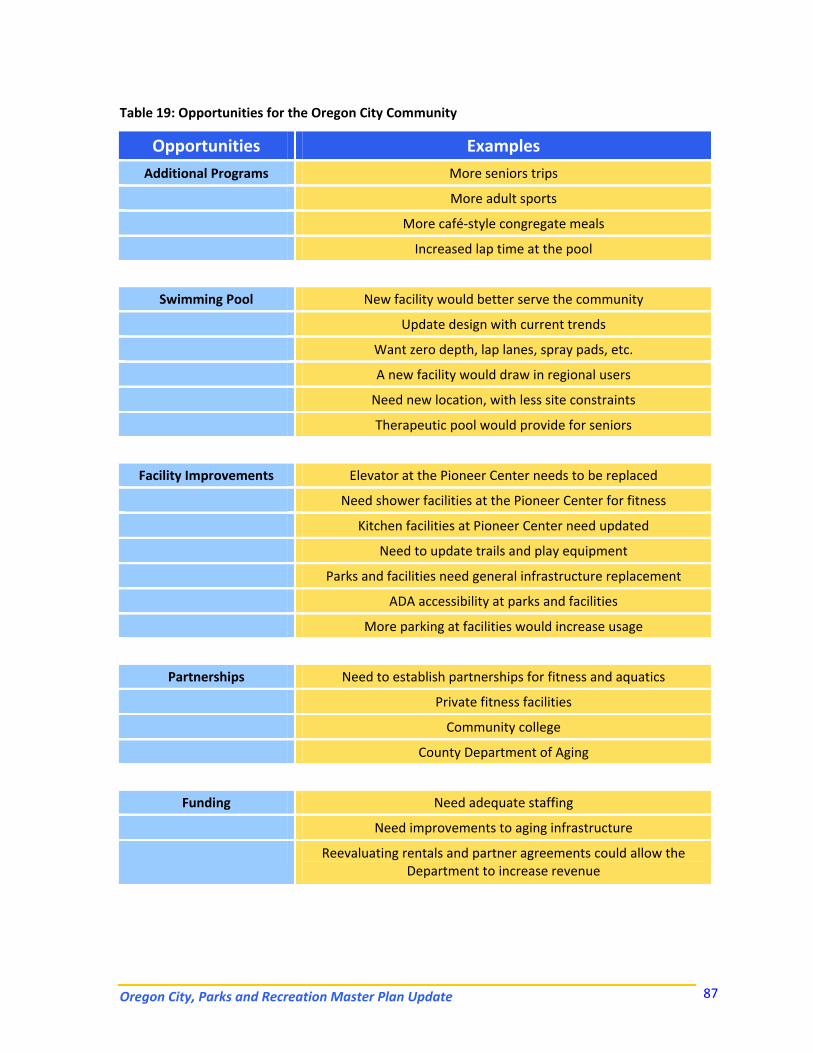
Oregon City, Parks and Recreation Master Plan Update 87
Table 19: Opportunities for the Oregon City Community
Opportunities Examples Additional Programs More seniors trips
More adult sports
More café‐style congregate meals
Increased lap time at the pool
Swimming Pool New facility would better serve the community
Update design with current trends
Want zero depth, lap lanes, spray pads, etc.
A new facility would draw in regional users
Need new location, with less site constraints
Therapeutic pool would provide for seniors
Facility Improvements Elevator at the Pioneer Center needs to be replaced
Need shower facilities at the Pioneer Center for fitness
Kitchen facilities at Pioneer Center need updated
Need to update trails and play equipment
Parks and facilities need general infrastructure replacement
ADA accessibility at parks and facilities
More parking at facilities would increase usage
Partnerships Need to establish partnerships for fitness and aquatics
Private fitness facilities
Community college
County Department of Aging
Funding Need adequate staffing
Need improvements to aging infrastructure
Reevaluating rentals and partner agreements could allow the Department to increase revenue
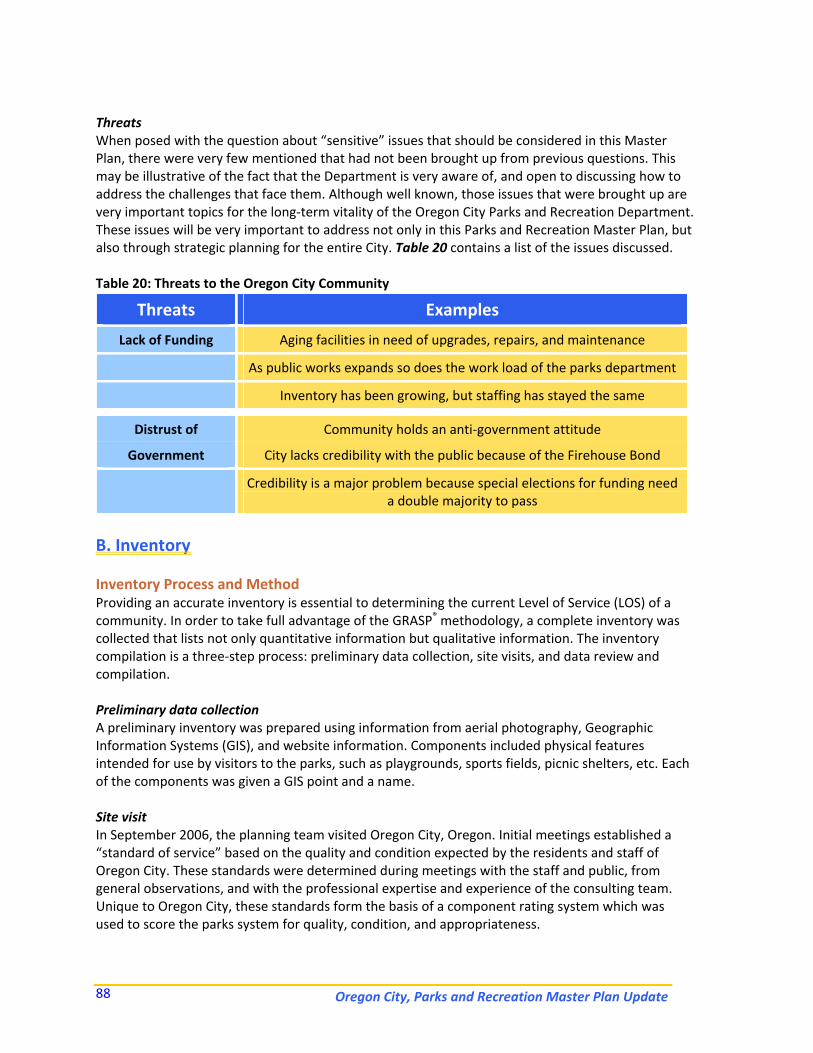
Oregon City, Parks and Recreation Master Plan Update 88
Threats When posed with the question about “sensitive” issues that should be considered in this Master Plan, there were very few mentioned that had not been brought up from previous questions. This may be illustrative of the fact that the Department is very aware of, and open to discussing how to address the challenges that face them. Although well known, those issues that were brought up are very important topics for the long‐term vitality of the Oregon City Parks and Recreation Department. These issues will be very important to address not only in this Parks and Recreation Master Plan, but also through strategic planning for the entire City. Table 20 contains a list of the issues discussed. Table 20: Threats to the Oregon City Community
Threats Examples
Lack of Funding Aging facilities in need of upgrades, repairs, and maintenance
As public works expands so does the work load of the parks department
Inventory has been growing, but staffing has stayed the same
Distrust of Community holds an anti‐government attitude
Government City lacks credibility with the public because of the Firehouse Bond
Credibility is a major problem because special elections for funding need a double majority to pass
B. Inventory Inventory Process and Method Providing an accurate inventory is essential to determining the current Level of Service (LOS) of a community. In order to take full advantage of the GRASP® methodology, a complete inventory was collected that lists not only quantitative information but qualitative information. The inventory compilation is a three‐step process: preliminary data collection, site visits, and data review and compilation. Preliminary data collection A preliminary inventory was prepared using information from aerial photography, Geographic Information Systems (GIS), and website information. Components included physical features intended for use by visitors to the parks, such as playgrounds, sports fields, picnic shelters, etc. Each of the components was given a GIS point and a name. Site visit In September 2006, the planning team visited Oregon City, Oregon. Initial meetings established a “standard of service” based on the quality and condition expected by the residents and staff of Oregon City. These standards were determined during meetings with the staff and public, from general observations, and with the professional expertise and experience of the consulting team. Unique to Oregon City, these standards form the basis of a component rating system which was used to score the parks system for quality, condition, and appropriateness.
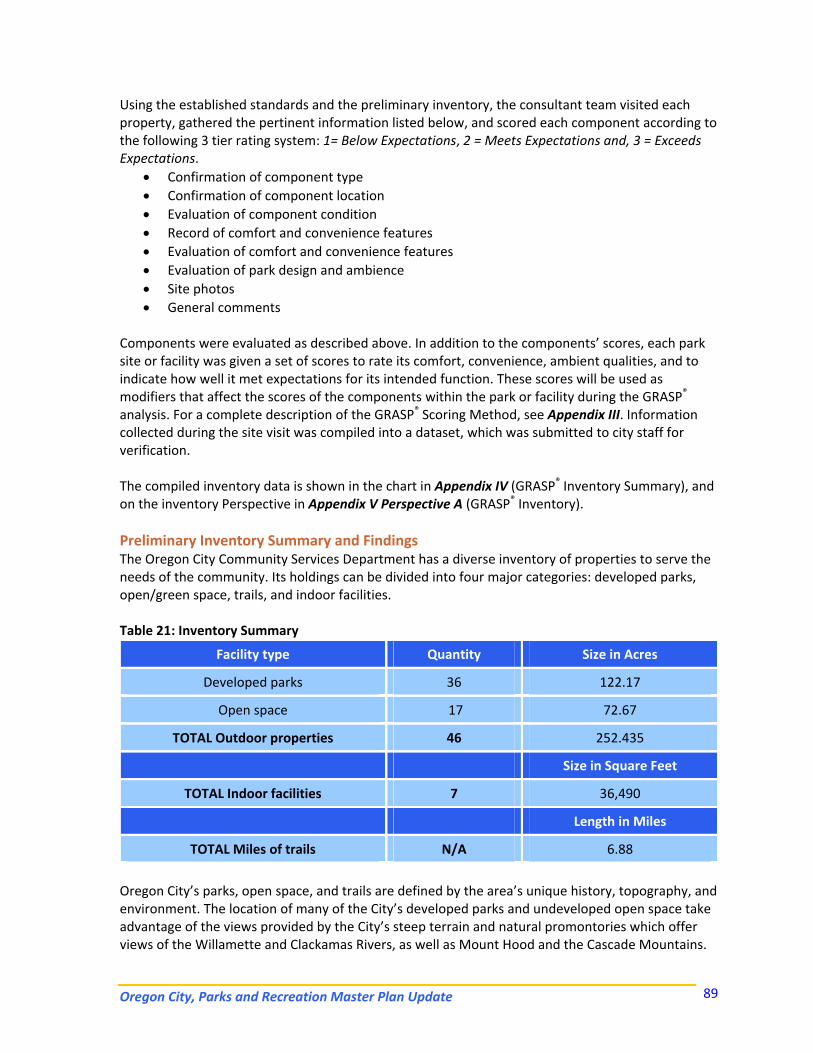
Oregon City, Parks and Recreation Master Plan Update 89
Using the established standards and the preliminary inventory, the consultant team visited each property, gathered the pertinent information listed below, and scored each component according to the following 3 tier rating system: 1= Below Expectations, 2 = Meets Expectations and, 3 = Exceeds Expectations.
• Confirmation of component type • Confirmation of component location • Evaluation of component condition • Record of comfort and convenience features • Evaluation of comfort and convenience features • Evaluation of park design and ambience • Site photos • General comments
Components were evaluated as described above. In addition to the components’ scores, each park site or facility was given a set of scores to rate its comfort, convenience, ambient qualities, and to indicate how well it met expectations for its intended function. These scores will be used as modifiers that affect the scores of the components within the park or facility during the GRASP® analysis. For a complete description of the GRASP® Scoring Method, see Appendix III. Information collected during the site visit was compiled into a dataset, which was submitted to city staff for verification. The compiled inventory data is shown in the chart in Appendix IV (GRASP® Inventory Summary), and on the inventory Perspective in Appendix V Perspective A (GRASP® Inventory). Preliminary Inventory Summary and Findings The Oregon City Community Services Department has a diverse inventory of properties to serve the needs of the community. Its holdings can be divided into four major categories: developed parks, open/green space, trails, and indoor facilities. Table 21: Inventory Summary
Facility type Quantity Size in Acres
Developed parks 36 122.17
Open space 17 72.67
TOTAL Outdoor properties 46 252.435
Size in Square Feet
TOTAL Indoor facilities 7 36,490
Length in Miles
TOTAL Miles of trails N/A 6.88
Oregon City’s parks, open space, and trails are defined by the area’s unique history, topography, and environment. The location of many of the City’s developed parks and undeveloped open space take advantage of the views provided by the City’s steep terrain and natural promontories which offer views of the Willamette and Clackamas Rivers, as well as Mount Hood and the Cascade Mountains.
Oregon City, Parks and Recreation Master Plan Update 90
Developed Parks Developed parks in Oregon City are located throughout the City and can be roughly divided into three major areas: river and bluff parks, historic downtown parks, and outlying suburban parks. Parks located along the Willamette River or bluffs include Clackamette Park, Jon Storm Park, McLoughlin Promenade, and Sportcraft Landing. These four parks are connected by trails and are extremely popular with the community. They afford some of the more impressive views of the river and provide access to the water for a variety of recreational activities, including fishing and boating. These parks are well maintained and are highly valued by the City and community. Parks located in the historic downtown area fall into two categories:
1) Parks associated with historic sites or recreational facilities, and 2) Small neighborhood parks.
Oregon City has a wealth of historic properties and has worked to preserve these properties as public facilities operated for social, educational, and/or recreational use. These properties include The End of the Oregon Trail Interpretive Center, McLoughlin House National Historic Site (operated by the National Parks Service), Barclay House, Buena Vista Club House, Ermatinger House, Carnegie Center, and Pioneer Community Center. These facilities are maintained and/or preserved and provide valued services to the community. Some such as The End of the Oregon Trail Interpretive Center and McLoughlin House National Historic Site provide value as tourism destinations. An aquatic center also exists in the downtown area, however this facility is old and in poor condition. The possibility of a new pool facility and location is currently under review. Small neighborhood parks scattered throughout the historic downtown area provide valuable green space and often boast beautiful mature trees, which provide the parks with a generous shade canopy. However, older buildings, site furnishings, and shelters, in addition to a below average level of maintenance in these parks, leaves ample room for renovation and improvement. Outlying suburban parks are primarily neighborhood parks with similar amenities focused primarily on passive recreation, such as a picnic shelters, playgrounds, and open turf fields. The exception is Chapin Park and the recently opened Wesley Lynn Park, which has a community‐wide draw and a center for the City’s active recreation and sport facilities. Properties unique to Oregon City’s developed parks include Pioneer Center (a community senior center), the historic Carnegie Library (also serving as a community art center), and Mountain View Cemetery. The City also has built unique relationships to ensure the safety, maintenance, and economic sustainability of its parks by creating cooperative relationships between city, non‐profits, and private individuals. The End of the Oregon Trail Interpretive Center and the Park Host Program are prime examples. Special amenities unique to Oregon City’s park system include river access, scenic views, and an RV Park. Open Space According to The Oregon City Park and Recreation Master Plan (1999), Oregon City has a total of about 38 acres of open space in 4 sites: Old Canemah Park, River Access trail, Singer Creek Park, and Waterboard Park. Centrally located with trail access and connections, these parcels are undeveloped and provide habitat protection, historic and cultural preservation, and the protection of scenic views.
Oregon City, Parks and Recreation Master Plan Update 91
Further analysis of the park, recreation, open space, and trail inventory is discussed in the GRASP® Level of Service section that follows.
C. The GRASP® Level of Service Analysis During the planning process, several methods were employed to analyze the current facilities in relationship to the needs of the community. This relationship is often referred to as Level of Service (or LOS) and each methods used in this analysis provides a different look at the community and addresses various aspects of the system. These tools allow for analysis of the inventory, location, distribution, and access to the parks and recreation. When the results of each analysis are combined, a full view of the system and the LOS that is provided to each resident is created, on which recommendations can be formed. NRPA Standards Level of Service (LOS) is typically defined in parks and recreation master plans as the capacity of system components and facilities to meet the needs of the public. The traditional means of measuring Levels of Service (LOS), often called the NRPA (National Recreation and Parks Association) Standards method, was typically based on providing X number of facilities or acres per 1,000 person population (or “capacity”). This methodology was developed in the 1970’s and 80’s and is not accurate for the majority of public agencies. Even NRPA officials are now calling this standards methodology “obsolete.” It has been, however, used extensively, and therefore we provide these historic comparisons for population based components as part of this plan. See Level of Service Capacities in the following section for this analysis. In order to find a way to standardize LOS that is accurate, implemental, and can be benchmarked, this plan includes an enhanced approach using the Geo‐Referenced Amenities Standards Process (GRASP®). This methodology builds on traditional community standards based on capacity, but can track not only the quantity, but also quality and distribution of amenities and components of a group of components. GRASP® technology applies to individual components, such as basketball courts, as well as to overall facilities, such as neighborhood and community parks. It replaces the traditional classification of parks with a classification of the individual components within parks and open space according to their functions to create a component based system. By thinking of the components within the parks, trails, and recreational facility system as an integrated whole that provides a service to residents, it is possible to measure and quantify the net Level of Service provided. Process As mentioned in the description of the inventory process, each of the various components found within the community was evaluated for its quality and condition. The geographic location of the component was also recorded. Capacity also is part of the LOS analysis, due to the fact that the quantity of each component is also recorded. GRASP® uses comfort, convenience, and ambience as characteristics that are part of the context and setting of a component. These comfort and convenience features are items such as drinking
Oregon City, Parks and Recreation Master Plan Update 92
fountains, seating, and shade. They are not characteristics of the component itself, but when they exist in proximity to a component they enhance the value of the component. By combining and analyzing the value of each component with the comfort and convenience features, it is possible to measure the service provided by the entire park system from a variety of perspectives and for any given location. This was done for Oregon City, and the results are presented in a series of perspectives and tables that make up the GRASP® analysis of the study area. GRASP® Level of Service shows how well the community is served by the relevant components by evaluating individual park GRASP® scores, using perspectives to graphically display the GRASP® scores, and with a quantified measurement spreadsheet (as presented in the LOS Capacities Figure at the end of the following section. This quantification system provides a benchmark against which a community can determine how it is doing in providing services in relation to the community’s goals, presently and over time. The GRASP® enabled dataset is “living” digital data. Oregon City is encouraged to maintain and update this valuable resource, so that further analyses may be performed to measure progress in maintaining and enhancing levels of service for the community. GRASP® Perspectives After all relevant components have been inventoried, analysis maps, called “perspectives,” are created to graphically depict analysis of several variations and composites of key issues and components. For each perspective, each inventoried component is assigned a service radius. This is the distance from which getting to the component can be accomplished within a reasonable time frame. When the service areas for multiple components are plotted on a perspective, a picture emerges that represents the cumulative service provided by that set of components upon the geographic area. Where service areas for multiple components overlap, a darker shade results from the overlap. Darker shades indicate locations that are “served” by more components. The shades all have numeric values associated with them, which means that for any given location on a GRASP® perspective, there is a numeric GRASP® Level of Service score for that location and that particular set of components. The perspectives can be used to determine levels of service throughout the community from a variety of analysis standpoints. These perspectives can show a specific set of components, depict estimated travel time to services, highlight a particular geographic area, or display facilities that accommodate specific programming. In the completed perspectives, it is not necessary for all parts of the community to score equally in the analyses. The desired level of service for any particular location will depend on the type of service being analyzed, and the characteristics of the particular location. Commercial and industrial areas might reasonably be expected to have lower levels of service for parks and recreation opportunities than residential areas. Levels of service for retail services in high‐density residential areas might be different from those for lower‐density areas. The perspectives can be used to determine if current levels of service are appropriate in any given location, and whether or not that level of service is appropriate to continue. If so, then plans can be developed that provide similar levels of service to new neighborhoods. Conversely, if it is
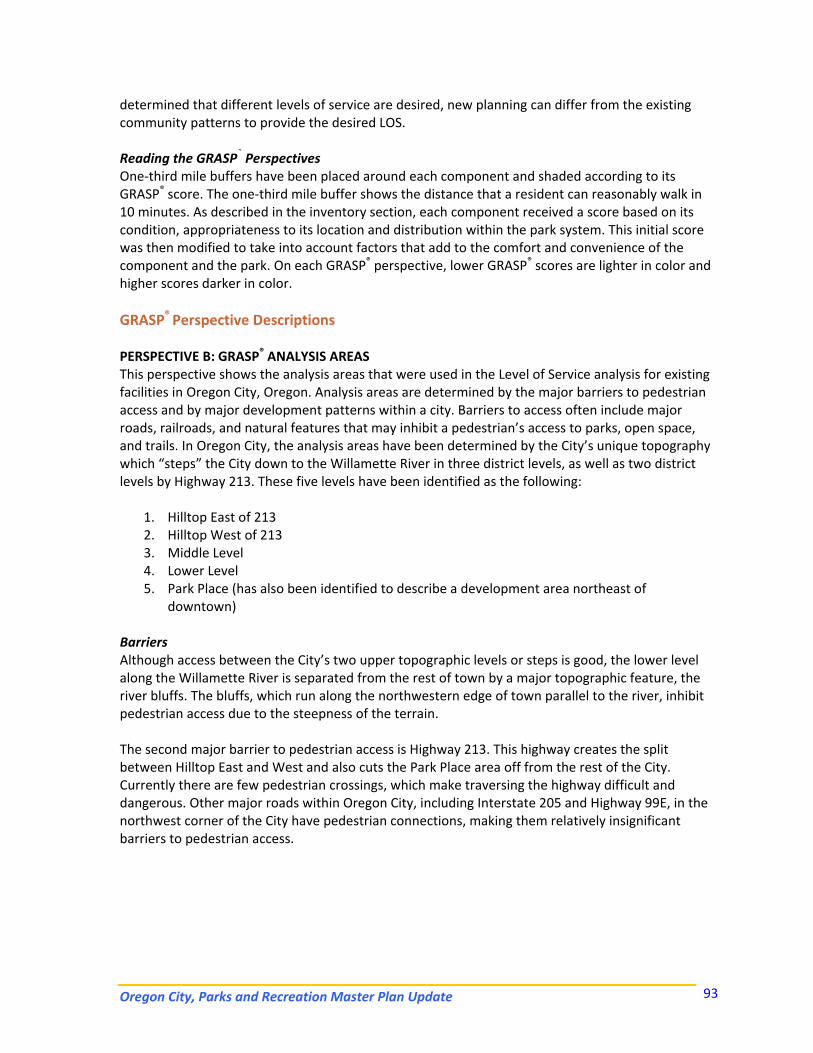
Oregon City, Parks and Recreation Master Plan Update 93
determined that different levels of service are desired, new planning can differ from the existing community patterns to provide the desired LOS. Reading the GRASP® Perspectives One‐third mile buffers have been placed around each component and shaded according to its GRASP® score. The one‐third mile buffer shows the distance that a resident can reasonably walk in 10 minutes. As described in the inventory section, each component received a score based on its condition, appropriateness to its location and distribution within the park system. This initial score was then modified to take into account factors that add to the comfort and convenience of the component and the park. On each GRASP® perspective, lower GRASP® scores are lighter in color and higher scores darker in color. GRASP® Perspective Descriptions PERSPECTIVE B: GRASP® ANALYSIS AREAS This perspective shows the analysis areas that were used in the Level of Service analysis for existing facilities in Oregon City, Oregon. Analysis areas are determined by the major barriers to pedestrian access and by major development patterns within a city. Barriers to access often include major roads, railroads, and natural features that may inhibit a pedestrian’s access to parks, open space, and trails. In Oregon City, the analysis areas have been determined by the City’s unique topography which “steps” the City down to the Willamette River in three district levels, as well as two district levels by Highway 213. These five levels have been identified as the following:
1. Hilltop East of 213 2. Hilltop West of 213 3. Middle Level 4. Lower Level 5. Park Place (has also been identified to describe a development area northeast of
downtown) Barriers Although access between the City’s two upper topographic levels or steps is good, the lower level along the Willamette River is separated from the rest of town by a major topographic feature, the river bluffs. The bluffs, which run along the northwestern edge of town parallel to the river, inhibit pedestrian access due to the steepness of the terrain. The second major barrier to pedestrian access is Highway 213. This highway creates the split between Hilltop East and West and also cuts the Park Place area off from the rest of the City. Currently there are few pedestrian crossings, which make traversing the highway difficult and dangerous. Other major roads within Oregon City, including Interstate 205 and Highway 99E, in the northwest corner of the City have pedestrian connections, making them relatively insignificant barriers to pedestrian access.
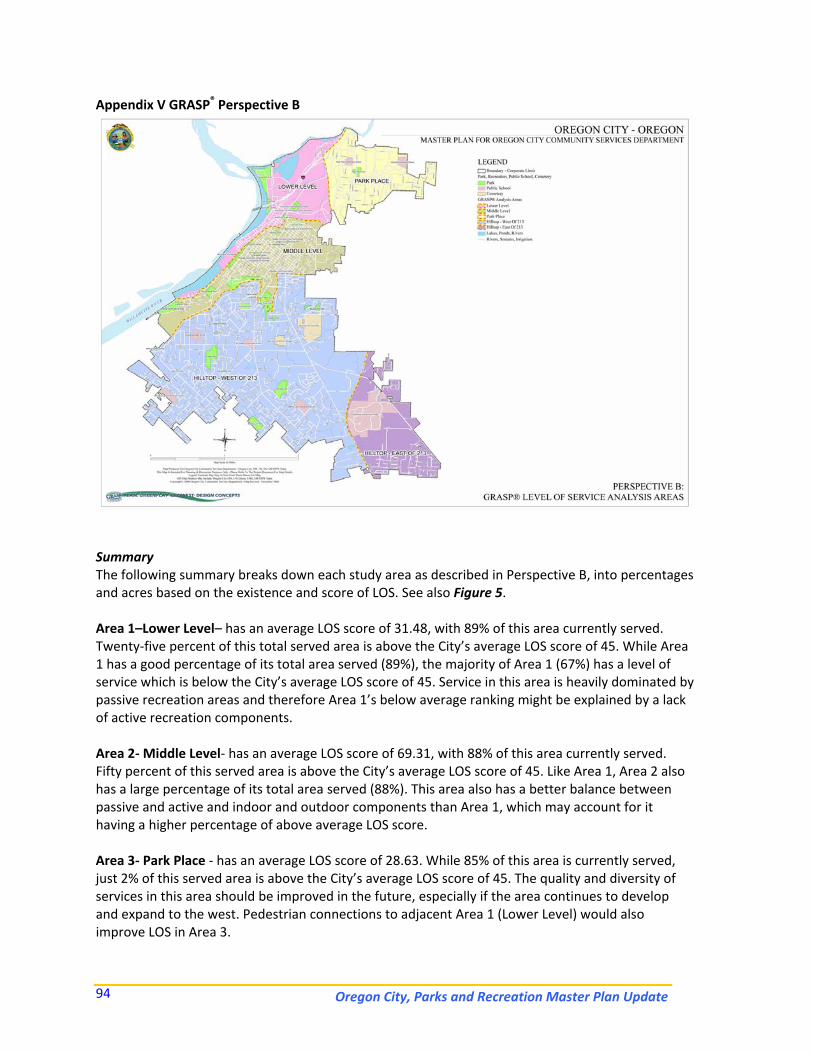
Oregon City, Parks and Recreation Master Plan Update 94
Appendix V GRASP® Perspective B
Summary The following summary breaks down each study area as described in Perspective B, into percentages and acres based on the existence and score of LOS. See also Figure 5. Area 1–Lower Level– has an average LOS score of 31.48, with 89% of this area currently served. Twenty‐five percent of this total served area is above the City’s average LOS score of 45. While Area 1 has a good percentage of its total area served (89%), the majority of Area 1 (67%) has a level of service which is below the City’s average LOS score of 45. Service in this area is heavily dominated by passive recreation areas and therefore Area 1’s below average ranking might be explained by a lack of active recreation components. Area 2‐ Middle Level‐ has an average LOS score of 69.31, with 88% of this area currently served. Fifty percent of this served area is above the City’s average LOS score of 45. Like Area 1, Area 2 also has a large percentage of its total area served (88%). This area also has a better balance between passive and active and indoor and outdoor components than Area 1, which may account for it having a higher percentage of above average LOS score. Area 3‐ Park Place ‐ has an average LOS score of 28.63. While 85% of this area is currently served, just 2% of this served area is above the City’s average LOS score of 45. The quality and diversity of services in this area should be improved in the future, especially if the area continues to develop and expand to the west. Pedestrian connections to adjacent Area 1 (Lower Level) would also improve LOS in Area 3.
Oregon City, Parks and Recreation Master Plan Update 95
Area 4‐ Hilltop West of 213 ‐ has an average LOS score of 49.42, with 90% of this area currently served. Thirty‐eight percent of this served area is above the City’s average LOS score of 45. This area represents the largest percentage of the City’s acreage and maintains an above average LOS score for all but 10% of its total area. This area is well served for its size, but improvements might be made in order to distribute services more equitably. Area 5‐ Hilltop East of 213 ‐ has an average LOS score of 18.63, with 67% of this area currently served. Zero percent of this served area is above the City’s average LOS score of 45. This Area’s low average LOS score may be remedied by increasing recreation amenities in this area. Increasing amenities on the border between Area 4 and 5 and providing better pedestrian connectivity over Highway 213 would serve to improve the total distribution of services and LOS for both areas.
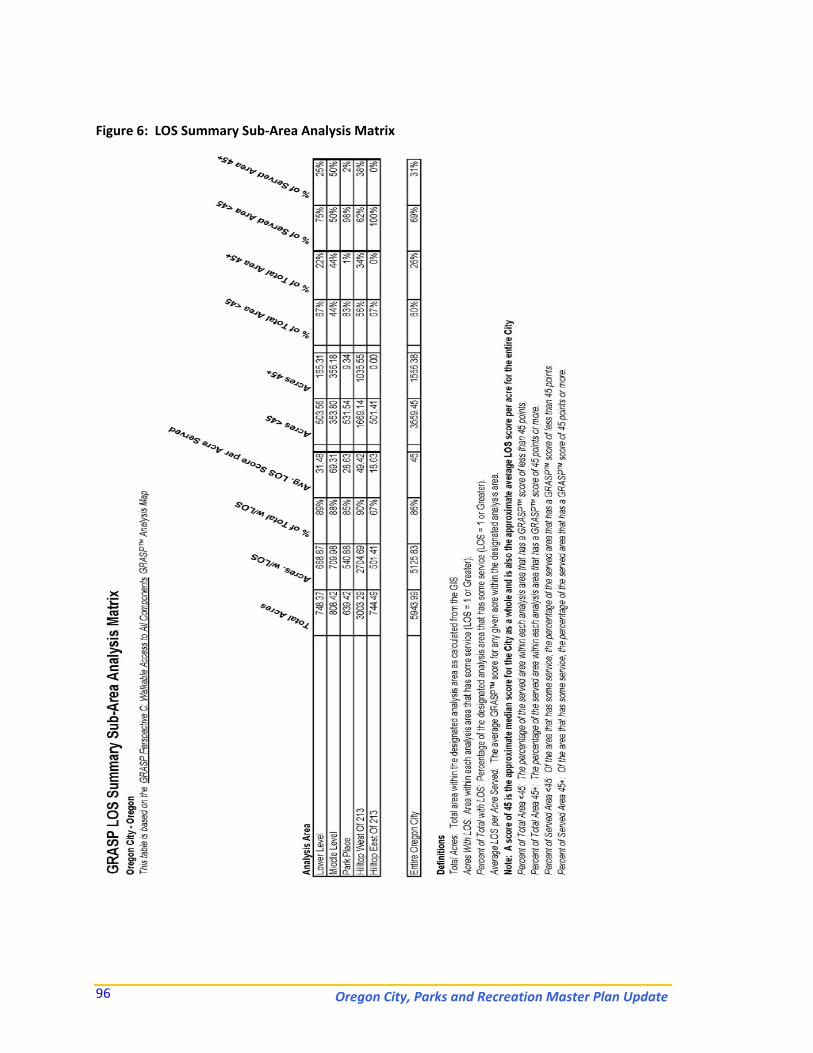
Oregon City, Parks and Recreation Master Plan Update 96
Figure 6: LOS Summary Sub‐Area Analysis Matrix
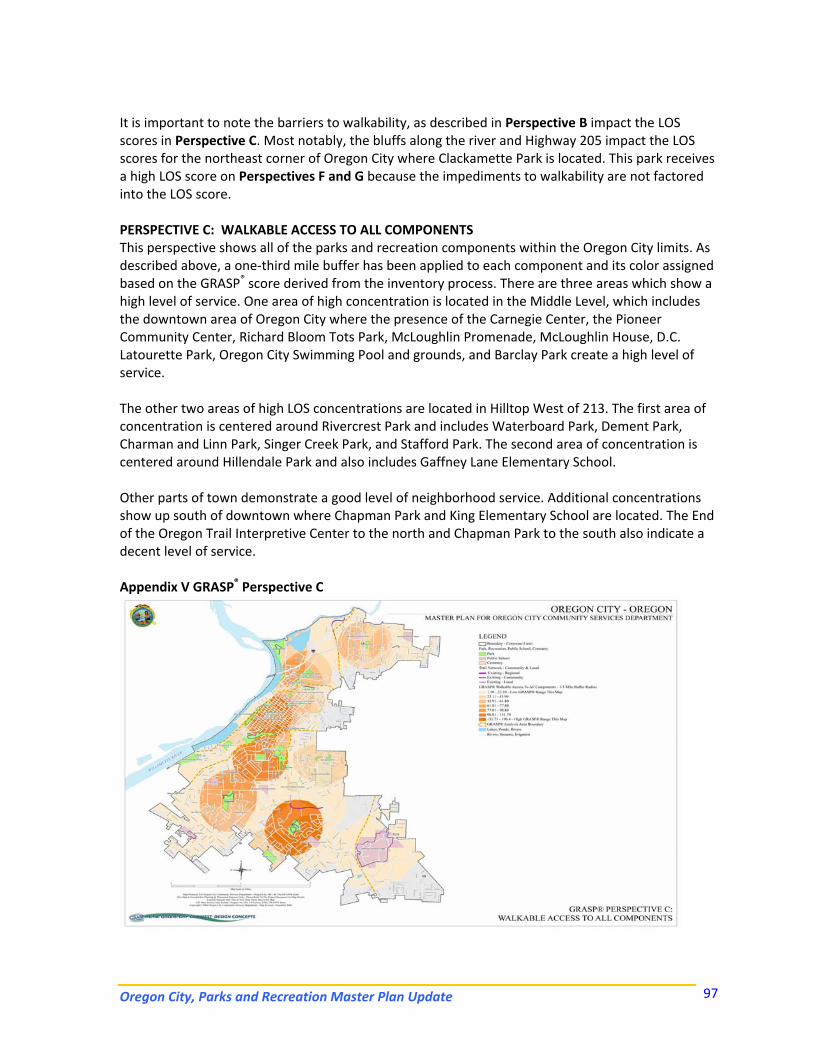
Oregon City, Parks and Recreation Master Plan Update 97
It is important to note the barriers to walkability, as described in Perspective B impact the LOS scores in Perspective C. Most notably, the bluffs along the river and Highway 205 impact the LOS scores for the northeast corner of Oregon City where Clackamette Park is located. This park receives a high LOS score on Perspectives F and G because the impediments to walkability are not factored into the LOS score. PERSPECTIVE C: WALKABLE ACCESS TO ALL COMPONENTS This perspective shows all of the parks and recreation components within the Oregon City limits. As described above, a one‐third mile buffer has been applied to each component and its color assigned based on the GRASP® score derived from the inventory process. There are three areas which show a high level of service. One area of high concentration is located in the Middle Level, which includes the downtown area of Oregon City where the presence of the Carnegie Center, the Pioneer Community Center, Richard Bloom Tots Park, McLoughlin Promenade, McLoughlin House, D.C. Latourette Park, Oregon City Swimming Pool and grounds, and Barclay Park create a high level of service. The other two areas of high LOS concentrations are located in Hilltop West of 213. The first area of concentration is centered around Rivercrest Park and includes Waterboard Park, Dement Park, Charman and Linn Park, Singer Creek Park, and Stafford Park. The second area of concentration is centered around Hillendale Park and also includes Gaffney Lane Elementary School. Other parts of town demonstrate a good level of neighborhood service. Additional concentrations show up south of downtown where Chapman Park and King Elementary School are located. The End of the Oregon Trail Interpretive Center to the north and Chapman Park to the south also indicate a decent level of service. Appendix V GRASP® Perspective C
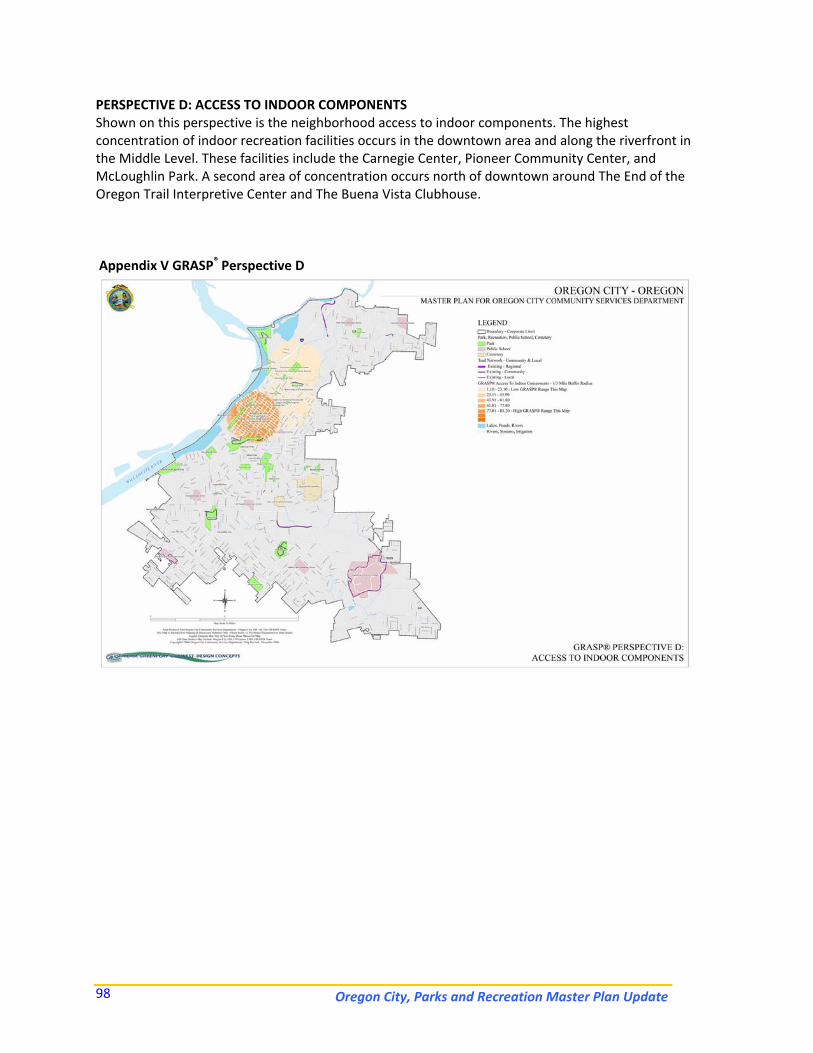
Oregon City, Parks and Recreation Master Plan Update 98
PERSPECTIVE D: ACCESS TO INDOOR COMPONENTS Shown on this perspective is the neighborhood access to indoor components. The highest concentration of indoor recreation facilities occurs in the downtown area and along the riverfront in the Middle Level. These facilities include the Carnegie Center, Pioneer Community Center, and McLoughlin Park. A second area of concentration occurs north of downtown around The End of the Oregon Trail Interpretive Center and The Buena Vista Clubhouse. Appendix V GRASP® Perspective D
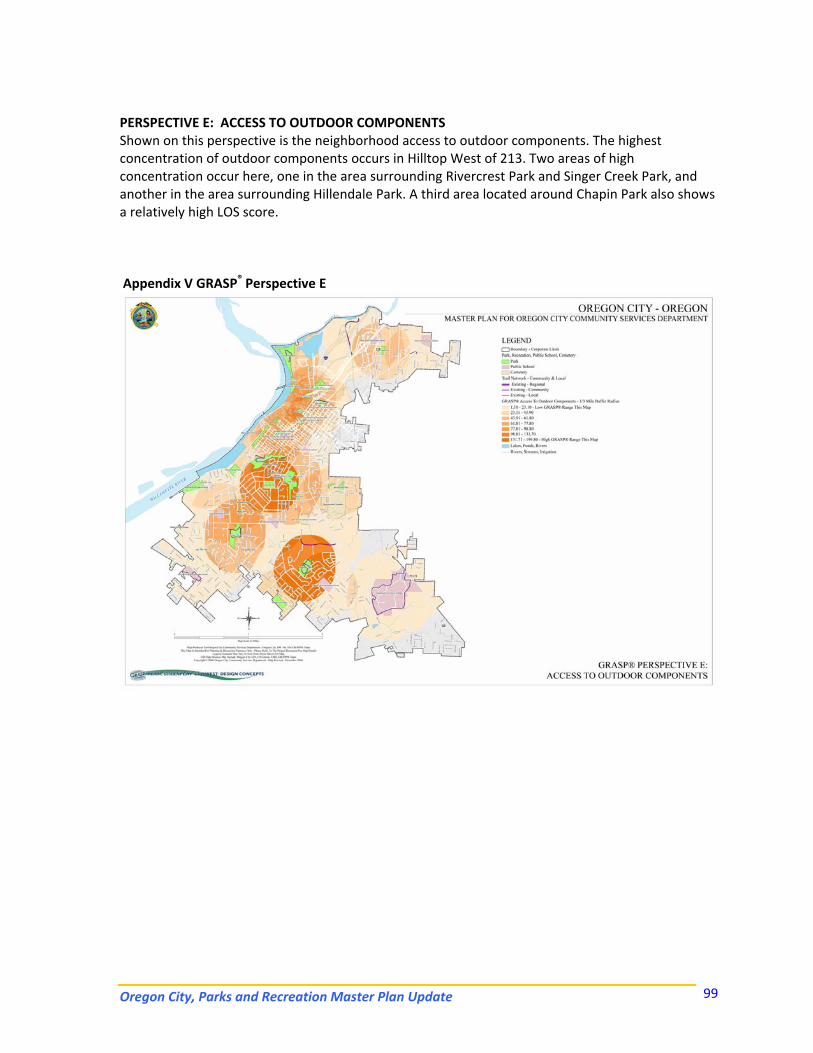
Oregon City, Parks and Recreation Master Plan Update 99
PERSPECTIVE E: ACCESS TO OUTDOOR COMPONENTS Shown on this perspective is the neighborhood access to outdoor components. The highest concentration of outdoor components occurs in Hilltop West of 213. Two areas of high concentration occur here, one in the area surrounding Rivercrest Park and Singer Creek Park, and another in the area surrounding Hillendale Park. A third area located around Chapin Park also shows a relatively high LOS score. Appendix V GRASP® Perspective E
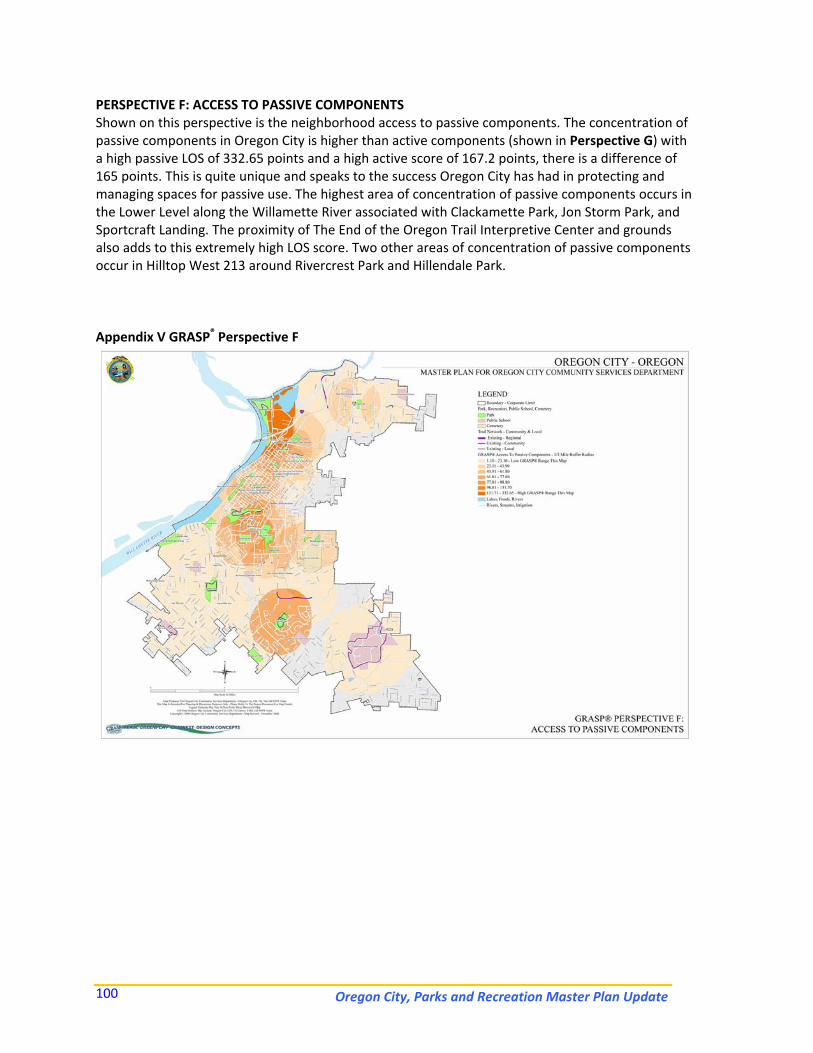
Oregon City, Parks and Recreation Master Plan Update 100
PERSPECTIVE F: ACCESS TO PASSIVE COMPONENTS Shown on this perspective is the neighborhood access to passive components. The concentration of passive components in Oregon City is higher than active components (shown in Perspective G) with a high passive LOS of 332.65 points and a high active score of 167.2 points, there is a difference of 165 points. This is quite unique and speaks to the success Oregon City has had in protecting and managing spaces for passive use. The highest area of concentration of passive components occurs in the Lower Level along the Willamette River associated with Clackamette Park, Jon Storm Park, and Sportcraft Landing. The proximity of The End of the Oregon Trail Interpretive Center and grounds also adds to this extremely high LOS score. Two other areas of concentration of passive components occur in Hilltop West 213 around Rivercrest Park and Hillendale Park. Appendix V GRASP® Perspective F
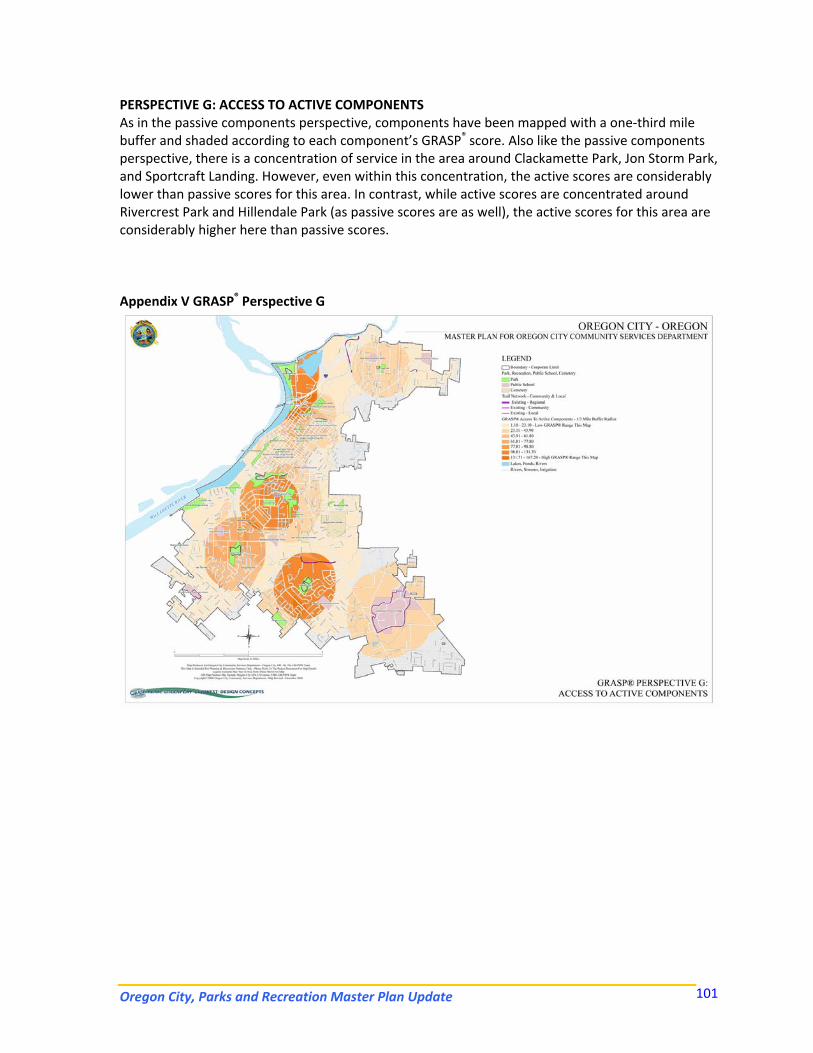
Oregon City, Parks and Recreation Master Plan Update 101
PERSPECTIVE G: ACCESS TO ACTIVE COMPONENTS As in the passive components perspective, components have been mapped with a one‐third mile buffer and shaded according to each component’s GRASP® score. Also like the passive components perspective, there is a concentration of service in the area around Clackamette Park, Jon Storm Park, and Sportcraft Landing. However, even within this concentration, the active scores are considerably lower than passive scores for this area. In contrast, while active scores are concentrated around Rivercrest Park and Hillendale Park (as passive scores are as well), the active scores for this area are considerably higher here than passive scores. Appendix V GRASP® Perspective G

Oregon City, Parks and Recreation Master Plan Update 102
Oregon City, Parks and Recreation Master Plan Update 103
D. Level of Service Capacity The analysis mapping shown in the previous section gives a good picture of the overall LOS for the community. It also shows component distribution and areas of service concentration. In addition, it is also helpful to take a detailed look at the variety and capacity of the components in the system. This is especially true for things like programmed athletic fields, and group picnic shelters, where having an adequate supply of facilities is more important than the location or distribution of those facilities. The quantity of some components is dictated by the ability of the component to provide service to the amount of the population that will be using the facility. For some components this is a fairly easy calculation because the components are programmed for use. The programming determines how many people will be using the facilities over a period of time. For example, sports fields and courts fall into this category. One set of numbers that is typically referred to in a capacity analysis is the “NRPA standards.” In conducting planning work, it is key to realize that these standards can be valuable when referenced as “norms” for capacity, but not necessarily as the target standards for which a community should strive as communities can differ greatly in need and desire for recreation facilities. Capacity standards are utilized in this plan as a tool to address Level of Service Target Standards, established in the analysis phase of the planning process. In the presentation of the findings section of the plan, only the current Capacity LOS is discussed. The following spreadsheet represents the Capacity LOS for Oregon City. This sheet more closely resembles a traditional LOS analysis and shows how the quantities of certain park and recreation components compare to population. For each component, the spreadsheet shows the current quantity of that component on a “per‐1000 persons” basis (referred to as the Capacity LOS) and the pro‐rata number of persons in the community represented by each component. This kind of analysis can be used to show the capacity of the current inventory. In other words, it can show how many people are potentially being served by park components. These figures are provided for city‐owned facilities, schools, and other providers (such as the county and HOA) for the total of all facilities from all providers. In this case the LOS has been calculated twice, once using the facilities provided by all providers and secondly using only the City inventory. In comparing the LOS of city‐owned facilities to that of all providers, the City can understand how much of the LOS being provided to the residents is within their control. Aside from measuring what is currently provided to the residents of Oregon City, the spreadsheet in Figure 6 is also set up to project the number of facilities that will need to be added to maintain the current ratios to accommodate population growth. The spreadsheets show the total numbers of facilities the City can expect to have for the growing population, as well as the number of new facilities that will be needed to provide a continued LOS to the community. In the analysis phases of this plan, the ratios presented in the following chart will be examined for community appropriateness and changed based on public and staff input. This will create a set of target numbers which the community will be able to use to guide component selection for new parks. These target numbers will also be helpful in determining the number of population based components that will be needed to address the needs of the expected population growth.
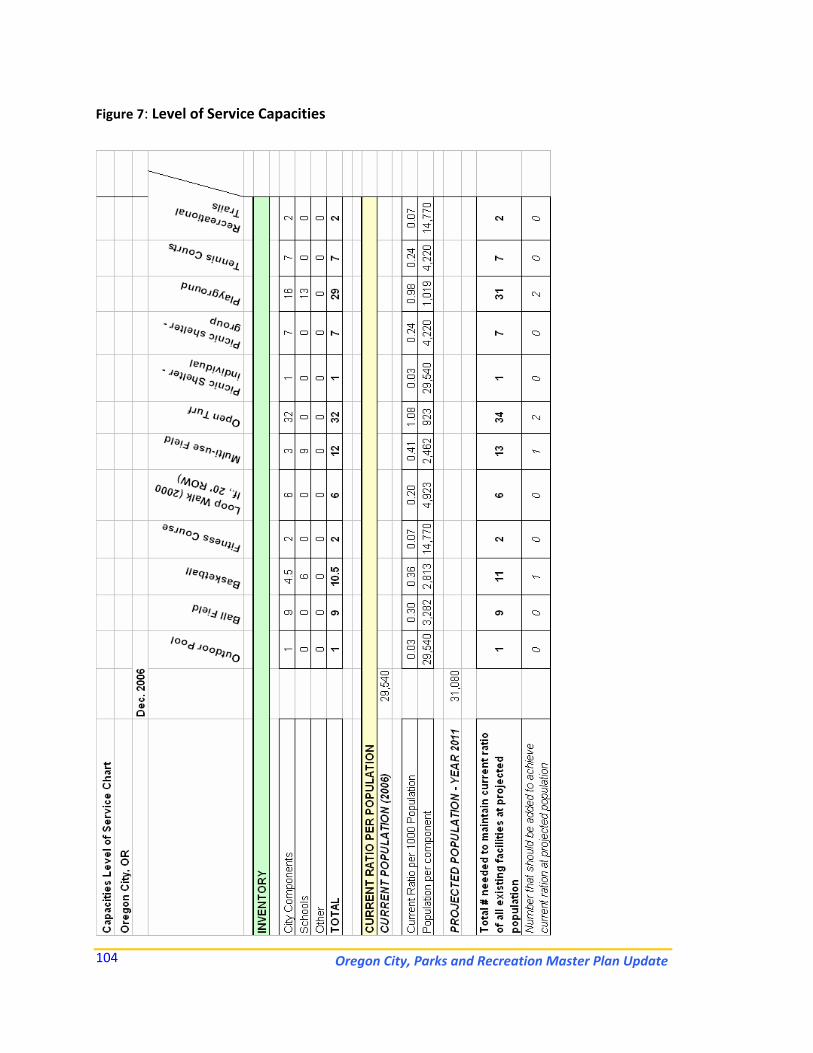
Oregon City, Parks and Recreation Master Plan Update
104
Figure 7: Level of Service Capacities
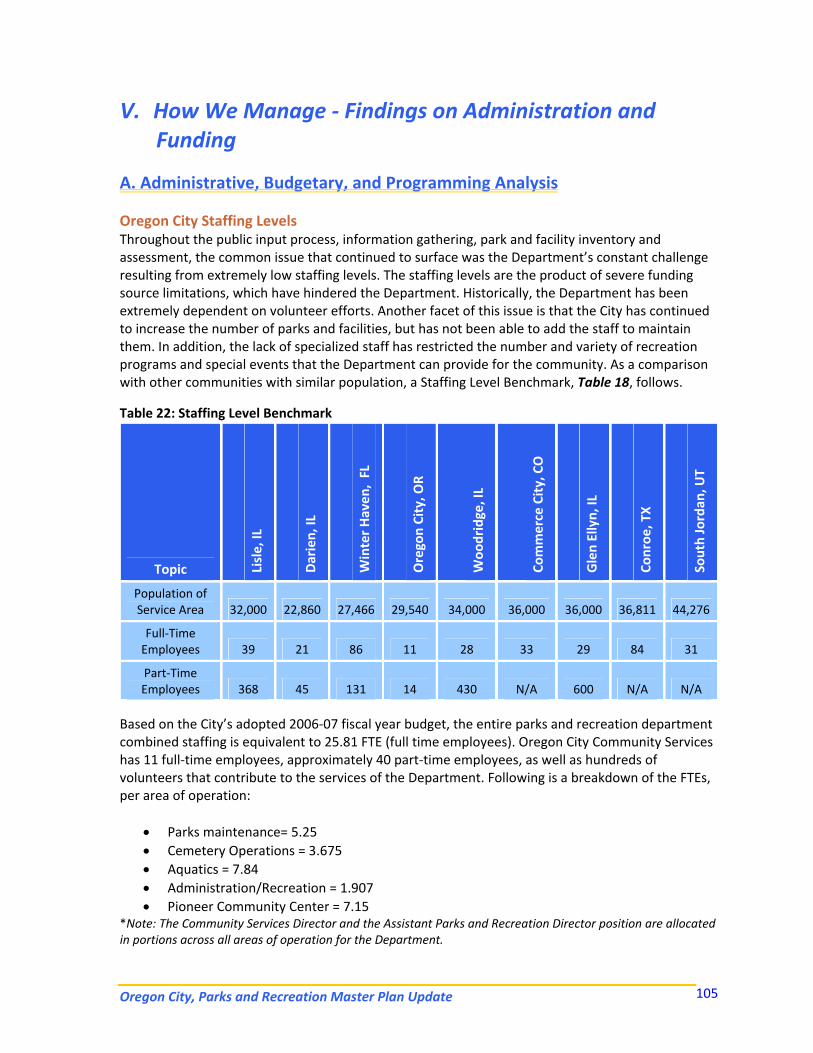
Oregon City, Parks and Recreation Master Plan Update 105
V. How We Manage ‐ Findings on Administration and Funding
A. Administrative, Budgetary, and Programming Analysis
Oregon City Staffing Levels Throughout the public input process, information gathering, park and facility inventory and assessment, the common issue that continued to surface was the Department’s constant challenge resulting from extremely low staffing levels. The staffing levels are the product of severe funding source limitations, which have hindered the Department. Historically, the Department has been extremely dependent on volunteer efforts. Another facet of this issue is that the City has continued to increase the number of parks and facilities, but has not been able to add the staff to maintain them. In addition, the lack of specialized staff has restricted the number and variety of recreation programs and special events that the Department can provide for the community. As a comparison with other communities with similar population, a Staffing Level Benchmark, Table 18, follows.
Table 22: Staffing Level Benchmark
Topic Lisle, IL
Darien, IL
Winter Haven
, FL
Oregon City, O
R
Woo
dridge, IL
Commerce City, CO
Glen Ellyn, IL
Conroe
, TX
South Jordan
, UT
Population of Service Area 32,000 22,860 27,466 29,540 34,000 36,000 36,000 36,811 44,276
Full‐Time Employees 39 21 86 11 28 33 29 84 31
Part‐Time Employees 368 45 131 14 430 N/A 600 N/A N/A
Based on the City’s adopted 2006‐07 fiscal year budget, the entire parks and recreation department combined staffing is equivalent to 25.81 FTE (full time employees). Oregon City Community Services has 11 full‐time employees, approximately 40 part‐time employees, as well as hundreds of volunteers that contribute to the services of the Department. Following is a breakdown of the FTEs, per area of operation:
• Parks maintenance= 5.25 • Cemetery Operations = 3.675 • Aquatics = 7.84 • Administration/Recreation = 1.907 • Pioneer Community Center = 7.15
*Note: The Community Services Director and the Assistant Parks and Recreation Director position are allocated in portions across all areas of operation for the Department.
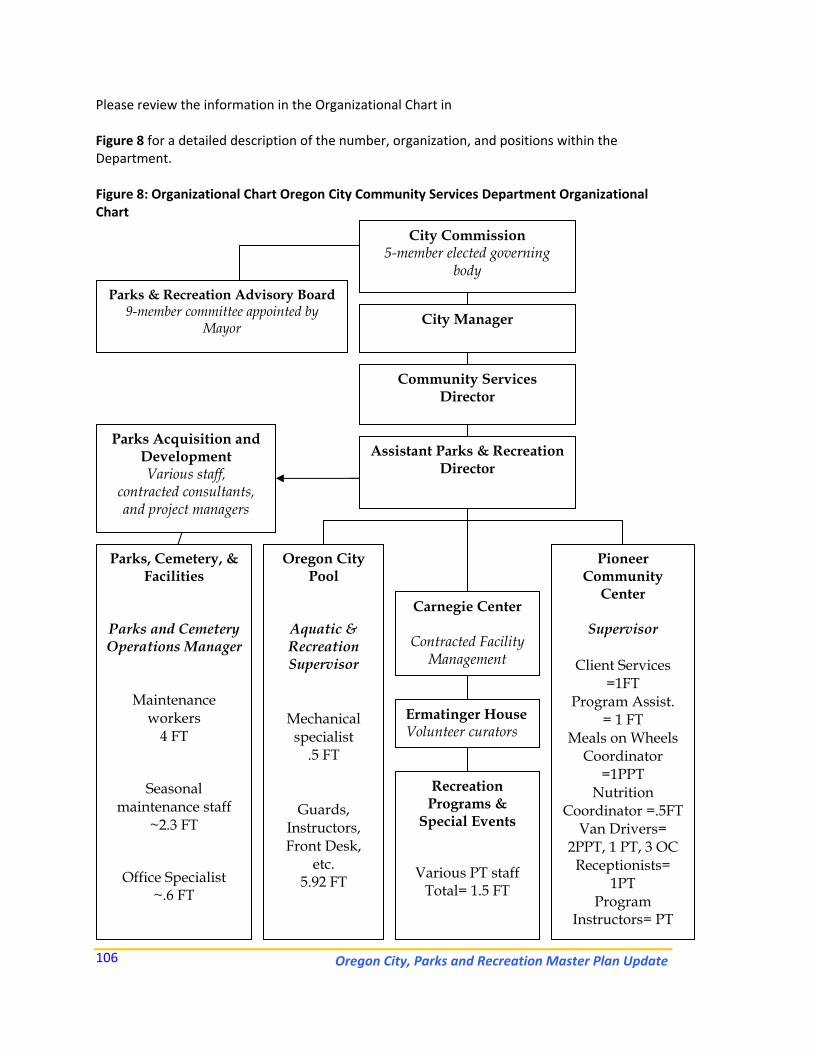
Oregon City, Parks and Recreation Master Plan Update
106
Please review the information in the Organizational Chart in Figure 8 for a detailed description of the number, organization, and positions within the Department. Figure 8: Organizational Chart Oregon City Community Services Department Organizational Chart
City Commission 5-member elected governing
body
City Manager
Community Services Director
Assistant Parks & Recreation Director
Carnegie Center
Contracted Facility Management
Parks & Recreation Advisory Board 9-member committee appointed by
Mayor
Parks Acquisition and Development Various staff,
contracted consultants, and project managers
Parks, Cemetery, & Facilities
Parks and Cemetery Operations Manager
Maintenance workers
4 FT
Seasonal maintenance staff
~2.3 FT
Office Specialist ~.6 FT
Oregon City Pool
Aquatic & Recreation Supervisor
Mechanical specialist
.5 FT
Guards, Instructors, Front Desk,
etc. 5.92 FT
Ermatinger House Volunteer curators
Recreation Programs &
Special Events
Various PT staff Total= 1.5 FT
Pioneer Community
Center
Supervisor
Client Services =1FT
Program Assist. = 1 FT
Meals on Wheels Coordinator
=1PPT Nutrition
Coordinator =.5FT Van Drivers=
2PPT, 1 PT, 3 OC Receptionists=
1PT Program
Instructors= PT
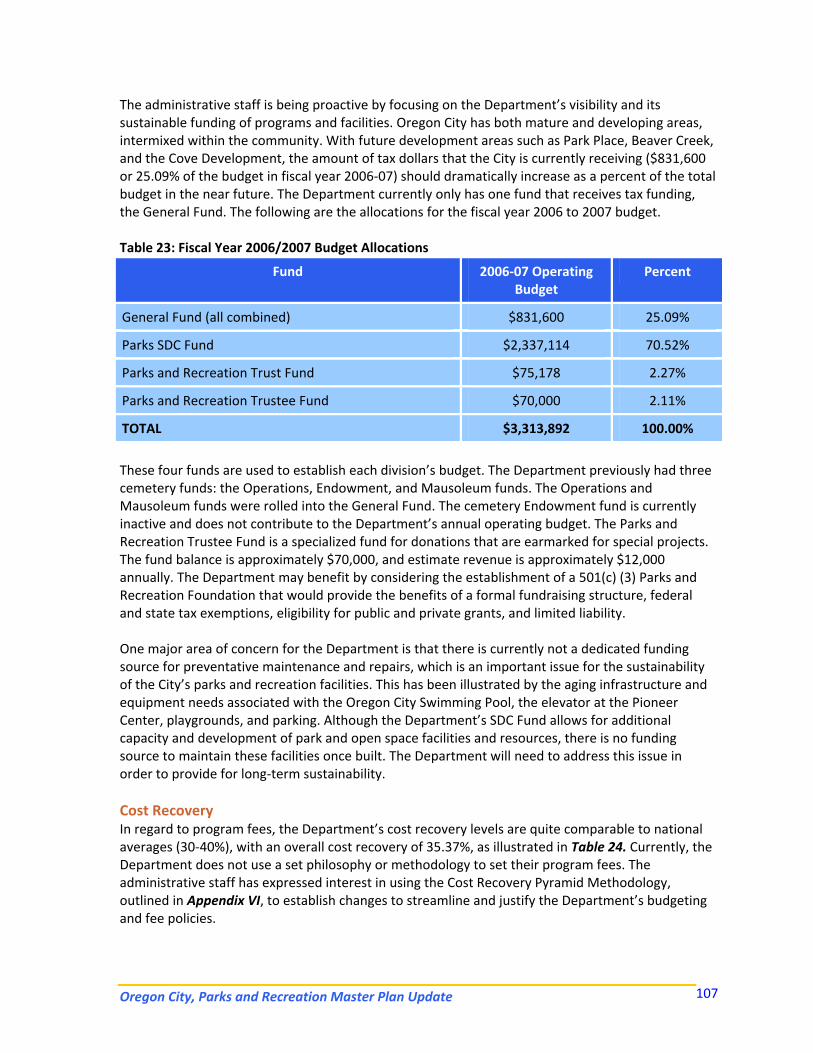
Oregon City, Parks and Recreation Master Plan Update 107
The administrative staff is being proactive by focusing on the Department’s visibility and its sustainable funding of programs and facilities. Oregon City has both mature and developing areas, intermixed within the community. With future development areas such as Park Place, Beaver Creek, and the Cove Development, the amount of tax dollars that the City is currently receiving ($831,600 or 25.09% of the budget in fiscal year 2006‐07) should dramatically increase as a percent of the total budget in the near future. The Department currently only has one fund that receives tax funding, the General Fund. The following are the allocations for the fiscal year 2006 to 2007 budget. Table 23: Fiscal Year 2006/2007 Budget Allocations
Fund 2006‐07 Operating Budget
Percent
General Fund (all combined) $831,600 25.09%
Parks SDC Fund $2,337,114 70.52%
Parks and Recreation Trust Fund $75,178 2.27%
Parks and Recreation Trustee Fund $70,000 2.11%
TOTAL $3,313,892 100.00%
These four funds are used to establish each division’s budget. The Department previously had three cemetery funds: the Operations, Endowment, and Mausoleum funds. The Operations and Mausoleum funds were rolled into the General Fund. The cemetery Endowment fund is currently inactive and does not contribute to the Department’s annual operating budget. The Parks and Recreation Trustee Fund is a specialized fund for donations that are earmarked for special projects. The fund balance is approximately $70,000, and estimate revenue is approximately $12,000 annually. The Department may benefit by considering the establishment of a 501(c) (3) Parks and Recreation Foundation that would provide the benefits of a formal fundraising structure, federal and state tax exemptions, eligibility for public and private grants, and limited liability. One major area of concern for the Department is that there is currently not a dedicated funding source for preventative maintenance and repairs, which is an important issue for the sustainability of the City’s parks and recreation facilities. This has been illustrated by the aging infrastructure and equipment needs associated with the Oregon City Swimming Pool, the elevator at the Pioneer Center, playgrounds, and parking. Although the Department’s SDC Fund allows for additional capacity and development of park and open space facilities and resources, there is no funding source to maintain these facilities once built. The Department will need to address this issue in order to provide for long‐term sustainability. Cost Recovery In regard to program fees, the Department’s cost recovery levels are quite comparable to national averages (30‐40%), with an overall cost recovery of 35.37%, as illustrated in Table 24. Currently, the Department does not use a set philosophy or methodology to set their program fees. The administrative staff has expressed interest in using the Cost Recovery Pyramid Methodology, outlined in Appendix VI, to establish changes to streamline and justify the Department’s budgeting and fee policies.
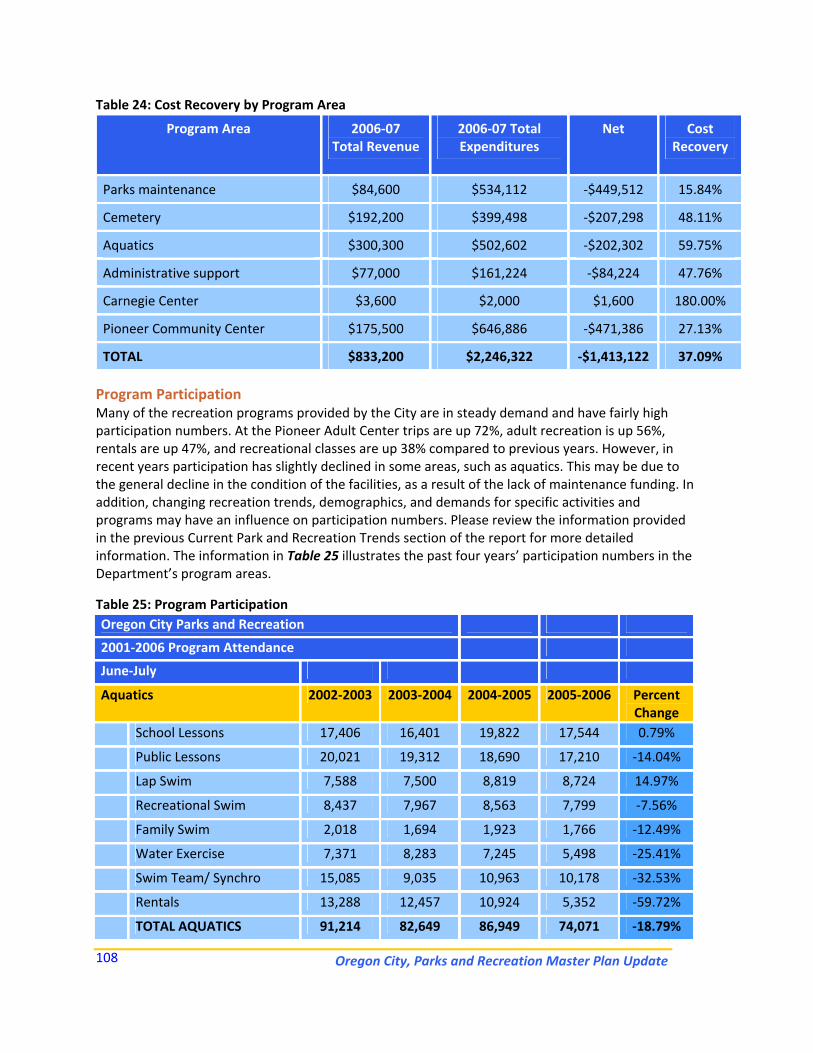
Oregon City, Parks and Recreation Master Plan Update
108
Table 24: Cost Recovery by Program Area
Program Area 2006‐07 Total Revenue
2006‐07 Total Expenditures
Net Cost Recovery
Parks maintenance $84,600 $534,112 ‐$449,512 15.84%
Cemetery $192,200 $399,498 ‐$207,298 48.11%
Aquatics $300,300 $502,602 ‐$202,302 59.75%
Administrative support $77,000 $161,224 ‐$84,224 47.76%
Carnegie Center $3,600 $2,000 $1,600 180.00%
Pioneer Community Center $175,500 $646,886 ‐$471,386 27.13%
TOTAL $833,200 $2,246,322 ‐$1,413,122 37.09%
Program Participation Many of the recreation programs provided by the City are in steady demand and have fairly high participation numbers. At the Pioneer Adult Center trips are up 72%, adult recreation is up 56%, rentals are up 47%, and recreational classes are up 38% compared to previous years. However, in recent years participation has slightly declined in some areas, such as aquatics. This may be due to the general decline in the condition of the facilities, as a result of the lack of maintenance funding. In addition, changing recreation trends, demographics, and demands for specific activities and programs may have an influence on participation numbers. Please review the information provided in the previous Current Park and Recreation Trends section of the report for more detailed information. The information in Table 25 illustrates the past four years’ participation numbers in the Department’s program areas.
Table 25: Program Participation Oregon City Parks and Recreation
2001‐2006 Program Attendance
June‐July
Aquatics 2002‐2003 2003‐2004 2004‐2005 2005‐2006 Percent Change
School Lessons 17,406 16,401 19,822 17,544 0.79%
Public Lessons 20,021 19,312 18,690 17,210 ‐14.04%
Lap Swim 7,588 7,500 8,819 8,724 14.97%
Recreational Swim 8,437 7,967 8,563 7,799 ‐7.56%
Family Swim 2,018 1,694 1,923 1,766 ‐12.49%
Water Exercise 7,371 8,283 7,245 5,498 ‐25.41%
Swim Team/ Synchro 15,085 9,035 10,963 10,178 ‐32.53%
Rentals 13,288 12,457 10,924 5,352 ‐59.72%
TOTAL AQUATICS 91,214 82,649 86,949 74,071 ‐18.79%
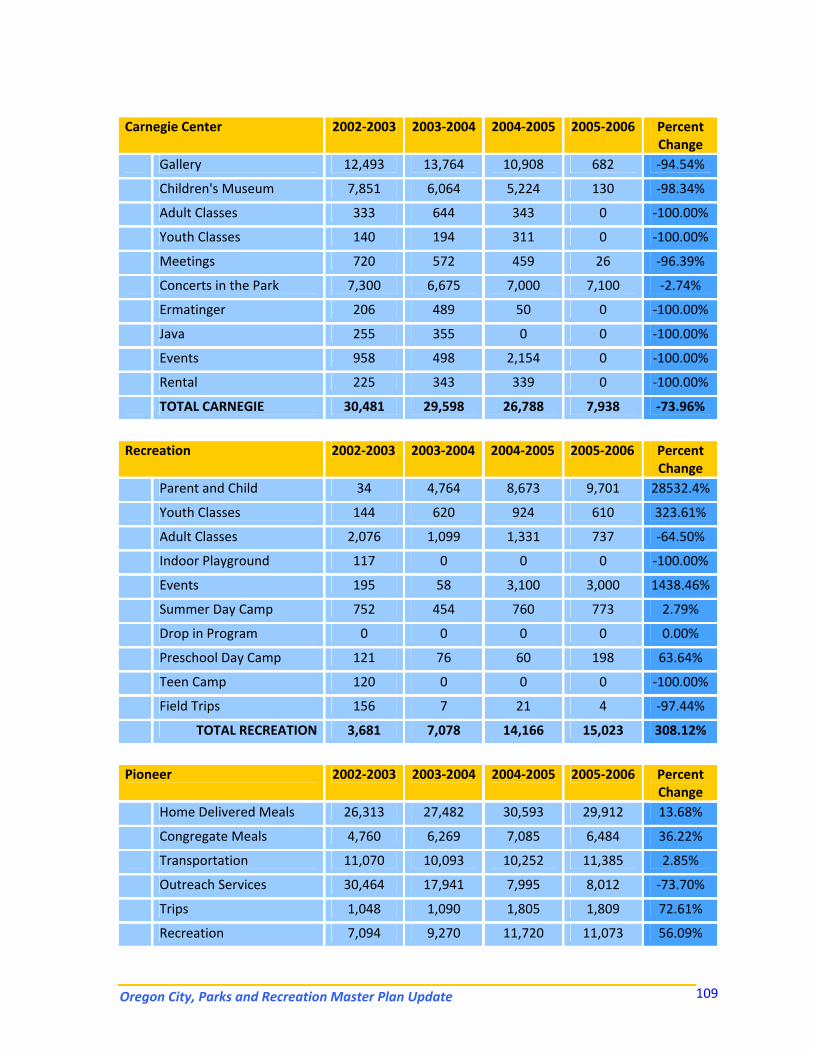
Oregon City, Parks and Recreation Master Plan Update 109
Carnegie Center 2002‐2003 2003‐2004 2004‐2005 2005‐2006 Percent
Change Gallery 12,493 13,764 10,908 682 ‐94.54%
Children's Museum 7,851 6,064 5,224 130 ‐98.34%
Adult Classes 333 644 343 0 ‐100.00%
Youth Classes 140 194 311 0 ‐100.00%
Meetings 720 572 459 26 ‐96.39%
Concerts in the Park 7,300 6,675 7,000 7,100 ‐2.74%
Ermatinger 206 489 50 0 ‐100.00%
Java 255 355 0 0 ‐100.00%
Events 958 498 2,154 0 ‐100.00%
Rental 225 343 339 0 ‐100.00%
TOTAL CARNEGIE 30,481 29,598 26,788 7,938 ‐73.96%
Recreation 2002‐2003 2003‐2004 2004‐2005 2005‐2006 Percent
Change Parent and Child 34 4,764 8,673 9,701 28532.4%
Youth Classes 144 620 924 610 323.61%
Adult Classes 2,076 1,099 1,331 737 ‐64.50%
Indoor Playground 117 0 0 0 ‐100.00%
Events 195 58 3,100 3,000 1438.46%
Summer Day Camp 752 454 760 773 2.79%
Drop in Program 0 0 0 0 0.00%
Preschool Day Camp 121 76 60 198 63.64%
Teen Camp 120 0 0 0 ‐100.00%
Field Trips 156 7 21 4 ‐97.44%
TOTAL RECREATION 3,681 7,078 14,166 15,023 308.12%
Pioneer 2002‐2003 2003‐2004 2004‐2005 2005‐2006 Percent
Change Home Delivered Meals 26,313 27,482 30,593 29,912 13.68%
Congregate Meals 4,760 6,269 7,085 6,484 36.22%
Transportation 11,070 10,093 10,252 11,385 2.85%
Outreach Services 30,464 17,941 7,995 8,012 ‐73.70%
Trips 1,048 1,090 1,805 1,809 72.61%
Recreation 7,094 9,270 11,720 11,073 56.09%
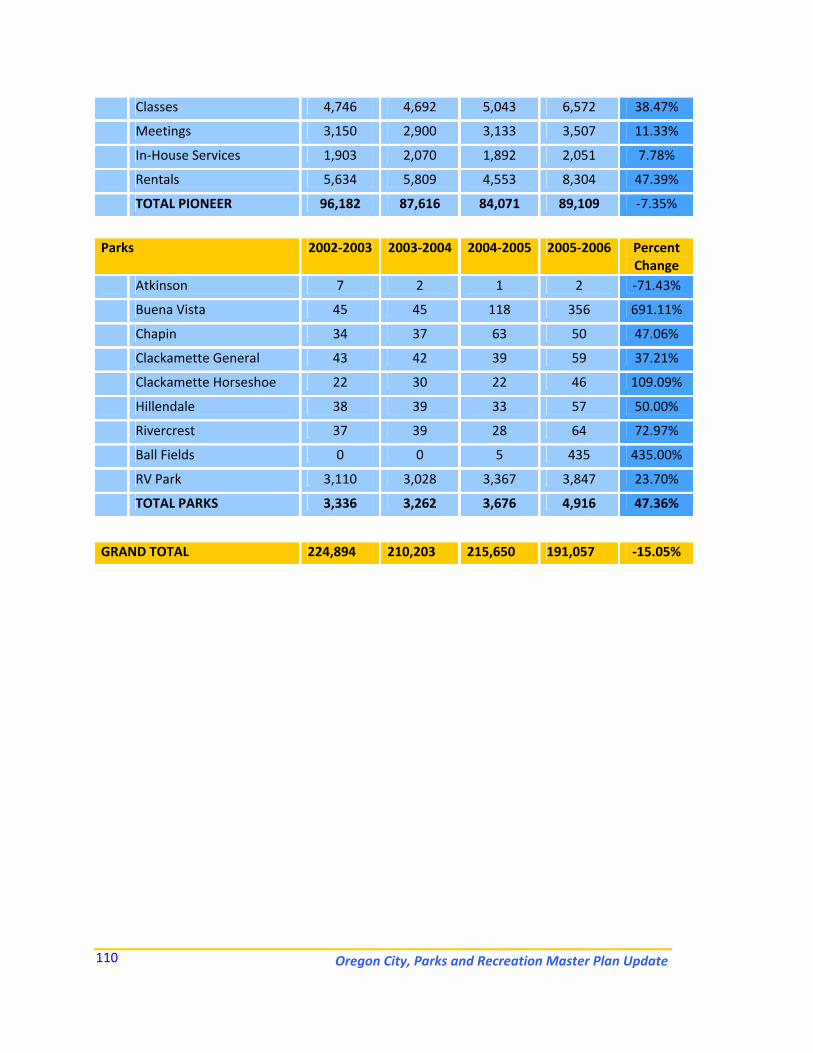
Oregon City, Parks and Recreation Master Plan Update
110
Classes 4,746 4,692 5,043 6,572 38.47%
Meetings 3,150 2,900 3,133 3,507 11.33%
In‐House Services 1,903 2,070 1,892 2,051 7.78%
Rentals 5,634 5,809 4,553 8,304 47.39%
TOTAL PIONEER 96,182 87,616 84,071 89,109 ‐7.35%
Parks 2002‐2003 2003‐2004 2004‐2005 2005‐2006 Percent
Change Atkinson 7 2 1 2 ‐71.43%
Buena Vista 45 45 118 356 691.11%
Chapin 34 37 63 50 47.06%
Clackamette General 43 42 39 59 37.21%
Clackamette Horseshoe 22 30 22 46 109.09%
Hillendale 38 39 33 57 50.00%
Rivercrest 37 39 28 64 72.97%
Ball Fields 0 0 5 435 435.00%
RV Park 3,110 3,028 3,367 3,847 23.70%
TOTAL PARKS 3,336 3,262 3,676 4,916 47.36%
GRAND TOTAL 224,894 210,203 215,650 191,057 ‐15.05%
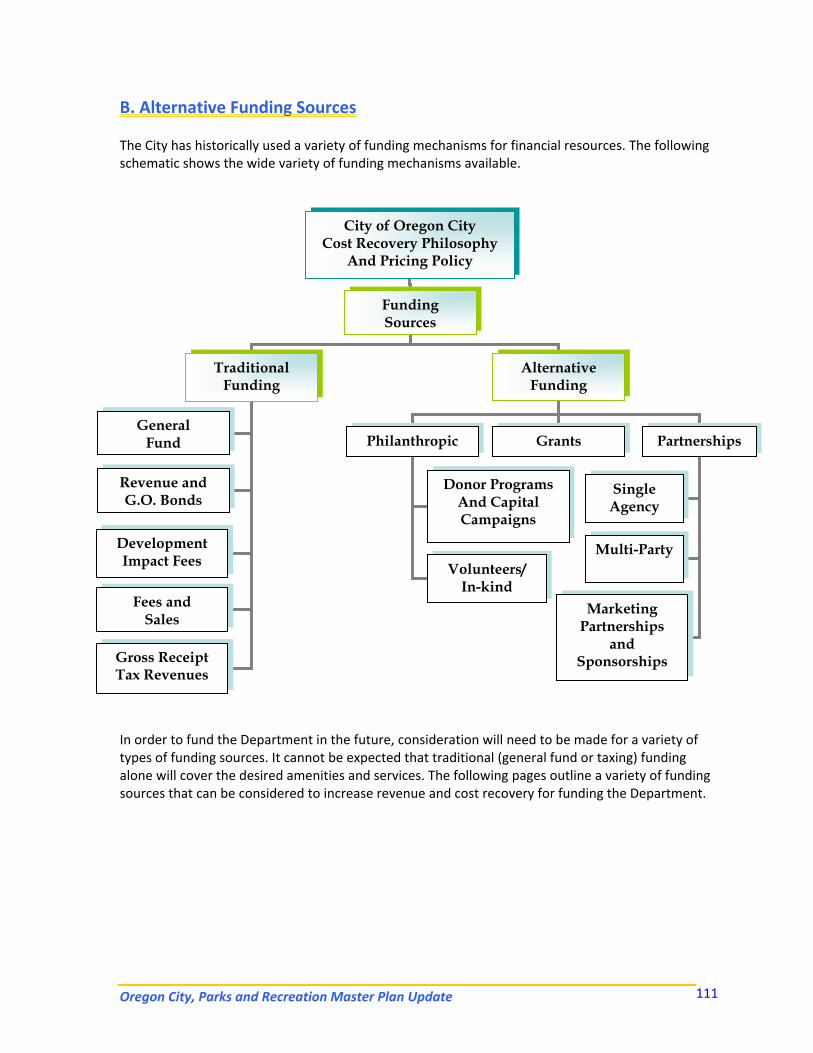
Oregon City, Parks and Recreation Master Plan Update 111
B. Alternative Funding Sources The City has historically used a variety of funding mechanisms for financial resources. The following schematic shows the wide variety of funding mechanisms available.
In order to fund the Department in the future, consideration will need to be made for a variety of types of funding sources. It cannot be expected that traditional (general fund or taxing) funding alone will cover the desired amenities and services. The following pages outline a variety of funding sources that can be considered to increase revenue and cost recovery for funding the Department.
City of Oregon City Cost Recovery Philosophy
And Pricing Policy
Traditional Funding
Alternative Funding
General Fund
Revenue and G.O. Bonds
Philanthropic Grants Partnerships
Single Agency
Multi-Party
Marketing Partnerships
and Sponsorships
Funding Sources
Development Impact Fees
Fees and Sales
Gross Receipt Tax Revenues
Donor Programs And Capital Campaigns
Volunteers/ In-kind
Oregon City, Parks and Recreation Master Plan Update
112
C. Potential Funding Sources These funding sources are currently being used, or could easily be used by the City of Oregon City Community Services Department to create the existing budgets for capital and operational expenditures. Systems Development Charges (SDC’s) These fees are assessed for the development of residential and/or commercial properties with the proceeds to be used for parks and recreation purposes, such as open space acquisition, community park site development, neighborhood parks development, regional parks development, etc. Recreation Service Fees This is a dedicated user fee, which can be established by a local ordinance or other government procedures for the purpose of constructing and maintaining recreation facilities. The fee can apply to all organized activities, which require a reservation of some type, or other purposes as defined by the local government. Examples of such activities include adult basketball, volleyball, and softball leagues, youth baseball, soccer, and softball leagues, and special interest classes. The fee allows participants an opportunity to contribute toward the upkeep of the facilities being used. Land and Water Conservation Fund These funds are awarded for acquisition and development of parks, recreation, and supporting facilities through the National Park Service and State Park System. Inter‐modal Transportation and Efficiency Act This funding program, commonly called TEA‐21 Grants was authorized by the Federal Government in 1991. Funds are distributed through the state. There are several million dollars in enhancement revenues available for transportation related projects, including bicycle and pedestrian trails, rail depot rehabilitation, landscaping, and beautification projects. Grants Varieties of special grants either currently exist through the federal and state governmental systems, or will be established through the life of current and proposed facilities. See Appendix VII for potential grant opportunities. Fees/Charges The plan has documented that the Department is far undervalued and must position its fees and charges to be market‐driven and based on both public and private facilities. The potential outcome of revenue generation is consistent with the national trends relating to public park and recreation agencies, which generate an average 35% to 50% of operating expenditures.
Oregon City, Parks and Recreation Master Plan Update 113
Private Developers These developers lease space from city‐owned land through a subordinate lease that pays out a set dollar amount plus a percentage of gross dollars for recreation enhancements. These could include a golf courses, marinas, restaurants, driving ranges, sports complexes, equestrian facilities, recreation centers, and ice arenas. (Which are currently in place at Sportcraft Landing.) Reservations This revenue source comes from the right to reserve specific public property for a set amount of time. The reservation rates are usually set and apply to group picnic shelters, meeting rooms for weddings, reunions and outings or other types of facilities for special activities. Volunteerism The revenue source is an indirect revenue source in that persons donate time to assist the Department in providing a product or service on an hourly basis. This reduces the City’s cost in providing the service plus it builds advocacy into the system. Catering Permits and Services This is a license to allow caterers to work in the park system on a permit basis with a set fee or a percentage of food sales returning to the City. Also, many cities have their own catering service and receive a percentage of dollars from the sale of their food. Ticket Sales/Admissions This revenue source is on accessing facilities for self‐directed activities such as pools, ice‐skating rinks, ballparks and entertainment activities. These user fees help offset operational costs. Solid Waste Fee Cities are able to add cost for land fills and drop stations that are designated to provide space and facilities for both. Once these fees cover the cost of buildings and landfills they can re‐dedicate a percentage to other city services. Several cities have opted to finance park improvements from solid waste fees (Oregon City already collects a host fee for a major solid waste transfer station site). On an annual basis a portion of these funds are utilized for community enhancement projects, which are competed for via a grant program. (The parks and recreation department has been the beneficiary of some of these funds as distributed each year). Booth Lease Space In some urban cities, they sell booth space to sidewalk type vendors in parks or at special events. For a flat rate based on volume received. The booth space can also apply to farmers markets, art schools, and antique type fairs. Camping Fees and Hook‐Up Fees City and county parks along with state parks permit camping for RV’s, tents, and primitive camping. Fees range from a high of $18.00 to $20.00 a night per site to $6.00 or $7.00 for primitive space. Additional fees will be added for water, electricity, sewer, and cable T.V. access. Lighting Fees Some cities charge additional fees for the lighting charges as it applies to leagues, special use sites, and signature type facilities that require lighting above a recreational level. This includes demand charges.
Oregon City, Parks and Recreation Master Plan Update
114
Program Contractor Fees Cities and counties receive a percentage of gross contractor fees for contractor programs held on city or county facilities. The percentages range from 25% to 40% depending on space, volume, and the amount of marketing the City does for the contractor. Patron Cards This allows patrons of a specific recreational facility to purchase patron cards for a month or a year that allow them special privileges above the general public. These privileges include having rights to early tee times, reservations, and special tours, shows, or events. The patron cards can range in price from $15.00 a month to $150.00 a year. Surplus Sale of Equipment by Auction Cities and counties have surplus auctions to get rid of old and used equipment that generates some income on a yearly basis. There are city and state policies already in place which govern how this happens. Permits (Special Use Permits) These special permits allow individuals to use specific park property for financial gain. The City either receives a set amount of money or a percentage of the gross service that is being provided. These funding sources are potential funding opportunities the City of Oregon City Community Services Department might consider for additional funding of capital and operational expenditures. Maintenance Utility Fee Cities can add a maintenance utility fee to the monthly utility bills that can be used for maintenance and operations of parks and recreation facilities and services. This can be done without a vote of the citizens. Franchise Fee on Cable This allows cities to add a franchise fee on cable to be designated for parks. The normal fee is $1.00 a month or $12.00 a year per household. Fees are usually designated for open space acquisition or capital improvements. Water Utility Fee Cities have added a special assessment on water utility fees paid by homeowners and businesses to cover the costs of watering street trees, landscaping, fountains, and pools. The fee is usually a percentage of the bill (2 or 3%). This fee is similar to the Maintenance Utility Fee (above). Partnerships Partnerships are joint development funding sources or operational funding sources between 2 separate agencies, such as 2 government entities, a non‐profit and a city department, or a private business and a city agency. Two partners jointly develop revenue producing park and recreation facilities and share risk, operational costs, responsibilities, and asset management based on the strengths and weaknesses of each partner. For a sample partnership policy see Appendix VIII.
Oregon City, Parks and Recreation Master Plan Update 115
Corporate Sponsorships This revenue‐funding source allows corporations to invest in the development or enhancement of new or existing facilities in park systems (we don’t solicit these currently but might be willing to). Sponsorships are also highly used for programs and events (we do utilize this method for programs and special events). For a sample sponsorship policy see Appendix IX. Film Rights Many cities and counties permit out their sites such as old ballparks or unique grounds or sites for film commissions to use. The film commission pays a daily fee for the site plus the loss of revenue the City will incur if the site generates income. (A citywide policy is currently being worked on for this, not limited to just parks). Cost Avoidance If the Department can stay driven by the market and focus on its core businesses it may be able to save money. By shifting its role as direct provider, the City will experience savings by deciding whether or not to provide that facility or program. This is cost avoidance. The estimated savings could be realized through partnering, outsourcing, or deferring to another provider in the provision of a service and/or facility. Foundation/Gifts These dollars are raised from tax‐exempt, non‐profit organizations established with private donations in promotion of specific causes, activities, or issues. They offer a variety of means to fund capital projects, including capital campaigns, gifts catalogs, fundraisers, endowments, sales of items, etc. Inter‐local Agreements Contractual relationships entered into between 2 or more local units of government and/or between a local unit of government and a non‐profit organization for the joint usage/development of sports fields, regional parks, or other facilities. General Obligation Bonds / Referendum Bonded indebtedness issued with the approval of the electorate for capital improvements and general public improvements. The plan recommends massive capital needs, renovation, and new facilities, to meet the needs and demands of residents of the City. These general obligation bonds would be initiated through city council approval and citizen vote. Private Concessionaires Contract with a private business to provide and operate desirable recreational activities financed, constructed, and operated by the private sector with additional compensation paid to the City. Naming Rights Many cities and counties have turned to selling the naming rights for new buildings or renovation of existing buildings and parks for the development cost associated with the improvement. This opportunity exists in the City. Cell Towers Cell towers attached to existing light poles in game field complexes are another source of revenue the City could seek to help support the system.
Oregon City, Parks and Recreation Master Plan Update
116
Capital Improvement Fees These fees are on top of the set user rate for accessing facilities such as golf, recreation centers, and pools to support capital improvements that benefit the user of the facility. Merchandising Sales This revenue source comes from the public or private sector on resale items from gift shops and pro shops for either all of the sales or a set gross percentage. Concession Management Concession management is from retail sales or rentals of soft goods, hard goods, or consumable items. The City either contracts for the service or receives a set of the gross percentage or the full revenue dollars that incorporates a profit after expenses. Friends Associations These groups are formed to raise money typically for a single focus purpose that could include a park facility or program that will better the community as a whole and their special interest. Advertising Sales This revenue source is for the sale of tasteful and appropriate advertising on park and recreation related items such as in the City’s program guide, on scoreboards, dasher boards and other visible products or services that are consumable or permanent that exposes the product or service to many people. Marine Slips/Permits This revenue source is for a permit to store boats on public property for a set amount based on a lineal foot and service charges on an annual basis. Parking Fees This fee applies to parking at selected destination facilities such as beach parking areas, major stadiums, and other attractions to help offset capital and operational costs. This is similar to a boat launch fee idea at Clackamette & Sportcraft. Horsepower Fee In some county parks, they charge a horsepower fee to use public park reservoirs. The higher the horsepower, the more money the user pays. A basic fee is applied, for example $35.00, and horsepower rates are typically $1.00 or $2.00 per horsepower. This is similar to the boat launch parking fee suggested above. Equipment Rental The revenue source is available on the rental of equipment such as tables, chairs, tents, stages, bicycles, roller blades, and boogie boards that are used for recreation purposes. Special Fundraisers Many park and recreation agencies have special fundraisers on an annual basis to help cover specific programs and capital projects.
Oregon City, Parks and Recreation Master Plan Update 117
Recreation Surcharge Fees on Sports and Entertainment Tickets, Classes, MasterCard, Visa, Golf This fee is a surcharge on top of the regular sports revenue fee or convenience fee for use of MasterCard and Visa. The fee usually is no more than $5.00 and usually is $3.00 on all exchanges. The money earned is used to help pay off the costs of improvement or for operational purposes. Gift Catalogs Gift catalogs provide organizations the opportunity to let the community know on a yearly basis what their needs are. The community purchases items from the gift catalog and donates them to the City. Maintenance Endowments Maintenance endowments are set up for organizations and individuals to invest in ongoing maintenance improvements and infrastructure needs. Endowments retain money from user fees, individual gifts, impact fees, development rights, partnerships, conservation easements, and for wetland mitigations. Membership and Season Pass Sales The cities or counties sell memberships to specific types of amenities to offset operational costs. These membership fees can apply to recreation and fitness centers, tennis centers, golf courses, pools, or ice‐rinks. Security and Clean‐Up Fees Cities will charge groups and individuals security and clean‐up fees for special events other type of events held in parks. The funding sources listed below are potential funding opportunities the City of Oregon City Community Services Department could consider for additional funding of capital and operational expenditures. These funding sources may not be available currently in the State of Oregon or an intergovernmental agreement may be necessary for implementation. These funding sources may meet with some resistance and be more difficult to implement.
Creation of an Authority The City needs to adopt the creation of a recreation authority or district to create an atmosphere that would allow the Department to initiate long‐term successes. Many successful park districts exist throughout the country and facilitate creative business approaches to leisure services that some governmental entities cannot provide. The planning team views this action as key to plan success. Hotel, Motel, and Restaurant Tax Tax based on gross receipts from charges and meals services, which may be used to build and operate sports fields, regional parks, golf courses, tennis courts, and other special park and recreation facilities. Sales Tax The revenue source is very popular for funding park and recreation agencies either partially or fully. The normal sales tax rate is 1¢ for operations and 1/2¢ for capital. This tax is very popular in high traffic tourism‐type cities and with counties and state parks.
Oregon City, Parks and Recreation Master Plan Update
118
Food and Beverage Tax The tax is usually associated with convention and tourism bureaus. However, since parks and recreation agencies manage many of the tourism attractions, they receive a portion of this funding source for operational or capital expenses. Utility Roundup Programs Some park and recreation agencies have worked with their local utilities on a round up program whereby a consumer can pay the difference between their bill up to the even dollar amount and they then pay the Department the difference. Ideally, these monies are used to support utility improvements such as sports lighting, irrigation cost, and HVAC costs Land Trust Many counties have developed land trusts to help secure and fund the cost for acquiring land that needs to be preserved and protected for greenway purposes. This could be a good source to look to for acquisition of future lands. Local Improvement Districts (LID’s) Taxing districts established to provide funds for certain types of improvements that benefit a specific group of affected properties. Improvements may include landscaping, the erection of fountains, and acquisition of art, and supplemental services for improvement and promotion, including recreation and cultural enhancements. Revenue Bonds Bonds used for capital projects that will generate revenue for debt service where fees can be set aside to support repayment of the bond. There are very limited opportunities for the City of Oregon City to utilize revenue bonds to develop facilities. Real Estate Transfer Fees As cities and counties expand, the need for infrastructure improvements continues to grow. Since parks add value to neighborhoods and communities, some cities and counties have turned to real estate transfer fees to help pay for needed renovations. Usually transfer fees amount to ¼ to ½% on the total sale of the property. Benefit Assessment Act of 1982 (Government Code section 54703 et seq.) This statute provides a uniform procedure for the enactment of benefit assessments to finance the maintenance and operation costs of drainage, flood control, and street light services and the cost of installation and improvement of drainage or flood control facilities. Under legislation approved in 1989 (SB 975, Chapter 1449), this authority is expanded to include the maintenance of streets, roads, and highways. As with most other assessment acts, cities, counties, and special districts that are otherwise authorized to provide such services may use it. The Mello‐Roos Act The 1982 Mello‐Roos Community Facilities Act (Government Code Sections 53311 et seq.) enables cities, counties, special districts, and school districts to establish community facilities districts (CFDs) and to levy special taxes to fund a wide variety of facilities and services. The proceeds of a Mello‐Roos tax can be used for direct funding and, in the case of capital facilities, to pay off bonds. Mello‐
Oregon City, Parks and Recreation Master Plan Update 119
Roos financing has similarities to special taxes and special assessments, and in some situations, it has advantages over both. Establish a Greenway Utility Greenway utilities are used to finance acquisition of greenways and development of the greenways by selling the development rights underground for the fiber optic types of businesses. Subordinate Easements – Recreation / Natural Area Easements This revenue source is available when the City allows utility companies, businesses, or individuals to develop some type of an improvement above ground or below ground on their property for a set period of time and a set dollar amount to be received by the City on an annual basis. Irrevocable Remainder Trusts These trusts are set up with individuals who typically have more than a million dollars in wealth. They will leave a portion of their wealth to the City in a trust fund that allows the fund to grow over a period of time and then is available for the City to use a portion of the interest to support specific park and recreation facilities or programs that are designated by the trustee. Life Estates This source of money is available when someone wants to leave their property to the City in exchange for them to live on their property until their death. The City usually can use a portion of the property for park purposes and then all of it after the person’s death. This revenue source is very popular for individuals who have a lot of wealth and their estate will be highly taxed at their death and their children may have to sell of their property because of probate costs. This allows the person to receive a good tax deduction yearly on their property while leaving a life estate. It is good for the City because they do not have to pay for the land. Integrated Financing Act This legislation creates an alternate method for collecting assessments levied under the Landscaping and Lighting Act, the Vehicle Parking District Law and the Park and Playground Act. This act applies to all local agencies. This act can be used to pay the cost of planning, designing, and constructing capital facilities authorized by the applicable financing act, pay for all or part of the principle and interest on debt incurred pursuant to the applicable financing act and to reimburse a private investor in the project. It serves two unique properties: one, it can levy an assessment which is contingent upon future land development and payable upon approval of a subdivision map or zone change or the receipt of building permits; two, it allows the local agency to enter into an agreement with a private investor whereby the investor will be reimbursed for funds advance to the agency for the project being financed. Business Excise Tax This tax is for new businesses that settle into a community on products sold based on the wholesale cost. Park districts in Illinois use this source as one of their revenue sources. Room Overrides on Hotels for Sports Tournaments and Special Events Cities have begun to keep a percentage of hotel rooms that are booked when the City hosts a major sports tournament or special event. The overrides are usually $5.00 to $10.00 depending on what type of room. Monies collected help offset operational costs for the City in hosting the events. (This is a limited opportunity in Oregon City because of the Cities lack of hotels.)
Oregon City, Parks and Recreation Master Plan Update
120
Leasebacks on Recreational Facilities Many cities do not have capital dollars to build revenue‐producing facilities but they will hire a private investor to build the facility according to the specifications they want, the investment company will finance the project and the City will lease it back from them over 20 years. This can be reversed where by the City builds the facility and leases to private management to operate it for a percentage of gross dollars to pay off the construction loans through a subordinate lease. Family Tree Program Many cities have worked with local hospitals to provide cash to the parks system to buy and plant a tree in honor of every newborn in the City. The hospitals invest $250.00 to $300.00 and receive the credit from the parents of the newborns. The parks system gets new trees of ample size. Alcohol Tax A percentage of alcohol tax gained by the state is made available for individual cities and county park systems to retain support efforts to develop programs and services targeted for youth to assist in skill development programs, after‐school programs, summer camps, and other family type programs. Cigarette Tax In some states the sales tax gain by the state for cigarettes is redistributed to cities and counties for programs to teach and curb youth smoking through effective prevention recreation programs. Sell Development Rights Some cities and counties sell their development rights below park ground or along trails to fiber optic companies or utilities. The park agency detains a yearly fee on a linear foot basis. Signage Fees This revenue source taxes people and businesses with signage fees at key locations with high visibility for short term events. Signage fees range in price from $25.00 per signs up to $100.00 per sign based on the size of the sign and location. Dog Park Fees These fees are attached to kennel clubs for the right for their club to have their own dog park facilities for their exclusive use. Fees are on the dogs themselves and on people who take care of people’s dogs. Land Swaps This is where the city or county trades property to improve their access of protection of resources. This could include property gain by the city for non‐payment of taxes or a situation in which a developer needs a larger or smaller space to improve their profitability. The city or county typically gains more property for more recreation opportunities in exchange for the land swap. Recommendations related to funding improvements can be found in Section VI, Recommendations and Action Plans.
Oregon City, Parks and Recreation Master Plan Update 121
D. Summary of Key Finance and Funding Findings Organizational Management The Oregon City Community Services Department resources are below standards for staffing resources. If Oregon City considers expanding recreation services and/or facilities in the future, staffing resources and allocations may need to be re‐evaluated. Finance and Cost Recovery The City of Oregon City has an average cost recovery for parks and recreation services. Current funding for park capital improvements is extremely limited. Ongoing operational and maintenance funding is very low and the level of service to the community is minimal. Partnerships Oregon City has no overall partnership policy or plan. There is substantial opportunity for additional partnerships and alternative funding, but no allocated staff or resources to procure these functions.
VI. Recommendations and Action Plans Great Things to Come The previous sections have provided findings and analysis of the various management and planning issues for the City of Oregon City. This section provides recommendations for improvements for Oregon City based on the information gathered from survey results and from the public input process. The information gathered has aided in identifying community issues, analyzing future needs, and addressing how to implement them. The recommendations in this section are not necessarily prioritized, although the capital improvement recommendations in the charts within this section are prioritized within the timeframe indicated. It is understood that these priorities may change or shift based on funding opportunities, political climates, etc. and is intended to provide guidelines as to what is needed to keep up with the quick growth and development that is occurring in Oregon City. Recommendations for the next five years address the needs of the community and can be implemented with funding sources identified. The five‐year recommendations are guidelines based on current information and planning. Planning beyond the next five years is not as certain, as the community will change drastically. It is recommended that another Parks and Recreation Master Planning process begin within the next five to six years to more accurately plan for the future. Most communities conduct a new Master Planning process every five to six years to maintain their ability to receive grants with a current long‐range plan in place. Guiding Themes Based on the Findings in the previous sections of this plan, some guiding themes have emerged and provide the framework for the City of Oregon City’s approach toward parks and recreation facilities and services. Oregon City should capitalize on its great assets and focus on taking care of what they have, as a priority.
Oregon City, Parks and Recreation Master Plan Update
122
A strong parks and recreation component is central to the quality of life goals of Oregon City. This Parks and Recreation Master Plan Update promotes the enhancement and expansion of parks and recreation opportunities for the community. There are several guiding themes expressed through the community planning processes that are summarized below:
• Build on Oregon City’s natural and recreational outdoor assets • Support a pedestrian‐friendly, “walkable” community, including bicycling • Enhance the “quality of life” for residents through parks and recreation • Create new funding mechanisms to sustain the level of standards the community supports • Balance passive, self‐directed, and active recreational opportunities through goals and
strategies • Maintain and upgrade the existing assets and expand park and recreation opportunities as
opportunities arise • Expand citywide events • Further embrace the historical aspects of Oregon City
A. Recommendations
Goal 1: Maximize the Planning Effort First Steps Objective: Incorporate the action items of this plan into the City’s annual work plans to achieve the recommendations of this plan and to enhance effectiveness of staff effort. Strategy:
• Assign responsibility and time frame, and allocate resources necessary to complete each action identified in annual work plans.
Objective: Assure that all levels of staff are informed of and are set up to work together to implement the recommendations and strategies of the plan. Strategies:
• Inform all levels of staff of the direction of the Plan, allow for staff input, encourage buy‐in, and encourage input from all staff members.
• Provide cross‐departmental staff teams/team members, as appropriate, with education development opportunities, necessary equipment, and supplies.
Goal 2: Increase Level of Service in Parks and Facilities Objective: Increase level of maintenance throughout the parks system to increase the level of service. National averages show that park systems that have an average of one full‐time employee (FTE) per 7 to 10 developed acres are able to adequately maintain parks to a safe and publicly acceptable
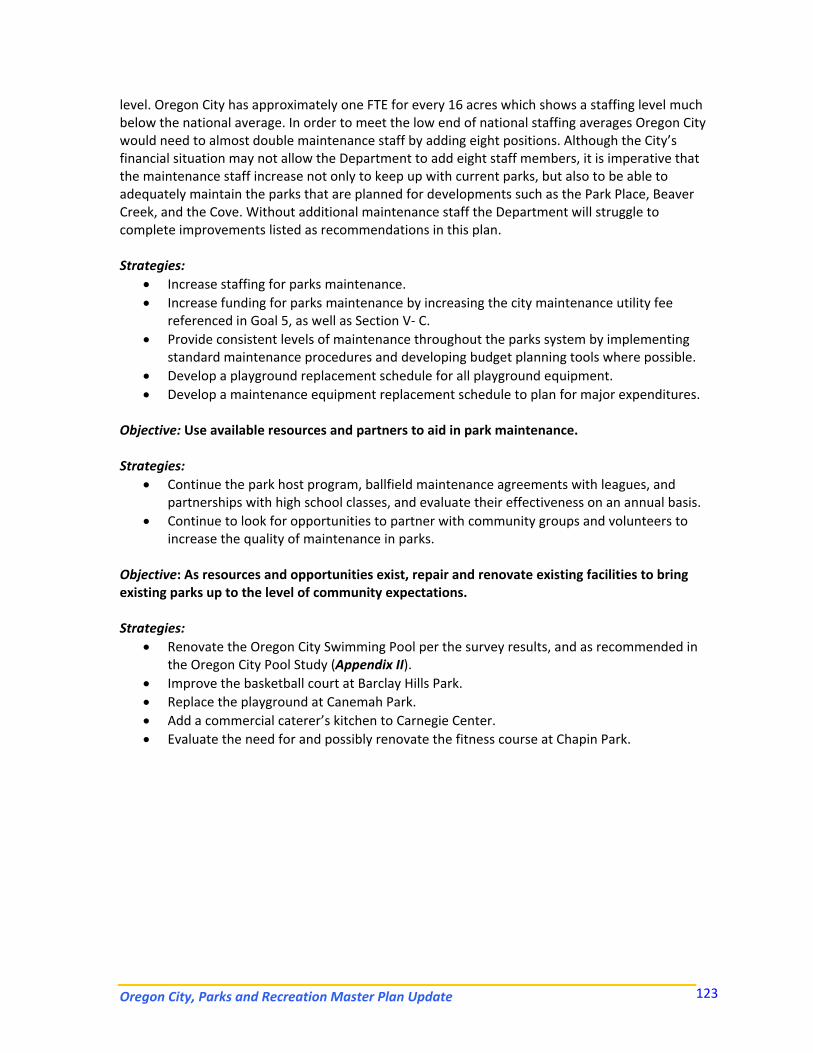
Oregon City, Parks and Recreation Master Plan Update 123
level. Oregon City has approximately one FTE for every 16 acres which shows a staffing level much below the national average. In order to meet the low end of national staffing averages Oregon City would need to almost double maintenance staff by adding eight positions. Although the City’s financial situation may not allow the Department to add eight staff members, it is imperative that the maintenance staff increase not only to keep up with current parks, but also to be able to adequately maintain the parks that are planned for developments such as the Park Place, Beaver Creek, and the Cove. Without additional maintenance staff the Department will struggle to complete improvements listed as recommendations in this plan. Strategies:
• Increase staffing for parks maintenance. • Increase funding for parks maintenance by increasing the city maintenance utility fee
referenced in Goal 5, as well as Section V‐ C. • Provide consistent levels of maintenance throughout the parks system by implementing
standard maintenance procedures and developing budget planning tools where possible. • Develop a playground replacement schedule for all playground equipment. • Develop a maintenance equipment replacement schedule to plan for major expenditures.
Objective: Use available resources and partners to aid in park maintenance. Strategies:
• Continue the park host program, ballfield maintenance agreements with leagues, and partnerships with high school classes, and evaluate their effectiveness on an annual basis.
• Continue to look for opportunities to partner with community groups and volunteers to increase the quality of maintenance in parks.
Objective: As resources and opportunities exist, repair and renovate existing facilities to bring existing parks up to the level of community expectations. Strategies:
• Renovate the Oregon City Swimming Pool per the survey results, and as recommended in the Oregon City Pool Study (Appendix II).
• Improve the basketball court at Barclay Hills Park. • Replace the playground at Canemah Park. • Add a commercial caterer’s kitchen to Carnegie Center. • Evaluate the need for and possibly renovate the fitness course at Chapin Park.
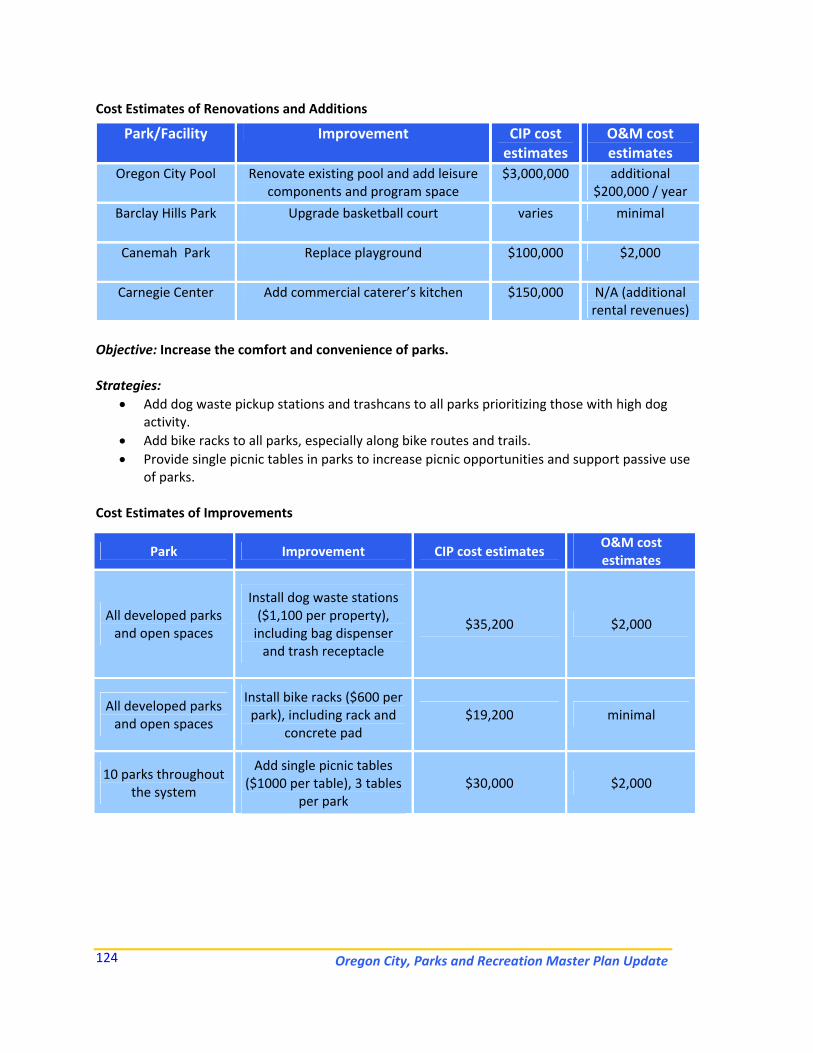
Oregon City, Parks and Recreation Master Plan Update
124
Cost Estimates of Renovations and Additions
Park/Facility Improvement CIP cost estimates
O&M cost estimates
Oregon City Pool Renovate existing pool and add leisure components and program space
$3,000,000 additional $200,000 / year
Barclay Hills Park Upgrade basketball court varies minimal
Canemah Park Replace playground $100,000 $2,000
Carnegie Center Add commercial caterer’s kitchen $150,000 N/A (additional rental revenues)
Objective: Increase the comfort and convenience of parks. Strategies:
• Add dog waste pickup stations and trashcans to all parks prioritizing those with high dog activity.
• Add bike racks to all parks, especially along bike routes and trails. • Provide single picnic tables in parks to increase picnic opportunities and support passive use
of parks. Cost Estimates of Improvements
Park Improvement CIP cost estimates O&M cost estimates
All developed parks and open spaces
Install dog waste stations ($1,100 per property), including bag dispenser and trash receptacle
$35,200 $2,000
All developed parks and open spaces
Install bike racks ($600 per park), including rack and
concrete pad $19,200 minimal
10 parks throughout the system
Add single picnic tables ($1000 per table), 3 tables
per park $30,000 $2,000
Oregon City, Parks and Recreation Master Plan Update 125
Objective: Increase diversity of components in parks. Strategies:
• Increase the LOS provided to the community by adding new facilities like those found in other Oregon parks such as: leisure aquatic amenities, an off‐leash dog park, a nature center, and an amphitheater. Explore the idea of adding an adventure or destination playground, farmer’s market area, and outdoor performing arts space.
• Solicit public input in the development or renovation of all parks. Objective: Determine the best uses for neighborhood parks. This planning process recognizes that neighborhood parks are valued by the residents of Oregon City. Seventy percent of the survey respondents stated that they have a need for neighborhood parks. This facility was second only to walking and biking trails in terms of need. In addition, 34% of the respondents list neighborhood parks in the top four most important facilities to have in their parks system. Because neighborhood parks are so important to residents, it will be important to use these parcels to keep up with the needs of the community. However, it is recommended that the City should focus its efforts towards neighborhood parks of at least three acres in size. It is important that plans for these parks be developed with neighborhood input. These plans may call for some development or may call for the parks to be left undeveloped, depending on the feedback from the neighborhoods. Each existing or future neighborhood park should be considered on an individual basis for its current or potential recreational value. Strategies:
• Hold public meetings or visit with neighborhood groups to gain input about future of neighborhood parks.
• Create master plans for each park based on public input. • Implement master plans after funding has increased to keep up with maintenance.
Objective: Determine the most efficient action to reduce the number of mini‐parks or pocket parks owned and maintained by the City. Respondents to the survey also list their need for small neighborhood parks as being met. Currently the Oregon Community Services Department has several very small neighborhood (mini or pocket) parks that are either undeveloped or have a very low level of development. These parks, less than three acres, known as "mini‐parks" or "pocket parks", should be discouraged because of their limited recreational value and high cost to maintain. There are a few cases of specialized park sites which are smaller than three acres, such as Jon Storm Park or Richard Bloom Tots' Park, where the parks should be developed and maintained because of other considerations. Each existing or future mini or pocket park should be considered on an individual basis for its current or potential recreational value. For these same reasons, the City should not assume the ownership or operations of any privately developed/owned parks which do not meet these same thresholds: at least three acres in size and built to City parks standards. Strategies:
• Explore opportunities for agreements with HOA's and neighborhood groups to maintain small neighborhood parks in exchange for development of the park.
Oregon City, Parks and Recreation Master Plan Update
126
• Hold public meetings or visit with neighborhood groups to gain input about future of neighborhood parks.
• The City should consider surplusing/disposing of existing mini‐parks/pocket parks where feasible, after the local neighborhood has been given the opportunity to assume maintenance and operation responsibilities for the site.
Objective: Continue to plan for parkland acquisition. Future park acquisition should be considered on an individual basis for its current or potential recreational value. Strategies:
• Pursue the acquisition of property in the High School (Glen Oak Road) Area. • Investigate and maximize opportunities presented by the Park Place, Beaver Creek, South
End, The Rivers, and Cove Developments to increase city park acres from 258.2 to meet the ORPA median of 422 park acres.
• Look for land acquisition opportunities that are more than three acre parcels in the southern part of the Hilltop east of Hwy 213, in the “South End” area near the edge of the current city boundary or in the Urban Growth Boundary (roughly between Central Pt. and S. End Roads), in the Hilltop area east of Clackamas Community College and Beavercreek Rd. (UGB/future growth areas), and in the eastern portion of the Middle Level.
• The City should not acquire or develop additional mini‐parks or pocket parks that are less than three acres in size. Mini/pocket parks may be developed within single‐family subdivisions as long as they are owned and maintained by homeowners associations.
See GRASP® Recommendation Perspective located in Appendix V.
Goal 3: Increase access to parks by implementing trails plan Objective: Use the 2004 Oregon City Trails Master Plan to seek out opportunities to increase miles of trails within Oregon City (currently six) to meet, if not greatly exceed, the ORPA median of nine miles of developed trail. Strategies:
• Work to fund Tier 1 local trails as identified in the 2004 Trails Master Plan. Place emphasis on constructing trails that connect parks to other parks, trails, or neighborhoods. For example: Park Place Development Trails (L4), Barclay Park Connection (L11), Parks Trail (L21), and Wesley Lynn – Chapin Trail (L23).
• Continue to fund planning and construction for Tier 1 Regional Trails as identified in the 2004 Trails Master Plan. Use the Trails Master Plan for priorities and specifics about implementation costs.
• As funding permits, determine the existing condition and location of the Oregon Trail‐Barlow Road Historic Corridor and review the existing standards within the Oregon City Municipal Code to determine if modifications to the development standards and/or City master plans are necessary to protect the corridor. If modifications to the existing code language are proposed, they should include methods to encourage property owners to preserve the historic corridor in the original condition while allowing the property to be used in an economically viable manner. This strategy recommendation shall
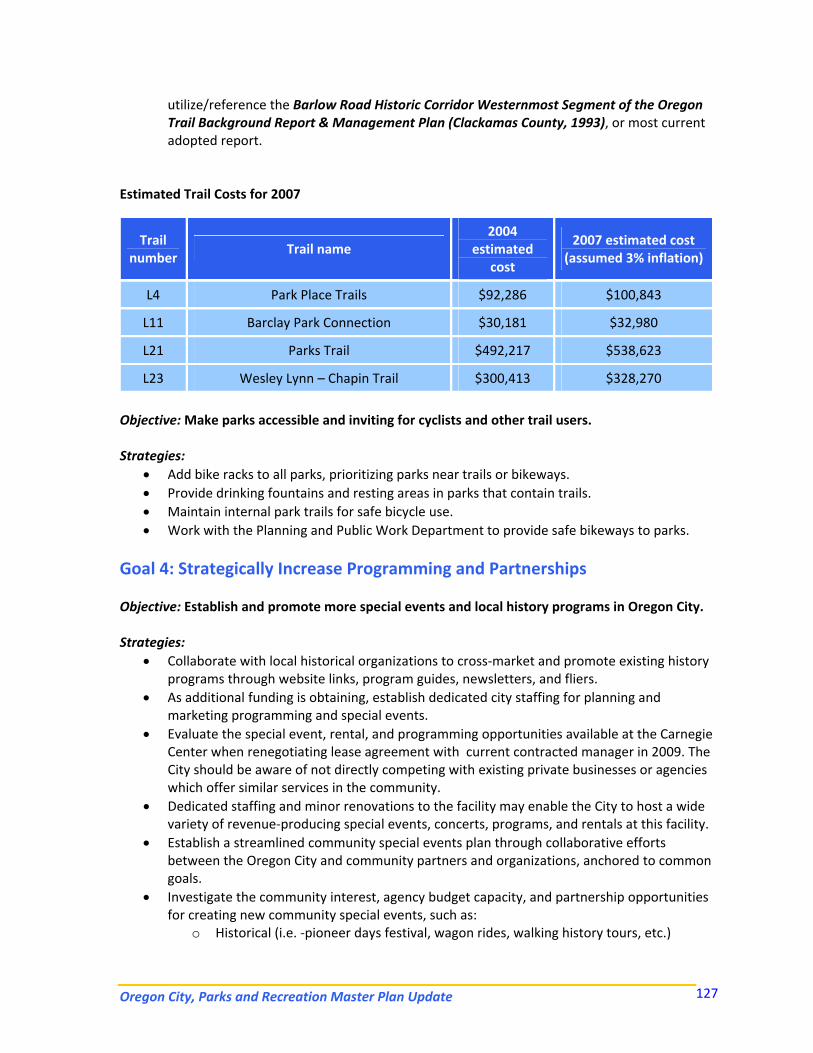
Oregon City, Parks and Recreation Master Plan Update 127
utilize/reference the Barlow Road Historic Corridor Westernmost Segment of the Oregon Trail Background Report & Management Plan (Clackamas County, 1993), or most current adopted report.
Estimated Trail Costs for 2007
Objective: Make parks accessible and inviting for cyclists and other trail users. Strategies:
• Add bike racks to all parks, prioritizing parks near trails or bikeways. • Provide drinking fountains and resting areas in parks that contain trails. • Maintain internal park trails for safe bicycle use. • Work with the Planning and Public Work Department to provide safe bikeways to parks.
Goal 4: Strategically Increase Programming and Partnerships Objective: Establish and promote more special events and local history programs in Oregon City. Strategies:
• Collaborate with local historical organizations to cross‐market and promote existing history programs through website links, program guides, newsletters, and fliers.
• As additional funding is obtaining, establish dedicated city staffing for planning and marketing programming and special events.
• Evaluate the special event, rental, and programming opportunities available at the Carnegie Center when renegotiating lease agreement with current contracted manager in 2009. The City should be aware of not directly competing with existing private businesses or agencies which offer similar services in the community.
• Dedicated staffing and minor renovations to the facility may enable the City to host a wide variety of revenue‐producing special events, concerts, programs, and rentals at this facility.
• Establish a streamlined community special events plan through collaborative efforts between the Oregon City and community partners and organizations, anchored to common goals.
• Investigate the community interest, agency budget capacity, and partnership opportunities for creating new community special events, such as:
o Historical (i.e. ‐pioneer days festival, wagon rides, walking history tours, etc.)
Trail number
Trail name 2004
estimated cost
2007 estimated cost (assumed 3% inflation)
L4 Park Place Trails $92,286 $100,843
L11 Barclay Park Connection $30,181 $32,980
L21 Parks Trail $492,217 $538,623
L23 Wesley Lynn – Chapin Trail $300,413 $328,270
Oregon City, Parks and Recreation Master Plan Update
128
o Arts and Culture (i.e. ‐movies and concerts in the park, art festivals, children’s storytelling, etc.)
o Holiday related (i.e. ‐Halloween haunted forest, egg scrambles, holiday market, etc.) o Health and Wellness (i.e. ‐fun runs and walks, community bike rides, dance contests,
health fairs, etc.) Objective: Strategically Meet the Community’s Demand for New Programs and Services Provide a variety of recreational programming and opportunities to meet the various needs of the community. Strategies:
• Allocate resources to provide quality recreation programming, based on community input. • Gain input from recreation participants through post‐program or event evaluations. • Continue to gain information from the community as to what programs are desired and
popular through a statistically valid survey, at minimum every five years. • Initiate collaborations to provide a greater quantity of diverse, cost effective recreation
programs and activities. • Expand the number of community‐wide and regional special events which should be located
in parks and/or facilities best suited to accommodate the activity/event (i.e. –historical festivals, concerts, etc.)
• Expand fitness and wellness programs for the entire community, with a focus on aquatics and adult programs.
o Consider marketing the cardio and weight facilities at the Pioneer Center to all ages, to better serve the needs of the entire community.
o Provide additional health and wellness programs like yoga, Pilates, and aerobics. • Continue and expand youth learn‐to‐swim programs to meet the interests and safety needs
of the community. • Create additional opportunities for adult and youth “recreational” sports activities (soccer,
basketball, softball, baseball, and swimming programs). Objective: Collaborate to attract more residents and visitors to utilize and participate in Oregon City’s parks and recreation services and facilities Strategies:
• Work with local tourism organizations to attract private recreation companies to the Oregon City area to provide activities such as environmental and wildlife education, tours to nearby attractions, historical tours, guided hiking, and ecotourism.
• Partner with Fine Arts Starts to provide drop‐in single‐session activities such as: art workshops, culinary instruction, gallery tours, instructional dance classes, drama classes, and theatre/film viewings at the Carnegie Center.
• Continue and establish relationships with the following partner organizations to implement the recommendations of this master plan and to provide an increased number of and high quality recreation programs, activities, and services that will attract both residents and visitors:
Oregon City, Parks and Recreation Master Plan Update 129
o Local volunteers o Youth sports associations o Clackamas Community College o Clackamas County Department of Aging o End of the Oregon Trail Interpretive Center o School District o John Inskeep Environmental Learning Center o National Park Service – McLoughlin House National Historic Site o Stevens‐Crawford Museum o Home Orchard Society Arboretum
Objective: Increase Partnerships and Collaborative Efforts Build partnerships within the community to take advantage of existing facilities, share new facilities, and provide additional programming and services to the community. Strategies:
• Continue dialogue between the Parks and Recreation Department and Public Works about the potential for staff sharing for responsibilities such as medians, landscaping, and grounds maintenance.
• Investigate partnerships with local medical and health organizations to increase fitness and health programming for the aging population within the community.
• Create new and formalize existing partnerships (see Sample Partnership Policy in Appendix VIII) with equity agreements that are reviewed annually.
• Strengthen and expand Intergovernmental Agreements (IGA's) with schools for use of fields, gyms, and multipurpose spaces.
• Explore the possibilities of revising and promoting an adopt‐a‐park program to help with park maintenance, beautification, and civic pride.
• Create a “Park Ambassador” program where residents living adjacent to parks are trained to inspect parks and then file a weekly report in exchange for a nominal fee or pass.
Goal 5: Increase Cost Recovery and Funding Objective: Research potential traditional funding opportunities. The City has the ability to use these mechanisms to enhance the quality of life in Oregon City and expand recreation, park, open space, trails, programs, and services to the community. The survey indicated initial support for additional fees and taxes to support current City operations and maintenance needs and to provide desired facilities, parks, trails, programs, and services.
Strategies: • Based on strong positive support from the community survey, work with the City
Commission to establish an additional five dollar maintenance utility fee (per household/per month) to build and operate City parks, recreation, and aquatic facilities. This maintenance utility fee is established for all households for the purpose of assisting in funding the operational and maintenance costs for facilities to enhance the level of service to the community. It is not considered a user fee for services.
Oregon City, Parks and Recreation Master Plan Update
130
• Work with residents and partners to establish additional revenue through a combination of the following sources to implement the recommendations of the Master Plan:
o City maintenance utility fees increase o System Development Charge increase o City sales tax increase o Bond referendum / City property tax o Redirection of existing City funds o Alternative Funding (see Section V‐ C.) o Strategic partnerships o Fees and charges (particularly with athletic associations) o Program grants (see Appendix VII)
• Further investigate support for an education campaign for a ballot initiative to pass a tax increase or bond referendum for future capital improvements.
• Utilize additional funding gained to adequately staff the Department; increasing staffing levels from 11 FTE’s and 40 PTE’s (2007) by 100% over the next five years.
Objective: Pursue alternative funding to implement the Master Plan. Many departments within Oregon City have experienced challenging times in the recent past, with limited funding and staffing levels, and the Department should explore the best means of achieving its funding goals. Alternative funding methods may be instrumental to the operations of the City’s recreation programs and facilities on an ongoing basis. Allocating resources (assigning staff time, matching funds, etc.) to pursue alternative funding should be considered an investment in the future, with an outlined and expected positive rate of return. Strategies:
• Identify opportunities to increase community support and revenue opportunities such as grants, partnerships, sponsorships, volunteers and earned income (see Section V‐C. for Alternative Funding Resources).
• Assign staff resources and/or investigate the possibility of utilizing volunteer efforts to apply for such funding.
• Develop a “Wish List” to identify philanthropic opportunities that align with these needs. Once identified, aggressively apply for grant funding.
• Expand and formalize a volunteer program to include standards, recruiting, training, retaining, and rewarding volunteers in all program areas.
• Create new and formalize existing Sponsorships (see Sample Sponsorship Policy in Appendix IX) with equity agreements that are reviewed annually.
• Create an annual “Sponsorship Manual” listing all the opportunities for the year and distribute within the community in a menu format that creates a sense of urgency within the business community.
• Establish a 501 (c) (3) Parks and Recreation Foundation to facilitate the receipt of grant funds and other fundraising activities.
• Seek collaborations with developers for the Park Place, Beaver Creek, and Cove development projects to include recommended parks and recreation facilities and standards as outlined in the Improve Level of Service Section (Goal 2).
Oregon City, Parks and Recreation Master Plan Update 131
Objective: Create a cost recovery philosophy and policy. It is important for the City to develop a pricing and cost recovery philosophy that reflects the values of the community and the responsibility it has to the community. This philosophy will be especially important if the City moves forward in the development of new programs and additional and/or expanded facilities; and as it strives for sustainability and determines how much it is willing to subsidize operations. One means of accomplishing this goal is applying the Pyramid Methodology. This methodology develops and implements a refined cost recovery philosophy and pricing policy based on current “best practices” as determined by the mission of the agency and the program’s benefit to the community and/or individual. Critical to this philosophical undertaking is the support and understanding of elected officials and ultimately, its citizens. Whether or not significant changes are called for, the agency wants to be certain that it is philosophically aligned with its residents. The development of the core services and cost recovery philosophy and policy is built on a very logical foundation, using the understanding of who is benefiting from parks, recreation, and natural resources services to determine how the costs for that service should be paid. For an overview of the Pyramid Methodology, please review the contents in Appendix VI. Strategies: Develop ongoing systems that help measure cost recovery goals and anticipate potential pitfalls utilizing the following points:
• Understand current revenue systems and their sustainability. • Track all expenses and revenues for all programs, facilities, and services to understand their
contribution to overall department cost recovery. • Analyze who is benefiting from programs, facilities, and services and to what degree they
should be subsidized. • Fees for programs should acknowledge the full cost of each program (those direct and
indirect costs associated with program delivery) and where the program fits on the scale of who benefits from the program of service to determine appropriate cost recovery target. Current cost recovery is at an average level and creating a cost recovery philosophy could enhance revenues to an above average level for operations and maintenance.
• Define direct costs as those that typically exist purely because of the program and change with the program.
• Define indirect costs as those that would exist anyway (like full time staff, utilities, administration, debt service, etc.)
• Define ability to pay as an implementation concern to be addressed through a fee reduction or scholarship program.
• Continue to encourage the pursuit of alternative funding for the Department. Objective: Increase participation and revenue from current services. Strategies:
• Utilize the marketing strategies in the Marketing, Communications, and Credibility section (Goal 6), to work to increase participation numbers and user fee revenue.
Oregon City, Parks and Recreation Master Plan Update
132
• Evaluate participation numbers of current programming so as to increase marketing and participation in programs that are not currently at capacity.
• Establish user fees for adult athletic associations using city recreation facilities that cover all direct costs of the field or facility use. Seek means with youth athletic associations using city facilities that minimally cover the costs of their use.
Goal 6: Marketing, Communications, and Credibility Objective: Generate awareness and credibility about Community Service offerings and needs as expressed by the public. Strategies:
• Formalize an evaluation and annual in‐house benchmarking program to solicit participant feedback and drive programming efforts.
• Collect feedback data that supports the expressed desire for improvements to programs and activities.
• Create a “Mystery Shopper” program where secret shoppers evaluate services anonymously and results are tracked.
• Prepare an annual report providing information to the public about parks and recreation funding, stewardship of tax dollars and fees and charges, and distribute the report as widely as possible.
• Work with the Chamber of Commerce and the local Welcome Wagon to develop information packets that promote city services to tourists and new residents.
• Create an annual marketing plan for the Community Services Department. • Develop an evaluation process for marketing media such as newspaper, seasonal brochures,
website, direct mail, targeted e‐mails, radio, and television advertising to continuously determine effectiveness of marketing dollars.
• Create seamless product delivery for park and recreation services that delivers from a consumer vantage.
Objective: Create a seamless and cohesive customer service delivery system for the provision of all community services programs and services regardless of the location. Strategies:
• Continue expanding current registration system to a fully integrated fax, on‐line, and phone registration system.
• Network the registration system into all Community Services facilities for ease of registration for patrons.
• Develop a comprehensive cross training program for all staff and instructors including knowledge of all program areas as well as customer service.
• Use program tracking and evaluation tools to capacity by designing reports to readily identify life cycles of programs, identify programs not meeting minimum capacity (review all program minimums for cost effectiveness), identify waiting lists, etc.
Oregon City, Parks and Recreation Master Plan Update 133
Goal 7: Track Performance Measures Objective: Create standards for all community services activities and services. Strategies: Establish service standards for all community services activities. Suggested criteria for service standards include:
• Programs: o Participation levels o Revenue o Instructors o Customer satisfaction o Cost per experience (or per hour, per class) o Customer retention
• Instructors: o Experience o Knowledge o Friendliness o Recruiting o Rewarding o Training o Standards
• Volunteers: o Experience o Knowledge o Friendliness o Recruiting o Rewarding o Training o Standards
• Facilities: o Cleanliness o Aesthetics o Comfort
• Staff: o Experience o Knowledge o Friendliness o Rewarding o Training o Trends
Strategies:
• Identify all major maintenance tasks including such things as: o Turf /Mowing o Plantings o Restrooms
Oregon City, Parks and Recreation Master Plan Update
134
o Sidewalks and paths o Irrigation o Weed and insect control o Curb appeal o Playground and picnic equipment o Courts and fields o Litter control
• Evaluate and develop a scoring system for each task to meet desired service levels. • Involve staff in the development of the standards and scoring system. • Conduct maintenance standards training for all staff. • Establish and monitor recordkeeping procedures to document the actual hours and
materials costs for each maintenance operation. • Apply appropriate maintenance standards and define set up/tear down requirements for all
special events, tournaments, or other activities that currently stress resources. Assure adequate staffing and funding to take on the task, prior to making a commitment.
Goal 8: Sustainability
Objective: Follow the defined goals and adopted policies for sustainability set forth by the City Commission as this five‐year Plan is implemented. A sustainability effort within all city departments is a top priority of the City Commission. The City of Oregon City defines sustainability as “Sustainable development is development that meets the needs of the present without compromising the ability of future generations to meet their own needs.” This entire Plan Update is founded in sustainability in that it has a realistic five‐year implementation plan and strongly addresses the need to take care of that which we already have (e.g. deferred maintenance, and having a plan to maintain that in which we build). See recommendations for additional maintenance staff and resources (Goal 2).
Strategies: • Refer to and implement “The U. S. Mayors’ Climate Protection Agreement” adopted by the
City of Oregon City Commission in January of 2007 wherever possible. • Implement the Oregon Recreation and Parks VIP Strategic Plan (Vision) that has goals which
address natural resource protection, public resource stewardship, cultural resources, economic development, and other sustainability related practices.
• Continue current sustainability practices in progress including: o Using alternative energy sources when possible o Minimize vehicle use o Recycle wherever possible o Minimize printing, utilize efficient printing practices o Use file sharing practices o Turn off all unnecessary electrical uses such as calculators, radios, etc. o Unplug chargers when not in use o Utilize Energy Saver features on machines when possible o Utilize biodegradable or recycled products where possible o Install motion sensor light switches in all buildings o Replace non‐energy efficient lights with fluorescent lights
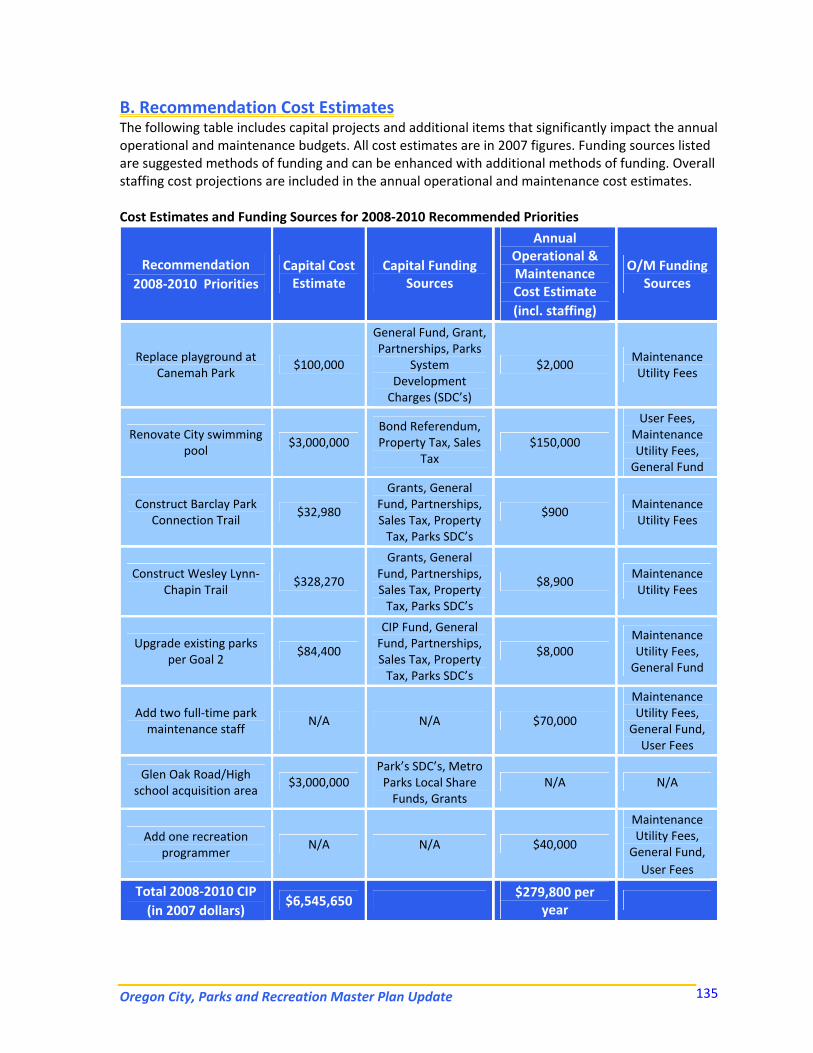
Oregon City, Parks and Recreation Master Plan Update 135
B. Recommendation Cost Estimates The following table includes capital projects and additional items that significantly impact the annual operational and maintenance budgets. All cost estimates are in 2007 figures. Funding sources listed are suggested methods of funding and can be enhanced with additional methods of funding. Overall staffing cost projections are included in the annual operational and maintenance cost estimates. Cost Estimates and Funding Sources for 2008‐2010 Recommended Priorities
Recommendation 2008‐2010 Priorities
Capital Cost Estimate
Capital Funding Sources
Annual Operational & Maintenance Cost Estimate (incl. staffing)
O/M Funding Sources
Replace playground at Canemah Park
$100,000
General Fund, Grant, Partnerships, Parks
System Development Charges (SDC’s)
$2,000 Maintenance Utility Fees
Renovate City swimming pool
$3,000,000 Bond Referendum, Property Tax, Sales
Tax $150,000
User Fees, Maintenance Utility Fees, General Fund
Construct Barclay Park Connection Trail
$32,980
Grants, General Fund, Partnerships, Sales Tax, Property Tax, Parks SDC’s
$900 Maintenance Utility Fees
Construct Wesley Lynn‐Chapin Trail
$328,270
Grants, General Fund, Partnerships, Sales Tax, Property Tax, Parks SDC’s
$8,900 Maintenance Utility Fees
Upgrade existing parks per Goal 2
$84,400
CIP Fund, General Fund, Partnerships, Sales Tax, Property Tax, Parks SDC’s
$8,000 Maintenance Utility Fees, General Fund
Add two full‐time park maintenance staff
N/A N/A $70,000
Maintenance Utility Fees, General Fund, User Fees
Glen Oak Road/High school acquisition area
$3,000,000 Park’s SDC’s, Metro Parks Local Share Funds, Grants
N/A N/A
Add one recreation programmer
N/A N/A $40,000
Maintenance Utility Fees, General Fund, User Fees
Total 2008‐2010 CIP (in 2007 dollars)
$6,545,650 $279,800 per
year
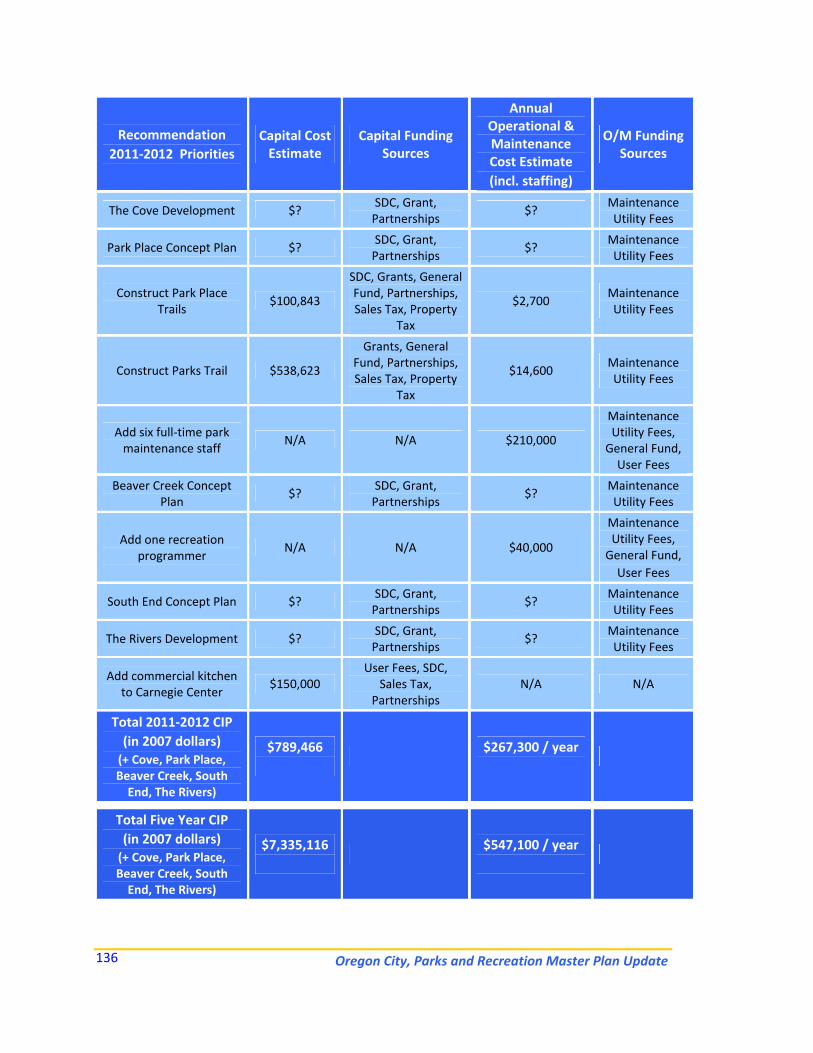
Oregon City, Parks and Recreation Master Plan Update
136
Recommendation 2011‐2012 Priorities
Capital Cost Estimate
Capital Funding Sources
Annual Operational & Maintenance Cost Estimate (incl. staffing)
O/M Funding Sources
The Cove Development $? SDC, Grant, Partnerships
$? Maintenance Utility Fees
Park Place Concept Plan $? SDC, Grant, Partnerships
$? Maintenance Utility Fees
Construct Park Place Trails
$100,843
SDC, Grants, General Fund, Partnerships, Sales Tax, Property
Tax
$2,700 Maintenance Utility Fees
Construct Parks Trail $538,623
Grants, General Fund, Partnerships, Sales Tax, Property
Tax
$14,600 Maintenance Utility Fees
Add six full‐time park maintenance staff
N/A N/A $210,000
Maintenance Utility Fees, General Fund, User Fees
Beaver Creek Concept Plan
$? SDC, Grant, Partnerships
$? Maintenance Utility Fees
Add one recreation programmer
N/A N/A $40,000
Maintenance Utility Fees, General Fund, User Fees
South End Concept Plan $? SDC, Grant, Partnerships
$? Maintenance Utility Fees
The Rivers Development $? SDC, Grant, Partnerships
$? Maintenance Utility Fees
Add commercial kitchen to Carnegie Center
$150,000 User Fees, SDC,
Sales Tax, Partnerships
N/A N/A
Total 2011‐2012 CIP (in 2007 dollars) (+ Cove, Park Place, Beaver Creek, South End, The Rivers)
$789,466
$267,300 / year
Total Five Year CIP (in 2007 dollars) (+ Cove, Park Place, Beaver Creek, South End, The Rivers)
$7,335,116
$547,100 / year