Embed Size (px)
Citation preview

City of Salem, Oregon
Urban Renewal Agency of The
City of Salem, Oregon
(A Component Unit of the City of Salem, Oregon)
For
Fiscal Year
Ended
June 30,
2017

Prepared by the City Manager’s Office – Budget and Finance Division
URBAN RENEWAL AGENCY OFTHE CITY OF SALEM, OREGON
(A Component Unit of the City of Salem, Oregon)
ANNUAL
FINANCIAL
REPORT
For the Fiscal Year Ended
June 30, 2017
i
URBAN RENEWAL AGENCY OF THECITY OF SALEM, OREGON
TABLE OF CONTENTS
Page
AGENCY OFFICIALS.....................................................................................................................1
MAPS OF URBAN RENEWAL AREASRiverfront/Downtown ....................................................................................................................2Fairview ........................................................................................................................................3North Gateway..............................................................................................................................4West Salem ..................................................................................................................................5Mill Creek Industrial Park..............................................................................................................6McGilchrist....................................................................................................................................7South Waterfront ..........................................................................................................................8
INDEPENDENT AUDITOR’S REPORT..........................................................................................9
MANAGEMENT’S DISCUSSION AND ANALYSIS.......................................................................13
BASIC FINANCIAL STATEMENTSGovernment-wide Financial Statements
Statement of Net Position........................................................................................................23Statement of Activities.............................................................................................................24
Fund Financial StatementsGovernmental Funds
Balance Sheet.......................................................................................................................25Statement of Revenues, Expenditures, and Changes in Fund Balances –
Governmental Funds .........................................................................................................26Reconciliation of the Statement of Revenues, Expenditures, and Changes in
Fund Balances of Governmental Funds to the Statement of Activities ..............................27Proprietary Fund
Statement of Net Position......................................................................................................28Statement of Revenues, Expenses, and Changes in Net Position........................................29Statement of Cash Flows ......................................................................................................30
Notes to the Financial Statements..............................................................................................33

i i
SUPPLEMENTARY INFORMATIONGovernmental FundsSchedule of Revenues, Expenditures, and Changes in Fund Balances –Budget and Actual - Governmental Funds............................................................................. 47
Debt Service FundCombining Balance Sheet ..................................................................................................... 49Combining Schedule of Revenues, Expenditures, and Changes in Fund Balances .............. 51Schedule of Revenues, Expenditures, and Changes in Fund Balance – Budget and ActualRiverfront/Downtown ........................................................................................................... 53Fairview ............................................................................................................................... 54North Gateway..................................................................................................................... 55West Salem ......................................................................................................................... 56Mill Creek Industrial Park..................................................................................................... 57McGilchrist ........................................................................................................................... 58South Waterfront.................................................................................................................. 59
Capital Projects FundCombining Balance Sheet ..................................................................................................... 61Combining Schedule of Revenues, Expenditures, and Changes in Fund Balances .............. 63Schedule of Revenues, Expenditures, and Changes in Fund Balance –Budget and ActualRiverfront/Downtown ........................................................................................................... 65Fairview ............................................................................................................................... 66North Gateway..................................................................................................................... 67West Salem ......................................................................................................................... 68Mill Creek Industrial Park..................................................................................................... 69McGilchrist ........................................................................................................................... 70South Waterfront.................................................................................................................. 71
Schedule of Expenditures by Project – Budget and Actual.................................................... 72Proprietary Fund
Schedule of Revenues, Expenditures, and Changes in Fund Balance – Budget and ActualSalem Convention Center...................................................................................................... 74
AUDIT COMMENTSAudit Comments and Disclosures Required by State Regulations.............................................. 76
Title VI Disclosure
It is the policy of the Urban Renewal Agency of the City of Salem (URA) to assure that no person shall bediscriminated against on the grounds of race, religion, color, sex, marital status, familial status, national origin,age, mental or physical disability, sexual orientation, gender identity and source of income. The URA also fullycomplies with Title VI of the Civil Rights Act of 1964, and related statutes and regulations, in all programs andactivities.

URBAN RENEWAL AGENCY OF THE CITY OF SALEM
AGENCY OFFICIALS
TermExpires
Ward No. Name December 31,
Mayor Chuck Bennett 2018
1 Cara Kaser 2020
2 Tom Andersen 2018
3 Brad Nanke 2020
4 Steve McCoid 2018
5 Matt Ausec 2020
6 Chris Hoy 2018
7 Sally Cook 2020
8 Jim Lewis 2018
ADMINISTRATIVE STAFF
Executive Director: Steve PowersUrban Development Department Director: Kristin Retherford
City of Salem555 Liberty St SE, Room 230
Salem, OR 97301-3513
1

WILL
AMET
TERIV
ER
SALEMDALLAS
HW
NW
LIB
ER
TY
ST
NE
FR
ON
T S
T N
E
SALEM DALLAS HW
CO
TT
AG
E S
T N
E
STATE ST
MADISON ST NE
UNION ST NE
WA
TE
R S
T N
ELIB
ER
TY
ST
SE
DIVISION ST NE
E ST NE
LIBERTY S
T NE
CO
MM
ER
CIA
L S
T N
E
FERRY ST SE
D ST NEC
HU
RC
H S
T S
E
SOUTH ST NE
MARKET ST NE
VA
N S
T N
W
CENTER ST NE
WA
LLA
CE
RD
NW
JEFFERSON ST NE
BR
OA
DW
AY
ST
NE
WIN
TE
R S
T S
E
CO
MM
ER
CIA
L S
T N
E
OAK ST SE
EDGEWATER S
T NW
TAGGART DR NW
1ST ST N
W
WAT
ER
ST
NE
COURT ST NE
WIN
TE
R S
T N
E
HIG
H S
T N
E
MILL ST SE
BELMONT ST NE
HOOD ST NE
WB
WALLACE
RDRP
CH
UR
CH
ST
NE
CO
MM
ER
CIA
L S
T S
E
NORWAY ST NE
5T
H A
V N
W
BELLEVUE ST SE
4T
H S
T N
E
SALEMDALLAS HW
NW
DIVISION ST NE
GLEN CREEK RD NW
CHEMEKETA ST NE
GAINES ST NE
OAK ST SE
BELLEVUE ST SE
HIG
H S
T S
E
CO
TT
AG
E S
T S
E
CA
PIT
OL S
T N
E
VEALL LN NW
CALICO ST NW
12
TH
ST
NE
SU
MM
ER
ST
NE
CH
UR
CH
ST
NE
WA
VE
RLY
ST
NE
MARION ST NE
D ST NE
CALICO ST NW
TRADE ST SE
MILL ST SE
PR
ING
LE
PY
SE
CO
RN
UC
OP
IA S
T N
W
MUSGRAVE LN NW
LAR
ME
RAV
NE
12
TH
ST
SE
12
TH
ST
SE
PR
ING
LE
PY
SE
CAMEO ST NW
CO
MM
ER
CIA
L S
T N
E
EB FRONT S T
RP
FRONT CP NE
5T
H S
T N
ETAYBIN RD NW
BA
RT
EL
LD
RN
W
FR
ON
T S
T S
E
EB
FR
ON
TS
TR
P
City of SalemRiverfront-DowntownUrban Renewal Area
Map Legend
Riverfront-Downtown Urban Renewal Area
Water
Streets
O
This map was created from various sources and is neither a legally
recorded map nor a survey and is not intended to be used as such.
No warranty as to correctness is expressed or implied.
0 1,600800Feet
Established: May 1975Acreage: 290 Acres
N:\PW\UD\urban_renewal_areas\Riverfront-Downtown\Riverfront-Downtown-Area.mxd
2

McNary FieldSalem Airport
AERIA L WY SE
FAIRVIEWIN
DUSTR
IAL
DR
SE
NB
INTERSTA
TE5
FW
Taxi la
ne
Taxi l
ane
MAD
RO
NA A
V SE
NB
KU
EBLE
R
BV
RP
THOREAU AV SE
BATTLECREEK
RDSE
EWALD AV SE
COU STE
AU
DR
SE
19TH ST SE
Taxi lane L8
Taxi lane L6
Taxi lane L7
ST
RO
NG
RD
SE
TU
RN
ER
RD
SE
25
TH
ST
SE
ED
WA
RD
DR
SE
Taxi lane L4
SB
KU
EBLERBV
RP
EDW
AR
DD
RS
E
Taxi lane T9
RE
ED
RD
SE
RIT
ING
CT
S
E
PILGRIMST
SE
Taxi lane T14
Taxi lane T10
Taxi lane T11
Taxi lane T12
Taxi lane T13
22
ND
ST
SE
Taxi lane T15
Taxi lane
Taxi lane
MARIETTA ST SE
EW
ALD
AV S
E
VISTA AV SE
27
TH
CT
SE
MARIETTA ST SE
OLD
STR
ONG
RD
SE
AIRW
AY DR S
E
Ta
xi
lane
19
TH
ST
SE
27
TH
AV
SE
LIN
DBU
RG
RD
SE
AVIATION
LPS
E
AERIAL WY SE
City of SalemFairviewUrban Renewal Area
Map Legend
Fairview Urban Renewal Area Boundary
Water
Streets
O
This map was created from various sources and is neither a legally
recorded map nor a survey and is not intended to be used as such.
No warranty as to correctness is expressed or implied.
0 2,0001,000Feet
Established: June 1984Acreage: 390 Acres
N:\PW\UD\urban_renewal_areas\Fairview\Fairview-Area.mxd
3

FIS
HE
R R
D N
E
BLOSSOM DR NE
TO
NI A
V N
VE
RD
A L
N N
E
PO
RT
LA
ND
RD
NE
FAIR
GR
OUNDS
RD
NE
CANDLEWOOD DR NE
HA
ZE
L A
V N
E
PA
RK
AV
NE
EVANS AV N
PINE ST NE
SILVERTON RD NE
NORTHGATE AV NE
HICKORY ST NE
MANBRIN DR N
WIL
LIA
MS
AV
NE
LOCUST ST NE
GARLAND WY N
WEEKS DR N
PLE
AS
AN
TV
IEW
DR
NE
HOLLYHOCK PL N
MA
INE
AV
NE
SOUTHST
NE
RIV
ER
RD
N
ALDER DR NE
BR
OA
DW
AY
ST
NE
TRYON AV NE
2N
D A
V N
GA
RY
ST N
E
CH
UR
CH
ST
NE
LYNN ST NE
CLAXTER RD NE
CE
DA
R A
V N
FIL
BE
RT
ST
NE
ACADEMY ST NE
FA
IRH
AV
EN
AV
NE
PO
TT
S D
R N
E
WATSON AV NE
SA
LEM
PY
NE
RO
BE
RT
AV
NE
BY
RA
M S
T N
E
CUMMINGS LN N
CLEARVIEW AV NE
BR
OA
DW
AY
ST
NE
AR
NO
LD
ST
NE
LO
WE
LL A
V N
E
MANBRIN DR NE
BE
AC
ON
ST
NE
TROY ST N
E
GLENDALE AV NE
KEEN AV NE
WAYSIDE TR NE
EV
EC
TN
E
WOODROW ST NE
DAWN ST NE
EV
ER
GR
EE
N A
V N
E
GR
EE
NB
RIA
R S
T N
E
19T
HP
LN
E
CARLETON WY NE
HAMMEL ST NE
5T
H S
T N
E
BY
RA
M S
T N
E
LEO ST N
E
SUNNYVIEW RD NE
HA
ZE
L A
V N
E
MADISON ST NE
32
ND
AV
NE
AL
AM
ED
A S
T N
E
HYACINTH ST NE
CARLETON WY NE
EL
LIE
CT
NE
CHESTER AV NE
BRANDON AV NE
31S
TAV
NE
LIVINGSTON ST NE
BIR
CH
AV
N
HICKORY ST NE
IVY WY NE
AR
LE
TA
AV
NE
BE
AC
ON
ST
NE
31
ST
AV
NE
SPRUCE ST NE
ADAM CTNE
TAND EM
AV
NE
TIN
Y C
T N
E
CARLETON WY NE
SHADY LN NE
LEO ST N
E
CLA
RK
AV
NE
CH
ER
RY
AV
NE
FOUR POINT ST NE
WIESSNER DR NE
WOODWARDST
NE
LA
UR
EL A
V N
E
KA
RM
LN
NE
CH
UR
CH
ST
NE
5T
H S
T N
E
3R
DA
VN
SMITH ST NE
STORTZ AV NE
FLORENCE AV NE
WA
LN
UT
AV
NE
HA
WK
OS
PR
EY
EA
GL
E
EDGEWOOD AV NE
MA
PLE
AV
NE
CR
AN
E
WATSON AV NE
BR
OA
DW
AY
ST
NE
AB
RA
MS
AV
NE
ANGIE WY NE
RAVEN
BEVERLY AV NE
FALCONHERON
OWL
WILTON AV NE
HONEYSUCKLE WY NE
GARDEN CT N
E
NAN
DA
LE
DR
NE
FINALE CT NE
NIL
ES
AV
NE
GREENWOOD DR NE
LIL
AC
LN
NE
MON ARCH DR NE
MA
RC
I AD
R NE
SA
LE
MIN
DU
ST
RIA
LD
RN
E
25TH
AVN
E
MAIN
LIN
ED
RN
E
STARR CT NE
DONNAAV
NE
WOODDALE AV NE
JOHNS ON
ST NE
BLILER AV NE
SUNSET AV N
WEEKS DR NE
HA
DL
EY
ST
NE
35
TH
PL NE
MCDONALD S T NE
JUEDES AV N
1 3
TH
AV
NE
BEVER DR NE
SHANGRI LA AV NE
HICKORY ST NE
KATHLEEN AV NE
NO
ON
AV
NE
SB
INT
ER
STA
TE
5F
WN
BIN
TE
RS
TA
TE
5F
W
LINDA AV NE
MAINE AV NE
CADE ST NE
BEACH AV NE
IND
US
TR
IAL W
Y N
E
AUTO GROUP AV NE
22
ND
AV
NE
PA
RK
AV
NE
RING ST NE
DIETZ AV NE
SA
LE
MIN
DU
ST
RIA
LD
RN
E
PLYMOUTH DR NE
BILL FREY DRNE
HIGHW
AY AV NE
SB
PO
RT
LA
ND
RD
RP
SB
PO
RT
LA
ND
RD
RP
DU
NC
AN
AV
NE
PO
RT
LA
ND
RD
NB R P
RID
GE
DR
NE
32
ND
PL
NE
CH
ER
RY
AV
NE
CH
ER
RY
AV
NE
ST
ILLW
AT
ER
DR
NE
BR
OO
KS
AV
NE
AR
BO
N S
T N
E
12
TH
AV
NE
18
TH
AV
NE
SA
ND
RA
AV
N
WA
RD
DR NE
WA
RD
DR
NE
ST
RA
W D
R N
30
TH
AV
NE
ED
DY
AV
NE
32N
DP
LN
E
NO
RT
HS
IDE
DR
NE
PA
NT
HE
R C
T N
E
17
TH
ST
NE
WO
O
DWA
RD
CT
NE
ODESSA LN NE
HA
RC
OU
RT
AV
NE
CLAXTER RD NE
CLA
XT
ER
RD
NE AS
TO
RIA
ST
NE
HA
WT
HO
RN
E A
V N
E
HA
WT
HO
RN
E A
V N
E
MY
RT
LE
AV
NE
BR
OO
KS
AV
NE
MA
PLE
AV
NE
DE
L
WEBB
AVNE
C
LA
XT
ER
CT
NE
SU
S
AN CT NE
APPLEBLOSSOM AV NE
KA
CE
YC
RN
E
BIL
LF
RE
YD
RN
E
LANA AV NE
City of SalemNorth GatewayUrban Renewal Area
Map Legend
North Gateway Urban Renewal Area Boundary
Streets
Water
O
This map was created from various sources and is neither a legally
recorded map nor a survey and is not intended to be used as such.
No warranty as to correctness is expressed or implied.
0 2,8001,400Feet
Established: December 1990Acreage: 926 Acres
N:\PW\UD\urban_renewal_areas\North Gateway\North-Gateway-Area.mxd
4

WILLAMETTE RIVER
FR
ON
T S
T N
E
UNION ST NE
FR
ON
T S
T N
E
6TH ST NW
GLEN CREEK RD NW
KIN
GWOOD
DRN
W
WAT
ER
ST
NE
STATE ST
FERRY ST SE
GE
RT
H A
V N
W
CHAPMAN HILL DR NW
MISSION ST SE
WA
LLA
CE
RD
NW
MISSION ST S
PA
TT
ER
SO
N S
T N
W
PA
RK
WA
Y D
R N
W
ORCHARDHEIGHTS
RDNW
BONNIE WY NW
HIG
H S
T S
E
MU
RLA
RK
AV
NW
HILLTOP DR NW
SALEMDALLAS
HW
NW
LIB
ER
TY
ST
SE
EDGEWATER S
T NW
1ST ST N
W
EOLA
DR
NW
COURT ST NE
WILLIE WY NW
CO
MM
ER
CIA
L S
T S
E
TRADE ST SE
WE
ST
WY
NW
WB
WALLACE
RDRP
SE
NA
TE
ST N
W
LUPINLN NW
ELM ST NW
KA
RE
NW
YN
W
FIR
ST
S
TA
G
G ART DR NW
LESLIE ST SE
5T
H A
V N
W
PLAZA ST NW
BUSH ST S
SIL
AS
CT
NW
LARKSPUR LN NW
CARDINAL ST NW
OVERVIEW ST NW
OAK ST SE
8THST
NW
KEARNEY ST S
LON
GVIE
W W
Y NW
BUSH ST SE
FAIRO
AKSW
YNW
MILL ST SE
RU
MSEY
RD
NW
KEARNEY ST SE
IRIS LN NW TULIP LN NWOLYMPIA CT NW
NONA AV NW
VEALL LN NW
MOYER LN NW
CALICO ST NW
7TH ST NW
WESTBROOK
DR
NW
OAK ST SE
FR
ON
TS
TS
E
CR
ES
CE
NT D
R N
W
RUGE ST NW
3RD ST NW
9TH ST NW
2ND ST N
W
2NDST NW
PLAZA ST NW
BE
LA
IRE
DR
NW
LO
TT
IELN
NW
ES
TA
TE
CT
NW
PTARMIGAN ST NW
2N
DST
NW
DO
RV
AL A
V N
W
URBAN LN NW
CO
RN
UC
OP
IA S
T N
WBA
RN
AB
AS
ST
NW
RUGE ST N
W
ELM ST N
W
3RD ST N
W
MUSGRAVE LN NW
AL
PIN
E D
R N
W
2ND ST N
W
GLE
NV
IEW
WY
NW 9TH ST NW
KE
NA
RD
ST
NW
VA
LL
EY
VIE
W A
V N
W
BASSETT ST NW
CAMEO ST NW
14T
HAV
NW
OV
ER
LO
OK
AV
NW
VA
LL
EY
VIE
W A
V N
W
TE
RR
AC
EDR
NW
WB
ROSEMONT AV RP
RO
SE
MO
NT
AV
NW
CASCADE
DR
NW
SU
NBU
RSTTR
NW
TAYBIN RD NW
VIE
W D
R N
W
LUPIN LN NW
GE
AR
HA
RT
AV
NW
PIE
DM
ON
TAV
NW
FR
ON
TS
TS
E
LARK SPUR LN NW
PORTER
LN
NW
CH
ES
TNUT ST NW
BE
AU
MO
UN
TD
RN
W
LEFOR DR
NW
ARTH
UR
W
YNW
EB
FR
ON
TS
TR
P
PA
LI D
R N
W
City of SalemWest SalemUrban Renewal Area
Map Legend
West Salem Urban Renewal Area Boundary
Streets
Water
O
This map was created from various sources and is neither a legally
recorded map nor a survey and is not intended to be used as such.
No warranty as to correctness is expressed or implied.
0 2,0001,000Feet
Established: August 2001Acreage: 451 Acres
N:\PW\UD\urban_renewal_areas\West Salem\West-Salem-Area.mxd
5

McNary FieldSalem Airport
LA
NC
AS
TE
RD
RS
E
DURBIN AV SE
49T
HA
VS
E
FAIR
VIEW
IND
US
TR
IAL
DR
SE
KU
EB
LE
R B
V S
E
AUM
SVILLE
HW
SE
NB
INT
ER
STA
TE
5F
W
NORTH SANTIAM HW SE
PENNSYLVANIAAV SE
BECK AV SE
BENHAM AV SE
MANGOAV
SE
GLENWOOD DR SE
SADD
LE CLU
B ST S
E
SHADOW LN SE
MACLEAY RD SE
CRANSTON ST SE
MACLEAY RD SE
WILDCHERRYDR SE
WA
IKIK
I ST S
E
RICKEY ST SEMUNKERS ST SE
BAYO
NNE DR SE
HAGERS GROVE RDS
E
COOLIDG
ED
RS
E
BABCOCK WY SE
CULV
ER D
R S
E
BOONE RD SE
SISKYOU AV SE
CO
NN
EC
TIC
UT
ST
SE
ELK
CT S
E
BOONE RD SE
BO ULD
ER
DR
SE
BR
INK
AV
SE
ED
ENST
SE
MARIETTA ST SE
HAGER ST SE
ME
AD
OW
LA
WN
DR
SE
SE
RE
NIT
YD
RS
E
BUFFALODR
SE
JOSEPHST SE
56T
HC
TS
E
DEER
PARK
DR
S
E
GLE
NW
OOD LP SE
TRELSTAD AV SE
HA
WT
HO
RN
EAV
SE
WITTEN ST SE
32N
DA
VS
E
SYLVIA ST SE
GAFF
IN R
D S
E
VIN
CA
ST
SE
SYLVIA CT SE
MEADOWLAWN LP SE
TIMBET DR SE
CAR
ME
L DR
SE
AIR
PO
RT
RD
SE
CAMPBELL DRSE
54
TH
CT
SE
JE
NN
ICHES
LN
SE
GAIA
ST S
E
MO
NT
EG
O L
N S
E
SB
KU
EB
LE
RB
VR
P
LITCHFIELD
PL SE
KASHMIR WY SE
DEP
OT C
T SE
37TH
AV
SE
LANGLEY ST SE
NB
NO
RT
HS
AN
TIA
MH
WRP
AIRWAY DR SE
TURNER RD SE
36
TH
AV
SE
AR
AB
IAN
AV
SE
LA
ND
ON
ST
SE
SB
INT
ER
STA
TE
5 F
W
SB
INT
ER
STA
TE
5F
W
49
TH
AV
SE
46
TH
PL
SE
46
TH
PL
SE
JEN
AH
ST SE
CO
NN
EC
TIC
UT
AV
SE
SH
ENANDO
AH
DR
SE
GATH RD SE
40T
HP
LS
E
EA
ST
LA
ND
AV
SE
EA
ST
LA
ND
AV
SE
MU
NK
ER
SC
TS
E
CO
RD
ON
RD
SE
CO
RDO
N R
D S
E
CAPLINGER
RD SE
ESSEX ST S
E
MA
RK
CT
SE
32
ND
AV
SE
ELLIS
ON
SW
YSE
46
TH
AV
SE
45T
HP
LS
E
SBN
OR
TH
SA
NTIA
MH
WR
P
NB
KU
EB
LE
RBV
R
P
JUN
TUR
A
AV SE
OAKLANDLP
SE
ME
AD
O
W
LAW
NLP
SE
CH
RIS
MA
NL
NS
E
NB
KU
EB
LE
RBV
RP
RYAN DR SECity of SalemMill CreekUrban Renewal Area
Map Legend
Mill Creek Urban Renewal Area Boundary
Streets
Water
O
This map was created from various sources and is neither a legally
recorded map nor a survey and is not intended to be used as such.
No warranty as to correctness is expressed or implied.
0 4,0002,000Feet
Established: May 2005Acreage: 828 Acres
N:\PW\UD\urban_renewal_areas\Mill Creek\Mill-Creek-Area.mxd
6

FAIRVIEW AV SE
12
TH
ST
SE
MISSION ST SE
21S
TS
TS
E
CROSS ST SE
22
ND
ST
SE
PE
CK
AV
SE
BE
RR
Y S
T S
E
OXFORD ST SE
RATCLIFF DR SE
LEFFELLE ST SE
WILBUR ST SE
RURAL AV SE
13
TH
ST
SE
MILL ST SE
Taxi la
ne
22
ND
ST
SE
18
TH
ST
SE
CROSS ST SE
Taxi la
ne
13T
HS
TS
E
HOWARD ST SE
FO
RD
ST
SE
23
RD
ST
SE
MISSION ST SE
ED
WA
RD
DR
SE
16
TH
ST
SE
FO
RD
ST
SE
15
TH
ST
SE FO
RD
ST
SE
MCGILCHRIST ST SE
25TH
ST S
E
OAK ST SE
WILBUR ST SE
OXFORD ST SE
9T
H C
T S
E
YE
W S
T S
E
DA
VID
SO
N S
T S
E
Taxi lane L2
MCGILCHRIST ST SECANNONSTSE
SIMPSON ST SE
LEE ST SE
Taxi lane L8
RA
YN
OR
ST
SE
YE
W S
T S
E
Taxi lane L5
Taxi lane L6
WALLER ST SE
Taxi lane L7
22
ND
ST
SE
LESLIEST SE
MADRONA AV SE
LESLIE ST SE
TRIPP ST SE
18
TH
ST
SE
LEE ST SE
17
TH
ST
SE
HOWARD ST SE
LEE ST SE
SHELTON ST SE
HOYT ST SE
HINES ST SE
HEATHER LN SE
MORNINGSIDE ST SE
FO
RD
ST
SE
DOUGLAS AV SE
LEWIS ST SE
SALISHAN ST SE
13
TH
PL
SE
HOYT ST SE
16
TH
ST
SE
WALLER ST SE
Taxi lane L4
YE
W S
T S
E
HOWARD ST SE
20
TH
ST
SE
CROSS ST SE
MORNINGSIDE DR SE
20
TH
ST
SE
RIC
HM
ON
D A
V S
E
LEWIS ST SE
23
RD
ST
SE
MCGILCHRIST ST SE
LEE ST SE
HYDE CT SE
WOODACRE DR SE
VISTA AV SE
OXFORD ST SE
RURAL AV SE
LEE ST SE
HYDE ST SE
CLAUDE ST SE
TOWNSEND WY SE
ADAMS ST SE
Taxi lane T14
PEACE ST SE
SIMPSON ST SE
STATE ST
LEE ST SE
FURRIER LN SE
SIMPSON ST SE
HELM ST SE
Taxi lane T12
TRADE ST SE
OXFORD ST SE
DAVCOR ST SE
Taxi lane T13
HEATHER LN SE
GEORGIA AV SE
HILLENDALE DR SE
22
ND
ST
SE
Taxi lane T15
22
ND
ST
SE
Taxi lane
Taxi lane
EW
ALD
AV S
E
19TH ST SE
UN
IVE
RS
ITY
ST
SE
JUDSON ST SE
VISTA AV SE
16T
HS
TS
E
Taxilan
e
24
TH
ST
SE
25
TH
ST
SE
25
TH
ST
SE
12TH
MISSION RP SE
BLU
FF
AV
SE
BL
UF
F A
V S
E
14
TH
ST
SE
24
TH
ST
SE
PR
ING
LE
RD
SE
PR
I NG
LE
RD
SE
23R
DST
SE
23
RD
ST
SE
19
TH
ST
SE
VISTA AV SE
19
TH
ST
SE
23
RD
ST
SE
PH
EA
SA
NT
AV
SE
MARILYN ST SE
BLUFF
AV
SE
12
TH
PL
SE
AVIATION
LPS
E
PE
NC
E
LP SE
AERIAL WY SE
City of SalemMcGilchristUrban Renewal Area
Map Legend
McGilchrist Urban Renewal Area Boundary
Streets
Water
O
This map was created from various sources and is neither a legally
recorded map nor a survey and is not intended to be used as such.
No warranty as to correctness is expressed or implied.
0 2,0001,000Feet
Established: September 2006Acreage: 437 Acres
N:\PW\UD\urban_renewal_areas\McGilchrist\McGilchrist-Area.mxd
7

WILLAMETTE RIVER
SA
GIN
AW
ST
S
PA
TT
ER
SO
N S
T N
W
RO
SE
MO
NT
AV
NW
STATE ST
GE
RT
H A
V N
W
FA
IRM
OU
NT
AV
S
MYERS ST S
EDGEWATER S
T NW
HIG
H S
T S
E
MISSION ST S
9TH ST NW
SALEMDALLAS
HW
NW
OAK ST SE
VA
N S
T N
W
MU
RLA
RK
AV
NW
WA
LLA
CE
RD
NW
6THST
NW
FA
IRM
OU
NT
AV
S
1ST ST N
W
7TH ST N
W
ELM ST NW
EB
ROSEMON
TAV
RP
WB
WALLACE
RDRP
FR
ON
T S
T N
E
CROSS ST SE
RUGE ST NW
EDGEWATER RP NW
LESLIE ST SE
PLAZAST NW
BUSH ST S
8TH ST NW
MILLER ST S
3RD ST NW
CO
MM
ER
CIA
L S
T S
E
WATE
RS
TN
E
OAK ST SE
JO
HN
ST
S
KEARNEY ST S
BUSH ST SE
MILLER ST SE
FRANKLIN ST NW
KEARNEY ST SE
MYERS ST SE
LEFFELLE ST S
OWENS ST S
WILSON ST SWILSON ST SE
LEFFELLE ST SE
OWENS ST SE
MISSION ST SE
SALEMDALLAS HW
NW
FR
ON
TS
TSE
3RD ST NW
2ND ST N
W
2NDST
NW
PLAZA ST NW
2ND
ST
NW
EB
FR
ON
TS
TR
P
RUGE ST N
W
ELM ST N
W
3RD ST N
W
MUSGRAVE LN NW
2ND ST N
W
BASSETT ST NW
WB
ROSEMONTAV
RP
RIV
ER
RD
S
LINCOLN ST S
MA
GN
OL
IA C
T N
W
AR
TH
UR
WY
NW
FR
ON
T S
T S
E
City of SalemSouth WaterfrontUrban Renewal Area
Map Legend
South Waterfront Urban Renewal Area Boundary
Streets
Water
O
This map was created from various sources and is neither a legally
recorded map nor a survey and is not intended to be used as such.
No warranty as to correctness is expressed or implied.
0 1,600800Feet
Established: October 2007Acreage: 355 Acres
N:\PW\UD\urban_renewal_areas\SouthWaterfront\South-Waterfront-Area.mxd
8

475 Cottage Street NE, Suite 200, Salem, Oregon 97301
(503) 581-7788
INDEPENDENT AUDITOR’S REPORT Agency Officials Urban Renewal Agency of the City of Salem, Oregon Salem, Oregon Report on the Financial Statements We have audited the accompanying financial statements of the governmental activities, the business-type activities, and each major fund of the Urban Renewal Agency of the City of Salem, Oregon (the Agency), as of and for the year ended June 30, 2017, and the related notes to the financial statements, which collectively comprise the Agency’s basic financial statements as listed in the table of contents. Management’s Responsibility for the Financial Statements Agency management is responsible for the preparation and fair presentation of these financial statements in accordance with accounting principles generally accepted in the United States of America; this includes the design, implementation, and maintenance of internal control relevant to the preparation and fair presentation of financial statements that are free from material misstatement, whether due to fraud or error. Auditor’s Responsibility Our responsibility is to express opinions on these financial statements based on our audit. We conducted our audit in accordance with auditing standards generally accepted in the United States of America. Those standards require that we plan and perform the audit to obtain reasonable assurance about whether the financial statements are free from material misstatement. An audit involves performing procedures to obtain audit evidence about the amounts and disclosures in the financial statements. The procedures selected depend on the auditor’s judgment, including the assessment of the risks of material misstatement of the financial statements, whether due to fraud or error. In making those risk assessments, the auditor considers internal control relevant to the Agency’s preparation and fair presentation of the financial statements in order to design audit procedures that are appropriate in the circumstances, but not for the purpose of expressing an opinion on the effectiveness of the Agency’s internal control. Accordingly, we express no such opinion. An audit also includes evaluating the appropriateness of accounting policies used and the reasonableness of significant accounting estimates made by management, as well as evaluating the overall presentation of the financial statements.
9

We believe that the audit evidence we have obtained is sufficient and appropriate to provide a basis for our audit opinions. Opinions In our opinion, the financial statements referred to above present fairly, in all material respects, the respective financial position of the governmental activities, the business-type activities, and each major fund of the Agency, as of June 30, 2017, and the respective changes in financial position and, where applicable, cash flows thereof for the year then ended in accordance with accounting principles generally accepted in the United States of America. Other Matters Required Supplementary Information Accounting principles generally accepted in the United States of America require that management’s discussion and analysis (MD&A) on pages 13-20 be presented to supplement the basic financial statements. Such information, although not a part of the basic financial statements, is required by the Governmental Accounting Standards Board who considers it to be an essential part of financial reporting for placing the basic financial statements in an appropriate operational, economic, or historical context. We have applied certain limited procedures to the required supplementary information in accordance with auditing standards generally accepted in the United States of America, which consisted of inquiries of management about the methods of preparing the information and comparing the information for consistency with management’s responses to our inquiries, the basic financial statements, and other knowledge we obtained during our audit of the basic financial statements. We do not express an opinion or provide any assurance on the information because the limited procedures do not provide us with sufficient evidence to express an opinion or provide any assurance. Other Information Our audit was conducted for the purpose of forming opinions on the financial statements that collectively comprise the Agency’s basic financial statements. The agency officials, maps of urban renewal areas and supplementary information as listed in the table of contents are presented for purposes of additional analysis and are not a required part of the financial statements. The supplementary information is the responsibility of management and was derived from and relates directly to the underlying accounting and other records used to prepare the basic financial statements. Such information has been subjected to the auditing procedures applied in the audit of the basic financial statements and certain additional procedures, including comparing and reconciling such information directly to the underlying accounting and other records used to prepare the basic financial statements or to the basic financial statements themselves, and other additional procedures in accordance with auditing standards generally accepted in the United States of America. In our opinion, the supplementary information is fairly stated, in all material respects, in relation to the basic financial statements as a whole. The agency officials and maps of urban renewal areas sections have not been subjected to the auditing procedures applied in the audit of the basic financial statements and, accordingly, we do not express an opinion or provide any assurance on them
10

Report on Other Legal and Regulatory Requirements In accordance with Minimum Standards for Audits of Oregon Municipal Corporations, we have issued our report dated December 5, 2017, on our consideration of the Agency’s compliance with certain provisions of laws and regulations, including the provisions of Oregon Revised Statutes as specified in Oregon Administrative Rules. The purpose of that report is to describe the scope of our testing of compliance and results of that testing and not to provide an opinion on compliance. GROVE, MUELLER & SWANK, P.C. CERTIFIED PUBLIC ACCOUNTANTS By: Ryan T. Pasquarella, A Shareholder December 5, 2017
11

MANAGEMENT’S DISCUSSION ANDANALYSIS
12

MANAGEMENT’S DISCUSSION AND ANALYSISFiscal Year Ended June 30, 2017
This discussion and analysis of the Urban Renewal Agency of the City of Salem (Agency)financial performance provides an overview of the Agency’s financial activities for the fiscalyear ended June 30, 2017. Please read it in conjunction with the basic financial statementsand the accompanying notes to the financial statements.
THE FINANCIAL STATEMENTS
The financial statements presented herein include all of the activities of the Agency usingthe integrated approach as prescribed by Governmental Accounting Standards Board(GASB) Statement No. 34, Basic Financial Statements and Management’s Discussion andAnalysis for State and Local Governments. The government-wide financial statementspresent the financial picture of the Agency from the economic resources measurementfocus and the accrual basis of accounting. These statements include all assets of theAgency as well as all liabilities, including long-term debt. Additionally, certain eliminationshave occurred as prescribed by Statement No. 34 in regard to payables and receivables.The fund financial statements for governmental activities are prepared using the currentfinancial resources measurement focus and the modified accrual basis of accounting.Reconciliation of the governmental fund financial statements to the government-widefinancial statements is provided to explain the differences created by the integratedapproach. Fund financial statements for the proprietary fund are reported in the samemanner as the government-wide statements.
REPORTING ON THE AGENCY AS A WHOLE
The Statement of Net Position and the Statement of Activities report financialinformation about the Agency as a whole and about its activities. These statements includeall assets and deferred outflows of the Agency, as well as all liabilities and deferred inflows(including long-term debt) using the accrual basis of accounting, which is similar to theaccounting used by most private-sector companies. All of the current year’s revenuesearned and expenses incurred are recorded regardless of when cash is received or paid.
These two statements report the Agency’s net position and the change in net position. Netposition is the residual of assets plus deferred outflows less liabilities and deferred inflows,and is one way to measure the Agency’s financial health, or financial position. Over time,increases or decreases in the Agency’s net position is one indicator of whether its financialhealth is improving or deteriorating. Other factors to consider are changes in the Agency’sproperty tax base as well as the assessed values in the urban renewal areas. In thesestatements, all Agency activities are categorized as either governmental or business-type.
Governmental activities – Most of the Agency’s activities are reported in this category,which includes capital projects and applicable debt service associated with the sevenurban renewal project areas, and a reserve fund for the Salem Convention Center(Convention Center).
Business-type activities – The Convention Center’s activities are reported in thiscategory. The Convention Center charges fees to customers to cover the cost ofservices provided.
13

REPORTING ON THE AGENCY’S MOST SIGNIFICANT FUNDS
Fund Financial Statements
A fund is a grouping of related accounts that are used to maintain control over resourcesthat have been segregated for specific activities or objectives. The Agency uses fundaccounting to ensure and demonstrate compliance with finance related legal requirements.
Governmental funds – The Agency’s construction and debt service activities andConvention Center gain/loss reserve are reported in governmental funds. These fundsfocus on how money flows into and out of funds and the balances left at year-end that areavailable for spending. These funds are reported using an accounting method calledmodified accrual, which measures cash and all other financial assets that can readily beconverted to cash. The governmental fund statements provide a detailed short-term view ofthe Agency’s operations. Governmental fund information helps determine whether there aremore or fewer financial resources that can be spent in the near future to finance theAgency’s programs. The reconciliation of differences between the governmental fundfinancial statements and the government-wide financial statements are explained in asection following the governmental fund statements.
Proprietary fund – The Convention Center charges customers for services provided,whether to outside customers or to other units of the City of Salem (City). This activity isreported in a proprietary fund. The proprietary fund is reported using the accrual basis ofaccounting which focuses on the changes in economic resources. This is the method usedin the Statement of Net Position and the Statement of Revenues, Expenses, and Changesin Net Position.
FINANCIAL ACTIVITIES OF THE AGENCY AS A WHOLE
Government-wide Financial Statements
Statement of Net Position
The table on the following page reflects the condensed Statement of Net Position comparedto the prior year.
14

Assets:Cash and investments $ 40.8 $ 45.1 $ 0.3 $ 0.6 $ 41.1 $ 45.7Other assets 5.4 4.0 0.6 0.7 6.0 4.7Capital assets 8.7 6.1 25.3 24.7 34.0 30.8
Total assets 54.9 55.2 26.2 26.0 81.1 81.2
Liabilities:Other liabilities 1.0 1.3 0.4 0.4 1.4 1.7Long-term liabilities 14.0 10.4 - - 14.0 10.4
Total liabilities 15.0 11.7 0.4 0.4 15.4 12.1
Net position:Net investment in capital assets (4.1) (3.6) 25.3 24.7 21.2 21.1RestrictedTax allocation debt 16.0 18.6 - - 16.0 18.6Tax allocation improvements 23.7 24.1 - - 23.7 24.1Convention Center gain/loss reserve 4.3 4.4 - - 4.3 4.4
Unrestricted - - 0.5 0.9 0.5 0.9
Total net position $ 39.9 $ 43.5 $ 25.8 $ 25.6 $ 65.7 $ 69.1
Statement of Net Position as of June 30,(in millions)
Activities
Business-Type
Activities
Total Primary
Government
Governmental
201720162017201620172016
For more detailed information, see the Statement of Net Position (page 23).
Governmental Activities
The Agency’s net position from governmental activities increased 9%, from $39.9 million to$43.5 million. This increase is the change in net position in the Statement of Activities, andis composed of the following:
Cash and investments increased $4.3 million. This is composed of an increase in thedebt service fund of $2.6 million due to Riverfront bonds being refunded andreissued in 2015/16 at a lower rate, increase in property tax revenue by $0.4 millionmostly from North Gateway and West Salem, an increase of $0.1 million in theSalem Convention Center gain/loss reserve fund.
Capital assets decreased $2.6 million due to decreased construction work inprogress, in the Mill Creek and the South Waterfront areas, which transferredcompleted street related projects to the City.
Long-term liabilities decreased $3.6 million due to scheduled debt service payments,primarily due to reduction of Riverfront debt by $3.2 million in principal payments andno new debt issuance.
Business-type Activities
Net position from business-type activities decreased 1%, from $25.8 million, to $25.6million. The change was primarily due to a net operating income of $0.1 million and atransfer of funds to the reserve account of $0.3 million.
15

Statement of Activities and Changes in Net Position
The following table reflects the condensed Statement of Activities compared to prior year.
Governmental Business-Type Total Primary
2016 2017 2016 2017 2016 2017
Revenues
Charge for services $ 0.2 $ 0.8 $ 3.7 $ 4.6 $ 3.9 $ 5.4
Taxes 11.7 12.0 - - 11.7 12.0
Interest 0.3 0.5 - - 0.3 0.5
Total revenues 12.2 13.3 3.7 4.6 15.9 17.9
Program expenses 5.2 5.7 4.0 4.5 9.2 10.2
Increase (decrease) in net position
before special items and transfers 7.0 7.6 (0.3) 0.1 6.7 7.7
Transfers to/from primary government (4.4) (4.0) (0.3) (0.3) (4.7) (4.3)
Increase (decrease) in net position 2.6 3.6 (0.6) (0.2) 2.0 3.4
Beginning net position 37.3 39.9 26.4 25.8 63.7 65.7
Ending net position $ 39.9 $ 43.5 $ 25.8 $ 25.6 $ 65.7 $ 69.1
Statement of Activities for the fiscal year ended June 30,(in millions)
Activities GovernmentActivities
For more detailed information, see the Statement of Activities (page 24).
Governmental Activities
The Agency’s change in net position from governmental activities increased from $2.6million last year to $3.6 million this year. The increase is primarily the increased taxrevenues from North Gateway and West Salem ($0.3 million), increased of interest on cashbalances ($0.2 million), and increased loan payments received (charge for services) by $0.6million. Transfers out of completed projects decreased by $0.4 million due to lowercompleted projects for the fiscal year.
Business-type Activities
The Agency’s change in net position from business-type activities increased from a negative$0.6 million to a negative $0.2 million. The increase this year is due to an income of theConvention Center of $0.1 million compared to a loss of $0.3 million last year.
16

Fund Financial Statements
The following table presents ending fund balances of governmental funds compared to theprior year.
Percent of
Major Funds Amount Total Amount Percent
Tax Allocation Debt 18.6$ 41.8% 2.6$ 16.3%
Tax Allocation Improvements 21.5 48.3% 1.3 6.4%
Convention Center gain/loss reserve 4.4 9.9% 0.1 2.3%
Total fund balances 44.5$ 100.0% 4.0$
Compared to FY 2015-16
(in millions)
FY 2016-17
Increase / (Decrease)
Governmental Funds - Fund Balances as of June 30, 2017
At June 30, 2017, the Agency’s governmental funds reported combined fund balances of$44.5 million, an increase of $4.0 million over the prior year. The debt service fundincreased due to property taxes, primarily in the North Gateway and West Salem area.Debt service payments decreased by $1.8 million due to paid off debt and reduced interestfrom reissuance in the prior fiscal year. Convention Center had a $0.1 million net operatingincome for the fiscal year.
Tax Allocation Debt Fund
This fund is a debt service fund that accounts for the accumulation of resources for thepayment of urban renewal long-term liabilities. The principal source of revenue is propertytaxes.
The Tax Allocation Debt fund revenues increased 3%, from $11.9 million to $12.3 milliondue to additional property taxes, primarily from North Gateway and West Salem, andinvestment interest for cash on hand. Net debt service expenditures decreased due to prioryear Riverfront bond reissuance at reduced interest rate and early payoff of West Salembonds. Transfers to the Tax allocation improvements fund increased by $0.6 million.
The June 30, 2017 fund balance of $18.6 million is restricted for future debt service.
Tax Allocation Improvements Fund
This fund is a capital projects fund that accounts for construction improvement projectswithin the urban renewal areas. Financing is provided by debt issuance and interestincome. Primary expenditures are for capital projects, grants, studies, and loans to privateparties for capital asset improvements within urban renewal areas.
The Tax Allocation Improvements fund revenues decreased 12%, from $2.6 million to $2.3million. The decrease was due to decreased program loan repayments received in theRiverfront area by $0.6 million. Expenditures increased by 20%, from $5.6 million to $6.7million. This increase was due to additional project spending in North Gateway (Grants andStorm Water Improvements) and Mill Creek (Parkway/Kuebler Blvd Improvements).
17
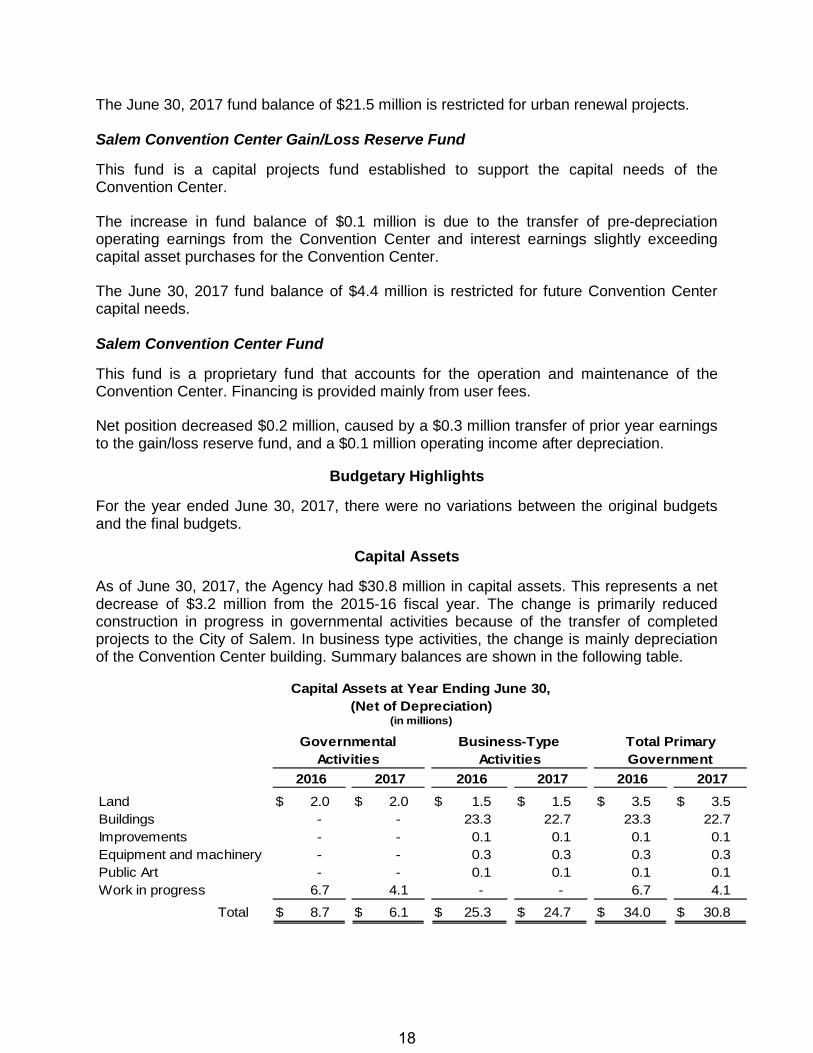
The June 30, 2017 fund balance of $21.5 million is restricted for urban renewal projects.
Salem Convention Center Gain/Loss Reserve Fund
This fund is a capital projects fund established to support the capital needs of theConvention Center.
The increase in fund balance of $0.1 million is due to the transfer of pre-depreciationoperating earnings from the Convention Center and interest earnings slightly exceedingcapital asset purchases for the Convention Center.
The June 30, 2017 fund balance of $4.4 million is restricted for future Convention Centercapital needs.
Salem Convention Center Fund
This fund is a proprietary fund that accounts for the operation and maintenance of theConvention Center. Financing is provided mainly from user fees.
Net position decreased $0.2 million, caused by a $0.3 million transfer of prior year earningsto the gain/loss reserve fund, and a $0.1 million operating income after depreciation.
Budgetary Highlights
For the year ended June 30, 2017, there were no variations between the original budgetsand the final budgets.
Capital Assets
As of June 30, 2017, the Agency had $30.8 million in capital assets. This represents a netdecrease of $3.2 million from the 2015-16 fiscal year. The change is primarily reducedconstruction in progress in governmental activities because of the transfer of completedprojects to the City of Salem. In business type activities, the change is mainly depreciationof the Convention Center building. Summary balances are shown in the following table.
Governmental
Activities
Business-Type
Activities
Total Primary
Government
2016 2017 2016 2017 2016 2017
Land $ 2.0 $ 2.0 $ 1.5 $ 1.5 $ 3.5 $ 3.5
Buildings - - 23.3 22.7 23.3 22.7
Improvements - - 0.1 0.1 0.1 0.1
Equipment and machinery - - 0.3 0.3 0.3 0.3
Public Art - - 0.1 0.1 0.1 0.1
Work in progress 6.7 4.1 - - 6.7 4.1
Total $ 8.7 $ 6.1 $ 25.3 $ 24.7 $ 34.0 $ 30.8
Capital Assets at Year Ending June 30,
(Net of Depreciation)(in millions)
18

The Agency’s change in capital assets is reflected in the following table:
Governmental Business-Type
Activities Activities Total
Beginning balance $ 8.7 $ 25.3 $ 34.0
Additions 1.6 0.1 1.7
Retirement and depreciation (4.2) (0.7) (4.9)
Ending balance $ 6.1 $ 24.7 $ 30.8
Change in Capital Assets for the fiscal year ended June 30, 2017(in millions)
For more detailed information, see page 41 of the notes to the financial statements.
Debt Outstanding
As of June 30, 2017, the Agency had $10.4 million in long-term debt outstanding, comparedto $14.0 million last year. The decrease is due to $3.8 million in debt service payments withan increase in capitalized interest of $0.2 million.
Totals
2016 2017
Governmental:
Bonds $ 6.0 $ 2.1
Notes 8.0 8.3
Total $ 14.0 $ 10.4
Outstanding Debt as of June 30,(in millions)
For more detailed information, see page 42-43 of the notes to the financial statements.
ECONOMIC FACTORS
The Agency is an important partner in economic development within the City of Salem,providing infrastructure improvements and loan programs to support growth and quality ofservice to those within the Agency’s boundaries. As assessed property values within theboundaries of the Agency increase, so do the property taxes derived from thecorresponding tax increment. That tax increment is then used to pay debt service on bondsissued to fund projects and improvements.
In fiscal year 2016-17, urban renewal taxes were collected through two methods. Under thetax increment or “division of taxes” method, the amount of tax collected is based on theincrease in Assessed Value (AV) of property located in an urban renewal area over the“frozen base” value established at the time the district was formed. The tax collected fromwithin a district may only be spent on urban renewal activity within that district. Certainurban renewal areas collect additional taxes through a citywide special levy, which isidentified as such on tax bills. These taxes also must be spent only on urban renewalactivity in the district for which the taxes are collected. The division of taxes rate and thespecial levy rate by urban renewal area are shown in the table on the following page.
19
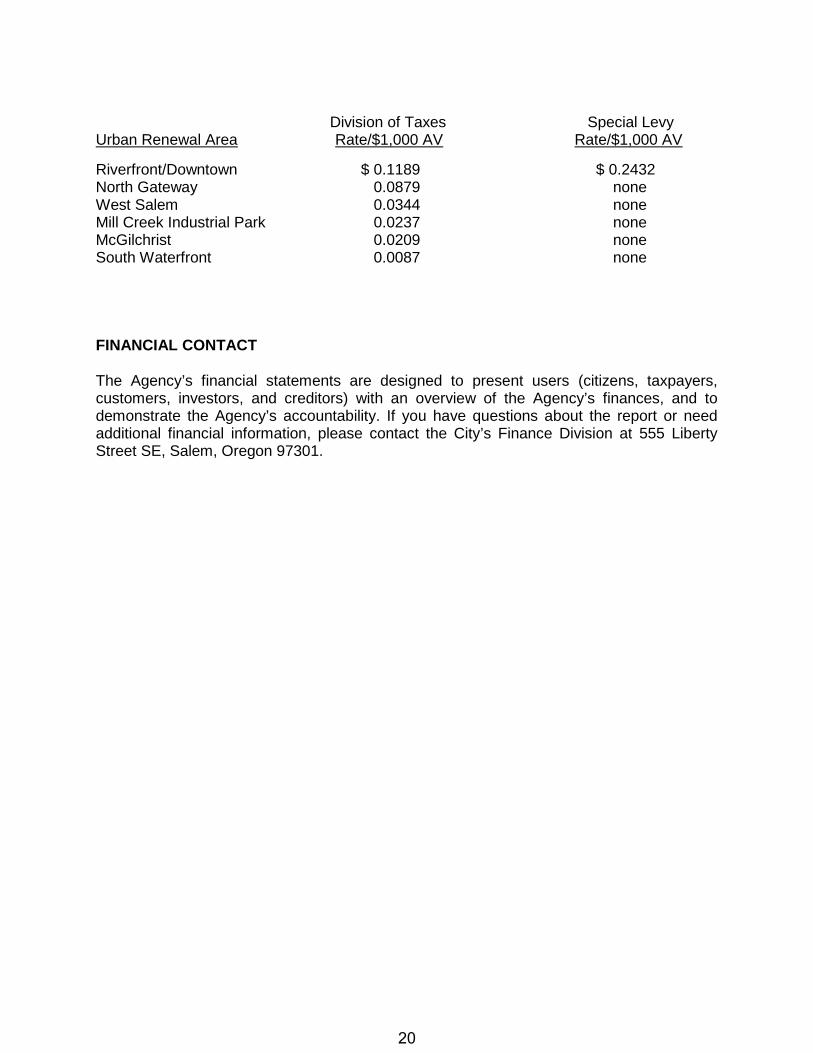
Division of Taxes Special LevyUrban Renewal Area Rate/$1,000 AV Rate/$1,000 AV
Riverfront/Downtown $ 0.1189 $ 0.2432North Gateway 0.0879 noneWest Salem 0.0344 noneMill Creek Industrial Park 0.0237 noneMcGilchrist 0.0209 noneSouth Waterfront 0.0087 none
FINANCIAL CONTACT
The Agency’s financial statements are designed to present users (citizens, taxpayers,customers, investors, and creditors) with an overview of the Agency’s finances, and todemonstrate the Agency’s accountability. If you have questions about the report or needadditional financial information, please contact the City’s Finance Division at 555 LibertyStreet SE, Salem, Oregon 97301.
20

This page intentionally left blank
21

BASIC FINANCIAL STATEMENTS
22

Governmental Business-typeActivities Activities Total
Assets
Current assetsCash and investments $ 45,144,503 $ 623,123 $ 45,767,626Accounts receivable, net 613,618 381,916 995,534Due from City of Salem - 265,106 265,106Inventories and prepayments - 64,992 64,992
Total current assets 45,758,121 1,335,137 47,093,258
Noncurrent assetsNotes receivable 3,356,904 - 3,356,904Capital assets:
Land and construction in progress 6,081,539 1,596,123 7,677,662Other capital assets, net - 23,110,062 23,110,062
Total noncurrent assets 9,438,443 24,706,185 34,144,628
Total assets 55,196,564 26,041,322 81,237,886
Liabilities
Current liabilitiesAccounts payable and accrued liabilities 1,298,026 439,291 1,737,317Due to City of Salem - 7,394 7,394Long-term debt - due within one year 703,644 - 703,644
Total current liabilities 2,001,670 446,685 2,448,355
Non-current liabilitiesLong-term debt 9,715,920 - 9,715,920
Total liabilities 11,717,590 446,685 12,164,275
Net position
Net investment in capital assets (3,582,131) 24,706,185 21,124,054Restricted
Tax allocation debt 18,549,858 - 18,549,858Tax allocation improvements 24,113,743 - 24,113,743Convention Center gain/loss reserve 4,397,504 - 4,397,504
Unrestricted - 888,452 888,452
Total net position $ 43,478,974 $ 25,594,637 $ 69,073,611
URBAN RENEWAL AGENCY OF THE CITY OF SALEM, OREGON
(A Component Unit of the City of Salem, Oregon)
Statement of Net PositionJune 30, 2017
The accompanying notes are an integral part of the financial statements.
23

Charges for Governmental Business-type
Functions/programs Expenses Services Activities Activities Total
Primary government
Governmental activities
Urban renewal $ 5,536,308 $ 764,097 $ (4,772,211) $ - $ (4,772,211)
Interest on long-term debt 200,286 - (200,286) - (200,286)
Total governmental activities 5,736,594 764,097 (4,972,497) - (4,972,497)
Business - type activities
Salem Convention Center 4,540,244 4,631,840 - 91,596 91,596
Total primary government $ 10,276,838 $ 5,395,937 (4,972,497) 91,596 (4,880,901)
General revenues
Property taxes 12,044,632 - 12,044,632
Investment earnings 479,669 - 479,669
Gain on sale of assets 1,625 - 1,625
Miscellaneous 1,000 - 1,000
Transfers to/from primary government (3,967,393) (304,367) (4,271,760)
Total general revenues and transfers 8,559,533 (304,367) 8,255,166
Change in net position 3,587,036 (212,771) 3,374,265
Net position - beginning of year 39,891,938 25,807,408 65,699,346
Net position - end of year $ 43,478,974 $ 25,594,637 $ 69,073,611
URBAN RENEWAL AGENCY OF THE CITY OF SALEM, OREGON
(A Component Unit of the City of Salem, Oregon)
Statement of Activities
For the fiscal year ended June 30, 2017
Net (Expense) Revenue and
Changes in Net Position
Primary Government
Program Revenues
24

Debt Service
Tax Tax Salem Convention
Allocation Allocation Center Gain/Loss
Debt Improvements Reserve Totals
Assets
Cash and investments $ 18,482,267 $ 22,005,947 $ 4,656,289 $ 45,144,503Accounts receivable, net 583,382 30,236 - 613,618Notes receivable - 3,356,904 - 3,356,904
Total assets $ 19,065,649 $ 25,393,087 $ 4,656,289 $ 49,115,025
Liabilities, deferred inflows of resources,
and fund balances
Liabilities
Accounts payable and accrued liabilities $ - $ 523,450 $ 258,785 $ 782,235
Deferred inflows of resources
Unavailable revenue 452,561 3,379,471 - 3,832,032
Fund balances
Restricted for:
Debt Service 18,613,088 - - 18,613,088Capital Projects - 21,490,166 4,397,504 25,887,670
Total fund balances 18,613,088 21,490,166 4,397,504 44,500,758
Total liabilities, deferred inflows ofresources, and fund balances $ 19,065,649 $ 25,393,087 $ 4,656,289
Amounts reported for governmental activities in the statementof net position are different because:
Capital assets used in governmental activities are not currentfinancial resources and, therefore, are not reported in thefunds (net of accumulated depreciation) 6,081,539
Other long-term assets are not available to pay for current-period expenditures and, therefore, are deferred in the funds:
Notes receivable - earned but unavailable 3,379,471Property taxes - earned but unavailable 452,561
Accrued interest on long-term debt (515,791)
Long-term liabilities, including bonds payable, are not dueand payable in the current period and, therefore, arenot reported in the funds (10,419,564)
Total net position $ 43,478,974
URBAN RENEWAL AGENCY OF THE CITY OF SALEM, OREGON(A Component Unit of the City of Salem, Oregon)
Balance Sheet - Governmental FundsJune 30, 2017
Capital Projects
The accompanying notes are an integral part of the financial statements.
25
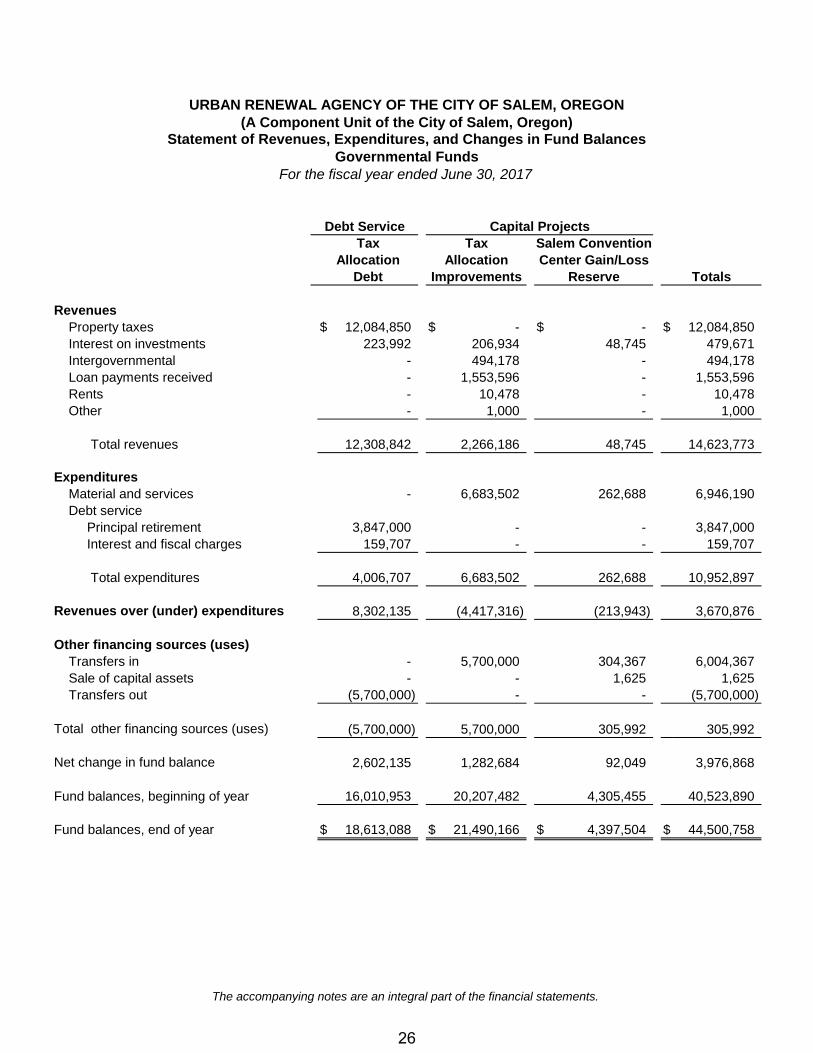
Revenues
Property taxes $ 12,084,850 $ - $ - $ 12,084,850
Interest on investments 223,992 206,934 48,745 479,671
Intergovernmental - 494,178 - 494,178
Loan payments received - 1,553,596 - 1,553,596
Rents - 10,478 - 10,478
Other - 1,000 - 1,000
Total revenues 12,308,842 2,266,186 48,745 14,623,773
Expenditures
Material and services - 6,683,502 262,688 6,946,190
Debt service
Principal retirement 3,847,000 - - 3,847,000
Interest and fiscal charges 159,707 - - 159,707
Total expenditures 4,006,707 6,683,502 262,688 10,952,897
Revenues over (under) expenditures 8,302,135 (4,417,316) (213,943) 3,670,876
Other financing sources (uses)
Transfers in - 5,700,000 304,367 6,004,367
Sale of capital assets - - 1,625 1,625
Transfers out (5,700,000) - - (5,700,000)
Total other financing sources (uses) (5,700,000) 5,700,000 305,992 305,992
Net change in fund balance 2,602,135 1,282,684 92,049 3,976,868
Fund balances, beginning of year 16,010,953 20,207,482 4,305,455 40,523,890
Fund balances, end of year $ 18,613,088 $ 21,490,166 $ 4,397,504 $ 44,500,758
URBAN RENEWAL AGENCY OF THE CITY OF SALEM, OREGON(A Component Unit of the City of Salem, Oregon)
Statement of Revenues, Expenditures, and Changes in Fund BalancesGovernmental Funds
Totals
Debt Service Capital Projects
Allocation
Debt
Allocation
For the fiscal year ended June 30, 2017
Improvements
Salem ConventionTax Tax
Center Gain/Loss
Reserve
The accompanying notes are an integral part of the financial statements.
26

Net change in fund balances - total governmental funds $ 3,976,868
Amounts reported for governmental activities in the Statement of Activities
are different because:
Capital assets used in governmental activities are not current financial resources and
Capital outlay transfer (2,624,387)
Revenues in the government-wide Statement of Activities that do not provide current
financial resources are not reported as revenues in the funds.
Change in deferred inflows for general revenue (40,218)
Change in deferred inflows for program revenue (1,294,156)
Debt issuance provides current financial resources and debt service payments use
Principal payments on long-term debt 3,847,000
Capitalized interest (284,861)
Debt forgiven for capital construction at Mill Creek URA 47,370
Accrued interest expense on long-term debt is reported in the government-wide
Statement of Activities, but does not require the use of current financial resources
and is not reported as an expenditure in governmental funds. (40,580)
Change in net position $ 3,587,036
therefore are not reported in the funds. This represents the increase/decrease inexpenses that reflects the change in capital assets, change in construction inprogress, and capitalized capital outlay.
current financial resources in governmental funds. Neither transaction affects thegovernment-wide net position since long-term debt is reported as a liability.
URBAN RENEWAL AGENCY OF THE CITY OF SALEM, OREGON
(A Component Unit of the City of Salem, Oregon)
Reconciliation of the Statement of Revenues, Expenditures, and Changes in
Fund Balances of Governmental Funds to the Statement of Activities
For the fiscal year ended June 30, 2017
The accompanying notes are an integral part of the financial statements.
27

Salem
Convention
Center
Assets
Cash and investments $ 623,123Accounts receivable, net 381,916Due from other funds 265,106Inventories and prepayments 64,992
Total current assets 1,335,137
Noncurrent assetsCapital assets:
Land and construction in progress 1,596,123Other capital assets, net 23,110,062
Total noncurrent assets 24,706,185
Total assets 26,041,322
Liabilities
Accounts payable and accrued liabilities 439,291Due to City of Salem 7,394
Total liabilities 446,685
Net Position
Net investment in capital assets 24,706,185Unrestricted 888,452
Total net position $ 25,594,637
URBAN RENEWAL AGENCY OF THE CITY OF SALEM, OREGON
(A Component Unit of the City of Salem, Oregon)
Proprietary Fund
Statement of Net Position
June 30, 2017
The accompanying notes are an integral part of the financial statements.
28
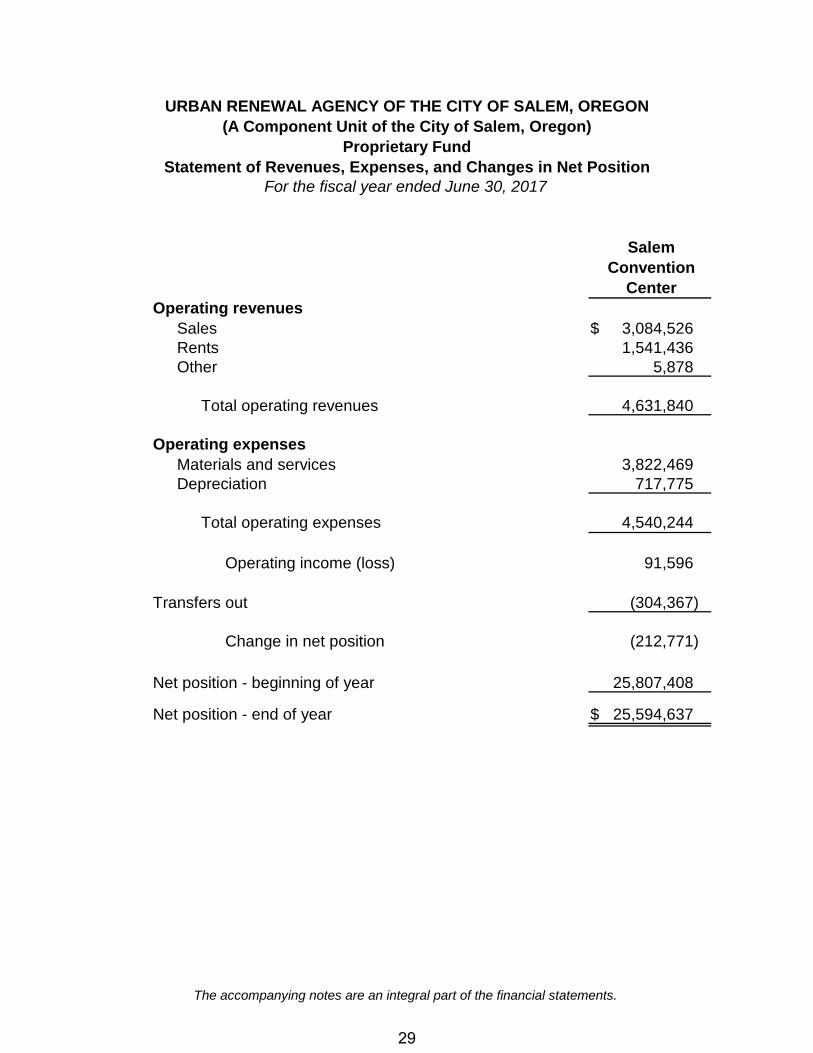
Salem
Convention
Center
Operating revenues
Sales $ 3,084,526Rents 1,541,436Other 5,878
Total operating revenues 4,631,840
Operating expenses
Materials and services 3,822,469Depreciation 717,775
Total operating expenses 4,540,244
Operating income (loss) 91,596
Transfers out (304,367)
Change in net position (212,771)
Net position - beginning of year 25,807,408
Net position - end of year $ 25,594,637
URBAN RENEWAL AGENCY OF THE CITY OF SALEM, OREGON
(A Component Unit of the City of Salem, Oregon)
Proprietary Fund
Statement of Revenues, Expenses, and Changes in Net PositionFor the fiscal year ended June 30, 2017
The accompanying notes are an integral part of the financial statements.
29
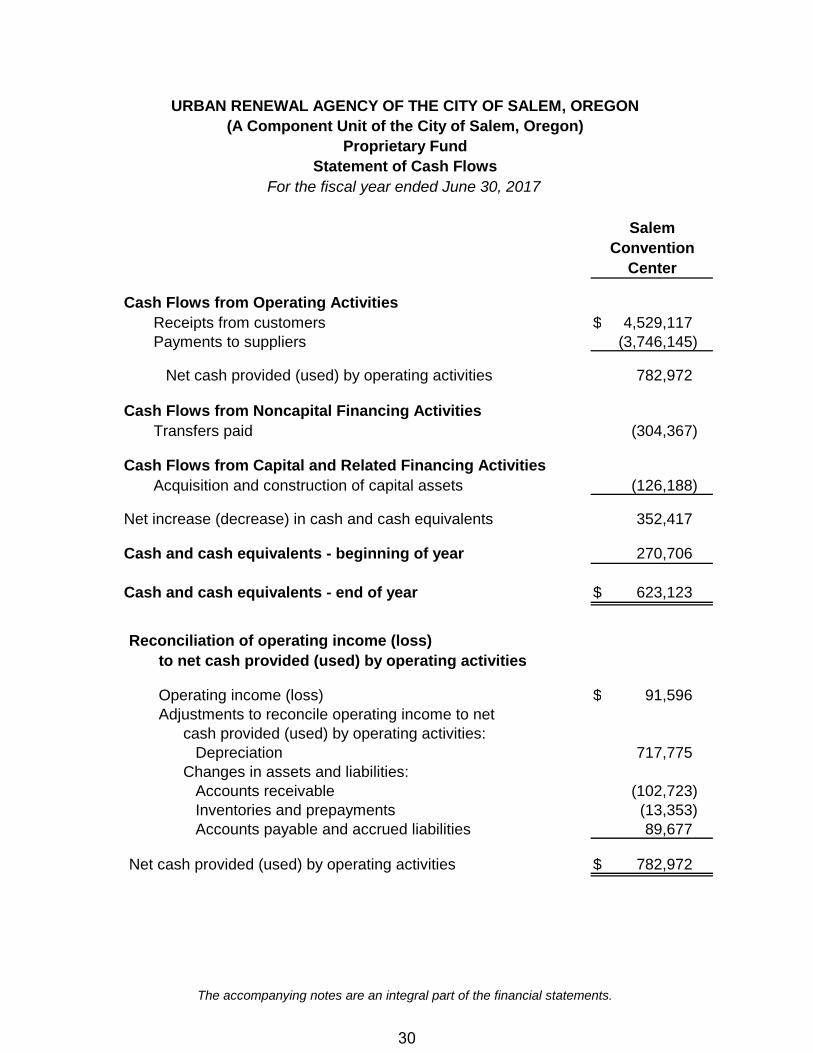
Salem
Convention
Center
Cash Flows from Operating Activities
Receipts from customers $ 4,529,117Payments to suppliers (3,746,145)
Net cash provided (used) by operating activities 782,972
Cash Flows from Noncapital Financing Activities
Transfers paid (304,367)
Cash Flows from Capital and Related Financing Activities
Acquisition and construction of capital assets (126,188)
Net increase (decrease) in cash and cash equivalents 352,417
Cash and cash equivalents - beginning of year 270,706
Cash and cash equivalents - end of year $ 623,123
Reconciliation of operating income (loss)
to net cash provided (used) by operating activities
Operating income (loss) $ 91,596Adjustments to reconcile operating income to net
cash provided (used) by operating activities:Depreciation 717,775
Changes in assets and liabilities:Accounts receivable (102,723)Inventories and prepayments (13,353)Accounts payable and accrued liabilities 89,677
Net cash provided (used) by operating activities $ 782,972
URBAN RENEWAL AGENCY OF THE CITY OF SALEM, OREGON
(A Component Unit of the City of Salem, Oregon)
Proprietary Fund
Statement of Cash Flows
For the fiscal year ended June 30, 2017
The accompanying notes are an integral part of the financial statements.
30

This page intentionally left blank
31

NOTES TO THE FINANCIAL STATEMENTS
32

URBAN RENEWAL AGENCY OF THE CITY OF SALEM, OREGON(A Component Unit of the City of Salem, Oregon)
Notes to the Financial StatementsJune 30, 2017
SUMMARY OF SIGNIFICANT ACCOUNTING POLICIES
The financial statements of the Urban Renewal Agency of the City of Salem, Oregon(Agency) have been prepared in conformity with Generally Accepted Accounting Principles(GAAP) as applied to governmental units. The Governmental Accounting Standards Board(GASB) is the accepted standard-setting body for establishing governmental accounting andfinancial reporting standards.
The more significant of the Agency’s accounting policies are described below.
The Financial Reporting Entity
The Urban Renewal Agency of the City of Salem is a municipal corporation created byOregon statute and activated by the Salem City Council (Council). The Council elected tohave the Agency exercise its powers and engage in urban renewal activity within theboundaries of the City. The Council has been designated as the governing body of theAgency and acts in that capacity. The Agency develops urban renewal plans that must beapproved by the Agency Board and Council. Pursuant to Oregon Revised Statutes (ORS)457.210(3), the City has been delegated responsibility for fiscal matters of the Agencyrelated to the planning and construction of urban renewal projects. The tax incrementcollections resulting from the division of taxes under ORS 457.420 are used to retire anyindebtedness incurred to finance urban renewal projects.
Urban Renewal Areas
Tax allocation bonds for urban renewal plan areas are authorized by state law to 1)“…eliminate and prevent the development or spread of urban blight and deterioration; and2) encourage needed urban conservation and rehabilitation and provide for redevelopmentof blighted or deteriorated areas.”
Projects are financed in urban renewal plan areas as follows:
• The County Assessor “freezes” the assessed value of property within the urbanrenewal area when the area is established. This is referred to as the “frozen value.”
• Any increase in assessed value above the frozen value is called the “incrementalvalue.” The tax revenue generated by the tax rate times the incremental value isused to pay the principal and interest on any indebtedness incurred by the UrbanRenewal Agency to finance urban renewal projects.
Government-wide and Fund Financial Statements
The government-wide financial statements report information on all activities of the Agency.As a general rule, the effect of interfund activity has been eliminated from the government-wide financial statements.
33

URBAN RENEWAL AGENCY OF THE CITY OF SALEM, OREGON(A Component Unit of the City of Salem, Oregon)
Notes to the Financial StatementsJune 30, 2017
The Statement of Activities demonstrates the degree to which the expenses of a givenfunction are offset by program revenues. Program revenues include (1) fines, fees, andcharges to customers who purchase, use, or directly benefit from goods, services, orprivileges provided by a given function or program, and (2) grants and contributions that arerestricted to meeting the operational or capital requirements of a particular function orprogram. Grants and contributions not restricted are reported as general revenues ratherthan program revenues. Taxes and other items not properly included among programrevenues are also reported as general revenues.
Fund financial statements are provided for all governmental and proprietary funds.
Measurement Focus, Basis of Accounting, and Financial Statement Presentation
Measurement focus refers to what is being measured by a fund. Basis of accounting refersto when revenues and expenditures are recognized in the accounts and reported in thefinancial statements.
The government-wide and proprietary fund financial statements are reported using theeconomic resources measurement focus and the accrual basis of accounting. All assets andliabilities are included in the Statement of Net Position. The Statement of Activities presentschanges in net position. Revenues are recorded when earned and expenses are recordedwhen a liability is incurred, regardless of the timing of related cash flows.
The governmental fund financial statements are reported using the current financialresources measurement focus and the modified accrual basis of accounting. Current assets,deferred outflows, current liabilities, and deferred inflows are included in the Balance Sheet.The Statement of Revenues, Expenditures, and Changes in Fund Balances presentsincreases and decreases in fund balances. Revenues are recorded when susceptible toaccrual (both measurable and available). Measurable means the amount of the transactioncan be determined. Available means collectible within the current period or soon enoughthereafter (60 days) to be used to liquidate liabilities of the current period. Expendituresother than interest on long-term obligations are recorded when a liability is incurred.
Proprietary funds distinguish operating revenues and expenses from non-operating items.Operating revenues and expenses generally result from providing services and producingand delivering goods in connection with a proprietary fund’s primary ongoing operations.The principal operating revenues of the Convention Center are charges to customers forsales and services. Operating expenses include the cost of sales and services,administrative expenses, and depreciation of capital assets. All revenues and expenses notmeeting this definition are reported as non-operating revenues and expenses.
Governmental Funds
Governmental funds finance all of the construction and debt service functions of the Agency,as well as provide a reserve fund for the Salem Convention Center. The following are theAgency’s major fund types.
34

URBAN RENEWAL AGENCY OF THE CITY OF SALEM, OREGON(A Component Unit of the City of Salem, Oregon)
Notes to the Financial StatementsJune 30, 2017
Tax Allocation Debt Fund
The Tax Allocation Debt fund is a debt service fund that accounts for the accumulation of taxincrement collections assessed on property and the payment of principal and interest ondebt.
Tax Allocation Improvements Fund
The Tax Allocation Improvements fund is a capital projects fund that accounts forconstruction improvement projects in the Urban Renewal areas. Financing is provided bydebt issuance and interest income.
Salem Convention Center Gain/Loss Reserve Fund
The Convention Center gain/loss reserve fund is a capital projects fund that accounts forresources accumulated to finance the capital asset needs of the Center.
Proprietary Funds
Proprietary funds record the business-type activities of the Agency. Revenues are expectedto offset expenses. The Salem Convention Center fund is the only proprietary fund of theAgency and accounts for the operations of the Center.
Cash and Investments
The City of Salem (City) maintains a common cash and investment pool for all City funds,including funds of the Agency. Interest earned on the pooled cash and investments isallocated based on each fund’s average cash and investments balance as a proportion ofthe City’s total.
Cash and cash equivalents are considered to be cash on hand, demand deposits, andshort-term investments with original maturities of three months or less from the date ofacquisition.
For purposes of the statement of cash flows, proprietary funds consider all highly liquidinvestments with maturities of three months or less when purchased to be cash equivalents.
The City’s investment policies are governed by ORS. The statutes authorize the City andcomponent units to invest primarily in U.S. Treasury obligations, U.S. Government agencyissues, U.S. Instrumentality debt, certain bonded obligations of municipalities, bankrepurchase agreements, bankers’ acceptances, high-grade corporate bonds andcommercial paper, collateralized deposit accounts, and the State Treasurer’s LocalGovernment Investment Pool (LGIP).
It is the City’s policy to report all short-term, highly liquid money market investments with aremaining maturity of one year or less at time of purchase at amortized cost, whichapproximates fair value. Investments with a remaining maturity at time of purchase of morethan one year are valued at fair value in accordance with GASB Statements 31 and 72.
35

URBAN RENEWAL AGENCY OF THE CITY OF SALEM, OREGON(A Component Unit of the City of Salem, Oregon)
Notes to the Financial StatementsJune 30, 2017
Receivables and Deferred Inflows of Resources
Property tax receivables for the governmental fund types that have been collected withinthirty days subsequent to year-end are considered measurable and available and arerecognized as revenues. All other property tax receivables are offset by deferred inflows ofresources, and accordingly, have not been recorded as revenue in the fund financialstatements. Real and personal property taxes are levied upon all taxable property within theurban renewal areas and become liens against the property as of July 1 of each year, andare payable in three installments that are due on November 15, February 15, and May 15.Discounts are allowed if the amount due is received by November 15. Taxes not collectedby May 15 are considered delinquent. In the government-wide financial statements, taxesare recognized as revenue when levied.
Notes receivable are recorded as receivables when loaned, are offset by deferred inflows ofresources, and accordingly, not recorded as revenue in the funds until payments arereceived.
Capital Assets
Capital assets are recorded at cost if purchased or constructed. Donated capital assets arerecorded at acquisition value at the date of donation. In the governmental fund statements,capital outlays are charged to expenditures as purchased. Governmental capital assets arereported only on the government-wide statement of net position. In the proprietary fundstatements, capital assets are reported on the statement of net position.
Capital assets are defined as assets with an initial individual cost of more than $10,000($2,000 for the Convention Center) and an estimated useful life in excess of one year.Additions or improvements, and other capital outlays that significantly extend the useful lifeof an asset, or significantly increase the capacity of an asset, are capitalized. Other costsincurred for repairs and maintenance are expensed.
Construction-in-progress represents amounts expended to date on construction projects thatare not yet complete.
It is the Agency’s practice to transfer capital assets to the City when projects are completed,with the exception of assets of the Convention Center.
Debt
Long-term debt is reported in the Statement of Net Position as noncurrent liabilities. Thegovernmental fund financial statements do not report long-term debt because it does notrequire the use of current financial resources.
Tax increment bonds are direct obligations of the Urban Renewal Agency and are payablesolely from tax increment revenues. The Agency issues tax increment bonds specific toeach urban renewal area to provide funds for projects within the respective area.
36

URBAN RENEWAL AGENCY OF THE CITY OF SALEM, OREGON(A Component Unit of the City of Salem, Oregon)
Notes to the Financial StatementsJune 30, 2017
Net Position
The government-wide and proprietary fund financial statements utilize a net positionpresentation. Net position is categorized as net investment in capital assets, restricted, andunrestricted. Net position is the residual of assets and deferred outflows, less liabilities anddeferred inflows.
Budget and Budgetary Accounting
A budget is prepared for each fund in accordance with the modified accrual basis ofaccounting for all funds. Appropriations are made by expenditure type for all funds.Expenditures may not legally exceed appropriations. Appropriations lapse at the end of eachfiscal year. Budget amounts include original approved amounts and all subsequentappropriation transfers approved by the Agency Board. The budget for the funds includescapital outlay expenditures in each program for capital outlays applicable to that program.
After budget approval, the Agency Board may approve supplemental appropriations if anoccurrence, condition, or need exists that was not identified at the time the budget wasadopted. Management may not amend the budget. A supplemental budget requireshearings before the public, publication in newspapers, and approval by the Agency Board.
Use of estimates
The preparation of financial statements in conformity with GAAP requires management tomake estimates and assumptions that affect certain amounts and disclosures. Accordingly,actual results could differ from those estimates.
CASH AND INVESTMENTS
The Agency’s cash and investments are comprised of the following at June 30, 2017:
Cash on hand $ 2,004
Deposits with City of Salem 9,105,195
Investments 36,660,427
Total cash and investments $ 45,767,626
Book Value
1. Deposits
In the case of deposits, there is a custodial credit risk that, in the event of the failure of thecounterparty, the Agency will not be able to recover the value of its investments or collateralsecurities that are in the possession of an outside party. All Agency deposits are held by theCity of Salem, which is covered by the State of Oregon Public Funds CollateralizationProgram. At June 30, 2017, the Agency’s deposits in City bank accounts have a book valueof $9,105,195.
37

URBAN RENEWAL AGENCY OF THE CITY OF SALEM, OREGON(A Component Unit of the City of Salem, Oregon)
Notes to the Financial StatementsJune 30, 2017
2. Investments
As of June 30, 2017, the Agency held the following investments and maturities:
Weighted avg. % of
Fair maturity investmentInvestment type Value in months portfolio
Local Government Investment Pool 36,660,427$ 0.033 100.0%
Weighted average maturity in months assumes that all investments are held to maturity.
Agency funds are invested by the City on behalf of the Agency. The City’s investmentpolicies are governed by state statutes, which authorize the City to invest primarily ingeneral obligations of the U.S. Government and its agencies, certain municipal andcorporate bonds, bank repurchase agreements, bankers' acceptances, certain commercialpaper, and the State Treasurer's Local Government Investment Pool (LGIP), among others.The LGIP is a portion of the Oregon Short Term Fund (OSTF). This fund is not registeredwith the US Securities and Exchange Commission, but is governed by ORS, the OregonInvestment Council, and the OSTF Board. The fair value of the fund is the same as thevalue of the pool shares.
As a means of limiting its exposure to fair value losses caused by changing interest rates,the City’s investment policy limits investments as shown below:
Investment typeBankers' acceptances 20% 6 monthsCertificates of deposit 25% 2 yearsCommercial paper 9 monthsCorporate indebtedness 5 yearsLocal government investment pool 100% * N/A
Municipal Debt 10% 5 yearsRepurchase agreements 10% 3 monthsU.S. agency securities 100% 5 yearsU.S. Instrumentality Debt 10% 5 yearsU.S. Treasuries 100% 5 years
*Dollar amount limited by ORS 294.810. As of June 30, 2017 this limit is $47,390,998.
Maximum %of portfolio
Maximum lengthto maturity
35%
Custodial credit risk for investments is the risk that, in the event of the failure of thecounterparty to a transaction, the Agency will not be able to recover the value of itsinvestment or collateral securities that are in the possession of an outside party. The City’sinvestment policy requires broker/dealers to meet certain qualifications and that allinvestments are delivered to and held by a third-party custodian, which holds the funds inthe City’s name. All investments, except for the investment in the LGIP, which is notevidenced by securities, are held in safekeeping by the financial institution counterparty orby its trust department in the City’s name.
38

URBAN RENEWAL AGENCY OF THE CITY OF SALEM, OREGON(A Component Unit of the City of Salem, Oregon)
Notes to the Financial StatementsJune 30, 2017
At June 30, 2017, the credit risk for the Agency’s investments is as follows:
Fair CreditInvestment type Value Risk
Local Government Investment Pool 36,660,427$ Unrated
The Agency’s policy, which adheres to State of Oregon law, is to limit its investments to thefollowing: issuers within Oregon must be rated A (bonds) or A-2/P-2 (commercial paper) orbetter by Standard and Poor’s, Moody’s Investors Service, or any other nationallyrecognized statistical rating organization. Issuers not in Oregon must be rated AA/Aa(bonds) or A-1/P-1 (commercial paper) or better.
RECEIVABLES
Receivables for governmental funds at June 30, 2017 are as follows:
Tax Tax
Allocation Allocation
Debt Improvements Totals
Accounts receivable $ - $ 7,669 $ 7,669Property taxes 583,188 - 583,188
Interest 194 22,567 22,761Notes receivable - 3,356,904 3,356,904
Total $ 583,382 $ 3,387,140 $ 3,970,522
Salem Convention Center accounts receivable for June 30, 2017 are $381,916.
PROPERTY TAXES
Fiscal Balances Balances
Year of July 1, 2016-17 Adjustments Collections June 30,Levy 2016 Levy To Date To Date 2017
2016-17 $ - $ 12,393,662 $ (374,119) $ 11,740,395 $ 279,148
2015-16 295,445 - (11,463) 160,549 123,4332014-15 158,343 - (5,547) 62,694 90,102
2013-14 89,321 - (843) 54,972 33,5062012-13 41,390 - - 27,113 14,277
2011-12 16,079 - (914) 4,051 11,1142010-11 12,336 - (789) 2,312 9,235All Prior 26,862 - (2,281) 2,208 22,373
$ 639,776 $ 12,393,662 $ (395,956) $ 12,054,294 $ 583,188
39

URBAN RENEWAL AGENCY OF THE CITY OF SALEM, OREGON(A Component Unit of the City of Salem, Oregon)
Notes to the Financial StatementsJune 30, 2017
Ensuing Year’s Levies
Property tax levies for the year beginning July 1, 2017 are as follows:
The Riverfront/Downtown and North Gateway plan areas will each levy 100% of the amountof their authority under option one of ORS 457.435(2)(a) as selected by the Agency for theretirement of debt obligations.
The Fairview plan area will not levy for the 2017-18 fiscal year.
West Salem plan area will levy 100% of the amount of its authority under the standard rateplan of ORS 457.445(2) as selected by the Agency for the retirement of debt obligations.
The Mill Creek Industrial Park, McGilchrist, and South Waterfront plan areas will each levy100% of the amount of their authority under the reduced rate plan of ORS 457.445(1) asselected by the Agency for the retirement of debt obligations.
NOTES RECEIVABLE
Riverfront/DowntownLoan repayments are receivable in monthly or annual installments; interestrates range from 0% to 6%. Notes are secured by the underlyingrenewal project improvements or land sold. $ 2,425,673
FairviewLoan repayments are receivable in monthly installments with an interest rateof 3%. Notes are secured by the underlying renewal project improvements.Some notes are forgivable based on job creation. 535,406
North GatewayLoan repayments are receivable in monthly or annual installments; interestrates range from 0% to 3%. Notes are secured by the underlyingrenewal project improvements or land sold. 395,825
$ 3,356,904
40

URBAN RENEWAL AGENCY OF THE CITY OF SALEM, OREGON(A Component Unit of the City of Salem, Oregon)
Notes to the Financial StatementsJune 30, 2017
CAPITAL ASSETSBeginning Ending
Governmental activities Balance Increases Decreases Balance
Land and land improvements $ 1,979,524 $ - $ - $ 1,979,524
Construction in progress 6,726,402 1,647,373 (4,271,760) 4,102,015
Governmental activities
capital assets, net $ 8,705,926 $ 1,647,373 $ (4,271,760) $ 6,081,539
Business-type activities
Land and land improvements $ 1,500,646 $ - $ - $ 1,500,646
Public art 80,477 15,000 - 95,477
Total non-depreciable 1,581,123 15,000 - 1,596,123
Buildings and building improvements 30,340,092 28,365 - 30,368,457
Other improvements 254,161 - - 254,161
Equipment and machinery 1,088,479 82,823 - 1,171,302
Total depreciable 31,682,732 111,188 - 31,793,920
Accumulated depreciation
Buildings and building improvements (7,050,327) (642,527) - (7,692,854)
Improvements (134,690) (15,913) - (150,603)
Equipment and machinery (781,066) (59,335) - (840,401)
Total accumulated depreciation (7,966,083) (717,775) - (8,683,858)
Business-type activities
capital assets, net $ 25,297,772 $ (591,587) $ - $ 24,706,185
SHORT-TERM DEBT
Riverfront, 2017 $ - $ 4,000,000 $ 4,000,000 $ -
North Gateway, 2017 - 1,500,000 1,500,000 -
Mill Creek, 2017 - 200,000 200,000 -
Total due to City of Salem $ - $ 5,700,000 $ 5,700,000 $ -
June 30, 2017ReductionsAdditionsJuly 1, 2016
Balance Balance
41

URBAN RENEWAL AGENCY OF THE CITY OF SALEM, OREGON(A Component Unit of the City of Salem, Oregon)
Notes to the Financial StatementsJune 30, 2017
LONG-TERM DEBT
Transactions for the year ended June 30, 2017 are as follows:
Tax increment bonds
Riverfront/Downtown, Series 2009
Bond payable dated Sep 17, 2009, $ 2,210,000 $ - $ 235,000 $ 1,975,000 $ 245,000
at 4.35%.
West Salem, Series 2013
Bond payable dated Jul 23, 2013, 613,000 - 613,000 - -
at 1.90%.
Riverfront/Downtown, Series 2015A
Bond payable dated Aug 27, 2015, 323,000 - 323,000 - -
at 1.26%.
Riverfront/Downtown, Series 2015A
Bond payable dated Aug 27, 2015, 2,829,000 - 2,676,000 153,000 153,000
at 1.73%.
Notes
Mill Creek, OR Econ & Comm Dev
Dept, Series 2007, L06001A 3,999,992 284,861 - 4,284,853 305,644
Mill Creek, OR Econ & Comm Dev
Dept, Series 2007, L06001B 282,000 - 47,370 234,630 -
Mill Creek, OR Econ & Comm Dev
Dept, Series 2007, L06001C 3,772,081 - - 3,772,081 -
$ 14,029,073 $ 284,861 $ 3,894,370 $ 10,419,564 $ 703,644
Matured/
Retired
New
Obligations
Balances
July 1,
2016
Balances
June 30,
2017
Due in
One Year
Governmental activity urban renewal bonds
Urban renewal bonds are special obligations of the Urban Renewal Agency and are payablesolely from tax increment revenues. The Agency issues bonds to provide funds for urbanrenewal projects within designated project areas.
In accordance with bond covenants, the Agency has established certain reserves within itsdebt service fund as follows:
Riverfront/Downtown URA
2009: $335,2552015B: $548,100
Governmental activity notes
The Agency issues notes to provide funds for the acquisition and construction of capitalasset improvements. The Agency’s currently outstanding notes represent funding primarilyfor projects associated with economic development and wetland mitigation in the Mill Creekurban renewal area. Mill Creek tax increment revenues are pledged to repay the notes. Note
L06001A unpaid accrued interest as of December 1, 2016 was capitalized into the principalbalance. Note L06001B is potentially forgivable based on job creation in the Mill Creekurban renewal area. To date, $765,370 of the original $1,000,000 has been forgiven.
42
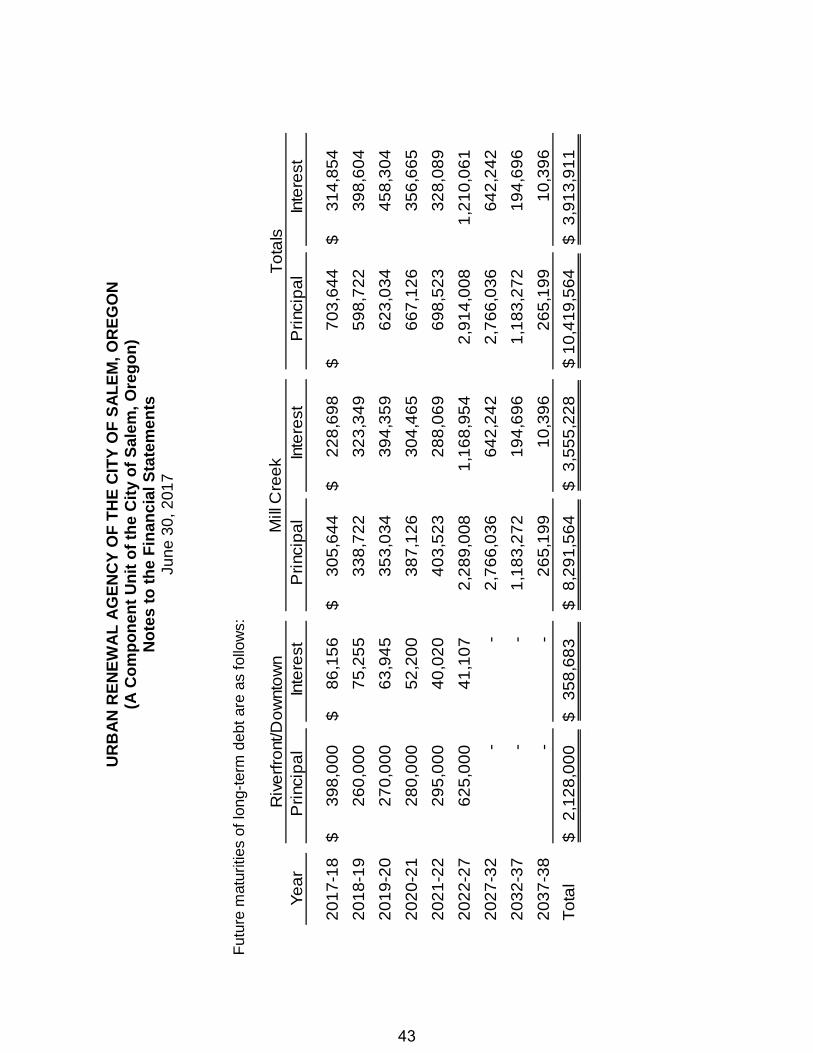
UR
BA
NR
EN
EW
AL
AG
EN
CY
OF
TH
EC
ITY
OF
SA
LE
M,
OR
EG
ON
(AC
om
po
ne
nt
Un
ito
fth
eC
ity
of
Sa
lem
,O
reg
on
)N
ote
sto
the
Fin
an
cia
lS
tate
me
nts
Jun
e3
0,2
01
7
Futu
rem
atu
ritie
sof
long-t
erm
debt
are
as
follo
ws:
Ye
ar
Pri
ncip
al
Inte
rest
Pri
ncip
al
Inte
rest
Pri
ncip
al
Inte
rest
20
17
-18
$3
98
,00
0$
86
,15
6$
30
5,6
44
$2
28
,69
8$
70
3,6
44
$3
14
,85
4
20
18
-19
26
0,0
00
75
,25
53
38
,72
23
23
,34
95
98
,72
23
98
,60
4
20
19
-20
27
0,0
00
63
,94
53
53
,03
43
94
,35
96
23
,03
44
58
,30
4
20
20
-21
28
0,0
00
52
,20
03
87
,12
63
04
,46
56
67
,12
63
56
,66
5
20
21
-22
29
5,0
00
40
,02
04
03
,52
32
88
,06
96
98
,52
33
28
,08
9
20
22
-27
62
5,0
00
41
,10
72
,28
9,0
08
1,1
68
,95
42
,91
4,0
08
1,2
10
,06
1
20
27
-32
--
2,7
66
,03
66
42
,24
22
,76
6,0
36
64
2,2
42
20
32
-37
--
1,1
83
,27
21
94
,69
61
,18
3,2
72
19
4,6
96
20
37
-38
--
26
5,1
99
10
,39
62
65
,19
91
0,3
96
To
tal
$2
,12
8,0
00
$3
58
,68
3$
8,2
91
,56
4$
3,5
55
,22
8$
10
,41
9,5
64
$3
,91
3,9
11
Mill
Cre
ek
To
tals
Riv
erf
ront/D
ow
nto
wn
43

URBAN RENEWAL AGENCY OF THE CITY OF SALEM, OREGON(A Component Unit of the City of Salem, Oregon)
Notes to the Financial StatementsJune 30, 2017
OTHER INFORMATION
Risk Management
The Agency is provided coverage under the City of Salem self-insurance program. Excessinsurance policies are purchased by the City’s Self-insurance fund, which include propertydamage and liability. No insurance claims have been settled in the prior three years thathave exceeded policy coverage.
From time to time, the Agency is a defendant in various litigation proceedings. Managementbelieves any losses arising from these actions will not materially affect the Agency’sfinancial position.
Budget Violation
The Salem Convention Center fund exceeded budget authority in operations expendituresby $99,817. Revenue was also over budget due to unexpectedly high volume of businessactivity late in the year. Future Convention Center budgets will include appropriationauthority for this situation. Monitoring will also be increased to ensure compliance withbudget law.
44

This page intentionally left blank
45

SUPPLEMENTARY INFORMATION
46

Revenues
Property taxes $ 12,528,730 $ 12,084,850 $ 443,880Interest on investments 101,220 223,992 (122,772)Intergovernmental - - -Loan payments received - - -Rents - - -Other - - -
Total revenues 12,629,950 12,308,842 321,108
Expenditures
Operations - - -
Debt service 9,715,180 9,706,707 8,473
Total expenditures 9,715,180 9,706,707 8,473
Revenues over (under) expenditures 2,914,770 2,602,135 312,635
Other financing sources (uses)
Transfers in - - -Sale of capital assets - - -
Issuance of long-term debt - - -Issuance of short-term debt - - -
Total other financing sources (uses) - - -
Excess (deficiency) of revenues over (under)expenditures and other financing sources (uses) 2,914,770 2,602,135 312,635
Fund balance, beginning of year 16,128,680 16,010,953 117,727
Fund balance, end of year $ 19,043,450 $ 18,613,088 $ 430,362
Continued
URBAN RENEWAL AGENCY OF THE CITY OF SALEM, OREGON
(A Component Unit of the City of Salem)
Schedule of Revenues, Expenditures, and Changes in Fund Balance
Budget and Actual - Governmental FundsFor the fiscal year ended June 30, 2017
Tax Allocation Debt
ActualBudget
Final
Original/
Variance1
1 ( ) indicates revenues/expenditures in excess of budget
47
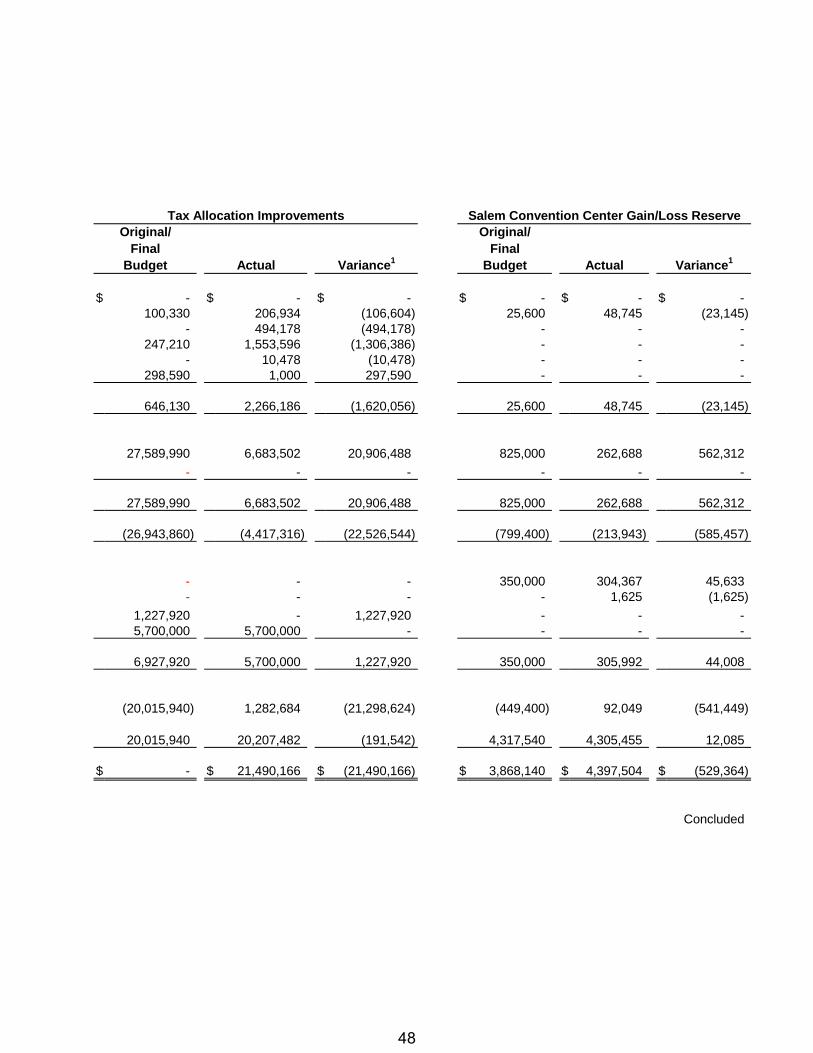
$ - $ - $ - $ - $ - $ -100,330 206,934 (106,604) 25,600 48,745 (23,145)
- 494,178 (494,178) - - -247,210 1,553,596 (1,306,386) - - -
- 10,478 (10,478) - - -298,590 1,000 297,590 - - -
646,130 2,266,186 (1,620,056) 25,600 48,745 (23,145)
27,589,990 6,683,502 20,906,488 825,000 262,688 562,312
- - - - - -
27,589,990 6,683,502 20,906,488 825,000 262,688 562,312
(26,943,860) (4,417,316) (22,526,544) (799,400) (213,943) (585,457)
- - - 350,000 304,367 45,633- - - - 1,625 (1,625)
1,227,920 - 1,227,920 - - -5,700,000 5,700,000 - - - -
6,927,920 5,700,000 1,227,920 350,000 305,992 44,008
(20,015,940) 1,282,684 (21,298,624) (449,400) 92,049 (541,449)
20,015,940 20,207,482 (191,542) 4,317,540 4,305,455 12,085
$ - $ 21,490,166 $ (21,490,166) $ 3,868,140 $ 4,397,504 $ (529,364)
Concluded
Tax Allocation Improvements
Variance1ActualBudget
Original/
Final
Salem Convention Center Gain/Loss Reserve
Original/
Final
Budget Actual Variance1
48

Assets
Cash and investments $ 2,240,758 $ $ 10,992,033Accounts receivable, net 307,484 - 151,850
Total assets $ 2,548,242 $ - $ 11,143,883
Liabilities, deferred inflows of resources,
and fund balances
Deferred inflows of resources
Unavailable revenue $ 238,592 $ - $ 118,240
Fund balances
Restricted for debt service 2,309,650 - 11,025,643
Total liabilities, deferred inflowsof resources, and fund balances $ 2,548,242 $ - $ 11,143,883
Continued
Downtown
Riverfront/
GatewayFairview
URBAN RENEWAL AGENCY OF THE CITY OF SALEM, OREGON
(A Component Unit of the City of Salem, Oregon)
Combining Balance Sheet - Debt Service Fund
June 30, 2017
North
49

$ 1,298,547 $ 2,342,946 $ 1,173,858 $ 434,125 $ 18,482,26752,768 33,314 26,718 11,248 583,382
$ 1,351,315 $ 2,376,260 $ 1,200,576 $ 445,373 $ 19,065,649
$ 41,151 $ 25,463 $ 20,389 $ 8,726 $ 452,561
1,310,164 2,350,797 1,180,187 436,647 18,613,088
$ 1,351,315 $ 2,376,260 $ 1,200,576 $ 445,373 $ 19,065,649
Concluded
Mill Creek
Park
West
Salem TotalsWaterfront
South
McGilchrist
Industrial
50

Revenues
Property taxes $ 6,518,637 $ - $ 2,760,021Interest on investments 65,842 - 110,752
Total revenues 6,584,479 - 2,870,773
Expenditures
Debt service 3,383,397 - 94
Total expenditures 3,383,397 - 94
Revenues over (under) expenditures 3,201,082 - 2,870,679
Other financing sources (uses)
Transfers out (4,000,000) - (1,500,000)
Excess (deficiency) of revenues overexpenditures and other financingsources (uses) (798,918) - 1,370,679
Fund balance, beginning of year 3,108,568 - 9,654,964
Fund balance, end of year $ 2,309,650 $ - $ 11,025,643
Continued
URBAN RENEWAL AGENCY OF THE CITY OF SALEM, OREGON
(A Component Unit of the City of Salem, Oregon)
Combining Schedule of Revenues, Expenditures, and Changes in Fund Balances -
Debt Service FundFor the fiscal year ended June 30, 2017
Downtown
Riverfront/
Fairview Gateway
North
51
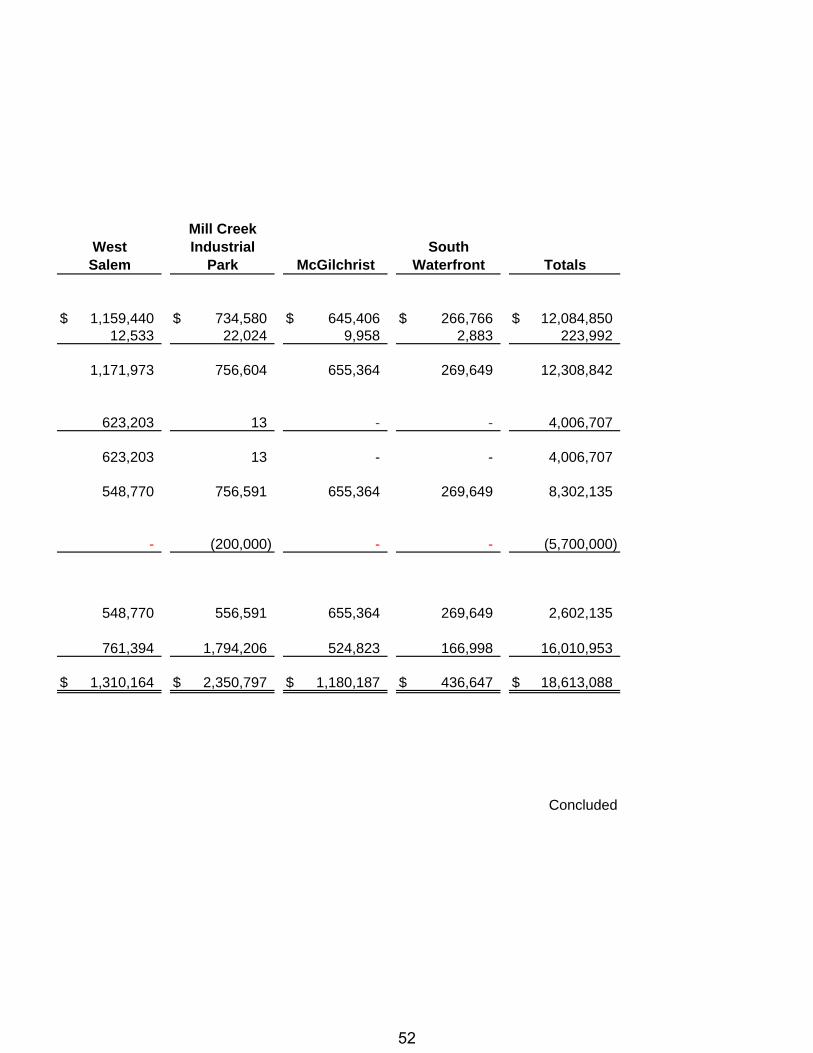
$ 1,159,440 $ 734,580 $ 645,406 $ 266,766 $ 12,084,85012,533 22,024 9,958 2,883 223,992
1,171,973 756,604 655,364 269,649 12,308,842
623,203 13 - - 4,006,707
623,203 13 - - 4,006,707
548,770 756,591 655,364 269,649 8,302,135
- (200,000) - - (5,700,000)
548,770 556,591 655,364 269,649 2,602,135
761,394 1,794,206 524,823 166,998 16,010,953
$ 1,310,164 $ 2,350,797 $ 1,180,187 $ 436,647 $ 18,613,088
Concluded
Mill Creek
Salem
West
Totals
Industrial
Park McGilchrist Waterfront
South
52

Revenues
Property taxes $ 6,919,100 $ 6,919,100 $ 6,518,637 $ 400,463Interest on investments 14,760 14,760 65,842 (51,082)
Total revenues 6,933,860 6,933,860 6,584,479 349,381
Expenditures
Debt service
Principal 7,234,000 7,234,000 7,234,000 -Interest 150,170 150,170 149,397 773
Total expenditures 7,384,170 7,384,170 7,383,397 773
Excess (deficiency) of revenues overexpenditures (450,310) (450,310) (798,918) 348,608
Fund balance, beginning of year 3,185,550 3,185,550 3,108,568 76,982
Fund balance, end of year $ 2,735,240 $ 2,735,240 $ 2,309,650 $ 425,590
For the fiscal year ended June 30, 2017
URBAN RENEWAL AGENCY OF THE CITY OF SALEM, OREGON
(A Component Unit of the City of Salem, Oregon)
Schedule of Revenues, Expenditures, and Changes in Fund Balance -
Budget and Actual - Riverfront/Downtown (Debt Service Fund)
(Budgetary Basis)
Actual Amounts
Variance1FinalOriginal
Budgeted Amounts
1 ( ) indicates revenues/expenditures in excess of budget.
53
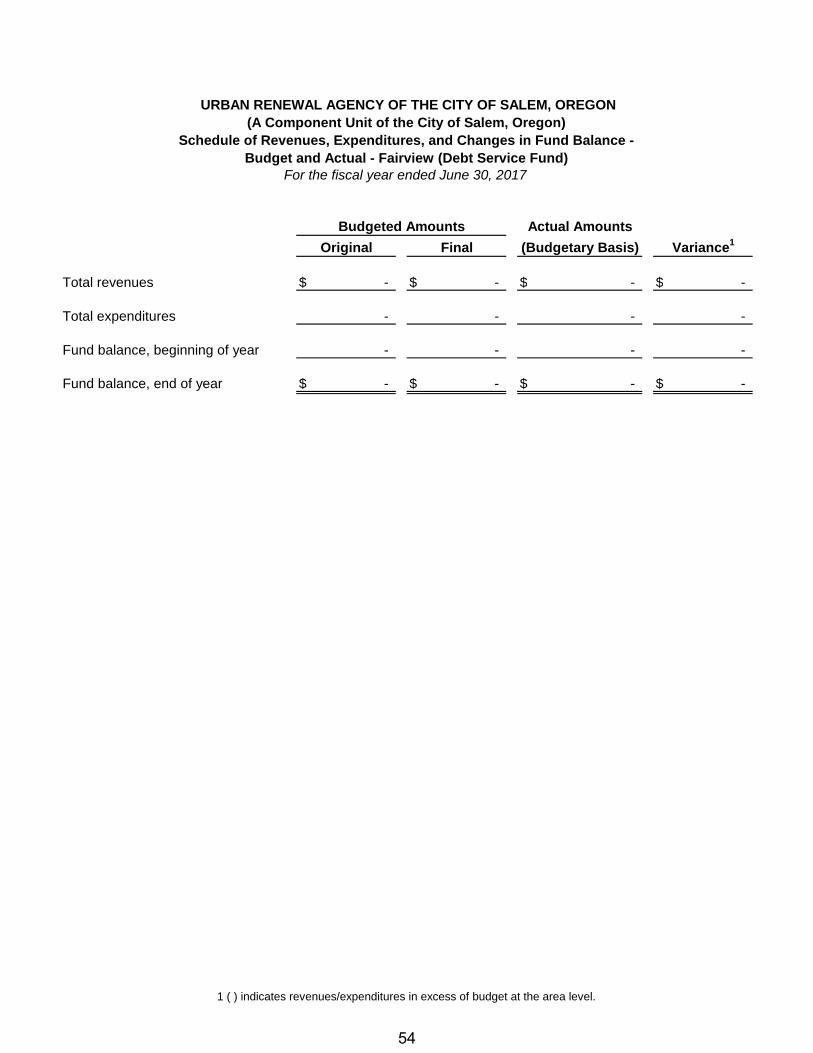
Total revenues $ - $ - $ - $ -
Total expenditures - - - -
Fund balance, beginning of year - - - -
Fund balance, end of year $ - $ - $ - $ -
URBAN RENEWAL AGENCY OF THE CITY OF SALEM, OREGON
(A Component Unit of the City of Salem, Oregon)
Schedule of Revenues, Expenditures, and Changes in Fund Balance -
Budget and Actual - Fairview (Debt Service Fund)For the fiscal year ended June 30, 2017
(Budgetary Basis)
Actual Amounts
Variance1
FinalOriginal
Budgeted Amounts
1 ( ) indicates revenues/expenditures in excess of budget at the area level.
54

Revenues
Property taxes $ 2,868,520 $ 2,868,520 $ 2,760,021 $ 108,499Interest on investments 51,730 51,730 110,752 (59,022)
Total revenues 2,920,250 2,920,250 2,870,773 49,477
Expenditures
Debt servicePrincipal 1,500,000 1,500,000 1,500,000 -Interest 500 500 94 406
Total expenditures 1,500,500 1,500,500 1,500,094 406
Excess (deficiency) of revenues overexpenditures 1,419,750 1,419,750 1,370,679 49,071
Fund balance, beginning of year 9,662,320 9,662,320 9,654,964 7,356
Fund balance, end of year $ 11,082,070 $ 11,082,070 $ 11,025,643 $ 56,427
Variance1(Budgetary Basis)
Actual Amounts
FinalOriginal
Budgeted Amounts
URBAN RENEWAL AGENCY OF THE CITY OF SALEM, OREGON(A Component Unit of the City of Salem, Oregon)
Schedule of Revenues, Expenditures, and Changes in Fund Balance -
Budget and Actual - North Gateway (Debt Service Fund)For fiscal year ended June 30, 2017
1 ( ) indicates revenues/expenditures in excess of budget
55

Revenues
Property taxes $ 1,149,980 $ 1,149,980 $ 1,159,440 $ (9,460)Interest on investments 14,500 14,500 12,533 1,967
Total revenues 1,164,480 1,164,480 1,171,973 (7,493)
Expenditures
Debt servicePrincipal 613,000 613,000 613,000 -Interest 17,310 17,310 10,203 7,107
Total expenditures 630,310 630,310 623,203 7,107
Excess (deficiency) of revenues overexpenditures 534,170 534,170 548,770 (14,600)
Fund balance, beginning of year 776,840 776,840 761,394 15,446
Fund balance, end of year $ 1,311,010 $ 1,311,010 $ 1,310,164 $ 846
Actual Amounts
(Budgetary Basis)
URBAN RENEWAL AGENCY OF THE CITY OF SALEM, OREGON
(A Component Unit of the City of Salem, Oregon)
Schedule of Revenues, Expenditures, and Changes in Fund Balance -
Budget and Actual - West Salem (Debt Service Fund)For the fiscal year ended June 30, 2017
Variance1Original Final
Budgeted Amounts
1 ( ) indicates revenues/expenditures in excess of budget at the area level.
56

Revenues
Property taxes $ 773,080 $ 773,080 $ 734,580 $ 38,500Interest on investments 12,530 12,530 22,024 (9,494)
Total revenues 785,610 785,610 756,604 29,006
Expenditures
Debt servicePrincipal 200,000 200,000 200,000 -Interest 200 200 13 187
Total expenditures 200,200 200,200 200,013 187
Excess (deficiency) of revenues overexpenditures 585,410 585,410 556,591 28,819
Fund balance, beginning of year 1,801,340 1,801,340 1,794,206 7,134
Fund balance, end of year $ 2,386,750 $ 2,386,750 $ 2,350,797 $ 35,953
URBAN RENEWAL AGENCY OF THE CITY OF SALEM, OREGON
(A Component Unit of the City of Salem, Oregon)
Schedule of Revenues, Expenditures, and Changes in Fund Balance -
Budget and Actual - Mill Creek Industrial Park (Debt Service Fund)For the fiscal year ended June 30, 2017
Variance1FinalOriginal
Budgeted Amounts Actual Amounts
(Budgetary Basis)
1 ( ) indicates revenues/expenditures in excess of budget at the area level.
57

Revenues
Property taxes $ 581,290 $ 581,290 $ 645,406 $ (64,116)Interest on investments 6,500 6,500 9,958 (3,458)
Total revenues 587,790 587,790 655,364 (67,574)
Total expenditures - - - -
Fund balance, beginning of year 533,150 533,150 524,823 8,327
Fund balance, end of year $ 1,120,940 $ 1,120,940 $ 1,180,187 $ (59,247)
URBAN RENEWAL AGENCY OF THE CITY OF SALEM, OREGON
(A Component Unit of the City of Salem, Oregon)
Schedule of Revenues, Expenditures, and Changes in Fund Balance -
Budget and Actual - McGilchrist (Debt Service Fund)For the fiscal year ended June 30, 2017
(Budgetary Basis)
Actual Amounts
Variance1
FinalOriginal
Budgeted Amounts
1 ( ) indicates revenues/expenditures in excess of budget
58

Revenues
Property taxes $ 236,760 $ 236,760 $ 266,766 $ (30,006)Interest on investments 1,200 1,200 2,883 (1,683)
Total revenues 237,960 237,960 269,649 (31,689)
Total expenditures - - - -
Excess (deficiency) of revenues overexpenditures 237,960 237,960 269,649 (31,689)
Fund balance, beginning of year 169,480 169,480 166,998 2,482
Fund balance, end of year $ 407,440 $ 407,440 $ 436,647 $ (29,207)
URBAN RENEWAL AGENCY OF THE CITY OF SALEM, OREGON
(A Component Unit of the City of Salem, Oregon)
Schedule of Revenues, Expenditures, and Changes in Fund Balance -
Budget and Actual - South Waterfront (Debt Service Fund)For the fiscal year ended June 30, 2017
(Budgetary Basis)
Actual Amounts
Variance1
Original Final
Budgeted Amounts
1 ( ) indicates revenues/expenditures in excess of budget
59

This page intentionally left blank
60
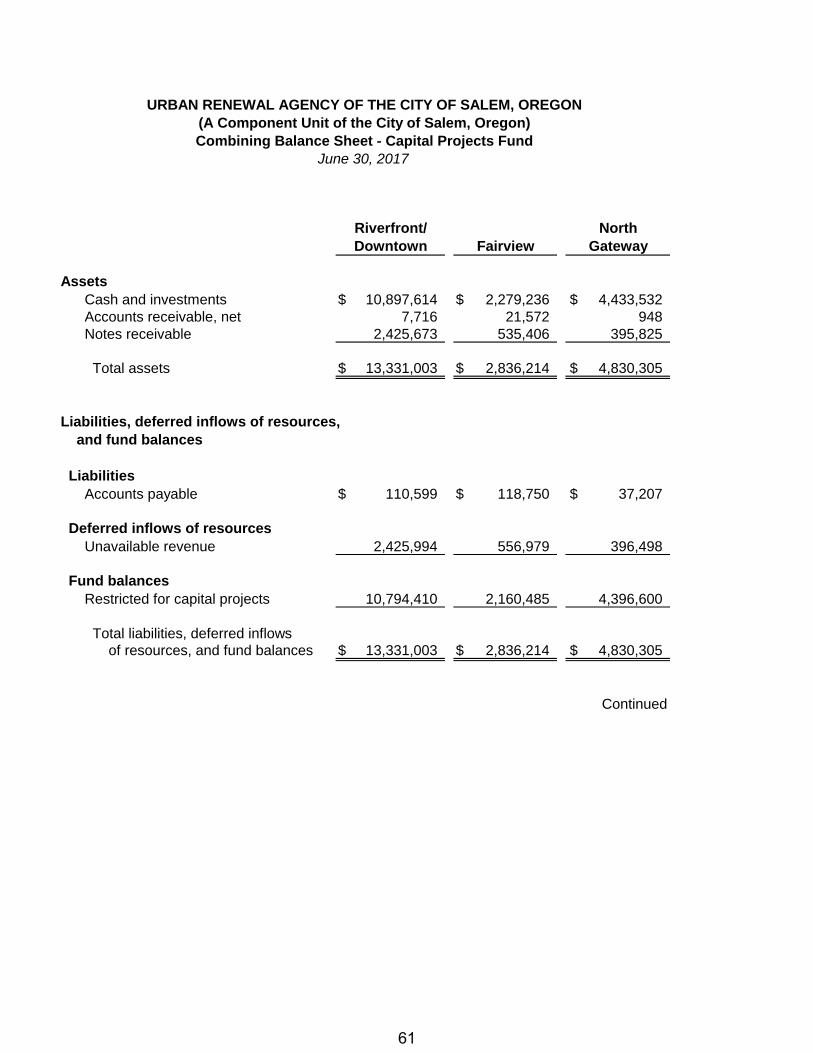
Assets
Cash and investments $ 10,897,614 $ 2,279,236 $ 4,433,532Accounts receivable, net 7,716 21,572 948Notes receivable 2,425,673 535,406 395,825
Total assets $ 13,331,003 $ 2,836,214 $ 4,830,305
Liabilities, deferred inflows of resources,
and fund balances
Liabilities
Accounts payable $ 110,599 $ 118,750 $ 37,207
Deferred inflows of resources
Unavailable revenue 2,425,994 556,979 396,498
Fund balances
Restricted for capital projects 10,794,410 2,160,485 4,396,600
Total liabilities, deferred inflowsof resources, and fund balances $ 13,331,003 $ 2,836,214 $ 4,830,305
Continued
Fairview
North
Gateway
URBAN RENEWAL AGENCY OF THE CITY OF SALEM, OREGON
Riverfront/
(A Component Unit of the City of Salem, Oregon)
Combining Balance Sheet - Capital Projects FundJune 30, 2017
Downtown
61

$ 1,288,604 $ 643,281 $ 1,980,972 $ 482,708 $ 22,005,947- - - - 30,236- - - - 3,356,904
$ 1,288,604 $ 643,281 $ 1,980,972 $ 482,708 $ 25,393,087
$ - $ 256,894 $ - $ - $ 523,450
- - - - 3,379,471
1,288,604 386,387 1,980,972 482,708 21,490,166
$ 1,288,604 $ 643,281 $ 1,980,972 $ 482,708 $ 25,393,087
Concluded
Total
West
McGilchristSalem
South
Waterfront
Industrial
Park
Mill Creek
62

Revenues
Interest on investments $ 75,174 $ 25,109 $ 51,380Intergovernmental 361,741 - -Loan payments received 1,479,119 39,240 35,237Rents 6,428 - 4,050Other - 500 500
Total revenues 1,922,462 64,849 91,167
Expenditures
Materials and services 2,348,758 192,156 2,340,201
Excess (deficiency) of revenues overexpenditures (426,296) (127,307) (2,249,034)
Other financing sources (uses)
Transfers in 4,000,000 - 1,500,000
Excess (deficiency) of revenues overexpenditures and other financing
sources (uses) 3,573,704 (127,307) (749,034)
Fund balance, beginning of year 7,220,706 2,287,792 5,145,634
Fund balance, end of year $ 10,794,410 $ 2,160,485 $ 4,396,600
Continued
North
GatewayFairview
For the fiscal year ended June 30, 2017
Downtown
URBAN RENEWAL AGENCY OF THE CITY OF SALEM, OREGON
(A Component Unit of the City of Salem, Oregon)
Combining Schedule of Revenues, Expenditures, and Changes in Fund Balances -
Capital Projects Fund
Riverfront/
63

$ 16,783 $ 8,732 $ 24,910 $ 4,846 $ 206,93410,541 121,896 - - 494,178
- - - - 1,553,596- - - - 10,478- - - - 1,000
27,324 130,628 24,910 4,846 2,266,186
451,142 812,439 526,890 11,916 6,683,502
(423,818) (681,811) (501,980) (7,070) (4,417,316)
- 200,000 - - 5,700,000
(423,818) (481,811) (501,980) (7,070) 1,282,684
1,712,422 868,198 2,482,952 489,778 20,207,482
$ 1,288,604 $ 386,387 $ 1,980,972 $ 482,708 $ 21,490,166
Concluded
Total
West
Salem Waterfront
South
Park McGilchrist
Mill Creek
Industrial
64

Revenues
Rents $ - $ - $ 6,428 $ (6,428)
Intergovernmental - - 361,741 (361,741)
Interest on investments 25,000 25,000 75,174 (50,174)Loan payments received 217,920 217,920 1,479,119 (1,261,199)Other 298,590 298,590 - 298,590
Total revenues 541,510 541,510 1,922,462 (1,380,952)
Expenditures
Operations 11,363,550 11,363,550 2,348,758 9,014,792
Excess (deficiency) of revenues overexpenditures (10,822,040) (10,822,040) (426,296) (10,395,744)
Other financing sources (uses)
Issuance of short-term capitalrelated debt 4,000,000 4,000,000 4,000,000 -
Excess (deficiency) of revenues overexpenditures and other financingsources (uses) (6,822,040) (6,822,040) 3,573,704 (10,395,744)
Fund balance, beginning of year 6,822,040 6,822,040 7,220,706 (398,666)
Fund balance, end of year $ - $ - $ 10,794,410 $ (10,794,410)
URBAN RENEWAL AGENCY OF THE CITY OF SALEM, OREGON
(A Component Unit of the City of Salem, Oregon)
Schedule of Revenues, Expenditures, and Changes in Fund Balance -
Budget and Actual - Riverfront/Downtown (Capital Projects Fund)For the fiscal year ended June 30, 2017
Variance1FinalOriginal
Budgeted Amounts Actual Amounts
(Budgetary Basis)
1 ( ) indicates revenues/expenditures in excess of budget
65

Revenues
Interest on investments $ 14,000 $ 14,000 $ 25,109 $ (11,109)Loan payments received - - 39,240 (39,240)Other - - 500 (500)
Total revenues 14,000 14,000 64,849 (50,849)
Expenditures
Operations 2,294,290 2,294,290 192,156 2,102,134
Excess (deficiency) of revenues overexpenditures (2,280,290) (2,280,290) (127,307) (2,152,983)
Fund balance, beginning of year 2,280,290 2,280,290 2,287,792 (7,502)
Fund balance, end of year $ - $ - $ 2,160,485 $ (2,160,485)
URBAN RENEWAL AGENCY OF THE CITY OF SALEM, OREGON
(A Component Unit of the City of Salem, Oregon)
Schedule of Revenues, Expenditures, and Changes in Fund Balance -
Budget and Actual - Fairview (Capital Projects Fund)For the fiscal year ended June 30, 2017
Variance1(Budgetary Basis)
Actual Amounts
FinalOriginal
Budgeted Amounts
1 ( ) indicates revenues/expenditures in excess of budget
66

Revenues
Rents $ - $ - $ 4,050 $ (4,050)Interest on investments 25,670 25,670 51,380 (25,710)Loan payments received 29,290 29,290 35,237 (5,947)Other - - 500 (500)
Total revenues 54,960 54,960 91,167 (36,207)
Expenditures
Operations 6,652,790 6,652,790 2,340,201 4,312,589
Excess (deficiency) of revenues over
expenditures (6,597,830) (6,597,830) (2,249,034) (4,348,796)
Other financing sources (uses)
Proceeds of short-term capital related debt 1,500,000 1,500,000 1,500,000 -
Excess (deficiency) of revenues overexpenditures and other financingsources (uses) (5,097,830) (5,097,830) (749,034) (4,348,796)
Fund balance, beginning of year 5,097,830 5,097,830 5,145,634 (47,804)
Fund balance, end of year $ - $ - $ 4,396,600 $ (4,396,600)
URBAN RENEWAL AGENCY OF THE CITY OF SALEM, OREGON
(A Component Unit of the City of Salem, Oregon)
Schedule of Revenues, Expenditures, and Changes in Fund Balance -
Budget and Actual - North Gateway (Capital Projects Fund)For the fiscal year ended June 30, 2017
(Budgetary Basis)
Actual Amounts
Variance1FinalOriginal
Budgeted Amounts
1 ( ) indicates revenues/expenditures in excess of budget
67
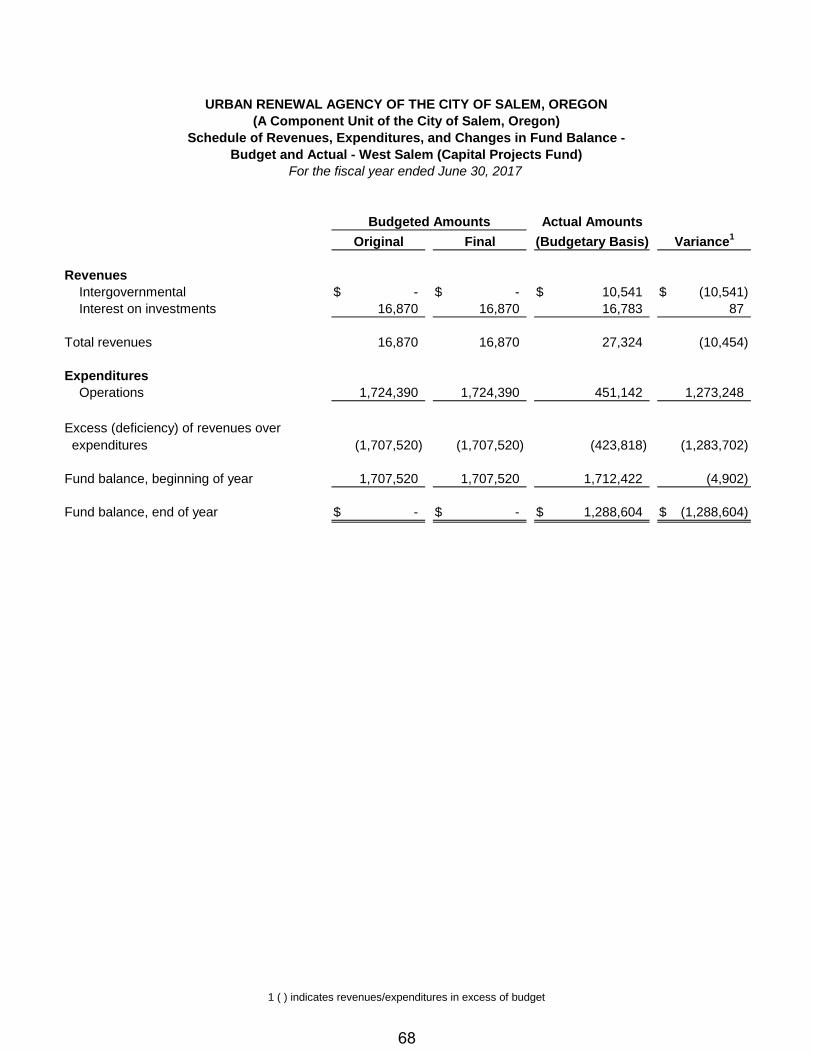
Revenues
Intergovernmental $ - $ - $ 10,541 $ (10,541)
Interest on investments 16,870 16,870 16,783 87
Total revenues 16,870 16,870 27,324 (10,454)
Expenditures
Operations 1,724,390 1,724,390 451,142 1,273,248
Excess (deficiency) of revenues over
expenditures (1,707,520) (1,707,520) (423,818) (1,283,702)
Fund balance, beginning of year 1,707,520 1,707,520 1,712,422 (4,902)
Fund balance, end of year $ - $ - $ 1,288,604 $ (1,288,604)
URBAN RENEWAL AGENCY OF THE CITY OF SALEM, OREGON
(A Component Unit of the City of Salem, Oregon)
Schedule of Revenues, Expenditures, and Changes in Fund Balance -
Budget and Actual - West Salem (Capital Projects Fund)
For the fiscal year ended June 30, 2017
(Budgetary Basis)
Actual Amounts
Variance1FinalOriginal
Budgeted Amounts
1 ( ) indicates revenues/expenditures in excess of budget
68

Revenues
Intergovernmental $ - $ - $ 121,896 $ (121,896)
Interest on investments 8,790 8,790 8,732 58
Loan payments received 1,227,920 1,227,920 - 1,227,920
Total revenues 1,236,710 1,236,710 130,628 1,106,082
Expenditures
Operations 2,342,790 2,342,790 812,439 1,530,351
Excess (deficiency) of revenues over
expenditures (1,106,080) (1,106,080) (681,811) (424,269)
Other financing sources (uses)
Issuance of short-term capital related debt 200,000 200,000 200,000 -
Excess (deficiency) of revenues over
expenditures and other financing
sources (uses) (906,080) (906,080) (481,811) (424,269)
Fund balance, beginning of year 906,080 906,080 868,198 37,882
Fund balance, end of year $ - $ - $ 386,387 $ (386,387)
URBAN RENEWAL AGENCY OF THE CITY OF SALEM, OREGON
(A Component Unit of the City of Salem, Oregon)
Schedule of Revenues, Expenditures, and Changes in Fund Balance -
Budget and Actual - Mill Creek Industrial Park (Capital Projects Fund)
For the fiscal year ended June 30, 2017
Variance1FinalOriginal
Budgeted Amounts Actual Amounts
(Budgetary Basis)
1 ( ) indicates revenues/expenditures in excess of budget
69

Revenues
Interest on investments $ 8,500 $ 8,500 $ 24,910 $ (16,410)
Expenditures
Operations 2,728,800 2,728,800 526,890 2,201,910
Excess (deficiency) of revenues over
expenditures (2,720,300) (2,720,300) (501,980) (2,218,320)
Fund balance, beginning of year 2,720,300 2,720,300 2,482,952 237,348
Fund balance, end of year $ - $ - $ 1,980,972 $ (1,980,972)
URBAN RENEWAL AGENCY OF THE CITY OF SALEM, OREGON
(A Component Unit of the City of Salem, Oregon)
Schedule of Revenues, Expenditures, and Changes in Fund Balance -
Budget and Actual - McGilchrist (Capital Projects Fund)
For the fiscal year ended June 30, 2017
Variance1(Budgetary Basis)
Actual Amounts
FinalOriginal
Budgeted Amounts
1 ( ) indicates revenues/expenditures in excess of budget
70

Revenues
Interest on investments $ 1,500 $ 1,500 $ 4,846 $ (3,346)
Expenditures
Operations 483,380 483,380 11,916 471,464
Excess (deficiency) of revenues over
expenditures (481,880) (481,880) (7,070) (474,810)
Fund balance, beginning of year 481,880 481,880 489,778 (7,898)
Fund balance, end of year $ - $ - $ 482,708 $ (482,708)
URBAN RENEWAL AGENCY OF THE CITY OF SALEM, OREGON
(A Component Unit of the City of Salem, Oregon)
Schedule of Revenues, Expenditures, and Changes in Fund Balance -
Budget and Actual - South Waterfront (Capital Projects Fund)For the fiscal year ended June 30, 2017
(Budgetary Basis)
Actual Amounts
Variance1FinalOriginal
Budgeted Amounts
1 ( ) indicates revenues/expenditures in excess of budget
71

Riverfront/Downtown
682000 Project coordination/support $ - $ 275,637 $ -682005 Conference Center-HUD Sec 108 loan payments - 97,437 -682018 Toolbox grant program - 966,844 -682023 Marketing for Salem Conference Center - 291,196 -682063 Parking structures - 267,675 -682074 Signal improvement - Union & Commercial - 125,000 -682081 Art pedestals - 34,142 -682082 Church & High Streets conversion - 214,301 -682083 Streetscape Concepts - 13,582 -682084 Streetscape Alley Wayfinding - 26,651 -682085 Streetscape-North Block Design - 9,837 -682086 Alley Improvements - 381 -682087 Left Turn Lane Removals - 11,138 -682088 Streetscape-Murals - 14,937 -
Total Riverfront/Downtown 11,363,550 2,348,758 9,014,792
Fairview
683000 Project coordination/support - 34,071 -683014 PC&S toolbox & grant admin - 3,085 -683015 Loan-Gilgamesh 2 - 155,000 -
Total Fairview Industrial Park 2,294,290 192,156 2,102,134
North Gateway
684000 Project coordination/support - 167,553 -684004 N Gtwy-Loan Application Fees - 383 -684014 N Gtwy-Bond Pro & Iss Exp - 180 -684032 Toolbox grant program - 1,057,445 -684041 PC&S toolbox & grant admin - 5,969 -684045 Cherry Ave stormwater improvements - 826,259 -684046 Food Alternatives Analysis - 65,393 -684047 Madras Holdings LLC Loan - 99,505 -684048 N Gateway-Streetscape Imprvnts - 53,536 -684049 Garten Services Loan - 63,978 -
Total North Gateway 6,652,790 2,340,201 4,312,589
West Salem
685000 Project coordination/support - 92,810 -685008 Toolbox Grant Program - 276,583 -685025 PC&S toolbox & grant admin - 14,390 -685028 Business district feasibility study - 67,359 -
Total West Salem 1,724,390 451,142 1,273,248
Mill Creek Industrial Park
686000 Project coordination/support - 121,512 -686011 SEDCOR contract - 75,000 -686022 Mill Crk Parkway/Kuebler Blvd - 603,499 -686023 Mill Creek Drive - 12,428 -
Total Mill Creek Industrial Park 2,342,790 812,439 1,530,351
Budget Actual Variance
URBAN RENEWAL AGENCY OF THE CITY OF SALEM, OREGON
(A Component Unit of the City of Salem, Oregon)
Schedule of Expenditures by Project - Budget and Actual
For the fiscal year ended June 30, 2017
72

Budget Actual Variance
URBAN RENEWAL AGENCY OF THE CITY OF SALEM, OREGON
(A Component Unit of the City of Salem, Oregon)
Schedule of Expenditures by Project - Budget and Actual
For the fiscal year ended June 30, 2017
McGilchrist
687000 Project coordination/support - 10,090 -687002 Design road improvements, 12th to 25th - 516,800 -
Total McGilchrist 2,728,800 526,890 2,201,910
South Waterfront
688000 Project coordination/support - 11,916 -
Total South Waterfront 483,380 11,916 471,464
Total all projects $ 27,589,990 $ 6,683,502 $ 20,906,488
73

Actual Amounts
Original Final (Budgetary Basis) Variance1
Revenues
Sales, fees, licenses, and permits $ 2,390,000 $ 2,390,000 $ 3,084,526 $ (694,526)Intergovernmental 450,000 450,000 - 450,000Rents 1,010,000 1,010,000 1,541,436 (531,436)Other 298,590 298,590 5,878 292,712
Total revenues 4,148,590 4,148,590 4,631,840 (483,250)
Expenditures
Operations 3,848,840 3,848,840 3,948,657 (99,817) 2
Contingency 463,120 463,120 - 463,120
Total expenditures 4,311,960 4,311,960 3,948,657 363,303
Excess (deficiency) of revenuesover expenditures (163,370) (163,370) 683,183 (846,553)
Other financing sources (uses)Transfers out (350,000) (350,000) (304,367) (45,633)
Net change in fund balance (513,370) (513,370) 378,816 (892,186)
Fund balance, beginning of year 513,370 513,370 509,636 3,734
Fund balance, end of year $ - $ - 888,452 $ (888,452)
Reconciliation to generally accepted accounting principles:Capital assets 24,706,185
Net position at end of year $ 25,594,637
Budgeted Amounts
URBAN RENEWAL AGENCY OF THE CITY OF SALEM, OREGON
(A Component Unit of the City of Salem, Oregon)
Schedule of Revenues, Expenditures, and Changes in Fund Balance
Budget and Actual - Salem Convention Center (Proprietary Fund)
For the fiscal year ended June 30, 2017
1 ( ) indicates revenues/expenditures in excess of budget2 Budget violation. See note on page 44
74

This page intentionally left blank
75

475 Cottage Street NE, Suite 200, Salem, Oregon 97301
(503) 581-7788
INDEPENDENT AUDITOR’S REPORT
REQUIRED BY OREGON STATE REGULATIONS
Agency Officials
Urban Renewal Agency of the City of Salem, Oregon
Salem, Oregon
We have audited, in accordance with auditing standards generally accepted in the United States of America, the
basic financial statements of the Urban Renewal Agency of the City of Salem, Oregon (a component unit of the
City of Salem, Oregon) as of and for the year ended June 30, 2017, and have issued our report thereon dated
December 5, 2017.
Compliance and Other Matters
As part of obtaining reasonable assurance about whether the Agency’s financial statements are free of material
misstatement, we performed tests of its compliance with certain provisions of laws, regulations, contracts, and
grants, including the provisions of Oregon Revised Statutes as specified in Oregon Administrative Rules 162-10-
000 through 162-10-320 of the Minimum Standards for Audits of Oregon Municipal Corporations, noncompliance
with which could have a direct and material effect on the determination of financial statements amounts. However,
providing an opinion on compliance with those provisions was not an objective of our audit, and accordingly, we
do not express such an opinion.
We performed procedures to the extent we considered necessary to address the required comments and disclosures
which included, but were not limited to the following:
Deposit of public funds with financial institutions (ORS Chapter 295).
Indebtedness limitations, restrictions and repayment.
Budgets legally required (ORS Chapter 294).
Insurance and fidelity bonds in force or required by law.
Programs funded from outside sources.
Authorized investment of surplus funds (ORS Chapter 294).
Public contracts and purchasing (ORS Chapters 279A, 279B, 279C).
Accountability for collecting or receiving money by elected officials – no money was collected or
received by elected officials.
In connection with our testing nothing came to our attention that caused us to believe the Agency was not in
substantial compliance with certain provisions of laws, regulations, contracts, and grants, including the provisions
of Oregon Revised Statutes as specified in Oregon Administrative Rules 162-10-000 through 162-10-320 of the
Minimum Standards for Audits of Oregon Municipal Corporations except for the over expenditure of budgeted
appropriations as detailed in the notes to the financial statements.
76

Internal Control Over Financial Reporting
In planning and performing our audit of the financial statements, we considered the Agency's internal control over
financial reporting to determine the audit procedures that are appropriate in the circumstances for the purpose of
expressing our opinion on the financial statements, but not for the purpose of expressing an opinion on the
effectiveness of the Agency's internal control. Accordingly, we do not express an opinion on the effectiveness of
the Agency's internal control.
Restriction on Use
This report is intended solely for the information and use of the Agency Officials and management of the Urban
Renewal Agency of the City of Salem, Oregon and the Oregon Secretary of State and is not intended to be and
should not be used by anyone other than these parties.
GROVE, MUELLER & SWANK, P.C.
CERTIFIED PUBLIC ACCOUNTANTS
By:
Ryan T. Pasquarella, A Shareholder
December 5, 2017
77