Embed Size (px)
Citation preview

CITY
OF LO
ND
ON
INV
ESTM
ENT G
RO
UP
PLC
AN
NU
AL REPO
RT & A
CCOU
NTS 2016/2017
CITY OF LONDONI N V E S T M E N T G R O U P P L C
ANNUAL REPORT & ACCOUNTS 2016/2017
London office77 Gracechurch StreetLondonEC3V 0ASUnited Kingdom
Telephone: + 44 (0) 207 711 0771Facsimile: + 44 (0) 207 711 0772
US East Coast officeThe Barn1125 Airport RoadCoatesville, PA 19320United StatesTelephone: + 1 610 380 2110Facsimile: + 1 610 380 2116
US West Coast officePlaza Center10900 NE 8th StreetSuite 1519Bellevue, WA 98004United StatesTelephone: + 1 610 380 0090
Singapore office20 Collyer Quay#10-04Singapore 049319
Telephone: + 65 6236 9136Facsimile: + 65 6532 3997
Dubai officeUnit 2, 2nd FloorThe Gate Village Building 1Dubai International Financial CentrePO Box 506695DubaiUnited Arab Emirates
Telephone: + 971 (0)4 423 1780Facsimile: + 971 (0)4 437 0510
www.citlon.co.uk
City of London Investment Group PLC is an establishedasset management group which has built its reputation,with an institutional client focus, by specialising inEmerging Market closed-end fund investment.
In recent years the Group has expanded its range toinclude Developed, Frontier and Global Tactical AssetAllocation closed-end fund strategies.
CITY OF LONDONI N V E S T M E N T G R O U P P L C
www.citlon.co.ukDesigned and produced by fourthquarter
The paper used in this document containsmaterials sourced from responsiblymanaged and sustainable commercialforests, certified in accordance with the FSC® (Forest Stewardship Council).

OverviewCorporate governance
Financial statements
Shareholder information
Strategic report
SUMMARY
City of London Investment Group Annual Report 2016/2017 1
Notice of Annual General Meeting 91Notes to the Notice of Annual General Meeting 93Explanation of the business of the Annual General Meeting 94Company information 96
Independent Auditor’s report 60Financial statementsConsolidated income statement 64Consolidated and Company statement of comprehensive income 64Consolidated and Company statement of financial position 65Consolidated statement of changes in equity 66Company statement of changes in equity 67Consolidated and Company cash flow statement 68Notes to the financial statements 69
Board of Directors 36Directors’ report 38Corporate governance report 40Nomination Committee report 43Audit Committee report 45Directors’ remuneration report 48Statement of Directors’ responsibilities 59
Chief Executive Officer’s statement 4What we do 8How we do it 9The management of (at) CLIM 10Our strategy and objectives 11Business development review 18Key performance indicators 20Risk management 25Financial review 28Corporate and socialresponsibility policy 31
CONTENTS
•Funds under management (FuM) at 30th June 2017 wereUS$4.7 billion (2016: US$4.0 billion), an increase of 17%.In sterling terms, FuM increased by 20% to £3.6 billion(2016: £3.0 billion). The MSCI Emerging Markets TR NetIndex rose 24% in US$ terms over the same period.
•Revenues, representing the Group’s management chargeson FuM, were £31.3 million (2016: £24.4 million). Profit beforetax was £11.6 million (2016: £8.0 million).
•Basic earnings per share were 36.9p (2016: 23.3p) after atax charge of 21% (2016: 27%) of pre-tax profits.
•An increased final dividend of 17p per share is recommended,payable on 31st October 2017 to shareholders on theregister on 13th October 2017, making a total for the yearof 25p (2016: 24p)
3.78.9
Funds under management US$bn Pre-tax profit £m
8.0
13 14 15 16 17
7.4
Summary 1Chairman’s statement 2
Note: Financial years prior to 2014 have not beenrestated for the adoption of IFRS10.
3.94.2
4.7
4.0
8.9
13 14 15 16 17
11.6

CHAIRMAN’S STATEMENT
“I consider our current level of profits to be soundly basedwith encouraging upside from the pipeline of potentialnew client money for both our traditional EM productsand the diversification strategies.”
2 City of London Investment Group Annual Report 2016/2017
I joined the Board of your Company at thetime of the flotation on AIM in 2006 andI will be retiring at the end of the currentyear – it is a good moment, therefore, forme to review the progress that has beenmade over the last decade.
The primary driver of our fortunes hasbeen the Emerging Markets, where onaverage over the decade we have investedat least 90 percent of our Funds underManagement (“FuM”). They say a picturecan say more than a thousand words – thatis no less true for the graph set out belowwhich reminds us that the ride has beeneventful but rewarding for shareholders:
As can be seen, the Emerging Markets havebeen both volatile and, certainly comparedto the previous decade, have shown only
erratic growth. What I find to beparticularly impressive is how, withoutmuch of a following wind, your Companyhas been able amply to reward shareholderswell ahead of the performance of theunderlying markets. Good investmentperformance justified relatively high feeswhilst attracting new client money – onflotation in 2006 FuM totalled £1.5 billioncompared to £3.6 billion at end June 2017.The increased revenues, combined witheffective cost controls and the considereduse of technology driving efficiencies,ensured that shareholders have been wellrewarded through a combination ofdividends and stock price.
ResultsFor the year to 30th June 2017 pre-taxprofits were £11.6 million (2016: £8.0
0
50
100
150
200
250
300
350
400
450
500
30.6
.06
30.6
.07
30.6
.08
30.6
.09
30.6
.10
30.6
.11
30.6
.12
30.6
.13
30.6
.14
30.6
.15
30.6
.16
30.6
.17
Reba
sed
to 1
00
CLIG FUM* CLIG LN* M1EF*
*Rebased from the AIM listing in April 2006. Figures are in GBP and reflect total returns. Past performance is no guarantee of future results.Source: City of London Investment Management, MSCI, Bloomberg
CLIM FuM and Stock Performance Compared with the MSCI EM TR Index April 2006 to June 2017

OverviewCorporate governance
Financial statements
Shareholder information
Strategic report
City of London Investment Group Annual Report 2016/2017 3
million) and profits after a tax charge of21% were £9.1 million (2016: profits of£5.9 million after a tax charge of 27%).The tax charge includes an estimatedrefund of c.£0.4 million relating to prioryears’ US state taxes which if excludedwould result in a Group tax rate of 24%of pre-tax profits. Basic and fully dilutedearnings per share were 36.9p and 36.7prespectively (2016: 23.3p and 23.1p).
As highlighted previously, the major driverdetermining our results is the average levelof FuM over the year. The underlyingMSCI Emerging Markets TR Index(M1EF) performed strongly, averaging405 and reaching 453 at the year-end,compared to an average of 351 closing at364 the previous year. Our FuM wereUS$4.7 billion (£3.6 billion) at 30th June2017 (2016: US$4.0 billion or £3.0billion). Although this represented a17% increase in US$ terms, it fell shortof the increase of 24% in the M1EF asthe good EM performance led clients torebalance their portfolios away from theEMs. As we report in sterling and with,in addition, some 40% of our costsbeing sterling based, profits have againbenefited from a much weaker sterlingcurrency relative to our US dollar basedincome. In previous years I have illustratedthis with a sterling/dollar Post-Tax Profitmatrix; this year an updated matrix iscontained in our Finance Director’sreport. The average rate during the yearwas 1.27 compared to 1.48 for theprevious 12 months. These two driversaccounted for most of the impressiveprofit increase reported above.
DividendsShareholders will be aware that we have awell established policy applied with someflexibility of targeting a 1.2x dividend coverover a rolling 5 year period. In view ofboth the improvement in underlyingprofitability and the positive outlook forthe current year it has been decided torecommend an increase of 1p in the final
dividend giving a total for the year of25p and a dividend cover for the year of1.46x (2016: 0.97x).
BoardYour Board continues to evolve and thisyear we have both good news and not sogood news to report. Allan Bufferd, ourSenior Independent Director whose wisecounsel we have benefited from for 9 years, decided that with the start of hisninth decade beckoning it was time forhim to draw stumps on some of his veryextensive commitments. He retired at theyear end and we have been privileged towelcome as of 1st July Susannah Nicklin tothe Board. Information on Susannah’sbackground and experience was includedin our announcement on 13th June butsuffice to say she is exceptionally wellqualified to contribute to your Board.Barry Aling has become our new SeniorIndependent Director and Susannah nowchairs the Nominations Committee.
We again carried out a formal evaluation of the performance of the Board and itsmembers. With the conclusion that each Director is operating effectively Irecommend that all Directors be re-elected.
OutlookWith developed markets at all-time highsseemingly oblivious to the mountingpolitical uncertainties in a number ofkey OECD countries, emerging marketswill continue to be vulnerable to bothgeopolitical and monetary events.However, weak sterling has benefited yourCompany’s profitability substantially andwhilst predicting currencies is a fool’s gameI consider our current level of profits to besoundly based with encouraging upsidefrom the pipeline of potential new clientmoney for both our traditional EMproducts and the diversification strategies.
Our AGM is on Monday 23rd October at our Gracechurch Street offices andall shareholders are most welcome.
Following the meeting’s formal businessyour Directors look forward to havingthe opportunity to meet and talk toindividual shareholders.
In the meantime I do encourage allstakeholders, especially clients andshareholders, to read on as I believe thatthis report presents a quite exceptional levelof relevant information and transparency onour business underlining our commitmentto excellence in all that we do.
David CardaleChairman14th September 2017

STRATEGIC REPORT
CHIEF EXECUTIVE OFFICER’S STATEMENT
“After ten years, the Emerging Markets as measured by theMSCI EM T/R Index have just regained the highs of 2008.For us this has been a tough time with doubts about ourasset class abounding.”
4 City of London Investment Group Annual Report 2016/2017
An EM Bull Market at last!After ten years, the Emerging Markets asmeasured by the MSCI EM T/R Indexhave just regained the highs of 2008.
For us this has been a tough time withdoubts about our asset class abounding.
Fortunately our Clients, Shareholders andStaff have remained loyal as we havecontinued to do what we do best, which isto take advantage of the volatility that hasbeen created by others.
CLIG Corporate StabilityDuring this past bear market we have, as mentioned, been successful in keepingmost of our Clients. This has beenachieved with a Client Retention programthat has not just taken time and humanresources, but also an ongoing deeper anddeeper dive into our Investment Process.The improved information we can nowobtain for our clients and for ourselves via the use of technology is to meextraordinary. SWAD, Attribution, AssetAllocation Discrepancies and CountryAllocation data would not have been ableto be calculated as accurately as they aretoday even five years ago. Being forensic inour research and using no third party datawhen making investment decisions areadditional Core Values that we bring to
our work as markets become moreperfectly priced, volatility is reduced andalpha generation is potentially reduced.
DiversificationAs this process has worked for theEmerging Markets team for well over 25 years, it’s now also working for ourDeveloped, Frontier and Global TacticalAsset Allocation strategies.
Further, these latter teams within CLIMhave continued to grow in both absoluteand relative terms when compared to our core business of Emerging Markets. I believe it would be fair to say that interms of our ambitions regardingDiversification, we are in a good place interms of both momentum and profitability.
Over time an increased contribution togrowth from these diversification productswill benefit all stakeholders:
• Clients via an increased product offering, albeit one that continues tobenefit from our core competency within closed-end funds
• Shareholders via a less volatile (andpotentially greater) stream of earningsfrom a more diverse client base
• Staff via improved opportunities forprogression and, from the underpinningsof business profitability, potentiallyhigher remuneration.
Margins and Cost ControlsI would make the point that while marginsat all active managers have remained underpressure, we as a firm, as a result of ourconsistent outperformance relative to ourbenchmarks, have not had significantdownward pressure.
Shareholders should take note of the verydisciplined control we have demonstratedover our costs. To the extent that these
have increased, it is to a great extent downto the fall in GBP which, when translatingthe costs – including staff salariesassociated with our offices in the US,Singapore and Dubai – into sterling, hashad a detrimental effect on our overheads.
During this unique period of increasedGBP denominated revenues we have taken the opportunity to enhance our IT infrastructure. These enhancementsaddress the interrelated components ofrefreshing the Firm’s infrastructure andaddressing cybersecurity solutions. Theseexpenditures were both necessary andposition us well for the future.
In terms of containing costs, this year willbe no different. It’s my view that when one is at the early stages of a bull market,increased bonuses (variable costs) are asubstitute for increased salaries (fixed costs).
In our focus to contain costs we shouldnot forget our longer term plans for the(unfortunately inevitable) bear market.
Rather than join in with our peers whoinvariably start cost cutting once the bearmarket arrives, we prefer to keep stafftogether thus maintaining not justcorporate knowledge but their focus andlong-term commitment.
Advances in, and use of TechnologyWe would say that we have a very well triedand tested Investment Process. The smartthing though is to continue to delve intodata via the use of technology while havingbetter and better trained practitioners. Thisapproach, while very important within anInvestment Management context, is equallyimportant in terms of support staff. As wesay, this is a team firm and there is no single person here who is considered pivotal interms of the investment performance wehave achieved.

OverviewCorporate governance
Financial statements
Shareholder information
Strategic report
City of London Investment Group Annual Report 2016/2017 5
I have referenced IT on a number ofoccasions in the last few paragraphs. Wewill continue to invest in technologysolutions for the foreseeable future not justto assist our Investment Process but, asClients become more demanding and weare held increasingly accountable, toenhance support systems to leave staff timefor more “added value” tasks. It will alsoenable us to save on the additional staffcosts that would otherwise be inevitable.
Investment PerformanceIn terms of investment performance thefollowing tables represent data fromeVestment Alliance. This data isrepresentative of the different assetclasses referenced earlier.
Remuneration Policy within a Team EnvironmentAs CLIG Shareholders will be aware, while complying with our regulatoryresponsibilities, we are reluctant to becompartmentalized into the “one size fitsall” environment that has recently beenpromoted as the way that certain FinancialService companies should be run in termsof their Remuneration Policy.
Specifically, we are going to resist,to the extent possible, employee KeyPerformance Indicators (KPIs) that arebeing promoted as a solution to theselfishness and greed that have beenreferenced as contributing factors to theinstability that developed around 2008and what ultimately became known asthe “Financial Crisis”.
Having followed this industry for over 50 years it seems to me that the employeeKPI approach, while addressing a smallcomponent of the problem, does not dealwith its root cause.
In my opinion, not only are FinancialService companies being encouraged tomeasure employee performance over adiscrete (and I would suggest excessivelyshort term) period, but this performancedoes not necessarily relate to a firm’sprofits, reputation, long-term viability orits strategic positioning in the marketplace.
1 Year 3 Years 5 Years
35
30
25
20
15
10
5
0
-5
Rate
of R
etur
n (%
)
City of London: Global Emerging Markets SMA CompositeMSCI: MSCI EM TR Index NetS&P: Emerging Front Super Comp BMI NetiShares MSCI EM Index Fund (EEM US)
1 Year 3 Years
Rat
e of
Ret
urn
(%)
City of London Investment Group PLC: Tactical IncomeCLIM: Blended 50/50 S&P 500/Barclays US Aggregate Index
-5
-2.5
0
2.5
5
7.5
10
12.5
15
17.5
20
Global Emerging Markets SMAComposite Returns as of: 30th June 2017 According to eVestment Alliance*
1 Year 3 Years 5 Years
Rat
e of
Ret
urn
(%)
City of London Investment Group PLC: The Frontier Emerging Markets Fund
S&P: Extended Frontier 150 Index (NET)
-10
-5
0
5
10
15
20
25
30
35
Frontier Markets Quartile Returns as of:30th June 2017 According to eVestment Alliance*
CLIM Tactical Income Quartile Returnsas of: 30th June 2017 According to eVestment Alliance*
1 Year Since inception2.83 Years
Rat
e of
Ret
urn
(%)
CLIM: GTAA CompositeCLIM: Blended 50/50 MSCI ACWI/Barclays Global Agg Index
-7.5
-5
-2.5
0
2.5
5
7.5
10
12.5
15
17.5
2022.5
25
27.5
City of London Investment Group PLC: Global Developed CEF
1 Year 3 Years 5 Years
Rat
e of
Ret
urn
(%)
-5
0
5
10
15
20
25
30
35
40
MSCI Index: MSCI ACWI ex-US-ND
CLIM GTAA Quartile Returns as of: 30thJune 2017 According to eVestment Alliance*
Global Developed InternationalComposite Returns as of: 30th June 2017 According to eVestment Alliance*
NotesFrontier Markets*92.9% of the universe has been updated through to 30th June 2017Past performance is no guarantee of future results.Source: eASE Analytics System, S&P, Bloomberg
Global Developed International*98.0% of the universe has been updated through to 30th June 2017Past performance is no guarantee of future results.Source: eASE Analytics System
Global Emerging Markets SMA Composite returns*94% of the universe has been updated through to 30th June 2017Past performance is no guarantee of future results.Source: eASE Analytics System, S&P, MSCI, Bloomberg
CLIM Tactical Income*98.1% of the universe has been updated through to 30th June 2017Past performance is no guarantee of future results.Source: eASE Analytics System
CLIM GTAA*97.6% of the universe has been updated through to 30th June 2017Past performance is no guarantee of future results.Source: eASE Analytics System, MSCI, Barclays, Bloomberg
Note: Returns are gross of fees for relevant CLIM fund and peer group.

STRATEGIC REPORT
CHIEF EXECUTIVE OFFICER’S STATEMENTCONTINUED
6 City of London Investment Group Annual Report 2016/2017
By attempting to focus on employee KPIs,I would say that our industry is beingencouraged to attach a level of credibilityto the achievement of targets that cannotbe measured within the context of theaforementioned four points.
Further, in my opinion, KPIs couldactually motivate employees to increase therisks to which corporations are vulnerableas it is extraordinarily difficult todetermine if a relevant period in terms of measurement is one, three or five years,such periods being complicated in terms of remuneration by clawback and deferral.This is made even more complicated interms of how the benefit could be received– in cash or in shares?
There are three components that in myopinion are far more relevant to anydiscussion regarding Remuneration Policy.
First, what is the quality of the Profits –their volatility and the extent to whichthey are forecastable?
Second, the quality of the people beingemployed – are they selfish and greedy, orare they like those in other Industries suchas in Architecture, Dentistry andAccountancy where there is both a profitmotive and where employees can becomewealthy, but where this can only occurwithin a team environment?
Third, in many instances within parts of theFinancial Service industry, Profits andProfitability actually have nothing to do withindividual performance. They are a functionof volatility (of markets), (client) activity andthe strategic positioning of the business.
At the risk of stating the obvious, thequality of many Financial Service Profits isvery poor, on a long-term basis they arenot forecastable or sustainable and it’s forthese reasons that forty or fifty years agowe were paid low salaries (keeping thefixed overhead down) while letting staffbenefit hugely in the good times.
Over the past decades as our industry has developed, while the volatility of
profits has not changed, both the securityof employees and their remuneration has altered, effectively transferring thoserisks to Shareholders (and sometimes to tax payers). In contrast, thecomponents of our Remuneration(i.e., 30% profit share participation foremployees) have not been reset in 25years. How many other Financial Servicesfirms can say the same?
Within a CLIG and CLIM perspective we understand that Emerging Marketsstock market and currency volatility arewith us to stay.
We also understand that our Shareholders(who own the business) will be muchbetter off if we work within a teamenvironment. By definition we cannot,or would find it extraordinarily difficultto, reward employees within a teamenvironment via individual KPIs. Topropose KPIs would effectively pit oneemployee against another when thecompetition is actually outside the firm.
COVERAGE HIGHLIGHTS

OverviewCorporate governance
Financial statements
Shareholder information
Strategic report
City of London Investment Group Annual Report 2016/2017 7
CLIG KPIsElsewhere in this annual report you willfind our response to a requirement thatUK Listed Companies select KPIs viawhich they can be measured.
Unlike internal KPIs which we consider tobe divisive, we continue to embracecorporate KPIs as we believe the competitionis with other companies that undertakesimilar work to CLIM and CLIG.
For the past few years we have used as ourkey KPI a comparison of the Total Returnof our Share Price compared with selectedpeers since CLIG was listed in 2006. Thisremains the main measurement tool thatwe believe best reflects the relative successof our company in the marketplace.
In an attempt to determine the mostrelevant drivers or components of whatcontributes to our main KPI, we haveadded six measures that we believe allowShareholders to determine progress. Thesecould be considered leading indicators interms of potentially determining the valueof CLIG Shares.
We have selected funds under management,operating margin, cost/income ratio,
investment performance, client longevityand staff longevity as the six additional KPIs.These are referenced on pages 20 to 24.
My intended CLIG Share salesAs in previous years I would like to adviseShareholders of my intentions regardingshare sales.
As I approach retirement on 31st December2019, I have announced that at specificlevels of CLIG’s Share Price I will sell shares.
In my opinion this is an accountable wayto proceed and is in keeping with the waythat I have run the firm since its inception.
Previous sales of 500,000 have been madeat 50p increments and while as a principlethis has worked, 500,000 is a largenumber of Shares and also seems to act –for a period of time – as a ceiling for theCLIG Share Price.
As a result, going forward, my intention is going to change from selling 500,000Shares at 50p increments to selling250,000 Shares at 25p increments.
This will mean that having recently sold500,000 Shares at 400p, my next sale
will be 250,000 at 425p subject to closeperiods etc.
Information for ShareholdersWe spend a lot of time providinginformation to Shareholders that webelieve provides them with relevant data to make investment decisions.
Some of this information relates to ourStrategy while some of it is provided in an attempt to demystify our business.
As an example we provide on our web site monthly information regarding FuM (£ and US$), Income and Expenses.
You are very welcome to join ourInvestor Afternoon on 23rd October.For further details of the event, and toregister your interest, please [email protected]
Barry OlliffChief Executive Officer14th September 2017
Salary and remuneration comparisonWe thought that we would steal a march on legislation to be introduced by the Department for Business, Energy and IndustrialStrategy by including information that compares my salary / remuneration with average staff salaries / remuneration.
While some of this information is available elsewhere within the Accounts this format is significantly more succinct.
2008 CEO/ 2009 CEO/ 2010 CEO/ 2011 CEO/ 2012 CEO/ 2013 CEO/ 2014 CEO/ 2015 CEO/ 2016 CEO/ 2017 CEO/ Total employee Total employee Total employee Total employee Total employee Total employee Total employee Total employee Total employee Total employee £'000 multiple £'000 multiple £'000 multiple £'000 multiple £'000 multiple £'000 multiple £'000 multiple £'000 multiple £'000 multiple £'000 multiple
CEO salary 175 4 213 4 219 4 228 4 226 4 229 4 241 4 228 4 245 4 283 4
Employeeaverage salary 43 49 54 59 61 62 67 63 65 73
CEO remuneration 1,112 12 740 9 1,125 11 1,178 10 981 9 548 6 660 7 773 7 729 7 999 8
Employee averageremuneration 96 79 101 114 107 94 97 105 101 121
AverageHeadcount(excluding directors) 46 51 58 64 73 73 67 67 68 68
Average GBP/USDexchange rate 2.01 1.64 1.6 1.58 1.59 1.57 1.62 1.57 1.48 1.27
Note: Remuneration for the purpose of this table includes salary and profit share only, based on average headcount and spend each year.

8 City of London Investment Group Annual Report 2016/2017
STRATEGIC REPORT
WHAT WE DO
At City of London, we focus on designing products thatreflect our expertise. Initially, and for many years since thefirm was founded, that expertise was very specific to closed-end funds which offered emerging markets exposure.
This was subsequently complemented byresearch into the underlying equities that are represented within closed-end fundportfolios. Next came dedicated accessproducts such as the China A-share CEFwhich invests in closed-end funds listedin Shanghai and Shenzhen.
In addition, our global trading platform andknowledge of closed-end funds has beenextended to meet client demand. We nowmanage funds applying our investmentprocess to Developed markets, Frontiermarkets, Global Tactical Asset Allocationand Private Equity via closed-end funds.
So today, while we remain both proud andprotective of our “boutique” status, we seekto meet client needs across a suite ofproducts anchored by our core expertise inthe global universe of closed-end funds.
OverviewCorporate governance
Financial statements
Shareholder information
Strategic report
City of London Investment Group Annual Report 2016/2017 9
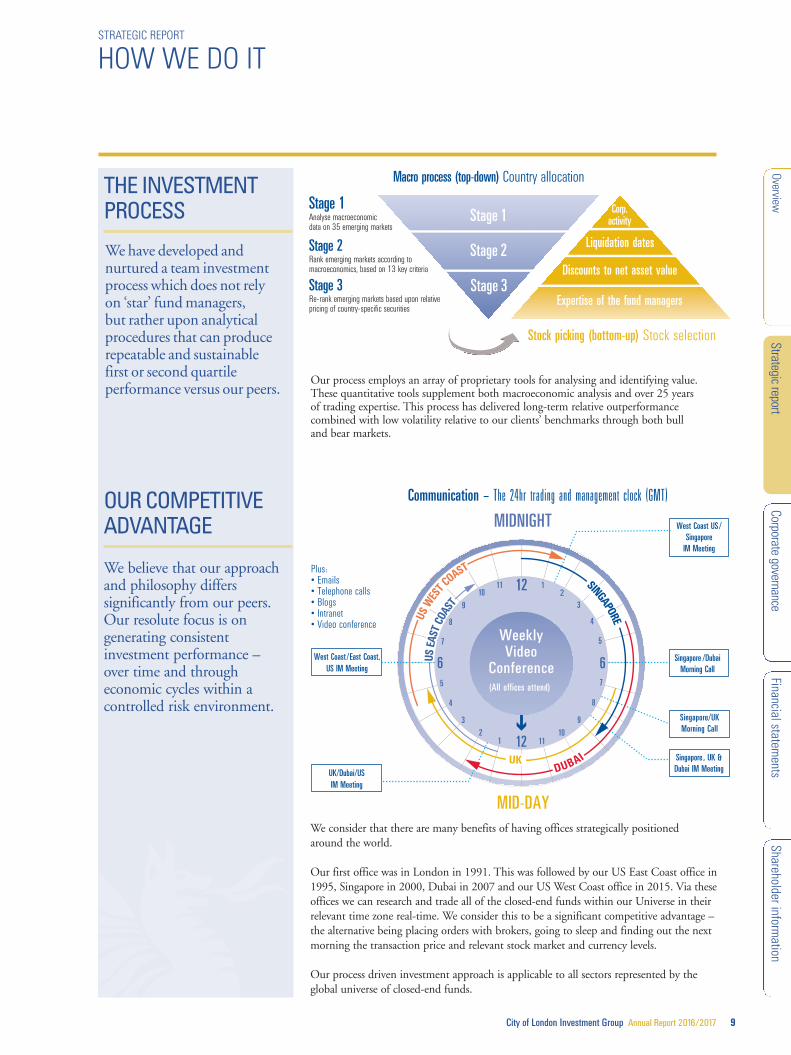
Our process employs an array of proprietary tools for analysing and identifying value.These quantitative tools supplement both macroeconomic analysis and over 25 years of trading expertise. This process has delivered long-term relative outperformancecombined with low volatility relative to our clients’ benchmarks through both bull and bear markets.
STRATEGIC REPORT
HOW WE DO IT
We consider that there are many benefits of having offices strategically positionedaround the world.
Our first office was in London in 1991. This was followed by our US East Coast office in1995, Singapore in 2000, Dubai in 2007 and our US West Coast office in 2015. Via theseoffices we can research and trade all of the closed-end funds within our Universe in theirrelevant time zone real-time. We consider this to be a significant competitive advantage –the alternative being placing orders with brokers, going to sleep and finding out the nextmorning the transaction price and relevant stock market and currency levels.
Our process driven investment approach is applicable to all sectors represented by theglobal universe of closed-end funds.
Stage 1Analyse macroeconomicdata on 35 emerging markets
Stage 2Rank emerging markets according tomacroeconomics, based on 13 key criteria
Stage 3Re-rank emerging markets based upon relativepricing of country-specific securities
Stage 1
Macro process (top-down) Country allocation
Stock picking (bottom-up) Stock selection
Corp.activity
Liquidation dates
Discounts to net asset value
Expertise of the fund managers
Stage 2
Stage 3
12 1
11
2
10
3
9
4
8
5
7
66
7
5
8
4
9
3
10
2
11
1 12
MIDNIGHT
MID-DAY
UK/Dubai/USIM Meeting
West Coast /East Coast,US IM Meeting
West Coast US /Singapore
IM Meeting
Singapore /DubaiMorning Call
Singapore/UKMorning Call
Singapore , UK &Dubai IM Meeting
Plus:• Emails • Telephone calls• Blogs• Intranet• Video conference
WeeklyVideo
Conference(All offices attend)
US E
AST
COAS
T
US W
EST C
OAST
UK
SINGAPORE
DUBAI
Communication – The 24hr trading and management clock (GMT)
We have developed andnurtured a team investmentprocess which does not rely on ‘star’ fund managers, but rather upon analyticalprocedures that can producerepeatable and sustainable first or second quartileperformance versus our peers.
OUR COMPETITIVEADVANTAGE
THE INVESTMENTPROCESS
We believe that our approachand philosophy differssignificantly from our peers.Our resolute focus is ongenerating consistentinvestment performance – over time and througheconomic cycles within acontrolled risk environment.

STRATEGIC REPORT
THE MANAGEMENT 0F (AT) CLIM
10 City of London Investment Group Annual Report 2016/2017
We support teams. What this means is thatwe discourage the cult of the individual or“star”, believing that the risks associatedwith a star culture are detrimental to bothshareholders and clients. The averagetenure of the 13 CLIM fund managersis a little over 13 years.
The present Management Team atCLIM have an average tenure of 12 years.The members of the CLIM SeniorManagement Team are the executiveDirectors plus: Ashleigh Simms, Headof Compliance; Michael Edmonds,Head of the Developed/GTAA strategy;
Jeff Gill, Head of the Frontier Strategy;Ted Sevick, Portfolio Manager – EM CEF;Alan Hoyt, Head of IT; Anthony Inverso,Operations Manager; and Courtney Short,Head of US Client Servicing.
OUR STRATEGY AND OBJECTIVES
Our responsibility is to keep these three stakeholders in balance (avoid conflicts) and toensure that each of their interests is safeguarded.
1. T
HE S
HAR E
H OL D
E RS
OWN TH
E B U S I N E S S2. TH E C L I E NTS PAY TH E BI LLS
3 . TH E E M P LOYE E S MANAG E TH E B U S I N E S S
EXPECT. . .• Relevant risk controls• Quality earnings• Cost controls
EXPECT. . .• Superior investment performance• Openness and accountability• Ethical treatment
EXPECT. . .• Fair treatment• Open communication• To share in success
We believe that both ourstrategy and our objectivesshould be to support the threestakeholders in our business.
The way in which we manage our business is different too.We are very risk-averse. Profits, margins and costs are carefullymanaged to provide our staff with appropriate remunerationand shareholders with significant, repeatable dividends.
THE CLIENTS (PAY THE BILLS)
Expect: Superior investmentperformance, Openness andaccountability, Ethical treatment.
THE EMPLOYEES (MANAGE THE BUSINESS)
Expect: Fair treatment, Opencommunications, To share in success.
THE SHAREHOLDERS (OWN THE BUSINESS)
Expect: Relevant risk controls,Quality earnings, Cost controls.
OverviewCorporate governance
Financial statements
Shareholder information
Strategic report
City of London Investment Group Annual Report 2016/2017 11
STRATEGIC REPORT
OUR STRATEGY AND OBJECTIVES
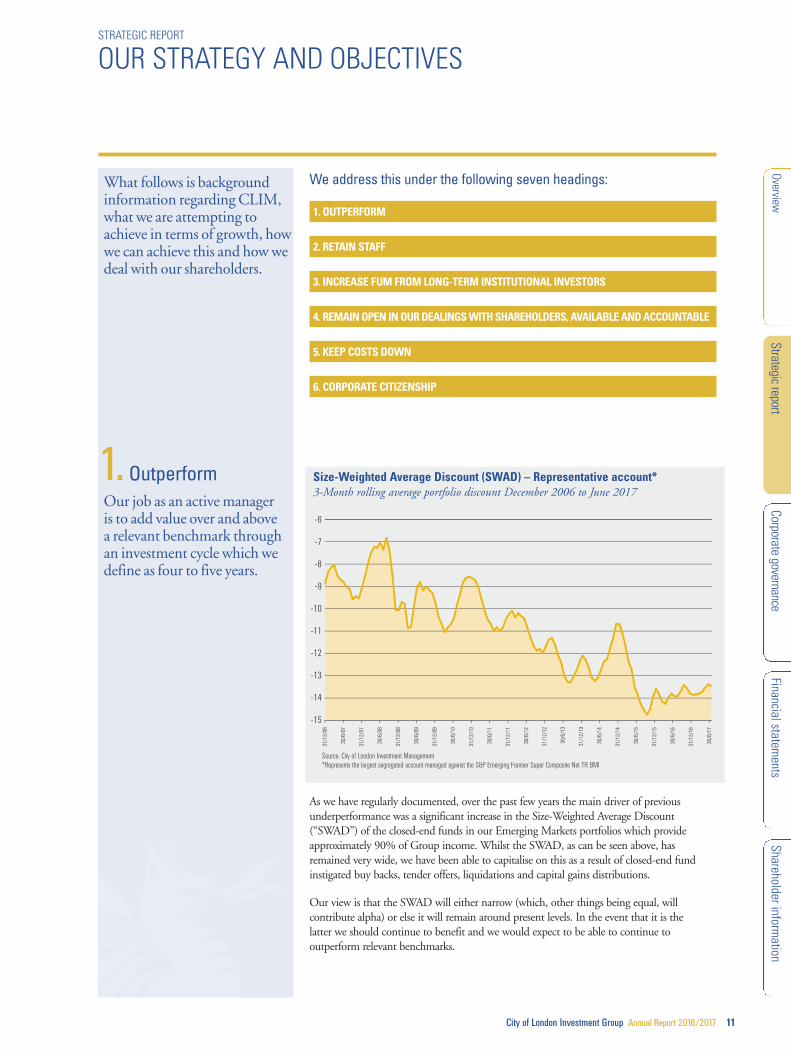
As we have regularly documented, over the past few years the main driver of previousunderperformance was a significant increase in the Size-Weighted Average Discount(“SWAD”) of the closed-end funds in our Emerging Markets portfolios which provideapproximately 90% of Group income. Whilst the SWAD, as can be seen above, hasremained very wide, we have been able to capitalise on this as a result of closed-end fundinstigated buy backs, tender offers, liquidations and capital gains distributions.
Our view is that the SWAD will either narrow (which, other things being equal, willcontribute alpha) or else it will remain around present levels. In the event that it is the latter we should continue to benefit and we would expect to be able to continue tooutperform relevant benchmarks.
Source: City of London Investment Management*Represents the largest segregated account managed against the S&P Emerging Frontier Super Composite Net TR BMI
31/1
2/06
30/6
/07
31/1
2/07
30/6
/08
31/1
2/08
30/6
/09
31/1
2/09
30/6
/10
31/1
2/10
30/6
/11
31/1
2/11
30/6
/12
31/1
2/12
30/6
/13
31/1
2/13
30/6
/14
31/1
2/14
30/6
/15
31/1
2/15
30/6
/17
31/1
2/16
30/6
/16
-15
-14
-13
-12
-11
-10
-9
-8
-7
-6
Size-Weighted Average Discount (SWAD) – Representative account*3-Month rolling average portfolio discount December 2006 to June 2017
What follows is backgroundinformation regarding CLIM,what we are attempting toachieve in terms of growth, howwe can achieve this and how wedeal with our shareholders.
Our job as an active manager is to add value over and above a relevant benchmark throughan investment cycle which wedefine as four to five years.
1.Outperform
We address this under the following seven headings:
1. OUTPERFORM
2. RETAIN STAFF
3. INCREASE FUM FROM LONG-TERM INSTITUTIONAL INVESTORS
4. REMAIN OPEN IN OUR DEALINGS WITH SHAREHOLDERS, AVAILABLE AND ACCOUNTABLE
5. KEEP COSTS DOWN
6. CORPORATE CITIZENSHIP

STRATEGIC REPORT
OUR STRATEGY AND OBJECTIVESCONTINUED
12 City of London Investment Group Annual Report 2016/2017
As shareholders would expect,in a firm that has always used a partnership approach, we takea very long-term view with regard to remuneration.
2. Retain staffA testament to our approach is that CLIM’s 13 fund managers have an average tenureof over 13 years.
Our remuneration policy is stress-tested in a number of ways:
• We have to deal with very volatile cash flows, thus our need to keep salaries towardsthe lower end of market levels.
• With five offices (not all of which are in financial centres) in four countries we haveto be aware of different pay scales, policies, costs of living and tax rates.
In the table below we show the relationship between staff and Directors’ salaries andbonuses, referred to as remuneration, from 2008 to 2017.
Other benefits, such as pension, share option awards, the Employee Incentive Plan andmedical insurance have been excluded from this table.
Remuneration costs for Directors and Employees from 2008 to 2017
2008 2009 08/09 2010 09/10 2011 10/11 2012 11/12 2013(6) 12/13 2014 13/14 2015 14/15 2016 15/16 2017 16/17 Total Total % Total % Total % Total % Total % Total % Total % Total % Total % £'000 £'000 change £'000 change £'000 change £'000 change £'000 change £'000 change £'000 change £'000 change £'000 change
Executive
Barry Olliff (1) 1,112 740 -33% 1,125 52% 1,178 5% 981 -17% 548 -44% 660 20% 773 17% 729 -6% 999 37%
D F Allison (2) 579 354 -39% 538 52% 648 20% 565 -13% 282 -50% – – – – – – – –
T WGriffith (1) 330 254 -23% 384 51% 466 21% 414 -11% 326 -21% 334 2% 459 37% 473 3% 653 38%
C MYuste (1) (3) 330 254 -23% 383 51% 465 21% 413 -11% 325 -21% 334 3% 458 37% 88 -81% – –
V S Tannahill (4) – – – – – – – – – 69 – – – – – – – – –
MD Dwyer (5) – – – – – – – – – – – – – – – 317 – 619 95%
T A Rodrigues (5) – – – – – – – – – – – – – – – 178 – 474 166%
Executive Directors 2,351 1,602 -32% 2,430 52% 2,757 13% 2,373 -14% 1,550 -35% 1,328 -14% 1,690 27% 1,785 6% 2,745 54%
Employees 4,444 4,031 -9% 5,851 45% 7,297 25% 7,822 7% 6,845 -12% 6,504 -5% 7,006 8% 6,863 -2% 8,205 20%
Total 6,795 5,633 -17% 8,281 47% 10,054 21% 10,195 1% 8,395 -18% 7,832 -7% 8,696 11% 8,648 -1% 10,950 27%
Average head count
Executive Directors 4 4 4 4 4 4 3 3 4 4
Employees 46 51 58 64 73 73 67 67 68 68
Percentage of aggregate spend
Executive Directors 35% 28% 29% 27% 23% 18% 17% 19% 21% 25%
Employees 65% 72% 71% 73% 77% 82% 83% 81% 79% 75%
Director average 588 401 -32% 608 52% 689 13% 593 -14% 388 -35% 443 14% 563 27% 446 -21% 686 54%
Employee average 96 79 -18% 101 28% 114 13% 107 -6% 93 -13% 97 4% 104 7% 100 -4% 120 20%
Profit before tax 10,695 5,384 -50% 10,379 93% 13,150 27% 11,462 -13% 10,160 -11% 7,242 -29% 8,791 21% 7,796 -11% 11,590 49%Dividend per share 19.5p 15.0p -23% 22.0p 47% 24.0p 9% 24.0p 0% 24.0p 0% 24.0p 0% 24.0p 0% 24.0p 0% 25.0p 4%
(1) Remuneration paid in US dollars(2) Resigned 15th April 2013(3) Resigned 31st December 2015(4) Appointed 1st January 2013 and resigned 15th April 2013. Remuneration disclosed for this period only.(5) Appointed to Board 19th October 2015(6) Excludes loss of office payments
OverviewCorporate governance
Financial statements
Shareholder information
Strategic report
City of London Investment Group Annual Report 2016/2017 13
2. Retain staff(continued)
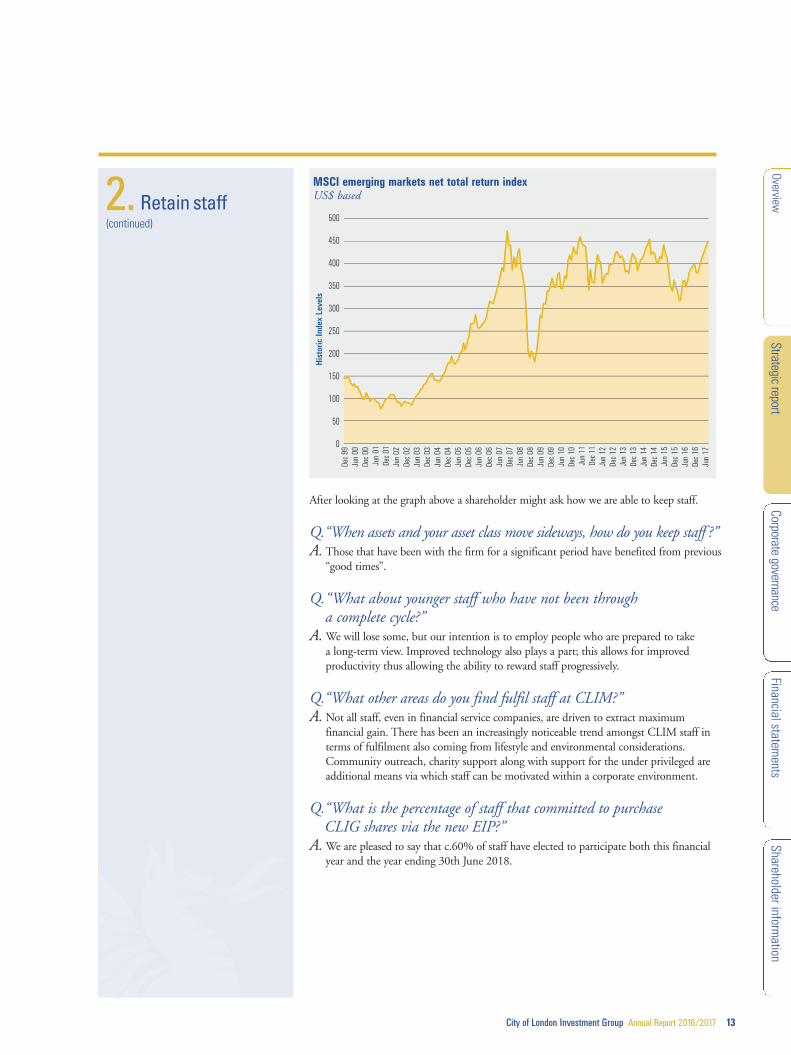
After looking at the graph above a shareholder might ask how we are able to keep staff.
Q.“When assets and your asset class move sideways, how do you keep staff ?”A. Those that have been with the firm for a significant period have benefited from previous
“good times”.
Q.“What about younger staff who have not been through a complete cycle?”
A.We will lose some, but our intention is to employ people who are prepared to take a long-term view. Improved technology also plays a part; this allows for improvedproductivity thus allowing the ability to reward staff progressively.
Q.“What other areas do you find fulfil staff at CLIM?”A. Not all staff, even in financial service companies, are driven to extract maximum
financial gain. There has been an increasingly noticeable trend amongst CLIM staff interms of fulfilment also coming from lifestyle and environmental considerations.Community outreach, charity support along with support for the under privileged areadditional means via which staff can be motivated within a corporate environment.
Q.“What is the percentage of staff that committed to purchaseCLIG shares via the new EIP?”
A.We are pleased to say that c.60% of staff have elected to participate both this financialyear and the year ending 30th June 2018.
His
toric
Inde
x Le
vels
Jun
00De
c 00
Jun
01De
c 01
Dec
99
Jun
02De
c 02
Jun
03De
c 03
Jun
04De
c 04
Jun
05De
c 05
Jun
06De
c 06
Jun
07De
c 07
Jun
08De
c 08
Jun
09De
c 09
Jun
10De
c 10
Jun
11De
c 11
Jun
12De
c 12
Jun
14De
c 14
Jun
13De
c 13
Jun
16De
c 15
Jun
17De
c 16
Jun
15
500
450
400
350
300
250
200
150
100
50
0
MSCI emerging markets net total return indexUS$ based

STRATEGIC REPORT
OUR STRATEGY AND OBJECTIVESCONTINUED
14 City of London Investment Group Annual Report 2016/2017
What our clients have in common is a desire to access the returns available in ‘difficult’emerging markets. We have provided that access over many years and cycles and havegenerated long-term outperformance for our clients. This allows our clients to then focus on their asset class allocation decisions.
We have c.150 institutional clients, many of whom have been clients of CLIM for manyyears. The graph below shows the length of time that clients have been invested with us.
1994
(1
)
1995
(2
)
1996
(2
)
1997
(1
)
1998
(1
)
1999
(1
)
2003
(1
)
2004
(13)
2005
(14)
2006
(9
)
2007
(7
)
2008
(9
)
2009
(16)
2010
(21)
2011
(21)
2012
(2
)
2013
(3
)
2014
(3
)
2015
(4
)
2016
(13)
2017
(2
)
$800
$700
$600
$500
$400
$300
$200
$100
$0
Calendar year of initial client inception, along with number of accounts incepted
US$
mill
ions
Client market value as of 30th June 2017
The ten largest clients are all North American.
Pension 36%
Endowment 21% Retail 1%
Foundation 23%
Healthcare 11%
Other Institutions 8%
City of London’s client baseis, and always has been,overwhelmingly US basedand institutional. Our clientsinclude pension funds,foundations, endowmentsand other institutionalmoney managers.
3. Increase FuM from long-terminstitutional investors
Ten largest clients by market valueMarket value
Client 30th June 2017 Inception date
1 Foundation $660,726,706 May 2014
2 Public Pension $402,031,430 September 2009
3 Public Pension $221,255,158 October 2013
4 Public Pension $184,653,501 April 2016
5 Endowment $179,445,932 June 2004
6 Endowment $173,437,666 November 1996
7 Corporate Pension $136,891,981 June 2006
8 Corporate Pension $131,109,660 March 1997
9 Healthcare $130,880,551 February 2009
10 Public Pension $122,001,533 February 2015
Total $2,342,434,118
CLIENTS BY SECTOR

OverviewCorporate governance
Financial statements
Shareholder information
Strategic report
City of London Investment Group Annual Report 2016/2017 15
Where possible, we take the opportunity to meet shareholders. This might be at one-to-one meetings with our larger institutional holders or at group meetings with advisersand individual shareholders. We believe that our shareholders have a right to know whatto expect from us. For this reason, we try to make all of our announcements simpleand accessible. We also provide supplementary data such as the following graph fromour management accounts, which is updated on our website after relevantannouncements (www.citlon.co.uk).
We have attempted to provide an illustrative framework which we update twice a year toenable interested parties to calculate our post-tax profits based upon some key assumptions.The dividend cover chart on the next page shows the quarterly estimated cost of amaintained dividend against actual post-tax profits for last year, the current year and theassumed post-tax profit for next financial year based upon the following assumptions:
• Starting point Current FuM (June 2017).
• Net increase in 2017/2018: emerging market CEF strategy US$250m, straight-lined to June 2018.
• Net increase in 2017/2018: non-emerging market CEF strategies US$250m, straight-linedto June 2018.
• Operating margin adjusted monthly for change in product mix and commission run-off.
• Market growth: 0%.
• Corporation tax based on an estimated average rate of 23% for 2017/2018.
• Increase in overhead: 3%.
• EIP charge: 2%.
• Exchange rate assumed to be £1/US$1.3 for entire period.
• Number of CLIG Shares in issue (26.9m) less those held by the ESOP Trust (1.5m) as at 30th June 2017.
Income (£K) Expenses (£K) MSCI EM Net Total ReturnFuM (£M)FuM (US$M)
Aug-
12
Oct-1
2
Dec-
12
Feb-
13
Apr-1
3
Jun-
13
Aug-
13
Oct-1
3
Dec-
13
Feb-
14
Apr-1
4
Jun-
14
Aug-
14
Oct-1
4
Dec-
14
Feb-
15
Apr-1
5
Jun-
15
Aug-
15
Oct-1
5
Dec-
15
Feb-
16
Apr-1
6
Jun-
16
Aug-
16
Oct-1
6
Dec-
16
Feb-
17
Apr-1
7
Jun-
17 0
500
1000
1500
2000
2500
3000
3500
4000
4500
5000
5500
6000
0
500
1000
1500
2000
2500
3000
3500
4000
4500
5000
5500
6000
Rolling five year Funds under Management and ProfitabilityExcludes exceptional items of income and expenditure
4.Remain open in our dealings withshareholders, availableand accountable

STRATEGIC REPORT
OUR STRATEGY AND OBJECTIVESCONTINUED
16 City of London Investment Group Annual Report 2016/2017
Given these assumptions it should be possible for shareholders and other interested partiesto construct models projecting our profitability based upon their own opinions.
It should be noted that FuM have risen from US$4.7 billion at the point of puttingtogether this Template, to US$4.9 billion at the time of writing.
Note: Excludes unrealised gains on seed investments
£000
0
500
1,000
1,500
2,000
3,000
2,500
Q 1 Q 2 Q 3 Q 4 Q 1 Q 2 Q 3 Q 4 Q 1 Q 2 Q 3 Q 4
2016/17 - £2.9m to Reserves
25p Dividend
2017/18 - £3.4m to Reserves
25p Dividend
2016/ 2017 2017/ 2018
2015/16 - £0.2 from Reserves
24p Dividend
2015/ 2016
Assumed post tax profit (£) Includes a credit of c.£500k relating toprior years’ US state taxes
Dividend to be approved by shareholdersAs assumed in the interims (£)
Actual figures (£)
Present dividend breakeven (£)1
1
2
2
Dividend coverActual and assumed over three financial years
4.Remain open in our dealings withshareholders, availableand accountable(continued)
Furthermore we have sought to make our dividend policy – the most direct way we haveof rewarding shareholders – as clear as we can. We will continue to pay out the major partof post-tax profits in dividends. The Group’s dividend policy is detailed below. This isgoing to be applied with flexibility, with approximately one third payable as an interimdividend and two thirds as a final.
Dividend policyThis policy was introduced in 2014 and was designed to incorporate the requiredflexibility to deal with the potential volatility of CLIG’s P&L:
• This is not a long-term policy. Rather it will be reviewed after five years and every five years thereafter.
• This policy specifically takes account of the implicit volatility in CLIG’s earnings as a result of its significant present exposure to the emerging markets.
• Once this reliance upon the emerging markets is reduced the cover could befurther reduced.
• The intention should be to put around £1 million to reserves in a normal year.For guidance a normal year would be considered the average of the previous five years.
• This would imply a cover ratio of circa 1.2 times (1.2x).
• While the cover is targeted as 1.2x this will continue to be applied flexibly and theannual dividend will approximate to this cover on a rolling five year average.
• The Board will take into account both the CLIG budget for the next year and marketoutlook when determining the current year’s dividend.

OverviewCorporate governance
Financial statements
Shareholder information
Strategic report
City of London Investment Group Annual Report 2016/2017 17
We do not work in expensive offices and when we travel we do not stay in five star hotels.
We do not need expensive offices to undertake our work and most of the time we are in a hotel we are there to sleep rather than it be a part of our lifestyle.
Keeping the overhead down is good business practice as it provides more money fordividends, bonuses and reserves and thus assists with relative job security.
In addition, efforts are made to limit inter-office air travel. Internal meetings are almostexclusively conducted by video conferencing, which we have in all our offices.
With regard to CLIM’s responsibility within the community, our awareness has beengrowing significantly over the past few years. Resourcing internal tools such as CLIM’sintranet to communicate upcoming events and campaigns encourages employees tocontribute to the community. Additionally, providing updates at CLIM’s annualStrategy Meeting and highlighting accomplishments in COLeague News, an internalpublication, further supports the recognition that the interests of the community areused as a measurement of success for the Firm and are seen as a complement to howthe business is run.
What are the targeted involvements within the community? We take a multi-prongedapproach to allocating our human resources across the communities, as we 1) attempt tounderstand the greater needs of the communities we work in and 2) champion initiativesthat are personal causes to individual employees. This means we can, and do, supportboth local events of national and global charities, as well as local community specificevents. Additionally, by the nature of our five office structure, this means that we are ableto offer a wide array of community involvement events to staff, and we have found that agreater variety allows for greater participation throughout the year. In turn, this can alsoprovide for meaningful results as some events will be chosen on a personal level and willhave a greater impact for specific employees and their families. These efforts and serviceswork hand in hand to protect cultures and customs not only within the communityoutreach programs but also within the workplace. Further details on communitycontributions are referenced within the Corporate and Social Responsibility Policy onpage 34 of these accounts.
We keep costs down because we believe that the assets overwhich we provide stewardshipare, by definition, not ours but are owned by CLIGshareholders.
Over the past few years there has been a realisation that corporations have a responsibility both for and separately within thecommunity.
5.Keep costs down
6.Corporate citizenship
STRATEGIC REPORT
BUSINESS DEVELOPMENT REVIEW
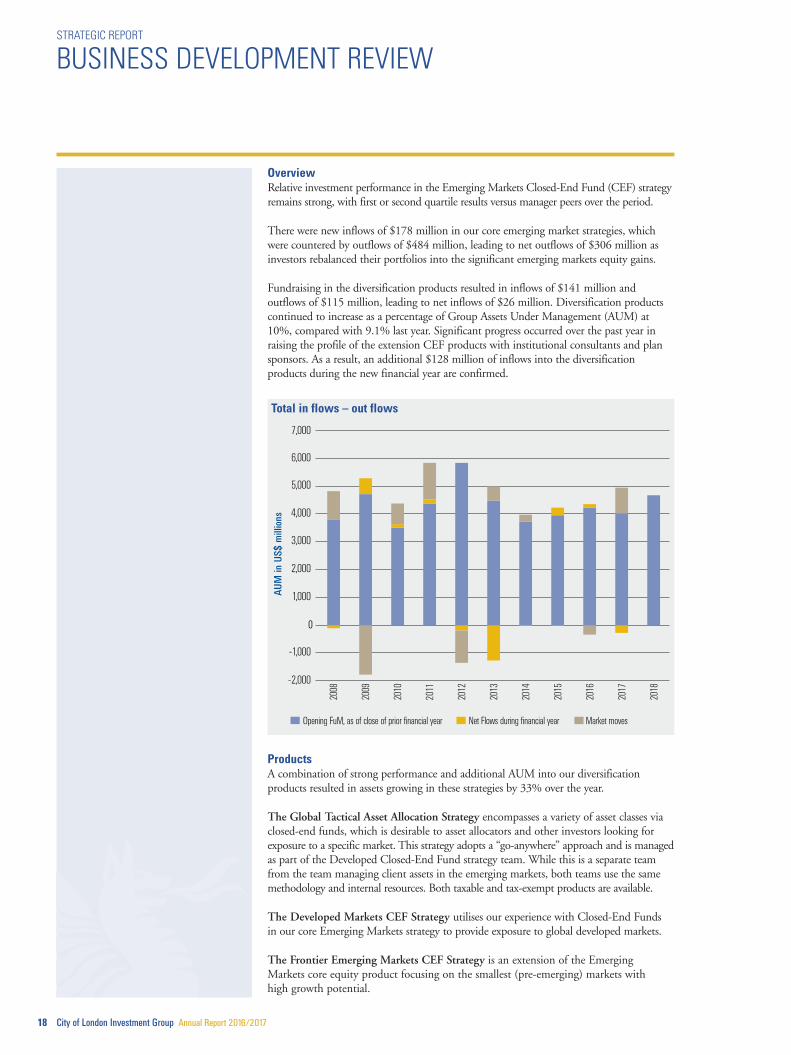
OverviewRelative investment performance in the Emerging Markets Closed-End Fund (CEF) strategyremains strong, with first or second quartile results versus manager peers over the period.
There were new inflows of $178 million in our core emerging market strategies, whichwere countered by outflows of $484 million, leading to net outflows of $306 million asinvestors rebalanced their portfolios into the significant emerging markets equity gains.
Fundraising in the diversification products resulted in inflows of $141 million andoutflows of $115 million, leading to net inflows of $26 million. Diversification productscontinued to increase as a percentage of Group Assets Under Management (AUM) at10%, compared with 9.1% last year. Significant progress occurred over the past year inraising the profile of the extension CEF products with institutional consultants and plansponsors. As a result, an additional $128 million of inflows into the diversificationproducts during the new financial year are confirmed.
ProductsA combination of strong performance and additional AUM into our diversificationproducts resulted in assets growing in these strategies by 33% over the year.
The Global Tactical Asset Allocation Strategy encompasses a variety of asset classes viaclosed-end funds, which is desirable to asset allocators and other investors looking forexposure to a specific market. This strategy adopts a “go-anywhere” approach and is managedas part of the Developed Closed-End Fund strategy team. While this is a separate teamfrom the team managing client assets in the emerging markets, both teams use the samemethodology and internal resources. Both taxable and tax-exempt products are available.
The Developed Markets CEF Strategy utilises our experience with Closed-End Fundsin our core Emerging Markets strategy to provide exposure to global developed markets.
The Frontier Emerging Markets CEF Strategy is an extension of the EmergingMarkets core equity product focusing on the smallest (pre-emerging) markets withhigh growth potential.
18 City of London Investment Group Annual Report 2016/2017
7,000
6,000
5,000
4,000
3,000
2,000
AUM
in U
S$ m
illio
ns
1,000
0
-1,000
-2,000
Market movesOpening FuM, as of close of prior financial year Net Flows during financial year
2013
2012
2011
2010
2015
2014
2009
2008
2017
2018
2016
Total in flows – out flows
OverviewCorporate governance
Financial statements
Shareholder information
Strategic report
City of London Investment Group Annual Report 2016/2017 19
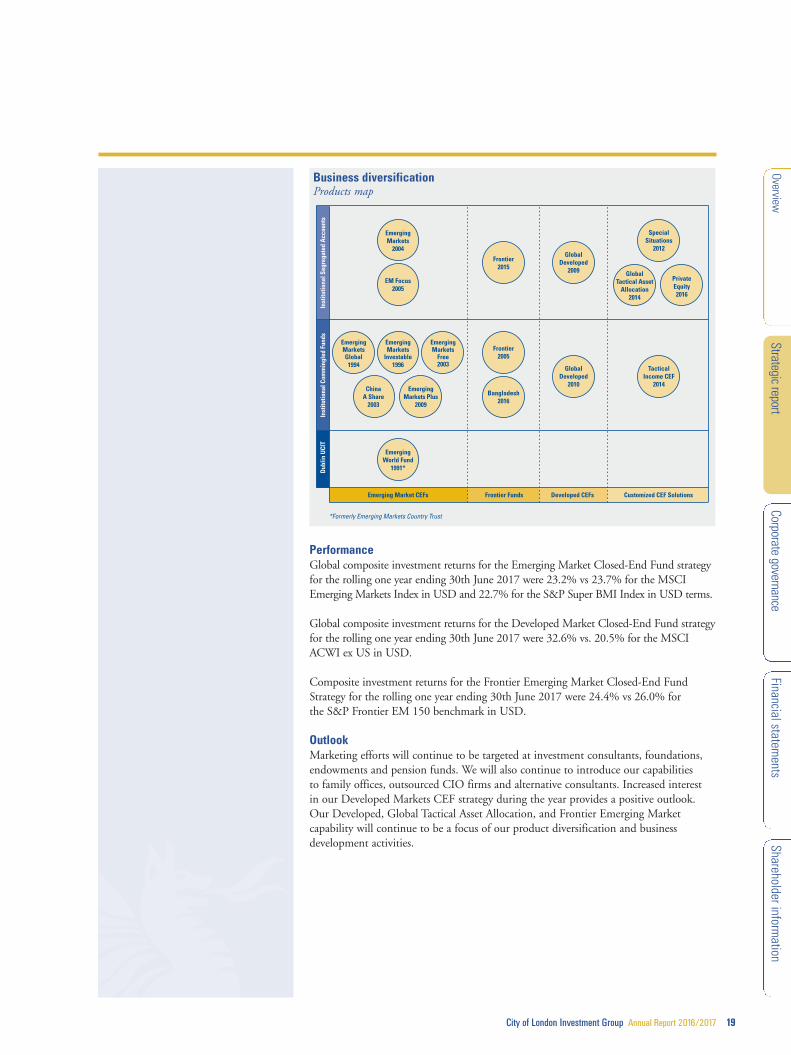
PerformanceGlobal composite investment returns for the Emerging Market Closed-End Fund strategyfor the rolling one year ending 30th June 2017 were 23.2% vs 23.7% for the MSCIEmerging Markets Index in USD and 22.7% for the S&P Super BMI Index in USD terms.
Global composite investment returns for the Developed Market Closed-End Fund strategyfor the rolling one year ending 30th June 2017 were 32.6% vs. 20.5% for the MSCIACWI ex US in USD.
Composite investment returns for the Frontier Emerging Market Closed-End FundStrategy for the rolling one year ending 30th June 2017 were 24.4% vs 26.0% forthe S&P Frontier EM 150 benchmark in USD.
OutlookMarketing efforts will continue to be targeted at investment consultants, foundations,endowments and pension funds. We will also continue to introduce our capabilitiesto family offices, outsourced CIO firms and alternative consultants. Increased interestin our Developed Markets CEF strategy during the year provides a positive outlook.Our Developed, Global Tactical Asset Allocation, and Frontier Emerging Marketcapability will continue to be a focus of our product diversification and businessdevelopment activities.
Dub
lin U
CIT
Emerging Market CEFs Frontier Funds Developed CEFs Customized CEF Solutions
Inst
itutio
nal C
omm
ingl
ed F
unds
Inst
itutio
nal S
egre
gate
d A
ccou
nts
EmergingMarkets
2004
EM Focus2005
Frontier2015
GlobalDeveloped
2009
GlobalDeveloped
2010
TacticalIncome CEF
2014
SpecialSituations
2012
GlobalTactical Asset
Allocation2014
PrivateEquity2016
Frontier2005
Bangladesh2016
EmergingMarketsGlobal
1994
EmergingMarkets
Investable1996
EmergingMarkets
Free2003
EmergingWorld Fund
1991*
ChinaA Share
2003
EmergingMarkets Plus
2009
*Formerly Emerging Markets Country Trust
Business diversificationProducts map

STRATEGIC REPORT
KEY PERFORMANCE INDICATORS
20 City of London Investment Group Annual Report 2016/2017
Shareholders should bear in mind that we do not manufacture widgets, that is to saythat whereas a widget manufacturer has a few variables to deal with, we have many.Specifically, we have many more than a typical fund manager, as exposure to theEmerging Markets and their currencies provides significant additional volatility.We are a relatively small firm and thus can be nimble in taking action.
We should also point out that we are not asset gatherers, preferring to focus oninvestment performance and client retention.
Furthermore, whilst we can talk about investment performance, long-term clients,stability of staff, levels of the stock market, business plans, budgets and cost savings,these influences do not necessarily automatically come through to the bottom linein terms of the measurement of shareholder value.
TOTAL SHAREHOLDER RETURN
It is our view that the true measurement of a management team is the long-termtotal return of the shares of the company that they manage.
Below is a graph of our London listed peers with significant Emerging Marketsexposure, rebased to CLIG’s listing date, 12th April 2006. CLIG has not onlyexceeded the MSCI Emerging Markets T/R Index virtually since listing but also itsLondon listed peers for the last two years.
We have revised our approachto Key Performance Indicators(“KPIs”) to be more in linewith industry practice.
As our focus is to createshareholder value, we mayrevise the reporting of theseKPIs as their level ofimportance changes throughmarket cycles. Any changeswill be explained.
0
50
100
150
200
250
300
350
400
500
450
City of London
Aberdeen Asset
Ashmore Group
Man Group
Miton Group
Polar Capital
M1EF Index
Schroders
30/06/08 30/06/09 30/06/10 30/06/11 30/06/12 30/06/13 30/06/14 30/06/15 30/06/16 30/06/1712/04/06 30/06/07
Listed London peer group with significant Emerging Markets exposure (all values in GBP)
OverviewCorporate governance
Financial statements
Shareholder information
Strategic report
City of London Investment Group Annual Report 2016/2017 21
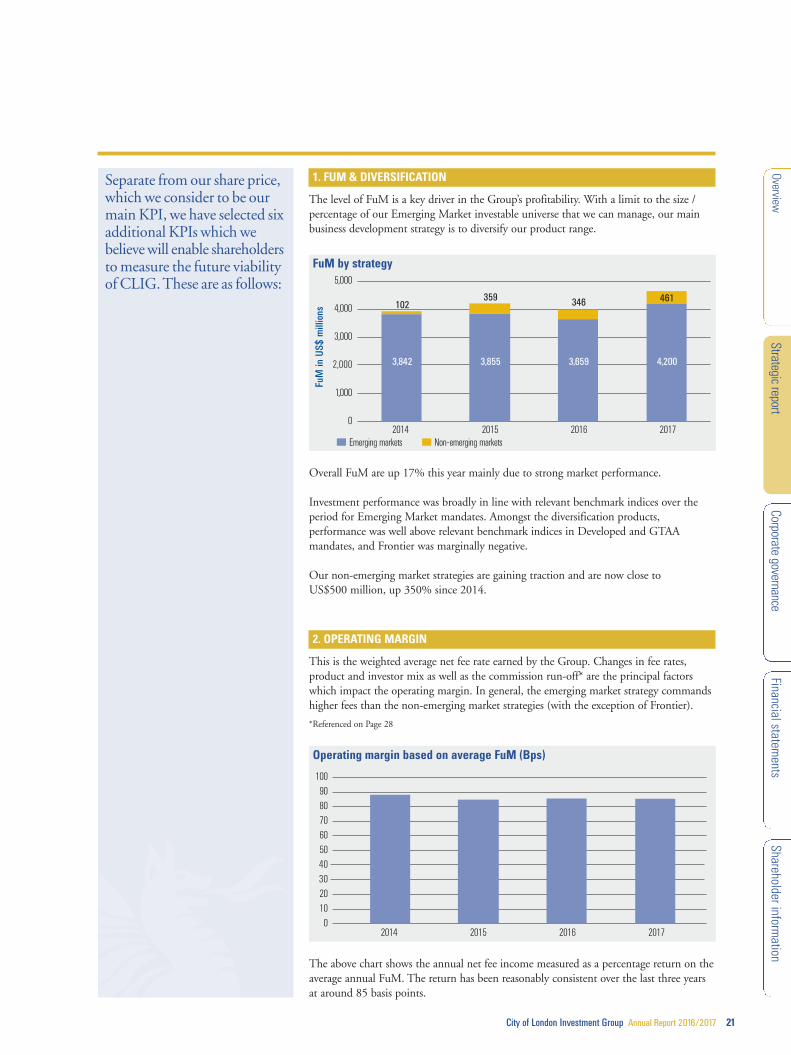
1. FUM & DIVERSIFICATION
The level of FuM is a key driver in the Group’s profitability. With a limit to the size /percentage of our Emerging Market investable universe that we can manage, our mainbusiness development strategy is to diversify our product range.
Overall FuM are up 17% this year mainly due to strong market performance.
Investment performance was broadly in line with relevant benchmark indices over theperiod for Emerging Market mandates. Amongst the diversification products,performance was well above relevant benchmark indices in Developed and GTAAmandates, and Frontier was marginally negative.
Our non-emerging market strategies are gaining traction and are now close toUS$500 million, up 350% since 2014.
2. OPERATING MARGIN
This is the weighted average net fee rate earned by the Group. Changes in fee rates,product and investor mix as well as the commission run-off* are the principal factorswhich impact the operating margin. In general, the emerging market strategy commandshigher fees than the non-emerging market strategies (with the exception of Frontier).
*Referenced on Page 28
The above chart shows the annual net fee income measured as a percentage return on theaverage annual FuM. The return has been reasonably consistent over the last three yearsat around 85 basis points.
Separate from our share price,which we consider to be ourmain KPI, we have selected sixadditional KPIs which webelieve will enable shareholdersto measure the future viabilityof CLIG. These are as follows: 5,000
4,000Fu
M in
US$
mill
ions
3,000
1,000
0
Emerging markets Non-emerging markets2014 2015 2016 2017
2,000 3,842 3,855 3,659 4,200
102359 346 461
1009080706050
20100
2014 2015 2016 2017
4030
FuM by strategy
Operating margin based on average FuM (Bps)

STRATEGIC REPORT
KEY PERFORMANCE INDICATORSCONTINUED
22 City of London Investment Group Annual Report 2016/2017
3. COST / INCOME RATIO
We believe cost control is an important discipline for any business to be successful.We look to balance the cost of growth and development with stakeholder returns.
The cost / income ratio is based on our fixed overhead to net fee income.
In absolute terms, while overheads are up 11% year on year mainly due to sterlingweakening against the US dollar plus IT infrastructure upgrades, net fee income is up31% year on year, benefiting from sterling weakening and strong performance in theemerging markets.
100%
90%
80%
70%
60%
50%
20%
10%
0
Cost / income ratio
2014 2015 2016 2017
40%
30%
Cost / income ratio

OverviewCorporate governance
Financial statements
Shareholder information
Strategic report
City of London Investment Group Annual Report 2016/2017 23
4. INVESTMENT PERFORMANCE
Our reputation depends on consistently strong investment performance versus bothrelevant benchmarks and peers. Outperformance enhances client retention and providesthe opportunity to expand our client base.
Recent investment performance has been good particularly when taking into account awidening trend in our SWAD and the small cap bias that we are exposed to via theCEF’s in which we invest.
Rat
e of
Ret
urn
(%)
City of London: Global Emerging Markets SMA Composite S&P: Emerging Front Super Comp BMI Net
*94% of the universe has been updated through to 30th June 2017
The current benchmark for the Global Emerging Markets SMA Composite is the S&P Emerging Frontier Super CompositeNet Total Return BMI (S&P Super BMI). The MSCI EM Net TR Index and iShares MSCI Emerging Markets ETF are shownfor comparative purposes.
Past performance is no guarantee of future results.
Source: eASE Analytics System, S&P, MSCI, Bloomberg
Note: Returns are gross of fees for relevant CLIM fund and peer group.
iShares MSCI EM Index Fund (EEM US) MSCI: MSCI EM TR Index Net
2014 2015 2016 2017-7.5
-5
-2.5
0
2.5
5
7.5
10
12.5
15
17.5
20
Global Emerging Markets SMA Composite 5 Year Annualised ReturnsAccording to eVestment Alliance*

STRATEGIC REPORT
KEY PERFORMANCE INDICATORSCONTINUED
24 City of London Investment Group Annual Report 2016/2017
5. CLIENT LONGEVITY
We find that stability of investment performance equates to stability of clients, but inaddition there needs to be a belief amongst clients that both our investment process willbe maintained and also that our employees will remain in place.
As referenced in the CEO Statement we have had an active client retention program inplace which has both educated and ensured that our clients understand even more aboutour investment process.
6. STAFF LONGEVITY
Our employees are a major asset. We spend time ensuring that we recruit, develop andretain the right people to complement the team, which in turn helps to create a stableworking environment.
All our Portfolio Managers have been with the Group for five or more years, and a thirdof all employees have over ten years tenure.
180
160
140
Num
ber
of c
lient
ent
ities
120
100
40
20
02014 (161) 2015 (153) 2016 (153) 2017 (146)
80
60
Over 10 years0-5 years 5-10 years
Client entity longevity
70
60
50
Hea
dcou
nt 40
30
10
0Portfolio
Managers2014 2015 2016 2017
Other PortfolioManagers
Other PortfolioManagers
Other PortfolioManagers
Other
20
Over 10 years0-5 years 5-10 years
Staff longevity
OverviewCorporate governance
Financial statements
Shareholder information
Strategic report
City of London Investment Group Annual Report 2016/2017 25
STRATEGIC REPORT
RISK MANAGEMENT
In the course of conducting our business operations, we are exposedto a variety of risks including market, liquidity, operational andother risks that may be material and require appropriate controlsand on-going oversight.
Each department/line of business reviews its risks and business processes and these areassigned both an inherent and residual risk rating, as whilst we cannot eliminate all risk,our aim is to proactively identify and manage those risks that have been identified.
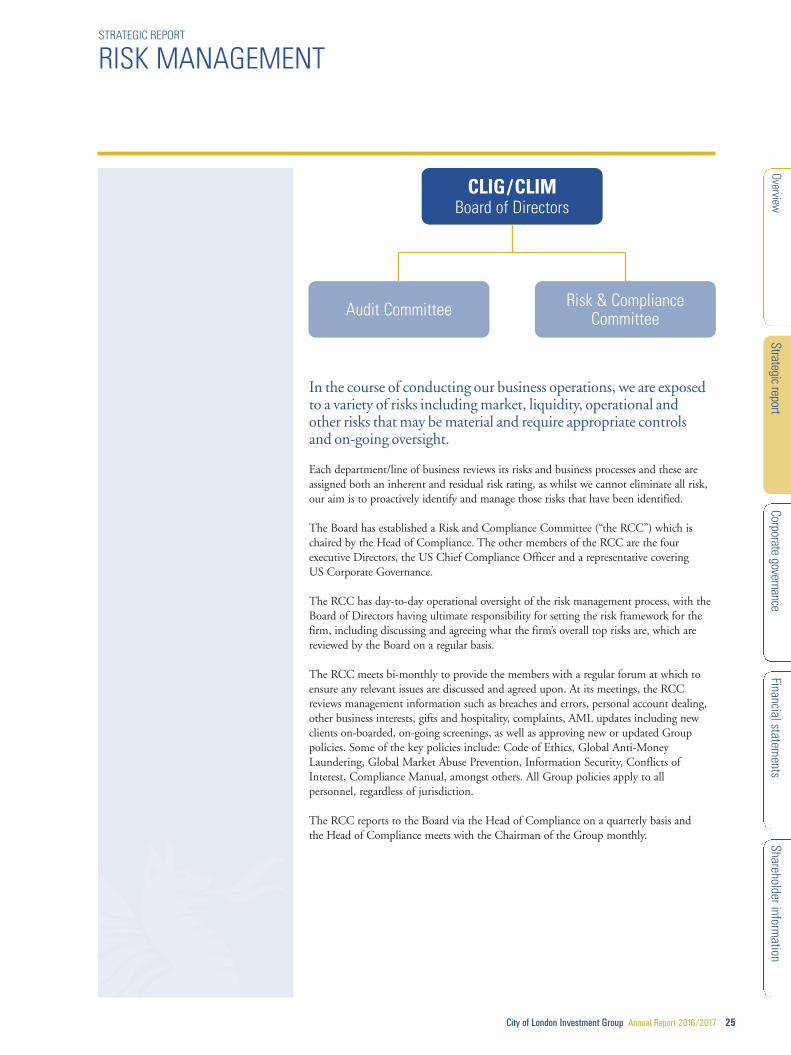
The Board has established a Risk and Compliance Committee (“the RCC”) which ischaired by the Head of Compliance. The other members of the RCC are the fourexecutive Directors, the US Chief Compliance Officer and a representative coveringUS Corporate Governance.
The RCC has day-to-day operational oversight of the risk management process, with theBoard of Directors having ultimate responsibility for setting the risk framework for thefirm, including discussing and agreeing what the firm’s overall top risks are, which arereviewed by the Board on a regular basis.
The RCC meets bi-monthly to provide the members with a regular forum at which toensure any relevant issues are discussed and agreed upon. At its meetings, the RCCreviews management information such as breaches and errors, personal account dealing,other business interests, gifts and hospitality, complaints, AML updates including newclients on-boarded, on-going screenings, as well as approving new or updated Grouppolicies. Some of the key policies include: Code of Ethics, Global Anti-MoneyLaundering, Global Market Abuse Prevention, Information Security, Conflicts ofInterest, Compliance Manual, amongst others. All Group policies apply to allpersonnel, regardless of jurisdiction.
The RCC reports to the Board via the Head of Compliance on a quarterly basis andthe Head of Compliance meets with the Chairman of the Group monthly.
CLIG/CLIMBoard of Directors
Audit Committee Risk & ComplianceCommittee

STRATEGIC REPORT
RISK MANAGEMENTCONTINUED
26 City of London Investment Group Annual Report 2016/2017
Internal controlThe Group maintains a comprehensive system of internal control, including financial,operational and compliance controls. Each function within the firm is subject to a formalsix monthly review by senior management, who are required to identify and report onthe key controls pertinent to their responsibilities. The Board reviews the effectiveness ofthe system of internal control annually and this process is subsequently evaluated by theAudit Committee.
The Board and the Audit Committee have considered the need for an internal auditfunction and have concluded that, given the size of the business, the nature of itsactivities, and the other control mechanisms that are in place, an internal audit functionis currently unnecessary. The Head of Compliance attends the quarterly Board meetingsand, since the latter half of this financial year, the Audit Committee meetings.
Key risksThe principal risk that the Group faces is the potential for loss of funds undermanagement as a result of poor investment performance, client redemptions, breach ofmandate guidelines or market volatility. The Group seeks to attract and retain clientsthrough consistent outperformance supplemented by first class client servicing, and theDirectors have implemented a product diversification strategy, as described in theBusiness Development review on pages 18 to 19 which should further mitigate this risk.In addition to the above key business risk, the Group has outlined what it considers to beits other Key Risks, including the controls in place and any mitigating factors.
Principal Risk Controls / Mitigation
Key Man Risk
Team approach, internal procedures,knowledge sharing. Remunerationpackages reviewed as needed to ensuretalent / key staff is retained.
Risk that key staff across the businessleave / significant reliance on a smallnumber of key staff members.
Technology, IT / Cybersecurity & Business Continuity Risks
IT monitors developments in this areaand ensures that systems are adequatelyprotected. Recent increase in IT spend toupgrade servers, telephony etc., which isconstantly reviewed. The firm activelymaintains a Disaster Recovery (“DR”)plan. All offices maintain backups of alllocal servers, applications and data. TheUS replicates its backup to the UK andvice versa. Employees across its five officesare able to work remotely, accessinginformation and maintaining operations.
Risk that technology systems andsupport are inadequate or fail to adaptto changing requirements; systems arevulnerable to third-party penetrationor that the business cannot continuein a disaster.

OverviewCorporate governance
Financial statements
Shareholder information
Strategic report
City of London Investment Group Annual Report 2016/2017 27
In addition, there are a number of less significant financial risks outlined in note 25on pages 85 to 90.
Principal Risk Controls / Mitigation
Regulatory and Legal Risk
Compliance monitors financial servicesregulatory developments – both newregulations as well as changes to existingregulations that impact the Group.Implementation is done as practicably aspossible taking into account the size andnature of the business. CFO & financeteam keep abreast of any changes tolisting rules and accounting standards thatmay have an impact on the Group. BothCompliance & Finance receive regularupdates from a variety of external sourcesincluding law firms, consultancies etc.
Risk of legal or regulatory action resultingin fines, penalties, censure or legal actionarising from failure to identify or meetregulatory and legislative requirements inthe jurisdictions in which the Groupoperates, including those of being a listedentity on the London Stock Exchange.Risk that new regulation or changes tothe interpretation or implementation ofexisting regulation affects the firm’soperations and cost base.
Material Error / Mandate Breach
Mandate guidelines are coded (wherepossible) into the order managementsystem and monitored on a dailybasis by Investment Managementand Compliance.
Risk of a material error or investmentmandate breach occurring.
28 City of London Investment Group Annual Report 2016/2017
STRATEGIC REPORT
FINANCIAL REVIEW
Consolidated income statementFunds under Management (FuM) as an average for the year was US$4.3 billioncompared to US$3.8 billion in 2015/2016 (based on the month end values), an increaseof approximately 13%, due to positive market movements offset in part by net outflowsduring the financial year of US$0.3 billion. The Group’s gross revenue comprisesmanagement fees charged as a percentage of FuM and is up year on year by 28% to£31.3 million (2016: £24.4 million). The principal reason for the significant increase inrevenue, compared to the rise in FuM, is due to sterling weakening against the US dollar.The average USD/GBP rate this year was 1.27 compared to 1.48 last year.
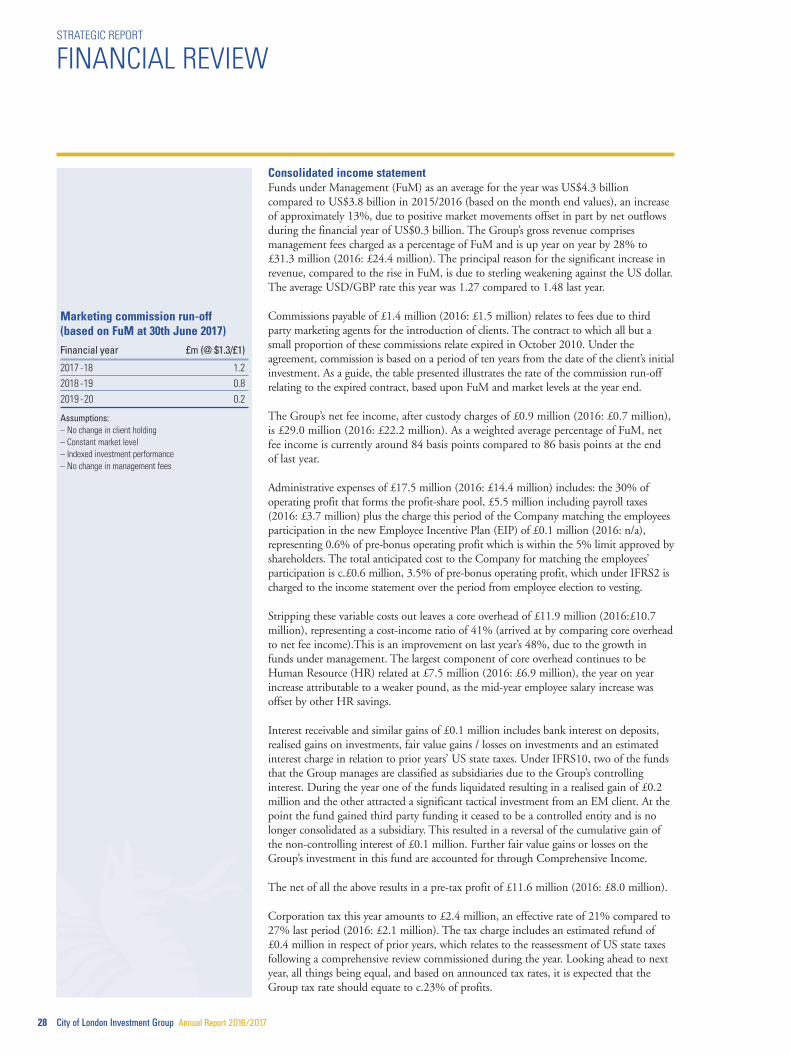
Commissions payable of £1.4 million (2016: £1.5 million) relates to fees due to thirdparty marketing agents for the introduction of clients. The contract to which all but asmall proportion of these commissions relate expired in October 2010. Under theagreement, commission is based on a period of ten years from the date of the client’s initialinvestment. As a guide, the table presented illustrates the rate of the commission run-offrelating to the expired contract, based upon FuM and market levels at the year end.
The Group’s net fee income, after custody charges of £0.9 million (2016: £0.7 million),is £29.0 million (2016: £22.2 million). As a weighted average percentage of FuM, netfee income is currently around 84 basis points compared to 86 basis points at the endof last year.
Administrative expenses of £17.5 million (2016: £14.4 million) includes: the 30% ofoperating profit that forms the profit-share pool, £5.5 million including payroll taxes(2016: £3.7 million) plus the charge this period of the Company matching the employeesparticipation in the new Employee Incentive Plan (EIP) of £0.1 million (2016: n/a),representing 0.6% of pre-bonus operating profit which is within the 5% limit approved byshareholders. The total anticipated cost to the Company for matching the employees’participation is c.£0.6 million, 3.5% of pre-bonus operating profit, which under IFRS2 ischarged to the income statement over the period from employee election to vesting.
Stripping these variable costs out leaves a core overhead of £11.9 million (2016:£10.7million), representing a cost-income ratio of 41% (arrived at by comparing core overheadto net fee income).This is an improvement on last year’s 48%, due to the growth infunds under management. The largest component of core overhead continues to beHuman Resource (HR) related at £7.5 million (2016: £6.9 million), the year on yearincrease attributable to a weaker pound, as the mid-year employee salary increase wasoffset by other HR savings.
Interest receivable and similar gains of £0.1 million includes bank interest on deposits,realised gains on investments, fair value gains / losses on investments and an estimatedinterest charge in relation to prior years’ US state taxes. Under IFRS10, two of the fundsthat the Group manages are classified as subsidiaries due to the Group’s controllinginterest. During the year one of the funds liquidated resulting in a realised gain of £0.2million and the other attracted a significant tactical investment from an EM client. At thepoint the fund gained third party funding it ceased to be a controlled entity and is nolonger consolidated as a subsidiary. This resulted in a reversal of the cumulative gain ofthe non-controlling interest of £0.1 million. Further fair value gains or losses on theGroup’s investment in this fund are accounted for through Comprehensive Income.
The net of all the above results in a pre-tax profit of £11.6 million (2016: £8.0 million).
Corporation tax this year amounts to £2.4 million, an effective rate of 21% compared to27% last period (2016: £2.1 million). The tax charge includes an estimated refund of£0.4 million in respect of prior years, which relates to the reassessment of US state taxesfollowing a comprehensive review commissioned during the year. Looking ahead to nextyear, all things being equal, and based on announced tax rates, it is expected that theGroup tax rate should equate to c.23% of profits.
Marketing commission run-off (based on FuM at 30th June 2017)
Financial year £m (@ $1.3/£1)
2017 -18 1.2
2018 -19 0.8
2019 -20 0.2
Assumptions:– No change in client holding– Constant market level– Indexed investment performance– No change in management fees

City of London Investment Group Annual Report 2016/2017 29
Consolidated statement of financial position and statement of changes in equityThe Group’s financial position continues to be strong and liquid with £13.9 million incash, representing 77% of net assets (2016: £10.2 million, 72%).
As mentioned earlier in the income commentary, the Group’s seed investments wereconsolidated last year due to the Group’s controlling interest. One fund liquidatedand the other, the International Equity CEF, gained a significant third party investorduring the year under review which meant the Group no longer had a controllinginterest. This accounts for the £2.2 million reduction in other financial assets since lastyear, with £0.9 million representing the fair value of the liquidated fund, £0.6 millionof non-controlling interest and £0.7 million being the fair value of the InternationalEquity CEF now reported as an “available-for-sale financial asset”. The fair value ofthis fund at 30th June 2017 was £0.9 million and the increase in value is reflectedin the fair value reserve.
Other components of non-current assets are: property and equipment of £0.6 million(2016: £0.4 million), capitalised software licences of £0.4 million (2016: £0.2 million)representing an increased investment in IT systems and equipment of £0.5 million offsetby amortisation of £0.1 million, and a deferred tax asset of £0.2 million (2016: £0.1million) which is an estimate of the future corporation tax savings to be derived fromthe exercise of share options in issue at the financial year end.
The major changes in equity attributable to shareholders this year are profit of £9.3 million(2016: £5.8 million) and the dividends paid during the year of £6.0 million (2016: £6.0million). The dividend comprised the 16p final dividend for 2015/16 plus the 8p interimdividend for the current year. The Group’s dividend policy is set out on page 16.
During the year, the Group took the opportunity to use some of its surplus cash tofund the buyback and cancellation of 35,000 Company shares at £3.65. Directors andemployees exercised 424,278 Employee Benefit Trust (EBT) held options, raising£1.1 million. The EBT currently holds sufficient shares to satisfy the EIP awards dueat the end of October 2017.
The Group is well capitalised and its regulated entities complied at all times withtheir local regulatory capital requirements. In the UK the Group’s principal operatingsubsidiary, City of London Investment Management Company Ltd, is regulated bythe FCA. As required under the Capital Requirements Directive, the underlyingrisk management controls and capital position are disclosed on our websitewww.citlon.co.uk.
Currency exposureThe Group’s revenue is almost entirely US dollar based whilst its costs are incurredin US dollars, sterling and to a lesser degree Singapore dollars and UAE dirhams.The US dollar/sterling exchange rate started and ended the year at around 1.30 andreached a low during the year of 1.20. The table opposite aims to illustrate the effectof a change in the US dollar/sterling exchange rate on the Group’s post-tax profits atvarious FuM levels, based on the assumptions given, which are a close approximationof the Group’s current operating parameters. You can see from the illustration thata change in exchange rate from 1.20 to 1.30 on FuM of US$4.5 billion reducespost-tax profits by £1.0 million.
It is worth noting though that while the Group’s fee income is assessed by reference toFuM expressed in US dollars, the underlying investments are primarily in emergingmarket related stock, and therefore the US dollar market value is sensitive to themovement in the US dollar rate against the currencies of the underlying countries.
FX/Post-Tax Profit MatrixIllustration of US$/£ rate effect:FuM $bn 3.5 4.0 4.5 5.0 5.5
US$/£ Post-Tax, £m:
1.20 6.4 8.3 10.1 11.9 13.8
1.25 6.1 7.8 9.6 11.3 13.1
1.30 5.7 7.4 9.1 10.8 12.5
1.35 5.4 7.0 8.6 10.3 11.9
1.40 5.1 6.7 8.2 9.8 11.4
Assumptions:1 Average net fee 84 bp’s2 Annual operating costs £5m plus US$8m plus S$1m (£1 = S$1.8)
3 Profit share 30%4 EIP 2%5 Average tax of 23%
Note: The above table is intended to illustrate theapproximate impact of movement in US$/£, given an assumed set of trading conditions.
It is not intended to be interpreted or used as a profit forecast.
OverviewCorporate governance
Financial statements
Shareholder information
Strategic report

30 City of London Investment Group Annual Report 2016/2017
To a degree this provides a natural hedge against the movement in the US dollar giventhat as the US dollar weakens (strengthens) against these underlying currencies the valueof the FuM in US dollar terms rises (falls).
The Group’s currency exposure also relates to its non-sterling assets and liabilities,which are again to a great extent in US dollars. The exchange rate differences arisingon their translation into sterling for reporting purposes each month is recognised inthe income statement. In order to minimise the foreign exchange impact the Groupmonitors its net currency position and offsets it by forward sales of US dollars forsterling. At 30th June 2017 these forward sales totalled US$4.8 million, with aweighted average exchange rate of US$1.28 to £1 (2016: US$4.3 million at aweighted average rate of US$1.45 to £1).
Viability statementIn accordance with the provisions of the UK Corporate Governance Code, the Directorshave assessed the viability of the Group, taking into account the Group’s current positionand prospects, Internal Capital Adequacy Assessment Process (“ICAAP”) and principalrisks, outlined in the Risk Management Report on pages 25 to 27.
The ICAAP is reviewed by the Board semi-annually and incorporates a series of stresstests on the Group’s financial position over a three year period. It is prepared toidentify and quantify the Group’s risks and level of capital which should be held tocover those risks.
Based on the results of this analysis, the Board confirms it has a reasonable expectationthat the Company and the Group will be able to continue in operation and meet itsliabilities as they fall due over the next three years.
While the Directors have no reason to believe that the Group will not be viable over alonger period, any future assessments are subject to a level of uncertainty that increaseswith time. The Board have therefore determined that a three year period constitutes anappropriate timeframe for its viability assessment.
STRATEGIC REPORT
FINANCIAL REVIEWCONTINUED
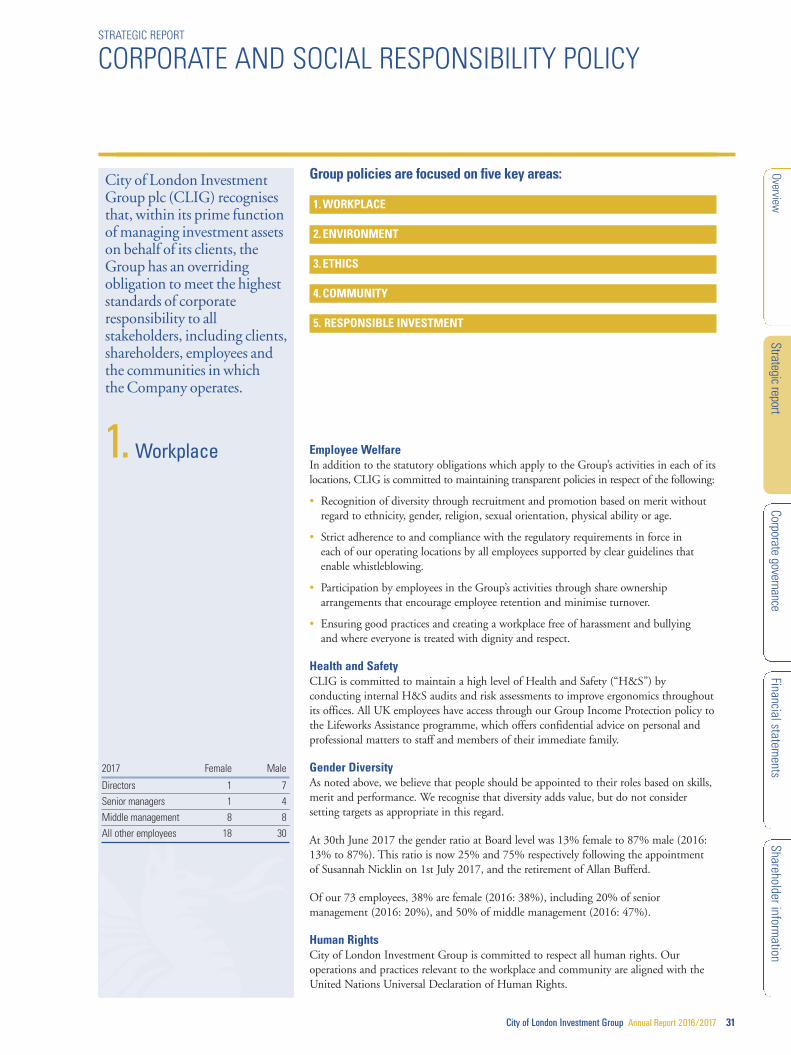
City of London Investment Group Annual Report 2016/2017 31
OverviewCorporate governance
Financial statements
Shareholder information
Strategic report
STRATEGIC REPORT
CORPORATE AND SOCIAL RESPONSIBILITY POLICY
Group policies are focused on five key areas:
1. WORKPLACE
2. ENVIRONMENT
3. ETHICS
4. COMMUNITY
5. RESPONSIBLE INVESTMENT
Employee WelfareIn addition to the statutory obligations which apply to the Group’s activities in each of itslocations, CLIG is committed to maintaining transparent policies in respect of the following:
• Recognition of diversity through recruitment and promotion based on merit withoutregard to ethnicity, gender, religion, sexual orientation, physical ability or age.
• Strict adherence to and compliance with the regulatory requirements in force ineach of our operating locations by all employees supported by clear guidelines thatenable whistleblowing.
• Participation by employees in the Group’s activities through share ownershiparrangements that encourage employee retention and minimise turnover.
• Ensuring good practices and creating a workplace free of harassment and bullyingand where everyone is treated with dignity and respect.
Health and SafetyCLIG is committed to maintain a high level of Health and Safety (“H&S”) byconducting internal H&S audits and risk assessments to improve ergonomics throughoutits offices. All UK employees have access through our Group Income Protection policy tothe Lifeworks Assistance programme, which offers confidential advice on personal andprofessional matters to staff and members of their immediate family.
Gender DiversityAs noted above, we believe that people should be appointed to their roles based on skills,merit and performance. We recognise that diversity adds value, but do not considersetting targets as appropriate in this regard.
At 30th June 2017 the gender ratio at Board level was 13% female to 87% male (2016:13% to 87%). This ratio is now 25% and 75% respectively following the appointmentof Susannah Nicklin on 1st July 2017, and the retirement of Allan Bufferd.
Of our 73 employees, 38% are female (2016: 38%), including 20% of seniormanagement (2016: 20%), and 50% of middle management (2016: 47%).
Human RightsCity of London Investment Group is committed to respect all human rights. Ouroperations and practices relevant to the workplace and community are aligned with theUnited Nations Universal Declaration of Human Rights.
2017 Female Male
Directors 1 7
Senior managers 1 4
Middle management 8 8
All other employees 18 30
City of London InvestmentGroup plc (CLIG) recognisesthat, within its prime functionof managing investment assetson behalf of its clients, theGroup has an overridingobligation to meet the higheststandards of corporateresponsibility to allstakeholders, including clients,shareholders, employees andthe communities in whichthe Company operates.
1.Workplace

32 City of London Investment Group Annual Report 2016/2017
STRATEGIC REPORT
CORPORATE AND SOCIAL RESPONSIBILITY POLICYCONTINUED
Learning and DevelopmentOur employees are an asset to us. We recognise and support the importance ofencouraging all staff to complete professional qualifications relevant to their role, inorder to progress and realise their full potential. We partner with our employees andcontribute towards their development by sponsoring their studies and providing studyleave. This year we have sponsored employees for their IMC, IOC & CFA studies, aswell as contributing towards an employee’s Master’s Degree. This is in addition to theusual seminars and conferences our employees attend. Anti-money laundering andCode of Ethics training is provided annually to all staff. Employees also takeresponsibility for their development via our annual appraisal process, where theyare able to discuss further training where they feel it is necessary.
Our latest initiative is the CLIG Security Education Program (CSEP), a multi-facetedCyber Security training program which includes online courses and videos via a web-based portal to allow employees to complete their training from anywhere. There willalso be a series of short in-house training sessions to raise employees’ awareness andknowledge on this and other issues relevant to the business.
We recognise the value of cross-training across our offices and regularly transferemployees to other offices to obtain experience. Internal training is available to allemployees on the products we offer. Our induction programme for new employees takesplace over a period of weeks and is an ongoing process to ensure new employees settlewell into the organisation and are confident carrying out the full scope of their duties.
City of London Investment Group believes that it has a responsibility to care for andprotect the environment in which we operate. While our activities as an investmentmanager have a relatively modest direct environmental impact, we recognise that society’scollective challenge to minimise environmental risks necessitates a pro-active stance tomeasure and, wherever commercially possible, improve the overall environmentalperformance. In addition to compliance with the regulations for all listed UK companiesto disclose their greenhouse gas emissions as set out in detail below, the Groupendeavours to limit its carbon footprint through a series of group-wide initiativeswith an aim to reduce absolute levels of emissions and waste volumes:
• Maximise use of video-conferencing facilities, which exist in all office locationsand which serve to limit inter-office air travel by employees.
• Use of electronic media across the Group in place of paper reports.
• Shred and recycle all confidential waste. Recycle paper, cardboard, glass, printertoner cartridges.
• Our ‘everyday paper’ across the Group is exclusively paper certified by the ForestStewardship Council.
• Comply with all relevant environmental legislation and regulations.
• Continually assess environmental performance and identify areas for improvement.
• Communication of our environmental policies to all stakeholders.
Barry Olliff is the executive Director responsible for the Group’s environmental policy.
2.Environment
1. Workplace(continued)

OverviewCorporate governance
Financial statements
Shareholder information
Strategic report
City of London Investment Group Annual Report 2016/2017 33
Mandatory Carbon ReportingListed companies are required to report their annual greenhouse gas emissions.We have used the financial control approach and utilised the UK Government’sEnvironmental Reporting Guidance and the Department for Environment, Food andRural Affairs (DEFRA) conversion factors to calculate carbon dioxide emissions for alloffice locations. The intensity measurement used below is tonnes of carbon dioxideequivalent (CO2e) per the average number of full-time equivalent (FTE) employeesduring the year.
Total CO2e Emissions
2016/17 2015/16
Tonnes Intensity Tonnes Intensity of CO2e ratio of CO2e ratio
Scope 1 – – – –
Scope 2 165.6 2.30 165.3 2.30Purchased electricity 165.6 165.3
Scope 3 223.8 3.11 386.4 5.37Business air travel 210.7 373.7Electricity transmission anddistribution losses 13.1 12.7
Total 389.4 5.41 551.7 7.67
Notes:• Scope 1 emissions are direct emissions from sources owned or operated by the Group and have a mandatoryreporting requirement. CLIG does not have any applicable Scope 1 emissions to report.
• Scope 2 emissions are those associated with electricity consumption and are mandatory to report.• Scope 3 emissions are voluntary to report but, as they are the largest source of our carbon emissions dueto business air travel, we deem it important to report them here. In accordance with DEFRA guidelines,we have also included an estimate of transmission and distribution losses, common to all buyers of electricity,under Scope 3 emissions.
All CLIG employees are required to act in accordance with the Group’s Code of Ethics(“the Code”). This lays out minimum standards of conduct to ensure that employees actethically when dealing with our various stakeholders. It also seeks to ensure that all actualand potential conflicts of interest are identified, mitigated, and monitored on an ongoingbasis. Any breaches of the Code are reported to the Board of Directors. All employeesre-certify on an annual basis that they have read and understood the Code, and agreeto act within the standards therein.
2.Environment(continued)
3.Ethics

34 City of London Investment Group Annual Report 2016/2017
STRATEGIC REPORT
CORPORATE AND SOCIAL RESPONSIBILITY POLICYCONTINUED
City of London Investment Group seeks to encourage employees to regularly participatein community support activities across a wide spectrum of causes that encompass bothmonetary and non-monetary efforts to help raise awareness. In turn, this fosters a cultureof leadership, teamwork and appreciation within our firm and community. Our long-term goals include:
• Encouraging employee volunteer work in community activities.
• Engaging in programmes that make communities better places to live and work.
• Using local suppliers to help support businesses within the community.
• COLeague News, an internal CLIG document which helps raise awareness, shareefforts and spread participation across all our offices.
2016/2017 Highlights include:
• Food Bank volunteer activities to support underprivileged students in surroundingschools as well as adults (US & UK)
• Blood Drive through American Red Cross (US)
• United Neighbours Impacting Families and Youth book drive event (US)
• Salvation Army and Community, Youth and Women’s Alliance gift giving anddonations (US & Singapore)
• Ramadan Community Campaigns to support refugees (Dubai)
• Wildlife Conservancy fundraising to protect endangered species in South Africa (US)
• Save Our Stray Dogs, a volunteer-run organization dedicated to the welfare ofSingapore’s many street dogs (Singapore)
• Various runs and walks to support causes such as Juvenile Diabetes ResearchFoundation, Hearing Loss Association of America, Osteogenesis Imperfecta (US)and British Heart Foundation (UK)
As a matter of policy, CLIG does not make donations to any client related charity, eventor activity, or to any political party or candidate.
4.Community

OverviewCorporate governance
Financial statements
Shareholder information
Strategic report
City of London Investment Group Annual Report 2016/2017 35
CLIG is committed to promoting responsible investment and effective stewardship,both as a means of advancing our clients’ objective of superior long-term investmentperformance and in respect of our wider corporate obligations to all stakeholders.
In 2015 CLIG launched a significant initiative to promote environmental, social andgovernance (ESG) awareness in emerging market investment trusts and closed-end funds(CEFs). We firmly believe that businesses which adopt best practice in their ESG policieswill ultimately earn superior returns. We therefore promote responsible investment inCEFs both directly to managers and via their boards.
Our investment teams are using the ESG research of Sustainalytics, the leading independentresponsible investment consultancy, as the basis of this work with investment managers.The process involves a detailed comparison of ESG characteristics of each closed-end fundversus its relevant benchmark and it is providing valuable insights for our researchers as theyconduct manager due diligence. We are encouraging managers to be more explicit abouthow ESG considerations are incorporated into their investment processes and to provideall their investors with better portfolio transparency from an ESG perspective.
CLIG is a signatory to both the UN-supported Principles for Responsible Investment (PRI)and to the UK Stewardship Code. As part of this commitment to responsible investment,CLIG is required to seek appropriate disclosure on ESG issues by the closed-end funds inwhich we invest. Most managers, as signatories themselves to the PRI and UK StewardshipCode, should have a clear understanding of this commitment as we challenge them, bothdirectly and via their closed-end fund boards, to raise their ESG transparency.
In the past 12 months we have taken steps to improve our own transparency of theseaspects of our business, via disclosures on our web site. Our voting policy has always beenpublicly available but we now disclose our full voting record. We have also initiated anannual stewardship report, also publicly available, which provides a convenient summaryof our voting record and our engagement with closed-end fund boards. More detailedinformation is also available on our website about CLIG’s own ESG credentials. Thiscovers our commitment to conduct our business in an environmentally responsiblemanner, our responsibilities for the welfare and development of our employees, and thecomprehensive policies that ensure our business is managed in accordance with thehighest governance standards.
More information can be found at http://www.citlon.co.uk/esg.php
For and on behalf of the Board
Barry OlliffChief Executive Officer14th September 2017
Should shareholders have any questions with regard to the content of this report, they arewelcome to email us at [email protected], but we will obviously not be able toanswer any questions of a price sensitive nature.
5.Responsibleinvestment

BOARD OF DIRECTORS
36 City of London Investment Group Annual Report 2016/2017
D. M. Cardale NON EXECUTIVE CHAIRMAN
David Cardale has worked extensively in both Corporate Finance and Private Equity.He has advised a number of fund management groups including Gartmore, Ivory &Sime and MIM, and ran the European operations of NatWest Equity Partners, nowBridgepoint. He has been a director of two London listed Investment Trusts and iscurrently chairman of the supervisory board of the London based fund managerHosking Partners LLP. David holds an MBA from INSEAD.
B. M. Olliff CHIEF EXECUTIVE OFFICER, CHIEF INVESTMENT OFFICER
Barry Olliff ‘s career has spanned over 50 years within the investment trust (closed-endfund) sector. He began his career in 1964 with Denny Brothers, ultimately PinchinDenny, as a market maker in the sector. In 1979 he moved to Laing & Cruickshank as amember of their investment trust department, and became a director in 1984. In 1987,he established Olliff & Partners, the stockbroker business from which City of Londonwas founded in the early 1990’s.
T. W. Griffith CHIEF OPERATING OFFICER
Prior to joining City of London Group in 2000, Thomas Griffith held various positionsin the institutional client division of The Vanguard Group including roles as both aClient Relationship Manager and a Marketing Executive. In 1986 he obtained abachelor’s degree in Corporate Finance and Investment Management from theUniversity of Alabama.
M. D. Dwyer CHIEF INVESTMENT OFFICER EM CEF GROUP
Mark re-joined City of London in May 2012 and has over eighteen years investmentexperience. Prior to re-joining the Group, Mark spent eight years with Banco CommercialPortuguese as a Director in the Asset Management department. Mark initially joined Cityof London in 1995 and was a Portfolio Manager based in the UK, followed by the USoffice. He established City of London’s Singapore Office in 2000 where he spent two years.Mark is now CIO of the EM CEF Group and is based in London. He holds a BA ineconomics and is a CFA Charterholder.
T. A. Rodrigues FINANCE DIRECTOR
Tracy Rodrigues joined the Group in 2000 and is based in the London office. Havingmanaged the Finance department since 2006 she was promoted to Financial Controllerin 2013 and appointed to the Board in October 2015. Tracy has more than 25 years’experience within the financial services industry having previously worked at CS FirstBoston (now Credit Suisse) as both a financial and product accountant. Tracy is a directorof all Group subsidiaries.

OverviewCorporate governance
Financial statements
Shareholder information
Strategic report
City of London Investment Group Annual Report 2016/2017 37
S. E. Nicklin INDEPENDENT NON-EXECUTIVE DIRECTOR (APPOINTED 01.07.17)
Susannah Nicklin is an investment and financial services professional with 20 years ofexperience in executive roles at Goldman Sachs and Alliance Bernstein in the US, Australiaand the UK. She has also worked in the social impact private equity sector with BridgesVentures and the Global Impact Investing Network. Susannah is a non-executive Directorof Pantheon International plc, Amati VCT 2, and sits on the Investment Committee ofImpact Ventures UK.
Dr. A. S. Bufferd SENIOR INDEPENDENT NON-EXECUTIVE DIRECTOR (RESIGNED 30.6.17)
Allan Bufferd is Treasurer Emeritus of the Massachusetts Institute of Technology (“MIT”)where he served for over 30 years prior to his retirement in 2006. At MIT, he served asan ex-officio member of the governing board and its executive committee and, asPresident of the MIT Investment Management Company supervised the formulation andimplementation of investment policy for US$12 billion of endowment and retirementfund assets. He is a director of Och-Ziff Capital Management Group LLC, (NYSE).In addition, he serves as a director of several private companies and investment fundscovering diverse asset classes. He is also director/trustee of several Non-ProfitOrganisations, primarily focussed around healthcare.
B. A. Aling INDEPENDENT NON-EXECUTIVE DIRECTOR
(SENIOR INDEPENDENT DIRECTOR FROM 01.07.17)
Barry Aling has worked extensively in international equity markets over a 40-year period.Within the emerging market universe, Barry has held senior executive positions withW.I.Carr and Swiss Bank Corporation in Asia and the UK and more recently was aDirector of Asset Management Investment Company plc, a listed investment trustspecialising in the investment management industry and Gaffney Cline & AssociatesLimited, a leading petroleum consultancy, prior to its sale to Baker Hughes Inc. in 2007.
M. J. Driver INDEPENDENT NON-EXECUTIVE DIRECTOR (APPOINTED 01.07.16)Mark Driver was a founding partner of the hedge fund management group HorsemanCapital Management where, together with John Horseman, he managed the HorsemanGlobal Fund. Prior to this, Mark had more than eleven years experience covering theAsian markets. He set up and managed the Asian Equity desk in London for DonaldsonLufkin and Jenrette. He has also worked in a specialist sales capacity in Hong Kong andLondon, covering the Asian markets for Société Générale (Crosby) and Merrill Lynch.He began his career at Fidelity Investment Management in 1985.

DIRECTORS’ REPORT
38 City of London Investment Group Annual Report 2016/2017
Principal activityCity of London Investment Group PLC is the holding companyfor a number of subsidiaries. The principal operating subsidiaryis City of London Investment Management Company Limited,which acts as an investment manager on 38 accounts (2016: 46accounts) with a total of £3,580 million (2016: £3,016 million)under management as at 30th June 2017. Accounts may becommingled or segregated. City of London InvestmentManagement Company Ltd has a subsidiary in Singaporeand a branch in Dubai.
Going concernThe Directors’ report should be read in conjunction with theChairman’s statement and the Strategic report on pages 2 to 35,which together provide a commentary on the operations of theGroup and include factors likely to affect its future developmentas well as relevant key performance indicators and principal risks.
During the year to 30th June 2017 the Group had no externalborrowings and is wholly funded by equity.
Accordingly, the Directors are satisfied that the Company hasadequate resources to meet its business needs for the foreseeablefuture, and the Financial Statements have therefore beenprepared on the going concern basis.
Results and dividendThe results of the Group for the year to 30th June 2017,together with details of amounts transferred to reserves, are setout on pages 64, 66 and 67. The Company has paid dividendsof £6,047,965 during the period (2016: £5,981,721). The finaldividend for the year to 30th June 2017 of 17p per share (2016:16p) has been proposed, payable on 31st October 2017, subjectto shareholder approval, to shareholders who are on the registerof members on 13th October 2017.
Subsequent eventsDuring the year the Group received a significant tacticalinvestment from an EM client in its International Equity CEFFund. This reduced the Company’s holding to 13% at whichpoint the entity was deconsolidated, which resulted in anunrealised gain of £98,166. This gain was reported through theincome statement under interest receivable and similar gains.
Subsequent to the year-end the client liquidated this tacticalholding in the International Equity CEF Fund to invest inanother of the Group’s funds.
Annual General MeetingThe Company’s AGM will be held at 11.30am on Monday,23rd October 2017 at 77 Gracechurch Street, London EC3V 0AS.
DirectorsThe names and biographical details of the current Directors ofthe Company are given on pages 36 and 37. The Directors’interests are set out in the Directors’ Remuneration report.
Directors’ indemnity arrangementsThe Company maintains appropriate Directors’ and Officers’insurance. The Directors also have the benefit of the indemnityprovisions in the Company’s Articles of Association. Theseprovisions, which are qualifying third party indemnityprovisions as defined by S236 of the Companies Act 2006,were in force throughout the year and are currently in force.
Own sharesThe Company is, until the date of the next AGM, generallyand unconditionally authorised to buy back up to 2,689,671of its own ordinary shares of nominal value £0.01. In the yearunder review the Company purchased and cancelled 35,000shares (2016: 115,000). The shares were purchased at £3.65.The Company is seeking a renewal of this authority at the2017 AGM.
The number of own shares purchased by the Company’sEmployee Benefit Trust during the year was 50,000 (2016: nil).The number of own shares held by the Trust as at 30th June2017 was 1,477,935 (2016: 1,852,213), of which, 1,062,342shares (2016: 1,566,620) were subject to options in issue.The Trust has waived its entitlement to receive dividends inrespect of the shares held.
Substantial shareholdingsAt 31st July 2017, the Company had been notified of the followinginterests of 3% or more in the Company’s ordinary shares:
Number Percentage ofInterested party of shares issued shares
BlackRock Investment Management 2,693,619 10.0
B M Olliff 2,275,186 8.5
The City of London EmployeeBenefit Trust 1,477,935 5.5
Hargreave Hale 1,323,197 4.9
Polar Capital 875,000 3.3
Corporate governanceThe UK Corporate Governance Code is publicly available onthe Financial Reporting Council’s website. A report on theGroup’s corporate governance and compliance with theprovisions of the UK Corporate Governance Code is set outon pages 40 to 42.

City of London Investment Group Annual Report 2016/2017 39
Corporate responsibilityDetails of the Group’s employment practices and carbon emissionscan be found in the Corporate and Social Responsibility sectionof the Strategic report on pages 31 to 35.
AuditorsThe auditors for the financial year were Moore Stephens, LLP.
Each of the persons who are Directors at the time when thisreport is approved has confirmed that:
(a) so far as each Director is aware, there is no relevant auditinformation of which the Company’s auditors areunaware; and
(b) each Director has taken all the steps that ought to have beentaken as a Director, including making appropriate enquiriesof fellow Directors and the Company’s auditors for thatpurpose, in order to be aware of any information needed bythe Company’s auditors in connection with preparing theirreport and to establish that the Company’s auditors areaware of that information.
As detailed in the Audit Committee report, the decision tochange auditors has been taken this year to coincide with theend of the audit partner’s statutory rotation period. A resolutionto appoint RSM UK Group LLP as the Company’s auditor willbe put to the forthcoming Annual General Meeting.
Approved by the Board of Directors and signed on behalf ofthe Board
B M OlliffChief Executive Officer
14th September 2017
OverviewCorporate governance
Financial statements
Shareholder information
Strategic report

40 City of London Investment Group Annual Report 2016/2017
CORPORATE GOVERNANCE REPORT
The Company considers itself a smaller company for thepurposes of compliance with the UK Corporate GovernanceCode (“the Code”).
The Board is committed to high standards of corporategovernance and considers that it has complied with theprovisions of the Code throughout the year ended 30th June2017, except in respect of a small number of provisions that theBoard considers to be incompatible with the nature and size ofthe Company’s operations, and these are described below.
Remuneration policyThe Company operates a bonus scheme for all employees,including the executive Directors, that is linked to the Group’sprofitability, allocating a maximum of 30% of pre-bonus,pre-tax, operating profit for this purpose. In addition, in orderto further align the interests of executive Directors andshareholders, as well as to address the significant levelof importance clients attach to employee share ownership,the Remuneration Committee introduced a new EmployeeIncentive Plan (EIP) last year. Details of the EIP can be foundin the Directors’ Remuneration Report.
Bonus awards are made by the Board followingrecommendations by the Remuneration Committee. Barry Olliffis entitled under his service agreement to a bonus equal to 5%of the pre-tax profits of the Company, and payment of thisentitlement is covered by Mr Olliff ’s allocation from the 30%bonus pool. Executive Director bonus awards are subject tosatisfactory annual appraisal and clawback may be applied inthe event of misstatement or misleading representation ofperformance, a significant risk failure or serious misconduct ofan individual. The bonuses are also subject to individual limitsas noted in the Directors’ Remuneration Report and are paid incash and, subject to the Director’s participation in the Group’sEIP, in Restricted Share Awards (RSAs). Under the EIP, RSAsare granted following the end of the financial year to which theaward relates and they vest one third each year over the nextthree years. The EIP is optional and requires the Director towaive up to 20% (or up to 30% if there is headroom withinthe cap agreed by shareholders) of their cash bonus in returnfor RSAs worth twice the amount waived.
The Board believes that its remuneration policy, although notfully compliant with the Code, aligns the interests of allstakeholders and has worked well in motivating staff at all levelswithin the Group, and that this is demonstrated by the highemployee retention rates experienced by the Group.
The Group’s main operating subsidiary, City of LondonInvestment Management Company Ltd (CLIM), is subject to,and adheres with, the FCA’s Remuneration Code. Being aBIPRU firm, CLIM is classified as a ‘proportionality Level 3’ firm.Proportionality Level 3 firms are considered to be the lowestcategory from a risk perspective and as such can disapply a
number of the FCA’s remuneration code requirements. Prior todoing so however, firms must first consider their individualcircumstances and be satisfied that risks relating to remunerationare not unduly increased. The Group believes that its systems andprocesses relating to remuneration do not pose a risk to itself, theindustry, or the regulator’s objectives. In line with FCA guidance,and following its own assessment, CLIM has opted to disapplycertain rules under the remuneration principles proportionalityrule relating to deferral, payment in shares or other instrumentsand the ratio between fixed and variable remuneration.
The Employee Benefit Trust and share related awardsThe IA Guidelines recommend that dilutive share awards shouldbe limited to 5% of the Company’s issued share capital over arolling 10 year period. As of 30th June 2017 there were nodilutive awards in issue (2016: nil).
In addition, the IA Guidelines recommend that no more than5% of a Company’s issued share capital be held in an EmployeeBenefit Trust (EBT) without prior approval by shareholders.The EBT currently has shareholder permission to hold up to10% and the Company will be seeking to renew thatpermission at the next AGM. As of 30th June 2017 the EBTholding comprises 5.5% of issued share capital (2016: 6.9%).The components of which are:
Percentage ofNumber of shares issued shares
Vested options 754,217 2.8% Unvested options 308,125 1.1% Available for EIP awards 415,593 1.6%
1,477,935 5.5%
The EBT will waive its right to vote in respect of shares heldto cover the unvested options and this holding is capped at5% of issued share capital. The EBT will also abstain fromvoting on resolutions that concern a change of control inthe Company.
The BoardCurrently, the Board is composed of eight members, consistingof the non-executive Chairman, four executive Directors andthree non-executive Directors.
On 30th June 2017 Allan Bufferd stepped down, having been onthe Board for nine years. Susannah Nicklin joined as an independentnon-executive on 1st July 2017, and took over from Allan asChair of the Nominations Committee. Barry Aling took over asSenior Independent Director. The Senior Independent Director is available to shareholders if they have concerns which contactthrough the normal channels of Chairman or Chief Executive hasfailed to resolve or for which such contact is inappropriate.
The Company’s Articles of Association currently dictate thatall Directors shall stand for annual re-election. This is a
City of London Investment Group Annual Report 2016/2017 41
OverviewCorporate governance
Financial statements
Shareholder information
Strategic report
recommendation of the Code for FTSE 350 companies, but issomething we have adopted nonetheless. Brief details of all theDirectors may be found on pages 36 and 37.
The Code recommends that for FTSE 350 companies theBoard should include a balance of executive and non-executiveDirectors (and in particular independent non-executiveDirectors) such that no individual or small group of individualscan dominate the Board’s decision making. Smaller entities i.e.those not in the FTSE 350, are required to have at least twoindependent non-executive Directors on the Board. TheCompany is included in the FTSE SmallCap Index andtherefore complies with the Code in this respect.
The independence of non-executive Directors is considered atleast annually and is based on criteria suggested in the Code.The composition of the Board and balance between executiveand non-executive Directors is kept under review.
At the time of his appointment as Chairman, David Cardale metthe independence criteria set out in the Code, as do the otherthree non-executive Directors.
The roles of Chairman and Chief Executive are separate and areset out in writing. The non-executive Chairman’s role is to ensuregood corporate governance. His responsibilities include leadingthe Board, ensuring the effectiveness of the Board in all aspects ofits role, ensuring effective communication with shareholders,setting the Board’s agenda and ensuring that all Directors areencouraged to participate fully in the activities and decisionmaking process of the Board. The Chief Executive is responsiblefor the leadership and day-to-day management of the Company,which includes formulating and recommending the Group’sstrategy for Board approval and executing the approved strategy.
The Board reviews trading performance, ensures adequatefinancing, sets and monitors strategy, examines investment andacquisition opportunities and discusses reports to shareholders.There is a formal schedule of matters specifically reserved forthe Board, which includes:
• Dividend policy• Share buy-back policy• Effectiveness of compliance• Effectiveness of internal controls• Annual budget• Capital expenditure in excess of £100,000• Board and committee appointments
The Company maintains appropriate Directors’ and Officers’Liability Insurance.
Board performance evaluationThe Board has established a formal process, led by theChairman and the Senior Independent Director, for theannual evaluation of the performance of the Board and its
appointed committees. Individual performance evaluations arecarried out for each Director to ensure that the Board, as a whole,and its committees are operating effectively and that eachDirector is contributing effectively and continues to demonstratecommitment to the role. The Senior Independent Director seeksinput from the Directors with regard to appraisal of the Chairman.
Both the Chairman and the Senior Independent Directorreported on the results of the annual evaluations at the July Boardmeeting. In conclusion, the performance of the Chairman and theBoard as a whole continues to be effective and that each Directorcontinues to demonstrate commitment to their roles.
Board diversityThere is a formal, rigorous and transparent process for theappointment of new directors to the Board, led by theNominations Committee. The Nominations Committee and theBoard recognise that diversity in terms of gender, ethnicity andexpertise are important elements to a responsible governanceprotocol and add value, but it does not consider setting targets asappropriate in this regard. While Board appointments are madeon the basis of merit, every effort will be made to improvediversity when seeking new members.
Board training and inductionThe Chairman ensures that new directors receive a full, formaland tailored induction on joining the Board. This inductionprocess includes meeting with the members of the Board andother senior executives, information from past meetings, aschedule of future meetings as well as a specific compliancebriefing on the duties and obligations arising from the role of a director of a listed company.
Non-executive Directors are also invited to attend the Group’sannual strategy meeting which provides an opportunity toengage with employees at all levels, participate in Q&A sessionsand generally acquire a more comprehensive / holistic view ofthe organisation.
Board CommitteesThe Board has established Nomination, Audit and RemunerationCommittees, with formally delegated duties and responsibilitiesand written terms of reference. From time to time, separatecommittees may be set up by the Board to consider specific issueswhen the need arises. Each Committee and each Director has theauthority to seek independent professional advice where necessaryto discharge their duties, in each case at the Company’s expense.In addition, each Director and Committee has access to the adviceof the Company Secretary, Philippa Keith.
The Board keeps the membership of its Committees under reviewto ensure gradual refreshing of skills and experience and issatisfied that all Directors have sufficient time to devote to theirroles and that it is not placing undue reliance on key individuals.
A report from the chairman of each Committee follows this report.

CORPORATE GOVERNANCE REPORTCONTINUED
42 City of London Investment Group Annual Report 2016/2017
Although not committee members the Chairman and CEOaccepted the invitation to attend the majority of the committeemeetings during the year.
The non-executive Directors meet or confer as a group at leastannually without the executives present.
Internal control and risk managementThe Risk and Compliance Committee oversees the maintenanceand development of the firm’s risk and compliance frameworks(including financial crime) in adherence with the regulatoryrequirements. The Committee agrees, formulates and prioritisesactions to address any areas of development or concern andreports to the Board on a quarterly basis.
As part of the Group’s internal controls, each function withinthe firm is subject to a formal six monthly review by seniormanagement, who are required to identify and report on the keycontrols pertinent to their responsibilities. The Board reviewsthe effectiveness of the system of internal control annually andthis process is subsequently evaluated by the Audit Committee.
The Board is also responsible for the Internal Capital AdequacyAssessment Process (“ICAAP”), a process required by the UKregulator, which summarises the risk management frameworkand regulatory capital requirements of the Group.
A detailed description of the risk management framework andthe principal risks identified is set out on pages 25 to 27.
Shareholder relationsEngagement with shareholders is of paramount importance tothe Group. The Directors, including on occasions the SeniorIndependent non-executive Director and the Chairman,endeavour to meet with large shareholders at least twice annually,generally following interim and final results announcements.Following these meetings, the Directors report back to the Board.All of the Directors aim to attend the Annual General Meetingeither in person or by video-conference.
Rights of the shareholderThe Company is financed by 26,861,707 (2016: 26,896,707)£0.01 ordinary shares carrying one vote per share and a rightto dividends.
David CardaleChairman14th September 2017
Board and Committee attendanceThe table below sets out the number of pre-scheduled meetings of the Board and its Committees and individual attendance by theDirectors and Committee members respectively:
Nominations Remuneration AuditBoard Committee Committee Committee
Total number of meetings between1st July 2016 and 30th June 2017 6 2 4 3
Attendance:David Cardale – Chairman 6 – – –Barry Aling – non-executive 6 2 4 3Allan Bufferd – non-executive (resigned 30th June 2017) 6 2 4 3Mark Driver – non-executive (appointed 1st July 2016) 5 1 4 2Mark Dwyer – executive 6 – – –Tom Griffith – executive 5 – – –Barry Olliff – executive 6 – – –Tracy Rodrigues – executive 6 – – –

City of London Investment Group Annual Report 2016/2017 43
OverviewCorporate governance
Financial statements
Shareholder information
Strategic report
NOMINATION COMMITTEE REPORT
We are pleased to present the report of the NominationCommittee for the financial year ended 30th June 2017.
The Committee has defined terms of reference which arepublished on the Company’s website. The Committee reviewedits terms of reference during the year and did not recommendany changes. The document was approved by the Board inApril 2017.
The Nominations Committee is required to meet formally atleast twice a year and otherwise as required. During the pastfinancial year, the Committee met formally on two occasions.
At the Committee’s first meeting, held in December 2016, theCommittee discussed Board diversity; the balance betweennon-executive and executive Directors; and the country in whichthe Directors were resident, within the context of successionplanning and its general review of the size and composition ofthe Board and its Committees.
With regard to where the Directors should be resident, theCommittee recognised that although the Company was listed inLondon with a large shareholder base outside the United States,the client base is substantially located in the United States. Formany years the Company has had significant Board representationfrom the United States, though with changes to the Board inrecent years two shifts have occurred: there was now a balancebetween non-executive and executive Directors; and with AllanBufferd’s retirement planned for 30th June 2017, there wouldbe no non-executive Director from the United States.
The Committee discussions included what Board structurewould best serve the Company over the longer term withthe conclusion being that an equal number of non-executiveand executive Directors was acceptable and if there were tobe an imbalance, a majority of non-executive Directorswas preferable.
It was also agreed that diversity was an overarching objectivein the identification of the next non-executive Director to beinvited to serve on the Board. Although it should be noted thatappointments are made primarily on merit and with objectivecriteria, with particular attention to ascertaining that appointeeshave sufficient time available to devote to the position to whichthey are appointed and the responsibilities associated.
Given the need to provide for greater diversity, the Committeeappointed independent external advisers to assist in the search
process (in early 2017) with a view to appointing a new Boardmember prior to the June 2017 year-end. Following interviewswith five candidates, Ms. Susannah Nicklin was nominated bythe Committee to join the Board, and received Board approvalon 13th June 2017.
The second meeting of the Committee was held in June 2017,just prior to the close of the fiscal year. The Committee againreviewed the key factors which had been considered in previousmeetings. The Committee concluded, as noted in its December2016 meeting, that a balance between non-executive andexecutive Directors was appropriate for the Company given itsrelative size; and that this was the more defining criterion thanwhether the Director was based in the United States or theUnited Kingdom. It should be noted that Susannah Nicklin hasdual nationality as she was born in the United States but isresident in the United Kingdom.
Following Ms. Nicklin’s appointment, the Committee made aseries of recommendations for the membership of all BoardCommittees to take effect in the financial year commencing1st July 2017 and these also were agreed by the Board on13th June 2017.
The revised membership structures are as follows:
Audit Committee
Barry Aling, Chair
Mark Driver
Susannah Nicklin
Remuneration Committee
Mark Driver, Chair
Barry Aling
Susannah Nicklin
Nomination Committee
Susannah Nicklin, Chair
Barry Aling
Mark Driver

44 City of London Investment Group Annual Report 2016/2017
NOMINATION COMMITTEE REPORTCONTINUED
After a discussion of the merits of the Directors, the Committeealso recommended that the following individuals be proposedfor re-election to the Board:
David Cardale
Barry Aling
Mark Driver
Barry Olliff
Tom Griffith
Mark Dwyer
Ms. Tracy Rodrigues
In closing, we thank Allan for his valuable contribution to theCommittee since 2010 and look forward to working withSusannah in reviewing and planning the leadership needs ofthe Group going forward.
Barry AlingOn behalf of the Nomination Committeefor the year to 30th June 2017
14th September 2017

City of London Investment Group Annual Report 2016/2017 45
OverviewCorporate governance
Financial statements
Shareholder information
Strategic report
I am pleased to present my report on the activities of the AuditCommittee for the year ended 30th June 2017. At the end ofJune 2017, Allan Bufferd stepped down from the Committeefollowing his retirement from the Group’s Board, after serving asa member for the last nine years. Allan’s insight and experiencehave been greatly valued over that time and we are most gratefulfor his contribution. Coincident with Allan’s departure, we havewelcomed Susannah Nicklin to the Committee who, like Allan,has extensive experience of the asset management industry bothin the UK and the US.
Terms of referenceThe purpose of the Audit Committee (AC) is to assist the Boardin ensuring that the Group’s financial statements and relatedshareholder communications provide a detailed, balanced andaccurate view of financial performance and condition within aprudent control environment. The Committee’s Terms ofReference are reviewed annually by the Board to ensure fullcompliance with the UK Corporate Governance Code(“Code”) and are available for perusal on the Group website:http://www.citlon.co.uk/shareholders/share_reports.php
The AC’s key responsibilities include:
• Monitoring the financial statements, formal publicdisclosures, reporting issues and judgements containedtherein as well as any matters communicated to it by theexternal auditor, to ensure that they conform to the Group’saccounting policies and accurately reflect financial condition.
• Assessing the Group’s liquidity position to ensure thatadequate capital resources are available to meet its obligations.
• Reviewing the internal procedures in place to measureand control risk, paying particular attention to thedetection of fraud, bribery, money-laundering and cyber-security, as well as policies to mitigate such risks to themaximum extent possible.
• Review on a regular basis, and at least once annually, theGroup’s policy with regard to an internal audit function.
• Ensuring that adequate whistle-blowing protocols are inplace and communicated to all employees, so that they mayraise in confidence any issues of impropriety, in order thatremedial action can be taken in a timely fashion.
• Making recommendations to the Board concerning theappointment of an external auditor, including theremuneration and terms of engagement.
• Ensuring that the external auditor remains effective andthat the ongoing relationship meets the requirement ofindependence and objectivity.
• Reviewing the outcome of the external audit, payingparticular attention to any major issues or errors identifiedin the process.
• Compliance with the Code, Listing rules and any otherregulatory requirements applicable to the Group.
MembershipIn accordance with the recommendation of the Code, theCommittee comprises three independent non-executivedirectors. Barry Aling chairs the AC, having been appointedon 7th October 2013 and Mark Driver was appointed on1st July 2016. As noted above, Allan Bufferd retired from theCommittee on 30th June 2017 and was replaced by SusannahNicklin on 1st July 2017. The Board considers that Barry Alingsatisfies the Code’s requirement that at least one member of theCommittee should have recent and relevant financial experience,while all three members have extensive knowledge of the assetmanagement industry and the analytical tools used in theappraisal of company reports and accounts. Abbreviatedbiographies of the Committee members are shown onpage 37 of this Annual Report.
Meetings and activitiesIn accordance with its Terms of Reference, the AC is requiredto meet at least three times per year and it is normal for suchmeetings to be attended also by the Group Chairman, CEO,Finance Director and Head of Compliance. The external auditorattends two meetings per year and on at least one of theseoccasions, will meet separately with the Committee in theabsence of any executive directors. In addition, regular contactis maintained between AC meetings with the Finance Directorand Head of Compliance, the latter providing a review ofrisks and control issues at each meeting. The attendance ofindividual members at the three AC meetings in the lastfinancial year is shown below:
Barry Aling 3/3
Allan Bufferd 3/3
Mark Driver 2/3
At the first meeting, held in September 2016, the Committeereceived a presentation of the audit review from the externalauditor, Moore Stephens LLP (MS), which closely mirroredthe audit plan provided to the Committee in June 2016.With the exception of two minor procedural points, MSconfirmed that the audit process revealed no items of a materialnature, although they highlighted that the Group’s remunerationpolicy remained at variance with the Code, an issue which isdealt with at length elsewhere in this Annual Report. MS alsonoted that the internal transfer pricing policy, which governsinter-company transfers of revenues and expenses within theGroup, had not been reviewed since implementation in 2005and recommended that the AC commission such a reviewas part of its governance oversight responsibilities.
AUDIT COMMITTEE REPORT

AUDIT COMMITTEE REPORTCONTINUED
46 City of London Investment Group Annual Report 2016/2017
The Committee accepted this proposal, the outcome of whichis discussed below. MS were also able to confirm to theCommittee that, in their opinion, a separate internal auditfunction was not required.
A routine review of oversight functions at the second meeting,held in February 2017, revealed no material control issues orchanges to the AC’s Terms of Reference and the Committee wasalso able to recommend the Interim Report to the Board forapproval. Thereafter, there were more detailed discussions inrelation to certain ongoing issues arising, namely:
• A Transfer Pricing Review. As noted above, MS hadrecommended that such a review be undertaken in light ofthe long period since this issue was last addressed andBDO LLP (BDO) were duly appointed at this meeting toconduct the review and report to the Committee withinthe 2016/17 financial year.
• The tendering process for the appointment of a newexternal auditor for the financial year 2017/18 onwardsfollowing the Board’s decision to appoint a new externalauditor for 2017/18 after MS’ 13-year tenure.
• An update on the potential Group liability to additionalUS state taxes resulting from a detailed analysis by BDOof the Group’s US activities. The outcome of this review isdiscussed in more detail in the Financial Review on page 28of this Annual Report.
• The accounting treatment and financial impact of the newEmployee Incentive Plan on the current year results.
• A report analysing breaches and errors in 2016 withcomparative prior year figures. Excluding third party errors,the overall number of incidents was similar to the previousyear, with a negligible aggregate financial cost.
The third and final meeting of the year took place in June 2017,at which MS presented their audit plan and noted a number ofminor additional reporting requirements arising from changesto the Code. MS noted that the Group’s Remuneration Policywould not comply with Code guidance and the Committeeacknowledged that this would again necessitate an explanationin the 2017 Annual Report as to the basis of and reasons forGroup policy.
Following the introduction of the European Audit reforms lastyear, which introduced mandatory audit firm and partnerrotation requirements, the Committee noted that, since theexisting MS audit partner is required to rotate off the audit atthe end of the current year, it is an appropriate time also toappoint a new external auditor. The process by which a newauditor has been appointed for the year ending 30th June 2018is dealt with later in this report.
With regard to ongoing issues arising, the following pointswere noted:
• A preliminary draft of BDO’s transfer pricing reviewindicated that the Group’s current methodology was“in accordance with the spirit and letter of the OECDGuidelines” and any changes were unlikely to be needed.
• Potential liability to additional US state taxes were likelyto be significantly less than originally estimated as a resultof corresponding tax reclaims of other state taxes paid inprior years.
• Proposed changes to this year’s report were discussedand agreed, primarily regarding the Key PerformanceIndicators and Risk Management reports. The Group’sWhistleblowing Policy was discussed and minor changesproposed for the routing of any communications fromUS-based employees.
Financial Statements and accounting mattersIn accordance with the Code, the AC reviews all financial statementsprior to their discussion and approval by the Board and in light oftheir conformity with the appropriate accounting standards. TheCommittee has received management reports and correspondingadvice from MS auditors in light of the Group accounting policiesadopted, which are set out in Note 1 of the Financial Statements onpage 69. Also detailed in Note 1 are the accounting estimates andassumptions, the most important of which relate to the calculationof share-based payment charges under the Group’s Employee ShareOption Scheme and the Employee Incentive Program. TheCommittee has sought and received confirmation from MS throughthe audit process that such charges, while not material in the currentyear, are reflected appropriately in the statements. Further detailsregarding such charges and the assumptions used can be found onpages 83 and 84.
The Committee is responsible for evaluating the carrying valuesof intangible assets, any charges for impairments and othercharges that arise in respect of timing differences and it issatisfied that these have been satisfactorily reflected in this year’saccounts or are immaterial in scale.
US state taxesDuring 2016, the Group was made aware of potentialadditional tax liabilities arising in certain US states, where theGroup had either a place of business or a business “nexus”,for example resulting from regular client visits or value of sales.As a result BDO were appointed to conduct a detailed reviewand calculation of the Group’s liability and assist in preparingthe necessary returns. Based on the findings of BDO’s report,it appears that the net effect of the re-statement process ispositive as outlined in the Financial Review on page 28.
City of London Investment Group Annual Report 2016/2017 47
Risk management reviewThe Group’s asset management activities are conducted on anagency basis with no direct control over client assets, which areheld independently by third-party custodians. Similarly,management fees are accrued monthly based on data which isprovided by third-party custodians and reconciled to the Group’sown records. The Group has no performance-related fee income.Accordingly, the process of revenue recognition incorporatessignificant independent input and negligible scope formisstatement. Costs are tightly controlled and relativelypredictable with variances to forward budgets analysed andreported monthly. Since the Group has no debts and onlyimmaterial levels of intangible assets, the scope for misstatementof the statement of financial position is very limited and as notedabove, no variances have been identified in the current year.
The Group maintains a Risk Register which is under constantreview by executive management in conjunction with thecompliance and control team to identify any areas where thereare perceived to be risk exposures. As an asset managementbusiness, the Group’s financial performance is inevitably relatedto the quality of the investment team and their performance asmanagers. Beyond these “front-office” roles however, there are anumber of functions which constitute key areas of commercialrisk and which are identified in the Risk Register. The widespectrum of investment mandates managed on behalf of theGroup’s clients mean that great care is needed to ensure thatno breaches occur and that all aspects of client confidentialityare strictly maintained.
The monitoring of the controls necessary to comply with thesemandates represents the core function of the compliance andcontrol team, led by the Head of Compliance, Ashleigh Simms,who has extensive experience in the asset management industryand who attends AC meetings as a matter of course. While theincidence of breaches and errors was broadly similar in calendaryear 2016, compared with 2015, with no items of a materialnature in financial terms, there has been a notable andencouraging reduction in incidents in 2017 to date and there hasbeen no necessity for disciplinary action against any employees.All incidents require a “Breach and Error” report and the Group’spolicy is to ensure that no client, investor or fund is financiallydisadvantaged by any incident for which CLIG is responsible.
The Committee reviews reports and all areas of risk identifiedin the Risk Register in order to measure any potential impacton the Group’s financial statements. As noted above, particularattention is paid to the issue of compliance with investmentmandates and any breaches or errors relating to these arereviewed at each meeting. Potential risks from system orhardware failure are also highlighted in the Risk Register andappropriate disaster recovery procedures are in place to ensurethat there are no interruptions to full functionality across all fiveoffices. In addition, increasing focus is required to monitor the
Group’s cyber-security protocols to ensure that vulnerability isminimised absolutely and to this end, all directors and seniormanagement are required to undergo training to prevent oridentify potential cyber threats as they arise.
For the year to 30th June 2017, the Committee is satisfied thatthe Register has been appropriately amended and maintainedand that the training procedures in place adequately reflect suchamendments and the remedies applied.
Non-audit servicesConsistent with an overriding need to ensure independence andobjectivity, the Committee exercises great care to minimise the useof the external auditor for non-audit services, following a policy ofusing third-party advisers wherever possible. To this end, in theyear to 30th June 2017, third-party advisers were used to reviewthe Group’s inter-company transfer pricing policy as well as assistin the evaluation of US state tax liabilities. However, there maybe occasions when it is either necessary or practicable to use theexternal auditor for non-audit services conducted alongside theannual audit and, in such circumstances, it is the Committee’spolicy to limit the aggregate of any fees paid to 10% of theannual audit fee in any one year.
External auditorAs noted earlier, in view of the revised European Audit requirementsintroduced in 2016 concerning auditor rotation, and with the MSaudit partner due to rotate after this year’s audit, the Committeerecommended to the Board that it was an appropriate time toappoint a new external auditor for the year ended 30th June 2018.
During the course of 2015, the AC undertook a tendering processfor the role of external auditor as part of a cost benchmarkingexercise. Having conducted a tendering process relatively recently,therefore, the Committee recommended to the Board that RSMUK Group LLP (RSM) be invited to re-submit their tender forthe role of external auditor on the basis that their original tenderwas broadly comparable in cost to MS. Accordingly, the Board isrecommending that shareholders approve the appointment ofRSM as the external auditor for the year to 30th June 2018 atthe forthcoming Annual General Meeting.
The Committee wish to thank MS for their extensive helpthroughout their 13-year tenure as auditors.
Barry AlingChairman14th September 2017
OverviewCorporate governance
Financial statements
Shareholder information
Strategic report

48 City of London Investment Group Annual Report 2016/2017
DIRECTORS’ REMUNERATION REPORT
THE REMUNERATION COMMITTEE CHAIRMAN’S STATEMENT
The Remuneration Committee, which is comprised solely ofnon-executive Directors, approves and oversees the firm’sremuneration policies. Furthermore, the RemunerationCommittee also approves the salaries and bonuses of theexecutive Directors and the Firm’s Chairman, including pensionrights and any compensation payments, any employee earningover £100,000, all Code Staff and, for reasons of managingpotential conflicts of interest, the Head of Compliance.
This report has been prepared in accordance with theregulations governing the disclosure and approval of Directors’remuneration. It sets out all aspects of remuneration in respectof the Company’s Directors.
This annual report on remuneration provides details onremuneration for the year to June 2017 and which will besubject to an advisory shareholder vote at the 2017 AnnualGeneral Meeting (AGM).
However, before that I feel it is important to restate the basicprinciples of the Group’s Remuneration Policy, which has beenestablished to support the Group’s “Team Approach” andcomply with the FCA Remuneration Code within SYSC 19B,incorporating the ESMA guidelines for sound remunerationpolicies for Alternative Investment Fund Managers (AIFM).It takes into account the following factors:
• Volatility of earnings – As the Group invests primarily inGlobal Emerging Markets, its revenues and profits can beunpredictable and volatile.
• Due to the volatility of earnings, base salaries are kept onthe lower side of what might be considered industry average,but reflect the size of the business and the individualemployee’s role and experience.
• All employees have the opportunity to share in the successof the firm by way of variable remuneration, via profit shareand the Employee Incentive Plan (EIP), established to alignincentives with the long-term interests of shareholders.
• The balance between the fixed and variable componentsof total remuneration must therefore be appropriate toenable the professional operation of the business andretention of staff.
• The bonus scheme for all employees, including the executiveDirectors, is linked to the Groups profitability, allocating amaximum of 30% of the pre-tax and bonus operating profitfor this purpose. The Board believe that this is the best wayto align employee and shareholder interests.
• The bonus entitlement of executive Directors is capped to amaximum of 5% for the CEO, Barry Olliff, and 2.5% forall other executive Directors, and the Group operates a clawback provision for specified actions including failures of riskmanagement, misconduct or other similar actions.
• Variable remuneration is paid on a team basis. The Firmbelieves that no individual is solely responsible for theperformance of their area and therefore remuneration musttake into account how that individual contributes to theoverall team effort.
• The Group provides defined contribution pensionarrangements to assist with recruitment and retention of staff.
• Guaranteed compensation is only offered to new employeesin exceptional circumstances and for a limited time period.
As you can appreciate the most fundamental effect on totalcompensation for employees and management is the overallprofitability of the Group, which in turn is highly dependent onFunds under Management (“FuM”), this in turn is determinedby the investment performance and the attractiveness of theGroup’s products and services to current and new investors.
Discretion is viewed as being critically important within theoverall compensation philosophy, while giving consideration tobalancing the interests of all stakeholders: shareholders, clients,employees and management.
New Long-Term Incentive PlanThe new Employee Incentive Plan (EIP) was approved by anoverwhelming majority of shareholders at last years AGM.The Remuneration Committee believe that the new Planprovides an appropriate motivational framework that moreclosely aligns the interests of employees with the performanceof the Company and the interests of all stakeholders,including shareholders and clients.

City of London Investment Group Annual Report 2016/2017 49
OverviewCorporate governance
Financial statements
Shareholder information
Strategic report
Participation in the Plan was offered to all those who participatein the Company’s annual bonus arrangements and thereforeexcludes non-executive Directors. Those eligible are offered thechance to waive up to 20% (or up to 30% if there is headroomwithin the cap agreed by shareholders) of their annual cashbonus in return for share awards of two times the amountwaived. The ordinary shares awarded under the Plan arepurchased in the open market and vest over a three-yearperiod, with one third vesting each year. The Plan is linkedto the Group’s profitability, and for the first four years iscapped at 5% of pre-tax, pre-bonus operating profit to coverthe charge of matching shares. Thereafter, the Plan will fallwithin the 30% limit of the profit-share pool. Awards madeunder the EIP are forfeited if the individual leaves thefirm before they have vested.
The first awards under the EIP will be made in October 2017with 42 staff members subscribed to the Plan and a total of 44staff have subscribed to the Plan for financial period 2017/18,c.60% of the workforce. This is a tremendous endorsement of the employees long-term support for the Group and we hope that they will remain long-term shareholders. The Directorsconsider that the implementation of this EIP is in the bestinterests of all stakeholders in the Company.
Included with this report is a more complete description of basesalary, bonus provisions, and other benefits for both executiveand non-executive Directors. Notwithstanding these provisions,the Remuneration Committee reserves the discretion to takeinto account exceptional circumstances in determining theappropriate application of this policy, either as an increase ordecrease in specific cases. If the Committee does make any suchvariation, the rationale will be fully explained to shareholders.
Lastly, I would like to take the opportunity to thank AllanBufferd for his hard work as chair of the RemunerationCommittee for the last four years.
Mark DriverChairman of the Remuneration Committee 14th September 2017
THE REMUNERATION COMMITTEE CHAIRMAN’S STATEMENT CONTINUED
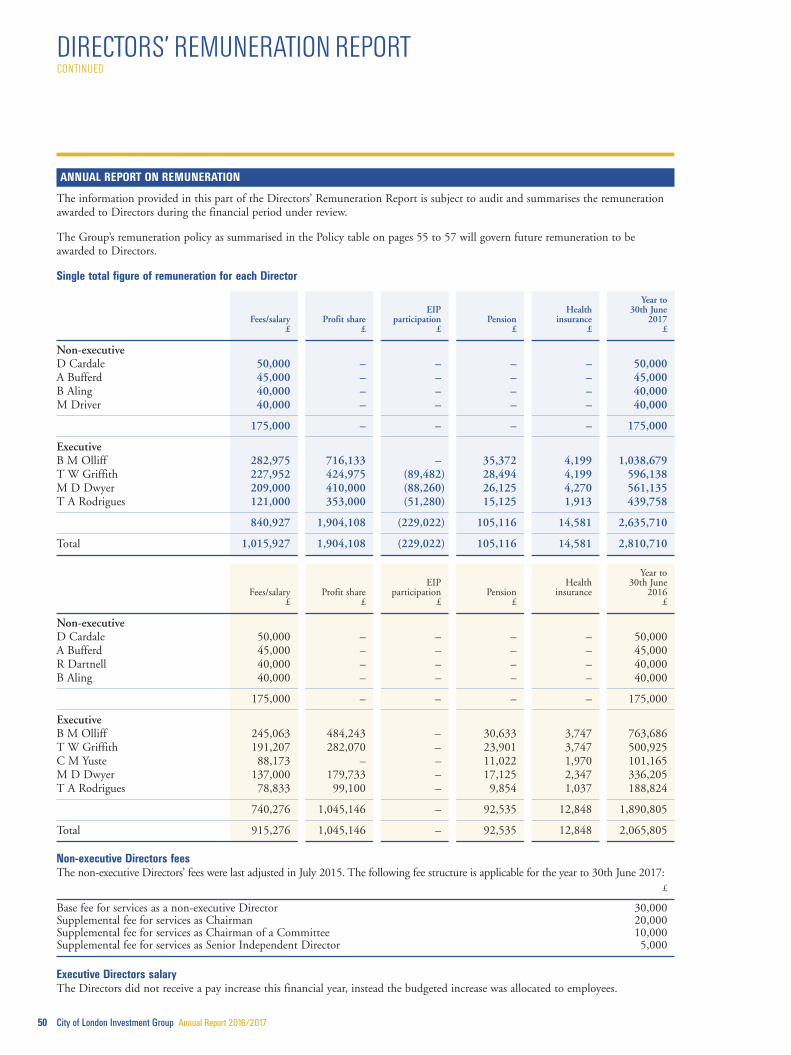
50 City of London Investment Group Annual Report 2016/2017
DIRECTORS’ REMUNERATION REPORTCONTINUED
ANNUAL REPORT ON REMUNERATION
The information provided in this part of the Directors’ Remuneration Report is subject to audit and summarises the remunerationawarded to Directors during the financial period under review.
The Group’s remuneration policy as summarised in the Policy table on pages 55 to 57 will govern future remuneration to beawarded to Directors.
Single total figure of remuneration for each Director
Year toEIP Health 30th June
Fees/salary Profit share participation Pension insurance 2017£ £ £ £ £ £
Non-executiveD Cardale 50,000 – – – – 50,000A Bufferd 45,000 – – – – 45,000B Aling 40,000 – – – – 40,000M Driver 40,000 – – – – 40,000
175,000 – – – – 175,000
ExecutiveB M Olliff 282,975 716,133 – 35,372 4,199 1,038,679T W Griffith 227,952 424,975 (89,482) 28,494 4,199 596,138M D Dwyer 209,000 410,000 (88,260) 26,125 4,270 561,135T A Rodrigues 121,000 353,000 (51,280) 15,125 1,913 439,758
840,927 1,904,108 (229,022) 105,116 14,581 2,635,710
Total 1,015,927 1,904,108 (229,022) 105,116 14,581 2,810,710
Year to EIP Health 30th June
Fees/salary Profit share participation Pension insurance 2016£ £ £ £ £
Non-executiveD Cardale 50,000 – – – – 50,000A Bufferd 45,000 – – – – 45,000R Dartnell 40,000 – – – – 40,000B Aling 40,000 – – – – 40,000
175,000 – – – – 175,000
ExecutiveB M Olliff 245,063 484,243 – 30,633 3,747 763,686T W Griffith 191,207 282,070 – 23,901 3,747 500,925C M Yuste 88,173 – – 11,022 1,970 101,165M D Dwyer 137,000 179,733 – 17,125 2,347 336,205T A Rodrigues 78,833 99,100 – 9,854 1,037 188,824
740,276 1,045,146 – 92,535 12,848 1,890,805
Total 915,276 1,045,146 – 92,535 12,848 2,065,805
Non-executive Directors feesThe non-executive Directors’ fees were last adjusted in July 2015. The following fee structure is applicable for the year to 30th June 2017:
£
Base fee for services as a non-executive Director 30,000Supplemental fee for services as Chairman 20,000Supplemental fee for services as Chairman of a Committee 10,000Supplemental fee for services as Senior Independent Director 5,000
Executive Directors salaryThe Directors did not receive a pay increase this financial year, instead the budgeted increase was allocated to employees.

City of London Investment Group Annual Report 2016/2017 51
OverviewCorporate governance
Financial statements
Shareholder information
Strategic report
The year on year comparison of salaries in the single total figure table reflects increases which have arisen as follows:
1. B M Olliff – paid in US dollars and reported in sterling. The difference is due to a weaker pound to the US dollar.
2. T W Griffith – received a pay rise of 7% as of 1st January 2016, therefore 12 months at the increased salary this year compared toonly six months last year. Plus paid in US dollars and reported in sterling.
3. M D Dwyer – appointed to the Board on 19th October 2015 so last year’s salary was only for a partial year. In addition, he received asalary increase of 7% as of 1st January 2016, therefore 12 months at the increased salary this year compared to only six months last year.
4. T A Rodrigues – appointed to the Board on 19th October 2015 so last year’s salary was only for a partial year. In addition, shereceived a salary increase of 10% as of 1st January 2016, therefore 12 months at the increased salary this year compared to onlysix months last year.
Profit shareThe Company operates a bonus scheme for all employees, including the executive Directors that is linked to the Group’s profitability.We have allocated a maximum bonus of 30% of the pre-bonus, pre-tax, operating profit for this purpose. Such allocation may bereduced infrequently as a result of an assessment of the projected intermediate term financial performance of the Company, andconsistent with our fundamental objective of an appropriate balance of the interests among all stakeholders: clients, shareholders,employees and management. Bonus awards are made by the Board following recommendations by the Remuneration Committee.
Barry Olliff is entitled under his service agreement to a bonus equal to 5% of the pre-tax profits of the Company, and payment ofthis entitlement is covered by Mr Olliff ‘s allocation from the maximum 30% bonus pool. Barry Olliff received 4.2% for the periodunder review (2016: 4.2%). The 4.2% of pre-tax profits for the period under review was the result of a voluntary agreement betweenBarry Olliff and the Remuneration Committee to give priority consideration to other stakeholders.
Deferred profit share paymentsThe following amounts have been deferred and will be paid once the financial statements have been audited and approved.
2017 2016
% of % of £ annual award £ annual award
B M Olliff 30,265 4% 22,159 5%T W Griffith 9,017 2% 12,225 4%M D Dwyer 8,714 2% 11,760 7%T A Rodrigues 10,312 3% 7,465 8%
These amounts are included in the profit share reported in the table on page 50.
Employee Incentive Plan (EIP)The EIP was approved by shareholders at the October 2016 AGM and adopted by the Group in December. It is open to employees of allGroup companies, including executive Directors. Participants are invited to waive up to 20% (or up to 30% if there is headroom within thecap agreed by shareholders) of their annual bonus in return for the right to participate in the EIP for the relevant financial year. Under theEIP, they are granted Restricted Share Awards (RSAs) over shares in the Company equal in value to 2 x the amount they have waived.
As the EIP was introduced in December 2016, the waivers submitted upon implementation relate only to the profit share paidthereafter in relation to services provided to 30th June 2017. The RSAs in respect of the waived profit share disclosed in the Directors’remuneration table on page 50 will be granted in October 2017.
The RSAs will vest one-third each year over a three year period and will accrue an amount equal to the dividend that the Directorwould have received had they been the shareholder from the date of grant.
The EIP is linked to the Group’s profitability, and for the first four years is capped at 5% of pre-bonus, pre-tax, operating profit tocover the charge of the matching shares. Thereafter, the EIP will fall within the 30% limit of the profit share pool. For further detailssee the Policy table on page 56.
PensionAll employees, including executive Directors, are entitled to membership of the Group’s defined contribution pension arrangements.Contributions are capped at 12.5% of annual salary. Employer contributions in respect of all executive Directors were 12.5% for theperiod under review.
Taxable benefitsTaxable benefits relate to private medical insurance for executive Directors and their dependants. It should be noted that althoughthe Group offers private medical insurance to all staff it is not considered a taxable benefit for those resident in the US.

DIRECTORS’ REMUNERATION REPORTCONTINUED
52 City of London Investment Group Annual Report 2016/2017
Payments to past DirectorsNo payment or transfer of assets was made during the financial period to any past Director of the Company.
Payments for loss of officeThere were no termination payments made to any person who has served as a Director during the financial period.
Summary of share option plan interests The Company operates an Employee Share Option Plan which is administered by the Remuneration Committee. The Plan is opento employees of all Group companies and executive Directors (who are required to work more than 25 hours per week provided theydo not have a material interest in the Company, that is to say the ability to control more than 25% of the ordinary share capital).Options were last granted to executive Directors under the Plan in June 2015 and it is not intended that any new options will begranted in the future to executive Directors as they now participate in the EIP.
Number of options
Exercised Granted Exercise Price at Face valueHeld during the during the Held price grant at grant Vesting Vesting Expiry2016 period period 2017 £ £ £ period date date
T W Griffith 5,000 (5,000) – – 2.61 2.61 – 3 yrs 30/01/2010 30/01/20175,000 (5,000) – – 2.73 2.73 – 3 yrs 30/03/2010 30/03/201712,000 (12,000) – – 2.75 2.3 – 3 yrs 01/10/2011 01/10/20188,000 – – 8,000 2.3 2.3 18,400 3 yrs 05/06/2012 05/06/201912,500 – – 12,500 3.14 3.14 39,250 3 yrs 18/01/2013 18/01/20207,500 – – 7,500 3.625 3.625 27,188 3 yrs 13/10/2013 13/10/20205,000 – – 5,000 4.03 4.03 20,150 3 yrs 05/04/2014 05/04/20216,000 – – 6,000 3.4875 3.4875 20,925 3 yrs 04/11/2014 04/11/202117,000 – – 17,000 2.55 2.5 42,500 3 yrs 30/01/2017 30/01/2024
Vested 78,000 (22,000) – 56,000
23,500 – – 23,500 3.52 3.52 82,720 3 yrs 19/06/2018 19/06/2025
Unvested 23,500 – – 23,500
Total 101,500 (22,000) – 79,500
M Dwyer 50,000 – – 50,000 3.6 3.6 180,000 3 yrs 03/05/2015 03/05/202215,500 (10,000) – 5,500 2.55 2.5 13,750 3 yrs 30/01/2017 30/01/2024
Vested 65,500 (10,000) – 55,500
17,500 – – 17,500 3.52 3.52 61,600 3 yrs 19/06/2018 19/06/2025
Unvested 17,500 – – 17,500
Total 83,000 (10,000) – 73,000
T A Rodrigues 4,000 (4,000) – – 2.61 2.61 – 3 yrs 30/01/2010 30/01/20174,000 (4,000) – – 2.73 2.73 – 3 yrs 30/03/2010 30/03/20174,000 (4,000) – – 2.3 2.3 – 3 yrs 05/06/2012 05/06/20193,000 (3,000) – – 3.14 3.14 – 3 yrs 18/01/2013 18/01/20203,000 – – 3,000 3.625 3.625 10,875 3 yrs 13/10/2013 13/10/20203,000 – – 3,000 4.03 4.03 12,090 3 yrs 05/04/2014 05/04/20214,000 – – 4,000 3.4875 3.4875 13,950 3 yrs 04/11/2014 04/11/202113,500 (13,500) – – 2.55 2.5 – 3 yrs 30/01/2017 30/01/2024
Vested 38,500 (28,500) – 10,000
17,500 – – 17,500 3.52 3.52 61,600 3 yrs 19/06/2018 19/06/2025
Unvested 17,500 – – 17,500
Total 56,000 (28,500) – 27,500
The closing market price of the Company’s ordinary shares at 30th June 2017 was £4.0625 (2016: £2.97) and the price movedduring the year between a low of £3.0225 to a high of £4.065 (2016: low £2.85 high £3.675).
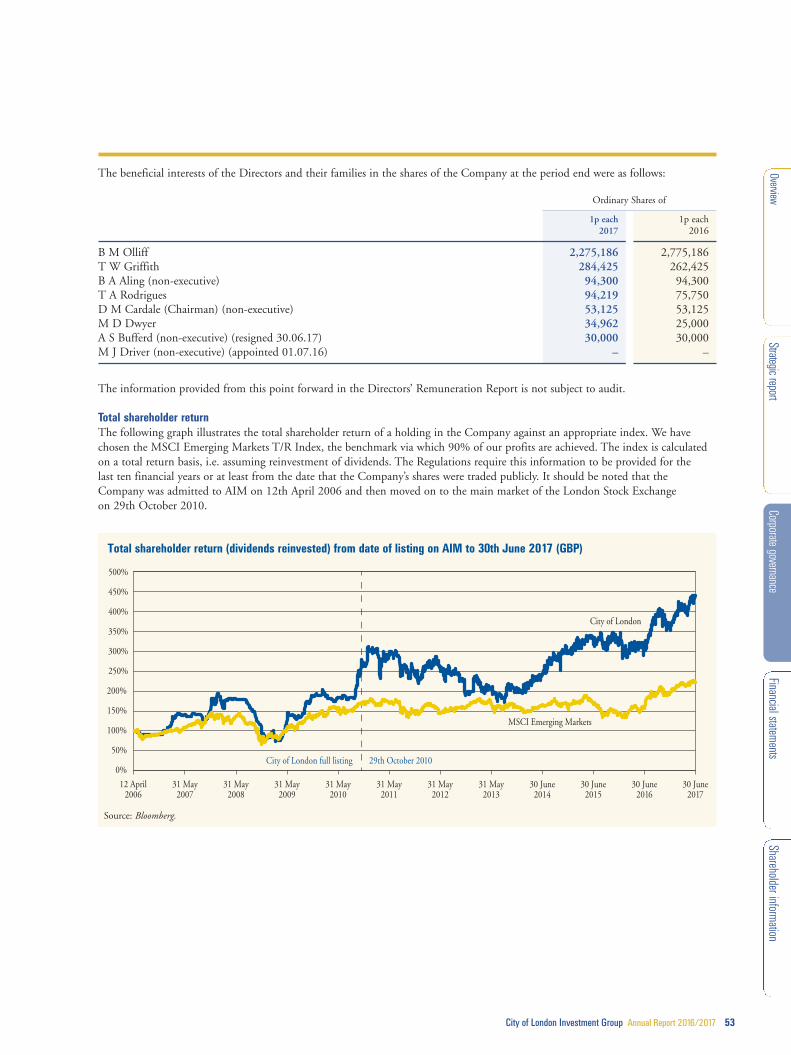
Total shareholder return (dividends reinvested) from date of listing on AIM to 30th June 2017 (GBP)
12 April2006
31 May2007
31 May2008
31 May2009
31 May2010
31 May2011
30 June2017
30 June2016
31 May2012
31 May2013
30 June2014
30 June2015
City of London
City of London full listing 29th October 2010
MSCI Emerging Markets
0%
50%
100%
150%
200%
300%
250%
400%
350%
500%
450%
City of London Investment Group Annual Report 2016/2017 53
OverviewCorporate governance
Financial statements
Shareholder information
Strategic report
The beneficial interests of the Directors and their families in the shares of the Company at the period end were as follows:
Ordinary Shares of
1p each 1p each2017 2016
B M Olliff 2,275,186 2,775,186T W Griffith 284,425 262,425B A Aling (non-executive) 94,300 94,300T A Rodrigues 94,219 75,750D M Cardale (Chairman) (non-executive) 53,125 53,125M D Dwyer 34,962 25,000A S Bufferd (non-executive) (resigned 30.06.17) 30,000 30,000M J Driver (non-executive) (appointed 01.07.16) – –
The information provided from this point forward in the Directors’ Remuneration Report is not subject to audit.
Total shareholder returnThe following graph illustrates the total shareholder return of a holding in the Company against an appropriate index. We havechosen the MSCI Emerging Markets T/R Index, the benchmark via which 90% of our profits are achieved. The index is calculatedon a total return basis, i.e. assuming reinvestment of dividends. The Regulations require this information to be provided for thelast ten financial years or at least from the date that the Company’s shares were traded publicly. It should be noted that theCompany was admitted to AIM on 12th April 2006 and then moved on to the main market of the London Stock Exchangeon 29th October 2010.
Source: Bloomberg.

DIRECTORS’ REMUNERATION REPORTCONTINUED
54 City of London Investment Group Annual Report 2016/2017
Chief Executive Officer single figureThe following table shows the total remuneration of Barry Olliff, CEO for the last eight financial years.
Year to Year to Year to Year to 13 months Year to Year to Year to31st May 31st May 31st May 31st May to 30th June 30th June 30th June 30th June
2010 2011 2012 2013(1) 2014 2015 2016 2017£ £ £ £ £ £ £ £
CEO single figure remuneration 1,152,351 1,210,763 1,012,801 580,922 693,550 805,430 763,686 1,038,679
Annual bonus (as a % ofcurrent cap) (2) 120% 100% 92% 51% 84% 85% 84% 84%
LTIP – % of maximum opportunity n/a n/a n/a n/a n/a n/a n/a n/a
Notes:(1) Barry Olliff stepped down as CEO on 1st January 2013 and resumed the role on 15th April 2013. During this time he remained a Director and CIO on
the same salary. Therefore his remuneration for the full year has been included in this table to provide a useful comparative.
(2) In 2015 the Directors Remuneration Policy was amended to include a cap on bonuses paid to Directors and the CEO’s cap was set at 5% of pre-bonus, pre-taxoperating profit. For comparison purposes prior years’ annual bonuses are shown as a percentage of 5% of pre-bonus, pre-tax operating profit each year.
Percentage change in the remuneration of the CEO and employeesThe table below shows the change in Barry Olliff ‘s salary, benefits and bonus in comparison with the Group’s employees as a whole.
The average change for employees as a whole is given using a per capita figure based on the average number of employees for the period.
Comparison of percentage change in value from 2016 to 2017 CEO Group employees
Salary 15% 12%Health Insurance 12% 8%Annual bonus awards 48% 48%
Note:– The regulations require us to disclose taxable benefits. Health insurance is offered to all employees but is not considered a taxable benefit in all countries.For comparative purposes we have based our calculations on all health insurance costs incurred, whether a taxable benefit or not.
The comparisons include the varying effects of currency exchange rates from one geographic location to another in conversion tosterling for the two comparative periods.
As an example, Barry Olliff has not taken a salary increase for over 10 years, therefore the 15% movement shown in the table aboverepresents the increased cost to the Company due to the movement in the US dollar / sterling rate, and not an increase to his remuneration.
Relative importance of spend on payThe table below shows the overall expenditure on employee remuneration and shareholder distributions and the percentage changebetween the current and previous period.
2017 2016 %£ £ change
Total employee spend 13,153,914 10,606,490 24%
Average headcount 72 72 0%
Profit after tax 9,289,755 5,791,354 60%
Dividends relating to the period * 6,342,087 6,017,823 5%
* The current period includes an estimate of the final dividend based on the number of qualifying shares as at 30th June 2017. The Board are recommendingan increase in this year’s final dividend, which would make the total for the year 25p per share (2016: 24p per share). This is subject to shareholder approvalat the AGM in October. The prior period estimate has been restated to include actual final dividend paid.
A breakdown of the employee spend can be found in note 5 to the financial statements on page 74.

City of London Investment Group Annual Report 2016/2017 55
OverviewCorporate governance
Financial statements
Shareholder information
Strategic report
Remuneration CommitteeDuring the period under review, the members of the Remuneration Committee were Mark Driver (Chairman of the Committee),Allan Bufferd and Barry Aling. The Remuneration Committee meets formally at least four times a year and otherwise as required.During the year to 30th June 2017 the scheduled Committee meetings were principally to review and approve the quarterlyassessment of the profit share pool, and allocations therefrom to executive Directors and senior employees, and the semi-annualsalary review including both the overall level of awards and individual awards to executive Directors and senior employees. In addition, the Committee agreed and finalised the Employee Incentive Plan and reviewed the level of employee participation to ensure it remained within the limits of the plan rules. Both the Chairman of the Company and the CEO are invited to attend themeetings to assist the Committee with its deliberations. The Finance Director attends in her capacity as secretary to the Committee.
Details of attendance by members are set out on page 42.
Statement of voting at the last Annual General Meeting (AGM)The resolutions seeking approval of the Remuneration Policy and Annual Report at the AGM in October 2016 received thefollowing votes.
Policy Annual report
Number Percentage of Number Percentage ofof votes votes cast of votes votes cast
For* 11,495,553 82.3% 13,397,801 95.9%Against 2,469,025 17.7% 569,777 4.1%
Total votes cast 13,964,578 13,967,578
Votes withheld 33,636 30,636
* includes discretionary votes
DIRECTORS’ REMUNERATION POLICY
The Directors’ Remuneration Policy (the “policy”) was approved by shareholders at the last AGM in October 2016, and will remainin force until the 2019 AGM unless material changes are proposed in the intervening period. For convenience, the following is anoverview of the approved policy.
Policy overviewThe Remuneration Committee is responsible for determining the Group’s policy on Directors’ remuneration and other managers.The Committee’s terms of reference may be found on the Group’s website at http://www.citlon.co.uk/shareholders/share_reports.php
Policy tableThe table below summaries the principal components of the Group’s remuneration policy for Directors.
Base salary (fixed pay)
EXECUTIVE DIRECTORS
To pay a fair base salary,commensurate with the size ofthe business and the individual’srole and experience.
Revised semi-annually, with changes, if any,generally effective 1st January and 1st July.The Committee considers salaries in the contextof an overall package with regard to marketdata, Group performance and individualexperience and performance.
The semi-annual pay review does not guaranteean increase. The Committee considers itimportant to keep fixed costs under tight controland as such salaries are at the lower end ofwhat may be described as market average.
There is no set maximum salary, however,the Committee is guided by marketdata/practice when setting pay awards.
Not applicable. Not applicable.
Component and purpose Operation Maximum opportunity
Performance measuresand targets Recovery

DIRECTORS’ REMUNERATION REPORTCONTINUED
56 City of London Investment Group Annual Report 2016/2017
Employee Incentive Plan (“Plan”)
EXECUTIVE DIRECTORS continued
To encourage and rewardloyalty, and to align the long-term interests of Directors withthat of shareholders and clients.The Plan is designed to work inline with the Group’s currentannual bonus policy.
The Plan is open to employees of all Groupcompanies and Directors. Participants will initiallybe invited to waive up to 20% of their annualbonus in return for the right to participate in thePlan for the financial year. Under the Plan, theywill be granted Restricted Share Awards (RSAs)over shares in the Company equal in value to2 x the amount they have waived.
The Plan is linked to the Group’s profitability,and for the first four years is capped at 5%of pre-bonus, pre-tax, operating profit to coverthe charge of matching shares. Thereafter,the Plan will fall within the 30% limit of theprofit-share pool.
Depending on the level of participation, ifthere is headroom within the 5% of pre-bonus, pre-tax operating profit, employeesand Directors will be offered the opportunityto increase their participation up to 30% oftheir annual bonus.
Awards held until they vest will receive adividend equivalent payment, equal to theamount that they would have received hadthey been entitled to dividends from thedate of grant.
Not applicable. The restricted share awards will vest 1/3each year over a three year period. TheRSAs are funded 50% by waived bonusand 50% by the Company. In the eventof termination before the normal vestingdate, the RSAs funded by the waivedbonus, will be repaid at the lower of thevalue of those shares on the date ofaward and the date of forfeiture. TheCompany funded RSAs will be forfeitedupon termination, except in the case of a good leaver (see ESOP section below),where there will be an entitlement to a pro-rated amount.
Pension (fixed pay)To provide defined contributionpension arrangements to assistwith recruitment and retention.
Employer contributions are made to definedcontribution pension arrangements or equivalentcash allowances are paid, subject to localpractice in the relevant country.
The maximum defined pension contributionor cash equivalent is 12.5% per annumof base salary.
Not applicable. Not applicable.
Other benefits (fixed pay)To provide market competitivefringe benefits.
Currently benefits offered include: life insurance,medical insurance (or a contribution towardsthe cost), disability insurance, paid holiday/sabbatical and travel season ticket loans.
Additional benefits may be provided if required,for example to support international relocation.
These benefits represent a small element ofthe overall remuneration package and assuch are not subject to a specific cap.
Directors are entitled to 30 days paidholiday, in addition to public holidays. MrOlliff is also entitled to an annual sabbaticalof up to six weeks, with pay and benefits.
Not applicable. Benefits are provided up to terminationof employment and any outstandingtravel season ticket loan is repayable infull.
Discretionary bonus (variable pay)To incentivise and rewardDirectors for their contributionto the corporate goals outlinedin the strategic report.
The Company operates a bonus plan for allemployees, including the executive Directors,that is linked to the Group’s profitability,allocating a maximum of 30% of pre-bonus,pre-tax, operating profit for this purpose.Bonus awards are made by the Boardfollowing recommendations by theRemuneration Committee.
Bonuses are paid quarterly in September(approximately 10% of the estimated annualbonus), December (20%), March (30%) andJuly (40%). A minimum of 10% of theJuly payment is deferred until Septemberonce the financial statements have beenaudited and approved.
The maximum payment to each ExecutiveDirector is capped at 2.5% of pre-bonus,pre-tax operating profit of the Group, exceptfor Barry Olliff whose entitlement is cappedat 5% of the pre-bonus, pre-tax operatingprofit, of the Group, provided, however,those profits exceed £500,000.
Bonuses are not subject toindividual performanceconditions and are paid incash. Although thisremuneration policy doesnot comply with the UKCorporate Governance Code,the Board believes that thisbonus scheme has workedwell in motivating staff at alllevels within the Companyand that this is demonstratedby the high employeeretention rates experiencedby the Group.
No profit share shall be payable for anyyear in which employment is terminatedor at any time after the Director hasgiven or received notice of termination.This relates to all executive Directorsexcept Barry Olliff whose contractprovides that he will be entitled to aproportion of the bonus to which hewould have been entitled had he beenemployed for the whole year.
ClawbackTo ensure that bonus awards donot encourage excessive risk.
The Committee can seek to recover the annualbonus in the exceptional event of: misstatementor misleading representation of performance;a significant failure of risk management andcontrol; or serious misconduct of an individual.
The Committee has discretion to determinethe amount of any award which it seeksto clawback.
Not applicable. Not applicable.
ESOPTo encourage both Director andemployee share ownership andalign their long-term interestswith that of shareholders.
The Board are no longer granting awards underthe ESOP as this plan has effectively beenreplaced by the EIP. Details of the ESOP areprovided here for information. The last awardgranted was in June 2015. The awards have a ten year life span.
The Employee Benefit Trust is currentlypermitted to hold up to 10% of the issuedshare capital of the Company.
Executive Director annual awards are limitedto 50% of base salary.
Option awards are madeby the Board followingrecommendations by theRemuneration Committee.
Options held will lapse upon terminationexcept for good leavers who may exercisetheir options within six months commencingfrom the date they ceased to be a Director.A good leaver is a Director who leaves dueto ill health or disability, sale of the business,on retirement, through redundancy or inother special circumstances approved by theRemuneration Committee (acting fairly andreasonably). Under the rules of the newoption scheme adopted in June 2015,options may be exercised up to 90 daysafter termination.
Component and purpose Operation Maximum opportunity
Performance measuresand targets Recovery
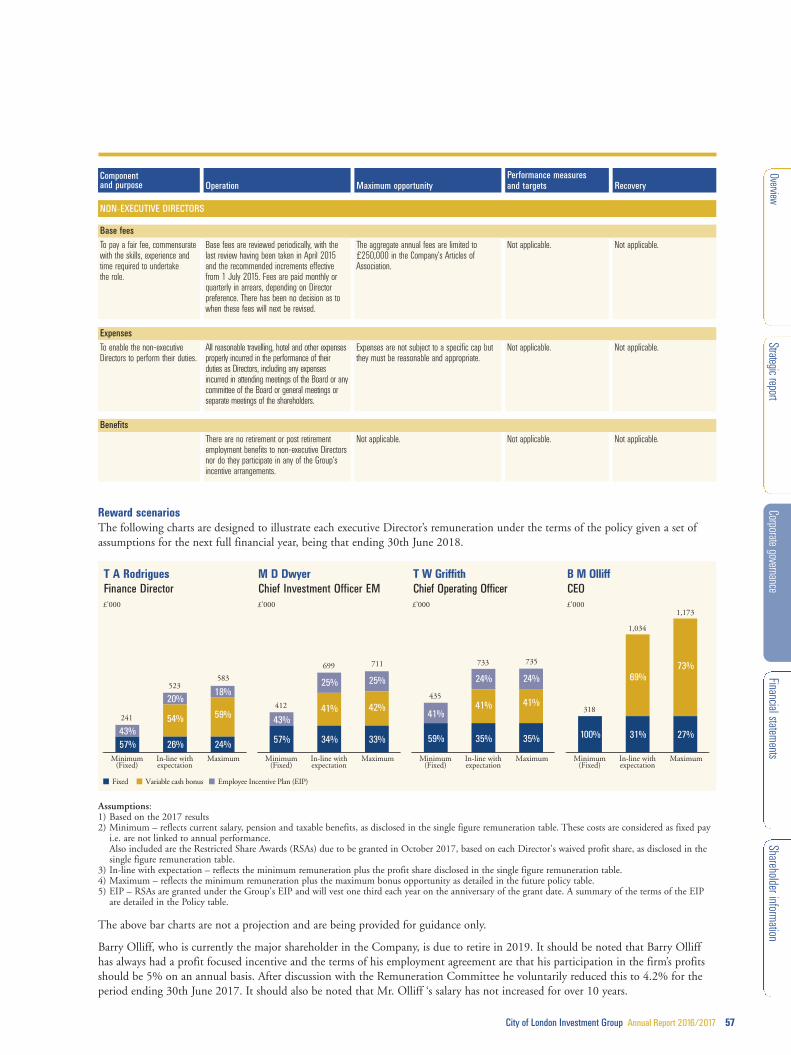
City of London Investment Group Annual Report 2016/2017 57
OverviewCorporate governance
Financial statements
Shareholder information
Strategic report
Reward scenariosThe following charts are designed to illustrate each executive Director’s remuneration under the terms of the policy given a set ofassumptions for the next full financial year, being that ending 30th June 2018.
Assumptions:1) Based on the 2017 results2) Minimum – reflects current salary, pension and taxable benefits, as disclosed in the single figure remuneration table. These costs are considered as fixed payi.e. are not linked to annual performance.Also included are the Restricted Share Awards (RSAs) due to be granted in October 2017, based on each Director's waived profit share, as disclosed in thesingle figure remuneration table.
3) In-line with expectation – reflects the minimum remuneration plus the profit share disclosed in the single figure remuneration table.4) Maximum – reflects the minimum remuneration plus the maximum bonus opportunity as detailed in the future policy table.5) EIP – RSAs are granted under the Group's EIP and will vest one third each year on the anniversary of the grant date. A summary of the terms of the EIPare detailed in the Policy table.
The above bar charts are not a projection and are being provided for guidance only.
Barry Olliff, who is currently the major shareholder in the Company, is due to retire in 2019. It should be noted that Barry Olliffhas always had a profit focused incentive and the terms of his employment agreement are that his participation in the firm’s profitsshould be 5% on an annual basis. After discussion with the Remuneration Committee he voluntarily reduced this to 4.2% for theperiod ending 30th June 2017. It should also be noted that Mr. Olliff ‘s salary has not increased for over 10 years.
Component and purpose Operation Maximum opportunity
Performance measuresand targets Recovery
Base feesTo pay a fair fee, commensuratewith the skills, experience andtime required to undertakethe role.
Base fees are reviewed periodically, with thelast review having been taken in April 2015and the recommended increments effectivefrom 1 July 2015. Fees are paid monthly orquarterly in arrears, depending on Directorpreference. There has been no decision as towhen these fees will next be revised.
The aggregate annual fees are limited to£250,000 in the Company’s Articles ofAssociation.
Not applicable. Not applicable.
ExpensesTo enable the non-executiveDirectors to perform their duties.
All reasonable travelling, hotel and other expensesproperly incurred in the performance of theirduties as Directors, including any expensesincurred in attending meetings of the Board or anycommittee of the Board or general meetings orseparate meetings of the shareholders.
Expenses are not subject to a specific cap butthey must be reasonable and appropriate.
Not applicable. Not applicable.
BenefitsThere are no retirement or post retirementemployment benefits to non-executive Directorsnor do they participate in any of the Group’sincentive arrangements.
Not applicable. Not applicable. Not applicable.
NON-EXECUTIVE DIRECTORS
MaximumMinimum(Fixed)
In-line withexpectation
Fixed Variable cash bonus Employee Incentive Plan (EIP)
£’000 £’000 £’000 £’000
MaximumMinimum(Fixed)
In-line withexpectation
MaximumMinimum(Fixed)
In-line withexpectation
MaximumMinimum(Fixed)
In-line withexpectation
26%
241
57%43%
523
24%
54% 59%
20%18%
583
34%
412
57%
43%
699
33%
41% 42%
25% 25%
711
35%
435
59%
41%
733
35%
41% 41%
24% 24%
735
31%
318
100%
1,034
27%
69%73%
1,173
M D DwyerChief Investment Officer EM
T W GriffithChief Operating Officer
B M OlliffCEO
T A RodriguesFinance Director
58 City of London Investment Group Annual Report 2016/2017
DIRECTORS’ REMUNERATION REPORTCONTINUED
Consideration of employment conditions elsewhere in the GroupThe firm has always adopted a partnership approach so in essence this policy is consistent with that applied across the Group.
While employees were not directly consulted on the Directors’ remuneration, the Group remuneration policy is provided to allstaff and any feedback or concerns are welcomed.
Recruitment of new DirectorsThe structure of the package offered to new Directors mirrors that offered to current Directors detailed in the future policy table.
The Group does not normally award guaranteed annual bonuses, however if when recruiting the Committee believes it is necessary,a guaranteed bonus may be offered for the first 12 months of service only. In general, the bonus would not exceed one year’s salary.However, the Remuneration Committee reserves the discretion to take into account exceptional circumstances in determining theappropriate application of this policy limit, in which case the rationale for any such payment exceeding the policy limit would beexplained to the shareholders as a point of information.
Payments for loss of office – Service contracts and letters of appointmentIn line with general market practice, the executive Director service contracts are based on a rolling 12 month period, except forBarry Olliff. His contract may also be terminated on 12 months’ notice by either party and it will automatically terminate on his75th birthday, 31st December 2019. Termination of any service contract requires 12 months written notice by either party, and theCommittee has the discretion to make a payment in lieu of notice. This would consist of one year’s base salary only.
Non-executive Directors do not have service contracts, but are engaged under letters of appointment. Their appointment can beterminated by serving six months’ notice by either party and the Committee has the discretion to make a payment in lieu of notice.
Details of Directors’ service contracts and letters of appointment are below:
Date of contract/ Notice period Notice period Provision of compensationName letter of appointment from company from Director for loss of office
Executive DirectorsBarry Olliff 9th June 2014 One year One year One year’s salaryTom Griffith 1st February 2013 One year One year One year’s salaryTracy Rodrigues 19th October 2015 One year One year One year’s salaryMark Dwyer 19th October 2015 One year One year One year’s salary
Non-executive DirectorsDavid Cardale 6th April 2006 Six months Six months Six months feesBarry Aling 1st August 2013 Six months Six months Six months feesMark Driver 1st July 2016 Six months Six months Six months feesSusannah Nicklin 1st July 2017 Six months Six months Six months fees
All Directors’ service contracts and letters of appointment are kept at the Company’s registered office and will be available forinspection at the AGM.
Approved by the Board of Directors and signed on behalf of the Board
Mark DriverChairman of the Remuneration Committee14th September 2017

STATEMENT OF DIRECTORS’ RESPONSIBILITIES
City of London Investment Group Annual Report 2016/2017 59
The Directors are responsible for preparing the Annual Report,the Directors’ remuneration report and the financial statementsin accordance with applicable laws and regulations.
Company law requires the Directors to prepare Group andCompany financial statements for each financial year. Under thatlaw the Directors have elected to prepare the financial statementsin accordance with International Financial Reporting Standards(IFRS) as adopted by the European Union and with those parts ofthe Companies Act 2006 applicable to companies reporting underIFRS. Under company law the Directors must not approve thefinancial statements unless they are satisfied that they give a trueand fair view of the state of affairs of the Group and Companyand of the profit or loss of the Group for that period. In preparingthese financial statements, the Directors are required to:
• select suitable accounting policies and then apply themconsistently;
• make judgements and accounting estimates that arereasonable and prudent;
• state whether applicable IFRSs have been followed, subject toany material departures disclosed and explained in thefinancial statement;
• prepare the financial statements on the going concernbasis unless it is inappropriate to presume that theCompany will continue in business.
The Directors are responsible for keeping adequate accountingrecords that are sufficient to show and explain the Company’stransactions and disclose with reasonable accuracy at any timethe financial position of the Company and enable them toensure that the financial statements comply with the CompaniesAct 2006 and, as regards the Group financial statements,Article 4 of the IAS Regulation. They are also responsible forsafeguarding the assets of the Company and hence for takingreasonable steps for the prevention and detection of fraud andother irregularities.
Under applicable law and regulations, the Directors are alsoresponsible for preparing a strategic report and a directors’report (including the directors’ remuneration report andcorporate governance statement) that comply with that lawand those regulations.
The Directors are responsible for the maintenance and integrityof the corporate and financial information included on theCompany’s website. Legislation in the United Kingdomgoverning the preparation and dissemination of the financialstatements may differ from legislation in other jurisdictions.
Responsibility statementEach of the persons who is a Director at the date of approval ofthis report confirms that to the best of his or her knowledge:
i) the financial statements, prepared in accordance with theapplicable set of accounting standards, gives a true and fair viewof the assets, liabilities, financial position and profit or loss ofthe issuer and the undertakings included in the consolidationtaken as a whole;
ii) the strategic report and directors’ report include a fair reviewof the development and performance of the business andthe position of the Company and the undertakings includedin the consolidation taken as a whole, together with adescription of the principal risks and uncertainties thatthey face; and
iii) the annual report, taken as a whole, is fair, balanced andunderstandable and provides the information necessary forshareholders to assess the Company’s performance, businessmodel and strategy.
For and on behalf of the Board
Barry OlliffChief Executive Officer14th September 2017
OverviewCorporate governance
Financial statements
Shareholder information
Strategic report

INDEPENDENT AUDITOR’S REPORTTO THE MEMBERS OF CITY OF LONDON INVESTMENT GROUP PLC
60 City of London Investment Group Annual Report 2016/2017
We have audited the financial statements of City of LondonInvestment Group Plc (“the Group”) for the year ended30th June 2017 which comprise the Consolidated statement ofcomprehensive income, Consolidated and Company statement offinancial position, Consolidated and Company statement ofchanges in equity, Consolidated and Company cash flow statementand notes to the financial statements, including a summary ofsignificant accounting policies. The financial reporting frameworkthat has been applied in their preparation is applicable law andInternational Financial Reporting Standards (IFRSs) as adopted bythe European Union, and as regard the parent company, IFRSs asadopted by the European Union and as applied in accordancewith the provisions of the Companies Act 2006.
In our opinion the financial statements:
• give a true and fair view of the state of the group’s and theparent company’s affairs as at 30th June 2017 and of the group’sprofit for the period then ended;
• the group financial statements have been properly prepared inaccordance with IFRSs as adopted by the European Union;
• the parent company financial statements have been properlyprepared in accordance with IFRSs as adopted by the EuropeanUnion and as applied in accordance with the provisions of theCompanies Act 2006 and;
• the financial statements have been prepared in accordance withthe requirements of the Companies Act 2006 and, as regards thegroup financial statements, Article 4 of the IAS Regulation
This report is made solely to the company’s members, as a body,in accordance with Chapter 3 of Part 16 of the Companies Act2006. Our audit work has been undertaken so that we might stateto the company’s members those matters we are required to stateto them in an auditor’s report and for no other purpose. To thefullest extent permitted by law, we do not accept or assumeresponsibility to anyone other than the company and thecompany’s members as a body, for our audit work, for thisreport, or for the opinions we have formed.
Basis for opinionWe conducted our audit in accordance with International Standardson Auditing (UK) (ISAs (UK)) and applicable law. Ourresponsibilities under those standards are further described in theAuditor’s responsibilities for the audit of the financial statementssection of our report. We are independent of the group in accordancewith the ethical requirements that are relevant to our audit of thefinancial statements in the UK, including the FRC’s Ethical Standardas applied to listed public interest entities, and we have fulfilled ourother ethical responsibilities in accordance with these requirements.We believe that the audit evidence we have obtained is sufficientand appropriate to provide a basis for our opinion.
Conclusions relating to principal risks, going concernand viability statementWe have nothing to report in respect of the following informationin the annual report, in relation to which the ISAs (UK) requireus to report to you whether we have anything material to add ordraw attention to:
• the disclosures in the annual report set out on pages 26 and 27that describe the principal risks and explain how they are beingmanaged or mitigated;
• the directors’ confirmation set out on page 25 in the annual reportthat they have carried out a robust assessment of the principal risksfacing the group, including those that would threaten its businessmodel, future performance, solvency or liquidity;
• the directors’ statement set out on page 38 in the financialstatements about whether the directors considered it appropriateto adopt the going concern basis of accounting in preparing thefinancial statements and the directors’ identification of anymaterial uncertainties to the company’s ability to continue todo so over a period of at least twelve months from the date ofapproval of the financial statements;
• whether the directors’ statement relating to going concernrequired under the Listing Rules in accordance with Listing Rule9.8.6R(3) is materially inconsistent with our knowledgeobtained in the audit; or
• the directors’ explanation set out on page 30 in the annual reportas to how they have assessed the prospects of the group, overwhat period they have done so and why they consider thatperiod to be appropriate, and their statement as to whether theyhave a reasonable expectation that the group will be able tocontinue in operation and meet its liabilities as they fall due overthe period of their assessment, including any related disclosuresdrawing attention to any necessary qualifications or assumptions.
Key audit mattersKey audit matters are those matters that, in our professionaljudgement, were of most significance in our audit of the financialstatements of the current period and include the most significantassessed risks of material misstatement (whether or not due tofraud) that we identified. These matters included those which hadthe greatest effect on: the overall audit strategy, the allocation ofresources in the audit; and directing the efforts of the engagementteam. These matters were addressed in the context of our audit ofthe financial statements as a whole, and in forming our opinionthereon, and we do not provide a separate opinion on these matters.
Breach of investment mandateAs a fund management group, the group is responsible formanaging assets in accordance with mandates specified by clients.The assets managed by the Group are subject to varying degrees

City of London Investment Group Annual Report 2016/2017 61
of financial risk. Trading outside agreed mandates could lead to,inter alia, financial loss for the Group.
Our audit work included, but was not restricted to, testing ofcontrols over access to, and reports generated by, the Group’s tradeorder management system, along with reviewing the controlframework and recent detailed review conducted by the group’scompliance department over the accuracy and completeness ofmandate restriction requirements included within the trade ordermanagement system, checking; i) correct restrictions are includedfor each mandate; ii) the trade order management system isoperating correctly; and iii) the daily reports identifying breachesof restrictions are being reviewed with any breaches properlyrecorded and promptly addressed.
Our testing did not identify any deviation in the operation ofcontrols which would have required us to amend the nature andscope of our planned detailed test work. From our testing, wefound no unexplained deviations between restrictions includedin mandates and the group’s trade order management system.
Management fees are accurate and completeManagement fees are calculated using a percentage of assets undermanagement for each mandate the group manages. Inaccurateassets under management figures, incomplete mandates orincorrect percentages applied to assets under management maylead to material inaccuracies.
Our audit work included, but was not restricted to, testing ofcontrols over the group’s reconciliation process in respect of theassets under management figures maintained by the group andassets under management figures maintained by various fundadministrators. We obtained third party confirmations ofmanagement fees paid to the group along with re-performingour own calculations for expected management fee income.
Our testing did not identify any failure in the operation of controlswhich would have required us to amend the nature and scope ofour planned detailed test work. From our detailed sample testing,we found no significant variance from our own calculations ofexpected management fee income or from the evidence providedby third party confirmations, and that recorded in the financialstatements. Further our testing of the take on process for newmandates demonstrated that management fees from new mandatesare recorded from the date on which they are due.
Regulatory requirementsThe group’s principal operating subsidiary, City of LondonInvestment Management Company Limited is regulated acrossfour separate jurisdictions. Compliance with regulations iscentral to the group’s business and can be onerous.
Our audit work included, but was not restricted to, testing ofcontrols over the completion and review processes, to board level,of the group’s compliance monitoring programme. In addition,we completed specific work on compliance with FCA laws andregulations in the UK and sought comfort from local regulatoryspecialists on the group’s compliance with the regulatoryrequirements in other jurisdictions.
Our testing did not identify any deviation in the operation ofcontrols which would have amended the nature and scope of ourplanned detailed test work. From completion of the work on FCAlaws and regulations we found no significant issues resulting in anunqualified Client Asset Report being filed with the FCA inaccordance with SUP 3.10.4R of the FCA’s handbook. Finally,confirmations received from local specialists provided sufficientcomfort on compliance with regulations in other jurisdictions.
Our application of materialityWe apply the concept of materiality in planning and performing ouraudit, and in evaluating the effect of misstatements and omissionson our audit and on the financial statements. For the purposes ofdetermining whether the financial statements are free from materialmisstatement we define materiality as the level of misstatement,including omissions that could influence the economic decisions ofa reasonably knowledgeable user of the financial statements.
We determined materiality for the financial statements as a whole tobe £579,000 which was determined by a reference to a benchmarkof approximately 5% of group profit before taxation which weconsider to cover the principal considerations for members of thecompany in assessing financial performance of the group.
We have agreed with the Audit Committee that we will report to itall corrected and uncorrected misstatements we identified throughour audit with a value in excess of £15,000 that have an impact onprofit, in addition to other audit misstatements that we believewarranted reporting on qualitative grounds.
An overview of the scope of our auditThe group consists of the parent undertaking and five subsidiaryundertakings (seven in the prior period, although one of these wasdisposed in the period and the other was reduced to an available forsale financial asset). We have been engaged to audit the parent entity,the consolidated financial statements and three of the subsidiaries.As a result we have audited 95% of the net assets of the group.
Of the remaining subsidiaries, one is exempt from audit as a resultof being dormant (and immaterial) throughout the period. Theother (which is not considered a significant component for thepurposes of the group audit) was audited by another independentmember firm of the Moore Stephens UK network.
OverviewCorporate governance
Financial statements
Shareholder information
Strategic report

INDEPENDENT AUDITOR’S REPORTCONTINUED
62 City of London Investment Group Annual Report 2016/2017
Other informationThe other information comprises the information included in theannual report set out on pages 1 to 59, other than the financialstatements and our auditor’s report thereon. The directors areresponsible for the other information. Our opinion on thefinancial statements does not cover the other information and,except to the extent otherwise explicitly stated in our report,we do not express any form of assurance conclusion thereon.In connection with our audit of the financial statements, ourresponsibility is to read the other information and, in doing so,consider whether the other information is materially inconsistentwith the financial statements or our knowledge obtained in theaudit or otherwise appears to be materially misstated. If we identifysuch material inconsistencies or apparent material misstatements,we are required to determine whether there is a materialmisstatement in the financial statements or a materialmisstatement of the other information. If, based on the work wehave performed, we conclude that there is a material misstatementof the other information; we are required to report that fact.
We have nothing to report in this regard.
In this context, we also have nothing to report in regard to ourresponsibility to specifically address the following items in theother information and to report as uncorrected materialmisstatements of the other information where we conclude thatthose items meet the following conditions:
• Fair, balanced and understandable set out on page 59 – thestatement given by the directors that they consider the annualreport and financial statements taken as a whole is fair, balancedand understandable and provides the information necessary forshareholders to assess the group’s performance, business modeland strategy, is materially inconsistent with our knowledgeobtained in the audit; or
• Audit committee reporting set out on pages 45 to 47 – thesection describing the work of the audit committee does notappropriately address matters communicated by us to the auditcommittee / the explanation as to why the annual report doesnot include a section describing the work of the auditcommittee is materially inconsistent with our knowledgeobtained in the audit; or
• Directors’ statement of compliance with the UK CorporateGovernance Code set out on pages 40 to 42 – the parts of thedirectors’ statement required under the Listing Rules relating tothe company’s compliance with the UK Corporate GovernanceCode containing provisions specified for review by the auditorin accordance with Listing Rule 9.8.10R(2) do not properlydisclose a departure from a relevant provision of the UKCorporate Governance Code.
Opinions on other matters prescribed by the Companies Act 2006In our opinion, the part of the directors’ remuneration report tobe audited has been properly prepared in accordance with theCompanies Act 2006.
In our opinion, based on the work undertaken in the course ofthe audit:
• the information given in the strategic report and the directors’report for the financial year for which the financial statementsare prepared is consistent with the financial statements andthose reports have been prepared in accordance with applicablelegal requirements;
• the information about internal control and risk managementsystems in relation to financial reporting processes and aboutshare capital structures, given in compliance with rules 7.2.5and 7.2.6 in the Disclosure Rules and Transparency Rulessourcebook made by the Financial Conduct Authority(the FCA Rules), is consistent with the financial statementsand has been prepared in accordance with applicable legalrequirements; and
• information about the company’s corporate governance codeand practices and about its administrative, management andsupervisory bodies and their committees complies with rules7.2.2, 7.2.3 and 7.2.7 of the FCA Rules.
Matters on which we are required to report by exceptionIn the light of the knowledge and understanding of the group andits environment obtained in the course of the audit, we have notidentified material misstatements in:
• the strategic report or the directors’ report; or
• the information about internal control and risk managementsystems in relation to financial reporting processes and aboutshare capital structures, given in compliance with rules 7.2.5and 7.2.6 of the FCA Rules.
We have nothing to report in respect of the following matters inrelation to which the Companies Act 2006 requires us to reportto you if, in our opinion:
• adequate accounting records have not been kept by thecompany, or returns adequate for our audit have not beenreceived from branches not visited by us; or
• the company financial statements and the part of the directors’remuneration report to be audited are not in agreement withthe accounting records and returns; or
• certain disclosures of directors’ remuneration specified by laware not made; or

City of London Investment Group Annual Report 2016/2017 63
OverviewCorporate governance
Financial statements
Shareholder information
Strategic report
• we have not received all the information and explanations werequire for our audit; or a corporate governance statement hasnot been prepared by the company.
Responsibilities of directorsAs explained more fully in the directors’ responsibilities statementset out on page 59, the directors are responsible for the preparationof the financial statements and for being satisfied that they give atrue and fair view, and for such internal control as the directorsdetermine is necessary to enable the preparation of financialstatements that are free from material misstatement, whether dueto fraud or error.
In preparing the financial statements, the directors are responsiblefor assessing the group’s and the parent company’s ability tocontinue as a going concern, disclosing, as applicable, mattersrelated to going concern and using the going concern basis ofaccounting unless the directors either intend to liquidate the groupor the company or to cease operations, or have no realisticalternative but to do so.
Auditor’s responsibilities for the audit of the financial statementsOur objectives are to obtain reasonable assurance about whetherthe financial statements as a whole are free from materialmisstatement, whether due to fraud or error, and to issue anauditor’s report that includes our opinion. Reasonable assurance isa high level of assurance, but is not a guarantee that an auditconducted in accordance with ISAs (UK) will always detect amaterial misstatement when it exists. Misstatements can arise fromfraud or error and are considered material if, individually or in theaggregate, they could reasonably be expected to influence theeconomic decisions of users taken on the basis of these financialstatements. There is an increased risk of material misstatementresulting from fraud than there is for those due to error. This is as aresult of the potential for collusion, misrepresentations, deliberateomissions or the override of internal controls as a result of fraud.This may also impact any area of law or regulation rather thandirectly on the financial statements.
A further description of our responsibilities for the audit ofthe consolidated financial statements is located on theFinancial Reporting Councils website at:www.frc.org.uk/auditorsresponsibilities. This descriptionforms part of our auditor’s report.
Other matters which we are required to addressFollowing the recommendation of the audit committee, we wereappointed by the Directors on 6th July 2015 to audit the financialstatements for the year ending 30th June 2016 and subsequentfinancial periods.
The period of total uninterrupted engagement is 13 years,covering the years ending 31st May 2005 to 30th June 2017.
The non-audit services prohibited by the FRC’s Ethical Standardwere not provided to the group or the parent company and weremain independent of the group and the parent company inconducting our audit.
Our audit opinion is consistent with the additional report to theaudit committee.
Lorraine Bay, (Senior Statutory Auditor)For and on behalf of Moore Stephens LLP, Statutory Auditor150 Aldersgate Street LondonEC1A 4AB15th September 2017

CONSOLIDATED INCOME STATEMENTFOR THE YEAR ENDED 30TH JUNE 2017
Year to Year to30th June 2017 30th June 2016
Note £ £
RevenueGross fee income 4 31,294,370 24,412,826Commissions payable (1,444,787) (1,514,707)Custody fees payable (880,840) (735,200)
Net fee income 28,968,743 22,162,919
Administrative expensesStaff costs 5(b) 13,153,914 10,606,490Other administrative expenses 4,074,975 3,631,993Depreciation and amortisation 230,635 168,298
(17,459,524) (14,406,781)
Operating profit 7 11,509,219 7,756,138Interest receivable and similar gains 8 81,135 212,595
Profit before taxation 11,590,354 7,968,733Income tax expense 9 (2,449,217) (2,115,404)
Profit for the period 9,141,137 5,853,329
Profit attributable to: Non-controlling interests (148,618) 61,975Equity shareholders of the parent 9,289,755 5,791,354
Basic earnings per share 10 36.9p 23.3p
Diluted earnings per share 10 36.7p 23.1p
CONSOLIDATED AND COMPANY STATEMENTOF COMPREHENSIVE INCOMEFOR THE YEAR ENDED 30TH JUNE 2017
Group Company
Year to Year to Year to Year to30th June 2017 30th June 2016 30th June 2017 30th June 2016
£ £ £ £
Profit for the period 9,141,137 5,853,329 8,629,630 9,395,022
Items which may be reclassified through the profit or loss:Fair value gains/(losses) on available-for-sale investments* 158,597 (542) 158,227 (869)Release of fair value gains on disposal ofavailable-for-sale investments* (253) – (253) –Foreign exchange gains on non-monetary assets 33,732 83,058 – –
Other comprehensive income/(loss) 192,076 82,516 157,974 (869)
Total comprehensive income for the period 9,333,213 5,935,845 8,787,604 9,394,153
Attributable to:Equity shareholders of the parent 9,481,831 5,873,870 8,787,604 9,394,153Non-controlling interests (148,618) 61,975 – –
*Net of deferred tax, detailed in note 19.
64 City of London Investment Group Annual Report 2016/2017
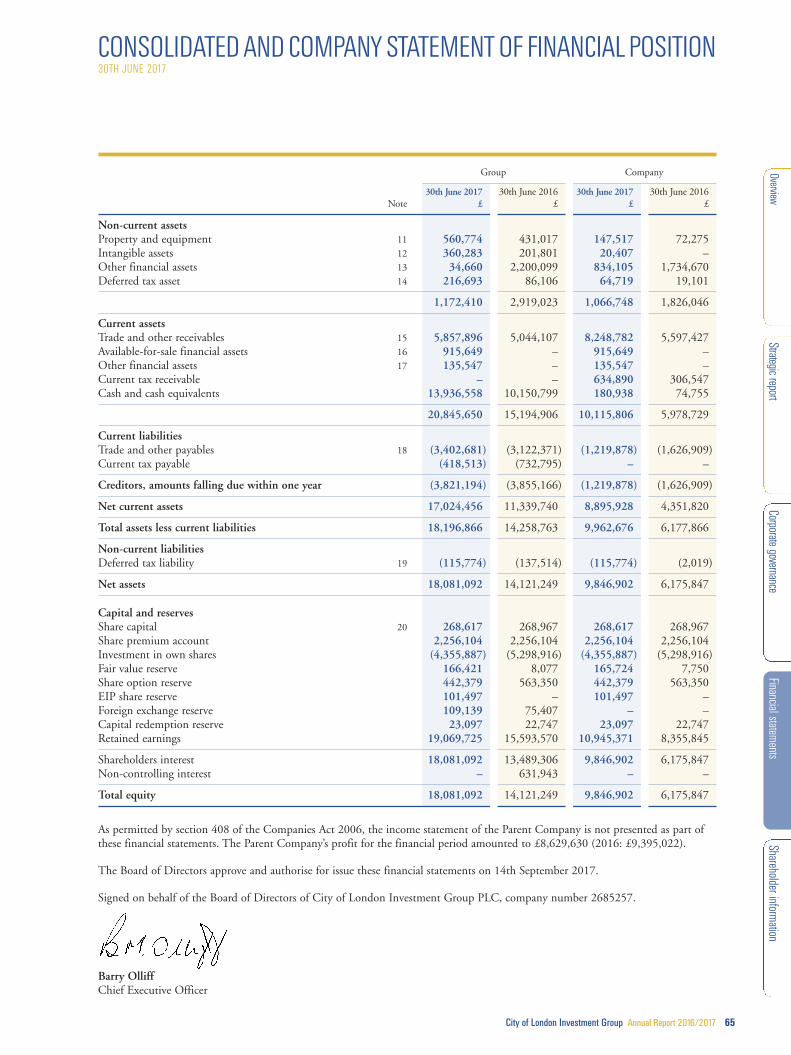
CONSOLIDATED AND COMPANY STATEMENT OF FINANCIAL POSITION30TH JUNE 2017
City of London Investment Group Annual Report 2016/2017 65
Group Company
30th June 2017 30th June 2016 30th June 2017 30th June 2016Note £ £ £ £
Non-current assetsProperty and equipment 11 560,774 431,017 147,517 72,275Intangible assets 12 360,283 201,801 20,407 –Other financial assets 13 34,660 2,200,099 834,105 1,734,670Deferred tax asset 14 216,693 86,106 64,719 19,101
1,172,410 2,919,023 1,066,748 1,826,046
Current assetsTrade and other receivables 15 5,857,896 5,044,107 8,248,782 5,597,427Available-for-sale financial assets 16 915,649 – 915,649 –Other financial assets 17 135,547 – 135,547 –Current tax receivable – – 634,890 306,547Cash and cash equivalents 13,936,558 10,150,799 180,938 74,755
20,845,650 15,194,906 10,115,806 5,978,729
Current liabilitiesTrade and other payables 18 (3,402,681) (3,122,371) (1,219,878) (1,626,909)Current tax payable (418,513) (732,795) – –
Creditors, amounts falling due within one year (3,821,194) (3,855,166) (1,219,878) (1,626,909)
Net current assets 17,024,456 11,339,740 8,895,928 4,351,820
Total assets less current liabilities 18,196,866 14,258,763 9,962,676 6,177,866
Non-current liabilitiesDeferred tax liability 19 (115,774) (137,514) (115,774) (2,019)
Net assets 18,081,092 14,121,249 9,846,902 6,175,847
Capital and reservesShare capital 20 268,617 268,967 268,617 268,967Share premium account 2,256,104 2,256,104 2,256,104 2,256,104Investment in own shares (4,355,887) (5,298,916) (4,355,887) (5,298,916)Fair value reserve 166,421 8,077 165,724 7,750Share option reserve 442,379 563,350 442,379 563,350EIP share reserve 101,497 – 101,497 –Foreign exchange reserve 109,139 75,407 – –Capital redemption reserve 23,097 22,747 23,097 22,747Retained earnings 19,069,725 15,593,570 10,945,371 8,355,845
Shareholders interest 18,081,092 13,489,306 9,846,902 6,175,847Non-controlling interest – 631,943 – –
Total equity 18,081,092 14,121,249 9,846,902 6,175,847
As permitted by section 408 of the Companies Act 2006, the income statement of the Parent Company is not presented as part ofthese financial statements. The Parent Company’s profit for the financial period amounted to £8,629,630 (2016: £9,395,022).
The Board of Directors approve and authorise for issue these financial statements on 14th September 2017.
Signed on behalf of the Board of Directors of City of London Investment Group PLC, company number 2685257.
Barry OlliffChief Executive Officer
OverviewCorporate governance
Financial statements
Shareholder information
Strategic report

CONSOLIDATED STATEMENT OF CHANGES IN EQUITY30TH JUNE 2017
Total Share Investment Share EIP Foreign Capital attributable Non-
Share premium in own Fair value option share exchange redemption Retained to controllingcapital account shares reserve reserve reserve reserve reserve earnings shareholders interest Total
£ £ £ £ £ £ £ £ £ £ £ £
At 1st July 2015 269,123 2,117,888 (5,692,430) 8,619 807,106 – (7,651) 21,597 16,127,877 13,652,129 595,387 14,247,516
Profit for the period – – – – – – – – 5,791,354 5,791,354 61,975 5,853,329Comprehensive income – – – (542) – – 83,058 – – 82,516 – 82,516
Total comprehensive income – – – (542) – – 83,058 – 5,791,354 5,873,870 61,975 5,935,845
Transactions with ownersForex movement onNCI investment – – – – – – – – – – (25,419) (25,419)Share option exercise 994 138,216 393,514 – (74,059) – – – 74,059 532,724 – 532,724Share cancellation (1,150) – – – – – – 1,150 (375,502) (375,502) – (375,502)Share-based payment – – – – 16,868 – – – – 16,868 – 16,868Deferred tax – – – – (186,565) – – – (129,958) (316,523) – (316,523)Current tax on share options – – – – – – – – 87,461 87,461 – 87,461Dividends paid – – – – – – – – (5,981,721) (5,981,721) – (5,981,721)
Total transactions with owners (156) 138,216 393,514 – (243,756) – – 1,150 (6,325,661) (6,036,693) (25,419) (6,062,112)
At 30th June 2016 268,967 2,256,104 (5,298,916) 8,077 563,350 – 75,407 22,747 15,593,570 13,489,306 631,943 14,121,249
Profit for the period – – – – – – – – 9,289,755 9,289,755 (148,618) 9,141,137Comprehensive income – – – 158,344 – – 33,732 – – 192,076 – 192,076
Total comprehensive income – – – 158,344 – – 33,732 – 9,289,755 9,481,831 (148,618) 9,333,213
Transactions with ownersDerecognisation ofNCI investment – – – – – – – – – – (483,325) (483,325)Share option exercise – – 1,132,727 – (147,464) – – – 147,464 1,132,727 – 1,132,727Purchase of own shares – – (189,698) – – – – – – (189,698) – (189,698)Share cancellation (350) – – – – – – 350 (128,007) (128,007) – (128,007)Share-based payment – – – – 26,493 – – – – 26,493 – 26,493EIP provision – – – – – 101,497 – – – 101,497 – 101,497Deferred tax – – – – – – – – 124,750 124,750 – 124,750Current tax on share options – – – – – – – – 90,158 90,158 – 90,158Dividends paid – – – – – – – – (6,047,965) (6,047,965) – (6,047,965)
Total transactions with owners (350) – 943,029 – (120,971) 101,497 – 350 (5,813,600) (4,890,045) (483,325) (5,373,370)
At 30th June 2017 268,617 2,256,104 (4,355,887) 166,421 442,379 101,497 109,139 23,097 19,069,725 18,081,092 – 18,081,092
66 City of London Investment Group Annual Report 2016/2017

COMPANY STATEMENT OF CHANGES IN EQUITY30TH JUNE 2017
City of London Investment Group Annual Report 2016/2017 67
Total Share Investment Share EIP Capital attributable
Share premium in own Fair value option share redemption Retained tocapital account shares reserve reserve reserve reserve earnings shareholders
£ £ £ £ £ £ £ £ £
At 1st July 2015 269,123 2,117,888 (5,692,430) 8,619 620,541 – 21,597 5,319,645 2,664,983
Profit for the period – – – – – – – 9,395,022 9,395,022Comprehensive income – – – (869) – – – – (869)
Total comprehensive income – – – (869) – – – 9,395,022 9,394,153
Transactions with ownersShare option exercise 994 138,216 393,514 – (74,059) – – 18,133 476,798Share cancellation (1,150) – – – – – 1,150 (375,502) (375,502)Share-based payment – – – – 16,868 – – – 16,868Deferred tax – – – – – – – (22,848) (22,848)Current tax on share options – – – – – – – 3,116 3,116Dividends paid – – – – – – – (5,981,721) (5,981,721)
Total transactions with owners (156) 138,216 393,514 – (57,191) – 1,150 (6,358,822) (5,883,289)
At 30th June 2016 268,967 2,256,104 (5,298,916) 7,750 563,350 – 22,747 8,355,845 6,175,847
Profit for the period – – – – – – – 8,629,630 8,629,630Comprehensive income – – – 157,974 – – – – 157,974
Total comprehensive income – – – 157,974 – – – 8,629,630 8,787,604
Transactions with ownersShare option exercise – – 1,132,727 – (147,464) – – 69,349 1,054,612Purchase of own shares – – (189,698) – – – – – (189,698)Share cancellation (350) – – – – – 350 (128,007) (128,007)Share-based payment – – – – 26,493 – – – 26,493EIP provision – – – – – 101,497 – – 101,497Deferred tax – – – – – – – 41,603 41,603Current tax on share options – – – – – – – 24,916 24,916Dividends paid – – – – – – – (6,047,965) (6,047,965)
Total transactions with owners (350) – 943,029 – (120,971) 101,497 350 (6,040,104) (5,116,549)
At 30th June 2017 268,617 2,256,104 (4,355,887) 165,724 442,379 101,497 23,097 10,945,371 9,846,902
OverviewCorporate governance
Financial statements
Shareholder information
Strategic report

CONSOLIDATED AND COMPANY CASH FLOW STATEMENTFOR THE YEAR ENDED 30TH JUNE 2017
Group Company
30th June 2017 30th June 2016 30th June 2017 30th June 2016Note £ £ £ £
Cash flow from operating activitiesOperating profit 11,509,219 7,756,138 217,567 154,546Adjustments for:Profit/(loss) on disposal of assets 202 (515) 202 185Depreciation charges 167,748 118,742 57,492 42,943Amortisation of intangible assets 62,886 49,556 2,915 –Share-based payment charge 26,493 16,868 21,134 36,374EIP charge 101,497 – 50,114 –Fair value gain/(loss) on investments 35,367 – – –Translation adjustments (57,966) (243,072) 44,963 (8,903)Cash generated from operations before changesin working capital 11,845,446 7,697,717 394,387 225,145Increase in trade and other receivables (813,789) (534,923) (2,651,355) (3,662,351)Increase/(decrease) in trade and other payables 280,310 512,427 (407,031) 24,962Cash generated from/(used in) operations 11,311,967 7,675,221 (2,663,999) (3,412,244)Interest received 28,925 40,195 76 74Interest paid (64,064) – – –Taxation paid (2,764,001) (2,094,937) (461,085) (22,012)
Net cash generated from/(used in) operating activities 8,512,827 5,620,479 (3,125,008) (3,434,182)
Cash flow from investing activitiesDividends received from subsidiaries – – 7,700,000 9,269,000Purchase of property and equipment and intangibles (485,345) (139,164) (156,258) (26,760)Proceeds from sale of property and equipment – 2,047 – –Purchase of non-current financial assets (768) – (768) –Proceeds from sale of non-current financial assets 2,538 23,098 2,538 310Proceeds from sale of subsidiary 1,073,438 – 1,073,438 –Purchase of current financial assets (155,963) – (155,963) –Proceeds from sale of current financial assets – – – –
Net cash generated from/(used in) investing activities 433,900 (114,019) 8,462,987 9,242,550
Cash flow from financing activitiesProceeds from issue of ordinary shares – 139,210 – 139,210Ordinary dividends paid 21 (6,047,965) (5,981,721) (6,047,965) (5,981,721)Purchase and cancellation of own shares (128,007) (375,502) (128,007) (375,502)Purchase of own shares by employee share option trust (189,698) – (189,698) –Proceeds from sale of own shares by employeeshare option trust 1,132,727 393,514 1,132,727 393,514
Net cash used in financing activities (5,232,943) (5,824,499) (5,232,943) (5,824,499)
Net increase/(decrease) in cash and cash equivalents 3,713,784 (318,039) 105,036 (16,131)Cash and cash equivalents at start of period 10,150,799 10,226,705 74,755 82,804Effect of exchange rate changes 71,975 242,133 1,147 8,082
Cash and cash equivalents at end of period 13,936,558 10,150,799 180,938 74,755
68 City of London Investment Group Annual Report 2016/2017

NOTES TO THE FINANCIAL STATEMENTSFOR THE YEAR ENDED 30TH JUNE 2017
City of London Investment Group Annual Report 2016/2017 69
City of London Investment Group PLC (“the Company”) is a public limited company which listed on the London StockExchange on 29th October 2010 and is domiciled and incorporated in the United Kingdom under the Companies Act 2006.
1 BASIS OF PREPARATION
The financial statements have been prepared in accordance with International Financial Reporting Standards (IFRS) as adopted bythe European Union (“EU”) and with those parts of the Companies Act 2006 applicable to companies reporting under IFRS.
The Group financial statements have been prepared under the historical cost convention, except for certain financial assets held bythe Group that are reported at fair value. The Group and Company financial statements have been prepared on a going concern basis.
New IFRS Standards and InterpretationsAs at 30th June 2017, the following Standards and Interpretations as adopted by the EU, which are relevant to the Group, were inissue but not yet effective.
IFRS 9 replaces the classification and measurement models for financial instruments in IAS 39 with three classification categories:amortised cost, fair value through profit or loss and fair value through other comprehensive income. The Group’s business modeland the contractual cash flows arising from its investments in financial instruments determine the classification. Equity instrumentswill be recorded at fair value, with gains or losses reported either in the income statement or through equity. However, where fairvalue gains and losses are recorded through equity there will no longer be a requirement to transfer gains or losses to the Incomestatement on impairment or disposal.
IFRS 9 also introduces an expected loss model for the assessment of impairment. The current incurred loss model (under IAS 39)requires the Group to recognise impairment losses when there is objective evidence that an asset is impaired; under the expected lossmodel, impairment losses are recorded if there is an expectation of credit losses, even in the absence of a default event. This standardis currently expected to become effective in 2018.
IFRS 15 deals with revenue recognition and establishes principles for reporting useful information to users of financial statementsabout the nature, amount, timing and uncertainty of revenue and cash flows arising from an entity’s contracts with customers.Revenue is recognised when a customer obtains control of goods or service and thus has the ability to direct the use and obtain thebenefits from the goods or service. The Standard replaces IAS 18 ‘Revenue’ and IAS 11 ‘Construction contracts’ and relatedinterpretations. The Standard is expected to become effective for annual periods beginning on or after 1st January 2018 and earlierapplication is permitted.
The following Standards and Interpretations, which are relevant to the Group, were in issue but subject to EU endorsement:
IFRS 16 requires a lessee to recognise lease assets and liabilities, currently accounted for as operating leases, on the statement offinancial position and recognise amortisation of the lease assets and interest on the lease liabilities over the term of the lease.This Standard is currently expected to become effective in 2019.
The Group is assessing the impact of the above Standards on its future financial statements. In relation to IFRS 16, the majority ofthe Group’s leases will expire before the Standard is effective and therefore it is not possible at this time to assess the extent of theStandard’s impact in the year of adoption.
Accounting estimates and assumptionsThe preparation of these financial statements in conformity with IFRS requires management to make estimates and assumptionsthat affect the application of policies and reported amounts of assets and liabilities, income and expenses. Whilst estimates are basedon management’s best knowledge and judgement using information and financial data available to them, the actual outcome maydiffer from those estimates.
The most significant area of the financial statements that are subject to the use of estimates and assumptions are noted below:
Share-based paymentsIn order to calculate the charge for share-based compensation as required by IFRS 2, the Group makes estimates principally relatingto the assumptions used in its option pricing model. Further details of this can be found in note 23.
OverviewCorporate governance
Financial statements
Shareholder information
Strategic report

NOTES TO THE FINANCIAL STATEMENTSCONTINUED
2 BASIS OF CONSOLIDATION
These financial statements consolidate the financial statements of the Company and all of its subsidiary undertakings.The Group’s subsidiaries are those entities which it directly or indirectly controls. Control over an entity is evidenced by theGroup’s ability to exercise its power in order to affect any variable returns that the Group is exposed to through itsinvolvement with the entity.
When assessing whether to consolidate an entity, the Group evaluates a range of control factors as defined under IFRS 10, namely:
• the purpose and design of the entity
• the relevant activities and how these are determined
• whether the Group’s rights result in the ability to direct the relevant activities
• whether the Group has exposure or rights to variable returns
• whether the Group has the ability to use its power to affect the amount of its returns
Subsidiaries are consolidated from the date on which control is transferred to the Group and are deconsolidated from the datethat control ceases.
During the year the Group liquidated the World Markets Umbrella Global Equity Fund resulting in a realised gain of £185,329.In addition, the Group received a significant tactical investment from an EM client in its International Equity CEF Fund. Thisreduced the Company’s holding to 13% at which point the entity was deconsolidated, which resulted in an unrealised gain of£98,166. These gains were reported through the income statement under interest receivable and similar gains.
Subsequent to the year-end the client liquidated this tactical holding in the International Equity CEF Fund to invest in anotherof the Group’s funds.
The Group’s subsidiary undertakings as at 30th June 2017 are detailed below:
Country ofincorporation /
Controlling principal placeSubsidiary undertakings Activity interest of business
City of London Investment Management Company Limited Management of funds 100% UKCity of London US Investments Limited Holding company 100% UK
City of London Investment Management Company Limited holds 100% of the ordinary shares in the following:
City of London Investment Management (Singapore) PTE Ltd Management of funds SingaporeCity of London Latin America Limited Dormant company UK
City of London US Investments Limited holds 100% of the ordinary shares in the following:
City of London US Services Limited Service company UK
The registered address of all the UK Incorporated companies is 77, Gracechurch Street, London EC3V 0AS. The registered addressof City of London Investment Management Company (Singapore) PTE Ltd is 20 Collyer Quay, #10-04, Singapore 049319.
City of London Latin America Limited is dormant and as such is not subject to audit.
The consolidated financial statements are prepared on the historical cost basis except for the revaluation of certain financialinstruments as outlined in note 3 (iii).
70 City of London Investment Group Annual Report 2016/2017
City of London Investment Group Annual Report 2016/2017 71
3 SIGNIFICANT ACCOUNTING POLICIES
The principal accounting policies adopted are set out below and have, unless otherwise stated, been applied consistently to allperiods presented in these financial statements. In addition, where presentational changes are made in the current period, the prioryear figures are also updated to present a true comparative.
(i) Property and equipmentFor all property and equipment depreciation is calculated to write off their cost to their estimated residual values by equal annualinstalments over the period of their estimated useful lives, which are considered to be:
Short leasehold property improvements – over the remaining life of the leaseFurniture and equipment – four yearsComputer and telephone equipment – four years
(ii) Intangible assetsIntangible assets are capitalised at cost and amortised on a straight line basis over the estimated useful life of the asset. The Group’sonly intangible assets are computer software licences, which are capitalised on the basis of the costs incurred to acquire and bringinto use the specific software. Costs include directly attributable overheads.
The estimated useful lives range from 4 to 10 years.
The assets are reviewed for impairment each year.
Software integral to a related item of hardware equipment is accounted for as property, plant and equipment.
Costs associated with maintaining computer software programs are recognised as an expense when they are incurred.
(iii) Financial instrumentsUnder IAS 39, “Financial Instruments: Recognition and Measurement”, financial assets must be classified as either:
• Loans and receivables• Held-to-maturity investments• Available-for-sale financial assets• At fair value through profit or loss
Financial liabilities must be classified at fair value through profit or loss or at amortised cost.
Except where investments in funds are identified as subsidiaries, the Group’s investments in the funds that it manages are designatedas available-for-sale financial assets. Such investments are initially recognised at fair value, being the consideration given togetherwith any acquisition costs associated with the investment. They are subsequently carried at fair value, with any gains or losses arisingfrom changes in fair value included as part of other comprehensive income. Fair value is determined using the price based on the netasset value of the fund. Investments are derecognised when the rights to receive cash flows from the investments have expired or havebeen transferred and the Group has transferred all risks and rewards of ownership. When derecognition occurs a realised profit orloss is recognised in the income statement, calculated as the difference between the net sales proceeds and the original cost of thefinancial asset. Any fair value gains or losses previously recognised as part of other comprehensive income are recycled into theincome statement as part of this calculation of the profit or loss arising on derecognition.
The Group assesses at each reporting date whether there is objective evidence that an investment or a group of investments isimpaired. In the case of an investment classified as available-for-sale, a significant or prolonged decline in the fair value of theinvestment below its cost is considered as an indicator that the investment is impaired. If any such evidence exists for available-for-sale investments, the cumulative loss – measured as the difference between the acquisition cost and the current fair value, less anyimpairment loss on that investment previously recognised in the income statement – is removed from other comprehensive incomeand recognised in the income statement.
OverviewCorporate governance
Financial statements
Shareholder information
Strategic report
NOTES TO THE FINANCIAL STATEMENTSCONTINUED
3 SIGNIFICANT ACCOUNTING POLICIES CONTINUED
The Group’s investments in securities and derivatives are classified as financial assets or liabilities at fair value through profit or loss.Such investments are initially recognised at fair value, and are subsequently remeasured at fair value, with any movement recognisedin the income statement. The fair value of the derivatives held by the Group is determined as follows:
Shares – priced using the quoted market mid price* Options – priced using the quoted market bid priceForward currency trades – priced using the forward exchange bid rates from Bloomberg
*The funds managed by the Group are valued at the mid price in accordance with US GAAP. Therefore, where the Group has identified investments in thosefunds as subsidiaries, the fair value consolidated is the net asset values as provided by the administrator of the funds. The underlying investments in these fundsare predominantly in blue chip companies and as such are very tradable with a small bid-ask spread.
The Group’s investments have been classified here for recognition and measurement purposes under IAS39 but are not necessarilyreported in the statement of financial position under those headings. A table showing how they are reported is shown in note 25.
(iv) Trade receivablesTrade receivables are measured on initial recognition at fair value, and are subsequently carried at the lower of original fair valueand their recoverable amount. Appropriate allowances for estimated irrecoverable amounts are recognised in the income statementwhen there is objective evidence that the asset is impaired.
(v) Cash and cash equivalentsCash and cash equivalents comprise cash on hand and demand deposits with an original maturity of three months or less frominception, and other short-term highly liquid investments that are readily convertible to a known amount of cash and are subjectto an insignificant risk of changes in value.
(vi) Trade payablesTrade payables are measured at initial recognition at fair value and subsequently measured at amortised cost.
(vii) Current and deferred taxationThe Group provides for current tax according to the tax regulations in each jurisdiction in which it operates, using tax rates thathave been enacted or substantively enacted by the reporting date.
Deferred tax is provided using the balance sheet liability method, providing for temporary differences between the carrying amountsof assets and liabilities for financial reporting purposes and the amounts used for tax purposes. However, deferred tax is notaccounted for if it arises from goodwill or the initial recognition (other than in a business combination) of other assets or liabilitiesin a transaction that affects neither the accounting nor the taxable profit or loss.
Deferred tax liabilities are generally recognised for all taxable temporary differences and deferred tax assets are recognised to theextent that it is probable that taxable profits will be available against which deductible temporary differences can be utilised.
The carrying amount of deferred tax assets is reviewed at the end of each reporting period and reduced to the extent that it is nolonger probable that sufficient taxable profits will be available to allow all or part of the asset to be recovered.
Deferred tax is calculated at the tax rates that are expected to apply in the period when the liability is settled or the asset realised.The tax rates used are those that have been enacted, or substantively enacted, by the end of the reporting period. Deferred taxis charged or credited to the income statement, except when it relates to items charged or credited directly as part of othercomprehensive income, in which case the deferred tax is also dealt with as part of other comprehensive income. For share-basedpayments, where the estimated future tax deduction exceeds the amount of the related cumulative remuneration expense, theexcess deferred tax is recognised directly in equity.
72 City of London Investment Group Annual Report 2016/2017

City of London Investment Group Annual Report 2016/2017 73
3 SIGNIFICANT ACCOUNTING POLICIES CONTINUED
(viii) Share-based paymentsThe Company operates an Employee Incentive Plan (EIP) which is open to all employees in the Group. Awards are made toparticipating employees over shares under the EIP where they have duly waived an element of their annual profit-share before therequired waiver date, in general before the start of the relevant financial year.
The Awards are made up of two elements: Deferred Shares and Bonus Shares. The Deferred Shares represent the waived profit share and the Bonus Shares represent the additional award made by the Company as a reward for participating in the EIP. Awardswill vest (i.e. no longer be forfeitable) over a three year period with one-third vesting each year.
The full cost of the Deferred Shares is recognised in the year to which the profit share relates. The value of the Bonus Shares isexpensed on a straight line basis over the period from the date the employees elect to participate to the date that the awards vest.This cost is estimated during the financial year and at the point when the actual award is made, the share-based payment charge is re-calculated and any difference is taken to the profit or loss.
Prior to the implementation of the EIP, the Company operated an Employee Share Option Plan. The fair value of the employeeservices received in exchange for share options is recognised as an expense. The fair value has been calculated using the Binomialpricing model, and has then been expensed on a straight line basis over the vesting period, based on the Company’s estimate of the number of shares that will actually vest. At the end of the three year period when the actual number of shares vesting is known,the share-based payment charge is re-calculated and any difference is taken to the profit or loss.
(ix) RevenueRevenue is recognised to the extent that it is probable that economic benefits will flow to the Group and such revenue can bereliably measured. Revenue is recognised as services are provided and comprises investment management fees based on a percentageof Funds under Management, in accordance with the underlying agreements.
(x) Commissions payableA portion of the Group’s revenue is subject to commissions payable under third party marketing agreements. Commissions payableare recognised in the same period as the revenue to which they relate.
(xi) Foreign currency translationForeign currency transactions are translated using the exchange rates prevailing at the transaction date. Monetary assets held in acurrency other than the functional currency are translated at the end of each financial period at the period end closing rates.
The functional currency of the Group’s main trading subsidiaries, City of London Investment Management Company Limited andCity of London US Services Limited, is US dollars. The functional currency of City of London Investment Group PLC (the“Company”) is sterling. The Group uses sterling as the presentation currency. Under IAS 21 this means that exchange differencescaused from translating the functional currency to presentational currency for the main trading subsidiaries would be recognised inequity. However, the Group operates a policy whereby the foreign exchange positions of the subsidiaries in relation to the incomestatement and monetary assets are sold to the Company. As such any exchange differences arising in the Company are “real” inthat the functional currency matches the presentational currency. This means that all such exchange differences are included in theincome statement and no split is required between other comprehensive income and the income statement. The subsidiariestranslate the non-monetary assets at the period end rate and any movement is reflected in other comprehensive income.
(xii) LeasesThe cost of operating leases is charged to the income statement in equal periodic instalments over the period of the leases.
(xiii) PensionsThe Group operates defined contribution pension schemes covering the majority of its employees. The costs of the pensionschemes are charged to the income statement as they are incurred. Any amounts unpaid at the end of the period are reflected inother creditors.
OverviewCorporate governance
Financial statements
Shareholder information
Strategic report

NOTES TO THE FINANCIAL STATEMENTSCONTINUED
74 City of London Investment Group Annual Report 2016/2017
4 SEGMENTAL ANALYSIS
The Directors consider that the Group has only one reportable segment, namely asset management, and hence only analysis bygeographical location is given.
EuropeUSA Canada UK (ex UK) Other Total
£ £ £ £ £ £
Year to 30th June 2017Gross fee income 28,893,685 983,509 463,821 953,355 – 31,294,370Non-current assets:Property and equipment 413,257 – 107,080 – 40,437 560,774Intangible assets 339,876 – 20,407 – – 360,283
Year to 30th June 2016Gross fee income 22,609,241 798,158 344,259 661,168 – 24,412,826Non-current assets:Property and equipment 358,742 – 63,715 – 8,560 431,017Intangible assets 201,801 – – – – 201,801
The Group has classified its fee income based on the domicile of its clients and non-current assets based on where the assets are held.Any individual client generating revenue of 10% or more would be disclosed separately, as would assets in a foreign country if theywere material.
5 EMPLOYEES
Year to Year to30th June 2017 30th June 2016
(a) Average number of persons employed by the Group in the period: Number Number
Investment Management/Research 26 27Performance and Attribution 5 5Business Development/Marketing 3 3Client Services 6 7Administration, Accounts and Settlements 32 30
72 72
Year to Year to30th June 2017 30th June 2016
(b) The aggregate employment costs of staff and Directors were: £ £
Wages and salaries 6,003,177 5,381,563Profit sharing payments 5,121,864 3,456,537Social security costs 865,389 676,488Defined contribution pension costs 681,923 615,617EIP charge 101,497 –Share options charge 26,493 16,868Other staff costs 353,571 459,417
13,153,914 10,606,490

City of London Investment Group Annual Report 2016/2017 75
6 DIRECTORS
Year to Year to30th June 2017 30th June 2016
Directors’ emoluments comprise: £ £
Emoluments (excluding pension contributions and awards under share option schemes) 2,691,013 1,960,422EIP participation 229,022 –Pension contributions 105,116 92,535Health insurance 14,581 12,848Share option charge 10,621 14,835Gains on exercise of share options 65,255 19,625
Year to Year to30th June 2017 30th June 2016
Number Number
Number of Directors on whose behalf pension contributions were paid during the period 4 5Number of Directors who exercised share options during the period 3 1
Year to Year to30th June 2017 30th June 2016
Highest paid Director’s remuneration: £ £
Emoluments (excluding pension contributions and awards under share option schemes) 999,108 729,306EIP participation – –Pension contributions 35,372 30,633Health insurance 4,199 3,747Share option charge – –Gains on exercise of share options – –
Note:– The regulations require us to disclose taxable benefits. Health insurance is offered to all employees but is not considered a taxable benefit in all countries.For comparative purposes we have based our calculations on all health insurance costs incurred, whether a taxable benefit or not.
Further details relating to Directors’ emoluments can be found in the Remuneration report on pages 48 to 58.
7 OPERATING PROFIT
Year to Year to30th June 2017 30th June 2016
The operating profit is arrived at after charging: £ £
Depreciation of owned assets 167,748 118,742Amortisation of intangible assets 62,886 49,556Auditors’ remuneration:– Statutory audit 75,319 75,160– Taxation services – –– Audit related assurance services 8,471 7,968– Other services – –Operating lease rentals:– Land and buildings 436,617 429,995– Other 1,886 81
OverviewCorporate governance
Financial statements
Shareholder information
Strategic report
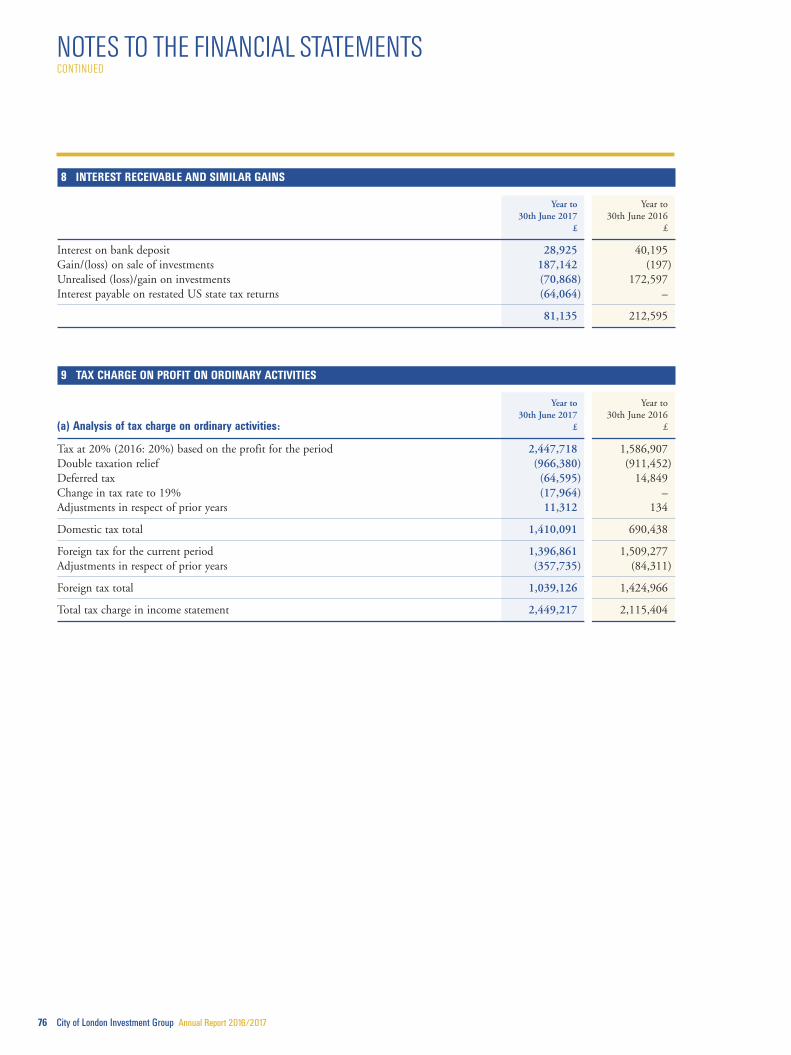
NOTES TO THE FINANCIAL STATEMENTSCONTINUED
8 INTEREST RECEIVABLE AND SIMILAR GAINS
Year to Year to30th June 2017 30th June 2016
£ £
Interest on bank deposit 28,925 40,195Gain/(loss) on sale of investments 187,142 (197)Unrealised (loss)/gain on investments (70,868) 172,597Interest payable on restated US state tax returns (64,064) –
81,135 212,595
9 TAX CHARGE ON PROFIT ON ORDINARY ACTIVITIES
Year to Year to30th June 2017 30th June 2016
(a) Analysis of tax charge on ordinary activities: £ £
Tax at 20% (2016: 20%) based on the profit for the period 2,447,718 1,586,907Double taxation relief (966,380) (911,452)Deferred tax (64,595) 14,849Change in tax rate to 19% (17,964) –Adjustments in respect of prior years 11,312 134
Domestic tax total 1,410,091 690,438
Foreign tax for the current period 1,396,861 1,509,277Adjustments in respect of prior years (357,735) (84,311)
Foreign tax total 1,039,126 1,424,966
Total tax charge in income statement 2,449,217 2,115,404
76 City of London Investment Group Annual Report 2016/2017
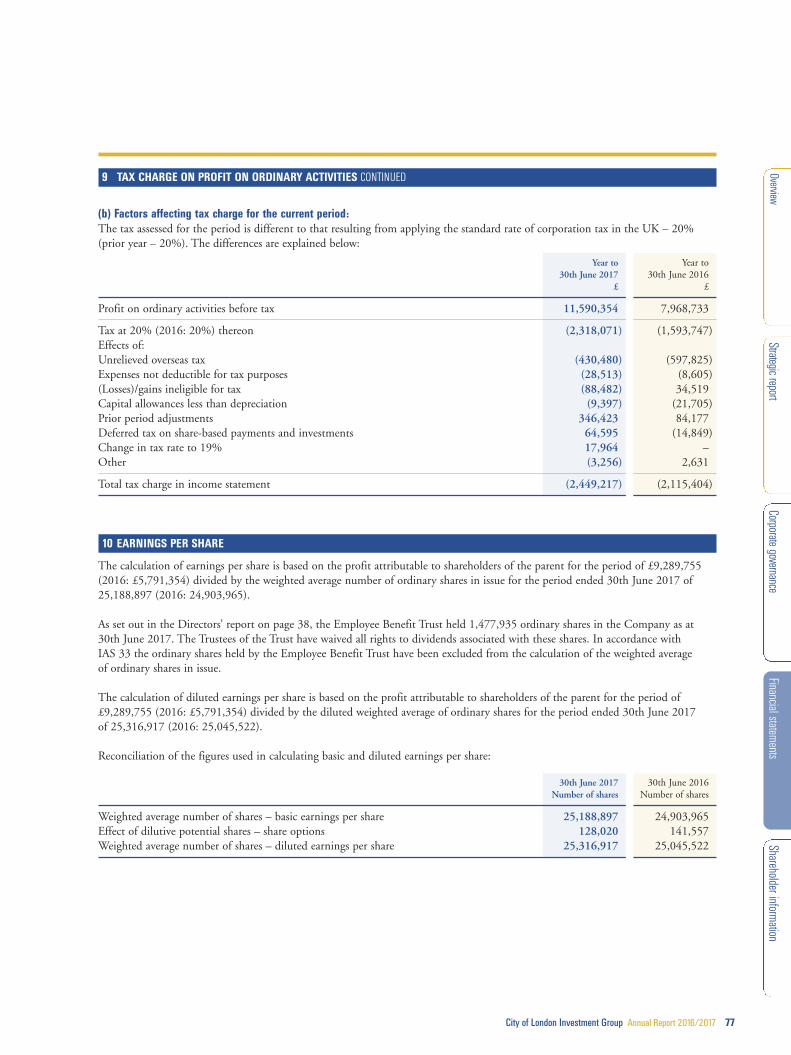
City of London Investment Group Annual Report 2016/2017 77
9 TAX CHARGE ON PROFIT ON ORDINARY ACTIVITIES CONTINUED
(b) Factors affecting tax charge for the current period:The tax assessed for the period is different to that resulting from applying the standard rate of corporation tax in the UK – 20%(prior year – 20%). The differences are explained below:
Year to Year to30th June 2017 30th June 2016
£ £
Profit on ordinary activities before tax 11,590,354 7,968,733
Tax at 20% (2016: 20%) thereon (2,318,071) (1,593,747)Effects of:Unrelieved overseas tax (430,480) (597,825)Expenses not deductible for tax purposes (28,513) (8,605)(Losses)/gains ineligible for tax (88,482) 34,519Capital allowances less than depreciation (9,397) (21,705)Prior period adjustments 346,423 84,177Deferred tax on share-based payments and investments 64,595 (14,849)Change in tax rate to 19% 17,964 –Other (3,256) 2,631
Total tax charge in income statement (2,449,217) (2,115,404)
10 EARNINGS PER SHARE
The calculation of earnings per share is based on the profit attributable to shareholders of the parent for the period of £9,289,755(2016: £5,791,354) divided by the weighted average number of ordinary shares in issue for the period ended 30th June 2017 of25,188,897 (2016: 24,903,965).
As set out in the Directors’ report on page 38, the Employee Benefit Trust held 1,477,935 ordinary shares in the Company as at30th June 2017. The Trustees of the Trust have waived all rights to dividends associated with these shares. In accordance withIAS 33 the ordinary shares held by the Employee Benefit Trust have been excluded from the calculation of the weighted averageof ordinary shares in issue.
The calculation of diluted earnings per share is based on the profit attributable to shareholders of the parent for the period of£9,289,755 (2016: £5,791,354) divided by the diluted weighted average of ordinary shares for the period ended 30th June 2017of 25,316,917 (2016: 25,045,522).
Reconciliation of the figures used in calculating basic and diluted earnings per share:
30th June 2017 30th June 2016Number of shares Number of shares
Weighted average number of shares – basic earnings per share 25,188,897 24,903,965Effect of dilutive potential shares – share options 128,020 141,557Weighted average number of shares – diluted earnings per share 25,316,917 25,045,522
OverviewCorporate governance
Financial statements
Shareholder information
Strategic report
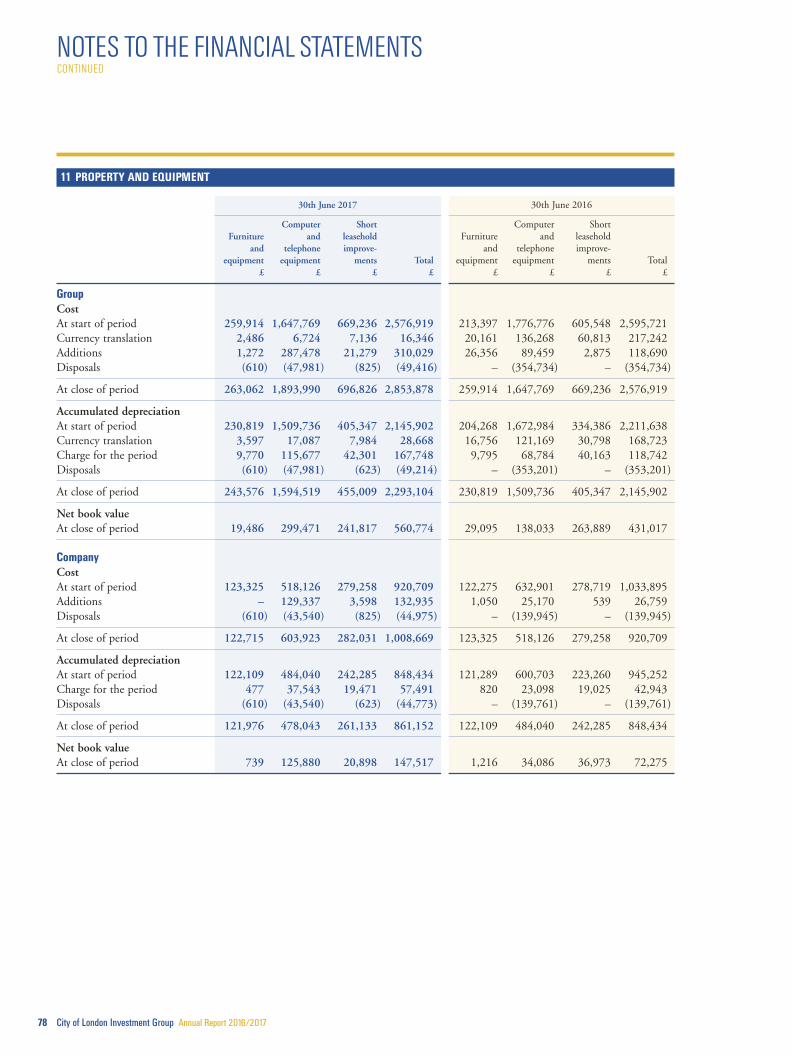
NOTES TO THE FINANCIAL STATEMENTSCONTINUED
11 PROPERTY AND EQUIPMENT
30th June 2017 30th June 2016
Computer Short Computer ShortFurniture and leasehold Furniture and leasehold
and telephone improve- and telephone improve-equipment equipment ments Total equipment equipment ments Total
£ £ £ £ £ £ £ £
GroupCostAt start of period 259,914 1,647,769 669,236 2,576,919 213,397 1,776,776 605,548 2,595,721Currency translation 2,486 6,724 7,136 16,346 20,161 136,268 60,813 217,242Additions 1,272 287,478 21,279 310,029 26,356 89,459 2,875 118,690Disposals (610) (47,981) (825) (49,416) – (354,734) – (354,734)
At close of period 263,062 1,893,990 696,826 2,853,878 259,914 1,647,769 669,236 2,576,919
Accumulated depreciationAt start of period 230,819 1,509,736 405,347 2,145,902 204,268 1,672,984 334,386 2,211,638Currency translation 3,597 17,087 7,984 28,668 16,756 121,169 30,798 168,723Charge for the period 9,770 115,677 42,301 167,748 9,795 68,784 40,163 118,742Disposals (610) (47,981) (623) (49,214) – (353,201) – (353,201)
At close of period 243,576 1,594,519 455,009 2,293,104 230,819 1,509,736 405,347 2,145,902
Net book valueAt close of period 19,486 299,471 241,817 560,774 29,095 138,033 263,889 431,017
CompanyCostAt start of period 123,325 518,126 279,258 920,709 122,275 632,901 278,719 1,033,895Additions – 129,337 3,598 132,935 1,050 25,170 539 26,759Disposals (610) (43,540) (825) (44,975) – (139,945) – (139,945)
At close of period 122,715 603,923 282,031 1,008,669 123,325 518,126 279,258 920,709
Accumulated depreciationAt start of period 122,109 484,040 242,285 848,434 121,289 600,703 223,260 945,252Charge for the period 477 37,543 19,471 57,491 820 23,098 19,025 42,943Disposals (610) (43,540) (623) (44,773) – (139,761) – (139,761)
At close of period 121,976 478,043 261,133 861,152 122,109 484,040 242,285 848,434
Net book valueAt close of period 739 125,880 20,898 147,517 1,216 34,086 36,973 72,275
78 City of London Investment Group Annual Report 2016/2017

City of London Investment Group Annual Report 2016/2017 79
12 INTANGIBLE ASSETS
30th June 2017 30th June 2016Long-term Long-term
software licences software licences£ £
GroupCostAt start of period 512,511 413,354Currency translation 6,539 78,682Additions 175,315 20,475
At close of period 694,365 512,511
Amortisation chargeAt start of period 310,710 217,011Currency translation (39,514) 44,143Charge for the period 62,886 49,556
At close of period 334,082 310,710
Net book valueAt close of period 360,283 201,801
CompanyCostAt start of period – –Additions 23,322 –
At close of period 23,322 –
Amortisation chargeAt start of period – –Charge for the period 2,915 –
At close of period 2,915 –
Net book valueAt close of period 20,407 –
13 OTHER FINANCIAL ASSETS (NON-CURRENT)
30th June 2017 30th June 2016Unlisted Unlisted
investments investmentsGroup £ £
CostAt start of period 2,200,099 2,075,954Additions 768 –Disposals (1,464,896) (531)Fair value (losses)/gains (701,311) 124,676
At close of period 34,660 2,200,099
OverviewCorporate governance
Financial statements
Shareholder information
Strategic report

NOTES TO THE FINANCIAL STATEMENTSCONTINUED
13 OTHER FINANCIAL ASSETS (NON-CURRENT) CONTINUED
30th June 2017 30th June 2016
Investment in Investment inUnlisted subsidiary Unlisted subsidiary
investments undertakings Total investments undertakings TotalCompany £ £ £ £ £ £
CostAt start of period 27,454 1,707,216 1,734,670 26,147 1,784,645 1,810,792Additions 768 95,262 96,030 – 65,477 65,477Disposals (722) (1,001,567) (1,002,289) (531) (140,909) (141,440)Fair value gains recognised in othercomprehensive income 5,694 – 5,694 1,838 – 1,838Other movements – – – – (1,997) (1,997)
At close of period 33,194 800,911 834,105 27,454 1,707,216 1,734,670
The additions and disposals under investments in subsidiary undertakings include the allocation of share-based payments from theCompany to its subsidiaries under IFRS 2.
All Group companies are listed in note 2.
14 DEFERRED TAX ASSET
Share-based payments
Group Company£ £
At 30th June 2015 395,354 34,674
Credit to income 7,275 7,275Credit to equity (316,523) (22,848)
At 30th June 2016 86,106 19,101
Credit to income 5,837 4,015Credit to equity 124,750 41,603
At 30th June 2017 216,693 64,719
15 TRADE AND OTHER RECEIVABLES
Group Company
30th June 2017 30th June 2016 30th June 2017 30th June 2016£ £ £ £
Trade receivables 66,634 162,547 – –Accrued income 4,814,229 4,163,469 – –Amounts owed by Group undertakings – – 7,874,540 5,286,074Other debtors 230,519 124,690 85,861 67,405Prepayments 746,514 593,401 288,381 243,948
5,857,896 5,044,107 8,248,782 5,597,427
80 City of London Investment Group Annual Report 2016/2017
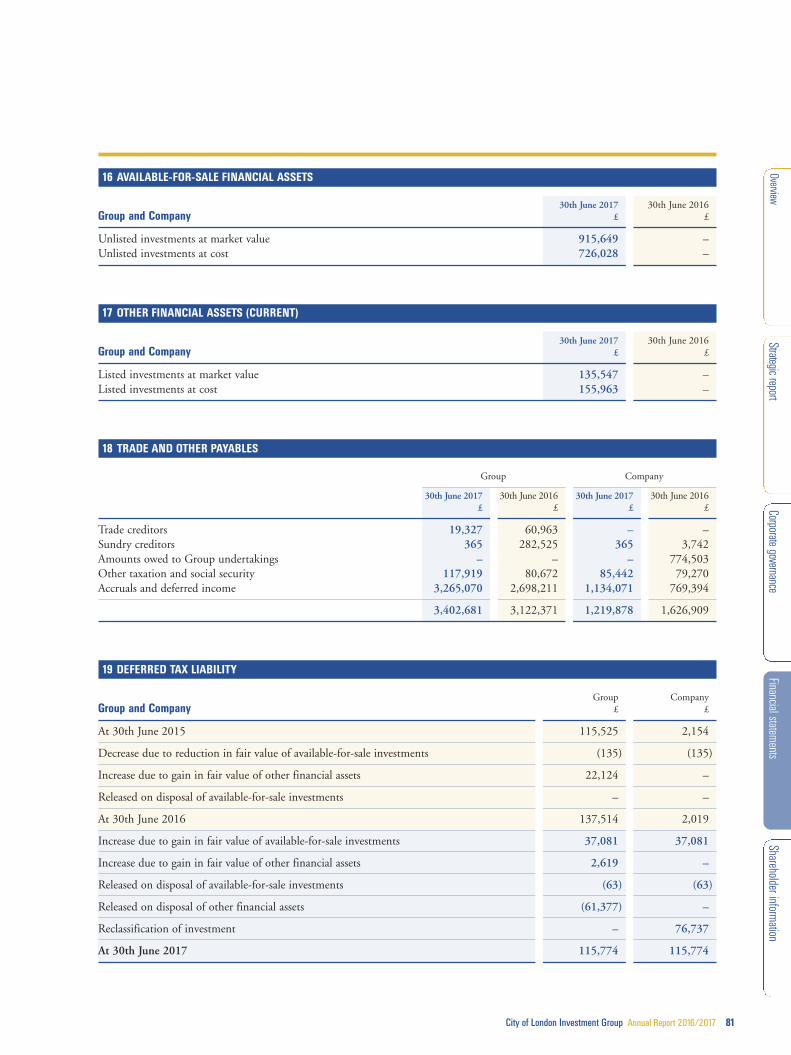
City of London Investment Group Annual Report 2016/2017 81
16 AVAILABLE-FOR-SALE FINANCIAL ASSETS
30th June 2017 30th June 2016Group and Company £ £
Unlisted investments at market value 915,649 –Unlisted investments at cost 726,028 –
17 OTHER FINANCIAL ASSETS (CURRENT)
30th June 2017 30th June 2016Group and Company £ £
Listed investments at market value 135,547 –Listed investments at cost 155,963 –
18 TRADE AND OTHER PAYABLES
Group Company
30th June 2017 30th June 2016 30th June 2017 30th June 2016£ £ £ £
Trade creditors 19,327 60,963 – –Sundry creditors 365 282,525 365 3,742Amounts owed to Group undertakings – – – 774,503Other taxation and social security 117,919 80,672 85,442 79,270Accruals and deferred income 3,265,070 2,698,211 1,134,071 769,394
3,402,681 3,122,371 1,219,878 1,626,909
19 DEFERRED TAX LIABILITY
Group CompanyGroup and Company £ £
At 30th June 2015 115,525 2,154
Decrease due to reduction in fair value of available-for-sale investments (135) (135)
Increase due to gain in fair value of other financial assets 22,124 –
Released on disposal of available-for-sale investments – –
At 30th June 2016 137,514 2,019
Increase due to gain in fair value of available-for-sale investments 37,081 37,081
Increase due to gain in fair value of other financial assets 2,619 –
Released on disposal of available-for-sale investments (63) (63)
Released on disposal of other financial assets (61,377) –
Reclassification of investment – 76,737
At 30th June 2017 115,774 115,774
OverviewCorporate governance
Financial statements
Shareholder information
Strategic report

NOTES TO THE FINANCIAL STATEMENTSCONTINUED
20 SHARE CAPITAL
30th June 2017 30th June 2016Group and Company Number of shares Number of shares
AuthorisedOrdinary shares of 1p each (2016 – 1p each) 90,000,000 90,000,000
£ £
Ordinary shares of 1p each (2016 – 1p each) 900,000 900,000
30th June 2017 30th June 2016Group and Company £ £
Allotted, called up and fully paidAt start of period 26,896,707 (2016: 26,912,271) Ordinary shares of 1p each 268,967 269,123Dilutive share options exercised; Nil (2016: 99,436) – 994Shares repurchased and cancelled; 35,000 (2016: 115,000) (350) (1,150)
At end of period 26,861,707 (2016: 26,896,707) Ordinary shares of 1p each 268,617 268,967
Fully paid ordinary shares carry one vote per share and carry a right to dividends.
21 DIVIDEND
30th June 2017 30th June 2016£ £
Dividends paid:Interim dividend of 8p per share (2016: 8p) 2,026,846 1,996,704Final dividend in respect of year ended:30th June 2016 of 16p per share (2015: 16p) 4,021,119 3,985,017
6,047,965 5,981,721
A final dividend of 17p per share has been proposed, payable on 31st October 2017, subject to shareholder approval, to shareholderswho are on the register of members on 13th October 2017.
82 City of London Investment Group Annual Report 2016/2017

City of London Investment Group Annual Report 2016/2017 83
22 OPERATING LEASE COMMITMENTS
At 30th June 2017 the Group had the following commitments for future minimum lease payments under non-cancellableoperating leases:
Group Company
Land and Land and Land and Land and buildings buildings buildings buildings
30th June 2017 30th June 2016 30th June 2017 30th June 2016£ £ £ £
Within one year 426,784 421,478 212,160 212,160In the second to fifth years inclusive 203,647 571,568 – 212,160After five years – – – –
630,431 993,046 212,160 424,320
Operating lease payments relating to land and buildings represent rents payable by the Group for its various offices. The Groupenters into formal occupational property leases ranging from one to ten years.
23 SHARE-BASED PAYMENTS
(a) The estimated fair values of options which fall under IFRS2, and the inputs used in the Binomial pricing model to calculatethose fair values, are as follows:
NumberExpected Risk-free Share price Exercise Dividend Estimated originally
Date of grant Expiry date life (yrs) rate at grant (£) price (£) Volatility yield fair value (£) granted
30/01/2014 30/01/2024 6.50 2.2294% 2.5000 2.5500 31.5246% 9.51% 0.3453 491,70019/06/2015 19/06/2025 6.50 1.6891% 3.5200 3.5200 30.8275% 6.51% 0.6141 398,585
The expected life of the options has been assumed to be six and a half years based upon the empirical evidence available.
The risk-free rate has been assumed to be represented by the yield to maturity at the date of grant of a UK principal Gilt strip withterm to maturity equal to the expected life of the option.
(b) All share options granted are equity settled. The number and weighted average exercise price of share options for each of thefollowing groups is as follows:
Year to 30th June 2017 Year to 30th June 2016
Weighted average Weighted average exercise price exercise price
Number £ Number £
Outstanding at the beginning of the period 1,566,620 3.11 2,158,671 2.88Granted during the period – – – –Forfeited during the period 80,000 3.29 312,710 2.61Exercised during the period 424,278 2.67 279,341 1.91Outstanding at the end of the period 1,062,342 3.27 1,566,620 3.11Exercisable at the end of the period 754,217 3.17 873,295 3.18
The weighted average share price at the date of exercisefor share options exercised during the period was 3.77 3.03
The total share-based payment for the period is a charge of £26,493 (2016: £16,868). For outstanding share options the exerciseprice ranged between £2.30 and £4.03, and all have a contract life of ten years.
OverviewCorporate governance
Financial statements
Shareholder information
Strategic report

NOTES TO THE FINANCIAL STATEMENTSCONTINUED
23 SHARE-BASED PAYMENTS CONTINUED
(c) The Group introduced a new Employee Incentive Plan (EIP) this year, open to employees of all Group companies and executiveDirectors, the details of which can be found in the Directors’ Remuneration Report.
Awards will be made to participating employees over shares under the EIP where they have duly waived an element of their annualbonus before the required waiver date.
Awards under the EIP will be made up of two elements: Deferred Shares and Bonus Shares. The Deferred Shares will represent thewaived bonus and the Bonus Shares will represent the additional award made by the Company as a reward for participating in the EIP.
The Deferred Shares are treated as cash settled and the full cost is recognised in the income statement in the year of service.The Bonus Shares are treated as equity settled and as such their estimated fair value is spread over the period from the time theemployee elects to participate, to when the Award vests (i.e. no longer forfeitable). This will be recalculated when the Awards aregranted and any amount under or over the estimated value will be recognised through the income statement at that point in time.
The estimated fair value of the Bonus Share awards is based on the cash equivalent at the time the employees elected to participate,and the share-based payment charge has been calculated as follows:
Totalestimated
Vesting charge 2016/17 2017/18 2018/19 2019/20 2020/21date £ £ £ £ £ £
Bonus Shares tranche 1 Oct-18 177,326 47,783 96,892 32,651 – –Bonus Shares tranche 2 Oct-19 177,326 30,899 62,657 62,657 21,114 –Bonus Shares tranche 3 Oct-20 177,326 22,815 46,264 46,264 46,391 15,591
531,978 101,497 205,813 141,572 67,505 15,591
The first Awards are due to be granted in October 2017 and will vest over a three period with one third vesting each year.
24 RELATED PARTY TRANSACTIONS
In the ordinary course of business, the Company and its subsidiary undertakings carry out transactions with related parties asdefined under IAS 24 Related Party Disclosures. Material transactions are set out below.
(i) Remuneration of key management personnelThe remuneration of the Directors who are the key management personnel of the Group is provided in the Remuneration reporton page 50 and in note 6.
(ii) Summary of transactions and balancesDuring the period the Company received from its subsidiaries £7,344,329 (2016: £6,171,618) in respect of management servicecharges and dividends of £7,700,000 (2016: £9,269,000).
Amounts outstanding between the Company and its subsidiaries as at 30th June 2017 are given in notes 15 and 18.
M Dwyer, a Director of the Company, is also a Director of the World Markets Umbrella Fund plc, a fund managed by City ofLondon Investment Management Company Ltd. The management fees earned by the Group during the year from this fund totalled£953,355 (2016: £661,169), with £122,580 (2016: £95,536 fees and £6,943 expenses) outstanding at the year end.
84 City of London Investment Group Annual Report 2016/2017

City of London Investment Group Annual Report 2016/2017 85
25 FINANCIAL INSTRUMENTS
The Group’s financial assets include cash and cash equivalents, investments and other receivables. Its financial liabilities includeaccruals and other payables. The fair value of the Group’s financial assets and liabilities is materially the same as the book value.
(i) Financial instruments by categoryThe tables below show the Group and Company’s financial assets and liabilities as classified under IAS39:
Group Assets at fairLoans and value through Available-
30th June 2017 receivables profit or loss for-sale TotalAssets as per statement of financial position £ £ £ £
Other financial assets – 135,547 34,660 170,207Trade and other receivables 5,792,745 65,151 – 5,857,896Available-for-sale financial assets – – 915,649 915,649Cash and cash equivalents 13,936,558 – – 13,936,558
Total 19,729,303 200,698 950,309 20,880,310
Liabilities at fair Financialvalue through liabilities atprofit or loss amortised cost Total
Liabilities as per statement of financial position £ £ £
Trade and other payables (1) – 3,402,681 3,402,681
Total – 3,402,681 3,402,681
Assets at fairLoans and value through Available-
30th June 2016 receivables profit or loss for-sale TotalAssets as per statement of financial position £ £ £ £
Other financial assets – 2,172,645 27,454 2,200,099Trade and other receivables 5,044,107 – – 5,044,107Cash and cash equivalents 10,150,799 – – 10,150,799
Total 15,194,906 2,172,645 27,454 17,395,005
Liabilities at Financialfair value through liabilities at
profit or loss amortised cost TotalLiabilities as per statement of financial position £ £ £
Trade and other payables (1) 276,743 2,845,628 3,122,371
Total 276,743 2,845,628 3,122,371
OverviewCorporate governance
Financial statements
Shareholder information
Strategic report

NOTES TO THE FINANCIAL STATEMENTSCONTINUED
25 FINANCIAL INSTRUMENTS CONTINUED
Company Assets at fairInvestment Loans and value through Available-
30th June 2017 in subsidiaries receivables profit or loss for-sale TotalAssets as per statement of financial position £ £ £ £ £
Other financial assets 800,911 – 135,547 33,194 969,652Trade and other receivables – 8,248,782 – – 8,248,782Available-for-sale financial assets – – – 915,649 915,649Cash and cash equivalents – 180,938 – – 180,938
Total 800,911 8,429,720 135,547 948,843 10,315,021
Liabilities at fair Financialvalue through liabilities atprofit or loss amortised cost Total
Liabilities as per statement of financial position £ £ £
Trade and other payables (1) – 1,219,878 1,219,878
Total – 1,219,878 1,219,878
Assets at fairInvestment Loans and value through Available-
30th June 2016 in subsidiaries receivables profit or loss for-sale TotalAssets as per statement of financial position £ £ £ £ £
Other financial assets 1,707,216 – – 27,454 1,734,670Trade and other receivables – 5,597,427 – – 5,597,427Cash and cash equivalents – 74,755 – – 74,755
Total 1,707,216 5,672,182 – 27,454 7,406,852
Liabilities at fair Financialvalue through liabilities atprofit or loss amortised cost Total
Liabilities as per statement of financial position £ £ £
Trade and other payables (1) – 1,626,909 1,626,909
Total – 1,626,909 1,626,909
(1) Trade and other payables are due within three months.
(ii) Fair value measurements recognised in the statement of financial positionThe following table provides an analysis of financial instruments that are measured subsequent to initial recognition at fair value,grouped into levels 1 to 3 based on the degree to which the fair value is observable.
• Level 1: fair value derived from quoted prices (unadjusted) in active markets for identical assets and liabilities.
• Level 2: fair value derived from inputs other than quoted prices included within level 1 that are observable for the assets orliability, either directly (i.e. as prices) or indirectly (i.e. derived from prices).
• Level 3: fair value derived from valuation techniques that include inputs for the asset or liability that are not based on observablemarket data.
86 City of London Investment Group Annual Report 2016/2017

City of London Investment Group Annual Report 2016/2017 87
25 FINANCIAL INSTRUMENTS CONTINUED
The fair values of the financial instruments are determined as follows:• Investments for hedging purposes are valued using the quoted bid price and shown under level 1.
• Investments in own funds are determined with reference to the net asset value (NAV) of the fund. Where the NAV is a quotedprice the fair value is shown under level 1, where the NAV is not a quoted price the fair value is shown under level 2.
• Forward currency trades are valued using the forward exchange bid rates and are shown under level 2.
The level within which the financial asset or liability is classified is determined based on the lowest level of significant input tothe fair value measurement.
GroupLevel 1 Level 2 Level 3 Total
30th June 2017 £ £ £ £
Available-for-sale financial assetsInvestment in own funds – 950,309 – 950,309
Total – 950,309 – 950,309
Financial assets at fair value through profit or lossInvestment in other financial assets 135,547 – – 135,547Forward currency trades – 65,151 – 65,151
Total 135,547 65,151 – 200,698
Financial liabilities at fair value through profit or lossForward currency trades – – – –
Total – – – –
Level 1 Level 2 Level 3 Total30th June 2016 £ £ £ £
Available-for-sale financial assetsInvestment in own funds – 27,454 – 27,454
Total – 27,454 – 27,454
Financial assets at fair value through profit or lossInvestment in other financial assets 2,160,174 12,457 14 2,172,645Forward currency trades – – – –
Total 2,160,174 12,457 14 2,172,645
Financial liabilities at fair value through profit or lossForward currency trades – 276,743 – 276,743
Total – 276,743 – 276,743
OverviewCorporate governance
Financial statements
Shareholder information
Strategic report
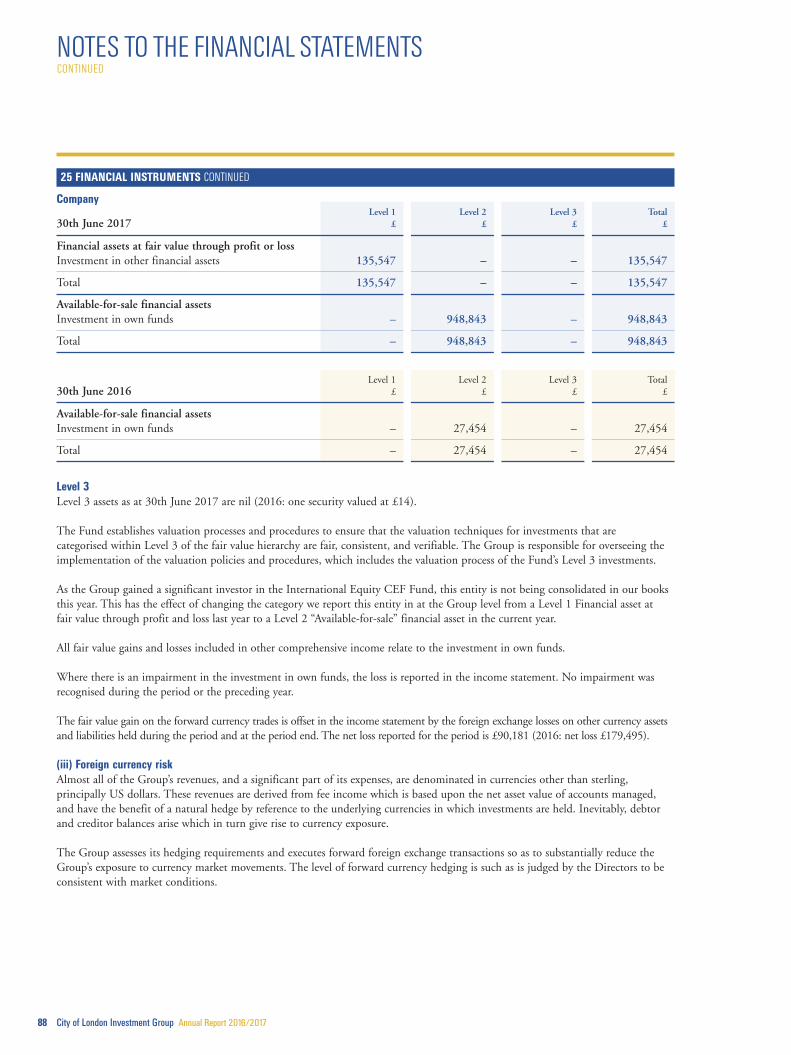
NOTES TO THE FINANCIAL STATEMENTSCONTINUED
25 FINANCIAL INSTRUMENTS CONTINUED
CompanyLevel 1 Level 2 Level 3 Total
30th June 2017 £ £ £ £
Financial assets at fair value through profit or lossInvestment in other financial assets 135,547 – – 135,547
Total 135,547 – – 135,547
Available-for-sale financial assetsInvestment in own funds – 948,843 – 948,843
Total – 948,843 – 948,843
Level 1 Level 2 Level 3 Total30th June 2016 £ £ £ £
Available-for-sale financial assetsInvestment in own funds – 27,454 – 27,454
Total – 27,454 – 27,454
Level 3Level 3 assets as at 30th June 2017 are nil (2016: one security valued at £14).
The Fund establishes valuation processes and procedures to ensure that the valuation techniques for investments that arecategorised within Level 3 of the fair value hierarchy are fair, consistent, and verifiable. The Group is responsible for overseeing theimplementation of the valuation policies and procedures, which includes the valuation process of the Fund’s Level 3 investments.
As the Group gained a significant investor in the International Equity CEF Fund, this entity is not being consolidated in our booksthis year. This has the effect of changing the category we report this entity in at the Group level from a Level 1 Financial asset atfair value through profit and loss last year to a Level 2 “Available-for-sale” financial asset in the current year.
All fair value gains and losses included in other comprehensive income relate to the investment in own funds.
Where there is an impairment in the investment in own funds, the loss is reported in the income statement. No impairment wasrecognised during the period or the preceding year.
The fair value gain on the forward currency trades is offset in the income statement by the foreign exchange losses on other currency assetsand liabilities held during the period and at the period end. The net loss reported for the period is £90,181 (2016: net loss £179,495).
(iii) Foreign currency riskAlmost all of the Group’s revenues, and a significant part of its expenses, are denominated in currencies other than sterling,principally US dollars. These revenues are derived from fee income which is based upon the net asset value of accounts managed,and have the benefit of a natural hedge by reference to the underlying currencies in which investments are held. Inevitably, debtorand creditor balances arise which in turn give rise to currency exposure.
The Group assesses its hedging requirements and executes forward foreign exchange transactions so as to substantially reduce theGroup’s exposure to currency market movements. The level of forward currency hedging is such as is judged by the Directors to beconsistent with market conditions.
88 City of London Investment Group Annual Report 2016/2017

City of London Investment Group Annual Report 2016/2017 89
25 FINANCIAL INSTRUMENTS CONTINUED
As at 30th June 2017, the Group had net asset balances of US$5,463,807 (2016: US$5,399,570), offset by forward sales totallingUS$4,750,000 (2016: US$4,250,000). Other significant net asset balances were C$452,927 (2016: C$387,803), AED246,996(2016: AED248,149), and SGD159,498 (2016: SGD196,587).
Had the US dollar strengthened or weakened against sterling as at 30th June 2017 by 10%, with all other variables held constant, theGroup’s net assets would have increased or decreased (respectively) by approximately 1%, because the US dollar position is hedged bythe forward sales.
Further details on the effects on the Group’s post-tax profits due to movements in the US dollar/sterling exchange rate have beendemonstrated in the Financial Review on page 28.
(iv) Market riskChanges in market prices, such as foreign exchange rates and equity prices will affect the Group’s income and the value of its investments.
Where the Group holds investments in its own funds, the market price risk is managed through diversification of the portfolio.A 10% increase or decrease in the price level of the funds’ relevant benchmarks, with all other variables held constant, would resultin an increase or decrease of approximately £0.1 million in the value of the investments and profit before tax.
The Group is also exposed to market risk indirectly via its assets under management, from which its fee income is derived. To hedgeagainst any potential loss in fee income due to a fall in the markets, the Group will look to invest in out-of-the-money put optionson the emerging markets index. The purchase and sale of these options are subject to limits established by the Board and aremonitored on a regular basis. The investment management and settlement functions are totally segregated.
The loss from hedging recognised in the Group income statement for the period is £20,416 (2016: Nil).
Further details on the effects on the Group’s post-tax profits due to movements in market prices have been demonstrated in thepost-tax profits table in the Chairman’s statement on page 2.
(v) Credit riskThe majority of debtors relate to management fees due from funds and segregated account holders. As such the Group is able toassess the credit risk of these debtors as minimal. For other debtors a credit evaluation is undertaken on a case by case basis.
The Group has zero experience of bad or overdue debts.
The majority of cash and cash equivalents held by the Group are with leading UK banks. The credit risk is managed by carryingout regular reviews of each institution’s credit rating and of their published financial position. Given their high credit ratings,management does not expect any counterparty to fail to meet its obligations.
(vi) Liquidity riskThe Group’s liquidity risk is minimal because commission payable forms the major part of trade creditors, and payment is madeonly upon receipt of the related fee income plus the Group’s strategy is to maximise its cash position. In addition, the Group’sinvestments in funds that it manages can be liquidated immediately if required.
(vii) Interest rate riskThe Group has no borrowings, and therefore has no exposure to interest rate risk other than that which attaches to its interest earningcash balances and forward currency contracts. The Group’s strategy is to maximise the amount of cash which is maintained in interestbearing accounts, and to ensure that those accounts attract a competitive interest rate. At 30th June 2017 the Group held £13,936,558(2016: £10,150,799) in cash balances, of which £13,799,951 (2016: £9,899,916) was held in bank accounts which attract variableinterest rates. The effect of a 100 basis points increase/decrease in interest rates on the Group’s net assets would not be material.
OverviewCorporate governance
Financial statements
Shareholder information
Strategic report

90 City of London Investment Group Annual Report 2016/2017
NOTES TO THE FINANCIAL STATEMENTSCONTINUED
25 FINANCIAL INSTRUMENTS CONTINUED
(viii) Capital risk managementThe Group manages its capital to ensure that all entities within the Group are able to operate as going concerns and exceed anyminimum externally imposed capital requirements. The capital of the Group and Company consists of equity attributable to theequity holders of the Parent Company, comprising issued share capital, share premium, retained earnings and other reserves asdisclosed in the statement of changes in equity on pages 66 and 67.
The Group’s principal operating subsidiary company, City of London Investment Management Company Ltd is subject to theminimum capital requirements of the Financial Conduct Authority (“FCA”) in the UK. This subsidiary held surplus capital over itsrequirements throughout the period.
The Group is required to undertake an Internal Capital Adequacy Assessment Process (“ICAAP”), under which the Board quantifiesthe level of capital required to meet operational risks. The objective of this is to ensure that the firm has adequate capital to enable itto manage risks which are not adequately covered under the Pillar 1 requirements. This process includes stress testing for the effectsof major risks, such as a significant market downturn, and includes an assessment of the Group’s ability to mitigate the risks.
26 SUBSEQUENT EVENTS
During the year the Group received a significant tactical investment from an EM client in its International Equity CEF Fund.This reduced the Company’s holding to 13% at which point the entity was deconsolidated, which resulted in an unrealised gain of£98,166. This gain was reported through the income statement under interest receivable and similar gains.
Subsequent to the year-end the client liquidated this tactical holding in the International Equity CEF Fund to invest in another ofthe Group’s funds.

City of London Investment Group Annual Report 2016/2017 91
OverviewCorporate governance
Financial statements
Shareholder information
Strategic report
NOTICE OF ANNUAL GENERAL MEETING
Notice is hereby given that the Annual General Meeting of City of London Investment Group PLC (the “Company”) will be held at 77 Gracechurch Street, London EC3V 0AS on Monday 23rd October 2017 at 11.30am to consider, and if thought fit, pass resolutions 1 to 16 as ordinary resolutions and resolution 17 as a special resolution:
Ordinary business1. To receive and adopt the financial statements for the year ended 30th June 2017 together with the reports of the Directors and
auditors thereon.
2. To approve the Annual report on remuneration for the year ended 30th June 2017.
3. To declare a final dividend of 17p per ordinary share for the year ended 30th June 2017 payable on 31st October 2017
4. To re-elect, as a Director of the Company, Barry Aling, who retires in accordance with the Articles of Association of theCompany and offers himself for re-election.
5. To re-elect, as a Director of the Company, David Cardale, who retires in accordance with the Articles of Association of theCompany and offers himself for re-election.
6. To re-elect, as a Director of the Company, Mark Driver, who retires in accordance with the Articles of Association of theCompany and offers himself for re-election
7. To re-elect, as a Director of the Company, Mark Dwyer, who retires in accordance with the Articles of Association of theCompany and offers himself for re-election.
8. To re-elect, as a Director of the Company, Tom Griffith, who retires in accordance with the Articles of Association of theCompany and offers himself for re-election.
9. To re-elect, as a Director of the Company, Barry Olliff, who retires in accordance with the Articles of Association of theCompany and offers himself for re-election.
10. To re-elect, as a Director of the Company, Tracy Rodrigues, who retires in accordance with the Articles of Association of theCompany and offers herself for re-election.
11. To appoint, as a Director of the Company, Susannah Nicklin, who was appointed during the period and retires in accordancewith the Company’s Articles of Association and, being eligible, offers herself for re-appointment.
12. To appoint RSM UK Group LLP as auditors of the Company to hold office from the conclusion of the meeting until theconclusion of the next general meeting of the Company at which accounts are laid before the Company.
13. To authorise the Board to determine the auditors’ remuneration.
Special business14. THAT, in accordance with sections 551 of the Companies Act 2006, the Directors be generally and unconditionally authorised to
exercise all powers conferred pursuant to Article 10 of the Company’s Articles of Association to allot shares in the Company (whichfor this purpose includes grants of rights to subscribe for or to convert any security into shares) up to a maximum nominal amountof £89,539 (representing approximately one third of the Company’s issued ordinary capital at the date of this notice), provided thatthis authority shall, unless renewed, varied or revoked by the Company, expire at the conclusion of the Company’s next AnnualGeneral Meeting, or on 30th November 2018 (whichever is earlier), save that the Company may, before such expiry, make an offeror agreement which would or might require shares to be allotted (or rights to be granted) and the Directors may allot shares (orgrant rights) in pursuance of such offer or agreement notwithstanding that the authority conferred by this resolution has expired.
This authority is in substitution for all previous authorities conferred on the Directors in accordance with section 551 of theCompanies Act 2006.
15. THAT, the trustees from time to time of the City of London Employee Benefit Trust (the “EBT”) be and are hereby authorisedto hold ordinary shares in the capital of the Company, for and on behalf of the ESOP, up to a maximum in aggregate equal to10% of the issued ordinary share capital of the capital from time to time.
NOTICE OF ANNUAL GENERAL MEETINGCONTINUED
16. THAT, subject to the passing of resolution 15 and in accordance with section 570 and section 573 of the Companies Act 2006,the Directors be generally and unconditionally authorised to exercise all powers conferred pursuant to Article 10 of the Company’sArticles of Association to allot equity securities (as defined in section 560 of the Companies Act 2006) pursuant to the authorityconferred by resolution 15, as if the pre-emption provisions of section 561(1) of the Companies Act 2006 did not apply to suchallotment, provided that this power shall be limited to the allotment of equity securities up to a maximum nominal amount of£13,431 (representing approximately 5% of the Company’s issued ordinary capital at the date of this notice), provided that thisauthority shall, unless renewed, varied or revoked by the Company, expire at the conclusion of the Company’s next AnnualGeneral Meeting, or on 30th November 2018 (whichever is earlier) save that the Company may, before such expiry, make an offeror agreement which would or might require shares to be allotted (or rights to be granted) and the Directors may allot shares (orgrant rights) in pursuance of such offer or agreement notwithstanding that the authority conferred by this resolution has expired.
17. THAT, in accordance with section 701 of the Companies Act 2006, the Company be generally and unconditionally authorisedto make market purchases (within the meaning of section 693(4) of the Companies Act 2006) of any of its ordinary shares of£0.01 (1p) provided that:
(a) the maximum number of ordinary shares which may be purchased is 2,686,171 (representing approximately 10% of theCompany’s issued ordinary share capital at the date of this notice);
(b) the minimum price which may be paid for each ordinary share is £0.01 (1p) which amount shall be exclusive of expenses, if any;
(c) the maximum price, exclusive of any expenses, which may be paid for any ordinary share shall be higher of:(i) an amount equal to 105% of the average of the middle market quotations for the ordinary shares of the Company as
derived from the Daily Official List of the London Stock Exchange plc for the five business days immediately precedingthe date on which such ordinary share is contracted to be purchased; and
(ii) the higher of the price quoted for(a) the last independent trade of; and(b) the highest current independent bid for, any number of ordinary shares on the trading venue where the purchase
is carried out, and
(d) unless previously renewed, revoked or varied, this authority shall expire at the conclusion of the Company’s next AnnualGeneral Meeting, or on 30th November 2018 (whichever is earlier),
under this authority the Company may make a contract to purchase ordinary shares which would or might be executed wholly orpartly after the expiry of this authority and may make purchases of ordinary shares pursuant to it as if this authority had not expired.
By order of the Board
P A KeithCompany Secretary14th September 2017
Registered office: 77 Gracechurch Street, London EC3V 0AS Registered in England and Wales No 2685257
92 City of London Investment Group Annual Report 2016/2017

City of London Investment Group Annual Report 2016/2017 93
OverviewCorporate governance
Financial statements
Shareholder information
Strategic report
NOTES TO THE NOTICE OF ANNUAL GENERAL MEETING
1. Information about this meeting is available on theCompany’s website – www.citlon.co.uk
2. A member entitled to receive notice, attend and vote at theannual general meeting is entitled to appoint a proxy orproxies to attend and, on a poll, vote instead of him. Suchproxy need not be a member of the Company. Completionof a form of proxy does not preclude the member attendingthe meeting and voting in person if they so wish. To bevalid, the instrument appointing a proxy, together ifappropriate, with a power of attorney or other authority (if any) under which it is signed, or a notarially certifiedcopy of such authority, must be deposited at the offices of the Company’s registrars, Capita Asset Services, PXS, 34 Beckenham Road, Beckenham, Kent, BR3 4TU orreturned in the envelope provided no later than 11.30am on 19th October 2017. A Form of Proxy accompanies this notice.
3. Pursuant to Regulation 41 of the Uncertificated SecuritiesRegulations 2001, the time by which a person must beentered on the register of members of the Company in orderto have the right to attend and vote at the annual generalmeeting (and for the purposes of the determination by theCompany of the numbers of votes they may cast) is Close of Business on 19th October 2017.
The rights of members to attend and vote at the meetingwill be determined by reference to entries on the register of members at Close of Business on 19th October 2017.Changes to entries on the register of members of theCompany after that time will be disregarded in determiningthe rights of any person to attend or vote at the meeting.
4. The right to appoint a proxy does not apply to personswhose ordinary shares are held on their behalf by another person and who have been nominated to receivecommunications from the Company in accordance withsection 146 of the Companies Act 2006 (“nominatedpersons”). Nominated persons may have a right under anagreement with the registered shareholder who holds shareson their behalf to be appointed (or to have someone elseappointed) as a proxy. Alternatively, if nominated persons do not have such a right, or do not wish to exercise it, theymay have a right under such an agreement to instructions to the person holding the ordinary shares as to the exerciseof voting rights.
5. In the case of joint holders, the signature of only one of thejoint holders is required on the form of proxy, but the voteof the first named on the register of members will beaccepted to the exclusion of the other joint holders.
6. The following documents are available for inspectionbetween 10.00am and 12.00 noon at the registered office of the Company on any weekday and will also be availablefor inspection at the place of the annual general meetingfrom the commencement of the meeting until theconclusion thereof:
(a) The register of interests of the Directors (and theirfamilies) in the share capital of the Company.
(b) Copies of the Directors’ contracts of service and lettersof appointment of the non-executive Directors.
(c) Terms of reference of the Audit, Remuneration andNominations Committees.
(d) Copies of the Company’s articles of association.

EXPLANATION OF THE BUSINESS OF THEANNUAL GENERAL MEETING
Report and accounts (Resolution 1)The first item on the agenda requires that the Directors mustpresent the accounts of the Company for the year ended 30thJune 2017, together with the Directors’ report and theindependent auditors’ report thereon.
Annual report on remuneration (Resolution 2)In line with regulations relating to the preparation and approvalof a Directors’ remuneration report, resolution 2 is to beproposed at the AGM. The resolution will provide shareholderswith the opportunity to comment on the remuneration,although shareholders should note that in accordance with theregulations the vote will be advisory in nature.
Declaration of final dividend (Resolution 3)Your Directors are recommending a final dividend of 17p perordinary share for the year ended 30th June 2017 which will bepaid on 31st October 2017 to shareholders on the register at theclose of business on 13th October 2017.
The Company’s shares will trade ex-dividend from 12th October2017 until the payment date.
Re-election of Directors (Resolutions 4 – 11)Article 138 of the Company’s articles of association requires thata resolution for the appointment or re-appointment of two ormore persons as Directors by a single resolution may not bemoved unless a resolution that it shall be so moved has first beenagreed to by the meeting without any vote being given againstit. Consequently separate resolutions will be put to the meeting.
Brief biographical details of all the Directors may be found onpages 36 to 37 of the annual report.
Appointment of auditors (Resolution 12)The Company is required at each general meeting at which itsannual accounts and reports are laid before the shareholders (an“Accounts Meeting”) to appoint auditors for the next financialyear to hold office from the conclusion of that accounts meetinguntil the conclusion of the next accounts meeting. If resolution12 is passed, RSM UK Group LLP will be appointed as auditorsto the Company for the financial year ending 30th June 2018.
Remuneration of auditors (Resolution 13)In accordance with the Companies Act 2006, the remunerationof the auditors appointed by the shareholders may be fixed insuch manner as the shareholders in general meeting maydetermine. It is normal practice for a company’s Directors to beauthorised to agree the auditors’ fees. If this resolution is passed,the Audit Committee will review and approve the auditors’ feesfor recommendation to the Board.
Authority to allot shares (Resolution 14)Resolution 14 will be proposed as an ordinary resolution inaccordance with section 551 of the Companies Act 2006, toauthorise the Directors generally to allot shares and rights overshares up to a maximum nominal amount of £89,539representing approximately one third of the existing issuedordinary share capital as at the date of this notice.
Such authority will expire at the conclusion of the Company’snext Annual General Meeting, or on 30th November 2018(whichever is the earlier), unless renewed, varied or revoked bythe Company prior to or on that date.
The City of London Employee Benefit Trust (the “EBT”)(Resolution 15)In accordance with the Association of British Insurers’ Principlesof Remuneration, the prior approval of shareholders should beobtained before 5% or more of the Company’s issued sharecapital is held on behalf of the EBT.
Your Board of Directors therefore seeks the approval ofshareholders by ordinary resolution to permit the trustees of theEBT to hold up to a maximum of 10% of the Company’s issuedordinary share capital from time to time. Your Directors believethat granting such approval would be in the best interests ofshareholders because it will offer the opportunity to align moreclosely the interests of staff and shareholders, will extend theCompany’s opportunities with respect to attracting new talentand will promote confidence in the stability of the Company’sinvestment process from a client perspective.
94 City of London Investment Group Annual Report 2016/2017
City of London Investment Group Annual Report 2016/2017 95
OverviewCorporate governance
Financial statements
Shareholder information
Strategic report
Disapplication of pre-emption rights (Resolution 16) Resolution 16 will be proposed as a special resolution inaccordance with section 570 of the Companies Act 2006, toauthorise the Directors of the Company to allot a limitednumber of shares for cash other than on a pre-emptive basis,up to an aggregate nominal value of £13,431 representingapproximately 5% of the issued ordinary share capital at thedate of this notice. This authority will expire at the conclusionof the Company’s next Annual general meeting, or on 30thNovember 2018 (whichever is earlier), unless renewed, variedor revoked by the Company prior to or on that date.
Purchase by the Company of its own shares (Resolution 17)Under section 701 of the Companies Act 2006, the Directors ofa company may make market purchases of that company’s sharesif authorised to do so. The Company’s articles of association givea general authority to the Directors to purchase shares on themarket but that authority is subject to the approval ofshareholders. Your Directors believe that granting such approvalwould be in the best interests of the shareholders in allowingDirectors the flexibility to react promptly to circumstancesrequiring market purchases.
Accordingly Resolution 17, which will be proposed as a specialresolution, will give the Directors the authority to purchaseissued shares of the Company under section 701 of theCompanies Act 2006. The authority contained in thisResolution will be limited to an aggregate nominal value of£26,861 which represents approximately 10% of the issuedordinary share capital of the Company at the date of this notice.The price which may be paid for those shares is also restrictedas set out in the Resolution. This authority will expire at theconclusion of the Company’s next Annual General Meeting,or on 30th November 2018 (whichever is earlier).
The Board has no present intention of exercising this authority.However, this will be kept under review, and the Board will usethis power only if and when, taking account of marketconditions prevailing at the time, other investmentopportunities, appropriate gearing levels and the overall financialposition of the Group, they believe that the effect of suchpurchases will be in the best interests of shareholders generallyand that they will result in an increase in earnings per share.
Shares purchased under this authority may be held as treasuryshares. The Company may purchase and hold shares as treasuryshares up to a maximum amount equal to 10% of the nominalvalue of the issued ordinary share capital at that time, ratherthan cancelling them. Shares held in treasury do not carryvoting rights and no dividends will be paid on such shares.Shares held in treasury in this way can be sold for cash orcancelled. This would allow the Company to manage its capitalbase more effectively and to replenish its distributable reserves.
If and when the Board resolves to exercise its authority to makemarket purchases, it will at that time decide whether sharespurchased are to be cancelled or held in treasury.

COMPANY INFORMATION
96 City of London Investment Group Annual Report 2016/2017
Financial calendar
First quarter Funds under Management (FuM) announcement 9th October 2017
Ex-dividend date for the final dividend 12th October 2017
Final dividend record date 13th October 2017
AGM 23rd October 2017
Final dividend payment 31st October 2017
Second quarter FuM announcement 17th January 2018
Half year results and interim dividend announcement 19th February 2018
Ex-dividend date for the interim dividend 1st March 2018
Interim dividend record date 2nd March 2018
Interim dividend payment 16th March 2018
Third quarter FuM announcement 18th April 2018
Year end 30th June 2018
For further information please see the shareholders page on our website www.citlon.co.uk
Financial adviser and brokerZeus Capital41 Conduit StreetLondonW1S 2YQ
AuditorsMoore Stephens LLPChartered Accountants150 Aldersgate StreetLondonEC1A 4AB
BankersThe Royal Bank of Scotland plcLondon City Office62-63 Threadneedle StreetLondonEC2R 8LA
RegistrarCapita Asset ServicesThe Registry34 Beckenham RoadBeckenhamKentBR3 4TU
By phone on 0871 664 0300 from theUK and +44 371 664 0391 from overseas.(Calls cost 12 pence per minute plusnetwork extras. Calls outside the UnitedKingdom will be charged at the applicableinternational rate. Lines are open from9am to 5:30pm Mon – Fri, excludingpublic holidays in England and Wales).
By email:[email protected]
Company registered officeCity of London Investment Group PLC77 Gracechurch StreetLondonEC3V 0AS
Company registration number2685257
Company SecretaryPhilippa Keith

City of London Investment Group PLC is an establishedasset management group which has built its reputation,with an institutional client focus, by specialising inEmerging Market closed-end fund investment.
In recent years the Group has expanded its range toinclude Developed, Frontier and Global Tactical AssetAllocation closed-end fund strategies.
CITY OF LONDONI N V E S T M E N T G R O U P P L C
www.citlon.co.ukDesigned and produced by fourthquarter
The paper used in this document containsmaterials sourced from responsiblymanaged and sustainable commercialforests, certified in accordance with the FSC® (Forest Stewardship Council).

CITY
OF LO
ND
ON
INV
ESTM
ENT G
RO
UP
PLC
AN
NU
AL REPO
RT & A
CCOU
NTS 2016/2017
CITY OF LONDONI N V E S T M E N T G R O U P P L C
ANNUAL REPORT & ACCOUNTS 2016/2017
London office77 Gracechurch StreetLondonEC3V 0ASUnited Kingdom
Telephone: + 44 (0) 207 711 0771Facsimile: + 44 (0) 207 711 0772
US East Coast officeThe Barn1125 Airport RoadCoatesville, PA 19320United StatesTelephone: + 1 610 380 2110Facsimile: + 1 610 380 2116
US West Coast officePlaza Center10900 NE 8th StreetSuite 1519Bellevue, WA 98004United StatesTelephone: + 1 610 380 0090
Singapore office20 Collyer Quay#10-04Singapore 049319
Telephone: + 65 6236 9136Facsimile: + 65 6532 3997
Dubai officeUnit 2, 2nd FloorThe Gate Village Building 1Dubai International Financial CentrePO Box 506695DubaiUnited Arab Emirates
Telephone: + 971 (0)4 423 1780Facsimile: + 971 (0)4 437 0510
www.citlon.co.uk