Embed Size (px)
Citation preview

City of Los Angeles
November 15, 2011
Presenters:Mike NormanSenior Principal
Robert CrandallSenior Associate
Experience Performance Consistency
GalliardCapital Management, Inc.
Experience. Performance. Consistency.

City of Los Angeles Stable Value Fund
Galliard ContactsRelationship Management
Mike NormanSenior [email protected]
Section I: Galliard Capital Management Update
Section II: A Brief Refresher: What is Stable Value?
Andy ApostolSenior [email protected]
Portfolio Analyst
Section III: Stable Value Market Update Economic Overview
Section IV: City of Los Angeles 3Q’11 Portfolio Update
Robert CrandallSenior [email protected]
Other Contact(s)
John Caswell, CFAManaging [email protected]
Karl TourvilleKarl TourvilleManaging [email protected]
Galliard Client Service
612 667 3220
City of Los Angeles


Galliard UpdateFixed Income and Stable Value Specialists
Galliard At A Glance
One of the nation’s leading fixed income and stable value managers
Over $75.8 Billion in assets under management - $68.1 Billion in stable value*
Ranked 12th largest active domestic fixed income managerg gby Pensions & Investments**
Experienced team focused on managing money and servicing clients
88 professionals on staff*
Ability to leverage support services from Wells FargoAbility to leverage support services from Wells Fargo
Exceptional Stability
Founded in 1995 as an independently operated subsidiary of Wells Fargo & Co.
No changes in ownership, management or philosophy since inception – none contemplated
Our client focus and organizational stability have been the key to our long term success
contemplated
*as of 9/30/11**Pensions & Investments, Largest Money Managers Report, May 30, 2011. The ranking is based on U.S. Institutional, tax-exempt assets managed internally in millions, as of December 31, 2010.
1 City of Los Angeles
Our client focus and organizational stability have been the key to our long term success*The City of Los Angeles Stable Value Fund and its underlying collective funds are not FDIC, Federal Reserve Board insured and may loose value. No bank guarantee,

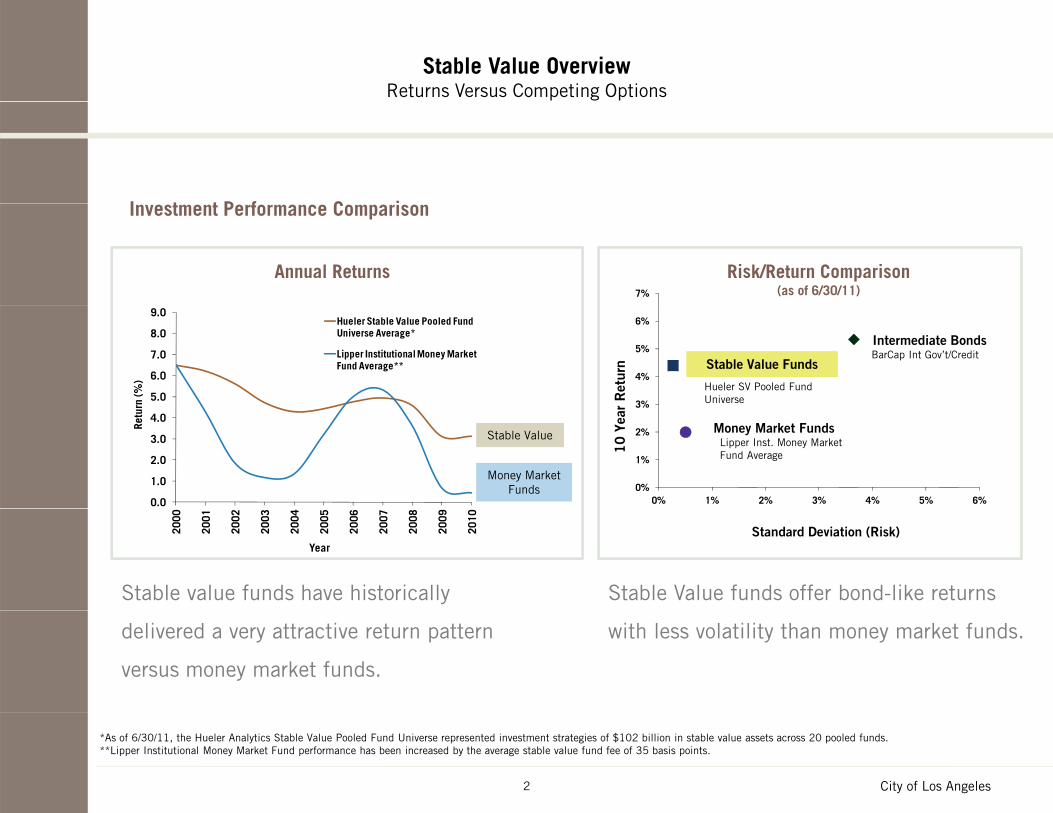
Stable Value OverviewReturns Versus Competing Options
I t t P f C iInvestment Performance Comparison
Annual Returns Risk/Return Comparison(as of 6/30/11)7%
3%
4%
5%
6%
Stable Value Funds
Intermediate Bonds
Hueler SV Pooled Fund Universe
BarCap Int Gov’t/Credit
r R
etur
n
5.0
6.0
7.0
8.0
9.0
rn (%
)
Hueler Stable Value Pooled Fund Universe Average*
Lipper Institutional Money Market Fund Average**
Stable Value
Money MarketFunds 0%
1%
2%
3%
0% 1% 2% 3% 4% 5% 6%
Money Market FundsLipper Inst. Money Market Fund Average1
0 Y
ear
0.0
1.0
2.0
3.0
4.0
Retu
r
Stable Value funds offer bond-like returns Stable value funds have historically
Standard Deviation (Risk)2000
2001
2002
2003
2004
2005
2006
2007
2008
2009
2010
Year
with less volatility than money market funds.delivered a very attractive return pattern
versus money market funds.
City of Los Angeles
*As of 6/30/11, the Hueler Analytics Stable Value Pooled Fund Universe represented investment strategies of $102 billion in stable value assets across 20 pooled funds.**Lipper Institutional Money Market Fund performance has been increased by the average stable value fund fee of 35 basis points.
2

Stable Value OverviewWhat Does the Fund Invest In?
Security Backed Contract (Wrap Contract)A fixed income (bond) portfolio combined withA fixed income (bond) portfolio combined with an investment contract issued from a bank or
insurance company
Investment Contracts (wrap contracts)
• Issued by banks and insurance companies
Book Value Contract
insurance companies
Underlying Fixed Income Portfolio
U.S. Gov't/Agency
Commercial Mortgage Backed
Securities 8%
Residential Mortgage Backed
Securities 35%
Sovereign/ Supranational
2%
Cash 4%
Portfoliog y9%
Other U.S. Gov't 11%
Taxable Municipal
5%
Corporates26%
8%
Underlying fixed income portfolio managed by a company different than the bank or insurance company providing the investment (wrap) contract
Th i d i d f ili i i ’ bili
3 City of Los Angeles
The wrap contract is designed to facilitate participants’ abilityto transact at book value (principal plus accrued interest)

Mechanics of Stable Value Investing The Role of the Crediting Rate
Wrap contracts are designed to help
preserve principal and provide a stable
crediting rate as identified by the solid,
bold line.
Falling Interest Rates
Crediting Rate
A wrap contract’s crediting rate
formula is designed to provide a
relatively consistent return profile during
periods of rising or falling interest rates.
Market Valueof underlying
tf li
Book Value Contract
et V
alue
p g g
The contracts tend to smooth the impact
of fluctuating interest rates and their
effect on bond prices by amortizing the
gains or losses over the duration of the
portfolioAs
se
gains or losses over the duration of the
portfolio.
Stable value portfolio yields tend to
track the general direction of interest
Rising Interest Rates
track the general direction of interest
rates, but with a lag. On a day-to-day
basis, stable value portfolios daily price
(NAV) should not vary much due to the
hi f h i h k b
Time
Objective of Stable Value Investing: Minimize volatility (changes) in th F d’ i ld hil t ti i i l
4 City of Los Angeles
smoothing of changes in the markets by
the wrap contracts.
the Fund’s yield, while protecting principal

Stable Value Performance CharacteristicsInterest Rate Responsiveness
7 00%
8.00%
S
5.00%
6.00%
7.00%Stable Value returns
have tracked changes
in market rates but g
Rate
s
2.00%
3.00%
4.00%
with a lag, as
indicated by
the graph Annu
aliz
ed C
redi
ting
0.00%
1.00%
5 Year Treasury Yield (CMT) Galliard Stable Value Separate Account Composite
the graph
5-Year Treasury Yield (CMT) Galliard Stable Value Separate Account Composite
Years
5 City of Los Angeles


Stable Value Market UpdateWrap Capacity
Wrap Market Update
• Existing providers are increasing capacity
• New providers entering market
• Shift in market providers from banking and insurance entities to predominantly insurance providers
• JP Morgan indication of exit
• Contract terms predominantly redefined
• Fees settling in 20-25 bps range
• Overall cooperation on S&P downgrade and guidelines being adjusted as necessary
Galliard continues to successfully transition Stable Value Portfolios in this environment:
• Since 1/1/08, transitioned $31.5 billion in new assets for 84 clients*
• In 2010, $11 billion transitioned for 30 clients
Galliard’s conservative approach, proven track record and strong relationships within the wrap market have allowed us to deliver client solutions in a challenging market
6
allowed us to deliver client solutions in a challenging market
*As of 9/30/11City of Los Angeles

Third Quarter 2011 Economic OverviewThird Quarter 2011
Confidence Crisis Threatens Economic Recovery! Consumer Confidence continued to erode during the third quarter,
falling to its lowest level since 2009 (Fig.1). Consumers and
700,000
Fig. 2: Initial Weekly Unemployment Claims
falling to its lowest level since 2009 (Fig.1). Consumers and businesses are leery about spending in the wake of political gridlock in the United States and the looming European debt crisis.
Initial unemployment claims fell below 400,000 at the end of the quarter (Fig. 2), signaling potential economic expansion. However, job creation remains stagnant and national unemployment remains above
500,000
600,000
tial Claim
s
Contraction (above 400k in claims)
9.0%.
Tepid ISM data suggest that manufacturing and non-manufacturing businesses alike are signaling weak expansion despite better-than-expected data for September (Fig. 3).
200 000
300,000
400,000Init
Expansion (below 400k in claims)
Current Level
200,000
Current Level Initial Claims (4-week moving average)
65
Fig. 3: ISM Manufacturing Index140 Fig. 1: Conference Board Consumer Confidence Index
45
50
55
60
65
ndex
Value
(%)
80
100
120
ndex
Valu
e
30
35
40
45
2001 2002 2003 2004 2005 2006 2007 2008 2009 2010 2011
In
20
40
60
2001 2002 2003 2004 2005 2006 2007 2008 2009 2010 2011
In
7
ISM Manufacturing Index ISM Non-Manufacturing Index2001 2002 2003 2004 2005 2006 2007 2008 2009 2010 2011

Third Quarter 2011 Economic OverviewThird Quarter 2011
Economic Growth is Driven by the U.S. Consumer
Real GDP managed 1.3% annualized growth from April through June despite supply shocks from high oil prices and the Japanese tsunami
$65.0
$70.0 Fig. 2: U.S. Household Net Worth (in $Trillion)
despite supply shocks from high oil prices and the Japanese tsunami.
The U.S. consumer has improved capacity to spend given the recovery in accumulated wealth since 2009 (Fig. 2). However, propensity to spend has been stifled by concerns over jobs and declining real income (Fig. 3).
Stronger economic growth overall will depend on improved consumer $45.0
$50.0
$55.0
$60.0
Stronger economic growth overall will depend on improved consumer confidence.
$30.0
$35.0
$40.0
$
2002 2003 2004 2005 2006 2007 2008 2009 2010 2011
4.0
6.0
8.0 Fig. 1 U.S. Real GDP Growth (QOQ % Chg)
6.00%
8.00%Fig. 3: Real Personal Income Growth (YOY % Chg)
(2.0)
0.0
2.0
% Ch
ange
0.00%
2.00%
4.00%
(8.0)
(6.0)
(4.0)
-4.00%
-2.00%
8
(10.0)2002 2003 2004 2005 2006 2007 2008 2009 2010 2011
-6.00%2007 2008 2009 2010 2011

Third Quarter 2011 Economic OverviewThird Quarter 2011
Economic Outlook – Slow Growth Recovery Continues
We expect final real GDP growth in the 1% to 2% range for 2011 and a slow growth p g g genvironment to begin 2012 in the face of mixed economic conditions. Businesses and consumers have taken a continued wait-and-see approach while politicians work to resolve economic and debt concerns in the United States and Europe. The consequence has been apathetic spending, despite improving capacity to do so.
The Federal Reserve remains committed to keeping interest rates low and liquidity abundant, as it instituted Operation Twist at the end of the third quarter. The result has been a flattening yield curve, as longer interest rates declined. The program’s desired outcome is to encourage consumer-based loans and spending. However, the program’s effectiveness remains to be seen.
The effects of QE2, which wrapped up in June, and Operation Twist, which began in September will ideally stimulate economic growth in the near term Looking forward and September, will ideally stimulate economic growth in the near term. Looking forward, and presuming economic growth materializes, the Fed may consider interest rate increases as keeping interest rates at historic lows risks a deflationary spiral.
In the meantime, economic growth will depend on job creation and income growth, the key determinants of consumer spending.
9
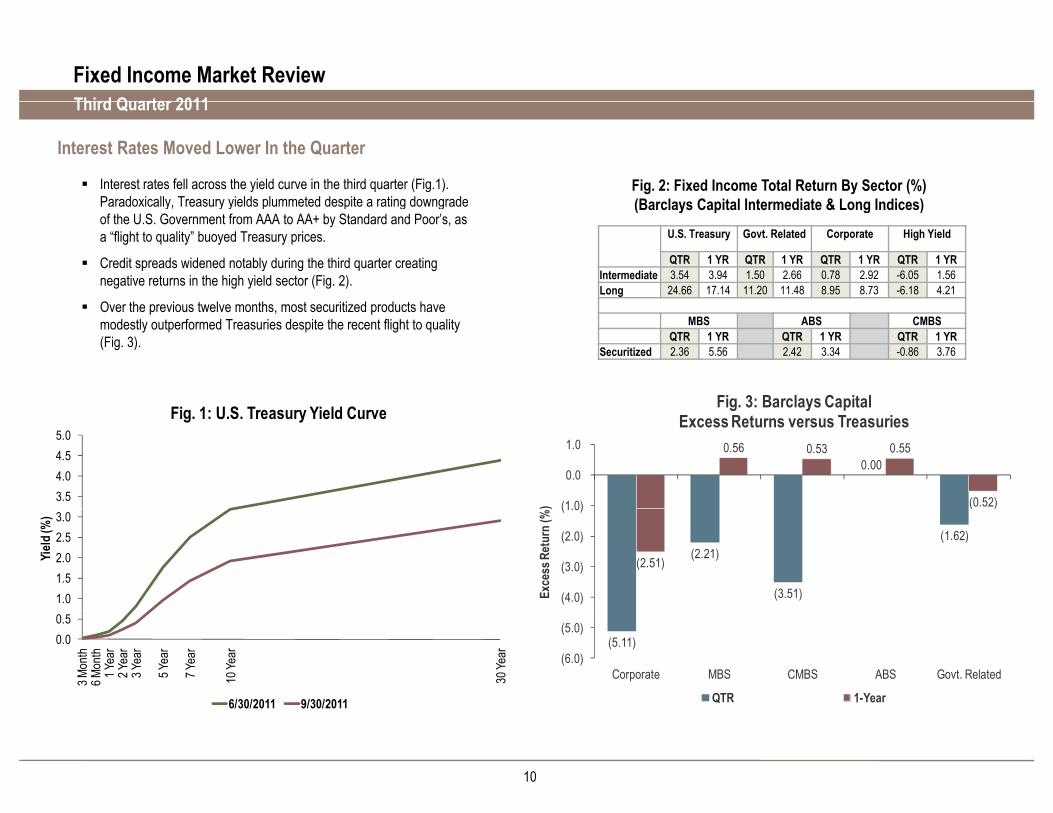
Third Quarter 2011 Fixed Income Market ReviewThird Quarter 2011
Interest rates fell across the yield curve in the third quarter (Fig.1). Paradoxically Treasury yields plummeted despite a rating downgrade
Fig. 2: Fixed Income Total Return By Sector (%)(Barclays Capital Intermediate & Long Indices)
Interest Rates Moved Lower In the Quarter
Paradoxically, Treasury yields plummeted despite a rating downgrade of the U.S. Government from AAA to AA+ by Standard and Poor’s, as a “flight to quality” buoyed Treasury prices.
Credit spreads widened notably during the third quarter creating negative returns in the high yield sector (Fig. 2).
Over the previous twelve months most securitized products have
(Barclays Capital Intermediate & Long Indices)U.S. Treasury Govt. Related Corporate High Yield
QTR 1 YR QTR 1 YR QTR 1 YR QTR 1 YRIntermediate 3.54 3.94 1.50 2.66 0.78 2.92 -6.05 1.56Long 24.66 17.14 11.20 11.48 8.95 8.73 -6.18 4.21
Over the previous twelve months, most securitized products have modestly outperformed Treasuries despite the recent flight to quality (Fig. 3).
MBS ABS CMBSQTR 1 YR QTR 1 YR QTR 1 YR
Securitized 2.36 5.56 2.42 3.34 -0.86 3.76
Fi 1 U S T Yi ld C Fig. 3: Barclays Capital
3.54.04.55.0
Fig. 1: U.S. Treasury Yield Curve
0.00 0.56 0.53 0.55
(0.52)(1 0)
0.0
1.0
)
Fig. 3: Barclays Capital Excess Returns versus Treasuries
1.01.52.02.53.0
Yiel
d (%
)
(2.21)
(3.51)
(1.62)
(2.51)
( )
(4.0)
(3.0)
(2.0)
(1.0)
Exce
ss R
etur
n (%
)
0.00.5
3 Mon
th6 M
onth
1 Yea
r2 Y
ear
3 Yea
r
5 Yea
r
7 Yea
r
10 Ye
ar
30 Ye
ar
6/30/2011 9/30/2011
(5.11)(6.0)
(5.0)
Corporate MBS CMBS ABS Govt. Related
QTR 1-Year
10


Stable Value PhilosophyInvestment Approach and Objectives
Consistent with the role of stable value as the “safe option,” we manage stable value portfolios conservatively seeking to consistently outperform our benchmarks while
K I Obj i
portfolios conservatively, seeking to consistently outperform our benchmarks while minimizing crediting rate volatility
Key Investment Objectives:
• Capital preservation
• Maintain sufficient liquidity
• Consistently outperform benchmarks and peer groupConsistently outperform benchmarks and peer group
Hallmarks of Our Investment Approach:
• High quality and broad diversificationg q y
• Disciplined value investing
• Stringent risk control
• Minimal crediting rate volatility
Our investment approach is ideally suited to stable value
11 City of Los Angeles

Third Quarter 2011 City of Los Angeles Stable Value FundThird Quarter 2011
Galliard Inception Date July 1, 1999
Investment Objective
Benchmark
Stable Value Portfolio Components Components Allocation Range
To provide safety of principal and consistency of returns with minimal volatility, while maintaining a stable credited rate of interest.
3 Year Constant Maturity Treasury Yield + 50 basis points
p p g
Cash Equivalents 2-50%
Security Backed Contracts 50-98%
Key Portfolio Guidelines P tf li D ti 2 0 3 5 Y T t f 3 0 Y Portfolio Duration 2.0 - 3.5 Years, Target of 3.0 Years
Minimum Portfolio Quality AA/Aa2 (underlying asset level)Minimum Portfolio Issue Quality Investment grade at the time of purchase
12 City of Los Angeles Stable Value Fund

***
***
13 City of Los Angeles Stable Value Fund
Third Quarter 2011
Periods Ending September 30, 2011Annualized Investment Performance*
3Q'11 YTD 1 Yr 3 Yr 5 Yr 10 YrSince
Inception**
Calendar Year Performance
2010 2009 2008 2007 2006
Returns for periods of less than one year are not annualized.Prior to July 1, 2008, the portfolio was invested exclusively in the Wells Fargo Stable Return Fund, a stable value collective fund. Since inception returns only include separate account returns.50% Citigroup 3 Month T-Bill/50% Merrill Lynch 1-3 Year Treasury Index through 6/30/2008 linked with 3 Year Constant Maturity Treasury Yield + 50 basis points from 7/1/2008.
Market Indices
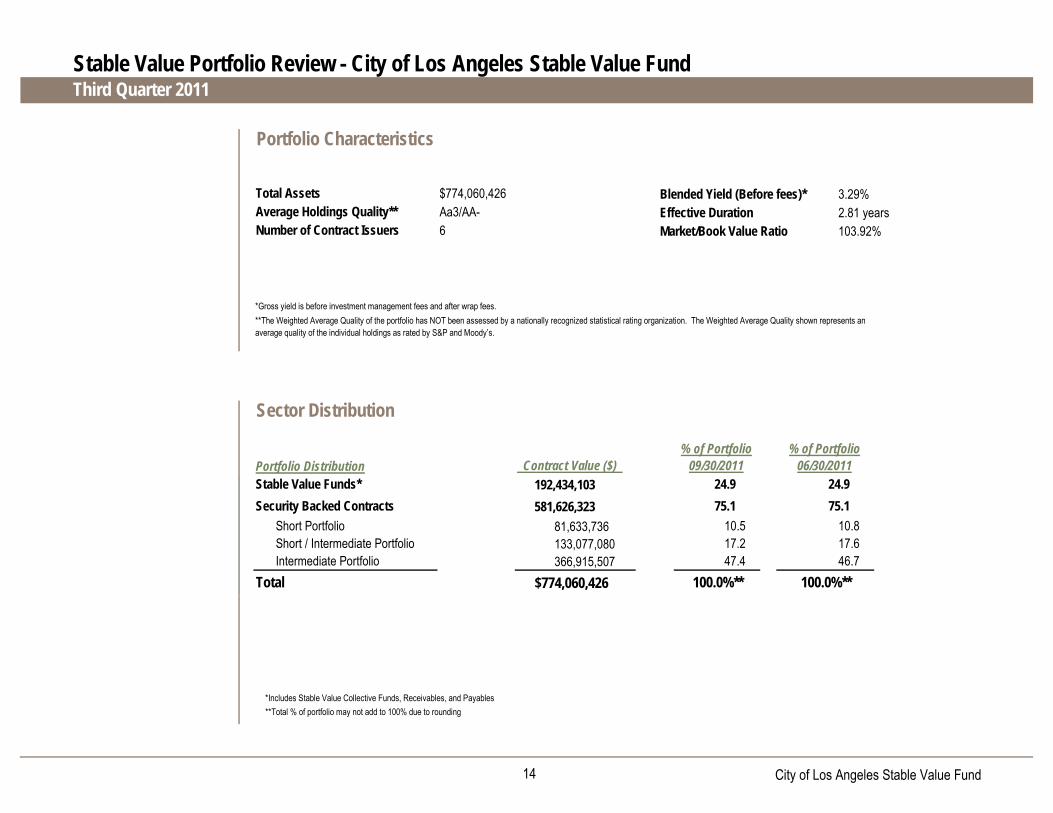
Stable Value Portfolio Review - City of Los Angeles Stable Value Fund
Merrill Lynch 3 Mo. T-Bill 0.13 0.21 2.06 5.03 4.83
Consumer Price Index 1.41 2.72 0.09 4.08 2.54
Portfolio (before inv. Mgmt. fees) 0.84 2.47 3.43 3.95 --- --- 4.04
Portfolio (net of inv. Mgmt. fees) 0.81 2.40 3.34 3.85 4.23 4.49 3.94
Benchmark*** 0.24 1.02 1.34 1.69 2.90 2.71 1.79
Portfolio (before inv. Mgmt. fees) 3.77 4.30 --- --- ---
Portfolio (net of inv. Mgmt. fees) 3.67 4.19 4.82 4.84 4.64
Benchmark*** 1.61 1.93 2.88 6.04 4.35
14 City of Los Angeles Stable Value Fund
Blended Yield (Before fees)* 3.29% Effective Duration 2.81 yearsMarket/Book Value Ratio 103.92%
Portfolio Distribution
192,434,103
581,626,323 81,633,736 133,077,080 366,915,507 $774,060,426
*Includes Stable Value Collective Funds, Receivables, and Payables **Total % of portfolio may not add to 100% due to rounding
*Gross yield is before investment management fees and after wrap fees.
Contract Value ($)
**The Weighted Average Quality of the portfolio has NOT been assessed by a nationally recognized statistical rating organization. The Weighted Average Quality shown represents an average quality of the individual holdings as rated by S&P and Moody’s.
75.1Short Portfolio 10.5 10.8Short / Intermediate Portfolio 17.2 17.6Intermediate Portfolio
Stable Value Portfolio Review - City of Los Angeles Stable Value FundThird Quarter 2011
Portfolio Characteristics
Total Assets $774,060,426Average Holdings Quality**Number of Contract Issuers 6
Aa3/AA-
09/30/2011% of Portfolio % of Portfolio
06/30/2011
Sector Distribution
Stable Value Funds* 24.9 24.9Security Backed Contracts 75.1
47.4 46.7Total 100.0%** 100.0%**

15 City of Los Angeles Stable Value Fund
Historical Crediting Rates*
*As of quarter end. Before fees.
Contract Quality Distribution*
*Total % of portfolio may not add to 100% due to rounding. The Weighted Average Quality shown represents an average quality of the individual holdings as rated by S&P, Moody’s and Fitch.**Total % of portfolio may not add to 100% due to rounding.
Market Value to Book Value Ratio*
Stable Value Portfolio Review - City of Los Angeles Stable Value FundThird Quarter 2011
Underlying Duration Distribution**
4.09 3.87 3.78 3.78 3.73 3.663.29 3.27 3.29
0
1
2
3
4
5
6
Cred
iting R
ate (%
)
101.47 101.13102.09
103.22104.24
102.86 102.69103.37 103.92
94
96
98
100
102
104
106
MV/B
V Ra
tio (%
)
0.0 0.0
35.3
24.9
29.8
10.1
0.00
5
10
15
20
25
30
35
40
% o
f Por
tfolio
18.3
40.8
26.8
14.0
0
5
10
15
20
25
30
35
40
45
% o
f Por
tfolio

16 City of Los Angeles Stable Value Fund
Portfolio Distribution*
*Book value**Includes Stable Value Collective Funds, Receivables, and Payables
Underlying Fixed Income Credit Quality* Underlying Fixed Income Asset Allocation**
*Market value. Total % of portfolio may not add to 100% due to rounding. The Weighted Average Quality shown represents an average quality of the individual holdings as rated by S&P, Moody’s and Fitch.
**Market value. Total % of portfolio may not add to 100% due to rounding.
Stable Value Portfolio Review - City of Los Angeles Stable Value FundThird Quarter 2011
24.9%
10.5%
17.2%
47.4%
Stable Value Funds**
Short Portfolio
Short / Intermediate Portfolio
Intermediate Portfolio
17.06.2
20.02.6
31.70.4
5.50.5
4.32.5
0.88.5
U.S. Treasury/AgencyOther U.S. Government
CorporatesTaxable Municipals
Agency MBSNon-Agency MBS
CMBSMunicipal MBS
Asset BackedIntl Government/Agency
GICsCash/Equivalents
76.6
8.2
10.7
4.2
0.4
AAA
AA
A
BBB
<BBB

Third Quarter 2011 Stable Value Portfolio Review - City of Los Angeles Stable Value FundThird Quarter 2011
14
Historical Cashflows
02468
1012
t Cas
h Flo
w (M
illion
s $)
-6-4-20
Oct-0
8
Nov-0
8
Dec-0
8
Jan-
09
Feb-
09
Mar-0
9
Apr-0
9
May-0
9
Jun-
09*
Jul-0
9
Aug-
09
Sep-
09
Oct-0
9
Nov-0
9
Dec-0
9
Jan-
10
Feb-
10
Mar-1
0
Apr-1
0
May-1
0
Jun-
10
Jul-1
0
Aug-
10
Sep-
10
Oct-1
0
Nov-1
0
Dec-1
0
Jan-
11
Feb-
11
Mar-1
1
Apr-1
1
May-1
1
Jun-
11
Jul-1
1
Aug-
11
Sep-
11
Net
*P ti i t hfl l
YTD 2010 2009 2008 2007 2006
*Participant cashflows only
YTD 2010 2009 2008 2007 2006Beginning Assets $714.8 $655.7 $161.6 $121.7 $118.7 $115.6Net Cash Flow ($)* $41.7 $34.4 $477.8*** $33.3 -$2.7 -$2.4Net Cash Flow (%) 5.83% 5.25% 295.67% 27.36% -2.27% -2.08%Estimated Investment Earnings $17.6 $24.7 $16.2 $6.6 $5.7 $5.4
$ $ $ $ $ $Ending Assets** $774.1 $714.8 $655.7 $161.6 $121.7 $118.7
*Contributions, Withdraw als and Inv estment Transfers**Cashflow s may not net to final assets due to rounding***Includes cashflow s due to merger of inv estment options
17 City of Los Angeles Stable Value Fund

Stable Value Portfolio Review - City of Los Angeles Stable Value FundThird Quarter 2011
Issuer Rating Summary
S & P Rating Moody’s Rating9/30/2011 6/30/2011 9/30/2011 6/30/20119/30/2011 6/30/2011 9/30/2011 6/30/2011
ING Life Ins. and Annuity Co.J.P. Morgan Chase Bank N.A.Monumental Life Ins. Co.Pacific Life Ins. Co.
AAA-AA-A+
AAA-AA-A+
A2Aa1A1A1
A2Aa1A1A1
ING Life Ins. and Annuity Co.C it l l l i d tl b l i d t
Pacific Life Ins. Co.Sli htl b t i ki t i
Prudential Life Ins. Co.State Street Bank and Trust Co.
AA-AA-
AA-AA-
A2Aa2
A2Aa2
• Capital levels remain modestly below industry average• Longer-term uncertainty due to parent's plan for IPO of US• operations in the next 2 years• Expect stability in the operating results and credit quality• ratings over the near termJ.P. Morgan Chase Bank N.A.
St bilit lti f t it l d li idit l l
• Slightly above average exposure to riskier assets is more• than offset by surplus levels that are well above average• Earnings remain solid and continue to boost surplus• Conservative leverage profile relative to peersPrudential Life Ins. Co.• A leading diversified U.S. life insurer
R t l di id d t t t it l• Stability resulting from strong capital and liquidity levels• Credit quality showing improvement with better NPAs and NCOs• Dodd-Frank and Basel 3 introduce some uncertainty for the• banking industryMonumental Life Ins. Co.• Parent (AEGON) fully repaid Dutch government aid in 2Q11
C
• Recent large dividend to parent put some pressure on capital• levels • Higher than industry average investment risk with exposure• to commercial real estate, non-Agency CMOs, equities and• high yield bondsState Street Bank and Trust Co.
O• Capital levels remain below average, but are improving• Strong operating earnings through the first half of the year• after a flat 2010
• Operating earnings have been more resilient than most• commercial banks• Strong capital and liquidity levels and fee-based revenue• stream• Off balance sheet conduit issues are behind them -• unrealized losses in their investment portfolio are down
City of Los Angeles Stable Value Fund18

Period: 7/1/2011 - 9/30/2011
Transaction ReportCity of Los Angeles Stable Value Fund Portfolio Review
S&PRating
TradeDate
SettleDate
Par AmountIssuerCUSIP Maturity Moody'sRating
*
PurchasesSecurity Backed Contracts
Intermediate Portfolio
744999AR4 14,000,000 N.S.M. 09/01/2011 09/01/2011 AA- A2Prudential Life Ins. Co.
Total Intermediate Portfolio 14,000,000
14,000,000Total Security Backed Contracts
Total Purchases 14,000,000
* N.S.M. = No Stated Maturity

Portfolio Holdings
MaturityContractValue ($)
S&PRating
Moody'sRating
EffectiveDuration (yrs)
CreditingRate / Yield (%)
% ofPortfolio
Portfolio Distribution
September 30, 2011
*
City of Los Angeles Stable Value Fund Portfolio Review
Money MarketCash Receivable / (Payable) -324,955 0.0 AAA Aaa0.102.37
Total Money Market -324,955 0.0 0.10 AaaAAA2.37
Stable Value FundsWells Fargo Stable Return Fund G 192,759,059 24.9 AA- Aa22.102.37
Total Stable Value Funds 192,759,059 24.9 2.10 Aa2AA-2.37
Security Backed Contracts
Short PortfolioPacific Life Ins. Co. 81,633,736 10.5 A+ A11.93N.S.M.2.81
Total Short Portfolio 81,633,736 10.5 1.93 A1A+2.81
Short / Intermediate PortfolioState Street Bank and Trust Co. 52,782,500 6.8 AA- Aa22.95N.S.M.3.53
J.P. Morgan Chase Bank N.A. 80,294,580 10.4 AA- Aa12.95N.S.M.3.14
Total Short / Intermediate Portfolio 133,077,080 17.2 2.95 Aa1AA-3.29
Intermediate PortfolioING Life Ins. and Annuity Co. 77,945,713 10.1 A A23.74N.S.M.4.48
Prudential Life Ins. Co. 149,318,952 19.3 AA- A23.14N.S.M.3.20
Monumental Life Ins. Co. 60,153,593 7.8 AA- A13.15N.S.M.4.08
Monumental Life Ins. Co. 79,497,249 10.3 AA- A13.40N.S.M.4.37
Total Intermediate Portfolio 366,915,507 47.4 3.32 A2AA-3.87
Total Security Backed Contracts 581,626,323 75.1 3.04 A1AA-3.59
Total Fund AA- Aa32.81100.0 3.29774,060,426
* N.S.M. = No Stated Maturity

City of Los AngelesAccount Overview
2010
• Migrated underlying broad market portfolio to an intermediate strategy to improve
i k/ t fil d dd id i trisk/return profile and address wrap provider requirements
• As wrap capacity improves, we will look to add additional external managers
20112011
• Working with wrap providers on equity wash needs due to brokerage window
• Looking to add new external manager to enhance diversification in the near future
Working with staff and Mercer on scenario analysis on the “what ifs” of various• Working with staff and Mercer on scenario analysis on the “what ifs” of various
Europe events
• Will be working with staff and Mercer on potential guideline updates
21 City of Los Angeles


![SECURITIZED MORTGAGE TRUSTS [Condedential] (Pandoras Box?)](https://img.pdfslide.us/doc/110x75/55cf8efd550346703b97c411/securitized-mortgage-trusts-condedential-pandoras-box.jpg)