Embed Size (px)
Citation preview
DISCLOSURE APPENDIX AT THE BACK OF THIS REPORT CONTAINS IMPORTANT DISCLOSURES AND
ANALYST CERTIFICATIONS.
CREDIT SUISSE SECURITIES RESEARCH & ANALYTICS BEYOND INFORMATION®
Client-Driven Solutions, Insights, and Access
Global Securitized Products Weekly Securitized Products Strategy
Agency MBS
With a somewhat dovish FOMC statement, we maintain a tactical overweight. With
ECB’s QE announcement, Greek elections and the FOMC in the rearview mirror, we
see room for volatility to decline, supporting basis performance. We expect a low
probability of base g-fee reduction, and significant probability of the 25bp upfront
adverse market delivery fee being dropped and/or a targeted reduction of LLPA for low
FICO/high LTV borrowers. STACR 2015-DN1 pricing corroborates our earlier analysis
suggesting limited room to lower base g-fees. Net issuance of GNMA MBS backed by
FHA loans has turned negative due to elevated FHA-to-conventional refi activity. We
estimate the volume at roughly $50B in 2014, 5-6 CPR in FHA speeds and roughly 3-4
CPR to overall GN speeds. The refi index should slip gradually for unchanged
mortgage rates, rise slightly (100-200 points) for a modest rate rally (~5bp), increase to
a 3800-4000 range in a 25bp rally, and rise to a 4500-5000 range for a 50bp rally.
Non-Agency MBS
Last Friday saw a fast and furious news cycle for Ocwen and HLSS. In the morning,
BlueMountain delivered a notice of default to the trustee on two HSART series; in the
afternoon, RMBS investors filed a notice of non-performance for 119 trusts and the CA
DBO settled its claims from two weeks ago. After recapping the events that have
occurred over the last week, we revisit our framework approach introduced two weeks
ago to help RMBS investors think about the ramifications of an Ocwen setback.
CMBS
The CMBS market continues to perform very well, on a relative basis, as it remains
largely immune from the macro-led volatility that has affected other financial markets,
including corporate bonds and equities. Investors are certainly attempting to
differentiate more between recently issued bonds, based on perceived credit quality,
subordination levels and rating agency assignments. The latest set of CMBX indices,
CMBX.8, started trading this past Monday and the launch was met with decent
trading volumes. The 60+-day legacy conduit delinquency rate fell 1 bp to 8.7% in
January, as the monthly changes have once again taken on a little bit of a see-saw
pattern of ups and downs. Credit seems to have stabilized, however. We count over
$1.3 billion of legacy loan liquidations in the January remittance period while
$3.0 billion was defeased.
European Update
There have been no new public pricings this week with only a retained transaction
(French consumer loan ABS) being structured and pricing. The current pipeline
includes a UK auto loan ABS deal and Italian CMBS. Please refer to the European
Update for more information.
Research Analysts
GLOBAL HEAD
Roger Lehman +1 212 325 2123 [email protected]
AGENCY MBS
Mahesh Swaminathan +1 212 325 8789 [email protected]
Qumber Hassan +1 212 538 4988 [email protected]
Glenn Russo +1 212 538 6881 [email protected]
NON-AGENCY MBS/CONSUMER ABS
Marc Firestein +1 212 325 4379 [email protected]
Jonathan Corwin +1 212 538 6490 [email protected]
CMBS
Roger Lehman +1 212 325 2123 [email protected]
Sylvain Jousseaume, CFA +1 212 325 1356 [email protected]
Serif Ustun, CFA +1 212 538 4582 [email protected]
EUROPEAN UPDATE
Helen Haworth +44 20 7888 0757 [email protected]
Carlos Diaz +44 20 7888 2414 [email protected]
Marion Pelata +44 20 7883 1333 [email protected]
MODELING AND ANALYTICS
David Zhang +1 212 325 2783 [email protected]
Table of Contents
Core Views 2
Agency MBS 3
Non-Agency MBS 11
CMBS 16
European Update 38
28 January 2015
Fixed Income Research
http://www.credit-suisse.com/researchandanalytics
FOR INSTITUTIONAL CLIENT USE ONLY
28
Ja
nu
ary
20
15
Glo
bal S
ecuritiz
ed
Pro
ducts
Weekly
2
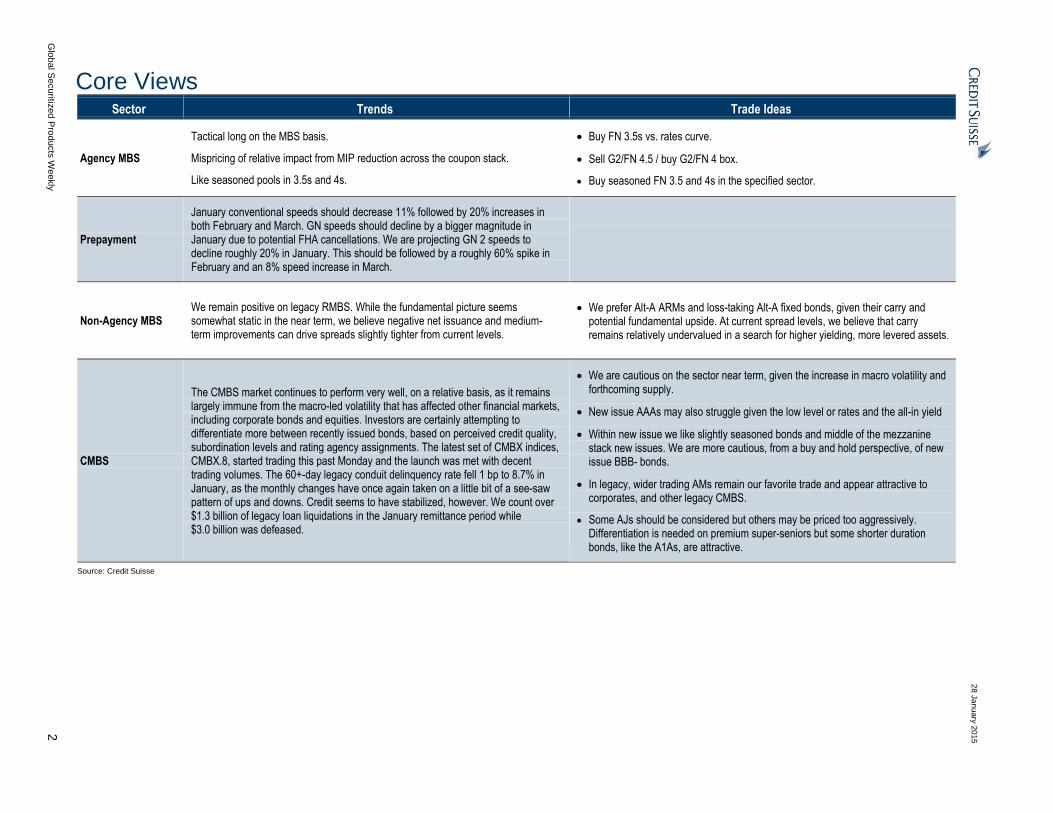
Core Views Sector Trends Trade Ideas
Agency MBS
Tactical long on the MBS basis.
Mispricing of relative impact from MIP reduction across the coupon stack.
Like seasoned pools in 3.5s and 4s.
Buy FN 3.5s vs. rates curve.
Sell G2/FN 4.5 / buy G2/FN 4 box.
Buy seasoned FN 3.5 and 4s in the specified sector.
Prepayment
January conventional speeds should decrease 11% followed by 20% increases in both February and March. GN speeds should decline by a bigger magnitude in January due to potential FHA cancellations. We are projecting GN 2 speeds to decline roughly 20% in January. This should be followed by a roughly 60% spike in February and an 8% speed increase in March.
Non-Agency MBS We remain positive on legacy RMBS. While the fundamental picture seems somewhat static in the near term, we believe negative net issuance and medium-term improvements can drive spreads slightly tighter from current levels.
We prefer Alt-A ARMs and loss-taking Alt-A fixed bonds, given their carry and potential fundamental upside. At current spread levels, we believe that carry remains relatively undervalued in a search for higher yielding, more levered assets.
CMBS
The CMBS market continues to perform very well, on a relative basis, as it remains largely immune from the macro-led volatility that has affected other financial markets, including corporate bonds and equities. Investors are certainly attempting to differentiate more between recently issued bonds, based on perceived credit quality, subordination levels and rating agency assignments. The latest set of CMBX indices, CMBX.8, started trading this past Monday and the launch was met with decent trading volumes. The 60+-day legacy conduit delinquency rate fell 1 bp to 8.7% in January, as the monthly changes have once again taken on a little bit of a see-saw pattern of ups and downs. Credit seems to have stabilized, however. We count over $1.3 billion of legacy loan liquidations in the January remittance period while $3.0 billion was defeased.
We are cautious on the sector near term, given the increase in macro volatility and forthcoming supply.
New issue AAAs may also struggle given the low level or rates and the all-in yield
Within new issue we like slightly seasoned bonds and middle of the mezzanine stack new issues. We are more cautious, from a buy and hold perspective, of new issue BBB- bonds.
In legacy, wider trading AMs remain our favorite trade and appear attractive to corporates, and other legacy CMBS.
Some AJs should be considered but others may be priced too aggressively. Differentiation is needed on premium super-seniors but some shorter duration bonds, like the A1As, are attractive.
Source: Credit Suisse
28 January 2015
Global Securitized Products Weekly 3
Agency MBS Strategy FOMC statement somewhat dovish, maintain tactical overweight. With ECB’s QE
announcement, Greek elections and the FOMC in the rearview mirror, we see room for
volatility to decline, supporting basis performance. We acknowledge the risk from a
continued rally and an additional refi risk premium build-up.
FHFA Director Mel Watt’s testimony points to g-fee decision by Q1-end, single
security structure by year-end. We expect a low probability of base g-fee reduction, and
significant probability of the 25bp upfront adverse market delivery fee being dropped
and/or a targeted reduction of LLPA for low FICO/high LTV borrowers. STACR 2015-DN1
pricing corroborates our earlier analysis suggesting limited room to lower base g-fees.
Net issuance of GNMA MBS backed by FHA loans has turned negative due to
elevated FHA-to-conventional refi activity. We estimate the volume at roughly $50B
in 2014 and find that this contributes approximately 5-6 CPR to FHA speeds and roughly
3-4 CPR to overall GN speeds.
The refi index should slip gradually for unchanged mortgage rates, rise slightly
(100-200 points) for a modest rate rally (~5bp), increase to a 3800-4000 range in a 25bp
rally (3.375 mortgage rate), and rise to a 4500-5000 range for a 50bp rally (3.125%
mortgage rate), with a higher probability of tracking the lower end of that range.
We recommend scaling into a box trade by selling the G2/FN 4.5 vs. buying the
G2/FN 4 swap due to potential mispricing of the recently announced 50bp MIP reduction
in the former. The cheapening across the G2 coupon stack appears to be in line with our
previously published estimates, except in the case of G2 4.5s, which appear to be
underpricing the potential impact of MIP reduction by eight ticks. Furthermore, we see
downside risk to G2 4.5s relative to our price impact estimate based on historical prepay
experience of pre-May G2 4.5s following MIP grandfathering in June 2012.
Trade recommendations Buy FN 3.5s vs. the swap curve (Buy $33MM FN 3.5s vs. $20.8MM / $8.7MM /
$5.3MM in 2- / 5- / 10-year swaps) on expectations of a range trade in rates and a
decline in volatility following the passage of two key event risks including ECB QE
announcement and Greek elections (26 January 2015, MBS Trade Note). This trade is
up roughly one tick.
Sell G2/FN 4.5/buy G2/FN 4 box ($50MM of each swap hedged one-for-one) due to
potential mispricing of the recently announced 50bp MIP reduction in the 4.5 swap
(26 January 2015, MBS Trade Note). This trade is up roughly one tick.
Closed long FN 4.5/3.5 swap at a profit of 8.2 ticks (23 January 2015, MBS Trade Note).
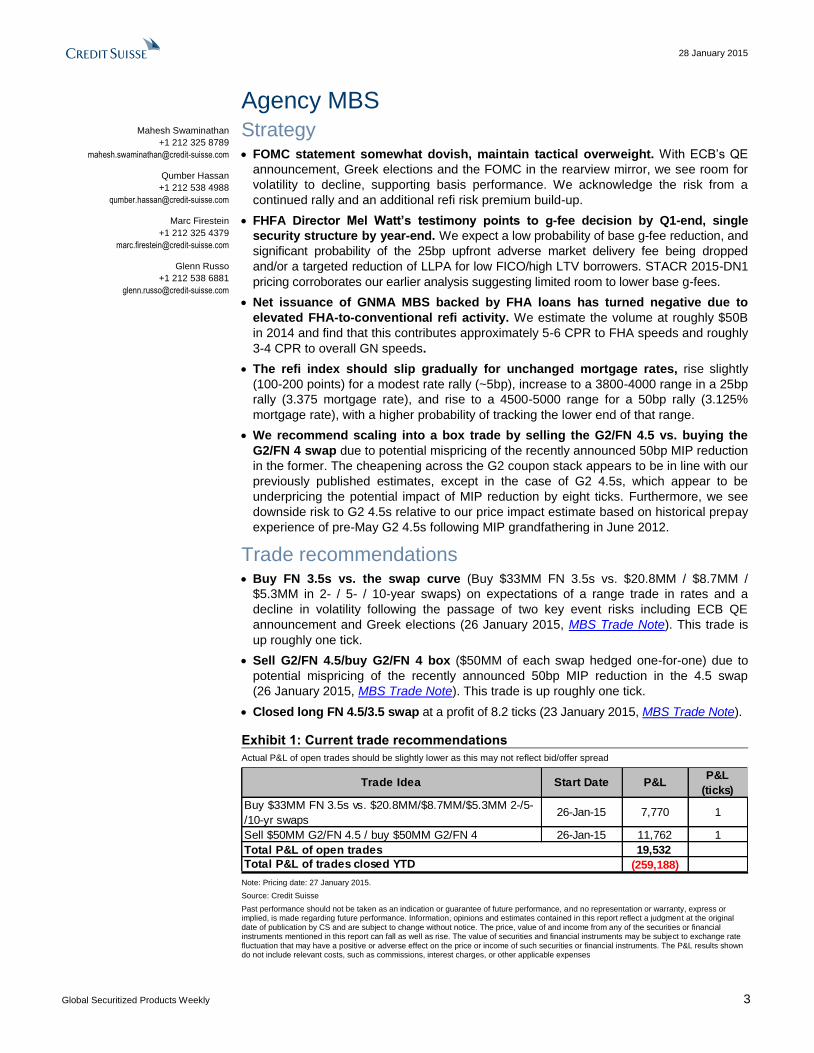
Exhibit 1: Current trade recommendations
Actual P&L of open trades should be slightly lower as this may not reflect bid/offer spread
Trade Idea Start Date P&LP&L
(ticks)
Buy $33MM FN 3.5s vs. $20.8MM/$8.7MM/$5.3MM 2-/5-
/10-yr swaps26-Jan-15 7,770 1
Sell $50MM G2/FN 4.5 / buy $50MM G2/FN 4 26-Jan-15 11,762 1
Total P&L of open trades 19,532
Total P&L of trades closed YTD (259,188)
Note: Pricing date: 27 January 2015.
Source: Credit Suisse
Past performance should not be taken as an indication or guarantee of future performance, and no representation or warranty, express or implied, is made regarding future performance. Information, opinions and estimates contained in this report reflect a judgment at the original date of publication by CS and are subject to change without notice. The price, value of and income from any of the securities or financial instruments mentioned in this report can fall as well as rise. The value of securities and financial instruments may be subject to exchange rate fluctuation that may have a positive or adverse effect on the price or income of such securities or financial instruments. The P&L results shown do not include relevant costs, such as commissions, interest charges, or other applicable expenses
Mahesh Swaminathan
+1 212 325 8789
Qumber Hassan
+1 212 538 4988
Marc Firestein
+1 212 325 4379
Glenn Russo
+1 212 538 6881
28 January 2015
Global Securitized Products Weekly 4
FOMC statement somewhat dovish, maintain tactical overweight
We maintain a tactical overweight on MBS initiated Monday (26 January 2015 MBS Trade
Note). Last week we argued that MBS had cheapened to the point that finding a trading
range would offer upside potential. We noted waiting for the passage of ECB’s QE
announcement and Greek elections before turning more constructive. With those events,
plus the FOMC in the rearview mirror, we see room for volatility to decline, supporting
basis performance. Furthermore, the relatively narrow range on 10-year Treasury yields
since mid-January opens the door for establishing a new rate range. However, we
recognize that Wednesday’s sharp rally potentially delays this process.
Wednesday’s FOMC statement mentions “solid growth” in the US economy, keeping a
June 2015 rate hike on the table. At the same time, the FOMC downgraded the
characterization of market-based inflation measures as having declined “substantially,”
and expanded the variables it is monitoring to include “international developments.” The
latter two shifts in language create optionality to delay the start of hikes if global data
worsen. Taken together, the FOMC has cast a somewhat dovish outlook.
The MBS coupon stack (FN 3s through 4.5s) has cheapened 1+ to 3 ticks vs. the swap
curve (2s/5s/10s) on Wednesday on the heels of the rally in rates. A continuation of this
rally could put further downside pressure on the basis by refocusing market attention on a
push toward lows in mortgage rates and an additional build-up of refi risk premium. That
said, considering the magnitude of the rate rally, we see the resilience of MBS on
Wednesday as a positive and hold our long recommendation.
FHFA Director Mel Watt’s testimony takeaways – g-fee decision by Q1 end, single security structure by year-end, low probability of base g-fee reduction
Director Watt on Tuesday presented to the House Financial Services Committee on the
state of GSE conservatorship and ongoing initiatives.
Key takeaways include the following:
(1) Significant progress made in 2014 on the single security initiative for Fannie and
Freddie MBS. GSEs to finalize the single security structure by 2015 end and begin a
“multi-year” implementation process.
(2) Reviewing input received on potential g-fee changes with a decision expected by end of
Q1 or potentially early Q2. The decision will incorporate safety, soundness, and credit
access considerations. The director did not explicitly suggest a direction for the decision.
(3) We think there is a low probability of changing the base g-fee (<10%), significant
probability (50%+) of the 25bp upfront adverse market delivery fee (AMDC) being
dropped. Additionally, there is potential for a targeted reduction in LLPA for high
LTV/low FICO borrowers (50+%). In addition to our detailed analysis in 15 January
2015 Global Securitized Products Weekly, the recent pricing of Freddie Mac’s STACR
2015-DN1 also supports the idea that there is little room to reduce base g-fees
(Exhibit 2).
(4) Director Watt’s answer to a question on FHLB membership rules changes noted that
the overwhelming majority of responses to a request for input favored maintaining the
status quo prior to FHFA’s recent shift. This opens the door to the possibility that he
may ease up on his restrictive guidance late last year. If such restrictions on captive
insurer membership are eased, it would most directly benefit some REITs (and would
encourage more) which access FHLB funding through this channel.
28 January 2015
Global Securitized Products Weekly 5
(5) The FHFA Director strongly defended the GSEs offering a 3% down payment product.
He also pushed back against arguments that contributions to affordable housing funds
were adversely affecting GSE capital, noting that Congress can address capital
requirements through GSE reform.
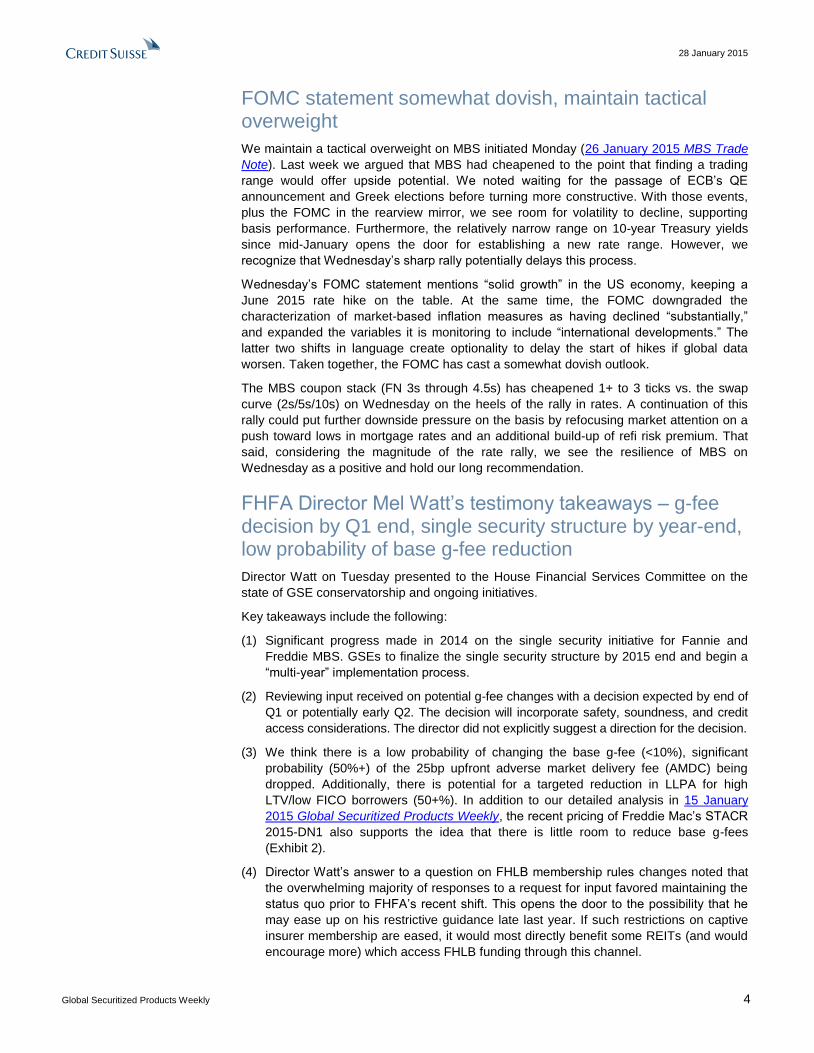
Exhibit 2: STACR 2015-DN1 pricing points to minimal room to reduce base g-fees
Pricing date: 28 January 2015
Freddie Mac's cost of buying credit protection (bp)
M1 1 A = 125*1.00%
M2 2 B = 240*1.00%
M3 6 C = 415*1.50%
B Tranche 12 D = 1150*1.0%
Subtotal 1 21 E = A + B + C + D
Structural estimates
Value of 10-yr final 3 F = 300*1.0% (assume B prices 300 wider)
Subtotal 2 24 G = E + F
Miscellaneous
Payroll tax and GSE operational costs 18 H = 10bp payroll tax + 8bp GSE operational cost
Total 42 I = G + H
Reconciling STACR 2015-DN1 and GSE g-fee pricing
Source: Credit Suisse
Quantifying FHA-to-conventional - $50B annual volume; 5-6 CPR speed impact
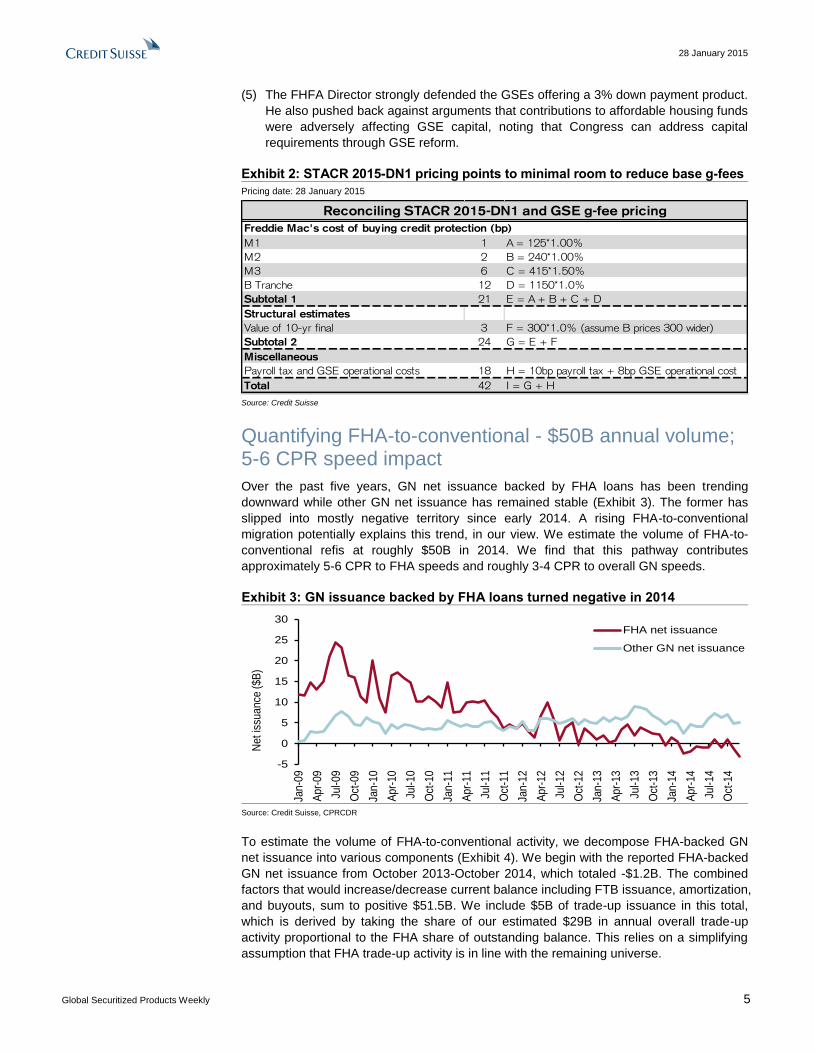
Over the past five years, GN net issuance backed by FHA loans has been trending
downward while other GN net issuance has remained stable (Exhibit 3). The former has
slipped into mostly negative territory since early 2014. A rising FHA-to-conventional
migration potentially explains this trend, in our view. We estimate the volume of FHA-to-
conventional refis at roughly $50B in 2014. We find that this pathway contributes
approximately 5-6 CPR to FHA speeds and roughly 3-4 CPR to overall GN speeds.
Exhibit 3: GN issuance backed by FHA loans turned negative in 2014
-5
0
5
10
15
20
25
30
Jan
-09
Ap
r-09
Jul-
09
Oct
-09
Jan
-10
Ap
r-10
Jul-
10
Oct
-10
Jan
-11
Ap
r-11
Jul-
11
Oct
-11
Jan
-12
Ap
r-12
Jul-
12
Oct
-12
Jan
-13
Ap
r-13
Jul-
13
Oct
-13
Jan
-14
Ap
r-14
Jul-
14
Oct
-14
Net
issu
an
ce (
$B
)
FHA net issuance
Other GN net issuance
Source: Credit Suisse, CPRCDR
To estimate the volume of FHA-to-conventional activity, we decompose FHA-backed GN
net issuance into various components (Exhibit 4). We begin with the reported FHA-backed
GN net issuance from October 2013-October 2014, which totaled -$1.2B. The combined
factors that would increase/decrease current balance including FTB issuance, amortization,
and buyouts, sum to positive $51.5B. We include $5B of trade-up issuance in this total,
which is derived by taking the share of our estimated $29B in annual overall trade-up
activity proportional to the FHA share of outstanding balance. This relies on a simplifying
assumption that FHA trade-up activity is in line with the remaining universe.
28 January 2015
Global Securitized Products Weekly 6
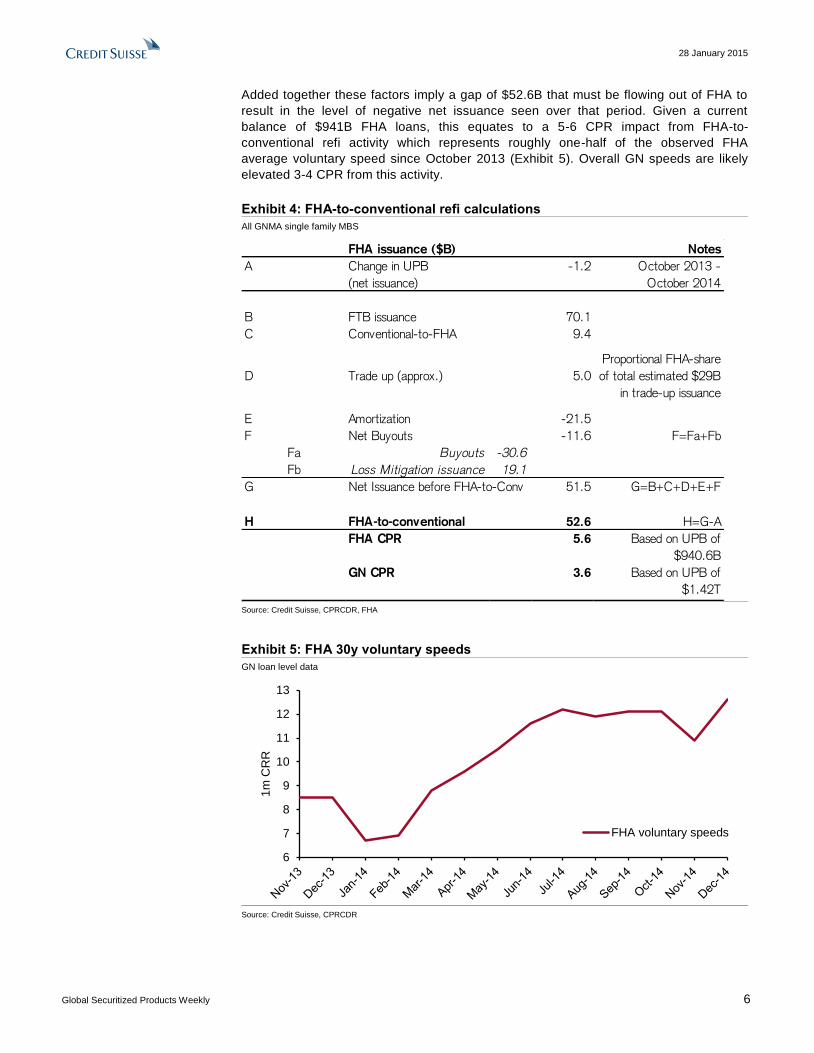
Added together these factors imply a gap of $52.6B that must be flowing out of FHA to
result in the level of negative net issuance seen over that period. Given a current
balance of $941B FHA loans, this equates to a 5-6 CPR impact from FHA-to-
conventional refi activity which represents roughly one-half of the observed FHA
average voluntary speed since October 2013 (Exhibit 5). Overall GN speeds are likely
elevated 3-4 CPR from this activity.
Exhibit 4: FHA-to-conventional refi calculations
All GNMA single family MBS
FHA issuance ($B) Notes
A Change in UPB
(net issuance)
-1.2 October 2013 -
October 2014
B FTB issuance 70.1
C Conventional-to-FHA 9.4
D Trade up (approx.) 5.0
Proportional FHA-share
of total estimated $29B
in trade-up issuance
E Amortization -21.5
F Net Buyouts -11.6 F=Fa+Fb
Fa Buyouts -30.6
Fb Loss Mitigation issuance 19.1
G Net Issuance before FHA-to-Conv 51.5 G=B+C+D+E+F
H FHA-to-conventional 52.6 H=G-A
FHA CPR 5.6 Based on UPB of
$940.6B
GN CPR 3.6 Based on UPB of
$1.42T
Source: Credit Suisse, CPRCDR, FHA
Exhibit 5: FHA 30y voluntary speeds
GN loan level data
6
7
8
9
10
11
12
13
1m
CR
R
FHA voluntary speeds
Source: Credit Suisse, CPRCDR
28 January 2015
Global Securitized Products Weekly 7
Where does the refi index go next?
(Originally published on 28 January 2015)
The MBA reported an 8% weekly decline (to 2572) in its seasonally adjusted conventional
refi index for the week ending 23 January 2015. This has raised questions as to whether
we have already seen the peak in refi response.
We expect the refi index to slip gradually for unchanged mortgage rates, rise slightly (100-
200 points) for a modest rate rally (~5bp), increase to a 3800-4000 range in a 25bp rally
(3.375), and rise to a 4500-5000 range for a 50bp rally (3.125% mortgage rate).
We note that applying a full one-day adjustment for MLK Day (rather than the one-half day
scaling used by the MBA) would result in roughly unchanged levels compared to the prior
week. The correct level of adjustment is uncertain, but we believe that the magnitude of
this adjustment should increase over time (to approach 1) as the holiday is more widely
observed. The other source of uncertainty arises from a 3bp decline in the Freddie Mac
PMMS for the week in contrast to a 3bp increase in the MBA’s 30-year mortgage rate
index. Using the Freddie Mac PMMS rate, our model suggests a roughly unchanged
projection week over week for the 23 January report (Exhibit 6).
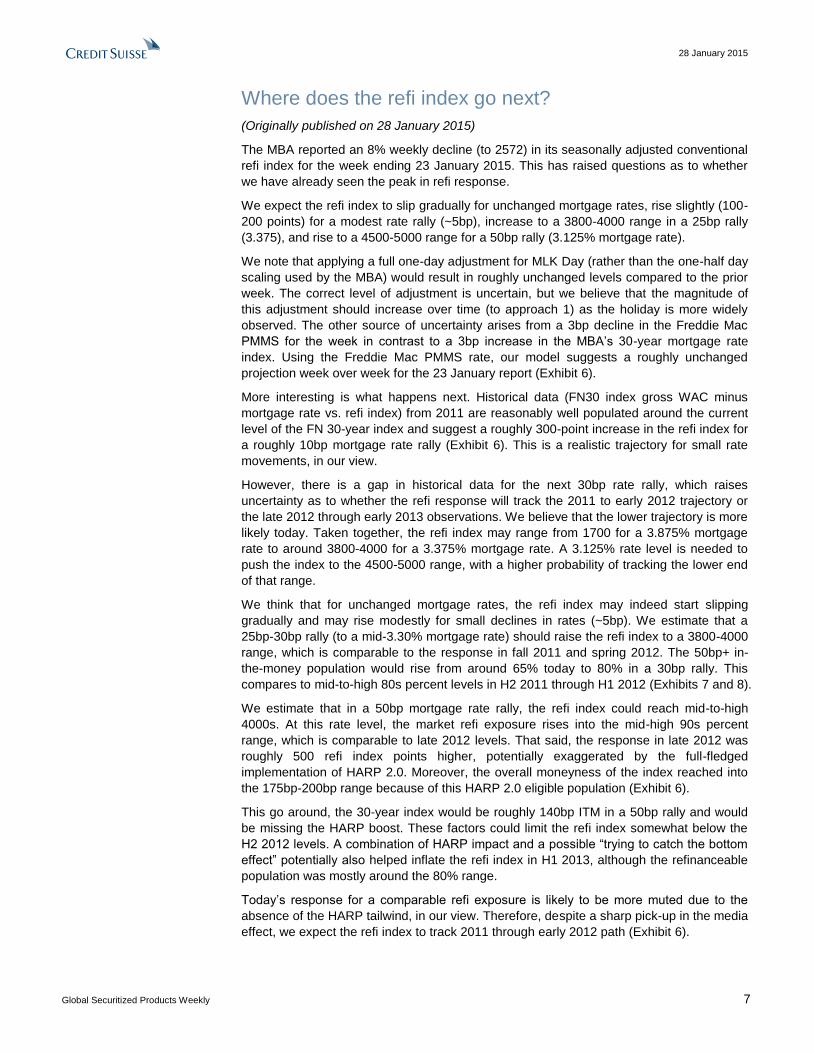
More interesting is what happens next. Historical data (FN30 index gross WAC minus
mortgage rate vs. refi index) from 2011 are reasonably well populated around the current
level of the FN 30-year index and suggest a roughly 300-point increase in the refi index for
a roughly 10bp mortgage rate rally (Exhibit 6). This is a realistic trajectory for small rate
movements, in our view.
However, there is a gap in historical data for the next 30bp rate rally, which raises
uncertainty as to whether the refi response will track the 2011 to early 2012 trajectory or
the late 2012 through early 2013 observations. We believe that the lower trajectory is more
likely today. Taken together, the refi index may range from 1700 for a 3.875% mortgage
rate to around 3800-4000 for a 3.375% mortgage rate. A 3.125% rate level is needed to
push the index to the 4500-5000 range, with a higher probability of tracking the lower end
of that range.
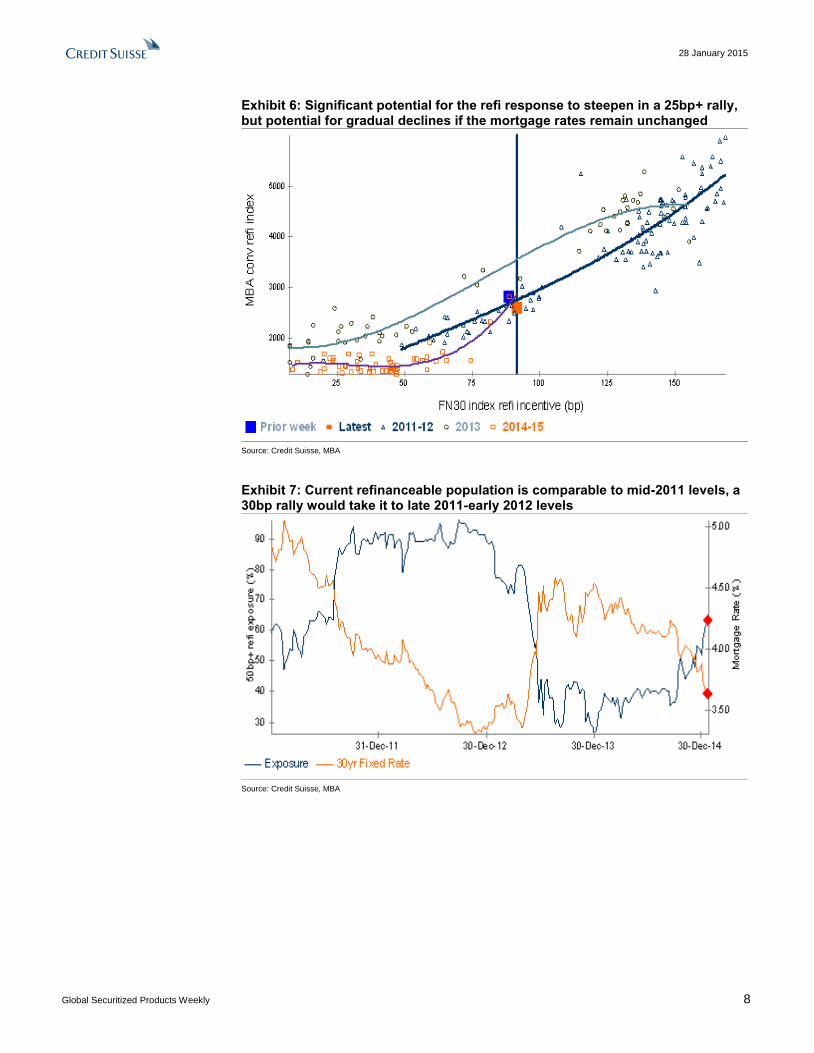
We think that for unchanged mortgage rates, the refi index may indeed start slipping
gradually and may rise modestly for small declines in rates (~5bp). We estimate that a
25bp-30bp rally (to a mid-3.30% mortgage rate) should raise the refi index to a 3800-4000
range, which is comparable to the response in fall 2011 and spring 2012. The 50bp+ in-
the-money population would rise from around 65% today to 80% in a 30bp rally. This
compares to mid-to-high 80s percent levels in H2 2011 through H1 2012 (Exhibits 7 and 8).
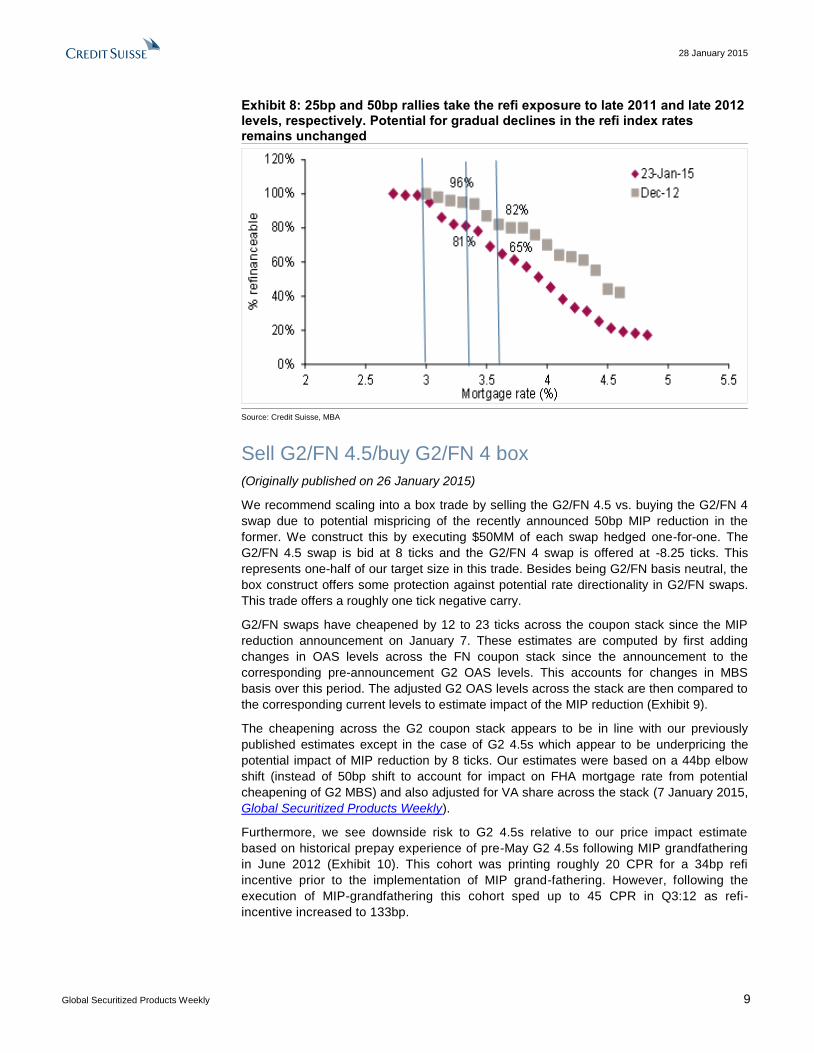
We estimate that in a 50bp mortgage rate rally, the refi index could reach mid-to-high
4000s. At this rate level, the market refi exposure rises into the mid-high 90s percent
range, which is comparable to late 2012 levels. That said, the response in late 2012 was
roughly 500 refi index points higher, potentially exaggerated by the full-fledged
implementation of HARP 2.0. Moreover, the overall moneyness of the index reached into
the 175bp-200bp range because of this HARP 2.0 eligible population (Exhibit 6).
This go around, the 30-year index would be roughly 140bp ITM in a 50bp rally and would
be missing the HARP boost. These factors could limit the refi index somewhat below the
H2 2012 levels. A combination of HARP impact and a possible “trying to catch the bottom
effect” potentially also helped inflate the refi index in H1 2013, although the refinanceable
population was mostly around the 80% range.
Today’s response for a comparable refi exposure is likely to be more muted due to the
absence of the HARP tailwind, in our view. Therefore, despite a sharp pick-up in the media
effect, we expect the refi index to track 2011 through early 2012 path (Exhibit 6).
28 January 2015
Global Securitized Products Weekly 8
Exhibit 6: Significant potential for the refi response to steepen in a 25bp+ rally, but potential for gradual declines if the mortgage rates remain unchanged
Source: Credit Suisse, MBA
Exhibit 7: Current refinanceable population is comparable to mid-2011 levels, a 30bp rally would take it to late 2011-early 2012 levels
Source: Credit Suisse, MBA
28 January 2015
Global Securitized Products Weekly 9
Exhibit 8: 25bp and 50bp rallies take the refi exposure to late 2011 and late 2012 levels, respectively. Potential for gradual declines in the refi index rates remains unchanged
Source: Credit Suisse, MBA
Sell G2/FN 4.5/buy G2/FN 4 box
(Originally published on 26 January 2015)
We recommend scaling into a box trade by selling the G2/FN 4.5 vs. buying the G2/FN 4
swap due to potential mispricing of the recently announced 50bp MIP reduction in the
former. We construct this by executing $50MM of each swap hedged one-for-one. The
G2/FN 4.5 swap is bid at 8 ticks and the G2/FN 4 swap is offered at -8.25 ticks. This
represents one-half of our target size in this trade. Besides being G2/FN basis neutral, the
box construct offers some protection against potential rate directionality in G2/FN swaps.
This trade offers a roughly one tick negative carry.
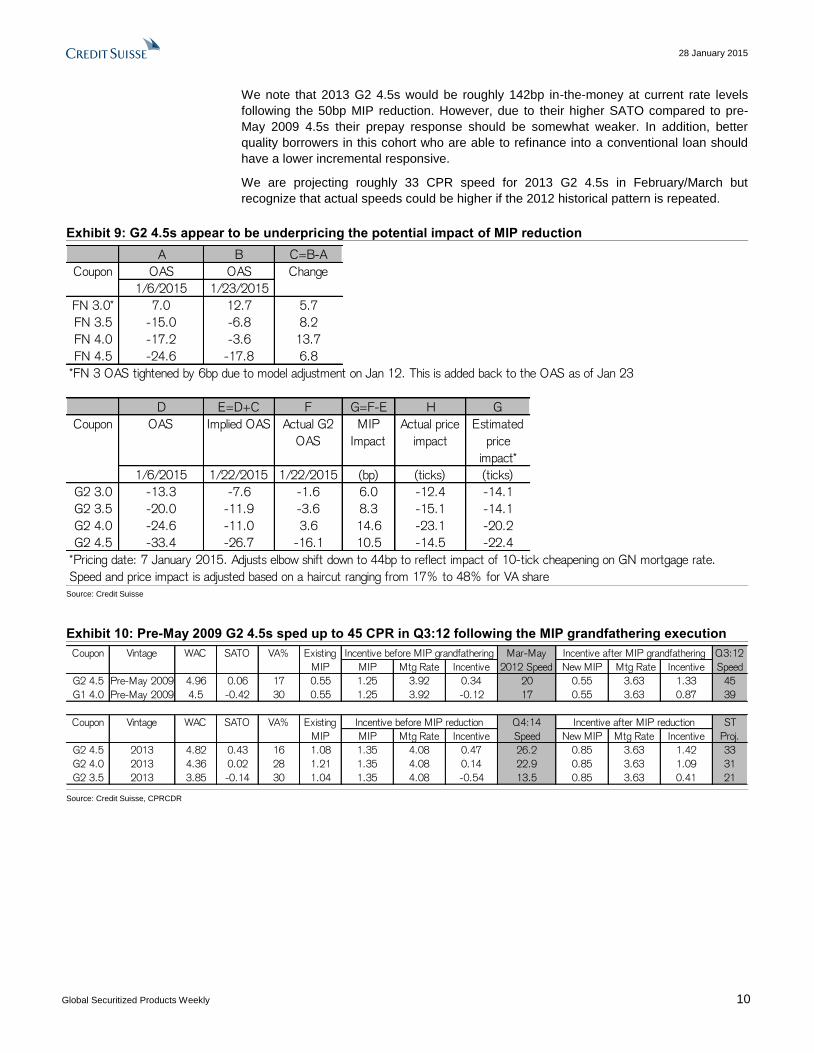
G2/FN swaps have cheapened by 12 to 23 ticks across the coupon stack since the MIP
reduction announcement on January 7. These estimates are computed by first adding
changes in OAS levels across the FN coupon stack since the announcement to the
corresponding pre-announcement G2 OAS levels. This accounts for changes in MBS
basis over this period. The adjusted G2 OAS levels across the stack are then compared to
the corresponding current levels to estimate impact of the MIP reduction (Exhibit 9).
The cheapening across the G2 coupon stack appears to be in line with our previously
published estimates except in the case of G2 4.5s which appear to be underpricing the
potential impact of MIP reduction by 8 ticks. Our estimates were based on a 44bp elbow
shift (instead of 50bp shift to account for impact on FHA mortgage rate from potential
cheapening of G2 MBS) and also adjusted for VA share across the stack (7 January 2015,
Global Securitized Products Weekly).
Furthermore, we see downside risk to G2 4.5s relative to our price impact estimate
based on historical prepay experience of pre-May G2 4.5s following MIP grandfathering
in June 2012 (Exhibit 10). This cohort was printing roughly 20 CPR for a 34bp refi
incentive prior to the implementation of MIP grand-fathering. However, following the
execution of MIP-grandfathering this cohort sped up to 45 CPR in Q3:12 as refi-
incentive increased to 133bp.
28 January 2015
Global Securitized Products Weekly 10
We note that 2013 G2 4.5s would be roughly 142bp in-the-money at current rate levels
following the 50bp MIP reduction. However, due to their higher SATO compared to pre-
May 2009 4.5s their prepay response should be somewhat weaker. In addition, better
quality borrowers in this cohort who are able to refinance into a conventional loan should
have a lower incremental responsive.
We are projecting roughly 33 CPR speed for 2013 G2 4.5s in February/March but
recognize that actual speeds could be higher if the 2012 historical pattern is repeated.
Exhibit 9: G2 4.5s appear to be underpricing the potential impact of MIP reduction
A B C=B-A
Coupon OAS OAS Change
1/6/2015 1/23/2015
FN 3.0* 7.0 12.7 5.7
FN 3.5 -15.0 -6.8 8.2
FN 4.0 -17.2 -3.6 13.7
FN 4.5 -24.6 -17.8 6.8
*FN 3 OAS tightened by 6bp due to model adjustment on Jan 12. This is added back to the OAS as of Jan 23
D E=D+C F G=F-E H G
Coupon OAS Implied OAS Actual G2
OAS
MIP
Impact
Actual price
impact
Estimated
price
impact*
1/6/2015 1/22/2015 1/22/2015 (bp) (ticks) (ticks)
G2 3.0 -13.3 -7.6 -1.6 6.0 -12.4 -14.1
G2 3.5 -20.0 -11.9 -3.6 8.3 -15.1 -14.1
G2 4.0 -24.6 -11.0 3.6 14.6 -23.1 -20.2
G2 4.5 -33.4 -26.7 -16.1 10.5 -14.5 -22.4
*Pricing date: 7 January 2015. Adjusts elbow shift down to 44bp to reflect impact of 10-tick cheapening on GN mortgage rate.
Speed and price impact is adjusted based on a haircut ranging from 17% to 48% for VA share Source: Credit Suisse
Exhibit 10: Pre-May 2009 G2 4.5s sped up to 45 CPR in Q3:12 following the MIP grandfathering execution
MIP Mtg Rate Incentive New MIP Mtg Rate Incentive
G2 4.5 Pre-May 2009 4.96 0.06 17 0.55 1.25 3.92 0.34 20 0.55 3.63 1.33 45
G1 4.0 Pre-May 2009 4.5 -0.42 30 0.55 1.25 3.92 -0.12 17 0.55 3.63 0.87 39
MIP Mtg Rate Incentive New MIP Mtg Rate Incentive
G2 4.5 2013 4.82 0.43 16 1.08 1.35 4.08 0.47 26.2 0.85 3.63 1.42 33
G2 4.0 2013 4.36 0.02 28 1.21 1.35 4.08 0.14 22.9 0.85 3.63 1.09 31
G2 3.5 2013 3.85 -0.14 30 1.04 1.35 4.08 -0.54 13.5 0.85 3.63 0.41 21
Existing
MIP
Incentive before MIP reduction Q4:14
Speed
Incentive after MIP reduction ST
Proj.
Vintage WAC SATO VA%Coupon
Coupon Vintage WAC SATO VA%
Mar-May
2012 Speed
Q3:12
Speed
Incentive after MIP grandfatheringIncentive before MIP grandfatheringExisting
MIP
Source: Credit Suisse, CPRCDR
28 January 2015
Global Securitized Products Weekly 11
Non-Agency MBS Ocwen, revisited – recent activity and impact on RMBS
Last Friday saw a fast and furious news cycle for Ocwen and HLSS. In the morning,
BlueMountain delivered a notice of default to the trustee on two HSART series; in the
afternoon, RMBS investors filed a notice of non-performance for 119 trusts and the CA
DBO settled its claims from two weeks ago. After recapping the events that have occurred
over the last week, we revisit our framework approach introduced two weeks ago to help
RMBS investors think about the ramifications of an Ocwen setback.
A recap of the last week’s activities
On Friday 1/23, hedge fund BlueMountain Capital Management, LLC delivered a
notice of default to the trustee of the HLSS Servicer Advance Receivables Trust
(HSART) Series 2012-T2 and 2013-T3 Notes. BlueMountain alleged that events of
defaults exist as a result of Ocwen’s material breach of Indenture covenants by failing to
“comply with applicable laws and requisite servicing obligations,” breach of warranty due
to the “adverse effect on Ocwen’s business and financial condition” from violations of law,
and inadequate collateralization levels for the Notes.
As evidence of imprudent servicing practices, BlueMountain cited Ocwen’s consent order
with the NYDFS, troubles with the California Department of Business Oversight (CA DBO),
rating agency downgrades and share price declines, among other items. BlueMountain
alleged that these events should trigger an early amortization event and a 3.0% increase
to the interest rate for each Note. In addition, BlueMountain disclosed that it holds short
positions in Ocwen and HLSS.
The press release for this notice can be found here.
Ocwen has since defended itself against the allegations in a letter to the Indenture Trustee.
Also on Friday, Gibbs & Bruns LLP filed a Notice of Non-Performance against Ocwen
for 119 trusts, stating that Ocwen failed to perform as servicer in the following ways:
“Use of Trust funds to “pay” Ocwen’s required “borrower relief” obligations under a
regulatory settlement, through implementation of modifications on Trust-owned
mortgages that have shifted the costs of the settlement to the Trusts and enriched
Ocwen unjustly.
Employing conflicted servicing practices that enriched Ocwen’s corporate affiliates,
including Altisource and Home Loan Servicing Solutions, to the detriment of the Trusts,
investors, and borrowers.
Engaging in imprudent and wholly improper loan modification, advancing, and advance
recovery practices.
Failure to maintain adequate records, communicate effectively with borrowers, or comply
with applicable laws, including consumer protection and foreclosure laws.
Failure to account for and remit accurately to the Trusts cash flows from, and amounts
realized on, Trust-owned mortgages.”
The notice states that the holders’ expert analysts determined “that Trusts serviced by
Ocwen have performed materially worse than Trusts serviced by other servicers.” The notice
also claims that these failures constitute an event of default, and that “[t]he Holders intend to
take further action to recover these losses and protect the Trusts’ assets and mortgages.”
No damage amounts were announced and how this issue would be remedied remains to
be seen. The investors could be seeking remedies such as Ocwen’s removal from the
trusts or potential damage payments. The distribution of any hypothetical payments made
related to this issue remains unclear.
Marc Firestein
+1 212 325 4379
Jonathan Corwin
+1 212 538 6490
28 January 2015
Global Securitized Products Weekly 12
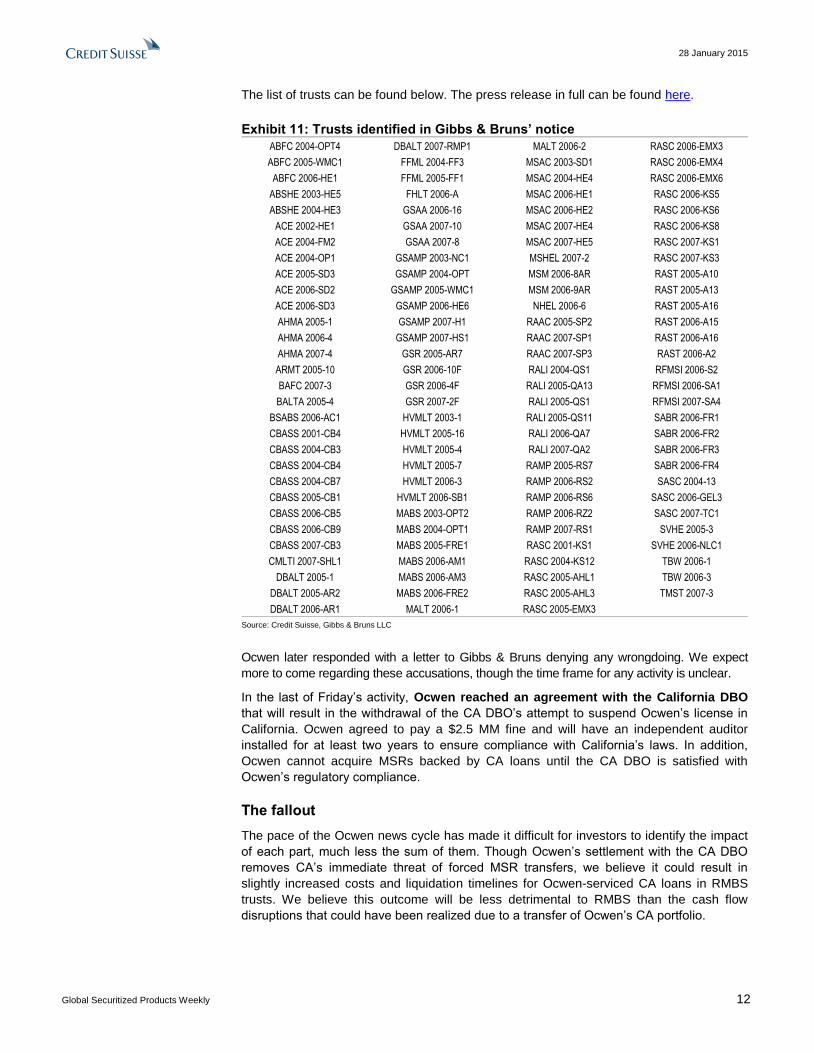
The list of trusts can be found below. The press release in full can be found here.
Exhibit 11: Trusts identified in Gibbs & Bruns’ notice
ABFC 2004-OPT4 DBALT 2007-RMP1 MALT 2006-2 RASC 2006-EMX3
ABFC 2005-WMC1 FFML 2004-FF3 MSAC 2003-SD1 RASC 2006-EMX4
ABFC 2006-HE1 FFML 2005-FF1 MSAC 2004-HE4 RASC 2006-EMX6
ABSHE 2003-HE5 FHLT 2006-A MSAC 2006-HE1 RASC 2006-KS5
ABSHE 2004-HE3 GSAA 2006-16 MSAC 2006-HE2 RASC 2006-KS6
ACE 2002-HE1 GSAA 2007-10 MSAC 2007-HE4 RASC 2006-KS8
ACE 2004-FM2 GSAA 2007-8 MSAC 2007-HE5 RASC 2007-KS1
ACE 2004-OP1 GSAMP 2003-NC1 MSHEL 2007-2 RASC 2007-KS3
ACE 2005-SD3 GSAMP 2004-OPT MSM 2006-8AR RAST 2005-A10
ACE 2006-SD2 GSAMP 2005-WMC1 MSM 2006-9AR RAST 2005-A13
ACE 2006-SD3 GSAMP 2006-HE6 NHEL 2006-6 RAST 2005-A16
AHMA 2005-1 GSAMP 2007-H1 RAAC 2005-SP2 RAST 2006-A15
AHMA 2006-4 GSAMP 2007-HS1 RAAC 2007-SP1 RAST 2006-A16
AHMA 2007-4 GSR 2005-AR7 RAAC 2007-SP3 RAST 2006-A2
ARMT 2005-10 GSR 2006-10F RALI 2004-QS1 RFMSI 2006-S2
BAFC 2007-3 GSR 2006-4F RALI 2005-QA13 RFMSI 2006-SA1
BALTA 2005-4 GSR 2007-2F RALI 2005-QS1 RFMSI 2007-SA4
BSABS 2006-AC1 HVMLT 2003-1 RALI 2005-QS11 SABR 2006-FR1
CBASS 2001-CB4 HVMLT 2005-16 RALI 2006-QA7 SABR 2006-FR2
CBASS 2004-CB3 HVMLT 2005-4 RALI 2007-QA2 SABR 2006-FR3
CBASS 2004-CB4 HVMLT 2005-7 RAMP 2005-RS7 SABR 2006-FR4
CBASS 2004-CB7 HVMLT 2006-3 RAMP 2006-RS2 SASC 2004-13
CBASS 2005-CB1 HVMLT 2006-SB1 RAMP 2006-RS6 SASC 2006-GEL3
CBASS 2006-CB5 MABS 2003-OPT2 RAMP 2006-RZ2 SASC 2007-TC1
CBASS 2006-CB9 MABS 2004-OPT1 RAMP 2007-RS1 SVHE 2005-3
CBASS 2007-CB3 MABS 2005-FRE1 RASC 2001-KS1 SVHE 2006-NLC1
CMLTI 2007-SHL1 MABS 2006-AM1 RASC 2004-KS12 TBW 2006-1
DBALT 2005-1 MABS 2006-AM3 RASC 2005-AHL1 TBW 2006-3
DBALT 2005-AR2 MABS 2006-FRE2 RASC 2005-AHL3 TMST 2007-3
DBALT 2006-AR1 MALT 2006-1 RASC 2005-EMX3
Source: Credit Suisse, Gibbs & Bruns LLC
Ocwen later responded with a letter to Gibbs & Bruns denying any wrongdoing. We expect
more to come regarding these accusations, though the time frame for any activity is unclear.
In the last of Friday’s activity, Ocwen reached an agreement with the California DBO
that will result in the withdrawal of the CA DBO’s attempt to suspend Ocwen’s license in
California. Ocwen agreed to pay a $2.5 MM fine and will have an independent auditor
installed for at least two years to ensure compliance with California’s laws. In addition,
Ocwen cannot acquire MSRs backed by CA loans until the CA DBO is satisfied with
Ocwen’s regulatory compliance.
The fallout
The pace of the Ocwen news cycle has made it difficult for investors to identify the impact
of each part, much less the sum of them. Though Ocwen’s settlement with the CA DBO
removes CA’s immediate threat of forced MSR transfers, we believe it could result in
slightly increased costs and liquidation timelines for Ocwen-serviced CA loans in RMBS
trusts. We believe this outcome will be less detrimental to RMBS than the cash flow
disruptions that could have been realized due to a transfer of Ocwen’s CA portfolio.
28 January 2015
Global Securitized Products Weekly 13
We still believe that projecting the likelihood of any outcomes to legal disputes, such as the
BlueMountain and Gibbs & Bruns accusations, remains an exercise in speculation. However,
we can use a similar framework to the one we applied prior to the CA DBO settlement.
The BlueMountain situation provides a relatively binary outcome. If the trustee deems that
an event of default is occurring, it would cause an early amortization event. We believe
this would make financing for future advances uncertain for Ocwen and HLSS; this could
put Ocwen in a precarious position to continue servicing non-agency MBS.
The Gibbs & Bruns notice could, in our view, trigger a number of outcomes for non-agency
investors. The notice’s two-pronged approach against Ocwen targets both an event of
default as well as a recovery of losses. The former could trigger a forced transfer of
servicing, while the latter could generate recoveries for RMBS holders. If there are to be
recoveries, it remains to be seen how much could come to holders and how recoveries
would be distributed.
A potential servicing transfer raises a few questions about what such a transfer would look
like. We have a few benchmarks for servicing transfers in the past, but only the ResCap to
Ocwen transfer included the element of a forced seller of MSRs. We believe this provides
the most appropriate comparison if any forced transfers occur – and how servicing would
behave prior to onboarding at a new servicer. However, a few other transfers can also
help investors to frame how long a servicing transfer takes.
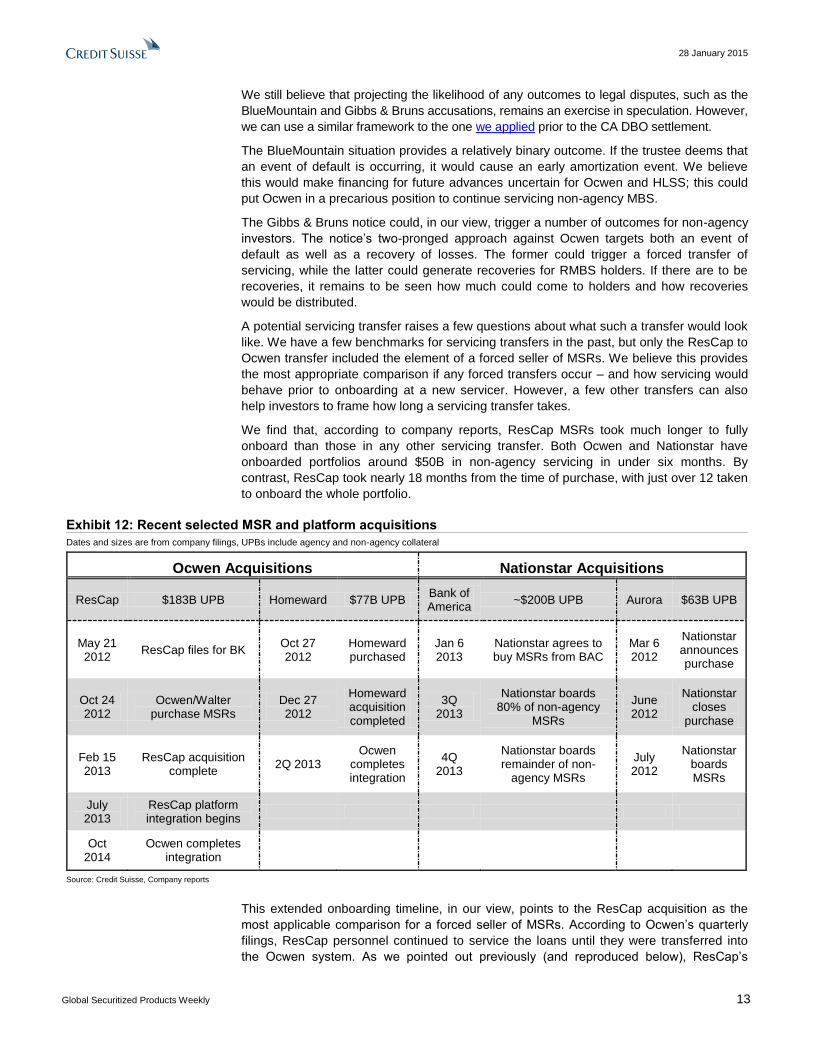
We find that, according to company reports, ResCap MSRs took much longer to fully
onboard than those in any other servicing transfer. Both Ocwen and Nationstar have
onboarded portfolios around $50B in non-agency servicing in under six months. By
contrast, ResCap took nearly 18 months from the time of purchase, with just over 12 taken
to onboard the whole portfolio.
Exhibit 12: Recent selected MSR and platform acquisitions
Dates and sizes are from company filings, UPBs include agency and non-agency collateral
Ocwen Acquisitions Nationstar Acquisitions
ResCap $183B UPB Homeward $77B UPB Bank of America
~$200B UPB Aurora $63B UPB
May 21 2012
ResCap files for BK Oct 27 2012
Homeward purchased
Jan 6 2013
Nationstar agrees to buy MSRs from BAC
Mar 6 2012
Nationstar announces purchase
Oct 24 2012
Ocwen/Walter purchase MSRs
Dec 27 2012
Homeward acquisition completed
3Q 2013
Nationstar boards 80% of non-agency
MSRs
June 2012
Nationstar closes
purchase
Feb 15 2013
ResCap acquisition complete
2Q 2013 Ocwen
completes integration
4Q 2013
Nationstar boards remainder of non-
agency MSRs
July 2012
Nationstar boards MSRs
July 2013
ResCap platform integration begins
Oct 2014
Ocwen completes integration
Source: Credit Suisse, Company reports
This extended onboarding timeline, in our view, points to the ResCap acquisition as the
most applicable comparison for a forced seller of MSRs. According to Ocwen’s quarterly
filings, ResCap personnel continued to service the loans until they were transferred into
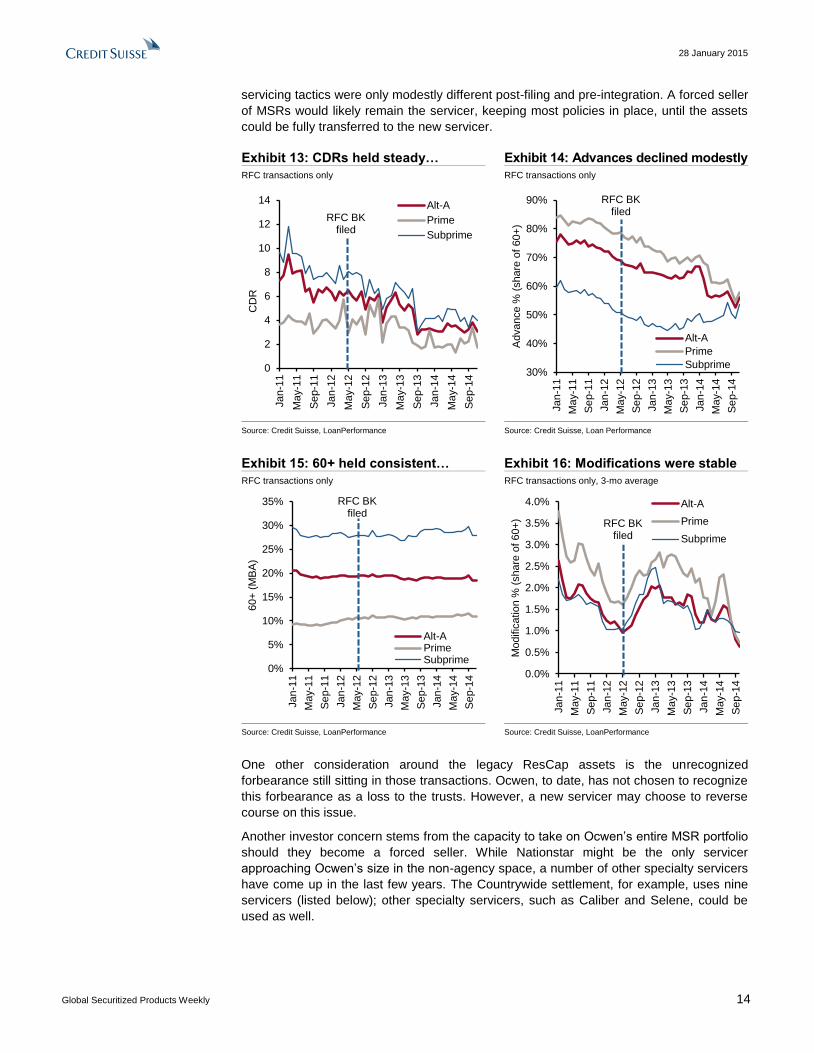
the Ocwen system. As we pointed out previously (and reproduced below), ResCap’s
28 January 2015
Global Securitized Products Weekly 14
servicing tactics were only modestly different post-filing and pre-integration. A forced seller
of MSRs would likely remain the servicer, keeping most policies in place, until the assets
could be fully transferred to the new servicer.
Exhibit 13: CDRs held steady… Exhibit 14: Advances declined modestly
RFC transactions only RFC transactions only
0
2
4
6
8
10
12
14
Jan
-11
May-1
1
Se
p-1
1
Jan
-12
May-1
2
Se
p-1
2
Jan
-13
May-1
3
Se
p-1
3
Jan
-14
May-1
4
Se
p-1
4
CD
R
Alt-A
Prime
Subprime
RFC BK filed
30%
40%
50%
60%
70%
80%
90%
Jan
-11
Ma
y-1
1
Se
p-1
1
Jan
-12
Ma
y-1
2
Se
p-1
2
Jan
-13
Ma
y-1
3
Se
p-1
3
Jan
-14
Ma
y-1
4
Se
p-1
4
Advance %
(share
of
60+
)
Alt-A
Prime
Subprime
RFC BK filed
Source: Credit Suisse, LoanPerformance Source: Credit Suisse, Loan Performance
Exhibit 15: 60+ held consistent… Exhibit 16: Modifications were stable
RFC transactions only RFC transactions only, 3-mo average
0%
5%
10%
15%
20%
25%
30%
35%
Jan
-11
Ma
y-1
1
Se
p-1
1
Jan
-12
May-1
2
Se
p-1
2
Jan
-13
Ma
y-1
3
Se
p-1
3
Jan
-14
Ma
y-1
4
Se
p-1
4
60+
(M
BA
)
Alt-APrimeSubprime
RFC BK filed
0.0%
0.5%
1.0%
1.5%
2.0%
2.5%
3.0%
3.5%
4.0%
Jan
-11
Ma
y-1
1
Se
p-1
1
Jan
-12
Ma
y-1
2
Se
p-1
2
Jan
-13
Ma
y-1
3
Se
p-1
3
Jan
-14
Ma
y-1
4
Se
p-1
4
Modific
atio
n %
(share
of 60+
)Alt-A
Prime
Subprime
RFC BK filed
Source: Credit Suisse, LoanPerformance Source: Credit Suisse, LoanPerformance
One other consideration around the legacy ResCap assets is the unrecognized
forbearance still sitting in those transactions. Ocwen, to date, has not chosen to recognize
this forbearance as a loss to the trusts. However, a new servicer may choose to reverse
course on this issue.
Another investor concern stems from the capacity to take on Ocwen’s entire MSR portfolio
should they become a forced seller. While Nationstar might be the only servicer
approaching Ocwen’s size in the non-agency space, a number of other specialty servicers
have come up in the last few years. The Countrywide settlement, for example, uses nine
servicers (listed below); other specialty servicers, such as Caliber and Selene, could be
used as well.
28 January 2015
Global Securitized Products Weekly 15
Exhibit 17: Approved subservicers from the Countrywide settlement
Names as of 10/2011; some subservicers now operate under another name
Bayview Loan Servicing, LLC
Residential Credit Solutions, Inc.
Resurgent Capital Services, LP (d/b/a Resurgent Mortgage Servicing)
Nationstar Mortgage LLC
Specialized Loan Servicing LLC
Select Portfolio Servicing, Inc.
Vantium Capital Inc. (d/b/a Acqura Loan Services)
Greentree Servicing LLC
FCI Lender Services, Inc.
Source: Credit Suisse, Court documents
We believe these smaller servicers could potentially step up if Ocwen were forced to
transfer servicing rights. As they are specialty servicers, most of them would require some
sort of financing agreements to fund servicer advances. We believe this concern might
limit the amount of potential candidates should an event of default cause a transfer.
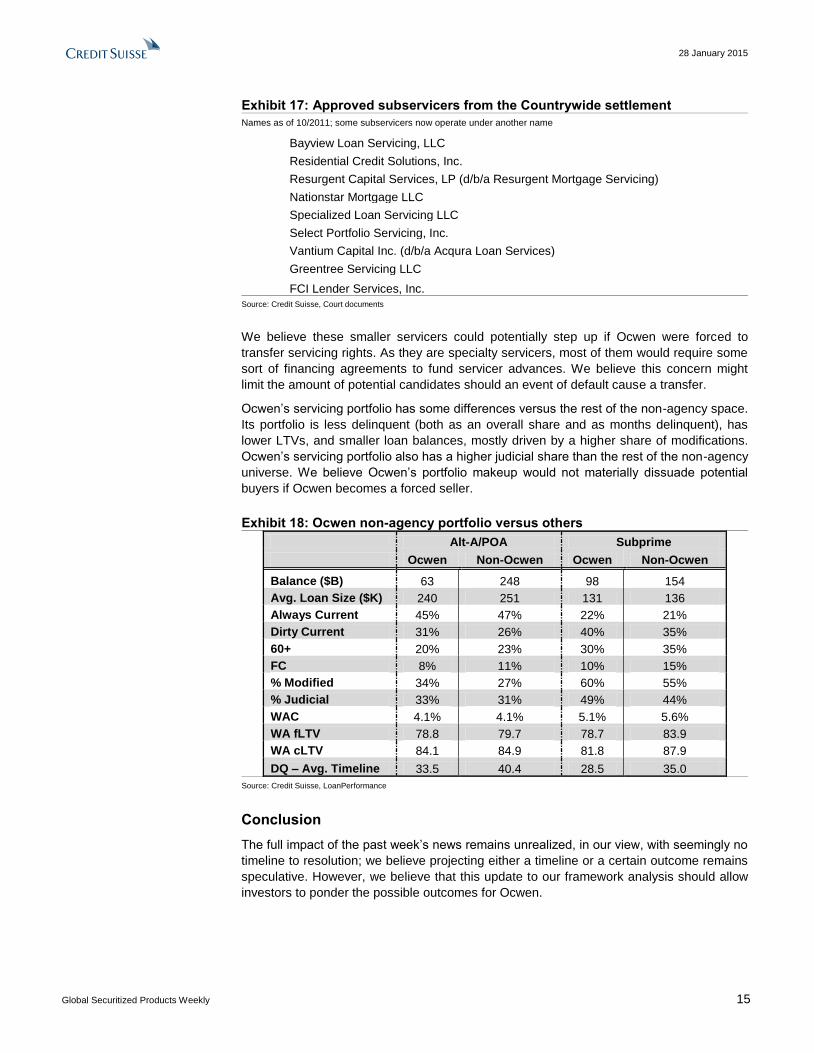
Ocwen’s servicing portfolio has some differences versus the rest of the non-agency space.
Its portfolio is less delinquent (both as an overall share and as months delinquent), has
lower LTVs, and smaller loan balances, mostly driven by a higher share of modifications.
Ocwen’s servicing portfolio also has a higher judicial share than the rest of the non-agency
universe. We believe Ocwen’s portfolio makeup would not materially dissuade potential
buyers if Ocwen becomes a forced seller.
Exhibit 18: Ocwen non-agency portfolio versus others
Alt-A/POA Subprime
Ocwen Non-Ocwen Ocwen Non-Ocwen
Balance ($B) 63 248 98 154
Avg. Loan Size ($K) 240 251 131 136
Always Current 45% 47% 22% 21%
Dirty Current 31% 26% 40% 35%
60+ 20% 23% 30% 35%
FC 8% 11% 10% 15%
% Modified 34% 27% 60% 55%
% Judicial 33% 31% 49% 44%
WAC 4.1% 4.1% 5.1% 5.6%
WA fLTV 78.8 79.7 78.7 83.9
WA cLTV 84.1 84.9 81.8 87.9
DQ – Avg. Timeline 33.5 40.4 28.5 35.0
Source: Credit Suisse, LoanPerformance
Conclusion
The full impact of the past week’s news remains unrealized, in our view, with seemingly no
timeline to resolution; we believe projecting either a timeline or a certain outcome remains
speculative. However, we believe that this update to our framework analysis should allow
investors to ponder the possible outcomes for Ocwen.
28 January 2015
Global Securitized Products Weekly 16
CMBS
Market activity and relative value The CMBS market continues to perform very well, on a relative basis, as it remains largely
immune from the macro-led volatility that has affected other financial markets, including
corporate bonds and equities.
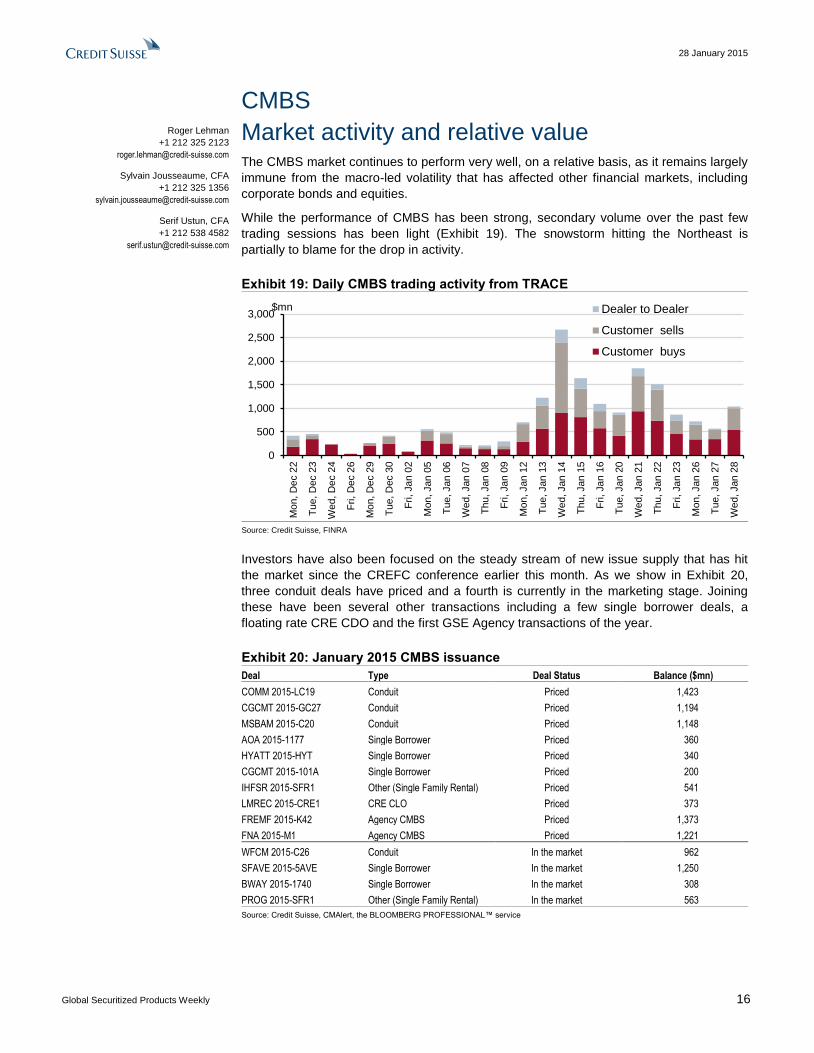
While the performance of CMBS has been strong, secondary volume over the past few
trading sessions has been light (Exhibit 19). The snowstorm hitting the Northeast is
partially to blame for the drop in activity.
Exhibit 19: Daily CMBS trading activity from TRACE
0
500
1,000
1,500
2,000
2,500
3,000
Mo
n, D
ec 2
2
Tu
e, D
ec 2
3
We
d, D
ec 2
4
Fri, D
ec 2
6
Mo
n, D
ec 2
9
Tu
e, D
ec 3
0
Fri, Ja
n 0
2
Mo
n, Jan
05
Tu
e, Jan
06
We
d, Jan
07
Th
u, Jan
08
Fri, Ja
n 0
9
Mo
n, Jan
12
Tu
e, Jan
13
We
d, Jan
14
Th
u, Jan
15
Fri, Ja
n 1
6
Tu
e, Jan
20
Wed, Jan 2
1
Th
u, Jan
22
Fri, Ja
n 2
3
Mo
n, Jan
26
Tu
e, Jan
27
We
d, Jan
28
Dealer to Dealer
Customer sells
Customer buys
$mn
Source: Credit Suisse, FINRA
Investors have also been focused on the steady stream of new issue supply that has hit
the market since the CREFC conference earlier this month. As we show in Exhibit 20,
three conduit deals have priced and a fourth is currently in the marketing stage. Joining
these have been several other transactions including a few single borrower deals, a
floating rate CRE CDO and the first GSE Agency transactions of the year.
Exhibit 20: January 2015 CMBS issuance
Deal Type Deal Status Balance ($mn)
COMM 2015-LC19 Conduit Priced 1,423
CGCMT 2015-GC27 Conduit Priced 1,194
MSBAM 2015-C20 Conduit Priced 1,148
AOA 2015-1177 Single Borrower Priced 360
HYATT 2015-HYT Single Borrower Priced 340
CGCMT 2015-101A Single Borrower Priced 200
IHFSR 2015-SFR1 Other (Single Family Rental) Priced 541
LMREC 2015-CRE1 CRE CLO Priced 373
FREMF 2015-K42 Agency CMBS Priced 1,373
FNA 2015-M1 Agency CMBS Priced 1,221
WFCM 2015-C26 Conduit In the market 962
SFAVE 2015-5AVE Single Borrower In the market 1,250
BWAY 2015-1740 Single Borrower In the market 308
PROG 2015-SFR1 Other (Single Family Rental) In the market 563
Source: Credit Suisse, CMAlert, the BLOOMBERG PROFESSIONAL™ service
Roger Lehman
+1 212 325 2123
Sylvain Jousseaume, CFA
+1 212 325 1356
Serif Ustun, CFA
+1 212 538 4582
28 January 2015
Global Securitized Products Weekly 17
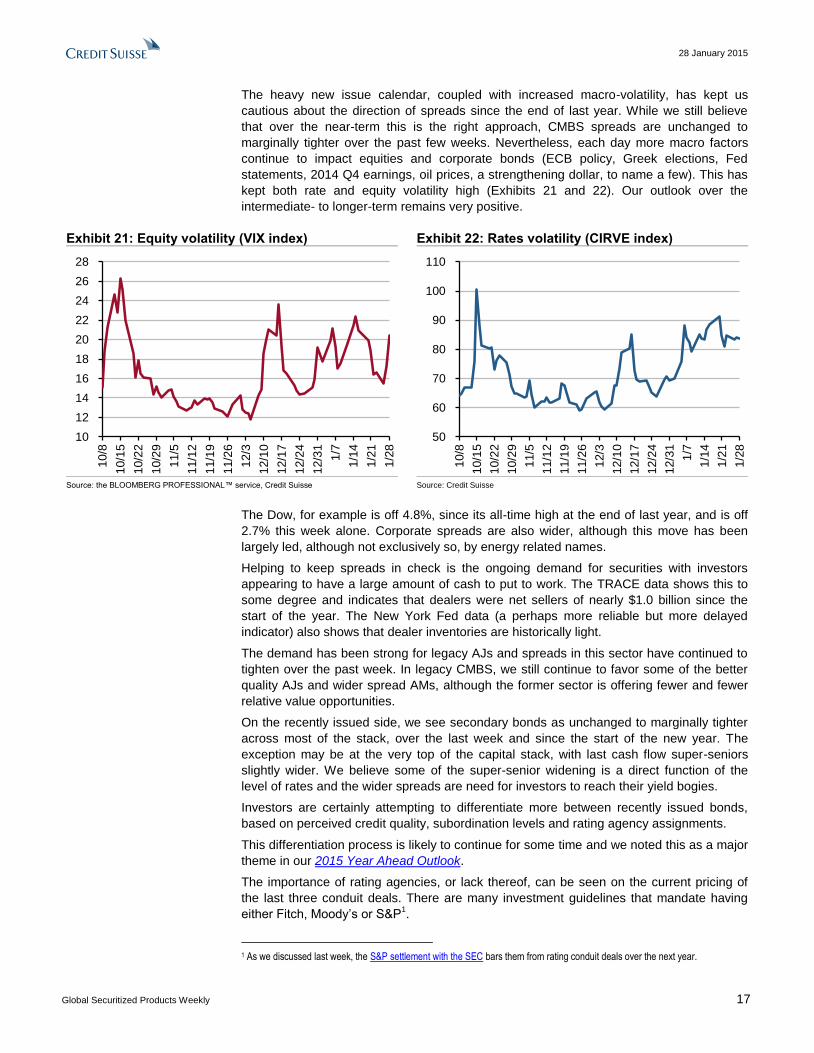
The heavy new issue calendar, coupled with increased macro-volatility, has kept us
cautious about the direction of spreads since the end of last year. While we still believe
that over the near-term this is the right approach, CMBS spreads are unchanged to
marginally tighter over the past few weeks. Nevertheless, each day more macro factors
continue to impact equities and corporate bonds (ECB policy, Greek elections, Fed
statements, 2014 Q4 earnings, oil prices, a strengthening dollar, to name a few). This has
kept both rate and equity volatility high (Exhibits 21 and 22). Our outlook over the
intermediate- to longer-term remains very positive.
Exhibit 21: Equity volatility (VIX index) Exhibit 22: Rates volatility (CIRVE index)
10
12
14
16
18
20
22
24
26
28
10/8
10/1
5
10/2
2
10/2
9
11/5
11/1
2
11/1
9
11/2
6
12/3
12/1
0
12/1
7
12/2
4
12/3
1
1/7
1/1
4
1/2
1
1/2
8
50
60
70
80
90
100
110
10/8
10/1
5
10/2
2
10/2
9
11/5
11/1
2
11/1
9
11/2
6
12/3
12/1
0
12/1
7
12/2
4
12/3
1
1/7
1/1
4
1/2
1
1/2
8
Source: the BLOOMBERG PROFESSIONAL™ service, Credit Suisse Source: Credit Suisse
The Dow, for example is off 4.8%, since its all-time high at the end of last year, and is off
2.7% this week alone. Corporate spreads are also wider, although this move has been
largely led, although not exclusively so, by energy related names.
Helping to keep spreads in check is the ongoing demand for securities with investors
appearing to have a large amount of cash to put to work. The TRACE data shows this to
some degree and indicates that dealers were net sellers of nearly $1.0 billion since the
start of the year. The New York Fed data (a perhaps more reliable but more delayed
indicator) also shows that dealer inventories are historically light.
The demand has been strong for legacy AJs and spreads in this sector have continued to
tighten over the past week. In legacy CMBS, we still continue to favor some of the better
quality AJs and wider spread AMs, although the former sector is offering fewer and fewer
relative value opportunities.
On the recently issued side, we see secondary bonds as unchanged to marginally tighter
across most of the stack, over the last week and since the start of the new year. The
exception may be at the very top of the capital stack, with last cash flow super-seniors
slightly wider. We believe some of the super-senior widening is a direct function of the
level of rates and the wider spreads are need for investors to reach their yield bogies.
Investors are certainly attempting to differentiate more between recently issued bonds,
based on perceived credit quality, subordination levels and rating agency assignments.
This differentiation process is likely to continue for some time and we noted this as a major
theme in our 2015 Year Ahead Outlook.
The importance of rating agencies, or lack thereof, can be seen on the current pricing of
the last three conduit deals. There are many investment guidelines that mandate having
either Fitch, Moody’s or S&P1.
1 As we discussed last week, the S&P settlement with the SEC bars them from rating conduit deals over the next year.
28 January 2015
Global Securitized Products Weekly 18
On the newest deals, the tranches that were missing ratings from all of these agencies
priced noticeably wider. For example, the single-A and triple-B minus tranches, of COMM
2015-LC19, came at S+205 bp and S+360 bp, respectively, with the bonds carrying a
Fitch rating. Neither the MSBAM 2015-C20 nor the CGCMT 2015-GC27 deal had ratings
from any of these three raters and the two single-A minus tranches came 40 bp wider.
While the cash markets have been somewhat immune to the heightened volatility, the
price swings are definitely more pronounced in the CMBX market, where more macro-
oriented investors tend to play a greater role.
The latest set of CMBX indices, CMBX.8,
started trading this past Monday and the
launch was met with decent trading
volumes, at least before the concerns
about the snowstorm took over.
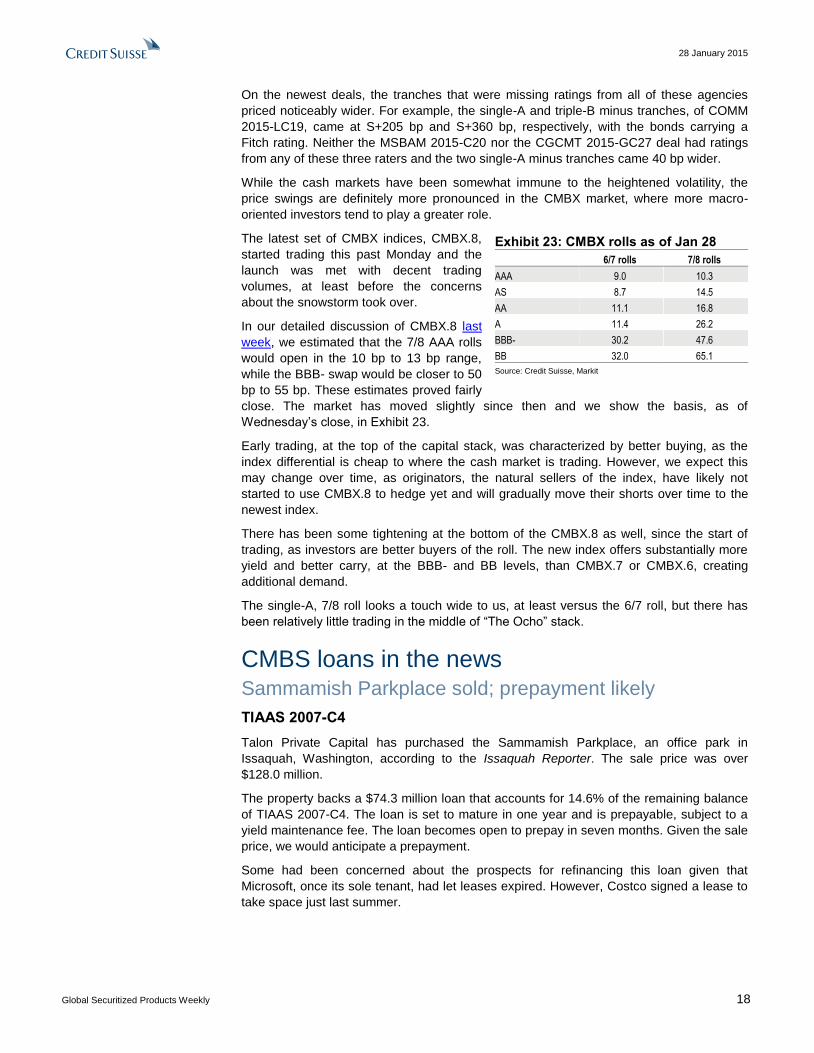
In our detailed discussion of CMBX.8 last
week, we estimated that the 7/8 AAA rolls
would open in the 10 bp to 13 bp range,
while the BBB- swap would be closer to 50
bp to 55 bp. These estimates proved fairly
close. The market has moved slightly since then and we show the basis, as of
Wednesday’s close, in Exhibit 23.
Early trading, at the top of the capital stack, was characterized by better buying, as the
index differential is cheap to where the cash market is trading. However, we expect this
may change over time, as originators, the natural sellers of the index, have likely not
started to use CMBX.8 to hedge yet and will gradually move their shorts over time to the
newest index.
There has been some tightening at the bottom of the CMBX.8 as well, since the start of
trading, as investors are better buyers of the roll. The new index offers substantially more
yield and better carry, at the BBB- and BB levels, than CMBX.7 or CMBX.6, creating
additional demand.
The single-A, 7/8 roll looks a touch wide to us, at least versus the 6/7 roll, but there has
been relatively little trading in the middle of “The Ocho” stack.
CMBS loans in the news Sammamish Parkplace sold; prepayment likely
TIAAS 2007-C4
Talon Private Capital has purchased the Sammamish Parkplace, an office park in
Issaquah, Washington, according to the Issaquah Reporter. The sale price was over
$128.0 million.
The property backs a $74.3 million loan that accounts for 14.6% of the remaining balance
of TIAAS 2007-C4. The loan is set to mature in one year and is prepayable, subject to a
yield maintenance fee. The loan becomes open to prepay in seven months. Given the sale
price, we would anticipate a prepayment.
Some had been concerned about the prospects for refinancing this loan given that
Microsoft, once its sole tenant, had let leases expired. However, Costco signed a lease to
take space just last summer.
Exhibit 23: CMBX rolls as of Jan 28
6/7 rolls 7/8 rolls
AAA 9.0 10.3
AS 8.7 14.5
AA 11.1 16.8
A 11.4 26.2
BBB- 30.2 47.6
BB 32.0 65.1
Source: Credit Suisse, Markit
28 January 2015
Global Securitized Products Weekly 19
Expansion near Green Acres Mall
COMM 2013-GAM
The owners of the Green Acres Mall, in Valley Stream, New York is building an adjacent
shopping center, according to an article in Newsday. The article states that Macerich Co
will spend an estimated $83.7 million on the new center, to be called Green Acres
Commons. In addition, the company plans to spend an estimated $79 million on
improvements to the mall.
The mall backs a $325.0 million loan that is securitized in a single borrower deal, COMM
2013-GAM. The loan is scheduled to mature in February 2021 and is subject to
defeasance until a few months prior to that date.
Improvements to the mall are already under way, according to the article, and the mall
plans to remain opening during the renovation, which is expected to take 15 years to
complete. Macerich was granted tax emptions and other incentives for the project.
Macerich purchased the Green Acres Mall in 2012 for $500 million and then purchased the
adjacent movie theater, where the new construction will take place, for $22.5 million, in 2013.
Sierra Vista Mall is now REO
COMM 2006-C8
Sierra Vista Mall was sold in a foreclosure proceeding according to ABC News and various
other news sources. The trust that owned the mortgage was the buyer, at $39 million, and
the asset is now REO. The lender was the only bidder at the auction.
The Sierra Vista Mall had backed a $77.8 million loan that accounts for 3.2% of COMM
2006-C8. The loan has been with the special servicer since September 2013. The notes
indicate that a modification was discussed but that tactic was apparently scrapped.
In addition to the outstanding loan balance the loan has accumulated $4.7 million in
servicing advances and interest as well as an additional $2.0 million in cumulative ASERs.
The property was appraised at $50.0 million a year ago and the most recent appraisal
reduction amount totals nearly $40.0 million.
The property backing the loan totaled about 405k square feet. Sears is the only one of the
anchors that is part of the collateral. Since the loan was securitized, Mervyn’s has been
replaced by Kohl’s and the MB2 Raceway has replaced the former Gottschalks.
New lease at 411 East Wisconsin
JPMCC 2006-LDP7
Northwestern Mutual has taken 56k square feet at the 411 East Wisconsin office building
in Milwaukee, according to the Milwaukee Business Journal. The lease accounts for about
8.6% of the space and should boost occupancy to 88%, the article states.
The building backs a $65.2 million loan that represents 2.1% of JPMCC 2006-LDP7. The
loan is scheduled to mature in September. The most recent financials show a DSCR of
1.2x and an occupancy of 77%.
The property sold last year for $74.3 million, to an affiliate of Five Mile Capital. This was
well below the 2006 appraised valued of $98.2 million. The buyers have begun a
$17.5 million redevelopment at the building.
28 January 2015
Global Securitized Products Weekly 20
Logistics Pointe trades for $52 million
MSC 2011-C3
Logistics Pointe, a 1.1 million square foot industrial park, sold for $52.1 million, according
to the Charlotte Business Journal. LRC Opportunity Fund and New York Life Real Estate
Investors were partners in the purchase.
The property now backs a $23.9 million loan securitized in MSC 2011-C3 (1.7% of the
deal). The property had been appraised at $40.0 million in May 2011, at securitization. The
purchase price implies a current LTV of under 46%. The loan is scheduled to mature in
June 2016 and is subject to defeasance, until early next year.
The Plaza Evergreen Park may sell for $14 million
CSMC 2006-C4
Lormax Stern has agreed to pay $14 million for The Plaza Evergreen Park, according to
Crain’s Chicago. With only four tenants remaining at the property the thinking is Lormax
would demolish it and redevelop it into a new retail operation.
The property backs a delinquent loan securitized in CSMC 2006-C4 ($18.4 million and
0.6% of the deal). The loan has been with the special servicer since October 2009.
The servicing notes indicate that a loan sale failed to close but we believe this was a prior
sale. A previous deal to sell the loan fell through and the special servicer restarted the
foreclosure process.
In addition to the outstanding balance the loan has accumulated over $9.1 million in
servicing advances and interest as well as nearly $902k in cumulative ASERs. The ASERs
have stopped growing, however, as the loan was deemed non-recoverable.
Factoring all of this in, we would expect a near total loss to the trust, with little or
no recovery.
The loss will continue to write down Class F (originally rated single-A).
January conduit credit update The 60+-day legacy conduit delinquency rate fell 1 bp in January, as the monthly changes
have once again taken on a little bit of a see-saw pattern of ups and downs. The
delinquency rate has been down in two of the past three months, but this follows four
consecutive increases, in the middle of last year. This rises brought some concerns that
the pace of credit deteriorate, in legacy loans, had started to escalate. We do not believe
that to be true, but changes are occurring.
As we have been discussing, and detailed in the 2015 CMBS Year Ahead Outlook, it
is our view that while the outlook for legacy credit has improved, over the past two
years, the pace of those gains is starting to wane and improvements will be more
gradual in 2015. From July 2012 to June 2014 the conduit delinquency rate fell in
16 months, bringing the rate from 10.6% down to 8.4%. However, since then, the rate has
increased and even with the latest drop, it is up 30 bp over the past few months.
However, we believe the legacy delinquency rate and, for that matter, other credit
metrics which rely on the current balance, may be prone to volatile and misleading
reads. In fact, over the past four months, even as the delinquency rate has been rising,
the total dollar balance of delinquent loans fell.
28 January 2015
Global Securitized Products Weekly 21
The problem is that the amount of delinquent loans fell less rapidly, relative to the amount
outstanding (the denominator), pushing up the overall delinquency rate. In a simplified
example, assume from one month to the next no conduit loans change their delinquency
status but several current loans mature and pay off. The delinquency rate will actually rise.
While the profile of the remaining universe has arguably gotten worse, it is hard to say
credit deteriorated. Generally, if the rate of pay downs is relatively faster than the rate of
resolutions (cures and liquidations) the legacy delinquency rate will rise regardless of the
pace of new delinquencies.
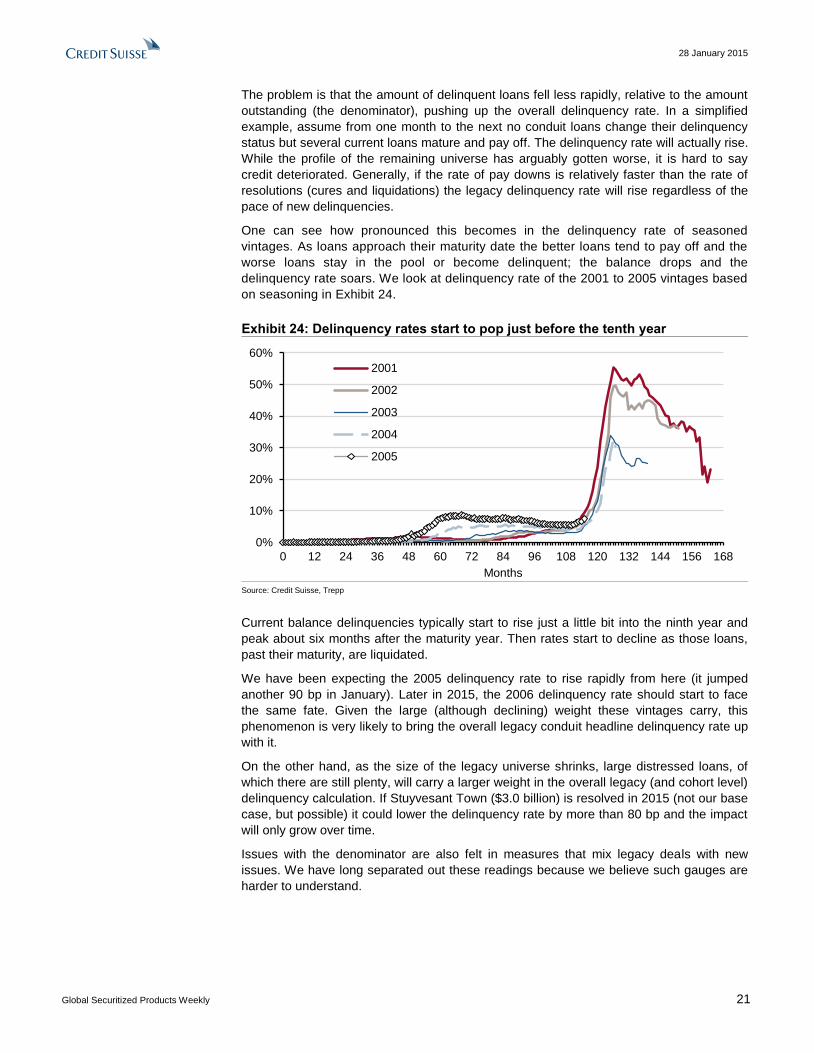
One can see how pronounced this becomes in the delinquency rate of seasoned
vintages. As loans approach their maturity date the better loans tend to pay off and the
worse loans stay in the pool or become delinquent; the balance drops and the
delinquency rate soars. We look at delinquency rate of the 2001 to 2005 vintages based
on seasoning in Exhibit 24.
Exhibit 24: Delinquency rates start to pop just before the tenth year
0%
10%
20%
30%
40%
50%
60%
0 12 24 36 48 60 72 84 96 108 120 132 144 156 168
Months
2001
2002
2003
2004
2005
Source: Credit Suisse, Trepp
Current balance delinquencies typically start to rise just a little bit into the ninth year and
peak about six months after the maturity year. Then rates start to decline as those loans,
past their maturity, are liquidated.
We have been expecting the 2005 delinquency rate to rise rapidly from here (it jumped
another 90 bp in January). Later in 2015, the 2006 delinquency rate should start to face
the same fate. Given the large (although declining) weight these vintages carry, this
phenomenon is very likely to bring the overall legacy conduit headline delinquency rate up
with it.
On the other hand, as the size of the legacy universe shrinks, large distressed loans, of
which there are still plenty, will carry a larger weight in the overall legacy (and cohort level)
delinquency calculation. If Stuyvesant Town ($3.0 billion) is resolved in 2015 (not our base
case, but possible) it could lower the delinquency rate by more than 80 bp and the impact
will only grow over time.
Issues with the denominator are also felt in measures that mix legacy deals with new
issues. We have long separated out these readings because we believe such gauges are
harder to understand.
28 January 2015
Global Securitized Products Weekly 22
The Conduit Loan Impairment Rate (CLIR)
There are many credit metrics that can be followed and each has advantages and
disadvantages. One of the more popular headline statistics is the overall delinquency rate
(with some using 30+-day and others using 60+-day measures).
While delinquencies are an important component to understanding the current
credit picture, we do not believe that, by themselves, they tell the full story. Just as
important is how loans are transitioning in and out of their respective buckets. Loans can
cure, be modified, or liquidated (often at a loss). Not all of these are positive credit events.
We think an unchanged delinquency rate, that is accompanied by a high level of
loan liquidations or modifications, is a sign of a deteriorating, rather than a stable,
credit environment. Credit problems will first show as delinquencies in the initial stages
of a credit downturn and attract the most attention. But we firmly believe that liquidations
and mods, which only start to appear later in the cycle, should not be ignored.
As we have often seen in the past, changes in the rate of liquidations and
modifications can have a distortive effect on the delinquency rate. In a month when
delinquent loan liquidations are above the trend, there is more pressure on the overall
delinquency rate.
In order to capture the dual influence of delinquencies and liquidations, we have
adapted a simple construct in which we combine the two measures, adding together
the delinquency rate (today’s current problems) and liquidations (credit problems
that have left the CMBS universe). This combination provides what we call the
conduit loan impairment rate (CLIR).
For the delinquency rate, we have chosen to use the current balance of loans that are
60+-days delinquent (which also includes loans in the process of foreclosure, REO, and
non-performing matured balloons). To this measure, we add the balance of loans that
have been liquidated and calculate the conduit loan impairment rate, as a percentage of
the original outstanding balance of the universe we are analyzing.
We then enhanced this measure to capture the growing number of modified loans.
We have dubbed this measure Mod-CLIR. While modified loans are often reported as
current, many of them are not performing as originally intended and we believe are credit
impaired. In summary, our Mod-CLIR measure incorporates loans that have been modified
with respect to their monthly payments but would not otherwise be captured in our original
CLIR measure. Loans that have received only a maturity modification are not included.
Legacy analysis covers the pre-2010 universe
Before we go on and discuss this month’s credit statistics, we also think it is important to
understand and clearly define the universe that one is analyzing, as this can also heavily
influence the calculation of credit metrics.
We focused on the CMBS fixed-rate conduit deals and specifically legacy issuance
(those deals issued in 2008 and earlier). It is easier, in our view, to focus on a fixed set
of deals and loans to make meaningful comparisons over time than an ever-changing
universe (that is one reason why we also like to analyze vintage level information).
The set of conduit deals we used in our analysis has a current outstanding balance of
approximately $321 billion (and an original balance of $844 billion).
We have seen other measures that incorporate the larger universe of conduit deals,
including those issued over the past four years. Fortunately, at the moment, these newer
vintage deals (issued in 2010 and later) have few serious credit issues. Adding the most
recent conduit issuance, which has been accelerating, would increase the denominator in
28 January 2015
Global Securitized Products Weekly 23
our calculation and suppress the overall percentages as well as any of the changes in
percentages from month to month. Including the recent issuance would push the overall
delinquency rate significantly lower and would mute the month-over-month change.
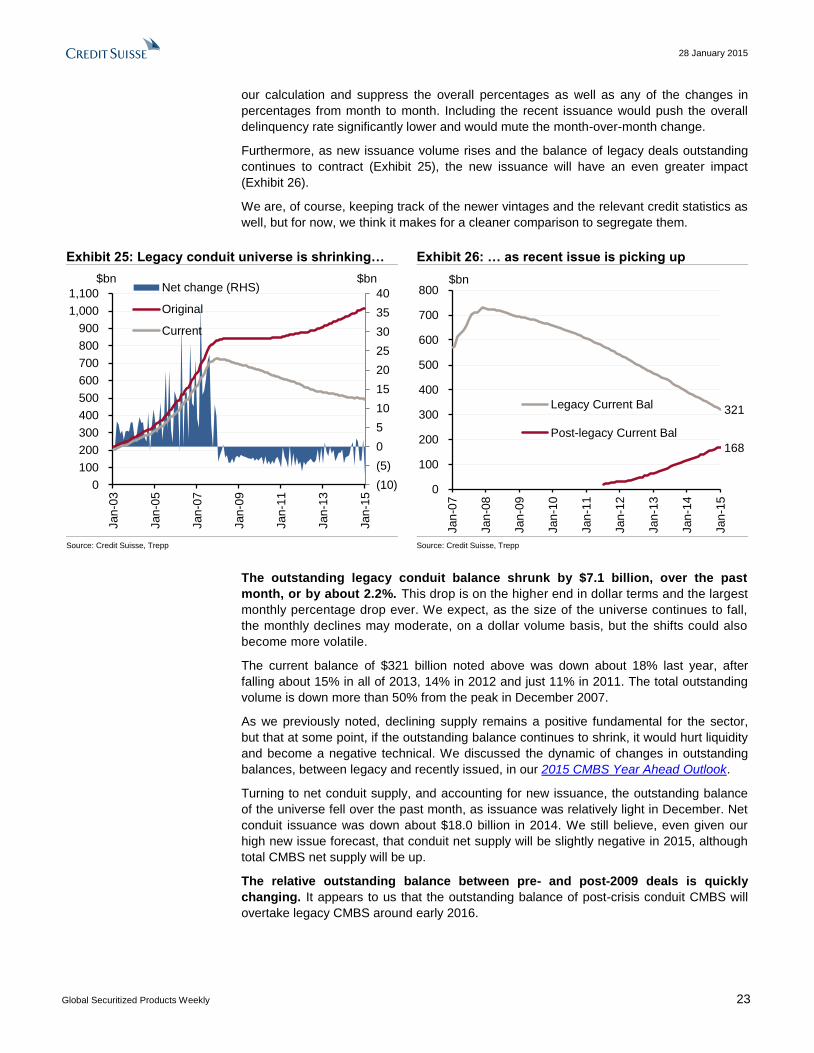
Furthermore, as new issuance volume rises and the balance of legacy deals outstanding
continues to contract (Exhibit 25), the new issuance will have an even greater impact
(Exhibit 26).
We are, of course, keeping track of the newer vintages and the relevant credit statistics as
well, but for now, we think it makes for a cleaner comparison to segregate them.
Exhibit 25: Legacy conduit universe is shrinking… Exhibit 26: … as recent issue is picking up
(10)
(5)
0
5
10
15
20
25
30
35
40
0
100
200
300
400
500
600
700
800
900
1,000
1,100
Jan
-03
Jan
-05
Jan
-07
Jan
-09
Jan
-11
Jan
-13
Jan
-15
Net change (RHS)
Original
Current
$bn $bn
321
168
0
100
200
300
400
500
600
700
800
Jan
-07
Jan
-08
Jan
-09
Jan
-10
Jan
-11
Jan
-12
Jan
-13
Jan
-14
Jan
-15
Legacy Current Bal
Post-legacy Current Bal
$bn
Source: Credit Suisse, Trepp Source: Credit Suisse, Trepp
The outstanding legacy conduit balance shrunk by $7.1 billion, over the past
month, or by about 2.2%. This drop is on the higher end in dollar terms and the largest
monthly percentage drop ever. We expect, as the size of the universe continues to fall,
the monthly declines may moderate, on a dollar volume basis, but the shifts could also
become more volatile.
The current balance of $321 billion noted above was down about 18% last year, after
falling about 15% in all of 2013, 14% in 2012 and just 11% in 2011. The total outstanding
volume is down more than 50% from the peak in December 2007.
As we previously noted, declining supply remains a positive fundamental for the sector,
but that at some point, if the outstanding balance continues to shrink, it would hurt liquidity
and become a negative technical. We discussed the dynamic of changes in outstanding
balances, between legacy and recently issued, in our 2015 CMBS Year Ahead Outlook.
Turning to net conduit supply, and accounting for new issuance, the outstanding balance
of the universe fell over the past month, as issuance was relatively light in December. Net
conduit issuance was down about $18.0 billion in 2014. We still believe, even given our
high new issue forecast, that conduit net supply will be slightly negative in 2015, although
total CMBS net supply will be up.
The relative outstanding balance between pre- and post-2009 deals is quickly
changing. It appears to us that the outstanding balance of post-crisis conduit CMBS will
overtake legacy CMBS around early 2016.
28 January 2015
Global Securitized Products Weekly 24
Post-legacy delinquency increases in January As we noted above, we are still keeping a careful eye on newly issued deals for problem
loans. There are a handful of loans from the last few vintages that have been moved to
special servicing or became delinquent.
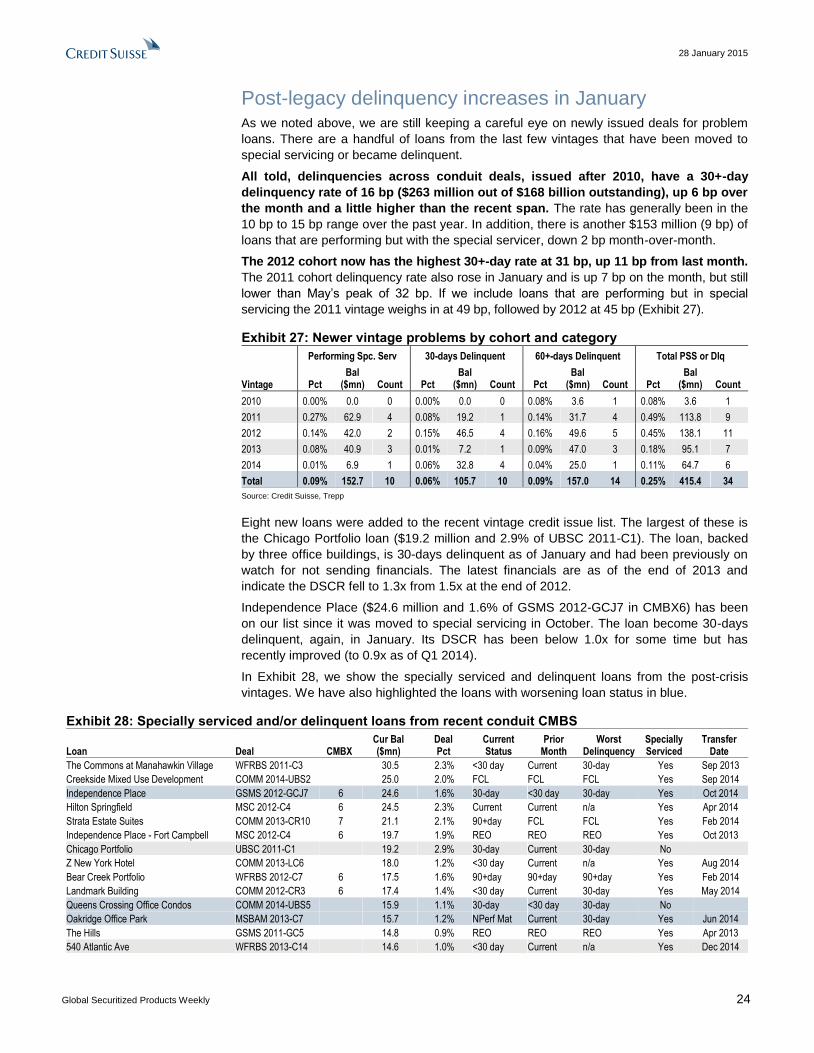
All told, delinquencies across conduit deals, issued after 2010, have a 30+-day
delinquency rate of 16 bp ($263 million out of $168 billion outstanding), up 6 bp over
the month and a little higher than the recent span. The rate has generally been in the
10 bp to 15 bp range over the past year. In addition, there is another $153 million (9 bp) of
loans that are performing but with the special servicer, down 2 bp month-over-month.
The 2012 cohort now has the highest 30+-day rate at 31 bp, up 11 bp from last month.
The 2011 cohort delinquency rate also rose in January and is up 7 bp on the month, but still
lower than May’s peak of 32 bp. If we include loans that are performing but in special
servicing the 2011 vintage weighs in at 49 bp, followed by 2012 at 45 bp (Exhibit 27).
Exhibit 27: Newer vintage problems by cohort and category
Performing Spc. Serv 30-days Delinquent 60+-days Delinquent Total PSS or Dlq
Vintage Pct Bal
($mn) Count Pct Bal
($mn) Count Pct Bal
($mn) Count Pct Bal
($mn) Count
2010 0.00% 0.0 0 0.00% 0.0 0 0.08% 3.6 1 0.08% 3.6 1
2011 0.27% 62.9 4 0.08% 19.2 1 0.14% 31.7 4 0.49% 113.8 9
2012 0.14% 42.0 2 0.15% 46.5 4 0.16% 49.6 5 0.45% 138.1 11
2013 0.08% 40.9 3 0.01% 7.2 1 0.09% 47.0 3 0.18% 95.1 7
2014 0.01% 6.9 1 0.06% 32.8 4 0.04% 25.0 1 0.11% 64.7 6
Total 0.09% 152.7 10 0.06% 105.7 10 0.09% 157.0 14 0.25% 415.4 34
Source: Credit Suisse, Trepp
Eight new loans were added to the recent vintage credit issue list. The largest of these is
the Chicago Portfolio loan ($19.2 million and 2.9% of UBSC 2011-C1). The loan, backed
by three office buildings, is 30-days delinquent as of January and had been previously on
watch for not sending financials. The latest financials are as of the end of 2013 and
indicate the DSCR fell to 1.3x from 1.5x at the end of 2012.
Independence Place ($24.6 million and 1.6% of GSMS 2012-GCJ7 in CMBX6) has been
on our list since it was moved to special servicing in October. The loan become 30-days
delinquent, again, in January. Its DSCR has been below 1.0x for some time but has
recently improved (to 0.9x as of Q1 2014).
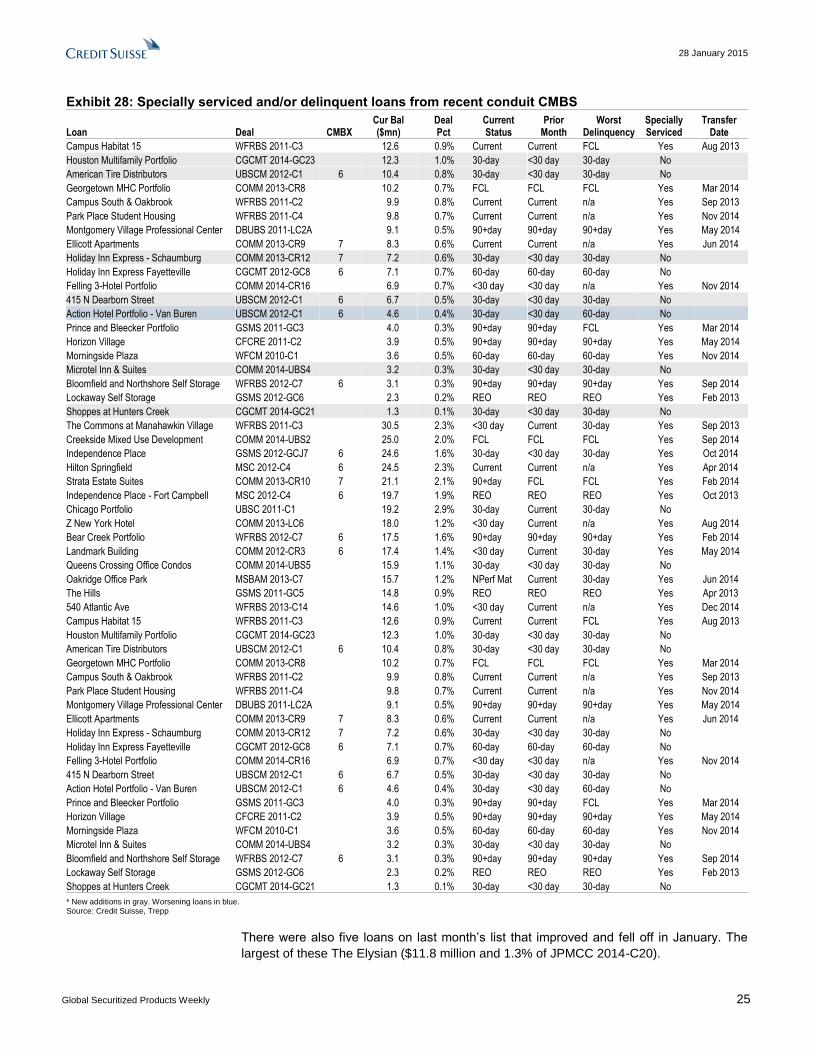
In Exhibit 28, we show the specially serviced and delinquent loans from the post-crisis
vintages. We have also highlighted the loans with worsening loan status in blue.
Exhibit 28: Specially serviced and/or delinquent loans from recent conduit CMBS
Loan Deal CMBX Cur Bal ($mn)
Deal Pct
Current Status
Prior Month
Worst Delinquency
Specially Serviced
Transfer Date
The Commons at Manahawkin Village WFRBS 2011-C3 30.5 2.3% <30 day Current 30-day Yes Sep 2013
Creekside Mixed Use Development COMM 2014-UBS2 25.0 2.0% FCL FCL FCL Yes Sep 2014
Independence Place GSMS 2012-GCJ7 6 24.6 1.6% 30-day <30 day 30-day Yes Oct 2014
Hilton Springfield MSC 2012-C4 6 24.5 2.3% Current Current n/a Yes Apr 2014
Strata Estate Suites COMM 2013-CR10 7 21.1 2.1% 90+day FCL FCL Yes Feb 2014
Independence Place - Fort Campbell MSC 2012-C4 6 19.7 1.9% REO REO REO Yes Oct 2013
Chicago Portfolio UBSC 2011-C1 19.2 2.9% 30-day Current 30-day No
Z New York Hotel COMM 2013-LC6 18.0 1.2% <30 day Current n/a Yes Aug 2014
Bear Creek Portfolio WFRBS 2012-C7 6 17.5 1.6% 90+day 90+day 90+day Yes Feb 2014
Landmark Building COMM 2012-CR3 6 17.4 1.4% <30 day Current 30-day Yes May 2014
Queens Crossing Office Condos COMM 2014-UBS5 15.9 1.1% 30-day <30 day 30-day No
Oakridge Office Park MSBAM 2013-C7 15.7 1.2% NPerf Mat Current 30-day Yes Jun 2014
The Hills GSMS 2011-GC5 14.8 0.9% REO REO REO Yes Apr 2013
540 Atlantic Ave WFRBS 2013-C14 14.6 1.0% <30 day Current n/a Yes Dec 2014
28 January 2015
Global Securitized Products Weekly 25
Exhibit 28: Specially serviced and/or delinquent loans from recent conduit CMBS
Loan Deal CMBX Cur Bal ($mn)
Deal Pct
Current Status
Prior Month
Worst Delinquency
Specially Serviced
Transfer Date
Campus Habitat 15 WFRBS 2011-C3 12.6 0.9% Current Current FCL Yes Aug 2013
Houston Multifamily Portfolio CGCMT 2014-GC23 12.3 1.0% 30-day <30 day 30-day No
American Tire Distributors UBSCM 2012-C1 6 10.4 0.8% 30-day <30 day 30-day No
Georgetown MHC Portfolio COMM 2013-CR8 10.2 0.7% FCL FCL FCL Yes Mar 2014
Campus South & Oakbrook WFRBS 2011-C2 9.9 0.8% Current Current n/a Yes Sep 2013
Park Place Student Housing WFRBS 2011-C4 9.8 0.7% Current Current n/a Yes Nov 2014
Montgomery Village Professional Center DBUBS 2011-LC2A 9.1 0.5% 90+day 90+day 90+day Yes May 2014
Ellicott Apartments COMM 2013-CR9 7 8.3 0.6% Current Current n/a Yes Jun 2014
Holiday Inn Express - Schaumburg COMM 2013-CR12 7 7.2 0.6% 30-day <30 day 30-day No
Holiday Inn Express Fayetteville CGCMT 2012-GC8 6 7.1 0.7% 60-day 60-day 60-day No
Felling 3-Hotel Portfolio COMM 2014-CR16 6.9 0.7% <30 day <30 day n/a Yes Nov 2014
415 N Dearborn Street UBSCM 2012-C1 6 6.7 0.5% 30-day <30 day 30-day No
Action Hotel Portfolio - Van Buren UBSCM 2012-C1 6 4.6 0.4% 30-day <30 day 60-day No
Prince and Bleecker Portfolio GSMS 2011-GC3 4.0 0.3% 90+day 90+day FCL Yes Mar 2014
Horizon Village CFCRE 2011-C2 3.9 0.5% 90+day 90+day 90+day Yes May 2014
Morningside Plaza WFCM 2010-C1 3.6 0.5% 60-day 60-day 60-day Yes Nov 2014
Microtel Inn & Suites COMM 2014-UBS4 3.2 0.3% 30-day <30 day 30-day No
Bloomfield and Northshore Self Storage WFRBS 2012-C7 6 3.1 0.3% 90+day 90+day 90+day Yes Sep 2014
Lockaway Self Storage GSMS 2012-GC6 2.3 0.2% REO REO REO Yes Feb 2013
Shoppes at Hunters Creek CGCMT 2014-GC21 1.3 0.1% 30-day <30 day 30-day No
The Commons at Manahawkin Village WFRBS 2011-C3 30.5 2.3% <30 day Current 30-day Yes Sep 2013
Creekside Mixed Use Development COMM 2014-UBS2 25.0 2.0% FCL FCL FCL Yes Sep 2014
Independence Place GSMS 2012-GCJ7 6 24.6 1.6% 30-day <30 day 30-day Yes Oct 2014
Hilton Springfield MSC 2012-C4 6 24.5 2.3% Current Current n/a Yes Apr 2014
Strata Estate Suites COMM 2013-CR10 7 21.1 2.1% 90+day FCL FCL Yes Feb 2014
Independence Place - Fort Campbell MSC 2012-C4 6 19.7 1.9% REO REO REO Yes Oct 2013
Chicago Portfolio UBSC 2011-C1 19.2 2.9% 30-day Current 30-day No
Z New York Hotel COMM 2013-LC6 18.0 1.2% <30 day Current n/a Yes Aug 2014
Bear Creek Portfolio WFRBS 2012-C7 6 17.5 1.6% 90+day 90+day 90+day Yes Feb 2014
Landmark Building COMM 2012-CR3 6 17.4 1.4% <30 day Current 30-day Yes May 2014
Queens Crossing Office Condos COMM 2014-UBS5 15.9 1.1% 30-day <30 day 30-day No
Oakridge Office Park MSBAM 2013-C7 15.7 1.2% NPerf Mat Current 30-day Yes Jun 2014
The Hills GSMS 2011-GC5 14.8 0.9% REO REO REO Yes Apr 2013
540 Atlantic Ave WFRBS 2013-C14 14.6 1.0% <30 day Current n/a Yes Dec 2014
Campus Habitat 15 WFRBS 2011-C3 12.6 0.9% Current Current FCL Yes Aug 2013
Houston Multifamily Portfolio CGCMT 2014-GC23 12.3 1.0% 30-day <30 day 30-day No
American Tire Distributors UBSCM 2012-C1 6 10.4 0.8% 30-day <30 day 30-day No
Georgetown MHC Portfolio COMM 2013-CR8 10.2 0.7% FCL FCL FCL Yes Mar 2014
Campus South & Oakbrook WFRBS 2011-C2 9.9 0.8% Current Current n/a Yes Sep 2013
Park Place Student Housing WFRBS 2011-C4 9.8 0.7% Current Current n/a Yes Nov 2014
Montgomery Village Professional Center DBUBS 2011-LC2A 9.1 0.5% 90+day 90+day 90+day Yes May 2014
Ellicott Apartments COMM 2013-CR9 7 8.3 0.6% Current Current n/a Yes Jun 2014
Holiday Inn Express - Schaumburg COMM 2013-CR12 7 7.2 0.6% 30-day <30 day 30-day No
Holiday Inn Express Fayetteville CGCMT 2012-GC8 6 7.1 0.7% 60-day 60-day 60-day No
Felling 3-Hotel Portfolio COMM 2014-CR16 6.9 0.7% <30 day <30 day n/a Yes Nov 2014
415 N Dearborn Street UBSCM 2012-C1 6 6.7 0.5% 30-day <30 day 30-day No
Action Hotel Portfolio - Van Buren UBSCM 2012-C1 6 4.6 0.4% 30-day <30 day 60-day No
Prince and Bleecker Portfolio GSMS 2011-GC3 4.0 0.3% 90+day 90+day FCL Yes Mar 2014
Horizon Village CFCRE 2011-C2 3.9 0.5% 90+day 90+day 90+day Yes May 2014
Morningside Plaza WFCM 2010-C1 3.6 0.5% 60-day 60-day 60-day Yes Nov 2014
Microtel Inn & Suites COMM 2014-UBS4 3.2 0.3% 30-day <30 day 30-day No
Bloomfield and Northshore Self Storage WFRBS 2012-C7 6 3.1 0.3% 90+day 90+day 90+day Yes Sep 2014
Lockaway Self Storage GSMS 2012-GC6 2.3 0.2% REO REO REO Yes Feb 2013
Shoppes at Hunters Creek CGCMT 2014-GC21 1.3 0.1% 30-day <30 day 30-day No
* New additions in gray. Worsening loans in blue. Source: Credit Suisse, Trepp
There were also five loans on last month’s list that improved and fell off in January. The
largest of these The Elysian ($11.8 million and 1.3% of JPMCC 2014-C20).
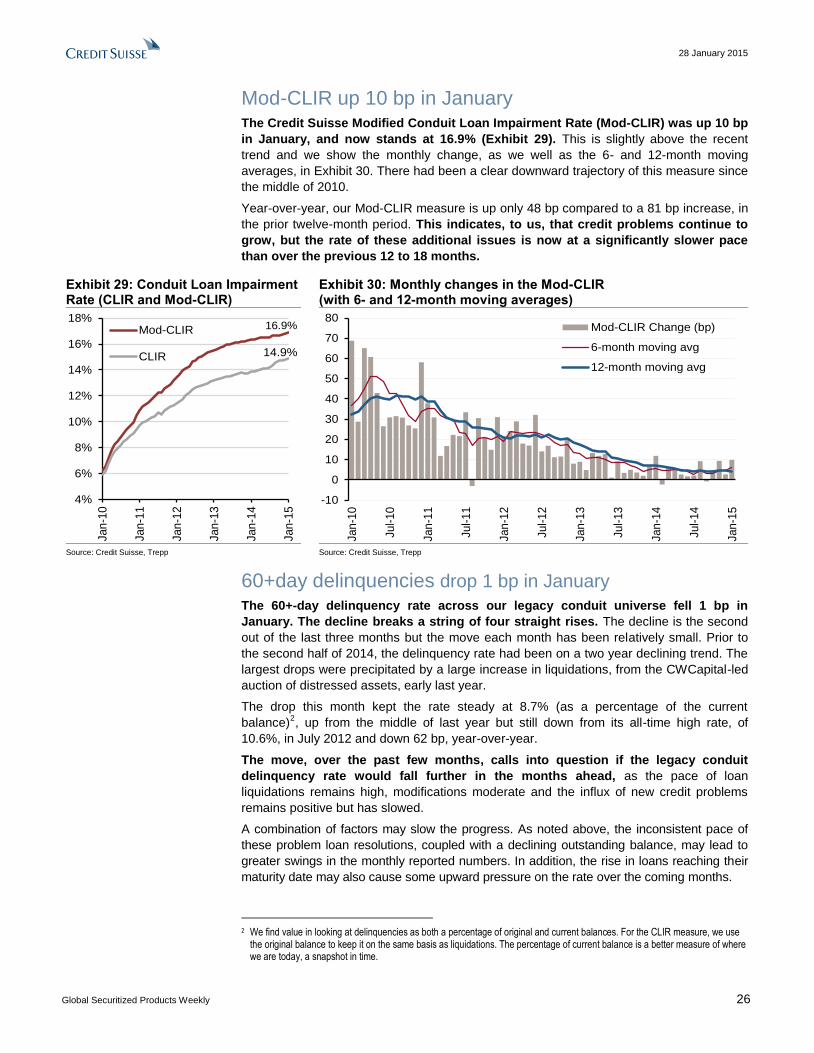
28 January 2015
Global Securitized Products Weekly 26
Mod-CLIR up 10 bp in January The Credit Suisse Modified Conduit Loan Impairment Rate (Mod-CLIR) was up 10 bp
in January, and now stands at 16.9% (Exhibit 29). This is slightly above the recent
trend and we show the monthly change, as we well as the 6- and 12-month moving
averages, in Exhibit 30. There had been a clear downward trajectory of this measure since
the middle of 2010.
Year-over-year, our Mod-CLIR measure is up only 48 bp compared to a 81 bp increase, in
the prior twelve-month period. This indicates, to us, that credit problems continue to
grow, but the rate of these additional issues is now at a significantly slower pace
than over the previous 12 to 18 months.
Exhibit 29: Conduit Loan Impairment Rate (CLIR and Mod-CLIR)
Exhibit 30: Monthly changes in the Mod-CLIR (with 6- and 12-month moving averages)
16.9%
14.9%
4%
6%
8%
10%
12%
14%
16%
18%
Jan
-10
Jan
-11
Jan
-12
Jan
-13
Jan
-14
Jan
-15
Mod-CLIR
CLIR
-10
0
10
20
30
40
50
60
70
80
Jan
-10
Jul-
10
Jan
-11
Jul-
11
Jan
-12
Jul-
12
Jan
-13
Jul-
13
Jan
-14
Jul-
14
Jan
-15
Mod-CLIR Change (bp)
6-month moving avg
12-month moving avg
Source: Credit Suisse, Trepp Source: Credit Suisse, Trepp
60+day delinquencies drop 1 bp in January The 60+-day delinquency rate across our legacy conduit universe fell 1 bp in
January. The decline breaks a string of four straight rises. The decline is the second
out of the last three months but the move each month has been relatively small. Prior to
the second half of 2014, the delinquency rate had been on a two year declining trend. The
largest drops were precipitated by a large increase in liquidations, from the CWCapital-led
auction of distressed assets, early last year.
The drop this month kept the rate steady at 8.7% (as a percentage of the current
balance)2, up from the middle of last year but still down from its all-time high rate, of
10.6%, in July 2012 and down 62 bp, year-over-year.
The move, over the past few months, calls into question if the legacy conduit
delinquency rate would fall further in the months ahead, as the pace of loan
liquidations remains high, modifications moderate and the influx of new credit problems
remains positive but has slowed.
A combination of factors may slow the progress. As noted above, the inconsistent pace of
these problem loan resolutions, coupled with a declining outstanding balance, may lead to
greater swings in the monthly reported numbers. In addition, the rise in loans reaching their
maturity date may also cause some upward pressure on the rate over the coming months.
2 We find value in looking at delinquencies as both a percentage of original and current balances. For the CLIR measure, we use
the original balance to keep it on the same basis as liquidations. The percentage of current balance is a better measure of where we are today, a snapshot in time.
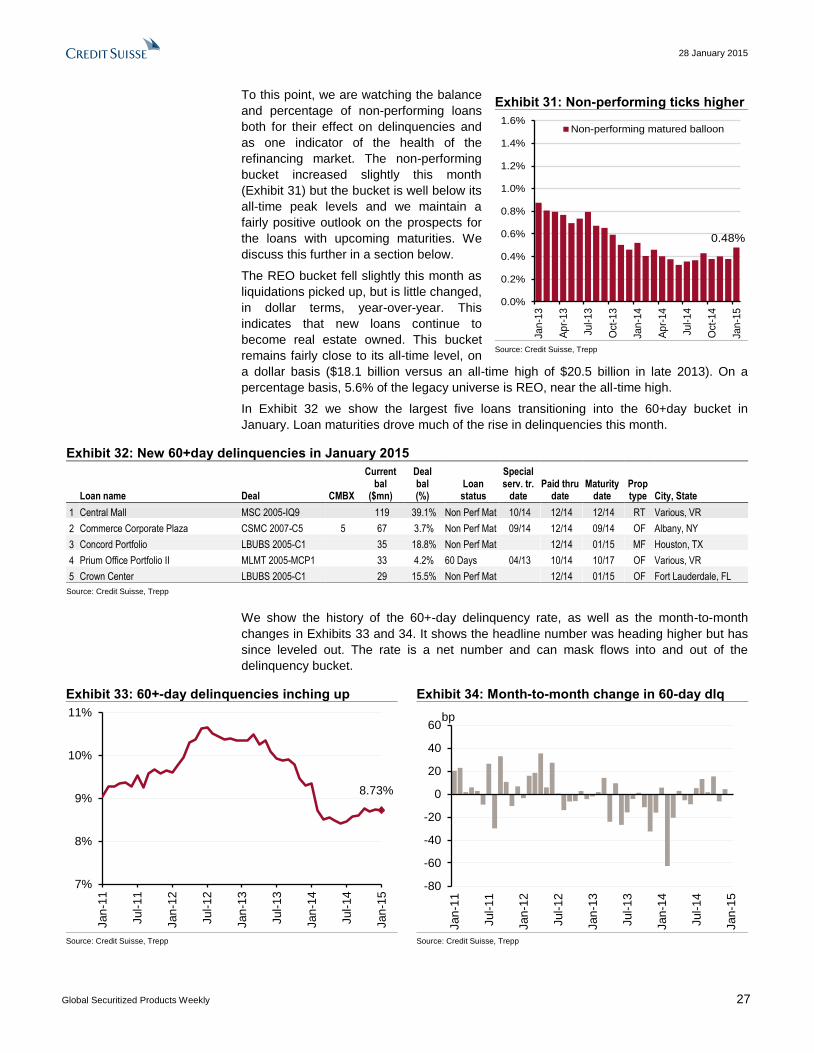
28 January 2015
Global Securitized Products Weekly 27
To this point, we are watching the balance
and percentage of non-performing loans
both for their effect on delinquencies and
as one indicator of the health of the
refinancing market. The non-performing
bucket increased slightly this month
(Exhibit 31) but the bucket is well below its
all-time peak levels and we maintain a
fairly positive outlook on the prospects for
the loans with upcoming maturities. We
discuss this further in a section below.
The REO bucket fell slightly this month as
liquidations picked up, but is little changed,
in dollar terms, year-over-year. This
indicates that new loans continue to
become real estate owned. This bucket
remains fairly close to its all-time level, on
a dollar basis ($18.1 billion versus an all-time high of $20.5 billion in late 2013). On a
percentage basis, 5.6% of the legacy universe is REO, near the all-time high.
In Exhibit 32 we show the largest five loans transitioning into the 60+day bucket in
January. Loan maturities drove much of the rise in delinquencies this month.
Exhibit 32: New 60+day delinquencies in January 2015
Loan name Deal CMBX
Current bal
($mn)
Deal bal (%)
Loan status
Special serv. tr.
date Paid thru
date Maturity
date Prop type City, State
1 Central Mall MSC 2005-IQ9 119 39.1% Non Perf Mat 10/14 12/14 12/14 RT Various, VR
2 Commerce Corporate Plaza CSMC 2007-C5 5 67 3.7% Non Perf Mat 09/14 12/14 09/14 OF Albany, NY
3 Concord Portfolio LBUBS 2005-C1 35 18.8% Non Perf Mat 12/14 01/15 MF Houston, TX
4 Prium Office Portfolio II MLMT 2005-MCP1 33 4.2% 60 Days 04/13 10/14 10/17 OF Various, VR
5 Crown Center LBUBS 2005-C1 29 15.5% Non Perf Mat 12/14 01/15 OF Fort Lauderdale, FL
Source: Credit Suisse, Trepp
We show the history of the 60+-day delinquency rate, as well as the month-to-month
changes in Exhibits 33 and 34. It shows the headline number was heading higher but has
since leveled out. The rate is a net number and can mask flows into and out of the
delinquency bucket.
Exhibit 33: 60+-day delinquencies inching up Exhibit 34: Month-to-month change in 60-day dlq
8.73%
7%
8%
9%
10%
11%
Jan
-11
Jul-
11
Jan
-12
Jul-
12
Jan
-13
Jul-
13
Jan
-14
Jul-
14
Jan
-15
-80
-60
-40
-20
0
20
40
60
Jan
-11
Jul-
11
Jan
-12
Jul-
12
Jan
-13
Jul-
13
Jan
-14
Jul-
14
Jan
-15
bp
Source: Credit Suisse, Trepp Source: Credit Suisse, Trepp
Exhibit 31: Non-performing ticks higher
0.48%
0.0%
0.2%
0.4%
0.6%
0.8%
1.0%
1.2%
1.4%
1.6%
Jan
-13
Ap
r-13
Jul-1
3
Oct
-13
Jan
-14
Ap
r-14
Jul-1
4
Oct
-14
Jan
-15
Non-performing matured balloon
Source: Credit Suisse, Trepp
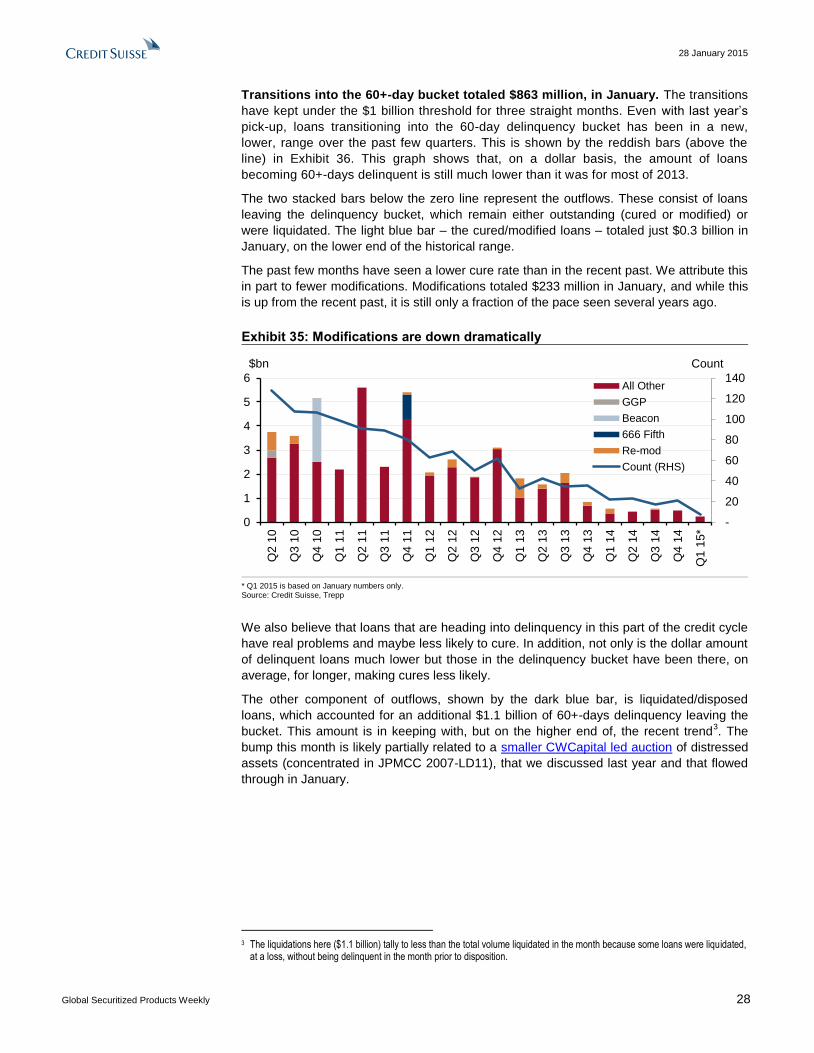
28 January 2015
Global Securitized Products Weekly 28
Transitions into the 60+-day bucket totaled $863 million, in January. The transitions
have kept under the $1 billion threshold for three straight months. Even with last year’s
pick-up, loans transitioning into the 60-day delinquency bucket has been in a new,
lower, range over the past few quarters. This is shown by the reddish bars (above the
line) in Exhibit 36. This graph shows that, on a dollar basis, the amount of loans
becoming 60+-days delinquent is still much lower than it was for most of 2013.
The two stacked bars below the zero line represent the outflows. These consist of loans
leaving the delinquency bucket, which remain either outstanding (cured or modified) or
were liquidated. The light blue bar – the cured/modified loans – totaled just $0.3 billion in
January, on the lower end of the historical range.
The past few months have seen a lower cure rate than in the recent past. We attribute this
in part to fewer modifications. Modifications totaled $233 million in January, and while this
is up from the recent past, it is still only a fraction of the pace seen several years ago.
Exhibit 35: Modifications are down dramatically
-
20
40
60
80
100
120
140
0
1
2
3
4
5
6
Q2
10
Q3
10
Q4
10
Q1
11
Q2
11
Q3
11
Q4
11
Q1
12
Q2 1
2
Q3
12
Q4
12
Q1
13
Q2
13
Q3
13
Q4
13
Q1
14
Q2
14
Q3
14
Q4
14
Q1
15*
All Other
GGP
Beacon
666 Fifth
Re-mod
Count (RHS)
$bn Count
* Q1 2015 is based on January numbers only. Source: Credit Suisse, Trepp
We also believe that loans that are heading into delinquency in this part of the credit cycle
have real problems and maybe less likely to cure. In addition, not only is the dollar amount
of delinquent loans much lower but those in the delinquency bucket have been there, on
average, for longer, making cures less likely.
The other component of outflows, shown by the dark blue bar, is liquidated/disposed
loans, which accounted for an additional $1.1 billion of 60+-days delinquency leaving the
bucket. This amount is in keeping with, but on the higher end of, the recent trend3. The
bump this month is likely partially related to a smaller CWCapital led auction of distressed
assets (concentrated in JPMCC 2007-LD11), that we discussed last year and that flowed
through in January.
3 The liquidations here ($1.1 billion) tally to less than the total volume liquidated in the month because some loans were liquidated,
at a loss, without being delinquent in the month prior to disposition.
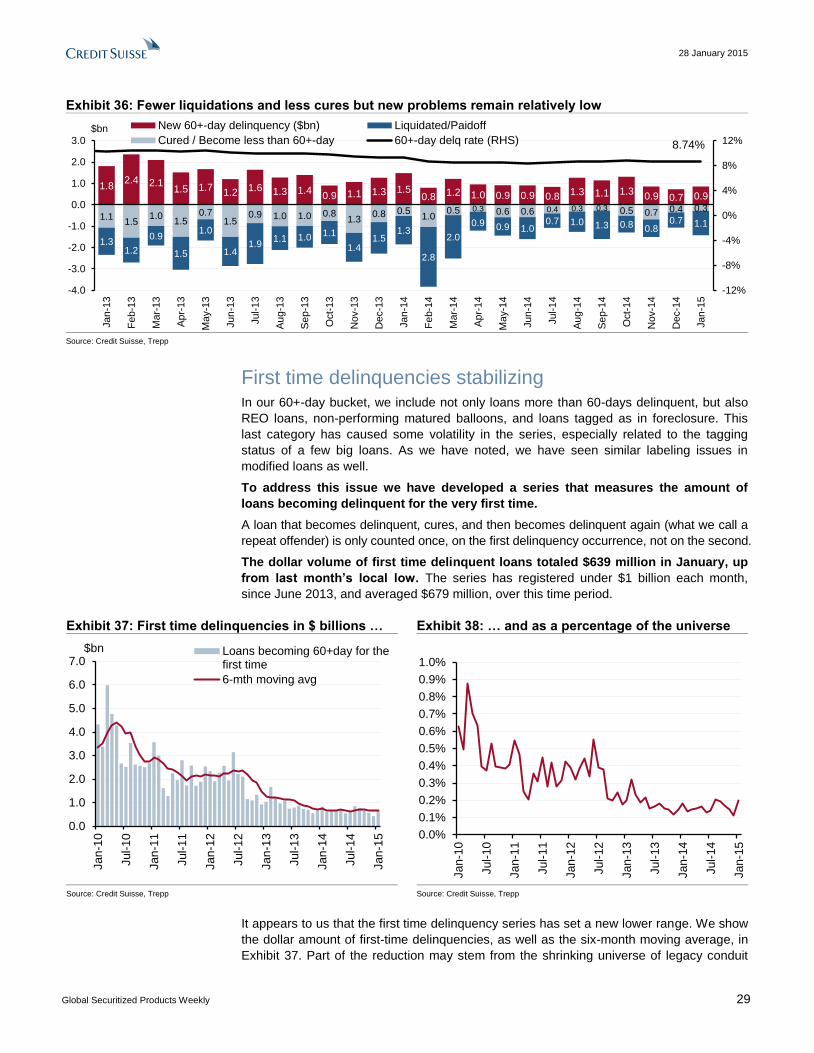
28 January 2015
Global Securitized Products Weekly 29
Exhibit 36: Fewer liquidations and less cures but new problems remain relatively low
1.11.5
1.01.5
0.71.5
0.9 1.0 1.0 0.81.3
0.8 0.51.0
0.5 0.3 0.6 0.6 0.4 0.3 0.3 0.5 0.7 0.4 0.3
1.31.2
0.9
1.5
1.0
1.41.9
1.1 1.0 1.1
1.41.5
1.3
2.8
2.0
0.9 0.9 1.00.7 1.0 1.3 0.8 0.8
0.7 1.1
1.82.4 2.1
1.5 1.71.2 1.6 1.3 1.4
0.9 1.1 1.3 1.50.8 1.2 1.0 0.9 0.9 0.8 1.3 1.1 1.3
0.9 0.7 0.9
8.74%
-12%
-8%
-4%
0%
4%
8%
12%
-4.0
-3.0
-2.0
-1.0
0.0
1.0
2.0
3.0
Jan
-13
Fe
b-1
3
Ma
r-13
Ap
r-13
May-1
3
Jun
-13
Jul-1
3
Au
g-1
3
Se
p-1
3
Oct-
13
Nov-1
3
Dec-1
3
Jan
-14
Fe
b-1
4
Ma
r-14
Ap
r-14
May-1
4
Jun
-14
Jul-1
4
Au
g-1
4
Se
p-1
4
Oct-
14
Nov-1
4
Dec-1
4
Jan
-15
New 60+-day delinquency ($bn) Liquidated/Paidoff
Cured / Become less than 60+-day 60+-day delq rate (RHS)
CurL
$bn
CurLCurLCurLCurLCurLCurLCurL
Source: Credit Suisse, Trepp
First time delinquencies stabilizing In our 60+-day bucket, we include not only loans more than 60-days delinquent, but also
REO loans, non-performing matured balloons, and loans tagged as in foreclosure. This
last category has caused some volatility in the series, especially related to the tagging
status of a few big loans. As we have noted, we have seen similar labeling issues in
modified loans as well.
To address this issue we have developed a series that measures the amount of
loans becoming delinquent for the very first time.
A loan that becomes delinquent, cures, and then becomes delinquent again (what we call a
repeat offender) is only counted once, on the first delinquency occurrence, not on the second.
The dollar volume of first time delinquent loans totaled $639 million in January, up
from last month’s local low. The series has registered under $1 billion each month,
since June 2013, and averaged $679 million, over this time period.
Exhibit 37: First time delinquencies in $ billions … Exhibit 38: … and as a percentage of the universe
0.0
1.0
2.0
3.0
4.0
5.0
6.0
7.0
Jan
-10
Jul-
10
Jan
-11
Jul-
11
Jan
-12
Jul-
12
Jan
-13
Jul-
13
Jan
-14
Jul-
14
Jan
-15
Loans becoming 60+day for thefirst time
6-mth moving avg
$bn
0.0%
0.1%
0.2%
0.3%
0.4%
0.5%
0.6%
0.7%
0.8%
0.9%
1.0%
Jan
-10
Jul-
10
Jan
-11
Jul-
11
Jan
-12
Jul-
12
Jan
-13
Jul-
13
Jan
-14
Jul-
14
Jan
-15
Source: Credit Suisse, Trepp Source: Credit Suisse, Trepp
It appears to us that the first time delinquency series has set a new lower range. We show
the dollar amount of first-time delinquencies, as well as the six-month moving average, in
Exhibit 37. Part of the reduction may stem from the shrinking universe of legacy conduit
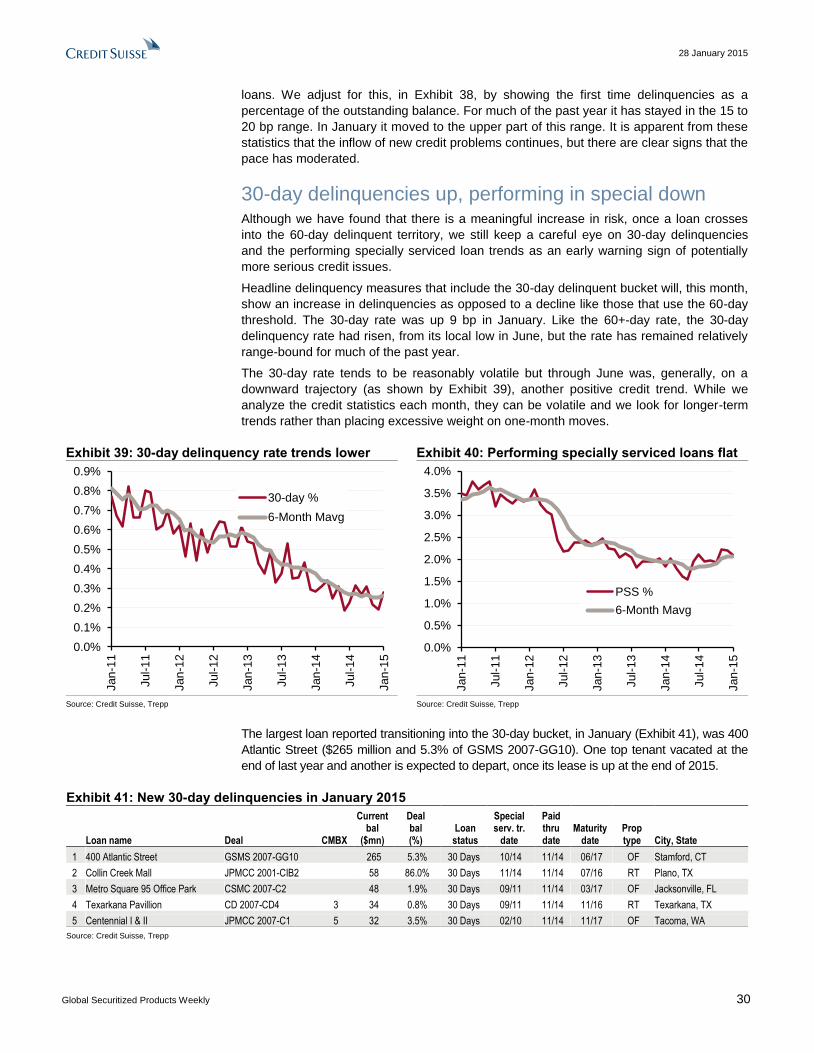
28 January 2015
Global Securitized Products Weekly 30
loans. We adjust for this, in Exhibit 38, by showing the first time delinquencies as a
percentage of the outstanding balance. For much of the past year it has stayed in the 15 to
20 bp range. In January it moved to the upper part of this range. It is apparent from these
statistics that the inflow of new credit problems continues, but there are clear signs that the
pace has moderated.
30-day delinquencies up, performing in special down Although we have found that there is a meaningful increase in risk, once a loan crosses
into the 60-day delinquent territory, we still keep a careful eye on 30-day delinquencies
and the performing specially serviced loan trends as an early warning sign of potentially
more serious credit issues.
Headline delinquency measures that include the 30-day delinquent bucket will, this month,
show an increase in delinquencies as opposed to a decline like those that use the 60-day
threshold. The 30-day rate was up 9 bp in January. Like the 60+-day rate, the 30-day
delinquency rate had risen, from its local low in June, but the rate has remained relatively
range-bound for much of the past year.
The 30-day rate tends to be reasonably volatile but through June was, generally, on a
downward trajectory (as shown by Exhibit 39), another positive credit trend. While we
analyze the credit statistics each month, they can be volatile and we look for longer-term
trends rather than placing excessive weight on one-month moves.
Exhibit 39: 30-day delinquency rate trends lower Exhibit 40: Performing specially serviced loans flat
0.0%
0.1%
0.2%
0.3%
0.4%
0.5%
0.6%
0.7%
0.8%
0.9%
Jan
-11
Jul-
11
Jan
-12
Jul-
12
Jan
-13
Jul-
13
Jan
-14
Jul-
14
Jan
-15
30-day %
6-Month Mavg
0.0%
0.5%
1.0%
1.5%
2.0%
2.5%
3.0%
3.5%
4.0%Jan
-11
Jul-
11
Jan
-12
Jul-
12
Jan
-13
Jul-
13
Jan
-14
Jul-
14
Jan
-15
PSS %
6-Month Mavg
Source: Credit Suisse, Trepp Source: Credit Suisse, Trepp
The largest loan reported transitioning into the 30-day bucket, in January (Exhibit 41), was 400
Atlantic Street ($265 million and 5.3% of GSMS 2007-GG10). One top tenant vacated at the
end of last year and another is expected to depart, once its lease is up at the end of 2015.
Exhibit 41: New 30-day delinquencies in January 2015
Loan name Deal CMBX
Current bal
($mn)
Deal bal (%)
Loan status
Special serv. tr.
date
Paid thru date
Maturity date
Prop type City, State
1 400 Atlantic Street GSMS 2007-GG10 265 5.3% 30 Days 10/14 11/14 06/17 OF Stamford, CT
2 Collin Creek Mall JPMCC 2001-CIB2 58 86.0% 30 Days 11/14 11/14 07/16 RT Plano, TX
3 Metro Square 95 Office Park CSMC 2007-C2 48 1.9% 30 Days 09/11 11/14 03/17 OF Jacksonville, FL
4 Texarkana Pavillion CD 2007-CD4 3 34 0.8% 30 Days 09/11 11/14 11/16 RT Texarkana, TX
5 Centennial I & II JPMCC 2007-C1 5 32 3.5% 30 Days 02/10 11/14 11/17 OF Tacoma, WA
Source: Credit Suisse, Trepp
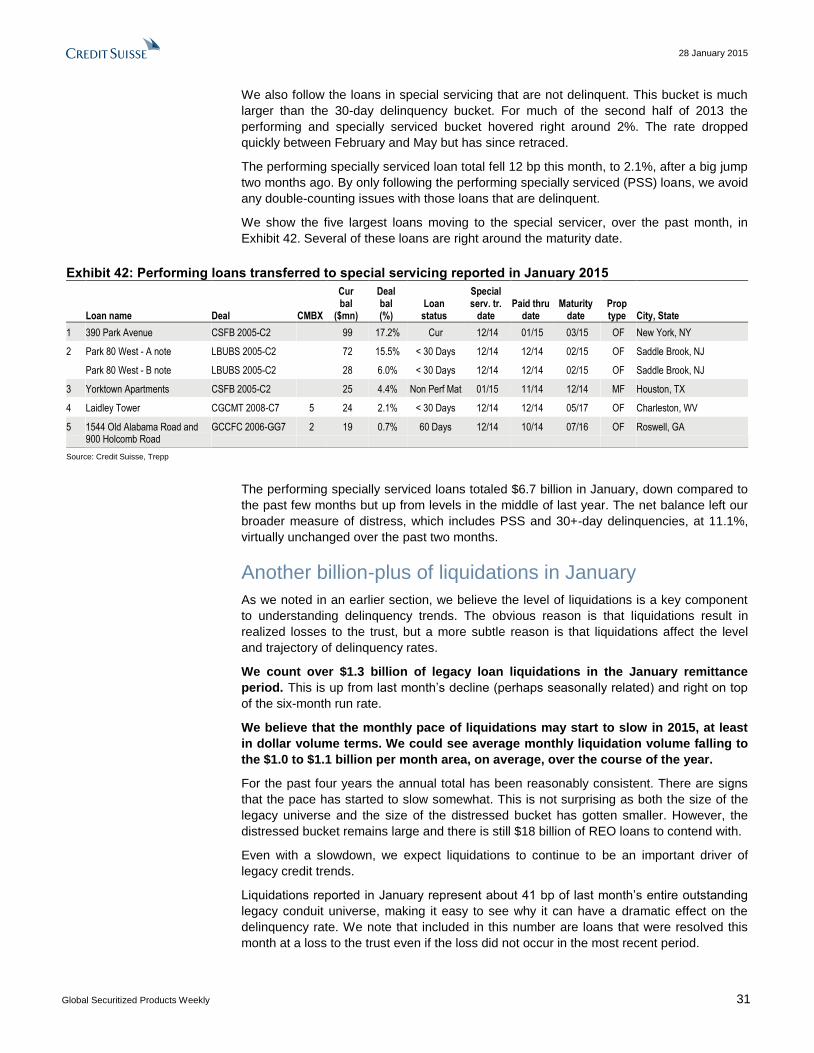
28 January 2015
Global Securitized Products Weekly 31
We also follow the loans in special servicing that are not delinquent. This bucket is much
larger than the 30-day delinquency bucket. For much of the second half of 2013 the
performing and specially serviced bucket hovered right around 2%. The rate dropped
quickly between February and May but has since retraced.
The performing specially serviced loan total fell 12 bp this month, to 2.1%, after a big jump
two months ago. By only following the performing specially serviced (PSS) loans, we avoid
any double-counting issues with those loans that are delinquent.
We show the five largest loans moving to the special servicer, over the past month, in
Exhibit 42. Several of these loans are right around the maturity date.
Exhibit 42: Performing loans transferred to special servicing reported in January 2015
Loan name Deal CMBX
Cur bal
($mn)
Deal bal (%)
Loan status
Special serv. tr.
date Paid thru
date Maturity
date Prop type City, State
1 390 Park Avenue CSFB 2005-C2 99 17.2% Cur 12/14 01/15 03/15 OF New York, NY
2 Park 80 West - A note LBUBS 2005-C2 72 15.5% < 30 Days 12/14 12/14 02/15 OF Saddle Brook, NJ
Park 80 West - B note LBUBS 2005-C2 28 6.0% < 30 Days 12/14 12/14 02/15 OF Saddle Brook, NJ
3 Yorktown Apartments CSFB 2005-C2 25 4.4% Non Perf Mat 01/15 11/14 12/14 MF Houston, TX
4 Laidley Tower CGCMT 2008-C7 5 24 2.1% < 30 Days 12/14 12/14 05/17 OF Charleston, WV
5 1544 Old Alabama Road and 900 Holcomb Road
GCCFC 2006-GG7 2 19 0.7% 60 Days 12/14 10/14 07/16 OF Roswell, GA
Source: Credit Suisse, Trepp
The performing specially serviced loans totaled $6.7 billion in January, down compared to
the past few months but up from levels in the middle of last year. The net balance left our
broader measure of distress, which includes PSS and 30+-day delinquencies, at 11.1%,
virtually unchanged over the past two months.
Another billion-plus of liquidations in January
As we noted in an earlier section, we believe the level of liquidations is a key component
to understanding delinquency trends. The obvious reason is that liquidations result in
realized losses to the trust, but a more subtle reason is that liquidations affect the level
and trajectory of delinquency rates.
We count over $1.3 billion of legacy loan liquidations in the January remittance
period. This is up from last month’s decline (perhaps seasonally related) and right on top
of the six-month run rate.
We believe that the monthly pace of liquidations may start to slow in 2015, at least
in dollar volume terms. We could see average monthly liquidation volume falling to
the $1.0 to $1.1 billion per month area, on average, over the course of the year.
For the past four years the annual total has been reasonably consistent. There are signs
that the pace has started to slow somewhat. This is not surprising as both the size of the
legacy universe and the size of the distressed bucket has gotten smaller. However, the
distressed bucket remains large and there is still $18 billion of REO loans to contend with.
Even with a slowdown, we expect liquidations to continue to be an important driver of
legacy credit trends.
Liquidations reported in January represent about 41 bp of last month’s entire outstanding
legacy conduit universe, making it easy to see why it can have a dramatic effect on the
delinquency rate. We note that included in this number are loans that were resolved this
month at a loss to the trust even if the loss did not occur in the most recent period.
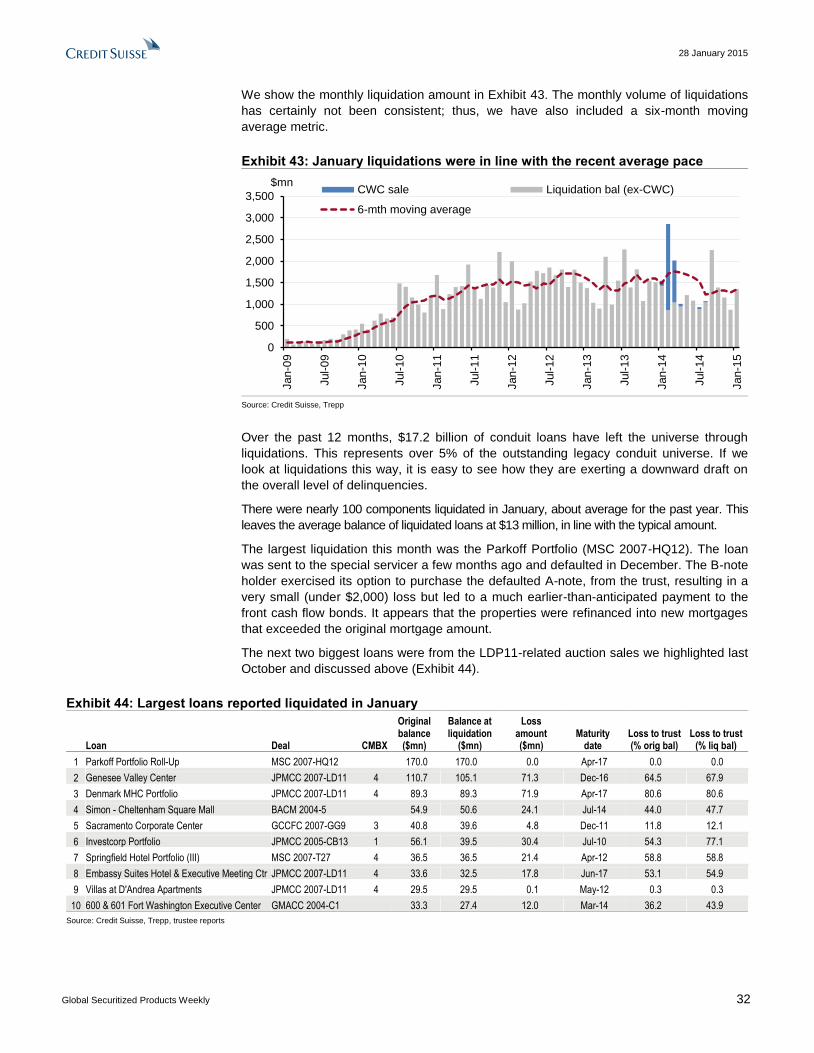
28 January 2015
Global Securitized Products Weekly 32
We show the monthly liquidation amount in Exhibit 43. The monthly volume of liquidations
has certainly not been consistent; thus, we have also included a six-month moving
average metric.
Exhibit 43: January liquidations were in line with the recent average pace
0
500
1,000
1,500
2,000
2,500
3,000
3,500
Jan
-09
Jul-
09
Jan
-10
Jul-
10
Jan
-11
Jul-
11
Jan
-12
Jul-
12
Jan
-13
Jul-
13
Jan
-14
Jul-
14
Jan
-15
CWC sale Liquidation bal (ex-CWC)
6-mth moving average
$mn
Source: Credit Suisse, Trepp
Over the past 12 months, $17.2 billion of conduit loans have left the universe through
liquidations. This represents over 5% of the outstanding legacy conduit universe. If we
look at liquidations this way, it is easy to see how they are exerting a downward draft on
the overall level of delinquencies.
There were nearly 100 components liquidated in January, about average for the past year. This
leaves the average balance of liquidated loans at $13 million, in line with the typical amount.
The largest liquidation this month was the Parkoff Portfolio (MSC 2007-HQ12). The loan
was sent to the special servicer a few months ago and defaulted in December. The B-note
holder exercised its option to purchase the defaulted A-note, from the trust, resulting in a
very small (under $2,000) loss but led to a much earlier-than-anticipated payment to the
front cash flow bonds. It appears that the properties were refinanced into new mortgages
that exceeded the original mortgage amount.
The next two biggest loans were from the LDP11-related auction sales we highlighted last
October and discussed above (Exhibit 44).
Exhibit 44: Largest loans reported liquidated in January
Loan Deal CMBX
Original balance ($mn)
Balance at liquidation
($mn)
Loss amount ($mn)
Maturity date
Loss to trust (% orig bal)
Loss to trust (% liq bal)
1 Parkoff Portfolio Roll-Up MSC 2007-HQ12 170.0 170.0 0.0 Apr-17 0.0 0.0
2 Genesee Valley Center JPMCC 2007-LD11 4 110.7 105.1 71.3 Dec-16 64.5 67.9
3 Denmark MHC Portfolio JPMCC 2007-LD11 4 89.3 89.3 71.9 Apr-17 80.6 80.6
4 Simon - Cheltenham Square Mall BACM 2004-5 54.9 50.6 24.1 Jul-14 44.0 47.7
5 Sacramento Corporate Center GCCFC 2007-GG9 3 40.8 39.6 4.8 Dec-11 11.8 12.1
6 Investcorp Portfolio JPMCC 2005-CB13 1 56.1 39.5 30.4 Jul-10 54.3 77.1
7 Springfield Hotel Portfolio (III) MSC 2007-T27 4 36.5 36.5 21.4 Apr-12 58.8 58.8
8 Embassy Suites Hotel & Executive Meeting Ctr JPMCC 2007-LD11 4 33.6 32.5 17.8 Jun-17 53.1 54.9
9 Villas at D'Andrea Apartments JPMCC 2007-LD11 4 29.5 29.5 0.1 May-12 0.3 0.3
10 600 & 601 Fort Washington Executive Center GMACC 2004-C1 33.3 27.4 12.0 Mar-14 36.2 43.9
Source: Credit Suisse, Trepp, trustee reports
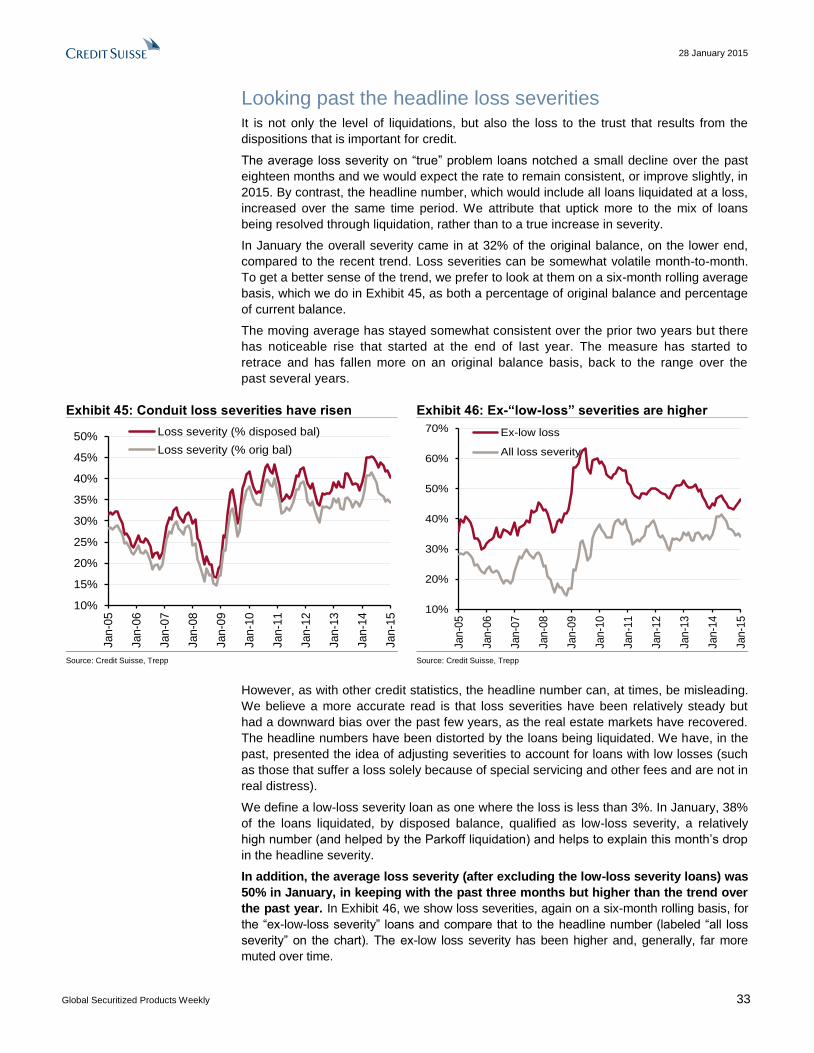
28 January 2015
Global Securitized Products Weekly 33
Looking past the headline loss severities It is not only the level of liquidations, but also the loss to the trust that results from the
dispositions that is important for credit.
The average loss severity on “true” problem loans notched a small decline over the past
eighteen months and we would expect the rate to remain consistent, or improve slightly, in
2015. By contrast, the headline number, which would include all loans liquidated at a loss,
increased over the same time period. We attribute that uptick more to the mix of loans
being resolved through liquidation, rather than to a true increase in severity.
In January the overall severity came in at 32% of the original balance, on the lower end,
compared to the recent trend. Loss severities can be somewhat volatile month-to-month.
To get a better sense of the trend, we prefer to look at them on a six-month rolling average
basis, which we do in Exhibit 45, as both a percentage of original balance and percentage
of current balance.
The moving average has stayed somewhat consistent over the prior two years but there
has noticeable rise that started at the end of last year. The measure has started to
retrace and has fallen more on an original balance basis, back to the range over the
past several years.
Exhibit 45: Conduit loss severities have risen Exhibit 46: Ex-“low-loss” severities are higher
10%
15%
20%
25%
30%
35%
40%
45%
50%
Jan
-05
Jan
-06
Jan
-07
Jan
-08
Jan
-09
Jan
-10
Jan
-11
Jan
-12
Jan
-13
Jan
-14
Jan
-15
Loss severity (% disposed bal)
Loss severity (% orig bal)
10%
20%
30%
40%
50%
60%
70%
Jan
-05
Jan
-06
Jan
-07
Jan
-08
Jan
-09
Jan
-10
Jan
-11
Jan
-12
Jan
-13
Jan
-14
Jan
-15
Ex-low loss
All loss severity
Source: Credit Suisse, Trepp Source: Credit Suisse, Trepp
However, as with other credit statistics, the headline number can, at times, be misleading.
We believe a more accurate read is that loss severities have been relatively steady but
had a downward bias over the past few years, as the real estate markets have recovered.
The headline numbers have been distorted by the loans being liquidated. We have, in the
past, presented the idea of adjusting severities to account for loans with low losses (such
as those that suffer a loss solely because of special servicing and other fees and are not in
real distress).
We define a low-loss severity loan as one where the loss is less than 3%. In January, 38%
of the loans liquidated, by disposed balance, qualified as low-loss severity, a relatively
high number (and helped by the Parkoff liquidation) and helps to explain this month’s drop
in the headline severity.
In addition, the average loss severity (after excluding the low-loss severity loans) was
50% in January, in keeping with the past three months but higher than the trend over
the past year. In Exhibit 46, we show loss severities, again on a six-month rolling basis, for
the “ex-low-loss severity” loans and compare that to the headline number (labeled “all loss
severity” on the chart). The ex-low loss severity has been higher and, generally, far more
muted over time.
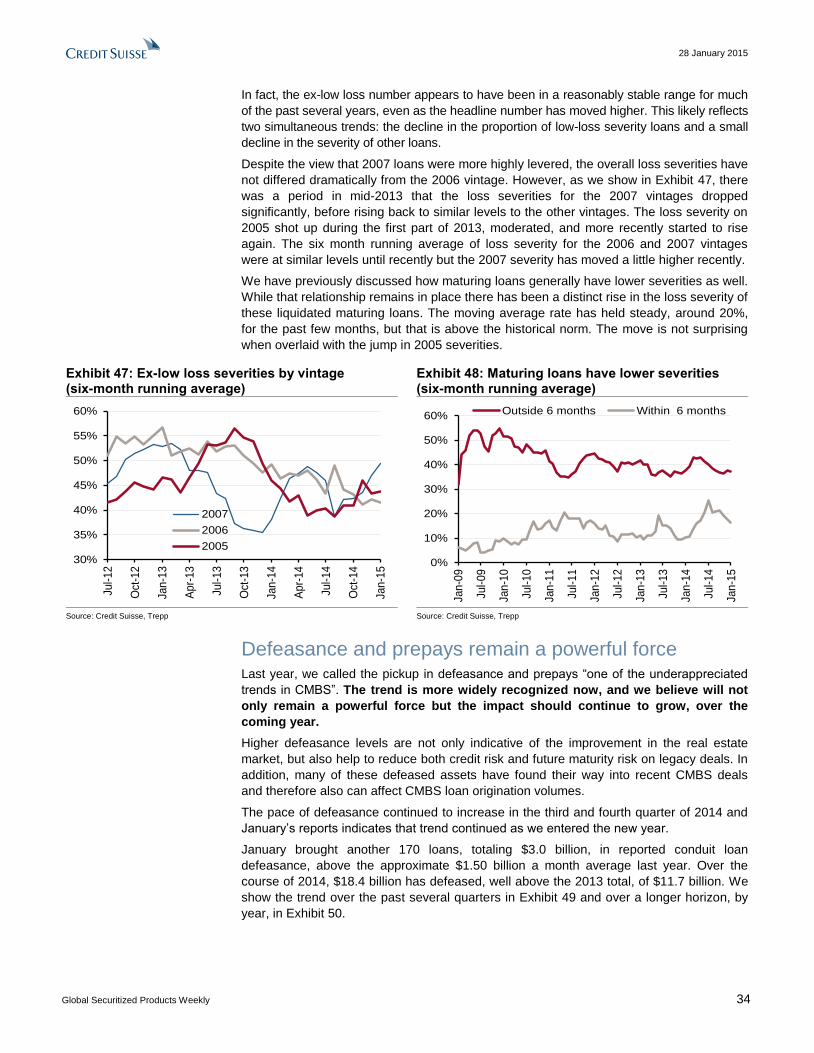
28 January 2015
Global Securitized Products Weekly 34
In fact, the ex-low loss number appears to have been in a reasonably stable range for much
of the past several years, even as the headline number has moved higher. This likely reflects
two simultaneous trends: the decline in the proportion of low-loss severity loans and a small
decline in the severity of other loans.
Despite the view that 2007 loans were more highly levered, the overall loss severities have
not differed dramatically from the 2006 vintage. However, as we show in Exhibit 47, there
was a period in mid-2013 that the loss severities for the 2007 vintages dropped
significantly, before rising back to similar levels to the other vintages. The loss severity on
2005 shot up during the first part of 2013, moderated, and more recently started to rise
again. The six month running average of loss severity for the 2006 and 2007 vintages
were at similar levels until recently but the 2007 severity has moved a little higher recently.
We have previously discussed how maturing loans generally have lower severities as well.
While that relationship remains in place there has been a distinct rise in the loss severity of
these liquidated maturing loans. The moving average rate has held steady, around 20%,
for the past few months, but that is above the historical norm. The move is not surprising
when overlaid with the jump in 2005 severities.
Exhibit 47: Ex-low loss severities by vintage (six-month running average)
Exhibit 48: Maturing loans have lower severities (six-month running average)
30%
35%
40%
45%
50%
55%
60%
Jul-
12
Oct
-12
Jan-1
3
Ap
r-13
Jul-
13
Oct
-13
Jan
-14
Ap
r-14
Jul-
14
Oct
-14
Jan
-15
2007
2006
2005
0%
10%
20%
30%
40%
50%
60%
Jan
-09
Jul-
09
Jan
-10
Jul-
10
Jan-1
1
Jul-
11
Jan
-12
Jul-
12
Jan
-13
Jul-
13
Jan
-14
Jul-
14
Jan
-15
Outside 6 months Within 6 months
Source: Credit Suisse, Trepp Source: Credit Suisse, Trepp
Defeasance and prepays remain a powerful force Last year, we called the pickup in defeasance and prepays “one of the underappreciated
trends in CMBS”. The trend is more widely recognized now, and we believe will not
only remain a powerful force but the impact should continue to grow, over the
coming year.
Higher defeasance levels are not only indicative of the improvement in the real estate
market, but also help to reduce both credit risk and future maturity risk on legacy deals. In
addition, many of these defeased assets have found their way into recent CMBS deals
and therefore also can affect CMBS loan origination volumes.
The pace of defeasance continued to increase in the third and fourth quarter of 2014 and
January’s reports indicates that trend continued as we entered the new year.
January brought another 170 loans, totaling $3.0 billion, in reported conduit loan
defeasance, above the approximate $1.50 billion a month average last year. Over the
course of 2014, $18.4 billion has defeased, well above the 2013 total, of $11.7 billion. We
show the trend over the past several quarters in Exhibit 49 and over a longer horizon, by
year, in Exhibit 50.
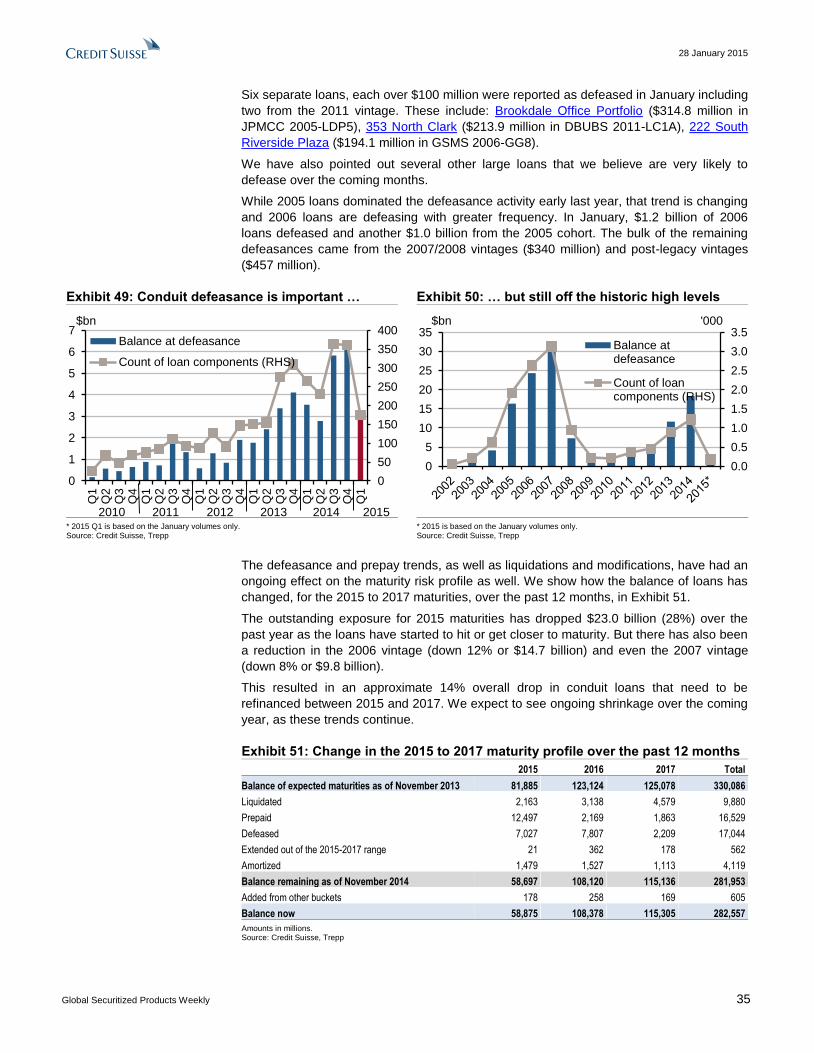
28 January 2015
Global Securitized Products Weekly 35
Six separate loans, each over $100 million were reported as defeased in January including
two from the 2011 vintage. These include: Brookdale Office Portfolio ($314.8 million in
JPMCC 2005-LDP5), 353 North Clark ($213.9 million in DBUBS 2011-LC1A), 222 South
Riverside Plaza ($194.1 million in GSMS 2006-GG8).
We have also pointed out several other large loans that we believe are very likely to
defease over the coming months.
While 2005 loans dominated the defeasance activity early last year, that trend is changing
and 2006 loans are defeasing with greater frequency. In January, $1.2 billion of 2006
loans defeased and another $1.0 billion from the 2005 cohort. The bulk of the remaining
defeasances came from the 2007/2008 vintages ($340 million) and post-legacy vintages
($457 million).
Exhibit 49: Conduit defeasance is important … Exhibit 50: … but still off the historic high levels
0
50
100
150
200
250
300
350
400
0
1
2
3
4
5
6
7
Q1
Q2
Q3
Q4
Q1
Q2
Q3
Q4
Q1
Q2
Q3
Q4
Q1
Q2
Q3
Q4
Q1
Q2
Q3
Q4
Q1
Balance at defeasance
Count of loan components (RHS)
$bn
2013 2014201220112010 2015
0.0
0.5
1.0
1.5
2.0
2.5
3.0
3.5
0
5
10
15
20
25
30
35
Th
ou
sa
nd
s
Balance atdefeasance
Count of loancomponents (RHS)
$bn '000
* 2015 Q1 is based on the January volumes only. Source: Credit Suisse, Trepp
* 2015 is based on the January volumes only. Source: Credit Suisse, Trepp
The defeasance and prepay trends, as well as liquidations and modifications, have had an
ongoing effect on the maturity risk profile as well. We show how the balance of loans has
changed, for the 2015 to 2017 maturities, over the past 12 months, in Exhibit 51.
The outstanding exposure for 2015 maturities has dropped $23.0 billion (28%) over the
past year as the loans have started to hit or get closer to maturity. But there has also been
a reduction in the 2006 vintage (down 12% or $14.7 billion) and even the 2007 vintage
(down 8% or $9.8 billion).
This resulted in an approximate 14% overall drop in conduit loans that need to be
refinanced between 2015 and 2017. We expect to see ongoing shrinkage over the coming
year, as these trends continue.
Exhibit 51: Change in the 2015 to 2017 maturity profile over the past 12 months
2015 2016 2017 Total
Balance of expected maturities as of November 2013 81,885 123,124 125,078 330,086
Liquidated 2,163 3,138 4,579 9,880
Prepaid 12,497 2,169 1,863 16,529
Defeased 7,027 7,807 2,209 17,044
Extended out of the 2015-2017 range 21 362 178 562
Amortized 1,479 1,527 1,113 4,119
Balance remaining as of November 2014 58,697 108,120 115,136 281,953
Added from other buckets 178 258 169 605
Balance now 58,875 108,378 115,305 282,557
Amounts in millions. Source: Credit Suisse, Trepp
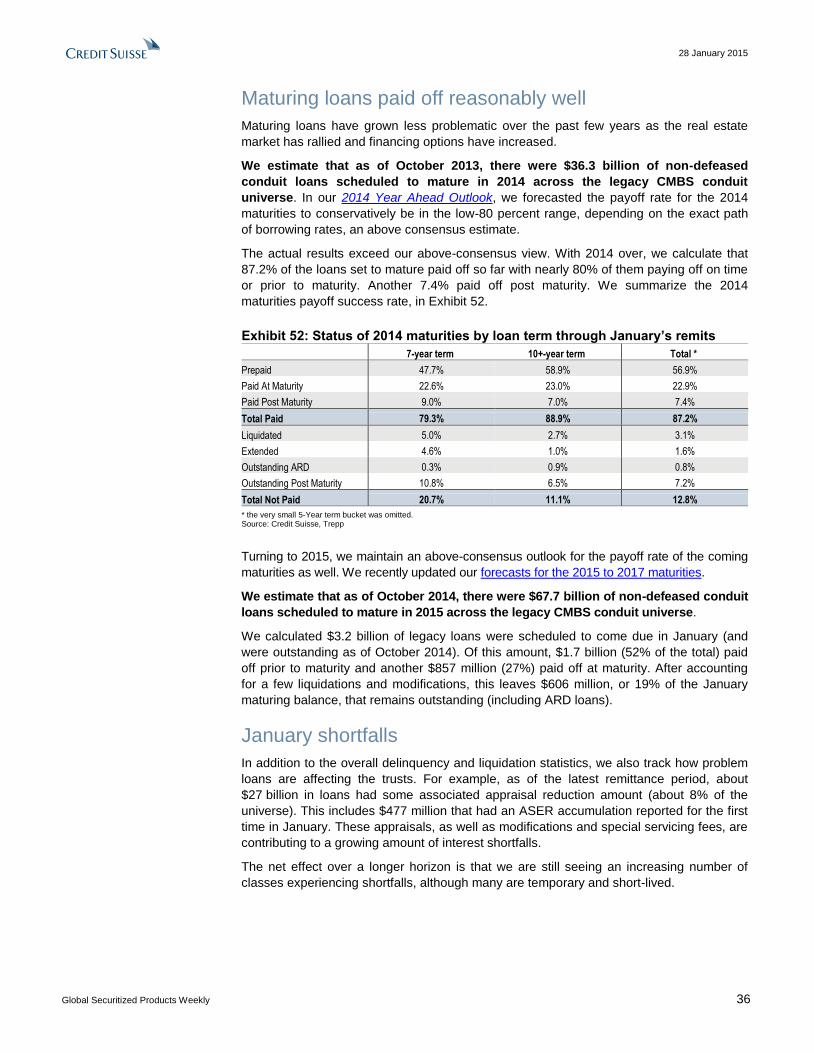
28 January 2015
Global Securitized Products Weekly 36
Maturing loans paid off reasonably well
Maturing loans have grown less problematic over the past few years as the real estate
market has rallied and financing options have increased.
We estimate that as of October 2013, there were $36.3 billion of non-defeased
conduit loans scheduled to mature in 2014 across the legacy CMBS conduit
universe. In our 2014 Year Ahead Outlook, we forecasted the payoff rate for the 2014
maturities to conservatively be in the low-80 percent range, depending on the exact path
of borrowing rates, an above consensus estimate.
The actual results exceed our above-consensus view. With 2014 over, we calculate that
87.2% of the loans set to mature paid off so far with nearly 80% of them paying off on time
or prior to maturity. Another 7.4% paid off post maturity. We summarize the 2014
maturities payoff success rate, in Exhibit 52.
Exhibit 52: Status of 2014 maturities by loan term through January’s remits
7-year term 10+-year term Total *
Prepaid 47.7% 58.9% 56.9%
Paid At Maturity 22.6% 23.0% 22.9%
Paid Post Maturity 9.0% 7.0% 7.4%
Total Paid 79.3% 88.9% 87.2%
Liquidated 5.0% 2.7% 3.1%
Extended 4.6% 1.0% 1.6%
Outstanding ARD 0.3% 0.9% 0.8%
Outstanding Post Maturity 10.8% 6.5% 7.2%
Total Not Paid 20.7% 11.1% 12.8%
* the very small 5-Year term bucket was omitted. Source: Credit Suisse, Trepp
Turning to 2015, we maintain an above-consensus outlook for the payoff rate of the coming
maturities as well. We recently updated our forecasts for the 2015 to 2017 maturities.
We estimate that as of October 2014, there were $67.7 billion of non-defeased conduit
loans scheduled to mature in 2015 across the legacy CMBS conduit universe.
We calculated $3.2 billion of legacy loans were scheduled to come due in January (and
were outstanding as of October 2014). Of this amount, $1.7 billion (52% of the total) paid
off prior to maturity and another $857 million (27%) paid off at maturity. After accounting
for a few liquidations and modifications, this leaves $606 million, or 19% of the January
maturing balance, that remains outstanding (including ARD loans).
January shortfalls
In addition to the overall delinquency and liquidation statistics, we also track how problem
loans are affecting the trusts. For example, as of the latest remittance period, about
$27 billion in loans had some associated appraisal reduction amount (about 8% of the
universe). This includes $477 million that had an ASER accumulation reported for the first
time in January. These appraisals, as well as modifications and special servicing fees, are
contributing to a growing amount of interest shortfalls.
The net effect over a longer horizon is that we are still seeing an increasing number of
classes experiencing shortfalls, although many are temporary and short-lived.
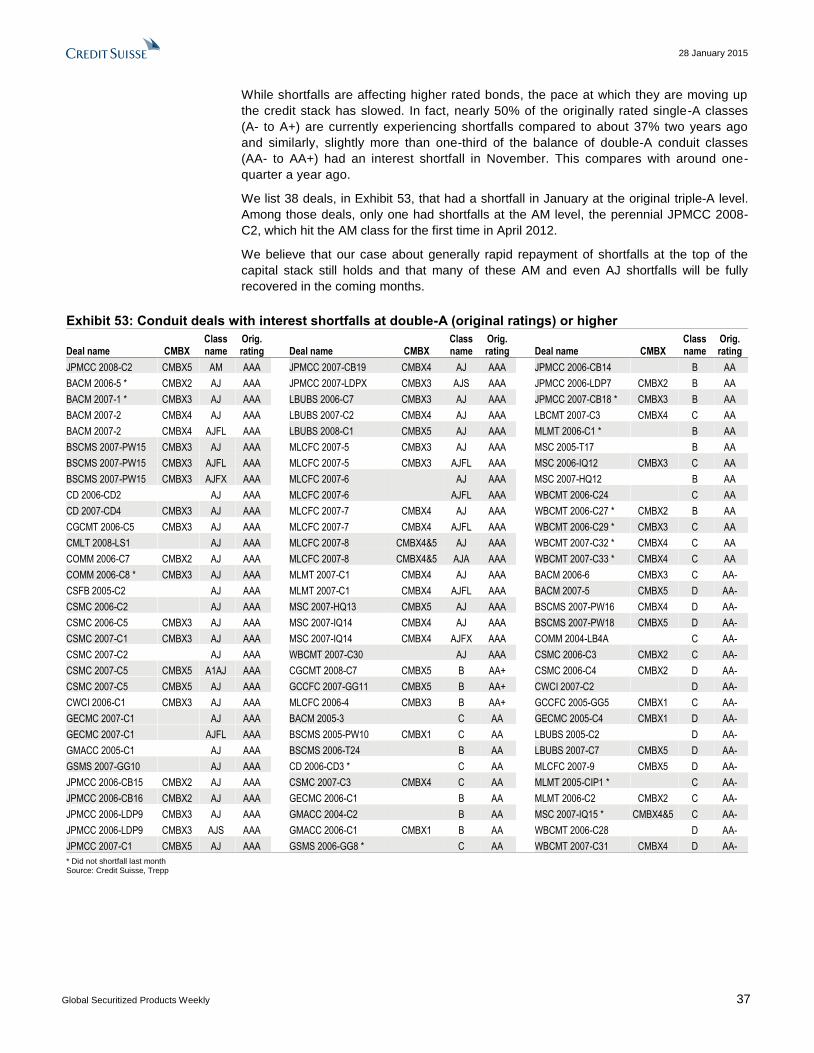
28 January 2015
Global Securitized Products Weekly 37
While shortfalls are affecting higher rated bonds, the pace at which they are moving up
the credit stack has slowed. In fact, nearly 50% of the originally rated single-A classes
(A- to A+) are currently experiencing shortfalls compared to about 37% two years ago
and similarly, slightly more than one-third of the balance of double-A conduit classes
(AA- to AA+) had an interest shortfall in November. This compares with around one-
quarter a year ago.
We list 38 deals, in Exhibit 53, that had a shortfall in January at the original triple-A level.
Among those deals, only one had shortfalls at the AM level, the perennial JPMCC 2008-
C2, which hit the AM class for the first time in April 2012.
We believe that our case about generally rapid repayment of shortfalls at the top of the
capital stack still holds and that many of these AM and even AJ shortfalls will be fully
recovered in the coming months.
Exhibit 53: Conduit deals with interest shortfalls at double-A (original ratings) or higher
Deal name CMBX Class name
Orig. rating Deal name CMBX
Class name
Orig. rating Deal name CMBX
Class name
Orig. rating
JPMCC 2008-C2 CMBX5 AM AAA JPMCC 2007-CB19 CMBX4 AJ AAA JPMCC 2006-CB14 B AA
BACM 2006-5 * CMBX2 AJ AAA JPMCC 2007-LDPX CMBX3 AJS AAA JPMCC 2006-LDP7 CMBX2 B AA
BACM 2007-1 * CMBX3 AJ AAA LBUBS 2006-C7 CMBX3 AJ AAA JPMCC 2007-CB18 * CMBX3 B AA
BACM 2007-2 CMBX4 AJ AAA LBUBS 2007-C2 CMBX4 AJ AAA LBCMT 2007-C3 CMBX4 C AA
BACM 2007-2 CMBX4 AJFL AAA LBUBS 2008-C1 CMBX5 AJ AAA MLMT 2006-C1 * B AA
BSCMS 2007-PW15 CMBX3 AJ AAA MLCFC 2007-5 CMBX3 AJ AAA MSC 2005-T17 B AA
BSCMS 2007-PW15 CMBX3 AJFL AAA MLCFC 2007-5 CMBX3 AJFL AAA MSC 2006-IQ12 CMBX3 C AA
BSCMS 2007-PW15 CMBX3 AJFX AAA MLCFC 2007-6 AJ AAA MSC 2007-HQ12 B AA
CD 2006-CD2 AJ AAA MLCFC 2007-6 AJFL AAA WBCMT 2006-C24 C AA
CD 2007-CD4 CMBX3 AJ AAA MLCFC 2007-7 CMBX4 AJ AAA WBCMT 2006-C27 * CMBX2 B AA
CGCMT 2006-C5 CMBX3 AJ AAA MLCFC 2007-7 CMBX4 AJFL AAA WBCMT 2006-C29 * CMBX3 C AA
CMLT 2008-LS1 AJ AAA MLCFC 2007-8 CMBX4&5 AJ AAA WBCMT 2007-C32 * CMBX4 C AA
COMM 2006-C7 CMBX2 AJ AAA MLCFC 2007-8 CMBX4&5 AJA AAA WBCMT 2007-C33 * CMBX4 C AA
COMM 2006-C8 * CMBX3 AJ AAA MLMT 2007-C1 CMBX4 AJ AAA BACM 2006-6 CMBX3 C AA-
CSFB 2005-C2 AJ AAA MLMT 2007-C1 CMBX4 AJFL AAA BACM 2007-5 CMBX5 D AA-
CSMC 2006-C2 AJ AAA MSC 2007-HQ13 CMBX5 AJ AAA BSCMS 2007-PW16 CMBX4 D AA-
CSMC 2006-C5 CMBX3 AJ AAA MSC 2007-IQ14 CMBX4 AJ AAA BSCMS 2007-PW18 CMBX5 D AA-
CSMC 2007-C1 CMBX3 AJ AAA MSC 2007-IQ14 CMBX4 AJFX AAA COMM 2004-LB4A C AA-
CSMC 2007-C2 AJ AAA WBCMT 2007-C30 AJ AAA CSMC 2006-C3 CMBX2 C AA-
CSMC 2007-C5 CMBX5 A1AJ AAA CGCMT 2008-C7 CMBX5 B AA+ CSMC 2006-C4 CMBX2 D AA-
CSMC 2007-C5 CMBX5 AJ AAA GCCFC 2007-GG11 CMBX5 B AA+ CWCI 2007-C2 D AA-
CWCI 2006-C1 CMBX3 AJ AAA MLCFC 2006-4 CMBX3 B AA+ GCCFC 2005-GG5 CMBX1 C AA-
GECMC 2007-C1 AJ AAA BACM 2005-3 C AA GECMC 2005-C4 CMBX1 D AA-
GECMC 2007-C1 AJFL AAA BSCMS 2005-PW10 CMBX1 C AA LBUBS 2005-C2 D AA-
GMACC 2005-C1 AJ AAA BSCMS 2006-T24 B AA LBUBS 2007-C7 CMBX5 D AA-
GSMS 2007-GG10 AJ AAA CD 2006-CD3 * C AA MLCFC 2007-9 CMBX5 D AA-
JPMCC 2006-CB15 CMBX2 AJ AAA CSMC 2007-C3 CMBX4 C AA MLMT 2005-CIP1 * C AA-
JPMCC 2006-CB16 CMBX2 AJ AAA GECMC 2006-C1 B AA MLMT 2006-C2 CMBX2 C AA-
JPMCC 2006-LDP9 CMBX3 AJ AAA GMACC 2004-C2 B AA MSC 2007-IQ15 * CMBX4&5 C AA-
JPMCC 2006-LDP9 CMBX3 AJS AAA GMACC 2006-C1 CMBX1 B AA WBCMT 2006-C28 D AA-
JPMCC 2007-C1 CMBX5 AJ AAA GSMS 2006-GG8 * C AA WBCMT 2007-C31 CMBX4 D AA-
* Did not shortfall last month Source: Credit Suisse, Trepp
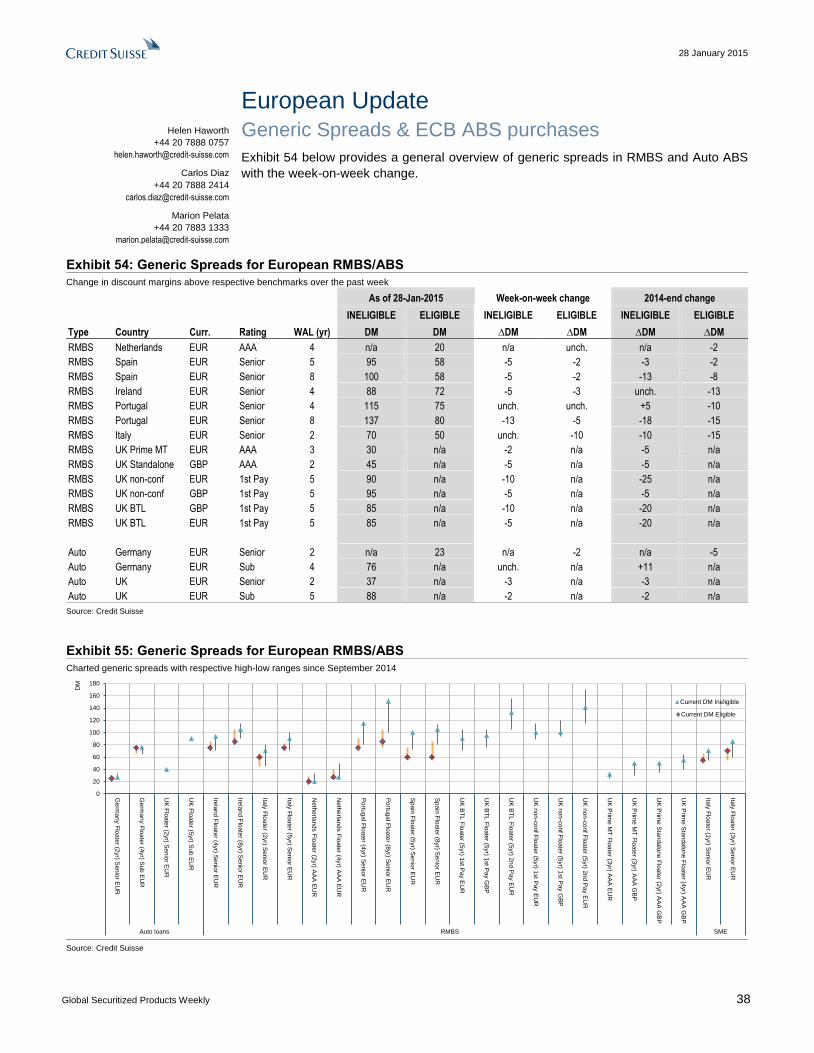
28 January 2015
Global Securitized Products Weekly 38
European Update Generic Spreads & ECB ABS purchases
Exhibit 54 below provides a general overview of generic spreads in RMBS and Auto ABS
with the week-on-week change.
Exhibit 54: Generic Spreads for European RMBS/ABS
Change in discount margins above respective benchmarks over the past week
As of 28-Jan-2015 Week-on-week change 2014-end change
INELIGIBLE ELIGIBLE INELIGIBLE ELIGIBLE INELIGIBLE ELIGIBLE
Type Country Curr. Rating WAL (yr) DM DM ∆DM ∆DM ∆DM ∆DM
RMBS Netherlands EUR AAA 4 n/a 20 n/a unch. n/a -2
RMBS Spain EUR Senior 5 95 58 -5 -2 -3 -2
RMBS Spain EUR Senior 8 100 58 -5 -2 -13 -8
RMBS Ireland EUR Senior 4 88 72 -5 -3 unch. -13
RMBS Portugal EUR Senior 4 115 75 unch. unch. +5 -10
RMBS Portugal EUR Senior 8 137 80 -13 -5 -18 -15
RMBS Italy EUR Senior 2 70 50 unch. -10 -10 -15
RMBS UK Prime MT EUR AAA 3 30 n/a -2 n/a -5 n/a
RMBS UK Standalone GBP AAA 2 45 n/a -5 n/a -5 n/a
RMBS UK non-conf EUR 1st Pay 5 90 n/a -10 n/a -25 n/a
RMBS UK non-conf GBP 1st Pay 5 95 n/a -5 n/a -5 n/a
RMBS UK BTL GBP 1st Pay 5 85 n/a -10 n/a -20 n/a
RMBS UK BTL EUR 1st Pay 5 85 n/a -5 n/a -20 n/a
Auto Germany EUR Senior 2 n/a 23 n/a -2 n/a -5
Auto Germany EUR Sub 4 76 n/a unch. n/a +11 n/a
Auto UK EUR Senior 2 37 n/a -3 n/a -3 n/a
Auto UK EUR Sub 5 88 n/a -2 n/a -2 n/a
Source: Credit Suisse
Exhibit 55: Generic Spreads for European RMBS/ABS
Charted generic spreads with respective high-low ranges since September 2014
0
20
40
60
80
100
120
140
160
180
Germ
any F
loate
r (2yr) S
enio
r EU
R
Germ
any F
loate
r (4yr) S
ub E
UR
UK
Flo
ate
r (2yr) S
enio
r EU
R
UK
Flo
ate
r (5yr) S
ub E
UR
Irela
nd F
loate
r (4yr) S
enio
r EU
R
Irela
nd F
loate
r (8yr) S
enio
r EU
R
Italy
Flo
ate
r (2yr) S
enio
r EU
R
Italy
Flo
ate
r (5yr) S
enio
r EU
R
Neth
erla
nds F
loate
r (2yr) A
AA
EU
R
Neth
erla
nds F
loate
r (4yr) A
AA
EU
R
Po
rtuga
l Flo
ate
r (4yr) S
enio
r EU
R
Po
rtuga
l Flo
ate
r (8yr) S
enio
r EU
R
Sp
ain
Flo
ate
r (5yr) S
enio
r EU
R
Sp
ain
Flo
ate
r (8yr) S
enio
r EU
R
UK
BT
L F
loate
r (5yr) 1
st P
ay E
UR
UK
BT
L F
loate
r (5yr) 1
st P
ay G
BP
UK
BT
L F
loate
r (5yr) 2
nd P
ay E
UR
UK
non-c
onf F
loate
r (5yr) 1
st P
ay E
UR
UK
non-c
onf F
loate
r (5yr) 1
st P
ay G
BP
UK
non-c
onf F
loate
r (5yr) 2
nd P
ay E
UR
UK
Prim
e M
T F
loate
r (3yr) A
AA
EU
R
UK
Prim
e M
T F
loate
r (3yr) A
AA
GB
P
UK
Prim
e S
tandalo
ne F
loate
r (2yr) A
AA
GB
P
UK
Prim
e S
tandalo
ne F
loate
r (4yr) A
AA
GB
P
Italy
Flo
ate
r (1yr) S
enio
r EU
R
Italy
Flo
ate
r (3yr) S
enio
r EU
R
Auto loans RMBS SME
Current DM Eligible
0
20
40
60
80
100
120
140
160
180
Germ
any F
loate
r (2yr) S
enio
r EU
R
Germ
any F
loate
r (4yr) S
ub E
UR
UK
Flo
ate
r (2yr) S
enio
r EU
R
UK
Flo
ate
r (5yr) S
ub E
UR
Irela
nd F
loate
r (4yr) S
enio
r EU
R
Irela
nd F
loate
r (8yr) S
enio
r EU
R
Italy
Flo
ate
r (2yr) S
enio
r EU
R
Italy
Flo
ate
r (5yr) S
enio
r EU
R
Neth
erla
nds F
loate
r (2yr) A
AA
EU
R
Neth
erla
nds F
loate
r (4yr) A
AA
EU
R
Po
rtuga
l Flo
ate
r (4yr) S
enio
r EU
R
Po
rtuga
l Flo
ate
r (8yr) S
enio
r EU
R
Sp
ain
Flo
ate
r (5yr) S
enio
r EU
R
Sp
ain
Flo
ate
r (8yr) S
enio
r EU
R
UK
BT
L F
loate
r (5yr) 1
st P
ay E
UR
UK
BT
L F
loate
r (5yr) 1
st P
ay G
BP
UK
BT
L F
loate
r (5yr) 2
nd P
ay E
UR
UK
non-c
onf F
loate
r (5yr) 1
st P
ay E
UR
UK
non-c
onf F
loate
r (5yr) 1
st P
ay G
BP
UK
non-c
onf F
loate
r (5yr) 2
nd P
ay E
UR
UK
Prim
e M
T F
loate
r (3yr) A
AA
EU
R
UK
Prim
e M
T F
loate
r (3yr) A
AA
GB
P
UK
Prim
e S
tandalo
ne F
loate
r (2yr) A
AA
GB
P
UK
Prim
e S
tandalo
ne F
loate
r (4yr) A
AA
GB
P
Italy
Flo
ate
r (1yr) S
enio
r EU
R
Italy
Flo
ate
r (3yr) S
enio
r EU
R
Auto loans RMBS SME
DM
Current DM Ineligible
Source: Credit Suisse
Helen Haworth
+44 20 7888 0757
Carlos Diaz
+44 20 7888 2414
Marion Pelata
+44 20 7883 1333
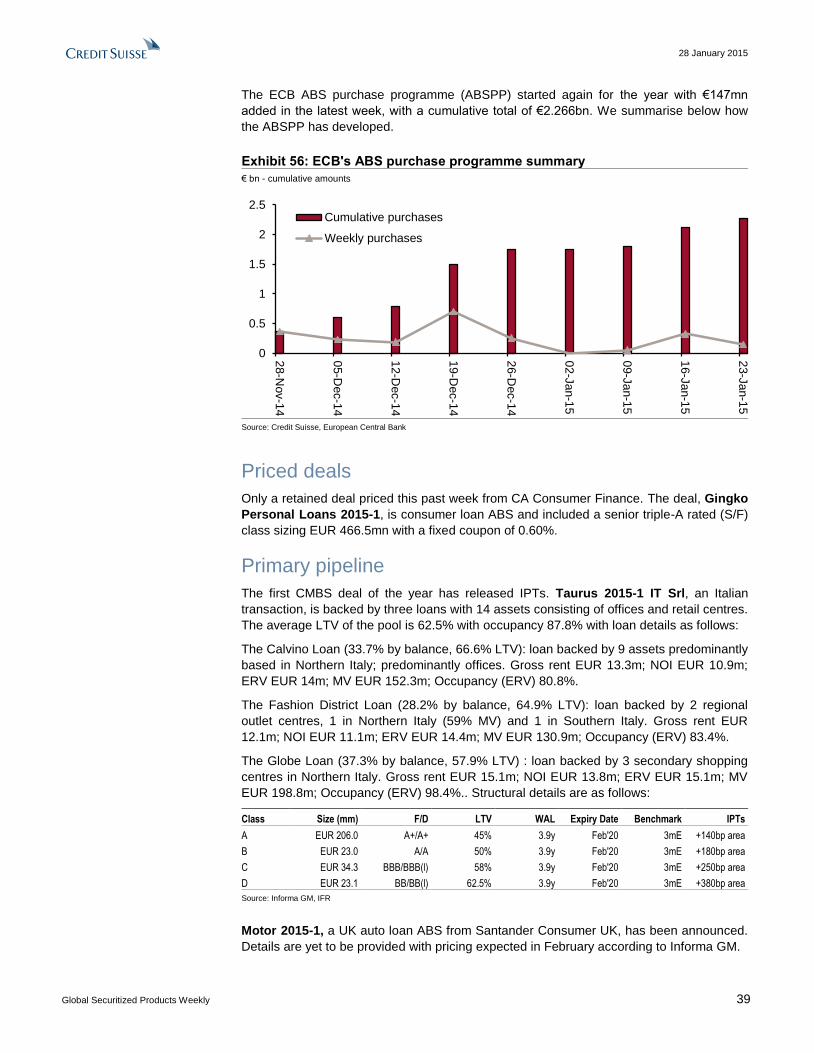
28 January 2015
Global Securitized Products Weekly 39
The ECB ABS purchase programme (ABSPP) started again for the year with €147mn
added in the latest week, with a cumulative total of €2.266bn. We summarise below how
the ABSPP has developed.
Exhibit 56: ECB's ABS purchase programme summary
€ bn - cumulative amounts
0
0.5
1
1.5
2
2.5
28-N
ov-1
4
05-D
ec-1
4
12-D
ec-1
4
19-D
ec-1
4
26-D
ec-1
4
02-J
an-1
5
09-J
an-1
5
16-J
an-1
5
23-J
an-1
5
Cumulative purchases
Weekly purchases
Source: Credit Suisse, European Central Bank
Priced deals
Only a retained deal priced this past week from CA Consumer Finance. The deal, Gingko
Personal Loans 2015-1, is consumer loan ABS and included a senior triple-A rated (S/F)
class sizing EUR 466.5mn with a fixed coupon of 0.60%.
Primary pipeline
The first CMBS deal of the year has released IPTs. Taurus 2015-1 IT Srl, an Italian
transaction, is backed by three loans with 14 assets consisting of offices and retail centres.
The average LTV of the pool is 62.5% with occupancy 87.8% with loan details as follows:
The Calvino Loan (33.7% by balance, 66.6% LTV): loan backed by 9 assets predominantly
based in Northern Italy; predominantly offices. Gross rent EUR 13.3m; NOI EUR 10.9m;
ERV EUR 14m; MV EUR 152.3m; Occupancy (ERV) 80.8%.
The Fashion District Loan (28.2% by balance, 64.9% LTV): loan backed by 2 regional
outlet centres, 1 in Northern Italy (59% MV) and 1 in Southern Italy. Gross rent EUR
12.1m; NOI EUR 11.1m; ERV EUR 14.4m; MV EUR 130.9m; Occupancy (ERV) 83.4%.
The Globe Loan (37.3% by balance, 57.9% LTV) : loan backed by 3 secondary shopping
centres in Northern Italy. Gross rent EUR 15.1m; NOI EUR 13.8m; ERV EUR 15.1m; MV
EUR 198.8m; Occupancy (ERV) 98.4%.. Structural details are as follows:
Class Size (mm) F/D LTV WAL Expiry Date Benchmark IPTs
A EUR 206.0 A+/A+ 45% 3.9y Feb'20 3mE +140bp area
B EUR 23.0 A/A 50% 3.9y Feb'20 3mE +180bp area
C EUR 34.3 BBB/BBB(l) 58% 3.9y Feb'20 3mE +250bp area
D EUR 23.1 BB/BB(l) 62.5% 3.9y Feb'20 3mE +380bp area
Source: Informa GM, IFR
Motor 2015-1, a UK auto loan ABS from Santander Consumer UK, has been announced.
Details are yet to be provided with pricing expected in February according to Informa GM.
GLOBAL FIXED INCOME AND ECONOMIC RESEARCH
Ric Deverell
Global Head of Fixed Income and Economic Research
+1 212 538 8964
GLOBAL SECURITIZED PRODUCTS RESEARCH
Roger Lehman
Global Head of Securitized Products Research
+1 212 325 2123
RESIDENTIAL MORTGAGES CMBS
Mahesh Swaminathan Roger Lehman
Group Head Group Head
+1 212 325 8789 +1 212 325 2123
[email protected] [email protected]
AGENCY MBS NON-AGENCY MBS
Qumber Hassan Marc Firestein Serif Ustun, CFA Sylvain Jousseaume, CFA
+1 212 538 4988 +1 212 325 4379 +1 212 538 4582 +1 212 325 1356
[email protected] [email protected] [email protected] [email protected]
Glenn Russo Jonathan Corwin
+1 212 538 6881 +1 212 538 6490
[email protected] [email protected]
EUROPE
Helen Haworth, CFA
Group Head
+44 20 7888 0757
Carlos Diaz Marion Pelata
+44 20 7888 2414 +44 20 7883 1333
[email protected] [email protected]
MODELING AND ANALYTICS
David Zhang
Group Head
+1 212 325 2783
Yihai Yu
+1 212 325 7922
Taek Choi
+1 212 538 0525
Oleg Koriachkin
+1 212 325 0578
Chun Lin
+1 212 325 5702
Joy Zhang
+1 212 325 5702
Disclosure Appendix
Analyst Certification The analysts identified in this report each certify, with respect to the companies or securities that the individual analyzes, that (1) the views expressed in this report accurately reflect his or her personal views about all of the subject companies and securities and (2) no part of his or her compensation was, is or will be directly or indirectly related to the specific recommendations or views expressed in this report.
Important Disclosures Credit Suisse's policy is only to publish investment research that is impartial, independent, clear, fair and not misleading. For more detail, please refer to Credit Suisse's Policies for Managing Conflicts of Interest in connection with Investment Research: http://www.csfb.com/research-and-analytics/disclaimer/managing_conflicts_disclaimer.html . Credit Suisse's policy is to publish research reports as it deems appropriate, based on developments with the subject issuer, the sector or the market that may have a material impact on the research views or opinions stated herein. The analyst(s) involved in the preparation of this research report received compensation that is based upon various factors, including Credit Suisse's total revenues, a portion of which are generated by Credit Suisse's Investment Banking and Fixed Income Divisions. Credit Suisse may trade as principal in the securities or derivatives of the issuers that are the subject of this report. At any point in time, Credit Suisse is likely to have significant holdings in the securities mentioned in this report. As at the date of this report, Credit Suisse acts as a market maker or liquidity provider in the debt securities of the subject issuer(s) mentioned in this report. For important disclosure information on securities recommended in this report, please visit the website at https://firesearchdisclosure.credit-suisse.com or call +1-212-538-7625. For the history of any relative value trade ideas suggested by the Fixed Income research department as well as fundamental recommendations provided by the Emerging Markets Sovereign Strategy Group over the previous 12 months, please view the document at http://research-and-analytics.csfb.com/docpopup.asp?ctbdocid=330703_1_en . Credit Suisse clients with access to the Locus website may refer to http://www.credit-suisse.com/locus For the history of recommendations provided by Technical Analysis, please visit the website at www.credit-suisse.com/techanalysis . Credit Suisse does not provide any tax advice. Any statement herein regarding any US federal tax is not intended or written to be used, and cannot be used, by any taxpayer for the purposes of avoiding any penalties.
Emerging Markets Bond Recommendation Definitions Buy: Indicates a recommended buy on our expectation that the issue will deliver a return higher than the risk-free rate. Sell: Indicates a recommended sell on our expectation that the issue will deliver a return lower than the risk-free rate.
Corporate Bond Fundamental Recommendation Definitions Buy: Indicates a recommended buy on our expectation that the issue will be a top performer in its sector. Outperform: Indicates an above-average total return performer within its sector. Bonds in this category have stable or improving credit profiles and are undervalued, or they may be weaker credits that, we believe, are cheap relative to the sector and are expected to outperform on a total-return basis. These bonds may possess price risk in a volatile environment. Market Perform: Indicates a bond that is expected to return average performance in its sector. Underperform: Indicates a below-average total-return performer within its sector. Bonds in this category have weak or worsening credit trends, or they may be stable credits that, we believe, are overvalued or rich relative to the sector. Sell: Indicates a recommended sell on the expectation that the issue will be among the poor performers in its sector. Restricted: In certain circumstances, Credit Suisse policy and/or applicable law and regulations preclude certain types of communications, including an investment recommendation, during the course of Credit Suisse's engagement in an investment banking transaction and in certain other circumstances. Not Rated: Credit Suisse Global Credit Research or Global Leveraged Finance Research covers the issuer but currently does not offer an investment view on the subject issue. Not Covered: Neither Credit Suisse Global Credit Research nor Global Leveraged Finance Research covers the issuer or offers an investment view on the issuer or any securities related to it. Any communication from Research on securities or companies that Credit Suisse does not cover is a reasonable, non-material deduction based on an analysis of publicly available information.
Corporate Bond Risk Category Definitions In addition to the recommendation, each issue may have a risk category indicating that it is an appropriate holding for an "average" high yield investor, designated as Market, or that it has a higher or lower risk profile, designated as Speculative, and Conservative, respectively.
Credit Suisse Credit Rating Definitions Credit Suisse may assign rating opinions to investment-grade and crossover issuers. Ratings are based on our assessment of a company's creditworthiness and are not recommendations to buy or sell a security. The ratings scale (AAA, AA, A, BBB, BB, B) is dependent on our assessment of an issuer's ability to meet its financial commitments in a timely manner. Within each category, creditworthiness is further detailed with a scale of High, Mid, or Low − with High being the strongest sub-category rating: High AAA, Mid AAA, Low AAA - obligor's capacity to meet its financial commitments is extremely strong; High AA, Mid AA, Low AA − obligor's capacity to meet its financial commitments is very strong; High A, Mid A, Low A − obligor's capacity to meet its financial commitments is strong; High BBB, Mid BBB, Low BBB − obligor's capacity to meet its financial commitments is adequate, but adverse economic/operating/financial circumstances are more likely to lead to a weakened capacity to meet its obligations; High BB, Mid BB, Low BB − obligations have speculative characteristics and are subject to substantial credit risk; High B, Mid B, Low B − obligor's capacity to meet its financial commitments is very weak and highly vulnerable to adverse economic, operating, and financial circumstances; High CCC, Mid CCC, Low CCC – obligor's capacity to meet its financial commitments is extremely weak and is dependent on favorable economic, operating, and financial circumstances. Credit Suisse's rating opinions do not necessarily correlate with those of the rating agencies.
Structured Securities, Derivatives, Options, and Futures Disclaimer General risks: Structured securities, derivatives, options (OTC and listed), and futures (including, but not limited to, commodity, foreign exchange, and security futures) are complex instruments that are not suitable for every investor, may involve a high degree of risk, may be highly illiquid, and may be appropriate investments only for sophisticated investors who are capable of understanding and assuming the risks involved. There is a risk of unlimited, total, or significant loss resulting from the use of these instruments for trading and investment. Before entering into any transaction involving these instruments, you should ensure that you fully understand their potential risks and rewards and independently determine that they are appropriate for you given your objectives, experience, financial and operational resources, and other relevant circumstances. For options, please ensure that you have read the Options Clearing Corporation's disclosure document, available at: http://www.optionsclearing.com/publications/risks/riskchap1.jsp. Risk of losses on options: The maximum potential loss on buying a call or put option is the loss of total premium paid. The maximum potential loss on selling a call option is unlimited. The maximum potential loss on selling a put option is substantial and may exceed the premium received by a significant amount. There are many other options combinations that entail significant risks and transaction costs: you should ensure they are appropriate for your situation and that you understand the risks. Risk of losses on futures: The maximum potential loss on buying a futures contract is substantial (the loss of the value of the contract) and can be amplified by leverage. The maximum potential loss on selling a futures contract is unlimited. OTC options and other derivatives: In discussions of OTC options and other derivatives, the results and risks are based solely on the hypothetical examples cited; actual results and risks will vary depending on specific circumstances. Investors are urged to consider carefully whether these products, as well as the products or strategies discussed herein, are suitable to their needs. While some OTC markets may be liquid, transactions in OTC derivatives may involve greater risk than investments in exchange-listed derivatives because there is no exchange market on which to liquidate a position and it may be very difficult to assess the value of the position because bid and offer prices need not be quoted. Structured products: These products often have a derivative component. As a result, they carry not only the risk of loss of principal, but also the possibility that at expiration the investor will own the reference asset at a depressed price. Even if a structured product is listed on an exchange, active and liquid trading markets may not develop and the structured product may be thinly traded. Taxation: Because of the importance of tax considerations for many option and other derivative transactions, investors considering these products should consult with their tax advisors as to how taxes affect the outcome of contemplated options or other derivatives transactions. You should consult with such tax, accounting, legal or other advisors as you deem necessary to assist you in making these determinations. Transaction costs: Such costs may be significant in option strategies calling for multiple purchases and sales of options and other derivatives, such as spreads and straddles. Commissions and transaction costs may be a factor in actual returns realized by the investor and should be taken into consideration. Trading on margin: Margin requirements vary and should be determined before investing as they can impact your profit potential. If the market moves against your position, you may be called upon by your broker to deposit a substantial amount of additional margin funds, on short notice, in order to maintain your position. If you do not provide the required funds within the time required by your broker, your position may be liquidated at a loss, and you will be liable for any resulting deficit in your account. Further information: Supporting documentation for any claims, comparisons, recommendations, statistics or other technical data in this material will be supplied upon request. Any trade information is preliminary and not intended as an official transaction confirmation. If you have any questions about whether you are eligible to enter into these transactions with Credit Suisse, please contact your sales representative.
References in this report to Credit Suisse include all of the subsidiaries and affiliates of Credit Suisse operating under its investment banking division. For more information on our structure, please use the following link: https://www.credit-suisse.com/who_we_are/en/This report may contain material that is not directed to, or intended for distribution to or use by, any person or entity who is a citizen or resident of or located in any locality, state, country or other jurisdiction where such distribution, publication, availability or use would be contrary to law or regulation or which would subject Credit Suisse AG or its affiliates ("CS") to any registration or licensing requirement within such jurisdiction. All material presented in this report, unless specifically indicated otherwise, is under copyright to CS. None of the material, nor its content, nor any copy of it, may be altered in any way, transmitted to, copied or distributed to any other party, without the prior express written permission of CS. All trademarks, service marks and logos used in this report are trademarks or service marks or registered trademarks or service marks of CS or its affiliates. The information, tools and material presented in this report are provided to you for information purposes only and are not to be used or considered as an offer or the solicitation of an offer to sell or to buy or subscribe for securities or other financial instruments. CS may not have taken any steps to ensure that the securities referred to in this report are suitable for any particular investor. CS will not treat recipients of this report as its customers by virtue of their receiving this report. The investments and services contained or referred to in this report may not be suitable for you and it is recommended that you consult an independent investment advisor if you are in doubt about such investments or investment services. Nothing in this report constitutes investment, legal, accounting or tax advice, or a representation that any investment or strategy is suitable or appropriate to your individual circumstances, or otherwise constitutes a personal recommendation to you. CS does not advise on the tax consequences of investments and you are advised to contact an independent tax adviser. Please note in particular that the bases and levels of taxation may change. Information and opinions presented in this report have been obtained or derived from sources believed by CS to be reliable, but CS makes no representation as to their accuracy or completeness. CS accepts no liability for loss arising from the use of the material presented in this report, except that this exclusion of liability does not apply to the extent that such liability arises under specific statutes or regulations applicable to CS. This report is not to be relied upon in substitution for the exercise of independent judgment. CS may have issued, and may in the future issue, other communications that are inconsistent with, and reach different conclusions from, the information presented in this report. Those communications reflect the different assumptions, views and analytical methods of the analysts who prepared them and CS is under no obligation to ensure that such other communications are brought to the attention of any recipient of this report. Some investments referred to in this report will be offered solely by a single entity and in the case of some investments solely by CS, or an associate of CS or CS may be the only market maker in such investments. Past performance should not be taken as an indication or guarantee of future performance, and no representation or warranty, express or implied, is made regarding future performance. Information, opinions and estimates contained in this report reflect a judgment at its original date of publication by CS and are subject to change without notice. The price, value of and income from any of the securities or financial instruments mentioned in this report can fall as well as rise. The value of securities and financial instruments is subject to exchange rate fluctuation that may have a positive or adverse effect on the price or income of such securities or financial instruments. Investors in securities such as ADR's, the values of which are influenced by currency volatility, effectively assume this risk. Structured securities are complex instruments, typically involve a high degree of risk and are intended for sale only to sophisticated investors who are capable of understanding and assuming the risks involved. The market value of any structured security may be affected by changes in economic, financial and political factors (including, but not limited to, spot and forward interest and exchange rates), time to maturity, market conditions and volatility, and the credit quality of any issuer or reference issuer. Any investor interested in purchasing a structured product should conduct their own investigation and analysis of the product and consult with their own professional advisers as to the risks involved in making such a purchase. Some investments discussed in this report may have a high level of volatility. High volatility investments may experience sudden and large falls in their value causing losses when that investment is realised. Those losses may equal your original investment. Indeed, in the case of some investments the potential losses may exceed the amount of initial investment and, in such circumstances, you may be required to pay more money to support those losses. Income yields from investments may fluctuate and, in consequence, initial capital paid to make the investment may be used as part of that income yield. Some investments may not be readily realisable and it may be difficult to sell or realise those investments, similarly it may prove difficult for you to obtain reliable information about the value, or risks, to which such an investment is exposed. This report may provide the addresses of, or contain hyperlinks to, websites. Except to the extent to which the report refers to website material of CS, CS has not reviewed any such site and takes no responsibility for the content contained therein. Such address or hyperlink (including addresses or hyperlinks to CS's own website material) is provided solely for your convenience and information and the content of any such website does not in any way form part of this document. Accessing such website or following such link through this report or CS's website shall be at your own risk. This report is issued and distributed in Europe (except Switzerland) by Credit Suisse Securities (Europe) Limited, One Cabot Square, London E14 4QJ, England, which is authorised by the Prudential Regulation Authority and regulated by the Financial Conduct Authority and the Prudential Regulation Authority. This report is being distributed in Germany by Credit Suisse Securities (Europe) Limited Niederlassung Frankfurt am Main regulated by the Bundesanstalt fuer Finanzdienstleistungsaufsicht ("BaFin"). This report is being distributed in the United States and Canada by Credit Suisse Securities (USA) LLC; in Switzerland by Credit Suisse AG; in Brazil by Banco de Investimentos Credit Suisse (Brasil) S.A or its affiliates; in Mexico by Banco Credit Suisse (México), S.A. (transactions related to the securities mentioned in this report will only be effected in compliance with applicable regulation); in Japan by Credit Suisse Securities (Japan) Limited, Financial Instruments Firm, Director-General of Kanto Local Finance Bureau (Kinsho) No. 66, a member of Japan Securities Dealers Association, The Financial Futures Association of Japan, Japan Investment Advisers Association, Type II Financial Instruments Firms Association; elsewhere in Asia/ Pacific by whichever of the following is the appropriately authorised entity in the relevant jurisdiction: Credit Suisse (Hong Kong) Limited, Credit Suisse Equities (Australia) Limited, Credit Suisse Securities (Thailand) Limited, regulated by the Office of the Securities and Exchange Commission, Thailand, having registered address at 990 Abdulrahim Place, 27th Floor, Unit 2701, Rama IV Road, Silom, Bangrak, Bangkok 10500, Thailand, Tel. +66 2614 6000, Credit Suisse Securities (Malaysia) Sdn Bhd, Credit Suisse AG, Singapore Branch, Credit Suisse Securities (India) Private Limited (CIN no. U67120MH1996PTC104392) regulated by the Securities and Exchange Board of India (registration Nos. INB230970637; INF230970637; INB010970631; INF010970631), having registered address at 9th Floor, Ceejay House, Dr.A.B. Road, Worli, Mumbai - 18, India, T- +91-22 6777 3777, Credit Suisse Securities (Europe) Limited, Seoul Branch, Credit Suisse AG, Taipei Securities Branch, PT Credit Suisse Securities Indonesia, Credit Suisse Securities (Philippines ) Inc., and elsewhere in the world by the relevant authorised affiliate of the above. Research on Taiwanese securities produced by Credit Suisse AG, Taipei Securities Branch has been prepared by a registered Senior Business Person. Research provided to residents of Malaysia is authorised by the Head of Research for Credit Suisse Securities (Malaysia) Sdn Bhd, to whom they should direct any queries on +603 2723 2020. This report has been prepared and issued for distribution in Singapore to institutional investors, accredited investors and expert investors (each as defined under the Financial Advisers Regulations) only, and is also distributed by Credit Suisse AG, Singapore branch to overseas investors (as defined under the Financial Advisers Regulations). By virtue of your status as an institutional investor, accredited investor, expert investor or overseas investor, Credit Suisse AG, Singapore branch is exempted from complying with certain compliance requirements under the Financial Advisers Act, Chapter 110 of Singapore (the "FAA"), the Financial Advisers Regulations and the relevant Notices and Guidelines issued thereunder, in respect of any financial advisory service which Credit Suisse AG, Singapore branch may provide to you. This information is being distributed by Credit Suisse AG, Dubai Branch, duly licensed and regulated by the Dubai Financial Services Authority (DFSA), and is directed at Professional Clients or Market Counterparties only, as defined by the DFSA. The financial products or financial services to which the information relates will only be made available to a client who meets the regulatory criteria to be a Professional Client or Market Counterparty only, as defined by the DFSA, and is not intended for any other person. This research may not conform to Canadian disclosure requirements. In jurisdictions where CS is not already registered or licensed to trade in securities, transactions will only be effected in accordance with applicable securities legislation, which will vary from jurisdiction to jurisdiction and may require that the trade be made in accordance with applicable exemptions from registration or licensing requirements. Non-U.S. customers wishing to effect a transaction should contact a CS entity in their local jurisdiction unless governing law permits otherwise. U.S. customers wishing to effect a transaction should do so only by contacting a representative at Credit Suisse Securities (USA) LLC in the U.S. Please note that this research was originally prepared and issued by CS for distribution to their market professional and institutional investor customers. Recipients who are not market professional or institutional investor customers of CS should seek the advice of their independent financial advisor prior to taking any investment decision based on this report or for any necessary explanation of its contents. This research may relate to investments or services of a person outside of the UK or to other matters which are not authorised by the Prudential Regulation Authority and regulated by the Financial Conduct Authority and the Prudential Regulation Authority or in respect of which the protections of the Prudential Regulation Authority and Financial Conduct Authority for private customers and/or the UK compensation scheme may not be available, and further details as to where this may be the case are available upon request in respect of this report. CS may provide various services to US municipal entities or obligated persons ("municipalities"), including suggesting individual transactions or trades and entering into such transactions. Any services CS provides to municipalities are not viewed as "advice" within the meaning of Section 975 of the Dodd-Frank Wall Street Reform and Consumer Protection Act. CS is providing any such services and related information solely on an arm's length basis and not as an advisor or fiduciary to the municipality. In connection with the provision of the any such services, there is no agreement, direct or indirect, between any municipality (including the officials, management, employees or agents thereof) and CS for CS to provide advice to the municipality. Municipalities should consult with their financial, accounting and legal advisors regarding any such services provided by CS. In addition, CS is not acting for direct or indirect compensation to solicit the municipality on behalf of an unaffiliated broker, dealer, municipal securities dealer, municipal advisor, or investment adviser for the purpose of obtaining or retaining an engagement by the municipality for or in connection with Municipal Financial Products, the issuance of municipal securities, or of an investment adviser to provide investment advisory services to or on behalf of the municipality. If this report is being distributed by a financial institution other than Credit Suisse AG, or its affiliates, that financial institution is solely responsible for distribution. Clients of that institution should contact that institution to effect a transaction in the securities mentioned in this report or require further information. This report does not constitute investment advice by Credit Suisse to the clients of the distributing financial institution, and neither Credit Suisse AG, its affiliates, and their respective officers, directors and employees accept any liability whatsoever for any direct or consequential loss arising from their use of this report or its content. Principal is not guaranteed. Commission is the commission rate or the amount agreed with a customer when setting up an account or at any time after that. Copyright © 2015 CREDIT SUISSE AG and/or its affiliates. All rights reserved.
Investment principal on bonds can be eroded depending on sale price or market price. In addition, there are bonds on which investment principal can be eroded due to changes in redemption amounts. Care is required when investing in such instruments. When you purchase non-listed Japanese fixed income securities (Japanese government bonds, Japanese municipal bonds, Japanese government guaranteed bonds, Japanese corporate bonds) from CS as a seller, you will be requested to pay the purchase price only.