Embed Size (px)
Citation preview
1 | P a g e
City of Greater Geraldton
Participatory Budgeting
Community Summit Report
Outcomes and Recommendations
23 March 2015
2 | P a g e
Forward In 2013/14 the City undertook an in-depth community engagement process to prioritise
capital works and review City services. This feedback has been invaluable in the City’s
decision making processes. However, community engagement is an on-going process, a two
way conversation, and because there have been some significant changes such as reduced
State and Federal Government funding, escalating utility costs and a growing backlog of
infrastructure renewals over the last 12 months, it is important to continue that
conversation.
These factors, combined with the need to keep rates rises down, meant it was important to
review and cease some non-mandatory services to achieve financial sustainability.
Cutting back on services requires Council to make difficult decisions about which non-
mandatory services the City can continue to offer and which must be discontinued or
reduced, whilst still being able to maintain assets and pay bills when they fall due.
To help the Council in its decision making processes, the City held a Community Summit. The
purpose of the Summit was to prioritise the non-mandatory services the City delivers within
the context of budget constraints.
The Community Summit was designed to provide members of the community with an
opportunity to learn more about the non-mandatory services the City provides, deliberate
with other participants about the relative importance of those services and develop a
priority list of non-mandatory services created from their combined vote.
The prioritised list will be a critical piece of information to assist Council in deciding which
services it will continue to deliver and those it won’t. It will join a suite of other documents
that the City will submit to Council to help inform their decision.
3 | P a g e
Background: The City of Greater Geraldton, like other local governments in Western Australia, is facing
the difficult challenge of achieving financial sustainability in an environment of reduced
funding, escalating costs and increasing community expectation. Within this environment,
the City of Greater Geraldton is challenged with balancing the needs and aspirations of a
growing community, with community ability and willingness to pay.
The City’s current budget for 2014-15 forecasts a net operating loss from ordinary activities
of $6.85m. Based on the City’s current adopted Long Term Financial Plan, which
incorporates an annual rate revenue rise of 5.2% (excluding growth factor), Council does not
expect to be in a break-even position until 2021-22. The City of Greater Geraldton’s financial
position means that many community needs and aspirations are unlikely to be delivered
within the short term and that some very difficult choices, about which services can be
continued and which must be discontinued or reduced, must be made.
In coming up with solutions to these challenges, the City has long recognised that the best
solutions are those that are made collaboratively between Council, City staff and the
community utilising the principles of engagement and deliberative democracy.
The City of Greater Geraldton has initiated several leading practice community participation
processes to facilitate community input into Council decision making. The most recent
initiative was the Participatory Budgeting Community Panels held from November 2013 to
March 2014.
Under the banner of #changesCGGcommunity, the City worked with the community via two
Community Panels. The first panel met over four weeks to determine the priorities for the
10 Year Capital Works Plan and develop a framework for evaluating new projects for
inclusion in future capital works plans. This provided staff with a more focused approach for
progressing capital works and some level of certainty for the community about what
facilities they can expect Council to deliver in the coming years. The second panel reviewed
the level of services the City provides and made recommendations to Council on increasing,
decreasing or maintaining the current level of service. The second panel chose to utilise the
values-based assessment criteria developed by first panel, with some minor modifications to
suit services rather than capital works projects, to ensure continuity of fundamental
principles.
Changes in the external environment that have impacted upon the City’s budget have
necessitated a further review with a focus on the range of non-mandatory services provided
by the City. These changes include;
1. Significant reductions in State and Federal Government funding;
2. Escalating costs, particularly utility costs; and
4 | P a g e
3. A large backlog of essential infrastructure renewal.
Additionally, the City recognises the need to ensure rates rises are kept at manageable
levels while still providing services that best align with community priorities. Therefore, the
City needed to engage further with the community to better understand community
prioritisation of the non-mandatory services it delivers. The Community Summit process was
developed to provide an opportunity for the community to have informed and considered
input thereby ensuring services are aligned with community need, aspiration and
importantly, community willingness and capacity to pay.
Output and Outcomes The primary output required from the Summit was a prioritised list of non-mandatory City
services.
Desired outcomes included;
Clearer and stronger alignment between services and community priorities;
Greater understanding in the community of the range of services provided by the
City and funded via their rates – i.e. people would have a greater appreciation of
how their rates were being used;
Shared ownership of the difficult decisions facing Council in balancing community
need and expectations with the budget;
Improved trust between the City and community; and
Increased transparency of decision-making.
Principles All non-mandatory services would be included in the process.
The whole cost of each service would need to be considered, including the cost of staff to
provide the service.
To achieve the output required (i.e. a prioritised list) participants would not be able to
change the cost of the service as this was a different issue that related to level of service.
However, comments about levels should also be captured.
Participants would be given $2.5million less than the total cost of all non-mandatory
services to ‘force’ prioritisation.
5 | P a g e
The Process To ensure considered and informed input from a broad and representative group, the City
chose to hold a Community Summit and invite participation from four groups of people via a
targeted recruitment process which is outlined later in this report.
Summit participants were responsible for reviewing 98 non-mandatory services provided by
the City, and then choosing to either fund or not fund the service. Participants were offered
the following tools to assist them in their task.
Tools 1. Key strategic documents for background reading;
2. Non-mandatory activities descriptions booklet;
3. Spreadsheet detailing revenue, expense and net impact of the services;
4. Community developed assessment criteria;
5. Ready reckoner to assist in calculating impact of services on rates; and
6. Secure log in to Particibudget software for making service selections.
Given the amount of background information involved, it was determined to run the
Summit in two parts;
Part One on 4 March 2015, was a 3.5 hour session to provide background information and
context, to outline the process and to demonstrate the Particibudget software. Participants
were asked to study the service descriptions and costs and to make their preliminary service
selections on the Particibudget, prior to attending Part Two of the Summit ten days later.
Part Two was originally scheduled for Saturday 14 March; however the Greater Geraldton
area was put on Yellow Alert on Friday 13 March as the result of a cyclone. The difficult
decision to postpone Part Two was made. All participants were reached by phone and
offered the new date of Sunday 22 March. 19 participants were unable to attend and
withdrew from the process.
Part Two offered participants a full day of deliberations with each other and the opportunity
to seek further information about services from the Executive Team and Managers.
Recruitment
Group A – Self-selecting residents The City widely advertised the Community Summit via local media, social media and
posters/flyers, inviting residents to register their interest in attending the Summit. Upon
6 | P a g e
registering, participants were asked for some basic personal demographic information (e.g.
gender, age range, ethnicity).
57 people registered via this process;
48 from this group attended on 4 March; and
35 from this group attended on 22 March.
Group B – Randomly selected participants The City engaged the Western Australian Combined Centre for Rural Health (WACHR) to
recruit participants via a random selection process using a qualified statistician to ensure
suitable independence and statistical rigour to the process. The aim was to recruit a sample
group selected in a random manner, noting that minority groups such as the residents of the
Mullewa community required special consideration to ensure appropriate representation. A
report from WACHR on the recruitment process is attached. (See attachment one.)
33 people registered via this process;
18 from this group attended on 4 March; and
14 from this group attended on 22 March.
Group C – Previous Panel Members
The City invited participants from the two previous Community Panels to attend given their
prior understanding of participatory budgeting and of City services. Their participation
provided some continuity to the work of the previous panels and recognised the
commitment of this group of residents.
15 people registered via this process;
11 from this group attended on 4 March; and
11 from this group attended on 22 March.
Group D – Invited Stakeholders
The City works with many partners in the community (e.g. other tiers of government, NGOs,
community groups and the business sector). In recognition of their understanding of the
specific needs of various sectors within the community and of the role of City services in
meeting community need, representatives from key partner agencies and organisations
were invited.
7 | P a g e
33 people registered via this process;
16 from this group attended on 4 March; and
13 from this group attended on 22 March.
Incentives The City covered reasonable expenses associated with attendance at the workshops such as
travel and childcare and provided all meals during workshops. All participants were eligible
for a raffle of prizes of donated goods and services, and received recognition with a formal
certificate of participation. All participants also received a bag containing complimentary
items from the City.
Pre - summit Soon after registering, participants were sent a welcome pack including a welcome letter
from the CEO and logistical information about the Summit.
One week prior to Part One, participants were sent an agenda pack; this pack included an
agenda for Part One (attachment two); key strategic documents for background reading; a
set of assessment criteria developed and used by the Community Panel reviewing the level
of services in 2014 (attachment three); and an explanation of the difference between
mandatory and non-mandatory (attachment four).
Part One - 4 March 2015, 5.15pm – 8.30pm
Objectives
To provide background information to better inform participants about the City’s
financial circumstances;
To clarify the role and responsibility of participants in the Summit; and
To introduce tools designed to assist participants with their task;
Process Participants were allocated seating at one of 15 tables. Each table was supported by a table
facilitator.
The CEO provided a 30 minute overview of the City’s financial situation after which
participants were given 20 minutes to discuss what they had heard at their tables and to jot
down any questions they had for the CEO. The commitment was made that as many
questions would be answered as possible in 10 minutes but that all questions would be
answered in writing within two working days. Questions were collected and the CEO
responded immediately to five questions and written responses to all questions were sent
to all participants within 48 hours.
8 | P a g e
Participants were introduced to a set of six assessment criteria developed by the
Community Panel reviewing the City’s service levels in 2014. They were provided with
background to the criteria and offered the criteria as a tool to assist them to review services,
to put structure around their deliberations on services and to assist them to think broadly of
community need. Participants were given 30 minutes to review the criteria at their tables
focussing on three questions;
1. Did they understand the assessment criteria or did they need any further
clarification?
2. Did they think the assessment criteria would help them do their job? If not, what
changes would they suggest?
3. Was anything missing? If so, what changes would they suggest?
The following amendments to the criteria were requested by participants;
Better recognition of disability access and inclusion;
Recognition of remote communities;
Protection of iconic infrastructure;
Recognition of youth;
Adding health and sport; and
Intergenerational connections.
The assessment criteria were amended to reflect these suggestions and distributed to
participants the following day. (See attachment five.)
Participants were given a demonstration of Particibudget, an online tool for making their
services selections. Particibudget calculated budgets, kept track spending for each
participant and automated the collation of all participants’ service selections.
Participants were given their homework packs at the end of the evening. Included in their
homework packs were descriptions of the 99 non-mandatory services from which they were
going to have to make their selections. (See attachment six for a sample page.)
The total cost of the 99 services was $8,589,061 and participants were given $6million to
spend; thereby forcing prioritisation.
Participants were asked to make preliminary selections and advised that these selections
were preliminary because Part Two of the Summit would allow them to learn more about
services, discuss, deliberate and debate the services and then make changes to their service
selections if they chose. They were asked to make preliminary selections by Thursday 12
9 | P a g e
March. (NB: the date was extended until Thursday 19 March when Part Two was
postponed.)
Output Revised criteria as per attachment five.
Observations and Outcomes Of the 92 participants, 91 completed their homework before the deadline.
Some participants did not agree with the restriction of not allowing participants to change
the funding they could allocate to services. The City considered this feedback but
determined that allowing participants to make changes to the funding for services would
add a layer of complexity regarding levels of service, that could not be managed in a one-
day Summit and potentially compromise the ability to achieve the primary output of a
prioritised list of services at their current cost.
Descriptions for three services were found to be too vague and the City issued revised
service descriptions.
One service was withdrawn from the process as it was confirmed to be fully funded from a
Trust, subject to an agreement and delivered at no cost to ratepayers. As a result, the final
list for consideration consisted of 98 services that had a total cost of $8,509,601.
Part Two - 14 March 2015
Objectives
To provide facilitated opportunities for participants to learn more about services
from staff and from each other, deliberate on services with each other and to
champion services to their fellow participants;
To allow changes to service selections and comments on Particibudget;
To understand participants willingness to pay more rates for services;
To capture recommendations participants would like the City and Council to
consider.
Process Participants were allocated seating at one of 11 tables. Each table was supported by a table
facilitator.
Following a recap of the outcomes of Part One, the CEO provided more detailed responses
to questions that had been submitted from participants regarding the City’s budget. (See
attachment seven.)
10 | P a g e
Participants were given the preliminary list of prioritised services that had been collated
from their collective service selections on Particibudget. (See attachment eight.) Table
facilitators led table deliberations on services and called on staff to provide further
information about services at the request of participants. Following two hours of
deliberations, participants were given an extended lunch and an opportunity to make
changes to their service selections in Particibudget.
Participants were advised that Particibudget would remain open for them to make changes
to their service selections for 24 hours after the Summit offering them more time to
consider their selections.
Participants were asked to complete a poll seeking information regarding the services, if
any, they would be willing to pay more rates to keep. This poll was important and very
useful as the process of prioritisation meant participants may have had to exclude services
they wanted to keep but could not afford within a fixed and limited budget. The poll
enabled participants to express their desire to keep services, even if it meant paying more
rates.
Participants were invited to consider other recommendations they would like the City and
Council to consider. Table facilitators captured draft recommendations at each table and
submitted them to a theme team. The theme team grouped similar recommendations
together and drafted 29 recommendations from the 60 table submissions.
Recommendations were presented to participants who were able to vote on each
recommendation. The recommendations and result of voting are attached. (See
attachment nine.)
All participants were invited to have one minute to address the room on a service or matter
of their choosing. 14 participants took the opportunity and spoke on a variety of subjects.
(See attachment ten.)
Participants were thanked by the CEO for their contributions and advised that their work
would assist the Executive Team in preparing the 2015/16 budget for Council to consider.
The CEO committed to inviting all participants back for a presentation on how their input
was used in developing the budget after the 2015/16 budget is adopted by Council.
Outputs
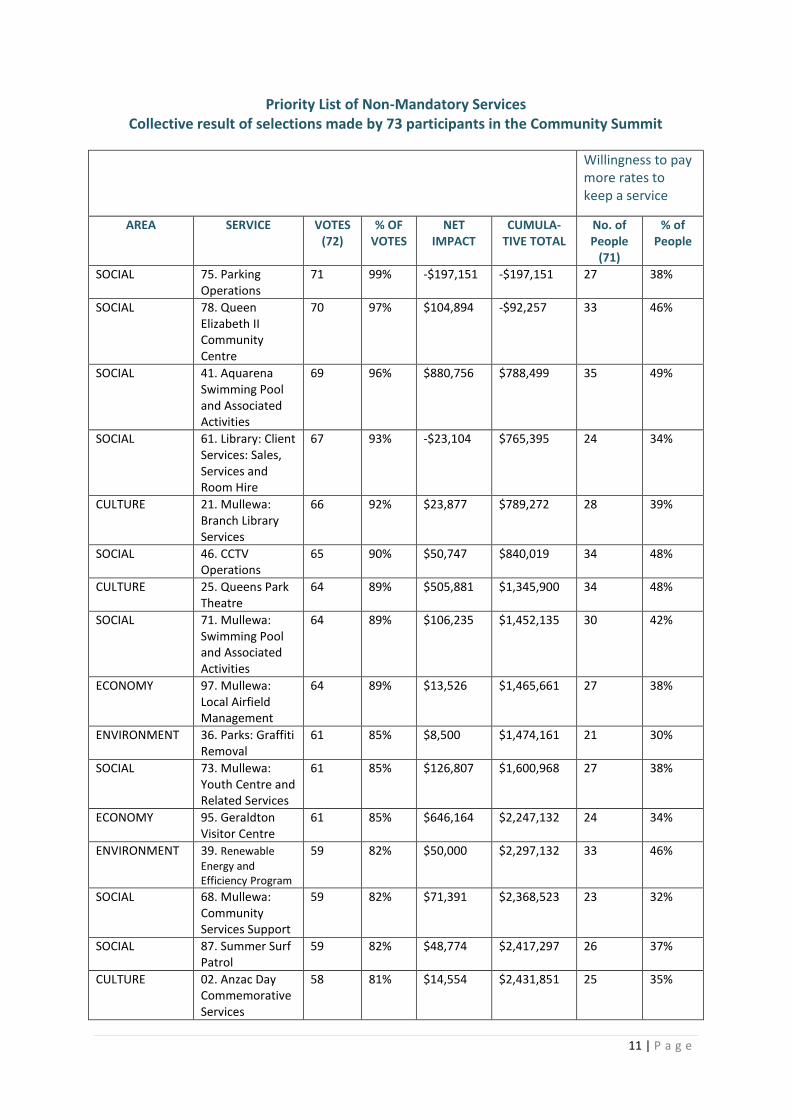
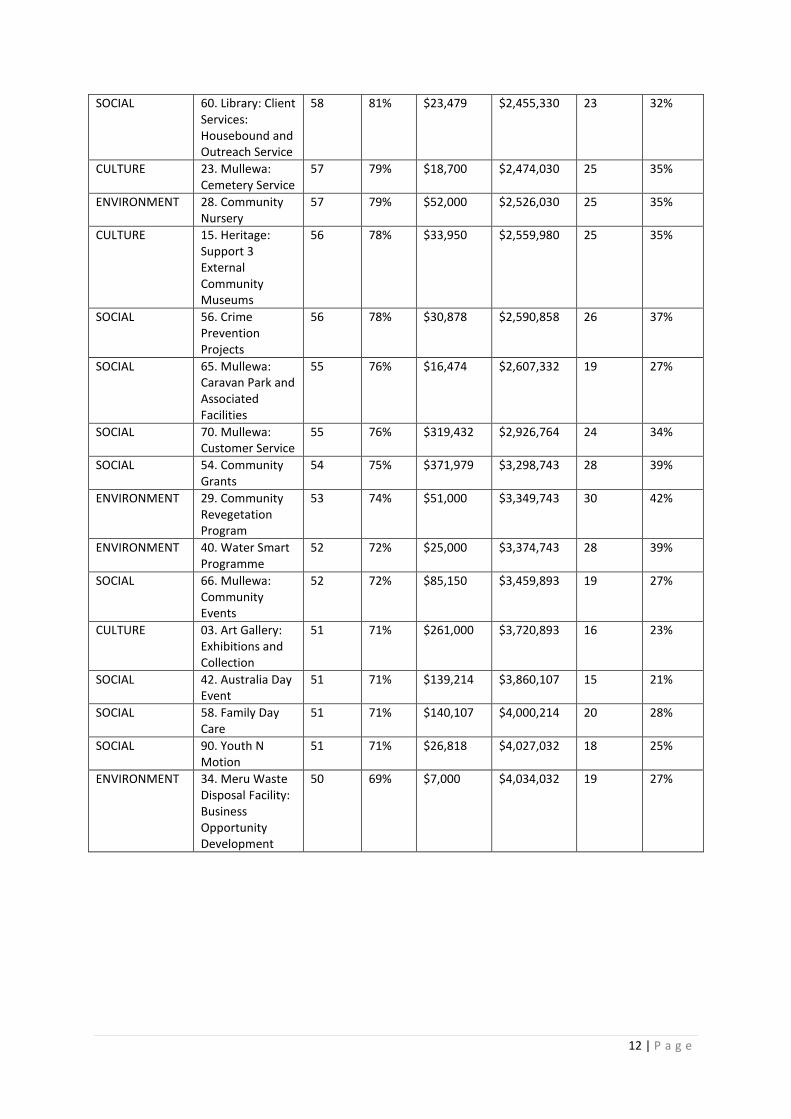
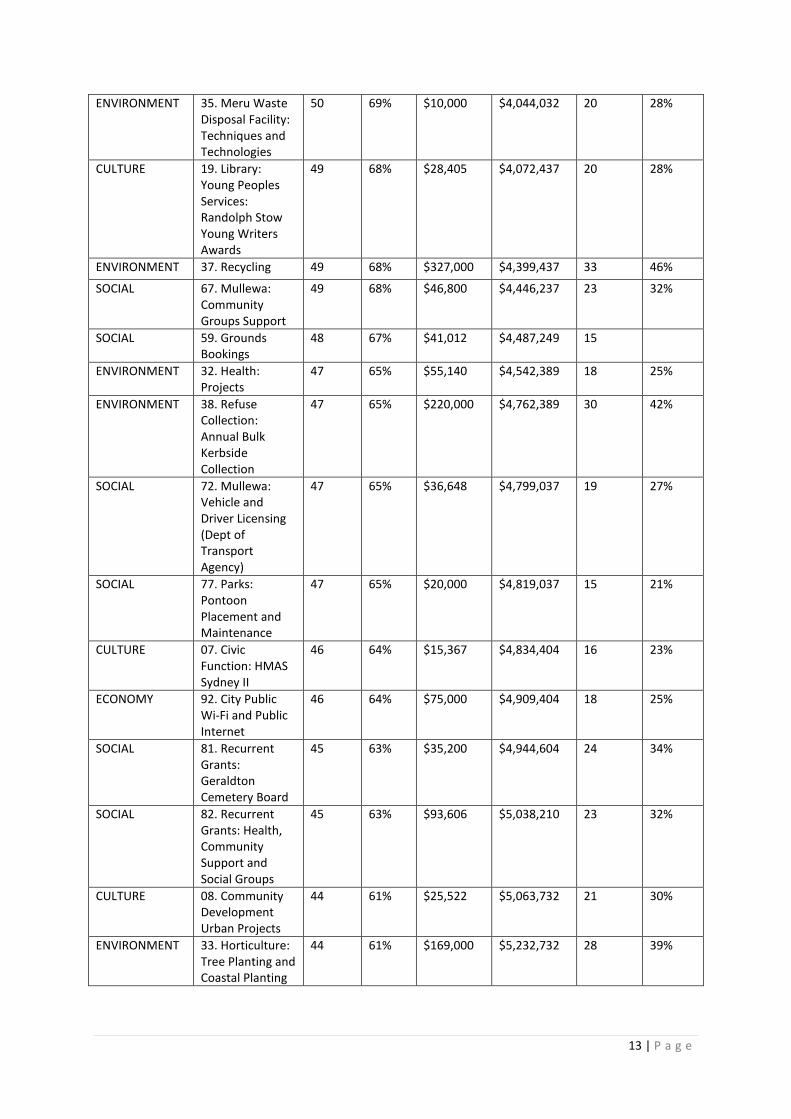
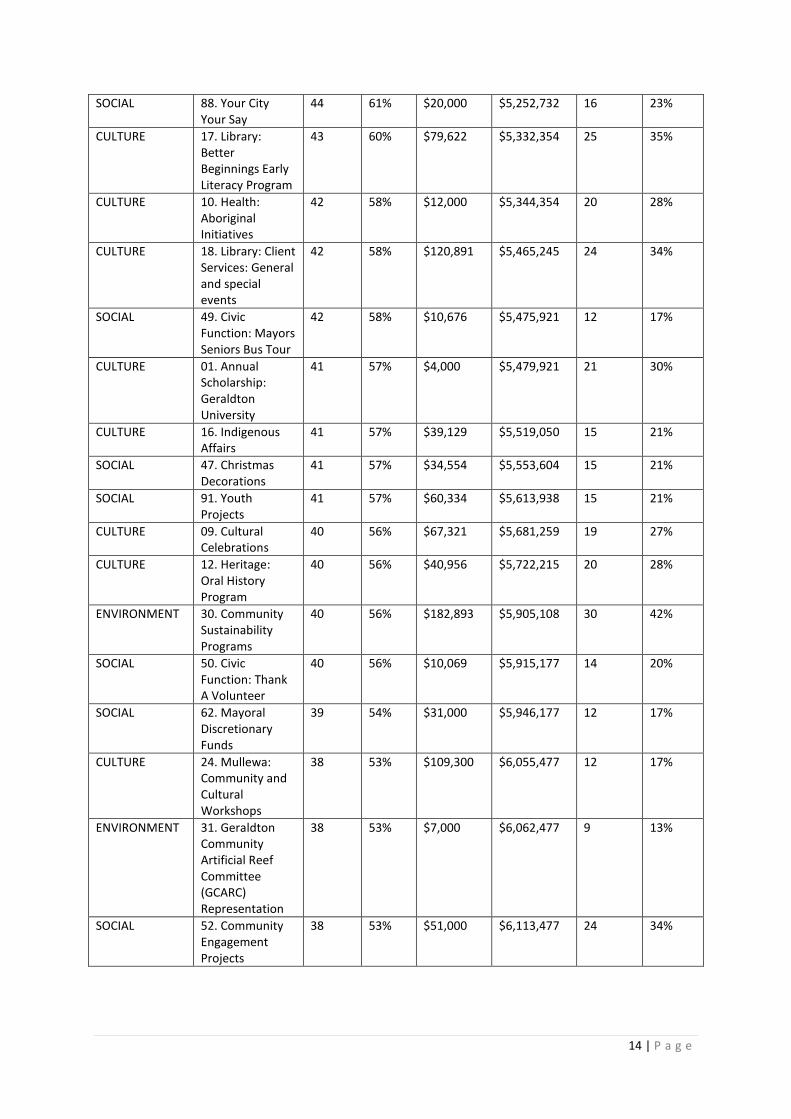
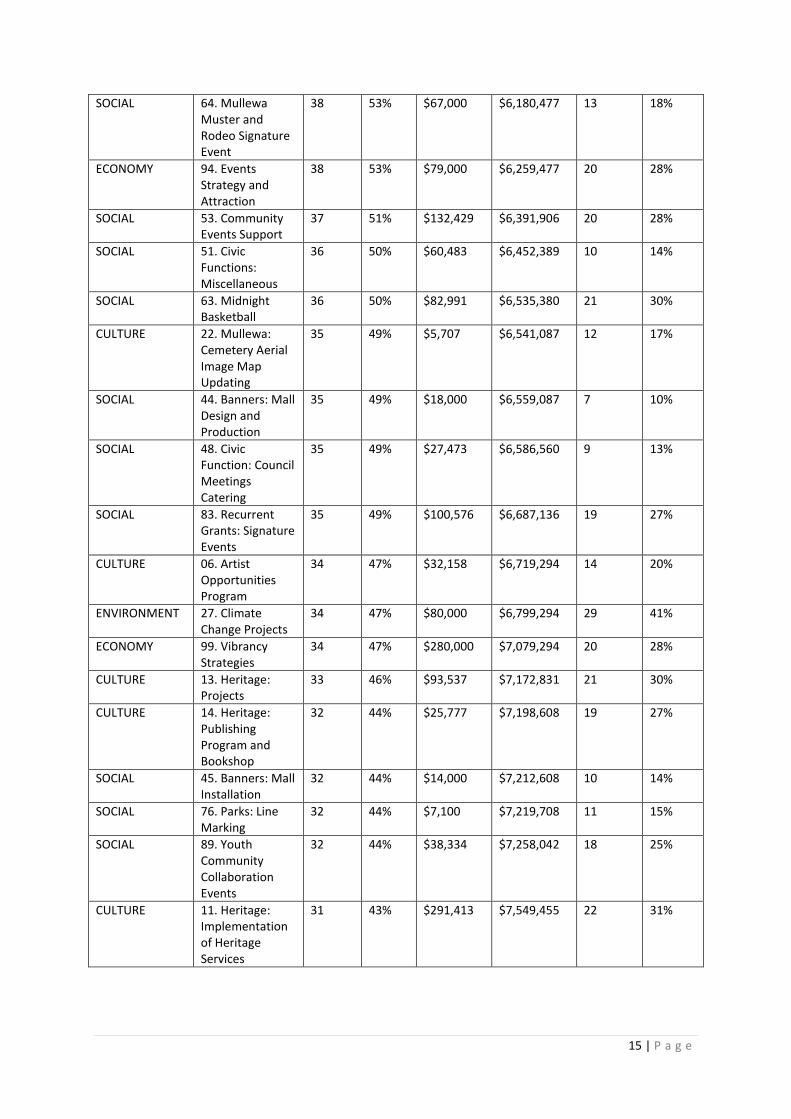
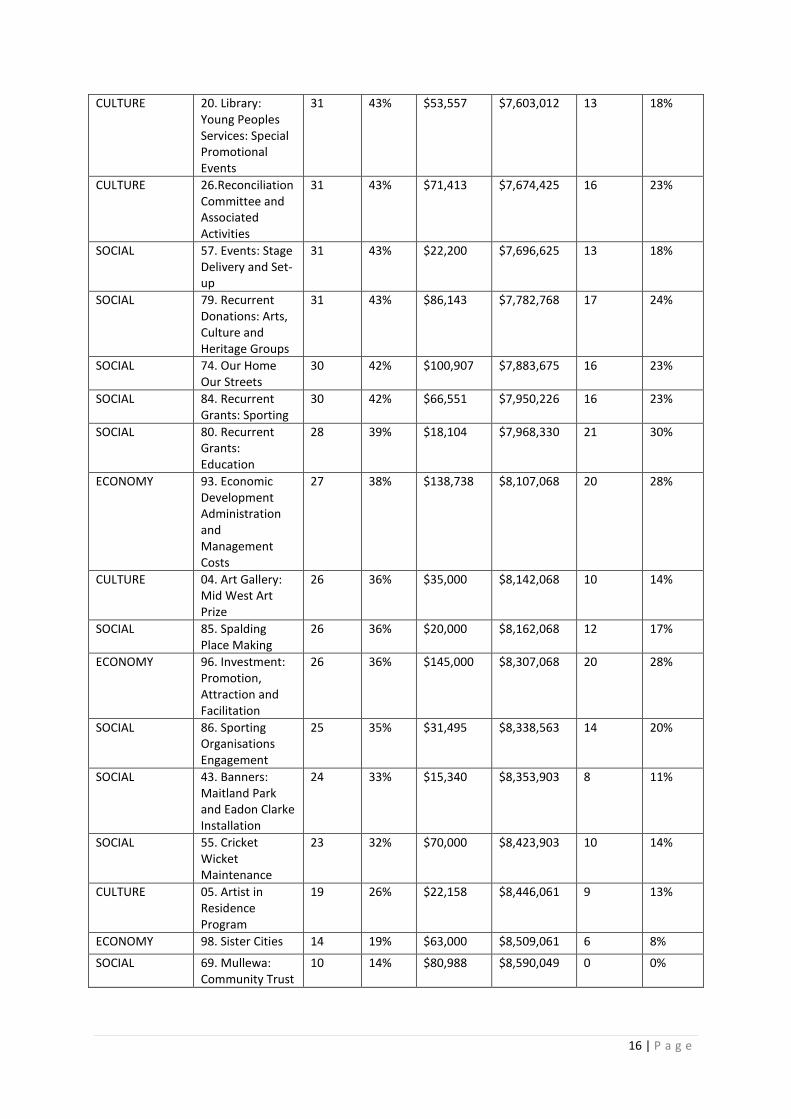
The primary output was the following prioritised list of services which includes the results of
the poll regarding willingness to pay more rates to ensure services continue to be provided.
The list is based on the collective selections and votes of the 73 participants who attended
both Part One and Part Two of the Community Summit.
11 | P a g e
Priority List of Non-Mandatory Services Collective result of selections made by 73 participants in the Community Summit
Willingness to pay more rates to keep a service
AREA SERVICE VOTES (72)
% OF VOTES
NET IMPACT
CUMULA-TIVE TOTAL
No. of People
(71)
% of People
SOCIAL 75. Parking Operations
71 99% -$197,151 -$197,151 27 38%
SOCIAL 78. Queen Elizabeth II Community Centre
70 97% $104,894 -$92,257 33 46%
SOCIAL 41. Aquarena Swimming Pool and Associated Activities
69 96% $880,756 $788,499 35 49%
SOCIAL 61. Library: Client Services: Sales, Services and Room Hire
67 93% -$23,104 $765,395 24 34%
CULTURE 21. Mullewa: Branch Library Services
66 92% $23,877 $789,272 28 39%
SOCIAL 46. CCTV Operations
65 90% $50,747 $840,019 34 48%
CULTURE 25. Queens Park Theatre
64 89% $505,881 $1,345,900 34 48%
SOCIAL 71. Mullewa: Swimming Pool and Associated Activities
64 89% $106,235 $1,452,135 30 42%
ECONOMY 97. Mullewa: Local Airfield Management
64 89% $13,526 $1,465,661 27 38%
ENVIRONMENT 36. Parks: Graffiti Removal
61 85% $8,500 $1,474,161 21 30%
SOCIAL 73. Mullewa: Youth Centre and Related Services
61 85% $126,807 $1,600,968 27 38%
ECONOMY 95. Geraldton Visitor Centre
61 85% $646,164 $2,247,132 24 34%
ENVIRONMENT 39. Renewable
Energy and Efficiency Program
59 82% $50,000 $2,297,132 33 46%
SOCIAL 68. Mullewa: Community Services Support
59 82% $71,391 $2,368,523 23 32%
SOCIAL 87. Summer Surf Patrol
59 82% $48,774 $2,417,297 26 37%
CULTURE 02. Anzac Day Commemorative Services
58 81% $14,554 $2,431,851 25 35%
12 | P a g e
SOCIAL 60. Library: Client Services: Housebound and Outreach Service
58 81% $23,479 $2,455,330 23 32%
CULTURE 23. Mullewa: Cemetery Service
57 79% $18,700 $2,474,030 25 35%
ENVIRONMENT 28. Community Nursery
57 79% $52,000 $2,526,030 25 35%
CULTURE 15. Heritage: Support 3 External Community Museums
56 78% $33,950 $2,559,980 25 35%
SOCIAL 56. Crime Prevention Projects
56 78% $30,878 $2,590,858 26 37%
SOCIAL 65. Mullewa: Caravan Park and Associated Facilities
55 76% $16,474 $2,607,332 19 27%
SOCIAL 70. Mullewa: Customer Service
55 76% $319,432 $2,926,764 24 34%
SOCIAL 54. Community Grants
54 75% $371,979 $3,298,743 28 39%
ENVIRONMENT 29. Community Revegetation Program
53 74% $51,000 $3,349,743 30 42%
ENVIRONMENT 40. Water Smart Programme
52 72% $25,000 $3,374,743 28 39%
SOCIAL 66. Mullewa: Community Events
52 72% $85,150 $3,459,893 19 27%
CULTURE 03. Art Gallery: Exhibitions and Collection
51 71% $261,000 $3,720,893 16 23%
SOCIAL 42. Australia Day Event
51 71% $139,214 $3,860,107 15 21%
SOCIAL 58. Family Day Care
51 71% $140,107 $4,000,214 20 28%
SOCIAL 90. Youth N Motion
51 71% $26,818 $4,027,032 18 25%
ENVIRONMENT 34. Meru Waste Disposal Facility: Business Opportunity Development
50 69% $7,000 $4,034,032 19 27%
13 | P a g e
ENVIRONMENT 35. Meru Waste Disposal Facility: Techniques and Technologies
50 69% $10,000 $4,044,032 20 28%
CULTURE 19. Library: Young Peoples Services: Randolph Stow Young Writers Awards
49 68% $28,405 $4,072,437 20 28%
ENVIRONMENT 37. Recycling 49 68% $327,000 $4,399,437 33 46%
SOCIAL 67. Mullewa: Community Groups Support
49 68% $46,800 $4,446,237 23 32%
SOCIAL 59. Grounds Bookings
48 67% $41,012 $4,487,249 15
ENVIRONMENT 32. Health: Projects
47 65% $55,140 $4,542,389 18 25%
ENVIRONMENT 38. Refuse Collection: Annual Bulk Kerbside Collection
47 65% $220,000 $4,762,389 30 42%
SOCIAL 72. Mullewa: Vehicle and Driver Licensing (Dept of Transport Agency)
47 65% $36,648 $4,799,037 19 27%
SOCIAL 77. Parks: Pontoon Placement and Maintenance
47 65% $20,000 $4,819,037 15 21%
CULTURE 07. Civic Function: HMAS Sydney II
46 64% $15,367 $4,834,404 16 23%
ECONOMY 92. City Public Wi-Fi and Public Internet
46 64% $75,000 $4,909,404 18 25%
SOCIAL 81. Recurrent Grants: Geraldton Cemetery Board
45 63% $35,200 $4,944,604 24 34%
SOCIAL 82. Recurrent Grants: Health, Community Support and Social Groups
45 63% $93,606 $5,038,210 23 32%
CULTURE 08. Community Development Urban Projects
44 61% $25,522 $5,063,732 21 30%
ENVIRONMENT 33. Horticulture: Tree Planting and Coastal Planting
44 61% $169,000 $5,232,732 28 39%
14 | P a g e
SOCIAL 88. Your City Your Say
44 61% $20,000 $5,252,732 16 23%
CULTURE 17. Library: Better Beginnings Early Literacy Program
43 60% $79,622 $5,332,354 25 35%
CULTURE 10. Health: Aboriginal Initiatives
42 58% $12,000 $5,344,354 20 28%
CULTURE 18. Library: Client Services: General and special events
42 58% $120,891 $5,465,245 24 34%
SOCIAL 49. Civic Function: Mayors Seniors Bus Tour
42 58% $10,676 $5,475,921 12 17%
CULTURE 01. Annual Scholarship: Geraldton University
41 57% $4,000 $5,479,921 21 30%
CULTURE 16. Indigenous Affairs
41 57% $39,129 $5,519,050 15 21%
SOCIAL 47. Christmas Decorations
41 57% $34,554 $5,553,604 15 21%
SOCIAL 91. Youth Projects
41 57% $60,334 $5,613,938 15 21%
CULTURE 09. Cultural Celebrations
40 56% $67,321 $5,681,259 19 27%
CULTURE 12. Heritage: Oral History Program
40 56% $40,956 $5,722,215 20 28%
ENVIRONMENT 30. Community Sustainability Programs
40 56% $182,893 $5,905,108 30 42%
SOCIAL 50. Civic Function: Thank A Volunteer
40 56% $10,069 $5,915,177 14 20%
SOCIAL 62. Mayoral Discretionary Funds
39 54% $31,000 $5,946,177 12 17%
CULTURE 24. Mullewa: Community and Cultural Workshops
38 53% $109,300 $6,055,477 12 17%
ENVIRONMENT 31. Geraldton Community Artificial Reef Committee (GCARC) Representation
38 53% $7,000 $6,062,477 9 13%
SOCIAL 52. Community Engagement Projects
38 53% $51,000 $6,113,477 24 34%
15 | P a g e
SOCIAL 64. Mullewa Muster and Rodeo Signature Event
38 53% $67,000 $6,180,477 13 18%
ECONOMY 94. Events Strategy and Attraction
38 53% $79,000 $6,259,477 20 28%
SOCIAL 53. Community Events Support
37 51% $132,429 $6,391,906 20 28%
SOCIAL 51. Civic Functions: Miscellaneous
36 50% $60,483 $6,452,389 10 14%
SOCIAL 63. Midnight Basketball
36 50% $82,991 $6,535,380 21 30%
CULTURE 22. Mullewa: Cemetery Aerial Image Map Updating
35 49% $5,707 $6,541,087 12 17%
SOCIAL 44. Banners: Mall Design and Production
35 49% $18,000 $6,559,087 7 10%
SOCIAL 48. Civic Function: Council Meetings Catering
35 49% $27,473 $6,586,560 9 13%
SOCIAL 83. Recurrent Grants: Signature Events
35 49% $100,576 $6,687,136 19 27%
CULTURE 06. Artist Opportunities Program
34 47% $32,158 $6,719,294 14 20%
ENVIRONMENT 27. Climate Change Projects
34 47% $80,000 $6,799,294 29 41%
ECONOMY 99. Vibrancy Strategies
34 47% $280,000 $7,079,294 20 28%
CULTURE 13. Heritage: Projects
33 46% $93,537 $7,172,831 21 30%
CULTURE 14. Heritage: Publishing Program and Bookshop
32 44% $25,777 $7,198,608 19 27%
SOCIAL 45. Banners: Mall Installation
32 44% $14,000 $7,212,608 10 14%
SOCIAL 76. Parks: Line Marking
32 44% $7,100 $7,219,708 11 15%
SOCIAL 89. Youth Community Collaboration Events
32 44% $38,334 $7,258,042 18 25%
CULTURE 11. Heritage: Implementation of Heritage Services
31 43% $291,413 $7,549,455 22 31%
16 | P a g e
CULTURE 20. Library: Young Peoples Services: Special Promotional Events
31 43% $53,557 $7,603,012 13 18%
CULTURE 26.Reconciliation Committee and Associated Activities
31 43% $71,413 $7,674,425 16 23%
SOCIAL 57. Events: Stage Delivery and Set-up
31 43% $22,200 $7,696,625 13 18%
SOCIAL 79. Recurrent Donations: Arts, Culture and Heritage Groups
31 43% $86,143 $7,782,768 17 24%
SOCIAL 74. Our Home Our Streets
30 42% $100,907 $7,883,675 16 23%
SOCIAL 84. Recurrent Grants: Sporting
30 42% $66,551 $7,950,226 16 23%
SOCIAL 80. Recurrent Grants: Education
28 39% $18,104 $7,968,330 21 30%
ECONOMY 93. Economic Development Administration and Management Costs
27 38% $138,738 $8,107,068 20 28%
CULTURE 04. Art Gallery: Mid West Art Prize
26 36% $35,000 $8,142,068 10 14%
SOCIAL 85. Spalding Place Making
26 36% $20,000 $8,162,068 12 17%
ECONOMY 96. Investment: Promotion, Attraction and Facilitation
26 36% $145,000 $8,307,068 20 28%
SOCIAL 86. Sporting Organisations Engagement
25 35% $31,495 $8,338,563 14 20%
SOCIAL 43. Banners: Maitland Park and Eadon Clarke Installation
24 33% $15,340 $8,353,903 8 11%
SOCIAL 55. Cricket Wicket Maintenance
23 32% $70,000 $8,423,903 10 14%
CULTURE 05. Artist in Residence Program
19 26% $22,158 $8,446,061 9 13%
ECONOMY 98. Sister Cities 14 19% $63,000 $8,509,061 6 8%
SOCIAL 69. Mullewa: Community Trust
10 14% $80,988 $8,590,049 0 0%
17 | P a g e
NB: Particibudget provided an opportunity for participants to make comments about each
service. Some 100 pages of comments were submitted. These included questions,
statements, suggestions and general feedback. Comments were provided to participants to
assist them in their final deliberations and decision making. Comments are also being
considered by the City and will be provided to Council. In the interests of brevity, the 100
pages of comments are not included in this report; however they have been formally
recorded and can be supplied on request.
Outcomes and observations
On leaving the Summit, most participants said they were pleased to have the opportunity to
be involved and to have their voice heard. Results of a formal survey of participants’ views
of the Summit will be discussed later in this report.
Some participants commented that they would have liked more time to discuss and
deliberate on services.
Some participants felt the information on services should have been expanded to include
speculation on what would happen if the service was withdrawn.
There was some concern from some participants about services that fell below the funding
line.
It was felt that some participants were selecting services only to ‘spend’ all their allocated
$6million dollars. In essence, as a result of the finite budget, if participants did not have
sufficient funding for a service, they were choosing other services they could afford, even if
the services were not their preferred priorities.
Formal Review To enable the City to improve its public participation processes, participants were asked to
complete a pre and post Summit survey. Some findings from the surveys were;
1. Although 29% were unsure or couldn’t say how it would go at the onset, by the end
of Part Two more than 78% thought the Summit went quite well or very well.
2. At the end of Part Two the number of participants who had a better understanding
of services by the City increased overall.
3. Some participants noted the following limitations of the process; insufficient time to
deliberate; limited options to change the budget for services; and under
representation from youth and Aboriginal people.
Full results of the surveys are attached. (See attachment 11.)
18 | P a g e
It should be noted that comparing the results of the pre and post surveys is somewhat
problematic given the number of people who were unable to participate in Part Two of the
Summit.
Summary Despite the challenges of a last minute date change and conducting this process within very
tight timeframes, the City’s aim to seek community input into decisions about which
services should or should not be continued via facilitating a process for the community to
develop a prioritised list of services, was achieved. While a perceived limitation of the
process was the lack of youth and Aboriginal community representation; it should be noted
that participation by the Aboriginal community was quite strong with 8% of participants
identifying as Aboriginal and that 7% of participants were within the 18-30 age range.
In summary, the process has provided the City with valuable information on community
views and will assist the Executive Team in developing the 2014/15 budget for Council to
consider.
Acknowledgements The City of Greater Geraldton acknowledges all participants for their commitment and time.
Their efforts on behalf of the Greater Geraldton community is valued and appreciated. The
efforts of people who had to travel long distances, up to 250kms for the round trip, is
further acknowledged.
The support of the team at the Western Australian Combined Centre for Rural Health
(WACHR) is sincerely appreciated. Their involvement ensured the City could demonstrate
every effort was made to include people who would otherwise not choose to participate in
such processes.
To all staff at the City of Greater Geraldton who assisted in a wide variety of ways to support
this important process; you exhibited the City’s STARS values and your hard work is sincerely
appreciated.
Thank you.

![WP 4 | CASE STUDY Report: Participatory Budgeting · Transit – Grant agreement n. 613169 – [Participatory budgeting] 1 WP 4 | CASE STUDY Report: Participatory Budgeting Theme](https://img.pdfslide.us/doc/110x75/5d4cd6e988c99339278bc395/wp-4-case-study-report-participatory-budgeting-transit-grant-agreement.jpg)