Embed Size (px)
Citation preview

CITY OF GRAPEVINE, TEXAS
COMPREHENSIVE ANNUAL FINANCIAL REPORT
FISCAL YEAR ENDED SEPTEMBER 30, 2013


CITY OF GRAPEVINE, TEXAS
COMPREHENSIVE ANNUAL FINANCIAL REPORT
FISCAL YEAR ENDED SEPTEMBER 30, 2013
Prepared by: Department of Administrative Services Finance Division

CITY OF GRAPEVINE, TEXAS
COMPREHENSIVE ANNUAL FINANCIAL REPORT
FOR THE FISCAL YEAR ENDED SEPTEMBER 30, 2013
HOME RULE, COUNCIL-MANAGER FORM OF GOVERNMENT
William D. Tate MAYOR
CITY COUNCIL
Chris Coy Darlene Freed Shane Wilbanks Mike Lease Sharron Spencer Roy Stewart
Bruno Rumbelow CITY MANAGER
Jennifer Hibbs ASSISTANT CITY MANAGER
John F. McGrane DIRECTOR OF ADMINISTRATIVE SERVICES

CITY OF GRAPEVINE, TEXAS
COMPREHENSIVE ANNUAL FINANCIAL REPORT
TABLE OF CONTENTS
SEPTEMBER 30, 2013 Page Number INTRODUCTORY SECTION Letter of Transmittal ..................................................................................................... i – iv Certificate of Achievement for Excellence in Financial Reporting .............................. v Organization Chart ........................................................................................................ vi Administrative Officials ................................................................................................ vii FINANCIAL SECTION Independent Auditors’ Report ....................................................................................... 1 – 3 Management’s Discussion and Analysis ...................................................................... 4 – 11 Basic Financial Statements Government-wide Financial Statements Statement of Net Position ....................................................................................... 12 Statement of Activities ............................................................................................ 13 – 14 Fund Financial Statements Balance Sheet – Governmental Funds .................................................................... 15 – 16 Reconciliation of the Balance Sheet of Governmental Funds to the Statement of Net Position .......................................................................... 17

CITY OF GRAPEVINE, TEXAS
COMPREHENSIVE ANNUAL FINANCIAL REPORT
TABLE OF CONTENTS
SEPTEMBER 30, 2013 Page Number Statement of Revenues, Expenditures and Changes in Fund Balances – Governmental Funds ................................................................ 18 – 19 Reconciliation of the Statement of Revenues, Expenditures and Changes in Fund Balances of Governmental Funds to the Statement of Activities ......................................................................................... 20 Statement of Net Position – Proprietary Funds ....................................................... 21 – 22 Statement of Revenues, Expenses and Changes in
Net Position – Proprietary Funds ....................................................................... 23 Statement of Cash Flows – Proprietary Funds ........................................................ 24 – 25 Statement of Fiduciary Net Position – Fiduciary Funds ......................................... 26 Statement of Changes in Net Position – Trust Fund ............................................... 27 Notes to Financial Statements .................................................................................... 28 – 59 Required Supplementary Information General Fund .............................................................................................................. 60 Hotel Occupancy Tax ................................................................................................ 61 Crime District ............................................................................................................. 62
4B - Transit ................................................................................................................ 63 Schedule of Funding Progress for Participation – in Texas
Municipal Retirement System ................................................................................. 64 Schedule of Funding Progress Post-Retirement Health Care Benefit Plan ............... 65 Notes to Required Supplementary Information ......................................................... 66

CITY OF GRAPEVINE, TEXAS
COMPREHENSIVE ANNUAL FINANCIAL REPORT
TABLE OF CONTENTS
SEPTEMBER 30, 2013 Page Number Combining and Individual Fund Statements and Schedules Nonmajor Governmental Funds Combining Balance Sheet ....................................................................................... 67 – 70 Combining Statement of Revenues, Expenditures and Changes in Fund Balances ................................................................................... 71 – 74 Budgetary Comparison Schedule – Debt Service Fund .......................................... 75 Agency Funds Combining Statement of Changes in Assets and Liabilities ................................... 76 – 77 STATISTICAL SECTION (Unaudited) Page Table Number Net Position by Component ........................................................................... 1 78 – 79 Changes in Net Position ................................................................................. 2 80 – 83 Fund Balances – Governmental Funds .......................................................... 3 84 – 85 Changes in Fund Balances – Governmental Funds ....................................... 4 86 – 89 Taxable Sales by Category ............................................................................. 5 90

CITY OF GRAPEVINE, TEXAS
COMPREHENSIVE ANNUAL FINANCIAL REPORT
TABLE OF CONTENTS
SEPTEMBER 30, 2013
Page Table Number STATISTICAL SECTION (Unaudited) Direct and Overlapping Sales Tax Rates ....................................................... 6 91 Assessed Value and Estimated Actual Value of Taxable Property ..................................................................................... 7 92 Property Tax Rates – Direct and Overlapping Governments ........................ 8 93 Principal Property Taxpayers ......................................................................... 9 94 Property Tax Levies and Collections ............................................................. 10 95 Ratios of Outstanding Debt by Type ............................................................. 11 96 Ratios of General Bonded Debt Outstanding ................................................. 12 97 Direct and Overlapping Governmental Activities Debt ................................. 13 98 Legal Debt Margin Information ..................................................................... 14 99 Pledged Revenue Coverage – Tax Increment Financing District Reinvestment Zone Number One ................................................... 15 100 Pledged Revenue Coverage – Tax Increment Financing District Reinvestment Zone Number Two .................................................. 16 101

CITY OF GRAPEVINE, TEXAS
COMPREHENSIVE ANNUAL FINANCIAL REPORT
TABLE OF CONTENTS
SEPTEMBER 30, 2013 Page Table Number STATISTICAL SECTION (Unaudited) Demographic and Economic Statistics .......................................................... 17 102 Principal Employers ....................................................................................... 18 103 Fulltime Equivalent City Government Employees by Function/Program .................................................................................. 19 104 Operating Indicators by Function/Program ................................................... 20 105 Capital Asset Statistics by Function/Program ................................................ 21 106 INTERNAL CONTROL AND COMPLIANCE SECTION Independent Auditors’ Report on Internal Control Over Financial Reporting and on Compliance and Other Matters Based on an Audit of Financial Statements Performed in Accordance With Government Auditing Standards ................................................................................ 107 – 108

THIS PAGE LEFT BLANK INTENTIONALLY

INTRODUCTORY SECTION

THIS PAGE LEFT BLANK INTENTIONALLY

i
March 18, 2014 To the Honorable Mayor, Members of the City Council, and Citizens of the City of Grapevine, Texas The Department of Administrative Services is pleased to submit the Comprehensive Annual Financial Report for the City of Grapevine. The City’s Management assumes responsibility for both the accuracy of the data and the completeness and fairness of the presentation, based upon a comprehensive framework of internal control that it has established for the purpose. Because the cost of internal control should not exceed anticipated benefits, the objective is to provide reasonable, rather than absolute, assurance that the financial statements are free of any material misstatements. To the best of our knowledge and belief, the enclosed data is accurate in all material respects. The data is reported in a manner designed to present fairly the financial position and results of operations of the various funds of the City government. To enable the reader to gain an understanding of the City’s financial activities, all necessary disclosures have been included. This report fulfills the requirement of state law which requires the City file to the State an annual financial statement and audit opinion within 180 days after the last day of the municipality’s fiscal year. Pattillo, Brown & Hill, LLP have issued an unmodified (“clean”) opinion on the City of Grapevine’s financial statements for the year ended September 30, 2013. The independent auditors’ report is located at the front of the financial section of this report. The Management and Discussion Analysis (MD&A) is a narrative introduction, overview, and analysis to accompany the basic financial statements. The MD&A can be found immediately following the independent auditors’ report. The letter of transmittal is designed to complement and should be read in conjunction with the MD&A. The statistical section includes selected financial and demographic information, generally presented on a multi-year basis. Profile of the City of Grapevine Incorporated in February 1907, Grapevine is a home rule City operating under a Council-Manager form of government. Policymaking and legislative authority are vested in the City Council, which consists of a Mayor and a six-member Council. The City Manager is appointed by the City Council and is responsible for carrying out policies and for the daily management of the City. Council members serve three-year staggered terms, with two Council members elected each year. The Mayor is elected to serve a three-year term. The City provides a full range of services, including police and fire protection, emergency ambulance service, sanitation, planning and zoning, public improvements, water and sewer services, culture and recreation and general administrative services.
Administrative Services • 200 South Main Street • Grapevine, Texas • 76051 • 817-410-3113 • Fax 817-410-3005

ii
Component units are legally separate organizations that a primary government must include as a part of its financial reporting entity. The City has included financial statements for five blended component units due to their fiscal dependency on the primary government. The Tax Reinvestment Zones Numbers One and Two (the “TIFS”), The Crime Control and Protection District (CCPD) “Crime District,” The Grapevine 4B Economic Development Corporation, and the 4B Transit Fund, which accounts for local sales tax used to fund Grapevine’s participation in the commuter rail development project with the Fort Worth Transit Authority (The “T”). The 4B Economic Development Fund accounts for the local sales tax used to stimulate the local economy, development, redevelopment and design and construction of the Main Street Rail Station. The Heritage Foundation is a legally separate organization that is a discretely presented component unit of the City. The Foundation was organized to promote the preservation, protection and economic development of Grapevine's physical and cultural heritage. Additional information on all six component units can be found in Note 1 in the notes to the financial statements. The annual budget serves as the foundation for the City of Grapevine’s financial planning and control. The budget is prepared by fund, and department (e.g. police, fire). Department heads may transfer resources within their department as they see fit, but transfers between funds require approval from the governing Council. The City is located in the center of the Dallas/Fort Worth metropolitan complex, 21 miles northwest of downtown Dallas and 19 miles northeast of downtown Fort Worth. Three major freeways, State Hwy 114, State Hwy 121, and Interstate Hwy 635, intersect in the heart of Grapevine, providing excellent access to Dallas, Fort Worth and the area shopping, entertainment and employment centers. The City is located in Northeast Tarrant County and is home to the Dallas/Fort Worth International Airport. Two-thirds of the airport, including all terminal buildings, is located within Grapevine city limits. The City is approximately 35 square miles and based on the 2010 Census serves a population of 47,000. Local Economy
The City has overcome several challenges during the past three fiscal years as overall sales tax receipts were $49,046,598 which equated to a modest 4.5% increase in FY13, while collections for FY12 increased by 3.0% thus reflecting a steady growth. Hotel occupancy tax receipts increased $445,791 in FY13, which equated to a 3.6% gain from the previous year. These results indicate that we are continuing to recover from the recession. The DFW Connector project was officially dedicated in the fall of 2013 but still presented some traffic congestion in FY13. Work began in 2013 on the SH 121 “Section 13” project and the FM 2499 project in Northeast Grapevine with a combined cost of $184 million. The Section 13 project doubles the current capacity of SH 121 in NE Grapevine and provides an improved connection between the DFW Connector project and the Sam Rayburn Toll Road. The FM 2499 project constructs new depressed main lanes from SH 121 to Denton Creek. These main lanes will no longer pass through the “at grade” signalized intersections with Stars and Stripes Way and Grapevine Mills Boulevard North. New service roads will be constructed to provide access to abutting properties and to connect with the two signalized intersections. Long-term Financial Planning The City Council establishes their long term financial goals each year as a part of the budget process. The long-range financial forecasting is not intended to be a budget, or a proposed plan. Instead, it sets the stage for the budget process, assisting both the Council and staff in establishing priorities and allocating resources appropriately. For fiscal year 2013, the Council continued with the following goals:
(1) Maintain financial stability and strong fiscal management
(2) Sustain existing programs at high service levels
iii
(3) Provide a safe and secure community
(4) Address future transportation needs
(5) Continue to enhance tourism development
(6) Invest in “Quality of Life” capital projects
The established goals of the Council for the long-term are a continuation of the goals set in fiscal year 2007. The three goals established by the Council were: 1) long-range financial health of the General Fund, 2) improve the employee compensation plan, and 3) stabilize the City’s economic base. The long-range financial forecast is based on assumptions regarding the regional and state economy over the next several years. For FY 2013, the City maintained financial stability and strong fiscal management. The General, Debt Service, Utility Enterprise, and Stormwater Drainage funds ended FY 2013 with fund balances that meet or exceed their requirement. The City maintained existing services and transferred from the General Fund $3,000,000 to the Quality of Life CIP Fund; $1,300,000 to the Special Revenue – Crime District and $2,169,886 to Capital Projects General Facility for the purchase of the Public Safety land. In meeting the goal to provide a safe, secure community, the Police responded to 67,634 calls for service, Fire responded to 5,135 calls for service and 3,026 ambulance runs. Major Initiatives and Developments Grapevine continues to be active in economic development with advantages that include high median incomes, superior access to major highways, its proximity to DFW Airport, a large existing tourist industry and a stable political climate. In 2013, the City experienced several major projects that were completed with total construction values of $161 million in 2012 and $90 million for the first nine months of 2013. The largest category of construction was commercial which accounted for 61% of the construction value. Some of these developments included the construction of the Marriott Courtyard/Town Place Suites Hotel with 301 guest rooms including a full service restaurant and 17,000 square feet of meeting space which opened in 2013. Other commercial construction projects included the completion of Baylor Medical Center’s $100.5 million expansion, a new assisted living center on Merlot Avenue, Westwood Development of 3 new medical buildings under construction, Golf Galaxy completion of their remodel building, and the In-N-Out Burger restaurant finished construction and opened in the Towers of Grapevine Development. Two historic replica redevelopment projects were either started or completed in 2013 on historic Main Street. The 15,000 square foot development located at 520 Main Street was completed this year and includes Jakes Restaurant, 7-Eleven convenience store and several other retail and service use spaces. The Gallery, a new historic replica building broke ground and is under construction at the southeast corner of Main Street and East Northwest Highway offering 47,400 square feet of retail and office space and is planned to open in fall 2014. There were two new multi-family developments that were under construction. The Enclave Apartments are a 243 unit complex west of Grapevine Mills Mall and the Loft located on the west side of Texan Trail recently completed their construction and started accepting tenants in their 274 unit complex. There are approximately 250 single family residential lots that have been approved for construction. Grapevine Mills Mall continued to be a strong economic engine for Grapevine, averaging 20 million visitors a year. Sales at the mall were up 6% over last year, and are expected to improve once road construction on 121 is complete. In 2012, Grapevine Mills management announced a $40 million renovation project including the upgrade of the tenant mix with the development of fashion and family neighborhoods. Recent new tenants included Michael Kors, Crocs, Under Armour, Coach, H&M and Kenneth Cole. Grapevine Mills staff are actively recruiting additional fashion tenants to cement their reputation as a fashion destination. Two major tenants also reinvested in the mall in 2013, Nike and Saks Off 5th both completed major interior renovations.

iv
Grapevine Mills also strengthened their goal as an entertainment destination with the expansion of Legoland’s City Forest Ranger Pursuit, a $1.2 million investment that added 6,000 square feet of space to their Discovery Center. Recognized nationally as a tourist and recreation destination, the Grapevine Shuttle provides local transportation of visitors from DFW Airport and Grapevine hotels to the historic downtown area, restaurants, and retail establishments. Construction began this year on the Ice House which is a new museum that will house the collections of the Grapevine Historical Society. Funding was provided by the historical society and the Grapevine CVB to remodel an existing structure to resemble the original Grapevine Ice House. Staff continues to work on the two new general obligation bond projects that were approved by citizens in November 2012. Recently, land was acquired on Dallas Road for the Public Safety Building and staff is working on the design phase of the new facility that will house Police, Court, IT and Fire Administration and will replace their existing facility. Staff has also been working with the architect firm for the design phase that involves expanding, equipping, and renovating the existing Community Activities Center which includes a senior component. Awards and Acknowledgements The City Charter requires an annual audit of the books of account, financial records, and transactions of all administrative departments of the City. The City Charter specifies that independent accountants selected by the City Council conduct such audits. Pattillo, Brown & Hill, LLP was selected by the City Council to conduct this year’s audit. The independent auditor’s report on the basic financial statements is included in the financial section of this report. The Government Finance Officers Association of the United States and Canada (“GFOA”) awarded a Certificate of Achievement for Excellence in Financial Reporting to the City for its comprehensive annual financial report (“CAFR”) for the fiscal year ended September 30, 2012. This was the 26th consecutive year that the City has received this prestigious award. In order to be awarded a Certificate of Achievement, the City published an easily readable and efficiently organized CAFR. This report satisfied both GAAP and applicable legal requirements. A Certificate of Achievement is valid for a period of one year only. We believe that our current CAFR continues to meet the Certificate of Achievement Program’s requirements and we are submitting it to the GFOA to determine its eligibility for another certificate. The preparation of this report would not have been possible without the efficient and dedicated services of the entire finance division staff. We would also like to express our appreciation to all members of the City who assisted and contributed to the preparation of this report. We would like to thank the members of the City Council for their interest and support in planning and conducting the financial operations of the City in a responsible and professional manner. Respectfully submitted,
Karen L Walker Karen L. Walker Controller

v
Government Finance Officers Association
Certificate of
Achievement
for Excellence
in Financial
Reporting
Presented to
City of Grapevine
Texas
For its Comprehensive Annual
Financial Report
for the Fiscal Year Ended
September 30, 2012

Animal Shelter Advisory BoardBoard of Zoning AdjustmentsBuilding Board of AppealsConvention & Visitors Bureau Advisory BoardGolf Course Advisory BoardGrapevine Heritage FoundationHistoric Preservation CommissionHousing Authority Board of CommissionersLibrary BoardParks and Recreation BoardPlanning and Zoning CommissionSenior Citizens Advisory BoardTeen Court Advisory BoardGrapevine 4B Economic Development Board
Administration Administration Administration Sales, Promotions & AdministrationAccounting Senior Activities Center Engineering Heritage Programs & PreservationPurchasing Park Maintenance Streets FacilitiesHuman Resources Recreation Traffic Operations Festivals & New VintageMunicipal Court Aquatics Environmental Services Grapevine Vintage RailroadRisk Management Athletics Programs Facility Services Tourism Incentives Utility Billing Recreation Programs Fleet Services Sister Cities Grapevine Golf Course Community Activities Center Water Distribution & Treatment Wine Pouring Society Grapevine Housing Authority Lake Parks Wastewater Collection & Treatment Visitor Shuttle SystemDebt Service Keep Grapevine Beautiful Stormwater Drainage Grapevine Township Revitalization4B Transit & Economic Devl.
Administration Administration Administration AdministrationAnimal Control Prevention Building InspectionsUniform Operations Operations PlanningCriminal Investigations TrainingTechnical Services Emergency ManagementCommercial Vehicle Enforcement
Administration Administration
Organization ChartCity of Grapevine
Mayor & Council
Citizens of
Grapevine
City Attorney
Municipal Court Judge
Boards and Commissions
City Manager
Assistant City Manager
Administrative Services
Parks & Recreation Public WorksConvention &
Visitors Bureau
Police FireDevelopment
ServicesCity Secretary
LibraryInformation Technology
Health Officer

vii
CITY OF GRAPEVINE, TEXAS
ADMINISTRATIVE OFFICALS
Bruno Rumbelow City Manager
Jennifer Hibbs Jodi Brown Assistant City Manager City Secretary John F. Boyle, Jr. David Florence City Attorney Municipal Court Judge John F. McGrane Stan Laster Director of Administrative Services Director of Public Works Scott Williams Steve Bass Director of Development Services Fire Chief Edward Salame Janis Roberson Chief of Police Library Director Douglas M. Evans Russell E. Pulley Director of Parks and Recreation Director of Golf P. W. McCallum Carolyn Van Duzee Executive Director, Convention & Visitors Bureau Human Resources Director Karen L. Walker Robert Smeby Controller Purchasing Agent Gary W. Livingston Budget Manager

THIS PAGE LEFT BLANK INTENTIONALLY

FINANCIAL SECTION

THIS PAGE LEFT BLANK INTENTIONALLY

401 WEST HIGHWAY 6 P. O. BOX 20725 WACO, TX 76702-0725 (254) 772-4901 FAX: (254) 772-4920 www.pbhcpa.com AFFILIATE OFFICES: BROWNSVILLE, TX (956) 544-7778 HILLSBORO, TX (254) 582-2583
TEMPLE, TX (254) 791-3460 ALBUQUERQUE, NM (505) 266-5904
INDEPENDENT AUDITORS’ REPORT To the Honorable Mayor and Members of the City of Council City of Grapevine, Texas Report on the Financial Statements
We have audited the accompanying financial statements of the governmental activities, the business-type activities, the discretely presented component unit, each major fund, and the aggregate remaining fund information of City of Grapevine, Texas (the “City”), as of and for the year ended September 30, 2013, and the related notes to the financial statements, which collectively comprise the City’s basic financial statements as listed in the table of contents. Management’s Responsibility for the Financial Statements
Management is responsible for the preparation and fair presentation of these financial statements in accordance with accounting principles generally accepted in the United States of America; this includes the design, implementation, and maintenance of internal control relevant to the preparation and fair presentation of financial statements that are free from material misstatement, whether due to fraud or error. Auditor’s Responsibility
Our responsibility is to express opinions on these financial statements based on our audit. We conducted our audit in accordance with auditing standards generally accepted in the United States of America and the standards applicable to financial audits contained in Government Auditing Standards, issued by the Comptroller General of the United States. Those standards require that we plan and perform the audit to obtain reasonable assurance about whether the financial statements are free from material misstatement.
1

2
An audit involves performing procedures to obtain audit evidence about the amounts and disclosures in the financial statements. The procedures selected depend on the auditor’s judgment, including the assessment of the risks of material misstatement of the financial statements, whether due to fraud or error. In making those risk assessments, the auditor considers internal control relevant to the entity’s preparation and fair presentation of the financial statements in order to design audit procedures that are appropriate in the circumstances, but not for the purpose of expressing an opinion on the effectiveness of the entity’s internal control. Accordingly, we express no such opinion. An audit also includes evaluating the appropriateness of accounting policies used and the reasonableness of significant accounting estimates made by management, as well as evaluating the overall presentation of the financial statements We believe that the audit evidence we have obtained is sufficient and appropriate to provide a basis for our audit opinions. Opinions
In our opinion, the financial statements referred to above present fairly, in all material respects, the respective financial position of the governmental activities, the business-type activities, the discretely presented component unit, each major fund, and the aggregate remaining fund information of the City of Grapevine, Texas, as of September 30, 2013, and the respective changes in financial position, and, where applicable, cash flows thereof for the year then ended in accordance with accounting principles generally accepted in the United States of America. Other Matters Required Supplementary Information
Accounting principles generally accepted in the United States of America require that the management’s discussion and analysis, the Schedule of Revenues, Expenditures and Changes in Fund Balance—Budget and Actual—General Fund, the Schedule of Revenues, Expenditures and Changes in Fund Balance—Budget and Actual—Hotel Occupancy Tax Fund, the Schedule of Revenues, Expenditures and Changes in Fund Balance—Budget and Actual— Crime District Fund, the Schedule of Revenues, Expenditures and Changes in Fund Balance—Budget and Actual— 4B-Transit Fund, the Schedule of Funding Progress for Participation in the Texas Municipal Retirement System, and the Schedule of Funding Progress – Post-Retirement Health Care Plan be presented to supplement the basic financial statements. Such information, although not a part of the basic financial statements, is required by the Governmental Accounting Standards Board, who considers it to be an essential part of financial reporting for placing the basic financial statements in an appropriate operational, economic, or historical context. We have applied certain limited procedures to the required supplementary information in accordance with auditing standards generally accepted in the United States of America, which consisted of inquiries of management about the methods of preparing the information and comparing the information for consistency with management’s responses to our inquiries, the basic financial statements, and other knowledge we obtained during our audit of the basic financial statements. We do not express an opinion or provide any assurance on the information because the limited procedures do not provide us with sufficient evidence to express an opinion or provide any assurance.

3
Other Information
Our audit was conducted for the purpose of forming opinions on the financial statements that collectively comprise the City of Grapevine, Texas’ basic financial statements. The introductory section, combining and individual nonmajor fund financial statements and schedules, and statistical section, are presented for purposes of additional analysis and are not a required part of the basic financial statements.
The combining and individual nonmajor fund financial statements and schedules are the
responsibility of management and were derived from and relate directly to the underlying accounting and other records used to prepare the basic financial statements. Such information has been subjected to the auditing procedures applied in the audit of the basic financial statements and certain additional procedures, including comparing and reconciling such information directly to the underlying accounting and other records used to prepare the basic financial statements or to the basic financial statements themselves, and other additional procedures in accordance with auditing standards generally accepted in the United States of America. In our opinion, the combining and individual nonmajor fund financial statements and schedules are fairly stated in all material respects in relation to the basic financial statements as a whole.
The introductory and statistical sections have not been subjected to the auditing procedures applied in the audit of the basic financial statements and, accordingly, we do not express an opinion or provide any assurance on them. Other Reporting Required by Government Auditing Standards
In accordance with Government Auditing Standards, we have also issued our report dated March 18, 2014, on our consideration of the City of Grapevine, Texas’ internal control over financial reporting and on our tests of its compliance with certain provisions of laws, regulations, contracts, and grant agreements and other matters. The purpose of that report is to describe the scope of our testing of internal control over financial reporting and compliance and the results of that testing, and not to provide an opinion on internal control over financial reporting or on compliance. That report is an integral part of an audit performed in accordance with Government Auditing Standards in considering City of Grapevine, Texas’ internal control over financial reporting and compliance.
Waco, Texas March 18, 2014

THIS PAGE LEFT BLANK INTENTIONALLY

MANAGEMENT’S DISCUSSION AND ANALYSIS
THIS PAGE LEFT BLANK INTENTIONALLY

4
Management’s Discussion and Analysis As management of the City of Grapevine (the “City”), we offer readers of the City’s financial statements this narrative overview and analysis of the financial activities of the City for the fiscal year ended September 30, 2013. FINANCIAL HIGHLIGHTS
The assets of the City exceeded its liabilities at the close of the most recent fiscal year by $278,711,152 (net position). Of this amount, $19,381,756 of (unrestricted net position) may be used to meet the City’s ongoing obligations to citizens and creditors.
At the end of the current fiscal year, unassigned fund balance for the General Fund was $11,302,613 or 28% of total General Fund expenditures.
The City transferred $3,000,000 to the Quality of Life CIP Fund. OVERVIEW OF THE FINANCIAL STATEMENTS
This discussion and analysis is intended to serve as an introduction to the City’s basic financial statements. The City’s basic financial statements comprise three components: 1) government-wide financial statements, 2) fund financial statements, and 3) notes to the financial statements. This report also contains other supplementary information in addition to the basic financial statements themselves. Government-wide Financial Statements
The government-wide financial statements are designed to provide readers with a broad overview of the City’s finances, in a manner similar to a private-sector business. The statement of net position presents information on all of the City’s assets and liabilities, with the difference between the two reported as net position. Over time, increases or decreases in net position may serve as a useful indicator of whether the financial position of the City is improving or deteriorating. The statement of activities presents information showing how the City’s net position changed during the fiscal year. All changes in net position are reported as soon as the underlying event giving rise to the change occurs, regardless of the timing of related cash flows. Thus, revenues and expenses are reported in this statement for some items that will only result in cash flows in future fiscal periods (e.g., uncollected taxes and earned but unused compensated absences). Both of the government-wide financial statements distinguish functions of the City that are principally supported by taxes and intergovernmental revenues (governmental activities) from other functions that are intended to recover all or a significant portion of their costs through user fees and charges (business-type activities). The governmental activities of the City include general government, public safety, culture and recreation, public works, transportation, and economic development. The business-type activities of the City include water and sewer and the golf course.

5
The government-wide financial statements include not only the City itself (known as the primary government), but also include the Heritage Foundation, the Tax Reinvestment Zones Numbers One and Two, the Crime Control and Protection District (Crime District), and the Grapevine 4B Economic Development Corporation, which are legally separate entities. A blended presentation has been used to report the financial information for all of the component units except for the Heritage Foundation. The Crime District was established to account for the accumulation and use of sales tax proceeds designated for crime reduction programs. The Grapevine 4B Economic Development Corporation consists of two funds. The 4B Transit Fund accounts for local sales tax used to fund Grapevine’s participation in the commuter rail development project with the Fort Worth Transit Authority (The “T”). The 4B Economic Development Fund accounts for the local sales tax used to stimulate the local economy, development, and redevelopment. The Heritage Foundation is a discretely presented component unit and is presented as a separate column in the government-wide financial statements. Fund financial statements—A fund is a grouping of related accounts that is used to maintain control over resources that have been segregated for specific activities or objectives. The City, like other state and local governments, uses fund accounting to ensure and demonstrate compliance with finance-related legal requirements. All of the funds of the City can be divided into three categories: governmental funds, proprietary funds, and fiduciary funds. The fund financial statements for governmental funds, proprietary funds, and fiduciary funds can be found in the financial section of this report. Governmental funds—Governmental funds are used to account for essentially the same functions reported as governmental activities in the government-wide financial statements. However, unlike the government-wide financial statements, governmental fund financial statements focus on current sources and uses of spendable resources, as well as on balances of spendable resources available at the end of the fiscal year. Such information may be useful in evaluating a government’s near-term financing requirements. Because the focus of governmental funds is narrower than that of the government-wide financial statements, it is useful to compare the information presented for governmental funds with similar information presented for governmental activities in the government-wide financial statements. By doing so, the reader may better understand the long-term impact of the City’s near-term financing decisions. Both the governmental fund balance sheet and the governmental fund statement of revenues, expenditures, and changes in fund balances provide a reconciliation to facilitate this comparison between governmental funds and governmental activities. The City maintains 20 individual governmental funds. Information is presented separately in the governmental fund balance sheet and in the governmental fund statement of revenues, expenditures, and changes in fund balances for the General, Special Revenue Fund—Hotel Occupancy Tax, Special Revenue Fund—Crime District, Special Revenue Fund—4B - Transit Fund, Debt Service Fund, Debt Service Fund—Tax Reinvestment Zone Number One (TIF #1), Capital Projects – Parks Open Space and Recreation, Capital Projects – General Facilities and Equipment, all of which are considered to be major funds. Data from the other 12 governmental funds are combined into a single, aggregate presentation. Individual fund data for each of these non-major governmental funds is provided in the form of combining statements elsewhere in this report. Proprietary funds—There are two types of Proprietary funds, Enterprise Funds and Internal Service Funds. The City maintains one type of proprietary fund, enterprise funds. Enterprise funds are used to report the same functions presented as business-type activities in the government-wide financial statements. The City uses enterprise funds to account for its Water, Sewer, and Lake Enterprise. The City has no Internal Service Funds.

6
Proprietary funds provide the same type of information as the government-wide financial statements, only in more detail. The proprietary fund financial statements provide separate information for the Water and Sewer Fund and the Lake Enterprise Fund (golf course), which are both major funds. Fiduciary funds—Fiduciary funds are used to account for resources held for the benefit of parties outside the City. Fiduciary funds are not reflected in the government-wide financial statements because the resources of those funds are not available to support the City’s own programs. The accounting used for fiduciary funds is similar to the accounting used for proprietary funds. Agency Funds are one of the City’s fiduciary fund types. The agency funds account for funds held in an agency capacity for the Industrial Development Corporation, the Police Department entitled “Police Department Case Settlement” and the W.D. Tate Scolarship. The second type of fiduciary fund is the Grapevine Health Reimbursement Account (HRA), a trust fund. See Note 1 for additional information pertaining to fiduciary funds. Notes to the financial statements—The notes provide additional information that is essential to a full understanding of the data provided in the government-wide and fund financial statements. GOVERNMENT-WIDE FINANCIAL ANALYSIS Analysis of the City’s Financial Position — As noted earlier, net position may serve over time as a useful indicator of a government’s financial position. As of September 30, 2013, the City’s assets exceeded liabilities by $278,711,152. The largest portion of the City’s net position ($172,920,694) reflects its investment in capital assets (e.g., land, building, equipment, improvements, construction in progress, and infrastructure), less any debt used to acquire capital assets still outstanding. The City uses these capital assets to provide services to citizens; consequently, these assets are not available for future spending. Although the City’s investment in capital assets is reported net of related debt, it should be noted that the resources needed to repay this debt must be provided from other sources, since the capital assets themselves cannot be used to liquidate these liabilities. An additional portion of the City’s net position represents resources that are subject to external restrictions on how they may be used. Restricted net position are for (1) use of impact fees for construction purposes $8,031,864 and (2) debt service $30,369,921 (3) public safety $1,088,003 (4) economic development $41,197,788 (5) transportation $412,394, (6) culture and recreation $40,537, and (7) tourism $5,268,195. Unrestricted net position of $19,381,756 are 7% of all net position and may be used to meet the City’s ongoing obligations to citizens and creditors. For fiscal year-end 2013, the City is able to report positive balances in all three categories of net position, both for the government as a whole, as well as for its separate governmental and business-type activities. The same situation held true for the prior fiscal year.

7
Condensed Schedule of Net Position
2013 2012 2013 2012 2013 2012
Current and other assets 210,642,273$ 131,713,324$ 23,434,972$ 27,392,403$ 234,077,245$ 159,105,727$ Capital assets 173,615,291 169,132,206 83,302,218 81,456,580 256,917,509 250,588,786
Total assets 384,257,564 300,845,530 106,737,190 108,848,983 490,994,754 409,694,513
Long-term liabilities 178,644,062 113,151,357 13,225,358 15,366,748 191,869,420 128,518,105 Other liabilities 16,595,350 12,973,521 3,818,832 3,812,151 20,414,182 16,785,672
Total liabilities 195,239,412 126,124,878 17,044,190 19,178,899 212,283,602 145,303,777
Net position: Net investment, in capital assets 98,171,072 88,342,250 74,749,622 70,171,197 172,920,694 158,513,447 Restricted 78,376,838 71,908,953 8,031,864 8,968,749 86,408,702 80,877,702 Unrestricted 12,470,242 14,469,449 6,911,514 10,530,138 19,381,756 24,999,587
Total net position 189,018,152$ 174,720,652$ 89,693,000$ 89,670,084$ 278,711,152$ 264,390,736$
Governmental Activities Business-type Activities Totals
Analysis of the City’s operations— Governmental activities – Governmental activities increased the City’s net position by $14,297,500. Significant reasons for this increase are as follows: Overall total revenues for fiscal year 2013 were slightly lower than the previous fiscal year. We did, however, experience an increase in both sales and occupancy taxes, but a slight decline in charges for services and grant reimbursements and awards. Overall, the City’s operating expenses increased by $3,502,589 and those increased expenses were primarily incurred by cultural and recreation, public works and transportation. We also experienced a significant change in both our total assets and long-term liabilities for the City which was primarily due to the issuance of the 2012 General Obligation (GO) Bonds that were approved by citizens last year for the CAC expansion and the new Public Safety Facility. During this year, City staff also worked on or completed several major capital projects that included the Dove Pool & Bathhouse, Casey’s Clubhouse and Playground, Emergency Vehicle Preemption, Denton Creek Channel, and the purchases of capital equipment. Business-type activities – Business-type activities increased the City’s net position by $22,916. The increase is primarily due to the continued improvements made to the Water and Sewer system and reduction in long-term liabilities.
8
The following table provides a summary of the City’s operations for the year ended September 30, 2013, and 2012.
CITY OF GRAPEVINE’S CHANGES IN NET POSITION
2013 2012 2013 2012 2013 2012Revenues: Program revenues: Charges for services 17,481,667$ 17,799,878$ 23,304,719$ 23,560,412$ 40,786,386$ 41,360,290$ Operating grants and contributions 525,816 1,124,029 - - 525,816 1,124,029 Capital grants and contributions 108,225 810,155 - - 108,225 810,155 General revenues: Property taxes 29,978,735 32,048,214 - - 29,978,735 32,048,214 Hotel occupancy taxes 12,772,218 12,326,427 - - 12,772,218 12,326,427 Sales taxes 49,046,598 46,932,217 - - 49,046,598 46,932,217 Mixed beverage taxes 1,158,625 1,051,264 - - 1,158,625 1,051,264 Franchise taxes 6,618,333 6,355,695 - - 6,618,333 6,355,695 Investment earnings 159,146 286,292 151,639 67,957 310,785 354,249 Miscellaneous 6,000 170,318 - - 6,000 170,318
Total revenues 117,855,363 118,904,489 23,456,358 23,628,369 141,311,721 142,532,858
Expenses: General government 18,601,720 18,370,262 - - 18,601,720 18,370,262 Public safety 28,309,203 28,263,804 - - 28,309,203 28,263,804 Culture and recreation 29,578,167 27,953,844 - - 29,578,167 27,953,844 Public works 12,216,082 11,056,248 - - 12,216,082 11,056,248 Transportation 8,619,843 7,788,997 - - 8,619,843 7,788,997 Intergovernmental - 4,040,040 - - - 4,040,040 Economic development 3,608,828 - - - 3,608,828 - Interest on long-term debt 4,094,640 4,589,793 - - 4,094,640 4,589,793 Water and sewer - - 18,806,917 18,372,558 18,806,917 18,372,558 Lake enterprise - - 3,155,905 3,053,170 3,155,905 3,053,170
Total expenses 105,028,483 102,062,988 21,962,822 21,425,728 126,991,305 123,488,716
Increases in net position before transfers 12,826,880 16,841,501 1,493,536 2,202,641 14,320,416 19,044,142
Transfers 1,470,620 1,676,661 1,470,620)( 1,676,661)( - -
Change in net position 14,297,500 18,518,162 22,916 525,980 14,320,416 19,044,142
Net position, beginning 174,720,652 156,202,490 89,670,084 89,144,104 264,390,736 245,346,594
Net position, ending 189,018,152$ 174,720,652$ 89,693,000$ 89,670,084$ 278,711,152$ 264,390,736$
Governmental Activities Business-type Activities Totals
FINANCIAL ANALYSIS OF THE CITY’S FUNDS Governmental funds – As of the end of the current fiscal year, the City of Grapevine’s governmental funds reported combined ending fund balances of $190,380,611, an increase of $75,130,874 compared with the prior year. Unassigned fund balance is $10,461,509 (5%), which is available for spending at the City’s discretion. The remainder of fund balance is not available for new spending because it has already been (1) classified as nonspendable $680,875 (2) restricted for debt service, capital projects, public safety, economic development, transportation, tourism, and culture and recreation programs $167,797,923 (3) committed for stormwater drainage and public arts $2,720,827 (4) or assigned for capital projects and culture and recreation programs $8,719,477.

9
Significant changes in fund balances of major funds are as follows: General Fund – The fund balance decreased $433,278 for FY 2013. The General Fund transferred funds to several other City funds this fiscal year, including $3,000,000 to the Quality of Life Fund (nonmajor fund) for CIP projects designated by the City Council. The changes in the fund balance were also impacted by the revenue and operating costs this fiscal year as the City experienced an increase in both sales and franchise taxes which attributed to the total General Fund revenues increasing by $1,018,855. Overall operating expenditures increased from the previous year by $1,412,387 as the city continues to provide quality programs, public safety and other services for the City. Special Revenue – Hotel Occupancy Tax Fund – Overall revenues increased $79,028 which reflects a slight and continued increase in occupancy rates at the hotels over the prior year. Due to the increases in tax revenue, the increase in transfer outs of $1,538,660 and operational costs of $282,814 the fund balance decreased by $697,951 from the previous year. Special Revenue – Crime District Fund – The Crime District Fund experienced an increase in sales tax revenues of $671,571; however, operating expenditures also increased by $731,737 with the final fund balance decreasing by $1,242 from the previous fiscal year. The General Fund transferred a net $1,500,000 to the Crime District Fund in FY 2013 and the ending fund balance for FY 2013 was $414,164. Special Revenue – 4B – Transit Fund – The 4B fund balance increased by $43,563 over last fiscal year. This increase is primarily attributed to the overall increase the City experienced this fiscal year in sales tax collections. Debt Service Fund – This fund has a total fund balance of $16,119,415 which is restricted for the payment of debt service. The $3,867,019 increase in fund balance was due to property tax revenue collections and debt issuance. Debt Service Fund – TIF #1 – The Debt Service had a total fund balance of $32,624,565. The $130,880 increase in fund balance was primarily impacted by the school district’s state reimbursement for the TIRZ M&O contribution of $1,033,327 which was not received from the school district until December 2013. This payment is being presented as deferred revenue for the current reporting year. There were also economic development distributions for FY 2013. Capital Projects – Parks Open Space and Recreation – The Parks Open Space and Recreation capital projects fund had an ending fund balance of $28,528,868. This is an increase of $28,530,315 over the prior year. The increase in fund balance is due to the issuance of long-term debt to finance capital projects. Capital Projects – General Facilities and Equipment – The General Facilities and Equipment capital projects fund had an ending fund balance of $41,393,980. This is an increase of $40,944,355 over the prior year. The increase in fund balance is due to the issuance of long-term debt to finance capital projects.

10
Proprietary Funds –
The City of Grapevine’s proprietary funds provide the same type of information found in the government-wide financial statements, but in more detail. Factors concerning the finances of the proprietary funds have already been addressed in the discussion of the City of Grapevine’s business-type activities. General Fund Budgetary Highlights Significant amendment changes: The general fund transfers out increased to $10,892,077 including transfers to the Capital Equipment Fund, the General Facilities Fund, the Quality of Life Fund and the Special Revenue Fund – Crime District (CCPD). Overall, the General Fund operating expenditures increased from the previous year primarily due to the adopted salary increases. The Cultural and Recreation expenditure budget increased this year to account for additional expenditures incurred in Park Maintenance and Aquatics for the new Dove Pool improvements and some departments experienced increases in operating supplies, professional services, and utilities from the previous year. Significant budget variances: For the year ended September 30, 2013, revenues did exceed the final budget in the General Fund due to tax receipts being greater than anticipated and overall expenditures were less than budgeted. CAPITAL ASSETS AND DEBT ADMINISTRATION Major capital asset events during the current fiscal year included the following amounts: The City incurred $1,501,950 in capital expenses related to the design phase of the Community Activities Center (CAC) expansion project in the Recreation Capital Fund. The City completed several Quality of Life projects this year including the Dove Pool & Bathhouse; Casey’s Clubhouse and Playground and the Emergency Vehicle Preemption Project as well as several other smaller projects. The $1,305,011 decrease in fund balance is due to these current year expenditures. The City completed two new parking lots at Bear Creek and Dove Parks expending $258,575 as well as improvement projects to Port America Place and Denton Creek Channel repairs expending $834,644 in FY 2013. Capital assets—The City’s investment in capital assets for its governmental and business-type activities as of September 30, 2013, amounted to $256,917,509 (net of accumulated depreciation). This investment in capital assets includes land, buildings, improvements, machinery and equipment, infrastructure, intangible assets and construction in progress. The total net increase in the City’s investment in capital assets for the current fiscal year was $6,328,723.

11
CITY OF GRAPEVINE’S CAPITAL ASSETS AT YEAR-END
2013 2012 2013 2012 2013 2012
Land and improvements 47,821,876$ 47,821,876$ 1,643,545$ 1,643,545$ 49,465,421$ 49,465,421$ Construction in progress 6,027,159 3,725,009 219,754 2,122,792 6,246,913 5,847,801 Buildings 32,639,182 33,115,271 797,805 839,774 33,436,987 33,955,045 Improvements other than buildings 21,141,304 18,786,261 1,879,385 2,243,878 23,020,689 21,030,139 Machinery and equipment 13,893,188 9,328,850 1,239,773 509,853 15,132,961 9,838,703 Water storage rights - - 129,594 146,683 129,594 146,683 Infrastructure 52,092,582 56,354,939 77,392,362 73,950,055 129,484,944 130,304,994
Total 173,615,291$ 169,132,206$ 83,302,218$ 81,456,580$ 256,917,509$ 250,588,786$
Governmental Activities Business-type Activities Totals
Additional information on the City’s capital assets can be found in Note 5 in the notes to the financial statements.
Long-term debt—At the end of the current fiscal year, the City had total bonded debt outstanding of $169,138,677. Of this amount, $169,138,677 comprises debt backed by the full faith and credit of the City.
CITY OF GRAPEVINE’S OUTSTANDING BONDS AND NOTES PAYABLE AT YEAR-END
2013 2012 2013 2012 2013 2012
General obligation bonds 102,692,840$ 40,355,000$ 10,845,000$ 12,510,000$ 113,537,840$ 52,865,000$ Certificates of obligation 45,658,918 50,794,060 - - 45,658,918 50,794,060 Revenue bonds - - - 790,000 - 790,000 Notes payable 6,296,518 3,604,730 - - 6,296,518 3,604,730 Premium on bonds issued 6,399,166 3,787,206 566,348 666,750 6,965,514 4,453,956 Discount on bonds issued - 24,159)( - - - 24,159)( Deferred loss on refunding 2,870,991)( 2,896,959)( 449,122)( 503,854)( 3,320,113)( 3,400,813)(
158,176,451$ 95,619,878$ 10,962,226$ 13,462,896$ 169,138,677$ 109,082,774$
Governmental Activities Business-type Activities Totals
Additional information on the City’s long-term debt can be found in Note 8 of the notes to the financial statements. CONTACTING THE CITY’S FINANCIAL MANAGEMENT The financial report is designed to provide our citizens, customers, investors and creditors with a general overview of the City’s finances. If you have questions about this report or need additional information, contact the Finance Division, City of Grapevine, 200 S. Main Street, Grapevine, Texas 76051.

BASIC FINANCIAL STATEMENTS

THIS PAGE LEFT BLANK INTENTIONALLY

12
ComponentUnit
Governmental Business-type HeritageActivities Activities Total Foundation
ASSETS Cash and investments 189,106,100$ 10,066,843$ 199,172,943$ 501,191$ Receivables, net Taxes 12,693,436 - 12,693,436 - Accounts 1,996,643 2,767,812 4,764,455 - Pledges - - - 50,404 Internal balances 935,936 935,936)( - - Due from other governments 419,470 92,047 511,517 - Inventory 447,545 47,956 495,501 - Accrued interest 16,006 2,763 18,769 67 Prepaid expenses 233,330 - 233,330 - Deposits 3,673,886 - 3,673,886 - Restricted assets: Cash and investments - 11,257,403 11,257,403 - Capital assets (net of accumulated depreciation) Non-depreciable 53,849,035 1,863,299 55,712,334 450,067 Depreciable 119,766,256 81,438,919 201,205,175 1,101,039 Deferred charges (net of accumulated amortization) 1,119,921 136,084 1,256,005 -
Total assets 384,257,564 106,737,190 490,994,754 2,102,768
LIABILITIES Accounts payable 9,193,974 2,243,956 11,437,930 3,052 Contracts and retainage payable 223,237 147,892 371,129 - Accrued and other liabilities 1,746,414 167,512 1,913,926 - Developer deposits 1,691,705 - 1,691,705 - Interest payable 1,619,517 55,511 1,675,028 - Unearned revenue 2,120,503 318,062 2,438,565 - Customer deposits - 885,899 885,899 - Noncurrent liabilities: Due within one year: Compensated absences 736,843 56,262 793,105 - Notes payable 1,824,236 - 1,824,236 - Bonds payable 10,661,736 1,750,000 12,411,736 - Sales tax obligation 173,556 - 173,556 - Due in more than one year: Compensated absences 2,210,527 168,783 2,379,310 - Notes payable 4,472,282 - 4,472,282 - Bonds payable 141,218,197 9,212,226 150,430,423 - Sales tax obligation 772,247 - 772,247 - Net OPEB obligation 11,546,496 1,491,080 13,037,576 - Net pension obligation 5,027,942 547,007 5,574,949 -
Total liabilities 195,239,412 17,044,190 212,283,602 3,052
NET POSITION Net investment in capital assets 98,171,072 74,749,622 172,920,694 1,551,106 Restricted for: Use of impact fees - 8,031,864 8,031,864 - Debt service 30,369,921 - 30,369,921 - Public safety 1,088,003 - 1,088,003 - Economic development 41,197,788 - 41,197,788 - Transportation 412,394 - 412,394 - Culture and recreation 40,537 - 40,537 - Tourism 5,268,195 - 5,268,195 - Unrestricted 12,470,242 6,911,514 19,381,756 548,610 Total net position 189,018,152$ 89,693,000$ 278,711,152$ 2,099,716$
The accompanying notes are an integral part of these financial statements.
Primary Government
CITY OF GRAPEVINE, TEXASSTATEMENT OF NET POSITION
SEPTEMBER 30, 2013

13
Functions/Programs ExpensesCharges for
Services
Operating Grants and
Contributions
Capital Grants and
Contributions
Primary government: Governmental activities: General government 18,601,720$ 2,013,411$ 107,408$ -$ Public safety 28,309,203 3,970,693 108,996 - Culture and recreation 29,578,167 10,011,861 56,514 - Public works 12,216,082 1,485,702 252,898 108,225 Transportation 8,619,843 - - - Economic development 3,608,828 - - - Interest on long-term debt 4,094,640 - - -
Total governmental activities 105,028,483 17,481,667 525,816 108,225
Business-type activities: Water and sewer 18,806,917 20,184,879 - - Lake Enterprise 3,155,905 3,119,840 - -
Total business-type activities 21,962,822 23,304,719 - -
Total primary government 126,991,305$ 40,786,386$ 525,816$ 108,225$
Component unit: Heritage Foundation 142,088$ 9,957$ 31,340$ 32,117$
General revenues: Taxes: Property Franchise Hotel occupancy Sales Mixed beverage Investment income MiscellaneousTransfers
Total general revenues and transfers
Change in net position
Net position - beginning
Net position - ending
The accompanying notes are an integral part of these financial statements.
Program Revenue
CITY OF GRAPEVINE, TEXAS
STATEMENT OF ACTIVITIES
FOR THE YEAR ENDED SEPTEMBER 30, 2013

14
ComponentUnit
Governmental Activities
Business-type Activities Total
Heritage Foundation
16,480,901)$( -$ 16,480,901)$( -$ 24,229,514)( - 24,229,514)( - 19,509,792)( - 19,509,792)( - 10,369,257)( - 10,369,257)( -
8,619,843)( - 8,619,843)( - 3,608,828)( - 3,608,828)( - 4,094,640)( - 4,094,640)( -
86,912,775)( - 86,912,775)( -
- 1,377,962 1,377,962 - - 36,065)( 36,065)( -
- 1,341,897 1,341,897 -
86,912,775)( 1,341,897 85,570,878)( -
68,674)(
29,978,735 - 29,978,735 - 6,618,333 - 6,618,333 -
12,772,218 - 12,772,218 - 49,046,598 - 49,046,598 -
1,158,625 - 1,158,625 - 159,146 151,639 310,785 955
6,000 - 6,000 13,838 1,470,620 1,470,620)( - -
101,210,275 1,318,981)( 99,891,294 14,793
14,297,500 22,916 14,320,416 53,881)(
174,720,652 89,670,084 264,390,736 2,153,597
189,018,152$ 89,693,000$ 278,711,152$ 2,099,716$
Net (Expense) Revenue and Changes in Net PositionPrimary Government

15
Hotel Crime 4B - TransitGeneral Occupancy Tax District Fund
ASSETS Cash and investments 8,850,689$ 6,451,646$ 5,894$ 1,323,289$ Receivables (net of allowances for uncollectibles) Accounts 1,711,659 64,760 2,928 - Taxes 4,605,084 972,070 1,962,876 1,438,677 Accrued interest 1,711 1,221 - 181 Inventory 429,412 442 - - Due from other funds 2,648,233 326,270 - - Due from other governments - - - - Prepaid items 229,655 2,563 1,112 - Deposits - - - -
Total assets 18,476,443$ 7,818,972$ 1,972,810$ 2,762,147$
LIABILITIES AND FUND BALANCES Liabilities: Accounts payable 2,278,399$ 2,342,023$ 332,262$ 2,349,753$ Accrued liabilities 1,401,806 105,970 221,294 - Interest payable - - - - Due to other funds - - 1,005,090 - Deferred revenue 2,834,558 99,779 - - Developer deposits - - - -
Total liabilities 6,514,763 2,547,772 1,558,646 2,349,753
Fund balances: Nonspendable: Inventory 429,412 442 - - Prepaid items 229,655 2,563 1,112 - Restricted for: - Debt service - - - - Capital projects - - - - Public safety - - 413,052 - Economic development - - - - Transportation - - - 412,394 Culture and recreation - - - - Tourism - 5,268,195 - - Committed for: Stormwater drainage operations - - - - Public arts - - - - Assigned for: Capital projects - - - - Culture and recreation - - - - Unassigned 11,302,613 - - -
Total fund balances 11,961,680 5,271,200 414,164 412,394
Total liabilities and fund balances 18,476,443$ 7,818,972$ 1,972,810$ 2,762,147$
The accompanying notes are an integral part of these financial statements.
Special Revenue
CITY OF GRAPEVINE, TEXAS
BALANCE SHEET
GOVERNMENTAL FUNDS
SEPTEMBER 30, 2013
16
Debt ServiceParks Open General Nonmajor TotalSpace and Facilities and Governmental Governmental
Debt Service TIF #1 Recreation Equipment Funds Funds
16,454,196$ 32,663,208$ 28,738,449$ 38,173,861$ 56,444,868$ 189,106,100$
21,932 - - - 195,364 1,996,643 321,657 1,632,603 - - 1,760,469 12,693,436
2,221 4,419 17 82 6,154 16,006 - - - - 17,691 447,545 - - - - - 2,974,503 - - - - 419,470 419,470 - - - - - 233,330 - - - 3,673,886 - 3,673,886
16,800,006$ 34,300,230$ 28,738,466$ 41,847,829$ 58,844,016$ 211,560,919$
-$ 582,086$ 86,554$ 127,579$ 1,095,318$ 9,193,974$ - - - - 17,344 1,746,414
371,994 - - - - 371,994 - - - 326,270 707,207 2,038,567
308,597 1,093,579 123,044 - 1,678,097 6,137,654 - - - - 1,691,705 1,691,705
680,591 1,675,665 209,598 453,849 5,189,671 21,180,308
- - - - 17,691 447,545 - - - - - 233,330
16,119,415 7,169,163 - - 5,761,978 29,050,556 - - 28,528,868 41,393,980 20,817,602 90,740,450 - - - - 674,951 1,088,003 - 25,455,402 - - 15,742,386 41,197,788 - - - - - 412,394 - - - - 40,537 40,537 - - - - - 5,268,195
- - - - 2,024,087 2,024,087 - - - - 696,740 696,740
- - - - 8,042,705 8,042,705 - - - - 676,772 676,772 - - - - 841,104)( 10,461,509
16,119,415 32,624,565 28,528,868 41,393,980 53,654,345 190,380,611
16,800,006$ 34,300,230$ 28,738,466$ 41,847,829$ 58,844,016$ 211,560,919$
Capital Projects

THIS PAGE LEFT BLANK INTENTIONALLY

17
Total fund balances - governmental funds balance sheet 190,380,611$
Capital assets used in governmental activities are not reported in the funds. 173,392,054
Certain receivables will not be collected soon enough to pay for the currentperiod's expenditures and are, therefore, deferred in the funds. 4,017,151
Accrued bond interest is not due and payable in the current period andtherefore is not reported in the funds. 1,247,523)(
Long-term liabilities, including bonds payable, are not due and payable in thecurrent period and therefore are not reported in the funds. Long-term liabilitiesconsist of:
Bonds payable 151,879,933)( Notes payable 6,296,518)( Compensated absences 2,947,370)( Sales tax obligation 945,803)( Net OPEB obligation 11,546,496)( Net pension obligation 5,027,942)(
Deferred charges recognized on Statement of Net Position, not recognized ingovernmental balance sheet: Deferred bond issue costs 1,119,921
Net position of governmental activities 189,018,152$
The accompanying notes are an integral part of these financial statements.
SEPTEMBER 30, 2013
Amounts reported for governmental activities in the Statement of Net Position aredifferent because:
CITY OF GRAPEVINE, TEXAS
RECONCILIATION OF THE BALANCE SHEET OF GOVERNMENTAL FUNDS
TO THE STATEMENT OF NET POSITION

18
Hotel Crime 4B - TransitGeneral Occupancy Tax District Fund
REVENUES Property tax 8,494,995$ -$ -$ -$
Hotel occupancy tax - 12,772,218 - -
Sales tax 24,797,696 - 11,958,485 8,715,679
Mixed beverage tax 1,158,625 - - -
Franchise tax 6,618,333 - - -
Licenses and permits 1,247,508 - - -
Intergovernmental 95,394 - 14 -
Charges for services 3,622,168 6,004,378 - -
Fines and forfeitures 2,210,213 - - -
Investment income 14,106 10,820 2,464 2,086
Contributions - - - -
Miscellaneous 395,593 131,708 1,966 -
Total revenues 48,654,631 18,919,124 11,962,929 8,717,765
EXPENDITURES Current: General government 13,506,546 - - -
Public safety 12,530,520 - 12,978,121 -
Culture and recreation 9,034,959 15,347,906 - -
Public works 5,367,768 - - -
Transportation - - - 8,619,843
Economic development - - - - Capital outlay 364,675 8,976 284,550 - Debt service: Principal 201,656 - - - Interest and fiscal charges - - - -
Other - - - -
Total expenditures 41,006,124 15,356,882 13,262,671 8,619,843
EXCESS (DEFICIENCY) OF REVENUES OVER (UNDER) EXPENDITURES 7,648,507 3,562,242 1,299,742)( 97,922
OTHER FINANCING SOURCES (USES) Transfers in 2,801,083 313,860 1,300,000 244,460
Transfers out 10,892,077)( 4,574,053)( 1,500)( 298,819)(
Sale of capital assets 9,209 - - - Issuance of debt - - - - Premium on issuance of bonds - - - -
Payment to bond refunding escrow agent - - - -
Total other financing sources and uses 8,081,785)( 4,260,193)( 1,298,500 54,359)(
NET CHANGE IN FUND BALANCES 433,278)( 697,951)( 1,242)( 43,563
FUND BALANCES, BEGINNING 12,394,958 5,969,151 415,406 368,831
FUND BALANCES, ENDING 11,961,680$ 5,271,200$ 414,164$ 412,394$
The accompanying notes are an integral part of these financial statements.
Special Revenue
FOR THE YEAR ENDED SEPTEMBER 30, 2013
CITY OF GRAPEVINE, TEXAS
STATEMENT OF REVENUES, EXPENDITURES AND CHANGES IN FUND BALANCES
GOVERNMENTAL FUNDS

19
Debt ServiceParks Open General Nonmajor TotalSpace and Facilities and Governmental Governmental
Debt Service TIF #1 Recreation Equipment Funds Funds
11,386,845$ 4,807,748$ -$ -$ 3,636,534$ 28,326,122$
- - - - - 12,772,218
- - - - 3,574,738 49,046,598
- - - - - 1,158,625
- - - - - 6,618,333
- - - - - 1,247,508
- - - - 1,079,949 1,175,357
- - - - 3,659,369 13,285,915
- - - - 47,789 2,258,002
24,541 35,945 2,303 5,669 61,212 159,146
- - 2,604 - 158,929 161,533 - - - 433 42,438 572,138
11,411,386 4,843,693 4,907 6,102 12,260,958 116,781,495
- - - - 207,155 13,713,701
- - - - 165,060 25,673,701
- - - - 1,818,887 26,201,752
- - - - 1,669,230 7,036,998
- - - - - 8,619,843
- 1,222,389 - - 2,386,439 3,608,828 - - 1,576,074 659,061 14,117,676 17,011,012
7,905,514 2,030,000 - - 1,325,000 11,462,170 2,183,238 329,813 - - 1,351,187 3,864,238
88,956 500 99,613 130,244 74,876 394,189
10,177,708 3,582,702 1,675,687 789,305 23,115,510 117,586,432
1,233,678 1,260,991 1,670,780)( 783,203)( 10,854,552)( 804,937)(
2,549,678 - - 2,997,915 9,560,761 19,767,757
- 1,130,111)( - - 1,400,577)( 18,297,137)(
- - - - 194,912 204,121 7,645,000 - 28,831,594 36,973,406 5,190,000 78,640,000
272,555 - 1,369,501 1,756,237 56,669 3,454,962 7,833,892)( - - - - 7,833,892)(
2,633,341 1,130,111)( 30,201,095 41,727,558 13,601,765 75,935,811
3,867,019 130,880 28,530,315 40,944,355 2,747,213 75,130,874
12,252,396 32,493,685 1,447)( 449,625 50,907,132 115,249,737
16,119,415$ 32,624,565$ 28,528,868$ 41,393,980$ 53,654,345$ 190,380,611$
Capital Projects

THIS PAGE LEFT BLANK INTENTIONALLY

20
Net change in fund balances - total governmental funds 75,130,874$
Governmental funds report capital outlays as expenditures. However, in the statement of activities thecost of those assets is allocated over their estimated useful lives and reported as depreciation. This isthe amount of capital assets recorded in the current period. 13,289,081
Depreciation on capital assets is reported in the statement of activities but does not require the use ofcurrent financial resources. Therefore, depreciation is not reported as expenditures in the governmentalfunds. 9,172,115)(
The issuance of long-term debt (e.g. bonds) provides current financial resources to governmental funds,while the repayment of the principal of long-term debt consumes the current financial resources ofgovernmental funds. Neither transaction, however, has any effect on net assets. Also, governmentalfunds report the effect of issuance costs, premiums, discounts, and similar items when debt is firstissued, whereas the amounts are deferred and amortized in the statement of activities. This amount isthe net effect of these differences in the treatment of long-term debt and related items.
Issuance of debt 78,640,000)( Repayment of principal of long-term debt 11,462,170 Payment to refunding escrow agent 7,833,892 Amortization of:
Bond issuance costs - deferred charges 248,884 Premium on bond issuance 2,817,806)( Loss on refunding 366,250)(
The net effect of various miscellaneous transactions involving capital assets (i.e., the sales, trade-ins,and donations) is to increase net position. 142,882
Interest is accrued in the government-wide financial statements but not at the fund level. Thisrepresents the change in the accrual during the period. 750,192)(
Current year changes in certain long-term liabilities do not require the use of current financial resourcesand, therefore, are not reported as expenditures in governmental funds.
Compensated balances liability 66,784)( Net OPEB obligation 2,684,765)( Net pension obligation 386,239)(
Revenues in the statement of activities that do not provide current financial resources are not reportedas revenues in the funds. 1,073,868
Change in net position of governmental activities 14,297,500$
The accompanying notes are an integral part of these financial statements.
FOR THE YEAR ENDED SEPTEMBER 30, 2013
Amounts reported for governmental activities in the Statement of Activities are different because:
CITY OF GRAPEVINE, TEXAS
RECONCILIATION OF THE STATEMENT OF REVENUES, EXPENDITURES
TO THE STATEMENT OF ACTIVITIESAND CHANGES IN FUND BALANCES OF GOVERNMENTAL FUNDS
21
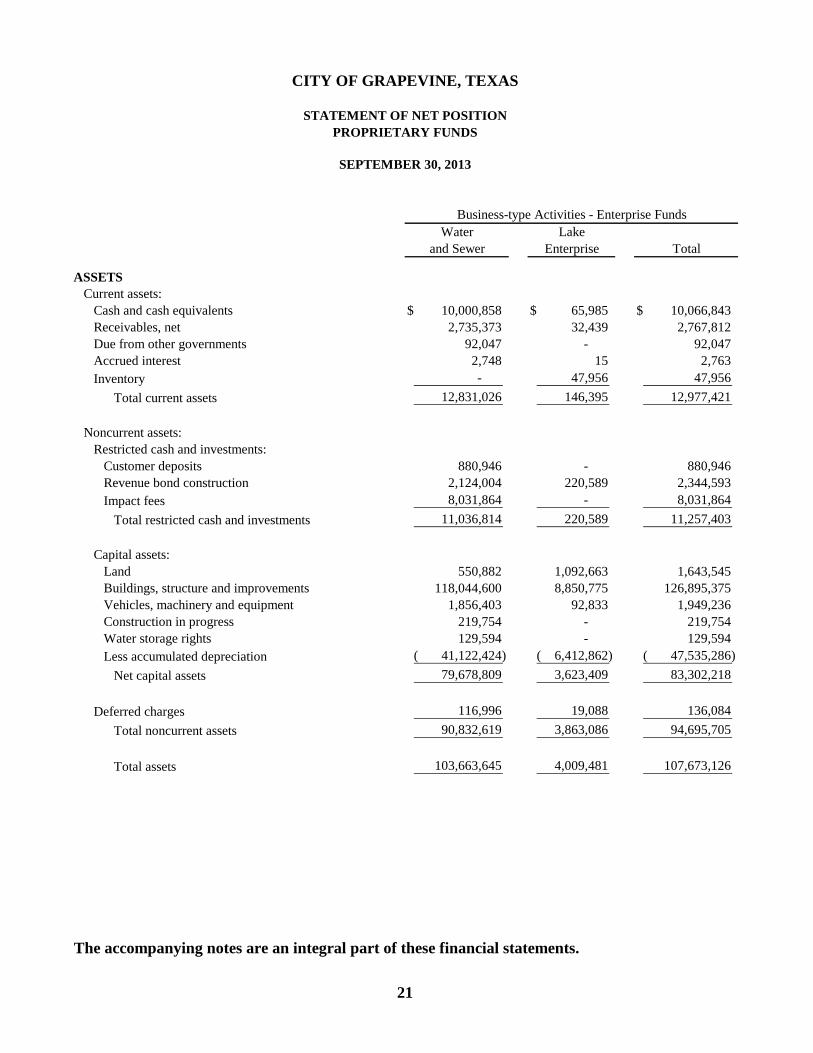
Water Lakeand Sewer Enterprise Total
ASSETS Current assets: Cash and cash equivalents 10,000,858$ 65,985$ 10,066,843$ Receivables, net 2,735,373 32,439 2,767,812 Due from other governments 92,047 - 92,047 Accrued interest 2,748 15 2,763 Inventory - 47,956 47,956
Total current assets 12,831,026 146,395 12,977,421
Noncurrent assets: Restricted cash and investments: Customer deposits 880,946 - 880,946 Revenue bond construction 2,124,004 220,589 2,344,593 Impact fees 8,031,864 - 8,031,864
Total restricted cash and investments 11,036,814 220,589 11,257,403
Capital assets: Land 550,882 1,092,663 1,643,545 Buildings, structure and improvements 118,044,600 8,850,775 126,895,375 Vehicles, machinery and equipment 1,856,403 92,833 1,949,236 Construction in progress 219,754 - 219,754 Water storage rights 129,594 - 129,594 Less accumulated depreciation 41,122,424)( 6,412,862)( 47,535,286)(
Net capital assets 79,678,809 3,623,409 83,302,218
Deferred charges 116,996 19,088 136,084
Total noncurrent assets 90,832,619 3,863,086 94,695,705
Total assets 103,663,645 4,009,481 107,673,126
The accompanying notes are an integral part of these financial statements.
CITY OF GRAPEVINE, TEXAS
STATEMENT OF NET POSITIONPROPRIETARY FUNDS
Business-type Activities - Enterprise Funds
SEPTEMBER 30, 2013

22
Water Lakeand Sewer Enterprise Total
LIABILITIES Current liabilities: Accounts payable 2,103,786$ 140,170$ 2,243,956$ Accrued liabilities 142,166 25,346 167,512 Due to other funds 9,286 926,650 935,936 Deferred revenue 318,062 - 318,062 Compensated absences 31,645 24,617 56,262 Retainage payable 147,892 - 147,892 Accrued bond interest payable 41,960 13,551 55,511 General obligation bonds payable 1,420,000 330,000 1,750,000 Customer deposits 885,899 - 885,899
Total current liabilities 5,100,696 1,460,334 6,561,030
Noncurrent liabilities: General obligation bonds payable 7,076,282 2,135,944 9,212,226 Net OPEB obligation 987,302 503,778 1,491,080 Net pension obligation 375,206 171,801 547,007 Compensated absences 94,933 73,850 168,783
Total noncurrent liabilities 8,533,723 2,885,373 11,419,096
Total liabilities 13,634,419 4,345,707 17,980,126
NET POSITION Net investment in capital assets 73,306,532 1,443,090 74,749,622 Restricted for: Impact fees 8,031,864 - 8,031,864 Unrestricted 8,690,830 1,779,316)( 6,911,514 Total net position 90,029,226$ 336,226)$( 89,693,000$
CITY OF GRAPEVINE, TEXAS
STATEMENT OF NET POSITIONPROPRIETARY FUNDS
Business-type Activities - Enterprise Funds
SEPTEMBER 30, 2013

THIS PAGE LEFT BLANK INTENTIONALLY

23
Water Lakeand Sewer Enterprise Total
OPERATING REVENUES Charges for services 19,299,271$ 3,097,973$ 22,397,244$ Miscellaneous 885,608 21,867 907,475
Total operating revenues 20,184,879 3,119,840 23,304,719
OPERATING EXPENSES Salaries and benefits 2,916,459 1,287,064 4,203,523 Maintenance, repairs, and supplies 9,871,647 330,075 10,201,722 Depreciation 2,466,325 392,484 2,858,809 General and administrative 3,123,542 973,073 4,096,615
Total operating expenses 18,377,973 2,982,696 21,360,669
OPERATING INCOME 1,806,906 137,144 1,944,050
NONOPERATING REVENUES (EXPENSES) Investment income 151,267 372 151,639 Loss on disposal of property 93,003)( - 93,003)( Interest and fiscal agent charges 428,944)( 80,206)( 509,150)(
Total nonoperating revenues (expenses) 370,680)( 79,834)( 450,514)(
INCOME BEFORE TRANSFERS 1,436,226 57,310 1,493,536
TRANSFERS Transfers out 1,271,724)( 198,896)( 1,470,620)(
Total transfers 1,271,724)( 198,896)( 1,470,620)(
CHANGE IN NET POSITION 164,502 141,586)( 22,916
TOTAL NET POSITION, BEGINNING 89,864,724 194,640)( 89,670,084
TOTAL NET POSITION, ENDING 90,029,226$ 336,226)$( 89,693,000$
The accompanying notes are an integral part of these financial statements.
Business-type Activities - Enterprise Fund
CITY OF GRAPEVINE, TEXAS
STATEMENT OF REVENUES, EXPENSES AND CHANGESIN NET POSITION - PROPRIETARY FUNDS
FOR THE YEAR ENDED SEPTEMBER 30, 2013

24
Water Lakeand Sewer Enterprise Total
CASH FLOWS FROM OPERATING ACTIVITIES Cash received from customers 20,011,598$ 3,124,324$ 23,135,922$ Cash paid to employees 2,664,966)( 1,291,960)( 3,956,926)( Cash paid to suppliers for goods and services 12,995,537)( 1,148,278)( 14,143,815)(
Net cash provided by operating activities 4,351,095 684,086 5,035,181
CASH FLOWS FROM CAPITAL AND RELATED FINANCING ACTIVITIES Principal repayment on bonds 2,160,000)( 315,000)( 2,475,000)( Interest and related fees paid on long-term debt 389,070)( 104,347)( 493,417)( Acquisition and construction of capital assets 4,797,450)( - 4,797,450)(
Net cash used by capital and related financing activities 7,346,520)( 419,347)( 7,765,867)(
CASH FLOWS FROM INVESTING ACTIVITIES Interest received on investments and cash equivalents 160,641 411 161,052
Net cash provided by investing activities 160,641 411 161,052
CASH FLOWS FROM NONCAPITAL FINANCING ACTIVITIES Transfer out 1,271,724)( 198,896)( 1,470,620)(
Net cash used by noncapital financing activities 1,271,724)( 198,896)( 1,470,620)(
NET INCREASE IN CASH AND CASH EQUIVALENTS 4,106,508)( 66,254 4,040,254)(
CASH AND CASH EQUIVALENTS, BEGINNING 25,144,180 220,320 25,364,500
CASH AND CASH EQUIVALENTS, ENDING 21,037,672$ 286,574$ 21,324,246$
The accompanying notes are an integral part of these financial statements.
CITY OF GRAPEVINE, TEXAS
STATEMENT OF CASH FLOWSPROPRIETARY FUNDS
FOR THE YEAR ENDED SEPTEMBER 30, 2013
Business-type Activities - Enterprise Funds

25
Water Lakeand Sewer Enterprise Total
RECONCILIATION OF OPERATING INCOME TO NET CASH PROVIDED BY OPERATING ACTIVITIES Operating income 1,806,906$ 137,144$ 1,944,050$ Adjustments to reconcile operating income to net cash provided (used) by operating activities: Depreciation 2,466,325 392,484 2,858,809 (Increase) decrease in assets: Customer receivable 60,040)( 4,484 55,556)( Other receivable 92,047)( - 92,047)( Inventories - 3,709)( 3,709)( Increase (decrease) in liabilities: Accounts payable 134,322)( 39,524 94,798)( Accrued liabilities 61,760 1,834)( 59,926 Other liabilities 1,805 8,206 10,011 Deferred revenue 21,194)( - 21,194)( Customer deposits 11,197 - 11,197 Retainage payable 59,212 - 59,212 Net OPEB obligation 221,969 100,414 322,383 Net pension obligation 28,983 12,269 41,252
Compensated absences 541 4,896)( 4,355)(
Total adjustments 2,544,189 546,942 3,091,131
Net cash provided by operating activities 4,351,095$ 684,086$ 5,035,181$
NONCASH INVESTING, CAPITAL, AND FINANCING ACTIVITIES
The City issued bonds to refund Water and Sewer Fund long-term debt. $426,631 was deposited into an
irrevocable trust for the defeasance of $395,000 of outstanding long-term debt and $31,631 of interest.
STATEMENT OF CASHFLOWSPROPRIETARY FUNDS
FOR THE YEAR ENDED SEPTEMBER 30, 2013
Business-type Activities - Enterprise Funds
(Continued)
CITY OF GRAPEVINE, TEXAS

THIS PAGE LEFT BLANK INTENTIONALLY

26
GrapevineHealth Care
ReimbursementAgency Trust
ASSETS Cash and cash equivalents 154,471$ 2,103,628$ Accrued interest receivable - 737
Total assets 154,471 2,104,365
LIABILITIES Accounts Payable - 49 Due to beneficiary 154,471 -
Total liabilities 154,471 49
NET POSITION Held in trust for Grapevine Health Care Reimbursement 2,104,316$
The accompanying notes are an integral part of these financial statements.
CITY OF GRAPEVINE, TEXAS
STATEMENT OF FIDUCIARY NET POSITIONFIDUCIARY FUNDS
SEPTEMBER 30, 2013

THIS PAGE LEFT BLANK INTENTIONALLY
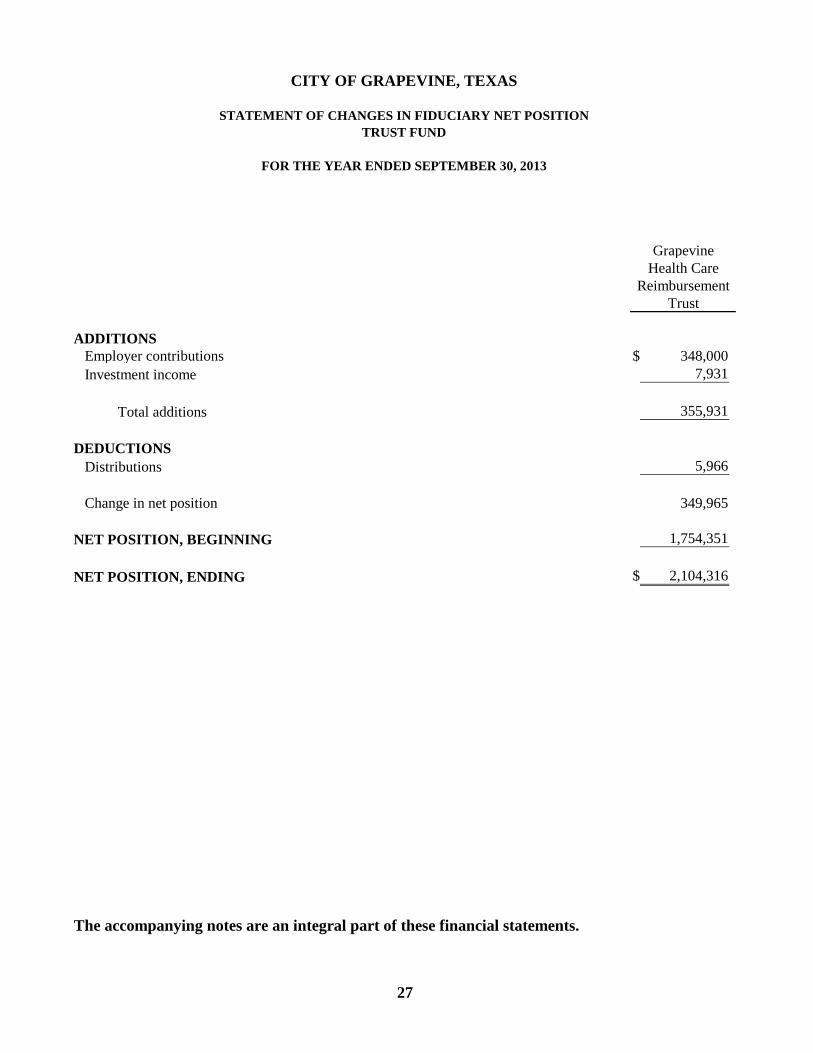
27
GrapevineHealth Care
ReimbursementTrust
ADDITIONS Employer contributions 348,000$ Investment income 7,931
Total additions 355,931
DEDUCTIONS Distributions 5,966
Change in net position 349,965
NET POSITION, BEGINNING 1,754,351
NET POSITION, ENDING 2,104,316$
The accompanying notes are an integral part of these financial statements.
CITY OF GRAPEVINE, TEXAS
STATEMENT OF CHANGES IN FIDUCIARY NET POSITIONTRUST FUND
FOR THE YEAR ENDED SEPTEMBER 30, 2013

THIS PAGE LEFT BLANK INTENTIONALLY

28
CITY OF GRAPEVINE, TEXAS
NOTES TO FINANCIAL STATEMENTS
SEPTEMBER 30, 2013
1. SUMMARY OF SIGNIFICANT ACCOUNTING POLICIES
The City of Grapevine (“City”) is a municipal corporation incorporated under Article XI of the Texas Constitution (Home Rule Amendment). The City operates under a Council-Manager form of government and provides such services as are authorized by its charter to advance the welfare, health, safety and convenience of its citizens. The accounting and reporting policies of the City relating to the funds included in the accompanying financial statements conform to generally accepted accounting principles applicable to state and local governments. The following represents the more significant accounting and reporting policies and practices used by the City. A. Reporting Entity
The accompanying financial statements present the City and its component units, entities for which the City is considered to be financially accountable. Blended component units, although legally separate entities, are, in substance, part of the City’s operations and are appropriately presented as funds of the primary government. Discretely presented component units, on the other hand, are reported in a separate column in the government-wide financial statements to emphasize they are legally separate from the City. Based on these criteria, the financial information of the following entities have been blended or discretely presented within the financial statements.
Blended Component Units Grapevine Tax Increment Financing District Reinvestment Zone Number One and Two (the “TIF’s”) were formed to finance and make public improvements serving only the City, under the authority of the Tax Increment Financing Act. The TIF’s are governed by two separate boards of directors that are substantively the same as the City Council. The chairman of the board is also designated by the City Council.
The Grapevine Crime Control and Prevention District (Crime District) was established to account for the accumulation and use of sales tax proceeds designated for crime reduction programs. One-half (1/2) cent of local sales and use tax within the district funds the Crime District. The Board of Directors of the Crime Control and Prevention District is substantively the same as the City Council. The Grapevine 4B Economic Development Corporation consists of two funds. The 4B Transit Fund accounts for funds designated for Grapevine’s participation in the commuter rail development project with the Fort Worth Transit Authority (the “T”). The Economic Development Fund accounts for funds used to stimulate the local economy, development, and redevelopment. One-half (1/2) cent local sales and use tax within the district fund these two blended component units. Three eighths (3/8th) of one-half cent of the local sales tax is

29
used to fund the 4B Transit Fund. One eighth (1/8th) of one-half cent of the local sales tax is used to fund the Economic Development Fund. The Boards of Directors of these blended component units include citizens as members, but are substantively the same as the City Council. Discretely Presented Component Unit Grapevine Heritage Foundation (the “Foundation”) is a Texas nonprofit corporation governed by a 15-member board of directors appointed by City Council, which includes a City Council member and the Director of the City’s Convention and Visitor’s Bureau. The Foundation’s operating budget is subject to the approval of the City Council. The City is able to impose its will on the Foundation. The boards are not substantively the same. The Foundation does not provide services to the City.
Complete financial statements for the TIFS may be obtained from the City of Grapevine, Finance Department, 200 South Main St., Grapevine Texas 76051. Separate financial statements for the Heritage Foundation, the Crime Control and Protection District, The 4B Transit Fund, and the 4B Economic Development Fund are not prepared.
B. Government-wide Fund Financial Statements The basic financial statements include both government-wide (based on the City as a whole) and fund financial statements. The government-wide financial statements (i.e., the statement of net position and the statement of activities) report information on all of the nonfiduciary activities of the primary government and its component units. For the most part, the effect of interfund activity has been removed from these statements. Governmental activities, which normally are supported by taxes and intergovernmental revenues, are reported separately from business-type activities, which rely to a significant extent on fees and charges for support. Likewise, the primary government is reported separately from certain legally separate component units for which the primary government is financially accountable. The government-wide statement of activities demonstrates the degree to which the direct expenses of a functional category (Public Safety, Public Works, etc.) or segment are offset by program revenues. Direct expenses are those that are clearly identifiable with specific function or segment. Program revenues include (1) charges to customers or applicants who purchase, use, or directly benefit from goods, services, or privileges provided by a given function or segment, and (2) grants and contributions that are restricted to meeting the operational or capital requirements of a particular function or segment. Taxes and other items not properly included among program revenues are reported instead as general revenues. Separate fund based financial statements are provided for governmental funds, proprietary funds, and fiduciary funds, even though the latter are excluded from the government-wide financial statements. Major individual governmental funds and major individual enterprise funds are reported as separate columns in the fund financial statements. GASB Statement No. 34 sets forth minimum criteria (percentage of assets, liabilities, revenues or expenditures/expenses of either fund category for the governmental and enterprise combined) for the determination of major funds. The nonmajor funds are combined in a separate column in the fund financial statements. The nonmajor funds are detailed in the combining section of the statements.

30
The City’s fiduciary funds are presented in the fund financial statements by type. Since by definition these assets are being held for the benefit of a third party (other local governments, individuals, pension participants, etc.) and cannot be used to address activities or obligations of the City, these funds are not incorporated into the government-wide statements.
The government-wide focus is more on the sustainability of the City as an entity and the change in aggregate financial position resulting from the activities of the fiscal period. The focus of the fund financial statements is on the major individual funds of the governmental and business-type categories, as well as the fiduciary funds (by category) and the component units. Each presentation provides valuable information that can be analyzed and compared to enhance the usefulness of the information.
C. Measurement Focus, Basis of Accounting and Financial Statement Presentation
The government-wide financial statements are reported using the economic resources measurement focus and the accrual basis of accounting, as are the proprietary fund financial statements. Revenues are recorded when earned and expenses are recorded when a liability is incurred, regardless of the timing of related cash flows. Property taxes are recognized as revenue in the year for which they are levied. Grants and similar items are recognized as revenue as soon as all eligibility requirements imposed by the provider have been met. Governmental fund level financial statements are reported using the current financial resources measurement focus and the modified accrual basis of accounting. Revenues are recognized as soon as they are both measurable and available. Revenues are considered to be available when they are collectible within the current period or soon enough thereafter to pay liabilities of the current period. For this purpose, the City considers revenues to be available if they are collected within 60 days of the end of the current fiscal period. In applying the susceptible to accrual concept to intergovernmental revenue, the legal and contractual requirements of the numerous individual programs are used as guidance. Generally, monies must be expended on a specific purpose or project before any amounts will be paid to the City; therefore, revenues are recognized based upon the expenditures recorded. Ad valorem taxes are recognized as revenues in the year for which they are levied. Sales taxes, franchise taxes, hotel occupancy taxes, charges for services and fines are recognized as revenue as earned, when measurable and available. Licenses, permits, and miscellaneous revenues (except earnings on investments) are recorded as revenues when received in cash because they are generally not measurable until actually received. Investment earnings are recorded as earned since they are measurable and available. Business-type activities and all proprietary funds are accounted for on a flow of economic resources measurement focus. With this measurement focus, all assets and all liabilities associated with the operation of these funds are included on the balance sheet. Proprietary fund-type operating statements present increases (e.g., revenues) and decreases (e.g., expenses) in net position. Proprietary funds distinguish operating revenues and expenses from nonoperating items. Operating revenues and expenses generally result from providing services and producing and delivering goods in connection with a proprietary fund’s principal ongoing operations. The principal operating revenues of the City’s water and sewer and municipal golf course are charges to customers for sales and services. Operating expenses for the enterprise funds include the cost of sales and services, administrative expenses, and depreciation on capital assets. All revenues and expenses not meeting this definition are reported as non-operating revenues and expenses.

31
Governmental Funds:
The focus of governmental fund measurement (in the fund financial statements) is upon determination of financial position and changes in financial position (sources, uses, and balances of financial resources) rather than upon net income. The following is a description of the major governmental funds of the City:
The City reports the following major governmental funds:
The General Fund accounts for several of the City’s primary services (Police Administration, Fire, Public Works, Libraries, Parks and Recreation, etc.) and is the primary operating unit of the City. The Special Revenue Fund (Hotel Occupancy Tax Fund) accounts for all revenues and expenditures relating to the hotel/motel occupancy tax received by the City. The Special Revenue Fund (Crime District Fund) accounts for the accumulation and use of sales tax proceeds designated for crime reduction programs. The Special Revenue Fund (4B-Transit Fund) is used to account for the accumulation and expenditure of resources used to fund the City of Grapevine's participation in the commuter rail development project with the Fort Worth Transit Authority (the "T"). The Debt Service Fund is used to account for the accumulation of resources for, and the payment of, general long-term debt principal, interest and related costs. The Tax Increment Financing Number One (TIF #1) Debt Service Fund TIF #1 account was established by ordinances authorizing the issuance of Combination Tax and Tax Increment Reinvestment Zone Certificate of Obligations Series 1996. A property tax is levied for the payment of the debt as it becomes due and is currently payable in annual installments as it becomes due. The Capital Projects Fund (Parks Open Space and Recreation Fund) is used to account for the financing, acquisition, construction and improvement of parks and public recreation facilities.
The Capital Projects Fund (General Facilities and Equipment Fund) is used to account for general financing, acquisition, construction and improvements of the City’s buildings and capital equipment.
Proprietary funds: The focus of proprietary fund measurement is upon determination of operating income, changes in net position, financial position, and cash flows, which is similar to businesses. The following is a description of the major proprietary funds of the City:
The Water and Sewer Fund accounts for the operation of the City’s water and sewer utility activities including administration, operation and maintenance of the

32
water and sewer system and billing and collection activities. The fund also accounts for the accumulation of resources for, and the payment of, long-term debt principal and interest for revenue bonds and obligations under capital leases when due throughout the year. All costs are financed through charges made to utility customers with rates reviewed regularly and adjusted if necessary to ensure integrity of the fund. The Lake Enterprise Fund includes the operations of a municipal golf course.
There are no nonmajor proprietary funds for the fiscal year end September 30, 2013.
Fiduciary Funds. There are four fiduciary funds: three agency funds and the Grapevine Health Reimbursement Trust Fund (HRA). Agency Funds represent funds held in an agency capacity for the Industrial Development Corporation, funds held for the Police Department entitled “Police Department Case Settlement” and funds held for the W.D. Tate Scholarship. These funds do not belong to the City. The Industrial Development Corporation is organized solely for the purposes of promoting and developing commercial, industrial, manufacturing and medical research enterprises to promote and encourage employment, public health and welfare. The HRA is an employee benefit trust account organized solely for the purpose of holding resources required to be held in trust for the members and beneficiaries of the defined employee medical plans. Trust funds use the economic resources measurement focus. Agency funds do not have a measurement focus.
As a general rule, the effect of interfund activity has been eliminated from the government-wide financial statements. Exceptions to this general rule are charges between the City’s governmental and business-type activities. Eliminations of these charges would distort the direct costs and program revenues reported for the various functions concerned.
When both restricted and unrestricted resources are available for use, it is the City’s policy to use the restricted resources first, and then use the unrestricted resources as needed.
D. Assets, Liabilities, and Net Position
1. Cash and Investments
Cash consists of demand deposits (principally interest-bearing accounts). Investments are stated at fair value. Fair value is the amount at which a financial instrument could be exchanged in a current transaction between willing parties. The City considers quoted market prices at September 30, 2013, to be the fair value of investments. For purposes of the statement of cash flows, proprietary funds consider all highly liquid investments (including restricted assets) with a maturity of three months or less when purchased to be cash equivalents.
2. Interfund Transactions, Receivables and Payables Activity between funds that are representative of lending/borrowing arrangements outstanding at the end of the fiscal year are referred to as either “due to/from other

33
funds” (i.e., the current portion of interfund loans) or “advances to/from other funds” (i.e., the non-current portion of interfund loans). All other outstanding balances between funds are reported as either “due to/from other funds” or “advances to/from other funds.” Any residual balances outstanding between the governmental activities and business-type activities are reported in the government-wide financial statements as “internal balances.”
3. Property Taxes and Other Receivables
The City’s property tax is levied each October 1, on the assessed value listed as of the prior January 1 for all real property located in the City. The appraisal of property within the City is the responsibility of the Central Appraisal Districts of Dallas, Denton, and Tarrant Counties as required by legislation passed by the Texas Legislature. The Appraisal Districts are required under such legislation to assess all property within their Appraisal District on the basis of 100% of its appraised value and is prohibited from applying any assessment ratios. The assessed value upon which the completed tax year 2012 levy was based was approximately $6,231,678,669. The value of property within the Appraisal District must be reviewed every five years; however, the City may, at its own expense, require annual reviews of appraised values. The City may challenge appraised values established by the Appraisal District through various appeals and, if necessary, legal action.
General property taxes are limited by the Texas Constitution to $2.50 per $100 of assessed valuation. The combined tax rate to finance general governmental service and debt service for the year ended September 30, 2013, was $0.345695 per $100 of assessed valuation. Property taxes attach as an enforceable lien on property as of January 1 following the levy date. Taxes are due by January 31 following the levy date. Property taxes levied for 2013 are recorded as receivables, net of estimated uncollectibles. The net receivables collected during 2013 and those considered “available” at year-end are recognized as revenues in 2013. The City considers property taxes available if they are collected within 60 days after year-end. Prior year levies were recorded using these same principles. The remaining receivables are reflected as deferred revenue in the fund financial statements. All trade and property tax receivables are shown net of an allowance for uncollectibles. All other allowances for uncollectible accounts are based on accounts outstanding in excess of 360 days of the invoice date. The property tax receivable allowance is based on the average collection rate of delinquent taxes over the last 20 years. Property taxes are imposed nonexchange revenue. Assets from imposed nonexchange transactions are recorded when the entity has enforceable legal claim to the asset, or when the entity receives resources, whichever comes first. The enforceable legal claim date for property taxes is the assessment date. The assessment date has been designated in the enabling legislation as October 1. The allowance for uncollectible accounts for utility billing is estimated based on a percentage of sales.

34
4. Inventories and Prepaid Items
Inventories are valued at average cost on a first-in, first-out basis. Inventories in the General Fund are recorded using the consumption method (i.e., recorded as an expenditure when used). Prepaid items are for payments made by the City in the current year to provide services occurring in the subsequent fiscal year. A corresponding portion of fund balance is shown as nonexpendable in governmental funds for prepaid items to indicate it is not available for other subsequent expenditures. Prepaids are defined as payments of greater than $5,000 that benefit future periods.
5. Restricted Assets
Certain proceeds of the City’s general obligation, certificates of obligation and revenue bonds, as well as certain resources set aside for their repayment, are classified as restricted assets on the balance sheet because their use is limited by applicable bond covenants or they are maintained in separate investment accounts. The “revenue bond construction” accounts are used to report those proceeds of revenue bond issuances that are restricted for use in construction of assets. Also included in restricted assets are impact fees (see Note 13) and customer deposits.
6. Capital Assets
Capital assets, which include land improvements, construction-in-progress, buildings and improvements, equipment, intangible assets and infrastructure assets (e.g., roads, bridges, and similar items), are reported in the applicable governmental or business-type activities columns in the government-wide financial statements. Capital assets, other than infrastructure, are defined by the City as assets with an initial, individual cost of more than $5,000 and an estimated useful life in excess of two years. Infrastructure assets are defined by the City as assets costing in excess of $50,000 that have an estimated useful life in excess of two years. Such assets are recorded at historical cost if purchased or constructed. Donated capital assets are recorded at estimated fair market value at the date of donation.
The costs of normal maintenance and repairs that do not add to the value of the asset or materially extend assets lives are not capitalized.
Depreciation has been provided on a straight-line basis over the estimated useful lives of the assets.

35
The estimated useful lives are as follows:
Assets Years
Buildings - wood framed 20Buildings - metal storage 7Buildings - steel framed 40Water and sewer system 30-50General infrastructure 20-30Improvements other than buildings 10-20Machinery and equipment 3-10Motor vehicles 3-10
7. Compensated Absences
It is the City’s policy to permit employees to accumulate earned but unused vacation, compensatory time, and sick pay benefits. Employees are reimbursed upon termination for accumulated vacation and only non-exempt employees are reimbursed for compensatory time. The liabilities for these amounts are accrued as they are incurred in the government-wide and proprietary fund financial statements. Employees are not reimbursed upon termination for accumulated sick leave.
8. Long-term Debt
In the government-wide financial statements, and proprietary funds in the fund financial statements, long-term debt and other long-term obligations are reported as liabilities in the applicable governmental activities, business-type activities, or proprietary fund type statement of net position. Bond premiums and discounts are deferred and amortized over the life of the bonds. Bonds payable are reported net of the applicable bond premium or discount. Bond issuance costs and losses on refundings are reported as deferred charges and amortized on a straight line basis over the life of the related debt.
In the fund financial statements, governmental funds recognize bond premiums and discounts, as well as bond issuance costs, during the current period. The face amount of debt issued is reported as other financing sources. Premiums received on debt issuances are reported as other financing sources while discounts on debt issuances are reported as other financing uses. Issuance costs, whether or not withheld from the actual debt proceeds, are reported as debt service expenditures.
9. Fund Balance Classification
The governmental fund financial statements present fund balances based on classifications that comprise a hierarchy that is based primarily on the extent to which the City is bound to honor constraints on the specific purposes for which amounts in the respective governmental funds can be spent. The classifications used in the governmental fund financial statements are as follows:
Nonspendable: This classification includes amounts that cannot be spent
36
because they are either (a) not in spendable form or (b) are legally or contractually required to be maintained intact. Nonspendable items are not expected to be converted to cash or are not expected to be converted to cash within the next year.
Restricted: This classification includes amounts for which constraints
have been placed on the use of the resources either (a) externally imposed by creditors, grantors, contributors, or laws or regulations of other governments, or (b) imposed by law through constitutional provisions or enabling legislation.
Committed: This classification includes amounts that can be used only for specific purposes pursuant to constraints imposed by ordinance of the City Council. These amounts cannot be used for any other purpose unless the City Council removes or changes the specified use by taking the same type of action that was employed when the funds were initially committed. This classification also includes contractual obligations to the extent that existing resources have been specifically committed for use in satisfying those contractual requirements.
Assigned: This classification includes amounts that are constrained by the City’s intent to be used for a specific purpose but are neither restricted nor committed. This intent can be expressed by the City Council or City Manager.
Unassigned: This classification includes the residual fund balance for the General Fund. The unassigned classification also includes negative residual fund balance of any other governmental fund that cannot be eliminated by offsetting of assigned fund balance amounts.
When an expenditure is incurred for purposes for which both restricted and unrestricted fund balance is available, the City considers restricted funds to have been spent first. When an expenditure is incurred for which committed, assigned, or unassigned fund balances are available, the City considers amounts to have been spent first out of committed funds, then assigned funds, and finally unassigned funds.
10. New Accounting Principles
Significant new accounting standards not yet implemented by the City include the following. Statement No. 65 (“GASB 65”), Items Previously Reported as Assets and Liabilities, is effective for periods beginning after December 15, 2012. This Statement establishes accounting and financial reporting standards that reclassify, as deferred outflows of resources or deferred inflows of resources, certain items that were previously reported as assets and liabilities and recognizes, as outflows of resources or inflows of resources, certain items that were previously reported as assets and liabilities. Statement No. 68 (“GASB 68”), Accounting and Financial Reporting for Pensions - an Amendment of GASB Statement No. 27, is effective for periods beginning after June 15, 2014. The primary objective of this Statement is to improve accounting and financial

37
reporting by state and local governments for pensions. This Statement results from a comprehensive review of the effectiveness of existing standards of accounting and financial reporting for pensions with regard to providing decision-useful information, supporting assessments of accountability and interperiod equity, and creating additional transparency.
2. DEFICIT EQUITY BALANCES
The Lake Parks Fund (Special Revenue – Nonmajor Fund) had a deficit fund balance of ($820,930). This deficit has been decreasing over recent years and is attributed to an increase in revenues from the expansion of the Vineyards Campground and cabins. This deficit will either be resolved with these increased revenues or a transfer from other funds in the future. The Grant Fund (Special Revenue – Nonmajor Fund) had a deficit fund balance of ($2,483) at year-end. This deficit can be attributed to the timing of grant payments from granting agencies. The deficit will be funded in the subsequent period with the receipt of grant funding.
The Lake Enterprise Fund had a deficit net position of ($336,226). The City anticipated the deficit equity balance in this fund will decline in the future. If this deficit continues it will either be resolved with an increase in revenues or a transfer from other funds.
3. CASH AND INVESTMENTS
As of September 30, 2013, the City had the following cash and investments:
Total City cash deposits 29,465,267$ Total investments 183,724,369
Total City cash and investments 213,189,636$
Cash and investments composition: Primary government 210,430,346$ Component unit 501,191 Trust and agency funds 2,258,099
Total cash and investments 213,189,636$
Weighted Average
Investment Type Fair Value Maturity (Days)
TexPool 181,040,216$ 60
LOGIC 1,823,986 55
U. S. Treasury Bonds 294,043 327
Municipal Bonds 566,124 30
Total portfolio 183,724,369$
Portfolio weighted average maturity (days) 60

38
Investment pools are not categorized as to investment risk since specific securities relating to the City cannot be identified. Under the TexPool Participation Agreement, administrative and investment services to TexPool are provided by Lehman Brothers, Inc. and Federated Investors, Inc. through an agreement with the State of Texas Comptroller of Public Accountants. The State Comptroller is the sole officer, director, and shareholder of the Texas Treasury Safekeeping Trust Company authorized to operate TexPool. Under the LOGIC Participation Agreement, administrative and investment services to LOGIC are provided by First Southwest Asset Management, Inc. and JP Morgan Asset Management, Inc. as co administrators. The administrators settle all trades for LOGIC and secure and value its assets every day. The fair value of the City’s position in these pools is the same as the value of the pool shares. As of September 30, 2013, the City’s investments in LOGIC and TexPool were both rated AAAm by Standard & Poor’s.
Interest Rate Risk. In accordance with its investment policy, the City minimizes the risk that the interest earnings and the market value of investments in the portfolio will fall due to changes in general interest rates, by:
a. Structuring the investment portfolio so that investments mature to meet cash
requirements for ongoing operations, thereby avoiding the need to liquidate investments prior to maturity.
b. Investing operating funds primarily in certificates of deposit, shorter-term securities, money market mutual funds, or local government investment pools functioning as money market mutual funds.
c. Diversifying maturities and staggering purchase dates to minimize the impact of market movements over time.
Credit Risk. In accordance with its investment policy, the City minimizes credit risk, the risk of loss due to the failure of the issuer or backer of the investment by:
a. Limiting investments to the safest types of investments.
b. Pre-qualifying the financial institutions and broker/dealers with which the City will do business.
c. Diversifying the investment portfolio so that potential losses on individual issuers will be minimized.
Concentration of Credit Risk. The City’s investment policy allows up to 100% to be invested in U. S. Treasury Bills/Notes/Bonds, and U. S. Agencies and Instrumentalities. The City’s investment in the securities of U. S. agencies are rated AAA by Standard & Poor’s. TexPool and LOGIC are public funds investment pools operating as a 2a-7 like pool and in full compliance with the Public Funds Investment Act. Custodial Credit Risk. State statutes require that all City deposits in financial institutions be fully collateralized by U. S. Government obligations or obligations of the State of Texas or its agencies. The City’s deposits were fully collateralized by government securities, or had a letter of credit issued by the Federal Home Loan Bank as required by State statutes at September 30, 2013.

39
4. RECEIVABLES
Receivables as of year-end for the City’s individual major funds and nonmajor funds in the aggregate, including the applicable allowances for uncollectible accounts, are as follows:
Less
Accrued Gross Allowance for
Interest Taxes Accounts Receivables Uncollectibles Total
General 1,711$ 5,075,166 4,808,480 9,885,357$ 3,566,903)( 6,318,454$
Hotel Occupancy 1,221 972,070 79,748 1,053,039 14,988)( 1,038,051
Crime District - 1,962,876 2,928 1,965,804 - 1,965,804
4B - Transit Fund 181 1,438,677 - 1,438,858 - 1,438,858
Debt Service 2,221 1,116,085 21,932 1,140,238 794,428)( 345,810
Debt Service TIF #1 4,419 1,632,603 - 1,637,022 - 1,637,022
Parks Open Space and Recreation 17 - - 17 - 17
General Facilities and Equipment 82 - - 82 - 82
Water and Sewer 2,748 - 2,860,633 2,863,381 125,260)( 2,738,121
Lake Enterprise 15 - 32,439 32,454 - 32,454
Nonmajor funds 6,154 1,760,469 195,364 1,961,987 - 1,961,987
Total 18,769$ 13,957,946$ 8,001,524$ 21,978,239$ 4,501,579)$( 17,476,660$
Governmental funds report deferred revenue in connection with receivables for revenue that is not considered to be available to liquidate liabilities of the current period. Governmental funds also defer revenue recognition in connection with resources that have been received, but not yet earned. At the end of the current fiscal year, the various components of deferred revenue and unearned revenue reported in the governmental funds were as follows:
Unavailable Unearned
Governmental funds:
Franchise taxes - 1,606,328$
Open space deposits - 123,044
Convention center deposits - 99,779
Camping and pavilion fees - 237,427
Delinquent property taxes receivable - general 182,073$ -
Delinquent property taxes receivable - debt service 308,597 -
Grants 251,958 -
Property taxes receivable debt service - TIF #1 1,093,579 -
Property taxes receivable debt service - TIF #2 1,164,712 -
Ambulance fees 764,293 -
Municipal court fines 227,939 -
Miscellaneous 24,000 53,925
Total 4,017,151$ 2,120,503$ The City considers franchise taxes exchange transactions as a lease of right-of-way for utility lines. Because they are treated as exchange transactions, the payments are recorded as unearned revenue and then are recognized in the period of exchange.

40
5. CAPITAL ASSETS
Capital asset activity for the year ended September 30, 2013, was as follows:
Primary GovernmentBeginning Transfers Transfers and EndingBalance and Additions Retirements Balance
Governmental activities: Capital assets, not being depreciated: Land 47,821,876$ - - 47,821,876$
Construction in progress 3,725,009 5,660,173$ 3,358,023)$( 6,027,159
Total assets not being depreciated 51,546,885 5,660,173 3,358,023)( 53,849,035
Capital assets, being depreciated: Buildings 49,729,458 959,539 - 50,688,997 Improvement other than buildings 27,115,453 3,621,646 - 30,737,099 Equipment and vehicles 30,788,276 7,778,822 2,066,387)( 36,500,711
Infrastructure 121,490,558 1,249,520 1,250,835)( 121,489,243
Total capital assets being depreciated 229,123,745 13,609,527 3,317,222)( 239,416,050
Less accumulated depreciation: Buildings 16,614,187)( 1,435,628)( - 18,049,815)( Improvement other than buildings 8,329,192)( 1,266,603)( - 9,595,795)( Equipment and vehicles 21,459,426)( 2,208,842)( 1,060,745 22,607,523)(
Infrastructure 65,135,619)( 4,261,042)( - 69,396,661)(
Total accumulated depreciation 111,538,424)( 9,172,115)( 1,060,745 119,649,794)(
Total capital assets being
depreciated, net 117,585,321 4,437,412 2,256,477)( 119,766,256
Governmental activities capital
assets, net 169,132,206$ 10,097,585$ 5,614,500)$( 173,615,291$

41
Beginning Transfers Transfers and EndingBalance and Additions Retirements Balance
Business-type activities: Capital assets, not being depreciated: Land 1,643,545$ - - 1,643,545$
Construction in progress 2,122,792 3,954,809$ 5,857,847)$( 219,754
Total assets not being depreciated 3,766,337 3,954,809 5,857,847)( 1,863,299
Capital assets, being depreciated:
Buildings 2,432,585 - - 2,432,585
Improvement other than buildings 6,867,585 - - 6,867,585 Equipment and vehicles 1,109,718 848,513 8,995)( 1,949,236 Water storage rights 683,547 - - 683,547
Infrastructure 111,835,306 5,759,899 - 117,595,205
Total capital assets being depreciated 122,928,741 6,608,412 8,995)( 129,528,158
Less accumulated depreciation: Buildings 1,592,811)( 41,969)( - 1,634,780)( Improvement other than buildings 4,623,707)( 364,493)( - 4,988,200)( Equipment and vehicles 599,865)( 117,666)( 8,068 709,463)( Water storage rights 536,864)( 17,089)( - 553,953)(
Infrastructure 37,885,251)( 2,317,592)( - 40,202,843)(
Total accumulated depreciation 45,238,498)( 2,858,809)( 8,068 48,089,239)(
Total capital assets being
depreciated, net 77,690,243 3,749,603 927)( 81,438,919
Business-type activities capital
assets, net 81,456,580$ 7,704,412$ 5,858,774)$( 83,302,218$ Depreciation expense was charged to functions/programs of the primary government as follows:
Governmental activities: General government 629,340$ Public safety 1,153,896 Public works 4,738,946 Culture and recreation 2,649,933
Total depreciation expense - governmental activities 9,172,115$
Business-type activities: Water and sewer 2,466,325$ Lake Enterprise 392,484
Total depreciation expense - business-type activities 2,858,809$

42
Beginning Transfers Transfers and EndingBalance and Additions Retirements Balance
Discretely Presented Component Unit:
Capital assets, not being depreciated:
Land 450,067$ - - 450,067$
Total assets not being depreciated 450,067 - - 450,067
Capital assets, being depreciated: Building 1,031,174 - - 1,031,174 Improvements other than building 945,651 - - 945,651
Vehicles and equipment 31,275 - - 31,275
Total capital assets being depreciated 2,008,100 - - 2,008,100
Less accumulated depreciation: Building 156,271)( 27,576)( - 183,847)( Improvements other than building 644,138)( 47,801)( - 691,939)(
Vehicles and equipment 31,275)( - - 31,275)(
Total accumulated depreciation 831,684)( 75,377)( - 907,061)(
Total capital assets being
depreciated, net 1,176,416 75,377)( - 1,101,039
Discretely presented component unit
capital assets, net 1,626,483$ 75,377)$( -$ 1,551,106$
Construction Commitments
The City has active construction projects as of September 30, 2013. The projects include building projects, street construction and improvements of existing streets, and repair and maintenance of existing water and sewer systems. As of September 30, 2013, the City had outstanding construction commitments totaling $5,347,815.
Project Commitment
Streets and drainage projects 556,167$ Commuter rail project 112,544 Water and wastewater projects 1,090,193 Public safety building 2,025,832 Community activity center renovation 1,563,079
Total 5,347,815$
The commitment for building, street and drainage construction is funded from unexpended general obligation, certificates of obligation, and revenue bond proceeds. Water and wastewater projects are funded from unexpended revenue bond proceeds and operations.

43
6. INTERFUND RECEIVABLES, PAYABLES, AND TRANSFERS
The composition of interfund balances as of September 30, 2013, is as follows:
Due to/from Other Funds
Receivable Fund Payable Fund Amount
General Crime District 1,005,090$ Grants (nonmajor fund) 125,066 Lake Parks (nonmajor fund) 582,141 Water and Sewer 9,286 Lake Enterprise 926,650
Total General 2,648,233
Hotel Occupancy Tax
General Facilities and Equipment 326,270
Total 2,974,503$
Interfund Transfers
The primary purpose of interfund transfers is the transfer of funds from one fund to support expenditures of another fund in accordance with the authority established for the individual fund. A summary of interfund transfers by fund type is as follows:
Hotel GeneralOccupancy Crime 4B - Transit Debt Facilities and Nonmajor
General Tax District Fund Service Equipment Governmental TotalTransfers from:
General -$ 15,041$ 1,300,000$ -$ -$ 2,169,886$ 7,407,150$ 10,892,077$ Hotel Occupancy Tax 966,247 - - 244,460 2,085,317 828,029 450,000 4,574,053 Crime District - - - - - - 1,500 1,500 4B - Transit Fund - 298,819 - - - - - 298,819 Debt Service - TIF #1 - - - - - - 1,130,111 1,130,111 Water and Sewer 1,271,724 - - - - - - 1,271,724 Lake Enterprise 198,896 - - - - - - 198,896 Nonmajor Governmental 364,216 - - - 464,361 - 572,000 1,400,577
Total 2,801,083$ 313,860$ 1,300,000$ 244,460$ 2,549,678$ 2,997,915$ 9,560,761$ 19,767,757$
Transfers to

44
Various nonmajor funds received transfers from the General Fund during fiscal year 2013. The General Fund transferred $3,000,000 to the Quality of Life Fund for capital projects. Per Council policy, revenues in excess of the 20% balance requirement in the General Fund are to be transferred to the Quality of Life CIP Fund at fiscal year-end. The General Fund transferred $1,300,000 to the Crime District Fund to supplement a decrease in anticipated sales tax revenues for fiscal year 2013. In addition, the Street Maintenance and Capital Replacement Fund received a $2,809,000 transfer for capital projects related to streets and general facilities, and $1,596,650 was transferred to the Capital Acquisition Fund for fleet, capital and technology equipment purchases. There were transfers to the Debt Service Fund of $2,085,317 for payment of debt obligations for the Hotel Occupancy Tax Fund, $113,988 for the Storm Drainage Fund, and $327,651 for the Lake Parks Fund, $22,722 for the Municipal Court Technology Fund. Transfers to the General Fund for $2,801,083 were for payments from other funds for insurance, claims, fleet and IT costs administered by the General Fund.
7. LEASES
Operating Leases
Lake Parks:
The City entered into a 25-year lease agreement with the United States Corps of Engineers to operate and maintain approximately 770 acres of property at Lake Grapevine. The City is required to pay the cost to maintain and operate the property. Revenues generated from the operations on the property will be used to maintain the property. The term of the operating lease is from October 2004 through September 2029. The agreement covers the park areas of Meadowmere Park, Oak Grove Park and Silver Lake Park.
Gaylord Texan Resort and Convention Center:
The City leased property from the United States Corps of Engineers as referred to above (Lake Parks). The City entered into a sublease agreement with the Gaylord Texan Resort and Convention Center on March 18, 1994, for a portion of the land leased from the United States Corps of Engineers. The contract is for 49 years and the rent payment is $1 per year. Gaylord Texan Resort and Convention Center has a sublease hold deed of trust and security agreement. The City agreed to sublease property to Gaylord Texan Resort and Convention Center so they could secure financing.
The City and Gaylord Texan Resort and Convention Center entered into an amended agreement in fiscal year 2008 pertaining to the United States Corps of Engineers leased property referred to as the “Lease Property.” This amendment does not become effective until the issuance of a building permit for the expansion on this property. The “Lease Property” terms provide for annual rents during the construction of the expansion of $54,360 with periodic fee increases due upon substantial completion of the expansion of the Gaylord Texan Resort and Convention Center. The annual rent will be adjusted every five years based on the terms of the contract. The Land Lease shall commence upon the issuance of a building permit for the expansion and shall have a primary term of 25 years with Gaylord Texan Resort and Convention Center having the right to extend the term for one additional period of 25 years.

45
In the new amended agreement between the City and Gaylord Texan Resort and Convention Center, the City also granted to Gaylord Texan Resort and Convention Center an option for the right to lease the “Western Amenity Parcel.” For a period of one year from the date of the Option Election, Gaylord Texan Resort and Convention Center has the right to lease the “Western Amenity Parcel,” and to keep the option in effect, Gaylord Texan Resort and Convention Center must continue paying annual rent at an amount based upon the contract terms. Gaylord Texan Resort and Convention Center elected to pick up the option for the “Western Amenity Parcel” on June 5, 2008, and paid the City of Grapevine $54,000 in accordance with the terms of the agreement. In May 2009, the City and Gaylord Texan Resort and Convention Center entered into a third agreement and agreed to extend the required commencement date of the expansion from September 12, 2009, until September 12, 2012, and extended the renewal dates for parcels 5 and 7, as defined in the agreement, until September 12, 2012. In September 2012, the City and the Gaylord Texan Resort and Convention Center entered into a fourth agreement and agreed to extend the required commencement date of the expansion until March 12, 2013. In November 20, 2012 the date was extended until September 12, 2014.
Cowboys Golf Course: The City entered into a 25-year lease agreement with the Cowboys Golf Course in 1994. The rent fee is 3% of Cowboys’ gross revenues from operations.
8. LONG-TERM LIABILITIES
General Obligation Bonds The City issues general obligation bonds to provide funds for the acquisition and construction of major capital facilities. General obligation bonds have been issued for both governmental and business-type activities.
General obligation bonds are direct obligations and pledge the full faith and credit of the City. These bonds generally are issued as 20-year serial bonds with principal maturing each year.
A summary of the terms of general obligation bonds, combination tax and revenue bonds, and certificates of obligation outstanding and their corresponding allocations to the governmental and business-type activities at September 30, 2013, follows:
Purpose Interest Rates Amount
Governmental activities 2.5% - 5.25% 74,020,000$ Governmental activities, refunding 2.5% - 5.25% 28,672,840
Total governmental 102,692,840
Business-type activities, refunding 2.0% - 5.25% 10,845,000
Total general obligation debt 113,537,840$

46
Annual debt service requirements for general obligation bonds are as follows:
Year Ending General G. O. General G. O.
September 30, Obligation Interest Obligation Interest
2014 6,035,000$ 4,415,394$ 1,750,000$ 421,312$
2015 7,300,000 3,747,889 1,830,000 347,525
2016 7,595,000 3,507,634 1,925,000 268,125
2017 6,580,000 3,274,306 1,855,000 195,038
2018 6,045,000 3,060,587 1,270,000 119,000
2019-2023 25,350,000 11,877,703 2,215,000 105,000
2024-2028 20,115,000 7,286,986 - -
2029-2033 23,672,840 2,882,075 - -
Total 102,692,840$ 40,052,574$ 10,845,000$ 1,456,000$
Governmental Activities Business-type Activities
Certificates of Obligation
The City also issues certificates of obligation (“COs”) to finance the acquisition and construction of capital assets including certain capital improvement projects, municipal facilities, and machinery and equipment. Interest rates on the outstanding COs range from 3.00% – 7.00%. Annual debt service requirements to maturity for certificates of obligation of the primary government are as follows:
Year Ending Certificates C. O.
September 30, of Obligation Interest
2014 4,626,736$ 2,047,833$
2015 4,748,386 1,844,056
2016 4,810,095 1,615,121
2017 2,486,864 1,447,480
2018 2,603,694 1,334,576
2019-2023 14,173,143 4,813,025
2024-2028 11,400,000 1,363,287
2029-2033 810,000 24,552
Total 45,658,918$ 14,489,930$
Governmental Activities

47
Notes Payable
The City issues tax notes to finance the construction of capital improvement projects, municipal facilities, and machinery and equipment. The interest rates on the outstanding tax notes range from 3.00% – 4.25%.
Tax, Land and Other Notes debt service requirements to maturity are as follows:
Year Ending Tax, Land and Tax, Land and
September 30, Other Notes Other Interest
2014 1,824,236$ 165,355$
2015 1,400,342 97,856
2016 571,533 69,285
2017 587,816 56,751
2018 580,000 34,200
2019-2023 1,307,103 61,558
2024-2028 25,488 965
Total 6,296,518$ 485,970$
Governmental Activities
The following is a summary of long-term liability transactions of the City for the year ended September 30, 2013, (amounts expressed in thousands):
Balance Balance Due Within9/30/2012 Increases Reductions 9/30/2013 One Year
Governmental activities: General obligation bonds 40,355,000$ 73,450,000$ 11,112,160)$( 102,692,840$ 6,035,000$
Certificates of obligation 50,794,060 1,225,000 6,360,142)( 45,658,918 4,626,736
Total bonds payable 91,149,060 74,675,000 17,472,302)( 148,351,758 10,661,736
Notes payable - taxes 3,390,000 3,965,000 1,260,000)( 6,095,000 1,810,000
Notes payable 214,730 - 13,212)( 201,518 14,236
Total notes payable 3,604,730 3,965,000 1,273,212)( 6,296,518 1,824,236
Total bonds and notes 94,753,790 78,640,000 18,745,514)( 154,648,276 12,485,972
Less deferred amount on refunding 2,896,959)( 340,282)( 366,250 2,870,991)( - Premium on bond issues 3,787,206 3,454,961 843,001)( 6,399,166 -
Discount on bond issues 24,159)( - 24,159 - -
Net governmental bonds and
notes outstanding 95,619,878 81,754,679 19,198,106)( 158,176,451 12,485,972
Sales tax obligation 1,147,459 - 201,656)( 945,803 173,556 Net OPEB obligation 8,861,731 2,684,765 - 11,546,496 - Net pension obligation 4,641,703 6,314,370 5,928,131)( 5,027,942 -
Compensated absences 2,880,586 2,339,543 2,272,759)( 2,947,370 736,843
Total governmental
long-term liabilities 113,151,357$ 93,093,357$ 27,600,652)$( 178,644,062$ 13,396,371$

48
For the governmental activities, compensated absences and other long-term liabilities are generally liquidated by the General Fund.
Balance Balance Due Within
9/30/2012 Increases Reductions 9/30/2013 One Year
Business-type activities: Water and sewer obligations General obligation bonds 9,895,000$ 415,000$ 1,765,000)$( 8,545,000$ 1,420,000$ Water and sewer bonds 790,000 - 790,000)( - - Less deferred amount on refund 450,630)( 41,301)( 87,684 404,247)( -
Premium on bond issues 420,795 20,023 85,289)( 355,529 -
Net water and sewer bonds payable 10,655,165 393,722 2,552,605)( 8,496,282 1,420,000
Lake enterprise obligations General obligation bonds 2,615,000 - 315,000)( 2,300,000 330,000 Less deferred amount on refund 53,224)( - 8,349 44,875)( -
Premium on bond issues 245,955 - 35,136)( 210,819 -
Net Lake Enterprise bonds payable 2,807,731 - 341,787)( 2,465,944 330,000
Net business-type bonds payable 13,462,896 393,722 2,894,392)( 10,962,226 1,750,000
Net OPEB obligation 1,168,697 322,383 - 1,491,080 - Net pension obligation 505,755 674,418 633,166)( 547,007 -
Compensated absences 229,400 180,419 184,774)( 225,045 56,262
Total business-type
long-term liabilities 15,366,748$ 1,570,942$ 3,712,332)$( 13,225,358$ 1,806,262$ Advance Refunding
The City issued $8,060,000 of General Obligation Refunding Bonds, Series 2012 with interest rates ranging from 2.0%-2.125%. The proceeds of these bonds were used to refund the following obligations:
Amount Refunded Obligations Refunded
Combination Tax and Revenue Improvement Bonds, Series 2001 240,000$
General Obligation Refunding and Improvement Bonds, Series 2002 330,000
Combination Tax and Revenue Certificates of Obligation, Series 2003 225,000
General Obligation Refunding and Improvement Bonds, Series 2003 2,980,000
General Obligation Refunding Bonds, Series 2004 2,675,000
ombination Tax and Lake Parks Revenue Certificates of Obligation, Series 2005A 1,035,000
General Obligation Refunding Bonds, Series 2006 395,000
7,880,000$ The net proceeds were deposited in an irrevocable trust with an escrow agent to provide funds for future debt service payments on the refunded bonds. As a result, the refunded bonds are considered defeased and the liability for those bonds has been removed from the statements of net position. The reacquisition price exceeded the carrying amount of the old debt by $381,583.

49
This amount is being netted against the new debt and amortized over the remaining life of the refunded debt, which is shorter than the life of the new debt issued. This refunding was undertaken to decrease total debt service payments over 15 years by $966,711and resulted in an economic gain (difference between the present values of the debt service payments of the old and new debt) of $885,694. Defeasance of Debt
As of September 30, 2013 outstanding balances of bond issues that have been refunded and defeased in-substance by placing existing assets and the proceeds of new bonds in an irrevocable trust to provide for all future debt service payments are $4,105,000. Other Long-term Liabilities – Texas Comptroller of Public Accounts
As of September 30, 2013, the City of Grapevine has three payout agreements with the Texas Comptroller of Public Accounts for overpayment of sales taxes that total $945,803. These amounts will be withheld from sales tax receipts over a period not to exceed seven years. Pledged Revenues
Tax Increment Financing District #1 The Board of Directors for the Tax Increment Financing District #1 approved amending the Financing and Project Plan to allow the creation of a 380 Category within the Financing and Plan whereas all City funds contributed to date and additional funds contributed up to 2016-2017 be placed in a 380 account in the TIF zone to incentivize further economic development in the zone. The action was passed by the Board on September 8, 2009. Tax Increment Financing District #2 The City has entered into a local agreement with the Grapevine-Colleyville Independent School District where future ad valorem taxes collected for the zone will be used to contribute towards the School’s middle school debt. The total contribution that the City is obligated to pay is $40,287,173 as of September 30, 2013. This annual amount was negotiated with the school and the school bills the City for this annual debt payment. The City does not have title to the middle school improvements.
9. EMPLOYEES’ RETIREMENT SYSTEM
Plan Description
The City provides pension benefits for all of its eligible employees through a non-traditional, joint contributory, hybrid defined benefit plan in the statewide Texas Municipal Retirement System (TMRS), an agent multiple-employer public employee retirement system. The plan provisions that have been adopted by the City are within the options available in the governing state statutes of TMRS.

50
TMRS issues a publicly available comprehensive annual financial report that includes financial statements and required supplementary information (RSI) for TMRS; the report also provides detailed explanations of the contributions, benefits and actuarial methods and assumptions used by the System. This report may be obtained from TMRS’ website at www.TMRS.com.
The plan provisions are adopted by the governing body of the City, within the options available in the state statutes governing TMRS. Plan provisions for the City were as follows:
Plan Year 2011 Plan Year 2012 Plan Year 2013
Employee deposit rate 7.00% 7.00% 7.00%Matching ratio (city to employee) 2 to 1 2 to 1 2 to 1Years required for vesting 5 5 5Service retirement eligibility (expressed as age/years of service) 60/5, 0/20 60/5, 0/20 60/5, 0/20Updated service credit 100% repeating, 100% repeating, 100% repeating,
transfers transfers transfersAnnuity increase (to retirees) 70% of CPI 70% of CPI 70% of CPI
repeating repeating repeating
Contributions
Under the state law governing TMRS, the contribution rate for each City is determined annually by the actuary, using the Projected Unit Credit actuarial cost method. This rate consists of the normal cost contribution rate and the prior service cost contribution rate, which is calculated to be a level percent of payroll from year to year. The normal cost contribution rate finances the portion of an active member’s projected benefit allocated annually; the prior service contribution rate amortizes the unfunded (overfunded) actuarial liability (asset) over the applicable period for that city. Both the normal cost and prior service contribution rates include recognition of the projected impact of annually repeating benefits, such as Updated Service Credits and Annuity Increases.
The City contributes to the TMRS Plan at an actuarially determined rate. Both the employees and the City make contributions monthly. Since the City needs to know its contribution rate in advance for budgetary purposes, there is a one-year delay between the actuarial valuation that serves as the basis for the rate and the calendar year when the rate goes into effect. The annual pension cost and net pension obligation/(asset) are as follows:
Annual Required Contribution (ARC) 6,945,038$ Interest on Net Pension Obligation 360,322 Adjustment to the ARC 316,572)(
Annual Pension Cost 6,988,788 Contributions Made 6,561,297)(
Increase (Decrease) in Net Pension Obligation 427,491 Net Pension Obligation/(Asset), beginning of year 5,147,458
Net Pension Obligation/(Asset), ending of year 5,574,949$

51
Accounting Annual Actual Percentage NetYear Pension Contribution of APC Pension
Ending Cost (APC) Made Contributed Obligation
9/30/2011 7,530,037$ 5,993,241$ 80% 4,415,012$ 9/30/2012 6,890,012 6,157,566 89% 5,147,458 9/30/2013 6,988,788 6,561,297 94% 5,574,949
The required contribution rates for fiscal year 2013 were determined as part of the December 31, 2010 and 2011 actuarial valuations. Additional information as of the latest actuarial valuation, December 31, 2012, also follows:
Valuation Date 12/31/2010 12/31/2011 12/31/2012
Actuarial cost method Projected Unit Credit Projected Unit Credit Projected Unit Credit
Amortization method Level percent Level percent Level percentof payroll of payroll of payroll
GASB 25 equivalent single 27.2 years; 26.2 years; 25.2 years; amortization period closed period closed period closed period
Amortization period for new gains/losses 30 years 30 years 30 years
Asset valuation method 10-year smoothed 10-year smoothed 10-year smoothedmarket market market
Actuarial Assumptions:
Investment rate of return 7.00% 7.00% 7.00%
Projected salary increases * varies by age varies by age varies by ageand service and service and service
*Includes inflation at 3.00% 3.00% 3.00%
Cost-of-living adjustments 2.10% 2.10% 2.10%
Schedule of Funding Information
The funded status as of December 31, 2012, the most recent actuarial valuation date, is as follows:
Actuarial UAAL as a
Actuarial Accrued Unfunded Percentage
Actuarial Value of Liability Funded AAL Covered of Covered
Valuation Assets (AAL) Ratio (UAAL) Payroll Payroll
Date (a) (b) (a/b) (b-a) (c) (b-a)/(c)
12/31/2012 156,289,479 198,037,309 78.9% 41,747,830 34,807,908 119.9%
Actuarial valuations involve estimates of the value of reported amounts and assumptions about the probability of events far into the future. Actuarially determined amounts are subject to continual revision as actual results are compared to past expectations and new estimates are made about the future.

52
Actuarial calculations are based on the benefits provided under the terms of the substantive plan in effect at the time of each valuation, and reflect a long-term perspective. Consistent with that perspective, actuarial methods and assumptions used include techniques that are designed to reduce short-term volatility in actuarial accrued liabilities and the actuarial value of assets. The Schedule of Funding Progress, presented as Required Supplementary Information following the notes to the financial statements, presents multi-year trend information about whether the actuarial value of plan assets is increasing or decreasing over time relative to the actuarial accrued liability of benefits.
10. COMMITMENTS AND CONTINGENCIES The City is defendant in several pending lawsuits. City management estimates, based on the advice of legal counsel, that the potential claims against the City, in excess of insurance coverage, would not materially affect the basic financial statements of the City. The City participates in a number of federal and state grant programs. These programs are subject to program compliance audits by the grantors or their representatives. Any liability that may arise as the result of these audits is not believed to be estimable or probable. Gaylord Texan Resort and Convention Center The City of Grapevine, Texas has a Memorandum of Understanding with Opryland Hotel—Texas, Limited Partnership “Gaylord” whereas one cent ($.01) of the Hotel Occupancy Tax [currently six cents($.06)] collected by the City from the Gaylord, for the immediately preceding fiscal-year, shall be remitted each year back to the Gaylord. Per the agreement dated March 24, 1999, these payments will continue for a period of 20 years. Expenditures for fiscal year-end 2013 were $701,970. On November 20, 2012, the City entered into a fifth addendum agreement with Opryland Hotel – Texas, Limited Partnership related to the expansion of the Gaylord Texan Resort and Convention Center. Gaylord Entertainment, Inc. will receive a payment from the City in the amount equal to one-half of the “City Property Taxes” paid by Gaylord Texan Resort and Convention Center to the City for a 10-year period. The term “City Property Taxes” means the amount determined by multiplying the City ad valorem tax rate for the years in question times the “Incremental Increase” in value with the base year being 2009. On October 1, 2012, the Opryland Hotel – Texas, Limited Partnership changed its name to RHP Property, GT a Delaware Corporation and is now being reimbursed by the City as Marriott Gaylord. The payment of Hotel Occupancy Taxes, as described in the preceding paragraph, will continue for a period of 20 years. If a building permit is issued for the expansion of the Gaylord Hotel prior to September 12, 2014, an additional one cent ($.02 total) will then be remitted back to the Gaylord for the remainder of the 20 years.

53
Great Wolf Lodge The City of Grapevine, Texas entered into an incentive agreement with Great Wolf Resorts, Inc. under Chapter 380 of the Texas Local Government Code. The Developer must complete the project to construct a family oriented resort hotel featuring an indoor water park to be known as the “Great Wolf Lodge.” The Project is to be completed in two phases. In consideration of the Developer’s completion of the Project, the City agrees to provide the following incentives. For a period of 10 years after the issuance of a Certificate of Occupancy for Phase I, the City shall annually grant an amount to developer equal to one cent ($ .01) of the Hotel Occupancy Tax rate [currently six cents ($.06)] collected by the City from Phase I of the Project for the immediately preceding Fiscal Year. For a period of 10 years after the issuance of a Certificate of Occupancy for Phase I, the City shall annually grant an amount to Developer equal to one cent of the Hotel Occupancy Tax rate [currently six cents ($.06)] collected by the City from Phase II of the Project for the immediately preceding Fiscal Year. The City shall annually provide a grant in an amount equal to one half of one cent of the municipal sales tax revenue collected on the “Property” for a period of 10 years following the opening of Phase II. Incentives of $527,708 were earned in fiscal year 2013 and were remitted by the City in fiscal year 2014 per contract.
Henry Schein
The City of Grapevine, Texas entered into a rebate agreement with Henry Schein, Inc. on March 6, 2007, for the rebate of Sales Tax Receipts from the one percent (1%) sales and use tax under Chapter 321 of the Texas Tax Code. The amount of the rebate is eighty seven and one half percent (87.5%) of the sales tax receipts for the sale of taxable items at the Henry Schein facility in Grapevine, TX. The rebate does not apply to the one half of one percent (.5 %) sales and use tax imposed on behalf of the Grapevine 4B Economic Development Corporation and one half of one percent (.5 %) sales and use tax imposed on behalf of the Grapevine Crime Control and Prevention District. The initial term of the agreement began on April 1, 2007, and continues until the 10th anniversary date of the commencement date. Thereafter, the term of this agreement shall be automatically renewed for two (2) successive terms of ten (10) years each. Rebate amounts earned by Henry Schein, Inc. totaled $1,101,627 as of September 30, 2013.
Grapevine Mills Mall
In 2012, the Tax Increment Financing District Reinvestment Zone Number One (TIF#1) Board of Directors approved an Economic Development Agreement with Grapevine Mills LTD Partnership in an amount not to exceed $14,000,000 for interior renovations ($10,000,000) and future exterior improvements ($4,000,000) at Grapevine Mills Mall.

54
11. RISK MANAGEMENT
The City of Grapevine is exposed to various risks of loss related to tort liability, theft of and damage to property and destruction of assets; public officials’ errors and omissions; bodily injury and property damage; injury to employees and natural disasters. During fiscal year 1987, the City of Grapevine established a risk management program to account for and finance its risk of loss. In fiscal year 1991, the Risk Management program was expanded to include implementation of the SIR (Self Insured Retention) plan. Under this plan, the City provided insurance protection for all known exposures, including all third party liability, law enforcement liability, public officials’ errors and omissions, and all bodily injury and property damage arising out of the City’s operations on an insured basis with various retentions up to $10,000 per occurrence. In addition, the City provides protection for all its real property on a blanket building basis, including contents with agreed values and replacement costs with $5,000 retention per occurrence. The City provides statutory workers’ compensation for all employees for bodily injury and indemnity loss of wages. The City provides liability protection for all its commercial auto vehicles (fleet) on an insured basis up to $5,000 per occurrence. The City also provides $10,000,000 excess umbrella liability over all liability exposures. The City’s loss experience has been very favorable with the experience modifier of .32 in the City’s workers’ compensation plan and similar loss ratios in the City’s property and casualty insurance fund. The City purchases commercial insurance for claims in excess of its retention provided by the fund and for all other risks of loss. Risk management subrogates against third parties that damage City property or create bodily injury to City staff. Settled claims have not exceeded this commercial coverage in any of the past twenty fiscal years, nor has the City experienced significant reductions in coverage. All funds of the City participate in the program and make payments to the general fund based on actuarial estimates of the amounts needed to pay prior and current year premiums and claims. All third party liability and property protection is provided by A rated insurance carriers as defined by Best Key Rating Guide, A.M. Best Company. All workers’ compensation protection afforded the employees of the City of Grapevine is through the Texas Municipal League Risk Retention Pool (TML Intergovernmental Risk Pool – Texas Municipal League, 211 E. 7th Street, Austin, Texas 78701). The City establishes the insurance claim liability based on estimates of the ultimate cost of claims reported but unsettled and of claims incurred but not reported. Any claims incurred and not reported are not believed to be significant to the City’s financial statements. Activity for the last two years is as follows:
2013 2012
Claims payable, beginning of year 602,218$ 745,054$ Current year claims and changes in estimates 6,070,309 5,977,450 Payments on claims 6,111,719)( 6,120,286)(
Claims payable at end of year 560,808$ 602,218$

55
12. WATER STORAGE RIGHTS
Water storage rights of $683,547 net of accumulated amortization of $553,953 , represent rights in the Federal Reservoir at Lake Grapevine purchased through a long-term contract with the federal government and are recorded at cost, with amortization being recorded using the straight-line method over the initial term of the contract of 40 years. Approximately 7 years remains on the contract.
13. IMPACT FEES
The City records impact fees received in excess of the cost of physical connection to the Water and Sewer system as revenues. Corresponding cash is recorded as a restricted asset for future expansion of the Water and Sewer system.
14. DEFERRED CHARGES
Deferred charges consist of expenses incurred in connection with the issuance of certain outstanding bonds. Such charges are amortized on a straight-line basis over the lives of the respective bonds.
15. WATER AND SEWER CONTRACTS
The City has separate contracts with the Trinity River Authority of Texas (“TRA”) for the purchase of treated water and for the transportation, treatment and disposal of wastewater, which expire in 2014 and 2023, respectively. The contracts require the City to pay varying amounts based on the costs associated with water purchased and wastewater transported and/or treated and disposed. The costs include the City’s proportionate share of TRA’s operating and maintenance expenses, related debt service costs, plus certain other miscellaneous charges. Payments during 2013 for the purchase of treated water were $6,764,620 and payments made for the transportation, treatment, and disposal of wastewater by TRA were $1,205,070. If the City were unable to fulfill its obligations under the contracts, the only liability for future payment would be its proportionate share of debt service requirements. In addition, the City does not retain an ongoing financial interest in TRA and has no representation on the TRA Board; therefore, the TRA contracts are not considered to be joint venture agreements.
16. OTHER POSTEMPLOYMENT BENEFITS
Post-retirement Health Care Benefits The City provides certain health care and life insurance benefits through a single-employer defined benefit OPEB plan, under City ordinance, for all full and part-time employees that meet eligibility requirements. Eligible individuals include retired employees who have satisfied the requirement as defined by the Texas Municipal Retirement System and their dependents that were covered prior to retirement. The requirement as defined by the Texas Municipal Retirement

56
System is any age with 20 years of service or 5 years of service for age 60 and above. City Council members that serve three terms will be classified as retired employees when they leave office. Currently, the City has 569 active employees and 148 retirees and beneficiaries eligible to participate in the plan. Retirees pay premiums for coverage in the OPEB programs. There is not a maximum employer paid premium amount (capped benefit). Active employees do not contribute to the retiree health care plan. Retirees are eligible for medical, dental, vision, and prescription insurance until they become Medicare eligible. Retirees are also eligible for a $20,000 life insurance policy. Once Medicare eligible, retirees are eligible for dental, vision, and life insurance only. At that time, the City medical plan will no longer be available. A supplement of $250 will be made available to all retirees who either (1) retire after the age of 65 or (2) are covered pre-Medicare in the retiree medical program. Spouses of retirees will receive the $250 supplement if they have been on the plan for one year prior to retirement. Retirees are eligible for benefits immediately upon retirement. If the employee returns to work for an employer that offers health coverage, the retiree cannot rejoin the City’s health plan at a later date. In the event that an active employee passes away, the spouse and dependents will become eligible for retiree coverage if (1) the employee was eligible for retirement as defined by the Texas Municipal Retirement System; and (2) the employee had dependent coverage at the time of death. Coverage will continue under the plan as long as monthly retiree premiums are paid by the specified due date, until dependents are no longer considered eligible dependents as defined by the plan, until the covered dependent becomes Medicare eligible, or until a surviving spouse remarries. When the retiree or eligible dependent becomes Medicare eligible, the City medical plan will no longer be available. Upon reaching Medicare eligibility retirees and their spouses may enroll in the Senior Insurance Plan. Annual OPEB Cost and Net OPEB Obligation
The City’s annual other postemployment benefit (OPEB) cost (expense) is calculated based on the annual required contribution of the employer (ARC), an amount actuarially determined in accordance with the parameters of GASB Statement 45. The ARC represents a level of accrual that is projected recognize the normal cost each year and to amortize any unfunded actuarial liabilities (or funding excess) over a period not to exceed 30 years. The annual OPEB cost for the fiscal year ending September 30, 2013, is as follows:

57
Annual Required Contribution (ARC) 4,103,952$ Interest on Net OPEB Obligation 451,369 Adjustment to the ARC 418,189)(
Annual OPEB Cost 4,137,132 Employer Contributions 1,129,984)(
Increase (Decrease) in Net OPEB Obligation 3,007,148 Net OPEB Obligation/(Asset), beginning of year 10,030,428
Net Pension Obligation/(Asset), ending of year 13,037,576$
Expenses for post-retirement health care benefits are recognized on a pay-as-you-go basis. In addition to the employer contribution, the retirees paid $173,283 in the form of premiums which funded current medical claims.
The City’s annual OPEB cost, the percentage of annual OPEB cost contributed to the plan, and the net OPEB obligation for fiscal year ending September 30, 2013 and the preceding two fiscal years were as follows:
Annual Net
Fiscal Year OPEB Employer Percentage OPEB
Ended Cost Contribution Contributed Obligation
9/30/2011 3,727,986$ 744,873$ 20% 6,754,120$
9/30/2012 3,849,319 573,011 15% 10,030,428
9/30/2013 4,137,132 1,129,984 27% 13,037,576
Funding Status and Funding Progress
Actuarial UAAL as aActuarial Actuarial Accrued Unfunded Percentage
Valuation Value of Liability (AAL) Funded Covered of CoveredDate Assets (AAL) (UAAL) Ratio Payroll Payroll
12/31/2012 - 41,596,928 41,596,928 - % 35,493,723 117.20%
The projection of future payments for an ongoing plan involves estimates of the value of reported amounts and assumptions about the probability of occurrence of events far into the future. Examples include assumptions about future employment, mortality, and the health care cost trend. Amounts determined regarding the funded status of the plan and the annual required contributions of the employer are subject to continual revision as actual results are compared with past expectations and new estimates are made about the future.

58
Actuarial Methods and Assumptions
The Projected Unit Credit actuarial cost method is used to calculate the ARC for the City’s retiree health care plan. Using the plan benefits, the present health premiums and set of actuarial assumptions, the anticipated future payments are projected. The projected unit credit method then provides for a systematic recognition of the cost of these anticipated payments. The yearly ARC is computed to cover the cost of benefits being earned by covered members as well as to amortize a portion of the unfunded accrued liability.
Projections of health benefits are based on the plan as understood by the City and include the types of benefits in force at the valuation date and the pattern of sharing benefit costs between the City and its employees to that point. Actuarial calculations reflect a long-term perspective and employ methods and assumptions that are designed to reduce short-term volatility in actuarial accrued liabilities and the actuarial value of assets.
Significant methods and assumptions were as follows:
Actuarial Valuation Date 12/31/2012Actuarial Cost Method Projected Unit CreditAmortization Method Level as a percentage of payrollRemaining Amortization Period 30 years; open
Asset Valuation Method Market Value
Actuarial Assumptions: Inflation rate 3% per annum Investment Rate of Return 4.5%, net of expenses Payroll Growth Rate 3% per annum General Inflation Rate 3% Health Care Trend Initial rate of 7.5% declining to an ultimate
rate of 5% after 8 years
There is no separately issued audited benefit plan report available for the City’s OPEB plan.
Actuarial valuations involve estimates of the value of reported amounts and assumptions about the probability of events in the future. Amounts determined regarding the funded status and the annual required contributions of the City’s retiree health care plan are subject to continual revisions as actual results are compared to past expectations and new estimates are made about the future. The required schedule of funding progress presented as required supplementary information provides multiyear trend information that shows whether the actuarial value of plan assets is increasing or decreasing over time relative to the actuarial accrued liability for benefits.

59
17. SUBSEQUENT EVENTS
The Grapevine 4B Development Corporation is a blended component unit of the City of Grapevine with a Board of Directors that includes both citizen and City Council members. On December 30, 2013, the 4B Economic Development Corporation purchased approximately 185 acres of undeveloped land for $29,500,000 on the north side of Grapevine. The development project is being partially financed by issuing 2014 4B Economic Development Bonds. The City is currently working with consultants and staff to develop a market analysis feasibility study and a land use plan that will provide future economic development for the City of Grapevine.

REQUIRED SUPPLEMENTARY INFORMATION

THIS PAGE LEFT BLANK INTENTIONALLY

60
Budgeted Amounts
Original Final Actual
Variance with Final Budget -
Positive (Negative)
REVENUESTaxes 39,760,000$ 39,760,000$ 41,069,649$ 1,309,649$ Licenses and permits 1,203,568 1,203,568 1,247,508 43,940 Intergovernmental 75,221 75,221 95,394 20,173 Charges for services 3,193,960 3,193,960 3,622,168 428,208 Fines and forfeitures 2,166,030 2,166,030 2,210,213 44,183 Investment income 72,500 72,500 14,106 58,394)( Miscellaneous 242,305 242,305 395,593 153,288
Total revenues 46,713,584 46,713,584 48,654,631 1,941,047
EXPENDITURESCurrent:
General government 14,511,213 14,166,193 13,506,546 659,647 Public safety 12,959,679 12,676,074 12,530,520 145,554 Culture and recreation 8,618,619 9,220,339 9,034,959 185,380 Public works 5,468,564 5,488,877 5,367,768 121,109 Capital outlay 231,951 446,219 364,675 81,544 Debt service principal - - 201,656 201,656)(
Total expenditures 41,790,026 41,997,702 41,006,124 991,578
EXCESS (DEFICIENCY) OF REVENUE OVER (UNDER) EXPENDITURES 4,923,558 4,715,882 7,648,507 2,932,625
OTHER FINANCING SOURCES (USES) Transfers in 3,005,661 3,005,661 2,801,083 204,578)( Transfers out 8,705,650)( 10,892,077)( 10,892,077)( - Sale of capital assets - - 9,209 9,209
Total other financing sources (uses) 5,699,989)( 7,886,416)( 8,081,785)( 195,369)(
NET CHANGE IN FUND BALANCES 776,431)( 3,170,534)( 433,278)( 2,737,256
FUND BALANCES, BEGINNING 12,394,958 12,394,958 12,394,958 -
FUND BALANCES, ENDING 11,618,527$ 9,224,424$ 11,961,680$ 2,737,256$
FOR THE YEAR ENDED SEPTEMBER 30, 2013
CITY OF GRAPEVINE, TEXAS
GENERAL FUND
BUDGETARY COMPARISON SCHEDULE

61
Budgeted Amounts
Original Final Actual
Variance with Final Budget -
Positive (Negative)
REVENUES Taxes 12,429,231$ 12,429,231$ 12,772,218$ 342,987$ Charges for services 5,897,547 5,897,547 6,004,378 106,831 Investment income 25,000 25,000 10,820 14,180)( Miscellaneous 218,600 218,600 131,708 86,892)(
Total revenues 18,570,378 18,570,378 18,919,124 348,746
EXPENDITURESCurrent:
Culture and recreation 16,363,420 16,174,043 15,347,906 826,137
Capital outlay 44,000 44,000 8,976 35,024
Total expenditures 16,407,420 16,218,043 15,356,882 861,161
EXCESS (DEFICIENCY) OF REVENUE OVER (UNDER) EXPENDITURES 2,162,958 2,352,335 3,562,242 1,209,907
OTHER FINANCING SOURCES (USES) Transfers in 542,420 542,420 313,860 228,560)( Transfers out 4,173,553)( 4,586,042)( 4,574,053)( 11,989
Total other financing sources (uses) 3,631,133)( 4,043,622)( 4,260,193)( 216,571)(
NET CHANGE IN FUND BALANCES 1,468,175)( 1,691,287)( 697,951)( 993,336
FUND BALANCES, BEGINNING 5,969,151 5,969,151 5,969,151 -
FUND BALANCES, ENDING 4,500,976$ 4,277,864$ 5,271,200$ 993,336$
FOR THE YEAR ENDED SEPTEMBER 30, 2013
CITY OF GRAPEVINE, TEXAS
HOTEL OCCUPANCY TAX
BUDGETARY COMPARISON SCHEDULE

62
Budgeted Amounts
Original Final Actual
Variance with Final Budget -
Positive (Negative)
REVENUESTaxes 11,665,000$ 11,665,000$ 11,958,485$ 293,485$
Intergovernmental 14 14 14 - Investment income 8,004 8,004 2,464 5,540)(
Miscellaneous - - 1,966 1,966
Total revenues 11,673,018 11,673,018 11,962,929 289,911
EXPENDITURESCurrent:
Public safety 13,177,249 13,152,658 12,978,121 174,537 Capital outlay - 292,132 284,550 7,582
Total expenditures 13,177,249 13,444,790 13,262,671 182,119
EXCESS (DEFICIENCY) OF REVENUE OVER (UNDER) EXPENDITURES 1,504,231)( 1,771,772)( 1,299,742)( 472,030
OTHER FINANCING SOURCES (USES) Transfers in 1,300,000 1,300,000 1,300,000 - Transfers out - 1,500)( 1,500)( -
Total other financing sources (uses) 1,300,000 1,298,500 1,298,500 -
NET CHANGE IN FUND BALANCES 204,231)( 473,272)( 1,242)( 472,030
FUND BALANCES, BEGINNING 415,406 415,406 415,406 -
FUND BALANCES, ENDING 211,175$ 57,866)$( 414,164$ 472,030$
FOR THE YEAR ENDED SEPTEMBER 30, 2013
CITY OF GRAPEVINE, TEXAS
CRIME DISTRICT
BUDGETARY COMPARISON SCHEDULE

63
Budgeted Amounts
Original Final Actual
Variance with Final Budget -
Positive (Negative)
REVENUESSales taxes 8,906,250$ 8,906,250$ 8,715,679$ 190,571)$( Investment income 3,000 3,000 2,086 914)(
Total revenues 8,909,250 8,909,250 8,717,765 191,485)(
EXPENDITURESCurrent:
Transportation 7,577,693 8,619,843 8,619,843 -
Total expenditures 7,577,693 8,619,843 8,619,843 -
EXCESS (DEFICIENCY) OF REVENUE OVER (UNDER) EXPENDITURES 1,331,557 289,407 97,922 191,485)(
OTHER FINANCING SOURCES (USES) Transfers in - - 244,460 244,460 Transfers out 527,379)( 299,379)( 298,819)( 560
Total other financing sources (uses) 527,379)( 299,379)( 54,359)( 245,020
NET CHANGE IN FUND BALANCE 804,178 9,972)( 43,563 53,535
FUND BALANCE, BEGINNING 368,831 368,831 368,831 -
FUND BALANCE, ENDING 1,173,009$ 358,859$ 412,394$ 53,535$
FOR THE YEAR ENDED SEPTEMBER 30, 2013
CITY OF GRAPEVINE, TEXAS
4B - TRANSIT
BUDGETARY COMPARISON SCHEDULE

THIS PAGE LEFT BLANK INTENTIONALLY

64
ActuarialActuarial Accrued Unfunded UAAL as a
Actuarial Value of Liability Funded AAL Covered Percentage of Valuation Assets (AAL) Ratio (UAAL) Payroll Covered Payroll
Date (a) (b) (a/b) (b-a) (c) (b-a)/(c)
12/31/2010 131,269,476$ 175,238,441$ 74.9% 43,968,965$ 35,278,020$ 124.6%
12/31/2011 143,043,423 186,688,189 76.6% 43,644,766 34,504,224 126.5%
12/31/2012 156,289,479 198,037,309 78.9% 41,747,830 34,807,908 119.9%
IN TEXAS MUNICIPAL RETIREMENT SYSTEM
CITY OF GRAPEVINE, TEXAS
REQUIRED SUPPLEMENTARY INFORMATIONSCHEDULE OF FUNDING PROGRESS FOR PARTICIPATION
FOR THE YEAR ENDED SEPTEMBER 30, 2013

65
ActuarialActuarial Accrued Unfunded UAAL as a
Actuarial Value of Liability Funded AAL Covered Percentage of Valuation Assets (AAL) Ratio (UAAL) Payroll Covered Payroll
Date (a) (b) (a/b) (b-a) (c) (b-a)/(c)
12/31/2008 -$ 23,744,606$ 0.0% 23,744,606$ 34,375,838$ 69.1%
12/31/2010 - 36,241,223 0.0% 36,241,223 35,278,020 102.7%
12/31/2012 - 41,596,928 0.0% 41,596,928 35,493,723 117.2%
CITY OF GRAPEVINE, TEXAS
REQUIRED SUPPLEMENTARY INFORMATIONSCHEDULE OF FUNDING PROGRESS
POST-RETIREMENT HEALTH CARE BENEFIT PLAN
FOR THE YEAR ENDED SEPTEMBER 30, 2013

THIS PAGE LEFT BLANK INTENTIONALLY

66
CITY OF GRAPEVINE, TEXAS
NOTES TO REQUIRED SUPPLEMENTARY INFORMATION
SEPTEMBER 30, 2013 1. SUMMARY OF SIGNIFICANT ACCOUNTING POLICIES
A. Budgets
The City follows these procedures in establishing budgetary data reflected in the financial statements:
(1) Prior to August 1, the City Manager submits to the City Council a proposed operating budget for the fiscal year commencing the following October 1. The operating budget includes proposed expenditures and the means of financing them.
(2) Public hearings are conducted to obtain taxpayer comments.
(3) Prior to September 15, the budget is legally enacted through passage of an ordinance.
(4) The City Manager is authorized to transfer budgeted amounts between departments within any fund; however, any revisions that alter the total expenditures of any fund must be approved by the City Council, after public hearings. Total expenditures may not exceed appropriations at the individual fund level.
(5) Budgets are legally adopted for the General Fund, Hotel Occupancy Tax Fund (a Special Revenue Fund), the Crime District Fund (a Special Revenue Fund), the 4B – Transit Fund (a Special Revenue Fund), the Debt Service Fund and Enterprise Funds. Budgetary control is maintained at the fund level.
(6) Budgets for the General, Hotel Occupancy Tax Special Revenue, Crime District Special Revenue, 4B–Transit Fund, and Debt Service Fund are adopted in accordance with generally accepted accounting principles. Budget amounts are as amended by the City Council and adjusted for transfers of budgeted amounts between departments within any fund, authorized by the City Manager.
(7) Budgetary comparison schedules are presented as required supplementary information for the General Fund and for each major special revenue fund. Capital Projects Funds have not been presented as such funds are budgeted over the life of the respective project and not on an annual basis. Accordingly, formal budgetary integration of these funds is not employed and comparison of actual results of operations to budgetary data for such funds is not presented.
(8) The budgetary comparison schedules included in the required supplementary information present a comparison of budgetary data to actual results of operations for the General Fund, Hotel Occupancy Tax Fund (Special Revenue Fund), Crime District Fund (Special Revenue Fund) and 4B–Transit Fund (Special Revenue Fund). A comparison of budgetary data to actual results of operations for the Debt Service Fund is presented as supplementary information.

THIS PAGE LEFT BLANK INTENTIONALLY

COMBINING AND INDIVIDUAL STATEMENTS AND SCHEDULES

NONMAJOR GOVERNMENTAL FUNDS
SPECIAL REVENUE FUNDS Special Revenue Funds are used to account for revenues that are restricted in nature for a special purpose limited by state law and management intentions for expenditures. Special Revenue Fund– to account for revenues that are restricted in name for a special purpose limited by state law and management intentions for expenditures. These funds include monies for state and federal forfeitures, copier service and replacement, library and parks programs and policy in-service training. Storm Drainage Fund – to account for the services in the management and acquisition of capital for storm water drainage utility projects in the City. Lake Parks Fund – to account for revenues from the campgrounds at Lake Grapevine. Revenues are restricted in accordance with Army Corp. of Engineer requirements and for debt covenant requirements for bonds issued for campground construction. 4B Economic Development Fund – to account for the accumulation and expenditure of resources used to stimulate the local economy, development, and redevelopment. Grant Fund – is used to account for federal and state funded grants.
DEBT SERVICE FUND Debt Fund – is used to account for the accumulation of resources for, and the payment of, general long-term debt principal, interest and related costs. The Tax Increment Financing (TIF) Number Two Debt Service Fund – established by ordinances authorizing the issuance of Combination Tax and Tax Increment Reinvestment Zone Certificate of Obligation Series 2000. A property tax is levied for the payment of the debt as it becomes due and is currently payable in annual installments as it becomes due.

CAPITAL PROJECTS FUNDS
Capital Projects Funds – used to account for the acquisition and construction of major capital facilities other than those financed by proprietary funds and trust funds. The Tax Increment Financing (TIF) Number One Capital Projects Fund – established for the financing, acquisition and construction of the infrastructure surrounding the Grapevine Mills Mall. The Tax Increment Financing (TIF) Number Two Capital Projects Fund – established for the financing, acquisition and construction of the infrastructure surrounding Gaylord Texas Resort and Convention Center. The Streets Fund – is used to account for the construction of improvements to various streets, drainage and sidewalk projects. Street Maintenance and Capital Replacement Fund – to account for resources provided and expended on street maintenance and capital replacements. Capital Acquisition Fund – to account for financial resources for the replacement and acquisition of capital assets. Quality of Life Fund – to account for capital projects as designated by the City Council.

67
Special StormRevenue Drainage
ASSETS Cash 2,735,815$ 2,071,280$ Receivables: Accounts, net 16,997 148,624 Taxes - - Accrued interest 366 233 Inventory - - Due from other governments - -
Total assets 2,753,178$ 2,220,137$
LIABILITIES AND FUND BALANCES Liabilities: Accounts payable 14,612$ 185,620$ Accrued and other liabilities 791 10,430 Due to other funds - - Deferred revenue - - Developer deposits - -
Total liabilities 15,403 196,050
Fund balances: Nonspendable: Inventory - - Restricted: Debt service - - Capital projects - - Public safety 674,951 - Economic development - - Culture and recreation 40,537 - Committed for: Stormwater drainage operations - 2,024,087 Public arts 696,740 - Assigned for: Capital projects 648,775 - Culture and recreation 676,772 - Unassigned - -
Total fund balances 2,737,775 2,024,087
Total liabilities and fund balances 2,753,178$ 2,220,137$
CITY OF GRAPEVINE, TEXAS
COMBINING BALANCE SHEET
NONMAJOR GOVERNMENTAL FUNDS
SEPTEMBER 30, 2013
Special Revenue

68
Debt Service
Lake 4B-EconomicParks Development Grant TIF #2 TIF #1 TIF #2
4,483$ 15,146,102$ 60,266$ 5,761,201$ 2,585,776$ 2,149,073$
1,778 - - - - - - 595,757 - 1,164,712 - - - 2,052 - 777 343 -
17,691 - - - - - 83,138 - 111,290 - - -
107,090$ 15,743,911$ 171,556$ 6,926,690$ 2,586,119$ 2,149,073$
104,071$ 1,525$ 22,057$ -$ 4,937$ -$ 4,381 - - - - -
582,141 - 125,066 - - - 237,427 - 26,916 1,164,712 - -
- - - - - -
928,020 1,525 174,039 1,164,712 4,937 -
17,691 - - - - -
- - - 5,761,978 - - - - - - 2,581,182 2,149,073 - - - - - - - 15,742,386 - - - - - - - - - -
- - - - - - - - - - - -
- - - - - - - - - - - -
838,621)( - 2,483)( - - -
820,930)( 15,742,386 2,483)( 5,761,978 2,581,182 2,149,073
107,090$ 15,743,911$ 171,556$ 6,926,690$ 2,586,119$ 2,149,073$
Special Revenue Capital Projects

69
StreetMaintenanceand Capital
Streets Replacement
ASSETS Cash 9,956,866$ 1,871,736$ Receivables: Accounts, net - - Taxes - - Accrued interest 733 251 Inventory - - Due from other governments 225,042 -
Total assets 10,182,641$ 1,871,987$
LIABILITIES AND FUND BALANCES Liabilities: Accounts payable 165,555$ 83,723$ Accrued and other liabilities - - Due to other funds - - Deferred revenue 225,042 - Developer deposits 1,691,705 -
Total liabilities 2,082,302 83,723
Fund balances: Nonspendable: Inventory - - Restricted: Debt service - - Capital projects 8,100,339 1,788,264 Public safety - - Economic development - - Culture and recreation - - Committed for: Stormwater drainage operations - - Public arts - - Assigned for: Capital projects - - Culture and recreation - - Unassigned - -
Total fund balances 8,100,339 1,788,264
Total liabilities and fund balances 10,182,641$ 1,871,987$
CITY OF GRAPEVINE, TEXAS
COMBINING BALANCE SHEET
NONMAJOR GOVERNMENTAL FUNDS(Continued)
SEPTEMBER 30, 2013
Capital Projects

70
Total OtherCapital Quality Governmental
Acquisition of Life Funds
6,673,784$ 7,428,486$ 56,444,868$
3,965 24,000 195,364 - - 1,760,469 401 998 6,154
- - 17,691 - - 419,470
6,678,150$ 7,453,484$ 58,844,016$
477,664$ 35,554$ 1,095,318$ 1,742 - 17,344 - - 707,207 - 24,000 1,678,097 - - 1,691,705
479,406 59,554 5,189,671
- - 17,691
- - 5,761,978 6,198,744 - 20,817,602
- - 674,951 - - 15,742,386 - - 40,537
- - 2,024,087 - - 696,740
- 7,393,930 8,042,705 - - 676,772 - - 841,104)(
6,198,744 7,393,930 53,654,345
6,678,150$ 7,453,484$ 58,844,016$
Capital Projects

71
Special StormRevenue Drainage
REVENUES Property taxes -$ -$ Sales taxes - - Charges for services 276,777 1,395,399 Fines and forfeitures 47,789 - Intergovernmental 22,340 - Contributions 158,929 - Investment income 4,974 2,193 Miscellaneous 3,240 -
Total revenues 514,049 1,397,592
EXPENDITURES Current: General government 207,155 - Public safety 493 - Culture and recreation 209,247 - Public works 2,650 1,627,691 Economic development - - Capital outlay 35,311 147,564 Debt service: Principal - - Interest - - Other - -
Total expenditures 454,856 1,775,255
EXCESS (DEFICIENCY) OF REVENUE OVER (UNDER) EXPENDITURES 59,193 377,663)(
OTHER FINANCING SOURCES (USES) Transfers in 3,000 - Transfers out 22,722)( 777,656)( Sale of capital assets - - Issuance of debt - - Premium on issuance of bonds - -
Total other financing sources (uses) 19,722)( 777,656)(
NET CHANGE IN FUND BALANCES 39,471 1,155,319)(
FUND BALANCES, BEGINNING 2,698,304 3,179,406
FUND BALANCES, ENDING 2,737,775$ 2,024,087$
Special Revenue
FOR THE YEAR ENDED SEPTEMBER 30, 2013
CITY OF GRAPEVINE, TEXAS
COMBINING STATEMENT OF REVENUES, EXPENDITURES
NONMAJOR GOVERNMENTAL FUNDS
AND CHANGES IN FUND BALANCES

72
Debt Service
Lake 4B-EconomicParks Development Grant TIF #2 TIF #1 TIF #2
-$ -$ -$ 3,636,534$ -$ -$ - 3,574,738 - - - -
1,987,193 - - - - - - - - - - -
16,476 - 968,653 - - - - - - - - - - 15,564 - 7,876 3,574 2,038
36,871 - - - - -
2,040,540 3,590,302 968,653 3,644,410 3,574 2,038
- - - - - - - - 100,481 - - -
1,572,682 - - - - - - - - - - - - 103,491 - 2,282,948 - - - - 71,121 - 409,454 -
- - - 1,325,000 - - - - - 1,351,187 - -
2,400 - - - - 2,400
1,575,082 103,491 171,602 4,959,135 409,454 2,400
465,458 3,486,811 797,051 1,314,725)( 405,880)( 362)(
- - - - 1,130,111 - 327,651)( 272,548)( - - - -
- - - - - - - - - - - - - - - - - -
327,651)( 272,548)( - - 1,130,111 -
137,807 3,214,263 797,051 1,314,725)( 724,231 362)(
958,737)( 12,528,123 799,534)( 7,076,703 1,856,951 2,149,435
820,930)$( 15,742,386$ 2,483)$( 5,761,978$ 2,581,182$ 2,149,073$
Capital ProjectsSpecial Revenue

73
StreetMaintenanceand Capital
Streets ReplacementREVENUES Property taxes -$ -$ Sales taxes - - Charges for services - - Fines and forfeitures - - Intergovernmental 72,480 - Contributions - - Investment income 4,716 6,303 Miscellaneous 2,327 -
Total revenues 79,523 6,303
EXPENDITURES Current: General government - - Public safety - - Culture and recreation - - Public works - - Economic development - - Capital outlay 379,399 2,710,767 Debt service: Principal - - Interest - - Other 2,842 -
Total expenditures 382,241 2,710,767
EXCESS (DEFICIENCY) OF REVENUE OVER (UNDER) EXPENDITURES 302,718)( 2,704,464)(
OTHER FINANCING SOURCES (USES) Transfers in - 2,809,000 Transfers out - - Sale of capital assets - - Issuance of debt - - Premium on issuance of bonds - -
Total other financing sources (uses) - 2,809,000
NET CHANGE IN FUND BALANCES 302,718)( 104,536
FUND BALANCES, BEGINNING 8,403,057 1,683,728
FUND BALANCES, ENDING 8,100,339$ 1,788,264$
Capital Projects
CITY OF GRAPEVINE, TEXAS
COMBINING STATEMENT OF REVENUES, EXPENDITURESAND CHANGES IN FUND BALANCE
NONMAJOR GOVERNMENTAL FUNDS
FOR THE YEAR ENDED SEPTEMBER 30, 2013(Continued)

74
Total OtherCapital Quality Governmental
Acquisition of Life Funds
-$ -$ 3,636,534$ - - 3,574,738 - - 3,659,369 - - 47,789 - - 1,079,949 - - 158,929
6,797 7,177 61,212 - - 42,438
6,797 7,177 12,260,958
- - 207,155 31,384 32,702 165,060
- 36,958 1,818,887 - 38,889 1,669,230 - - 2,386,439
4,881,353 5,482,707 14,117,676
- - 1,325,000 - - 1,351,187
67,234 - 74,876
4,979,971 5,591,256 23,115,510
4,973,174)( 5,584,079)( 10,854,552)(
2,618,650 3,000,000 9,560,761 - - 1,400,577)(
194,912 - 194,912 5,190,000 - 5,190,000
56,669 - 56,669
8,060,231 3,000,000 13,601,765
3,087,057 2,584,079)( 2,747,213
3,111,687 9,978,009 50,907,132
6,198,744$ 7,393,930$ 53,654,345$
Capital Projects

THIS PAGE LEFT BLANK INTENTIONALLY

75
Budgeted Amounts
Original Final Actual
Variance with Final Budget -
Positive (Negative)
REVENUES Taxes 8,286,472$ 8,286,472$ 11,386,845$ 3,100,373$ Investment income 75,000 75,000 24,541 50,459)(
Total revenues 8,361,472 8,361,472 11,411,386 3,049,914
EXPENDITURESDebt service:
Principal 8,288,352 7,905,512 7,905,514 2)( Interest and fiscal charges 2,437,798 2,183,242 2,183,238 4 Other 7,000 104,934 88,956 15,978
Total expenditures 10,733,150 10,193,688 10,177,708 15,980
EXCESS (DEFICIENCY) OF REVENUE OVER (UNDER) EXPENDITURES 2,371,678)( 1,832,216)( 1,233,678 3,065,894
OTHER FINANCING SOURCES (USES) Transfers in 2,549,678 2,549,678 2,549,678 - Issuance of debt - - 7,645,000 7,645,000 Premium on issuance of debt - - 272,555 272,555
Payment to bond refunding escrow agent - 8,260,523)( 7,833,892)( 426,631
Total other financing sources (uses) 2,549,678 5,710,845)( 2,633,341 8,344,186
NET CHANGE IN FUND BALANCE 178,000 7,543,061)( 3,867,019 11,410,080
FUND BALANCE, BEGINNING 12,252,396 12,252,396 12,252,396 -
FUND BALANCE, ENDING 12,430,396$ 4,709,335$ 16,119,415$ 11,410,080$
FOR THE YEAR ENDED SEPTEMBER 30, 2013
CITY OF GRAPEVINE, TEXAS
DEBT SERVICE FUND
BUDGETARY COMPARISON SCHEDULE
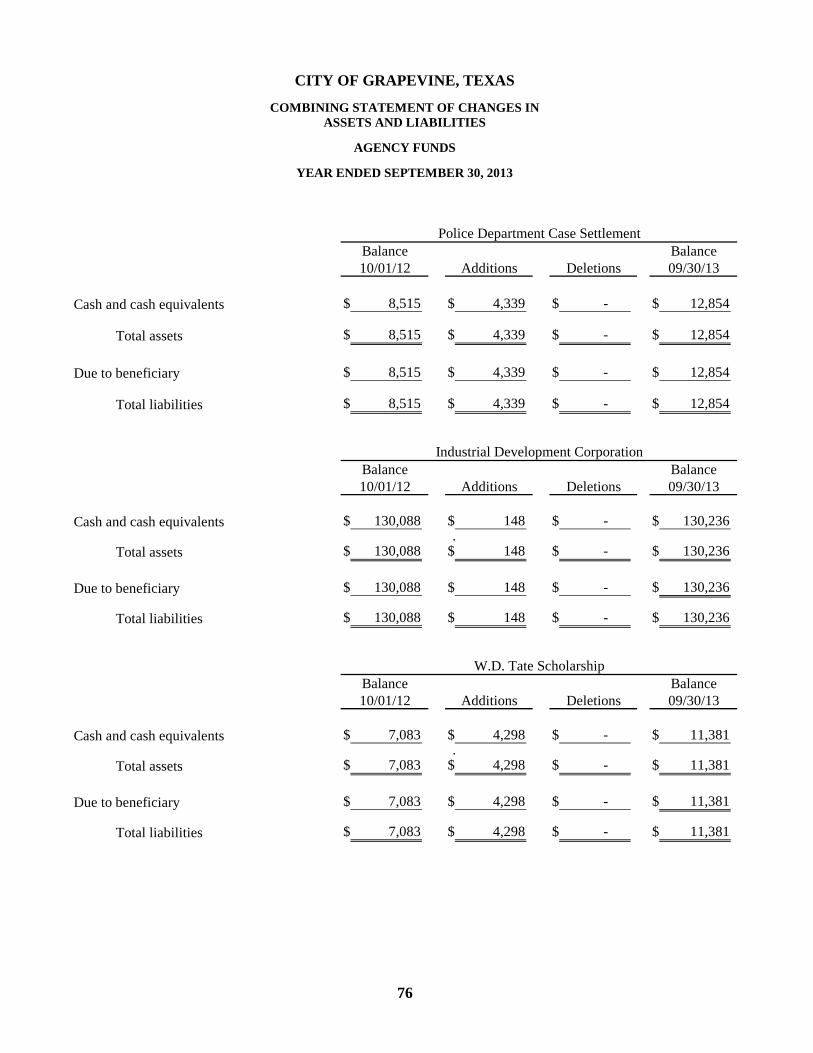
76
Balance Balance10/01/12 Additions Deletions 09/30/13
Cash and cash equivalents 8,515$ 4,339$ -$ 12,854$
Total assets 8,515$ 4,339$ -$ 12,854$
Due to beneficiary 8,515$ 4,339$ -$ 12,854$
Total liabilities 8,515$ 4,339$ -$ 12,854$
Balance Balance10/01/12 Additions Deletions 09/30/13
Cash and cash equivalents 130,088$ 148$ -$ 130,236$
. Total assets 130,088$ 148$ -$ 130,236$
Due to beneficiary 130,088$ 148$ -$ 130,236$
Total liabilities 130,088$ 148$ -$ 130,236$
Balance Balance10/01/12 Additions Deletions 09/30/13
Cash and cash equivalents 7,083$ 4,298$ -$ 11,381$
. Total assets 7,083$ 4,298$ -$ 11,381$
Due to beneficiary 7,083$ 4,298$ -$ 11,381$
Total liabilities 7,083$ 4,298$ -$ 11,381$
Police Department Case Settlement
Industrial Development Corporation
CITY OF GRAPEVINE, TEXAS
COMBINING STATEMENT OF CHANGES IN
AGENCY FUNDS
ASSETS AND LIABILITIES
W.D. Tate Scholarship
YEAR ENDED SEPTEMBER 30, 2013

77
Balance Balance10/01/12 Additions Deletions 09/30/13
Cash and cash equivalents 145,686$ 8,785$ -$ 154,471$
Total assets 145,686$ 8,785$ -$ 154,471$
Due to beneficiary 145,686$ 8,785$ -$ 154,471$
Total liabilities 145,686$ 8,785$ -$ 154,471$
(Continued)
CITY OF GRAPEVINE, TEXAS
COMBINING STATEMENT OF CHANGES INASSETS AND LIABILITIES
AGENCY FUNDS
YEAR ENDED SEPTEMBER 30, 2013
Total Agency Funds

THIS PAGE LEFT BLANK INTENTIONALLY

STATISTICAL SECTION

THIS PAGE LEFT BLANK INTENTIONALLY

STATISTICAL SECTION
This part of the City of Grapevine, Texas’ comprehensive annual financial report presents detailed information as a context for understanding what the information in the financial statements, note disclosures, and required supplementary information says about the City’s overall financial health. Contents Page
Financial Trends 78 – 89 These schedules contain trend information to help the reader
understand how the City’s financial performance and well-being have changed over time.
Revenue Capacity 90 – 95 These schedules contain information to help the reader assess the
City’s most significant local revenue sources. Sales tax became the most significant revenue source in FY 2007. Beginning in FY 2010, sales tax revenue information became available to the City and is in Tables 5 and 6. Information about principal sales tax revenue payers is confidential under Texas statutes and is not provided. Additionally, information about the City’s second most significant local revenue source, the property tax, is provided.
Debt Capacity 96 – 101 These schedules present information to help the reader assess the
affordability of the City’s current levels of outstanding debt and the City’s ability to issue additional debt in the future.
Demographic and Economic Information 102 – 103 These schedules offer demographic and economic indicators to help
the reader understand the environment within which the City’s financial activities take place.
Operating Information 104 – 106 These schedules contain service and infrastructure data to help the reader
understand how the information in the City’s financial report relates to the services the City provides and the activities it performs.
Sources: Unless otherwise noted, the information in these schedules is derived from the comprehensive annual financial reports for the relevant year.

78
2004 2005 2006 2007
Governmental activities: Net investment in capital assets 8,757$ 16,729$ 21,862$ 28,660$ Restricted 14,106 14,625 21,049 32,626 Unrestricted 9,607 12,957 16,653 18,198
Total governmental activities net position 32,470$ 44,311$ 59,564$ 79,484$
Business-type activities: Net investment in capital assets 57,643$ 60,931$ 63,936$ 65,750$ Restricted 5,312 6,421 6,784 7,228 Unrestricted 11,374 10,407 13,012 14,382
Total business-type activities net position 74,329$ 77,759$ 83,732$ 87,360$
Primary government: Net investment in capital assets 66,400$ 77,660$ 85,798$ 94,410$ Restricted 19,418 21,046 27,833 39,854 Unrestricted 20,981 23,364 29,665 32,580
Total primary government net position 106,799$ 122,070$ 143,296$ 166,844$
Source: Comprehensive Annual Financial Reports
Fiscal Year
(Unaudited) (Amounts Expressed in Thousands)
CITY OF GRAPEVINE, TEXAS
NET POSITION BY COMPONENT
LAST TEN FISCAL YEARS

79
2008 2009 2010 2011 2012 2013
39,332$ 57,264$ 73,702$ 84,069$ 88,342$ 98,171$ 34,200 40,419 55,622 61,712 71,909 78,377 29,360 25,626 13,109 10,421 14,469 12,470
102,892$ 123,309$ 142,433$ 156,202$ 174,720$ 189,018$
68,641$ 68,785$ 70,055$ 70,771$ 70,171$ 74,750$ 7,365 7,097 6,732 7,133 8,969 8,032
13,790 14,238 11,924 11,240 10,530 6,912
89,796$ 90,120$ 88,711$ 89,144$ 89,670$ 89,694$
107,973$ 126,049$ 143,757$ 154,840$ 158,513$ 172,921$ 41,565 47,516 62,354 68,845 80,878 86,409 43,150 39,864 25,033 21,661 24,999 19,382
192,688$ 213,429$ 231,144$ 245,346$ 264,390$ 278,712$
Fiscal Year
TABLE 1

80
2004 2005 2006 2007
EXPENSES Governmental activities: General government 12,382$ 14,564$ 13,964$ 19,150$ Public safety 17,598 19,094 19,174 20,732 Culture and recreation 16,090 17,055 19,978 21,914 Public works 10,363 9,077 9,502 12,777 Transportation - - - - Economic development - - - - Interest on long-term debt 7,683 5,993 6,579 6,634
Total governmental activities expenses 64,116 65,783 69,197 81,207
Business-type activities: Water and sewer 15,049 14,975 15,944 15,494 Lake Enterprise 2,842 2,673 2,664 2,668
Total business-type activities expenses 17,891 17,648 18,608 18,162
Total primary government expenses 82,007$ 83,431$ 87,805$ 99,369$
PROGRAM REVENUES Governmental activities: Fees, fines, and charges for services: General government 4,298$ 1,362$ 1,148$ 3,535$ Public safety 2,260 2,029 3,282 3,280 Culture and recreation 5,362 5,369 6,306 6,908 Public works 1,346 2,877 2,782 3,085 Operating grants and contributions 1,813 1,944 805 2,310 Capital grants and contributions 597 2,732 3,759 785
Total governmental activities program revenues 15,676 16,313 18,082 19,903
Business-type activities: Charges for services: Water and sewer 16,595 17,929 20,348 17,689 Lake Enterprise 2,500 2,630 2,890 2,712 Capital grants and contributions 1,172 1,049 1,690 833
Total business-type activities program revenues 20,267 21,608 24,928 21,234
Total primary government program revenues 35,943$ 37,921$ 43,010$ 41,137$
CHANGES IN NET POSITION
Fiscal Year
CITY OF GRAPEVINE, TEXAS
LAST TEN FISCAL YEARS(Unaudited) (Amounts Expressed in Thousands)

81
2008 2009 2010 2011 2012 2013
17,898$ 19,245$ 19,048$ 22,526$ 18,370$ 18,602$ 23,701 26,031 27,095 27,588 28,264 28,309 26,753 25,657 27,175 26,673 27,954 29,578 18,573 18,670 19,136 10,563 11,056 12,216
- - - 7,901 7,789 8,620 - - - 3,394 4,040 3,609
6,403 5,093 5,432 5,140 4,590 4,095
93,328 94,696 97,886 103,785 102,063 105,029
17,415 17,160 17,647 18,972 18,372 18,807 2,786 2,885 2,955 3,062 3,053 3,156
20,201 20,045 20,602 22,034 21,425 21,963
113,529$ 114,741$ 118,488$ 125,819$ 123,488$ 126,992$
4,071$ 3,771$ 4,039$ 4,250$ 2,547$ 2,013$ 3,597 3,759 3,660 3,346 3,736 3,971 7,479 7,829 8,530 9,198 10,099 10,012 1,372 1,344 1,467 1,378 1,418 1,486 1,629 957 1,060 1,212 1,124 526 1,891 5,204 3,819 1,302 810 108
20,039 22,864 22,575 20,686 19,734 18,116
18,893 17,950 18,523 21,168 20,481 20,185 2,862 2,649 2,377 2,862 3,079 3,120 1,331 674 274 - - -
23,086 21,273 21,174 24,030 23,560 23,305
43,125$ 44,137$ 43,749$ 44,716$ 43,294$ 41,421$
TABLE 2
Fiscal Year

82
2004 2005 2006 2007
NET (EXPENSE) REVENUES Governmental activities 48,440)$( 49,470)$( 51,115)$( 61,304)$( Business-type activities 2,376 3,960 6,320 3,072
Total primary government net expense 46,064)( 45,510)( 44,795)( 58,232)(
GENERAL REVENUES AND OTHER CHANGES IN NET POSITION Governmental activities: Taxes Property 23,600 26,066 26,046 27,066 Franchise 5,211 5,369 5,945 6,191 Hotel occupancy 4,931 7,566 9,194 10,126 Sales 17,976 18,746 19,993 31,827 Mixed beverage 686 863 952 1,128 Investment earnings 620 1,099 2,187 3,257 Miscellaneous 29 101 310 124 Gain on sale of capital assets - - - - Transfers - 1,501 1,741 1,505
Total governmental activities 53,053 61,311 66,368 81,224
Business-type activities: Investment earnings 397 648 1,035 1,437 Miscellaneous 696 323 359 624 Transfers - 1,501)( 1,741)( 1,505)(
Total business-type activities 1,093 530)( 347)( 556
Total primary government 54,146 60,781 66,021 81,780
CHANGE IN NET POSITION Governmental activities 4,613 11,841 15,253 19,920 Business-type activities 3,469 3,430 5,973 3,628
Total primary government 8,082$ 15,271$ 21,226$ 23,548$
Notes:
In April 2007, the City increased sales tax local option from 1% to 2% resulting in additional sales tax revenues of $10,614 in FY 2007.
For FY 2008, the City had $11,561 in additional sales tax revenues due to the increase in the sales tax local option from 1% to 2%. This was the first year to have 12 months (annual) with this increase.
Source: Comprehensive Annual Financial Reports
LAST TEN FISCAL YEARS
Fiscal Year
CITY OF GRAPEVINE, TEXAS
CHANGES IN NET POSITION(Continued)
(Unaudited) (Amounts Expressed in Thousands)

83
2008 2009 2010 2011 2012 2013
73,289)$( 71,832)$( 75,311)$( 83,099)$( 82,329)$( 86,913)$( 2,885 1,228 572 1,996 2,135 1,342
70,404)( 70,604)( 74,739)( 81,103)( 80,194)( 85,571)(
27,974 30,385 33,092 29,559 32,048 29,979 6,295 6,319 6,133 6,401 6,356 6,618
11,842 10,498 10,725 12,105 12,327 12,772 45,098 40,712 42,000 45,572 46,932 49,047
1,295 1,188 1,226 1,223 1,051 1,159 2,520 1,213 426 338 286 159 - 36 - - 170 6 - 31 119 33 - -
1,673 1,867 2,064 1,638 1,677 1,471
96,697 92,249 95,785 96,869 100,847 101,211
1,046 401 83 75 68 152 178 562 - 170 - -
1,673)( 1,867)( 2,064)( 1,638)( 1,677)( 1,471)(
449)( 904)( 1,981)( 1,393)( 1,609)( 1,319)(
96,248 91,345 93,804 95,476 99,238 99,892
23,408 20,417 20,474 13,770 18,518 14,298 2,436 324 1,409)( 432 526 23
25,844$ 20,741$ 19,065$ 14,202$ 19,044$ 14,321$
TABLE 2
Fiscal Year

84
2004 2005 2006 2007
General fund Reserved* 1,543$ 1,290$ 691$ 667$ Unreserved 3,018 3,981 5,904 7,562 Nonspendable* - - - - Unassigned - - - -
Total general fund 4,561$ 5,271$ 6,595$ 8,229$
All other governmental funds Reserved for: Prepayments 402$ 392$ 64$ 76$ Inventory - - - 2 Debt service 11,716 15,478 21,906 26,778 Capital projects 19,763 14,810 20,983 284 Unreserved, reported in: Special revenue 482 1,724 4,071 7,289 Capital projects 4,509 4,391 4,484 28,753 Nonspendable: Inventories - - - - Prepaid items - - - - Restricted for: Debt service - - - - Capital projects - - - - Public safety - - - - Economic development - - - - Transportation - - - - Culture and recreation - - - - Tourism - - - - Committed for: Stormwater drainage operations - - - - Public arts - - - - Assigned for: Capital projects - - - - Culture and recreation - - - - Unassigned - - - -
Total all other governmental funds 36,872$ 36,795$ 51,508$ 63,182$
Note: * Includes inventory, advances to other funds, and prepaid items.
The City implemented GASB Statement No. 54 "Fund Balance Reporting and Governmental Fund Type Definitions" in fiscal year 2011.
Source: Comprehensive Annual Financial Reports
CITY OF GRAPEVINE, TEXAS
FUND BALANCESGOVERNMENTAL FUNDS
LAST TEN FISCAL YEARS(Unaudited) (Amounts Expressed in Thousands)
Fiscal Year

85
2008 2009 2010 2011 2012 2013
727$ 632$ 714$ -$ -$ -$ 8,190 8,105 7,468 - - - - - - 657 653 659 - - - 8,938 11,742 11,303
8,917$ 8,737$ 8,182$ 9,595$ 12,395$ 11,962$
91$ 583$ 118$ -$ -$ -$ - - - - - -
29,863 31,784 40,700 - - - 6,249 20,566 16,861 - - -
10,002 9,238 11,347 - - - 24,982 18,631 20,426 - - -
- - - 15 18 18 - - - 42 14 4
- - - 26,713 28,858 29,051 - - - 19,863 17,655 90,741 - - - 836 1,078 1,088 - - - 28,985 35,493 41,198 - - - 345 369 412 - - - 264 152 41 - - - 4,605 5,954 5,268
- - - 3,005 3,179 2,024 - - - 453 600 697
- - - 9,322 10,627 8,043 - - - 841 635 677 - - - 1,822)( 1,777)( 841)(
71,187$ 80,802$ 89,452$ 93,467$ 102,855$ 178,421$
TABLE 3
Fiscal Year

86
2004 2005 2006 2007
REVENUES Taxes: Property 23,584$ 25,607$ 26,296$ 26,913$ Hotel occupancy 4,931 7,566 9,194 10,126 Sales 17,976 18,746 19,993 31,826 Mixed beverage 686 863 952 1,128 Franchise 5,211 5,369 5,945 6,191 Licenses and permits 1,264 1,530 1,550 1,776 Intergovernmental 951 1,945 1,042 931 Charges for services 11,019 9,839 11,209 12,987 Fines and forfeitures 1,961 1,713 1,860 1,607 Contributions 488 418 423 393 Interest and miscellaneous 1,853 2,156 4,895 4,354
Total revenues 69,924 75,752 83,359 98,232
EXPENDITURES General government 12,897 14,379 14,355 15,345 Public safety 16,168 17,187 17,527 19,047 Culture and recreation 14,541 15,071 17,015 19,470 Public works 5,101 4,945 4,840 4,514 Operations 3,677 2,954 2,262 6,552 Transportation - - - - Economic development - - - - Capital outlay 10,612 8,425 8,235 8,290 Debt service: Principal 9,011 8,698 8,165 9,667 Interest and fiscal charges 7,532 6,053 6,575 6,599 Other 819 2,918 1,451 2,557
Total expenditures 80,358 80,630 80,425 92,041
(Unaudited) (Amounts Expressed in Thousands)
Fiscal Year
CITY OF GRAPEVINE, TEXAS
CHANGES IN FUND BALANCESGOVERNMENTAL FUNDS
LAST TEN FISCAL YEARS

87
2008 2009 2010 2011 2012 2013
27,945$ 29,454$ 34,225$ 29,930$ 32,147$ 28,326$ 11,842 10,498 10,725 12,105 12,326 12,772 45,098 40,712 42,000 45,572 46,932 49,047
1,295 1,188 1,226 1,223 1,051 1,159 6,295 6,319 6,133 6,401 6,356 6,618 1,227 1,087 1,117 1,044 1,542 1,248
673 3,000 4,525 1,505 1,012 1,175 12,489 12,893 13,296 14,582 13,572 13,286
2,197 2,208 2,126 1,712 2,017 2,258 391 556 8 73 194 162
4,354 2,108 2,407 1,741 1,192 731
113,806 110,023 117,788 115,888 118,341 116,782
15,024 15,435 16,367 17,681 13,979 13,714 20,589 21,582 22,275 24,297 25,539 25,674 21,982 21,714 22,677 23,495 24,832 26,202
4,674 4,922 5,049 5,821 6,061 7,037 14,168 13,485 13,819 - - -
- - - 7,901 7,789 8,620 - - - 3,405 4,543 3,609
10,295 18,695 15,051 13,076 9,446 17,011
11,492 11,880 12,096 12,328 11,164 11,462 6,370 5,304 5,547 5,029 4,564 3,864 2,527 2,535 1,050 30 25 394
107,121 115,552 113,931 113,063 107,942 117,587
TABLE 4
Fiscal Year

88
2004 2005 2006 2007
EXCESS (DEFICIENCY) OF REVENUES OVER (UNDER) EXPENDITURES 10,434)$( 4,878)$( 2,934$ 6,191$
OTHER FINANCING SOURCES (USES) Bonds issued - 46,245 - 5,610 Notes payable issued - - 11,385 - Premium on issuance of debt - 2,114 6 2 Bond discount - - 29)( - Payments to escrow agent - - - - Sale of capital assets - 44,349)( - - Transfers in 2,248 7,037 4,084 7,757 Transfers out 2,248)( 5,536)( 2,343)( 6,252)(
Total other financing sources (uses) - 5,511 13,103 7,117
NET CHANGE IN FUND BALANCES 10,434)$( 633$ 16,037$ 13,308$
DEBT SERVICE AS A PERCENTAGE OF NONCAPITAL EXPENDITURES 23.7% 20.4% 20.4% 19.4%
Source: Comprehensive Annual Financial Reports
CITY OF GRAPEVINE, TEXAS
CHANGES IN FUND BALANCESGOVERNMENTAL FUNDS
(Continued)LAST TEN FISCAL YEARS
Fiscal Year
(Unaudited) (Amounts Expressed in Thousands)

89
2008 2009 2010 2011 2012 2013
6,685$ 5,529)$( 3,857$ 2,825$ 10,399$ 805)$(
260 45,825 8,565 500 - 78,640 - - - 309 - - - 2,184 344 - - 3,455 - - - - - -
76 34,944)( 6,954)( - - 7,834)( - 32 219 155 112 204
16,531 17,415 14,510 17,593 15,244 19,768 14,859)( 15,548)( 12,446)( 15,955)( 13,568)( 18,297)(
2,008 14,964 4,238 2,602 1,788 75,936
8,693$ 9,435$ 8,095$ 5,427$ 12,187$ 75,131$
18.4% 20.4% 17.8% 16.8% 15.7% 14.7%
TABLE 4
Fiscal Year

90
TABLE 5
Function/Program 2004 2005 2006 2007 (1) 2008 2009 2010 2011 2012 2013 (2)
Agriculture/forestry/fishing/hunting -$ 132$ -$ -$ 113$ 107$ -$ -$ -$ -$ Construction 22,679 28,216 36,231 36,212 33,550 27,636 19,347 23,201 32,162 26,960 Manufacturing 48,659 67,497 67,275 76,917 149,328 173,395 158,571 149,298 157,499 116,719 Wholesale trade 52,048 50,674 77,063 103,370 212,637 200,208 216,540 236,470 248,355 204,507 Retail trade 701,754 593,199 794,410 873,696 887,650 774,650 774,638 804,182 846,060 671,782 Transportation/warehousing 11,580 6,535 11,049 7,823 9,726 7,794 10,239 13,817 11,893 10,107 Information 50,387 29,796 33,492 22,968 22,836 28,136 29,311 36,209 42,137 35,790 Finance/insurance 4,748 8,812 5,532 4,711 4,641 1,379 964 1,049 993 628 Professional/scientific/technical 31,544 18,828 32,869 47,792 85,256 23,165 15,745 15,485 18,966 14,298 Real estate/rental/leasing 29,976 36,714 37,942 35,622 34,950 25,870 34,389 37,831 36,597 34,744 Management of companies/enterprises - 1,686 - 1,324 1,644 938 15 1 - - Admin/support/waste management/ remediation services 35,233 38,494 37,372 34,942 35,281 35,470 37,065 54,218 47,264 36,089 Educational services 131 141 144 153 186 104 344 531 2,762 1,565 Health care/socal assistance 759 756 1,240 2,243 3,594 1,903 1,930 2,465 2,999 2,340 Arts/entertainment/recreation 26,450 25,765 27,049 31,372 28,676 23,115 25,623 25,657 26,034 19,351 Accomodation/food service 307,477 341,330 372,951 402,040 421,867 402,661 413,133 453,507 477,362 354,092 Other services (except public administration) 12,256 14,495 15,587 15,815 20,877 21,970 24,736 24,868 24,250 24,492 Other 1,946 37 - - - - - - - - Unclassified 2,790 4,539 4,491 6,111 6,997 9,849 - 17,457 - -
Total 1,340,417 1,267,646 1,554,697 1,703,111 1,959,809 1,758,350 1,762,590 1,896,246 1,975,333 1,553,464
City direct sales tax rate 1.0% 1.0% 1.0% 1.0% 2.0% 2.0% 2.0% 2.0% 2.0% 2.0%
Source: Texas Comptroller
(1) Sales tax rate changed from 1% to 2% on 4/1/2007
(2) Only information for three quarters is available for FY 2013
Fiscal Year
CITY OF GRAPEVINE, TEXAS
TAXABLE SALES BY CATEGORY
LAST TEN FISCAL YEARS(Amounts Expressed in Thousands)

91
TABLE 6
City StateFiscal Year Direct Rate of Texas
2004 1.00% 6.25%
2005 1.00% 6.25%
2006 1.00% 6.25%
10/01/06 - 03/31/07 1.00% 6.25%
04/01/07-9/30/07 2.00% 6.25%
2008 2.00% 6.25%
2009 2.00% 6.25%
2010 2.00% 6.25%
2011 2.00% 6.25%
2012 2.00% 6.25%
2013 2.00% 6.25%
Source: City Budget Office and Texas Comptroller
CITY OF GRAPEVINE, TEXAS
DIRECT AND OVERLAPPING SALES TAX RATES
LAST TEN FISCAL YEARS

92
TABLE 7
Less: Total Taxable TotalFiscal Real Property Personal Tax-Exempt Assessed DirectYear Property Property Property Value Tax Rate
2004 6,204,000$ 2,248,000$ 3,572,000$ 4,880,000$ 0.3660$
2005 6,461,000 2,391,000 3,625,000 5,227,000 0.3635
2006 6,647,000 2,224,000 3,514,000 5,357,000 0.3625
2007 7,026,000 2,068,000 3,684,740 5,409,260 0.3625
2008 7,316,619 2,294,141 3,753,870 5,856,890 0.3625
2009 7,011,568 2,257,318 3,314,798 5,954,088 0.3500
2010 7,339,403 2,446,105 3,588,781 6,196,727 0.3500
2011 7,320,478 2,309,223 3,765,059 5,864,642 0.3500
2012 7,111,827 2,005,549 3,205,119 5,912,257 0.3480
2013 7,373,725 2,169,614 3,311,568 6,231,771 0.3457
Source: Tarrant County Appraisal District, Dallas and Denton County Appraisal Districts
Estimated Market Value
CITY OF GRAPEVINE, TEXAS
ASSESSED VALUE AND ESTIMATED ACTUAL VALUE OF TAXABLE PROPERTY
LAST TEN FISCAL YEARS(Unaudited) (Amounts Expressed in Thousands)

93
TABLE 8
General TotalOperating/ Obligation Total Direct and
Fiscal General Debt Direct Junior School Hospital OverlappingYear Rate Service Rate College District District County Rates
2004 0.1237$ 0.2423$ 0.3660$ 0.139$ 1.700$ 0.234$ 0.272$ 2.712$
2005 0.1416 0.2219 0.3635 0.139 1.700 0.235 0.273 2.711
2006 0.1285 0.2340 0.3625 0.139 1.700 0.235 0.273 2.709
2007 0.1150 0.2475 0.3625 0.131 1.324 0.234 0.242 2.293
2008 0.1275 0.2350 0.3625 0.139 1.290 0.230 0.267 2.289
2009 0.1189 0.2311 0.3500 0.138 1.290 0.228 0.264 2.270
2010 0.1364 0.2136 0.3500 0.138 1.290 0.228 0.264 2.270
2011 0.1346 0.2154 0.3500 0.138 1.290 0.228 0.264 2.270
2012 0.1423 0.2057 0.3480 0.149 1.310 0.228 0.264 2.299
2013 0.1357 0.2100 0.3457 0.149 1.320 0.228 0.264 2.307
Source: Tarrant County Appraisal District
Note: Tax rate limitations imposed by the Home Rules Section of the Texas Constitution, Article II, Section 5, provide that a maximum tax rate of $2.50 per $100valuation may be imposed in any one year. No provisions are made limiting the amount of this $2.50 tax rate that can be used for debt service.
(Unaudited)
CITY OF GRAPEVINE, TEXAS
PROPERTY TAX RATES - DIRECT AND OVERLAPPING GOVERNMENTS
LAST TEN FISCAL YEARS
City Direct Rates Overlapping Rates
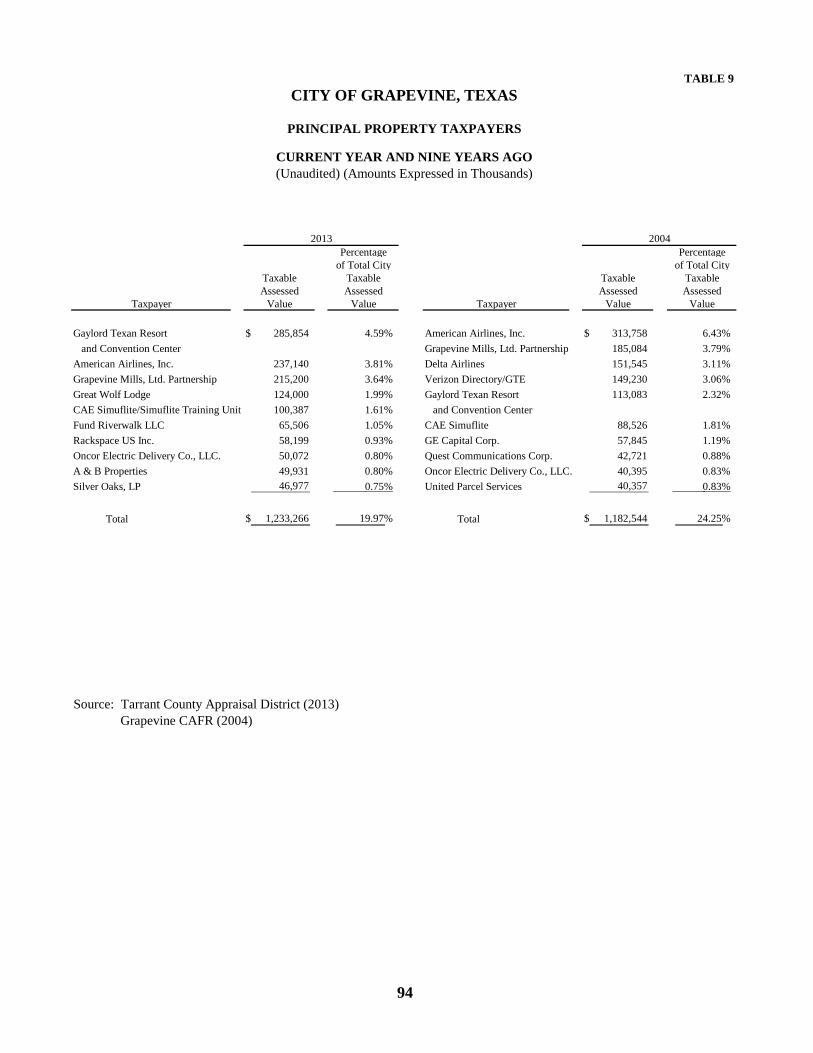
94
TABLE 9
Percentage Percentageof Total City of Total City
Taxable Taxable Taxable TaxableAssessed Assessed Assessed Assessed
Taxpayer Value Value Taxpayer Value Value
Gaylord Texan Resort 285,854$ 4.59% American Airlines, Inc. 313,758$ 6.43%
and Convention Center Grapevine Mills, Ltd. Partnership 185,084 3.79%
American Airlines, Inc. 237,140 3.81% Delta Airlines 151,545 3.11%
Grapevine Mills, Ltd. Partnership 215,200 3.64% Verizon Directory/GTE 149,230 3.06%
Great Wolf Lodge 124,000 1.99% Gaylord Texan Resort 113,083 2.32%
CAE Simuflite/Simuflite Training Unit 100,387 1.61% and Convention Center
Fund Riverwalk LLC 65,506 1.05% CAE Simuflite 88,526 1.81%
Rackspace US Inc. 58,199 0.93% GE Capital Corp. 57,845 1.19%
Oncor Electric Delivery Co., LLC. 50,072 0.80% Quest Communications Corp. 42,721 0.88%
A & B Properties 49,931 0.80% Oncor Electric Delivery Co., LLC. 40,395 0.83%
Silver Oaks, LP 46,977 0.75% United Parcel Services 40,357 0.83%
Total 1,233,266$ 19.97% Total 1,182,544$ 24.25%
Source: Tarrant County Appraisal District (2013) Grapevine CAFR (2004)
2013 2004
CITY OF GRAPEVINE, TEXAS
PRINCIPAL PROPERTY TAXPAYERS
CURRENT YEAR AND NINE YEARS AGO(Unaudited) (Amounts Expressed in Thousands)

95
TABLE 10
Fiscal Taxes Levied Percentage CollectionsYear for the of Levy in Subsequent Percentage PercentageEnded Fiscal Year Amount Collected Years Amount of Levy Amount of Levy
2004 18,044$ 17,859$ 98.97% 132$ 1,020$ 5.7% 17,991$ 99.7%
2005 19,223 18,764 97.61% 177 808 4.2% 18,941 98.5%
2006 19,182 18,945 98.76% 110 829 4.3% 19,055 99.3%
2007 19,572 19,368 98.96% 201 876 4.5% 19,569 99.9%
2008 21,113 20,964 99.29% 154 891 4.2% 21,118 99.9%
2009 22,250 21,936 98.59% 115 925 4.2% 22,051 99.1%
2010 22,208 21,958 98.87% 141 973 4.4% 22,099 99.5%
2011 21,114 20,954 99.24% 124 160 0.8% 21,078 99.8%
2012 21,321 21,211 99.48% 84 110 0.5% 21,295 99.9%
2013 21,468 21,364 99.52% - 184 0.9% 21,364 99.5%
Source: Grapevine/Colleyville ISD Tax Assessor
CITY OF GRAPEVINE, TEXAS
PROPERTY TAX LEVIES AND COLLECTIONS
LAST TEN FISCAL YEARS(Unaudited) (Amounts Expressed in Thousands)
Fiscal Year of the LevyCollected Within the
Total Collections to DateDelinquent Taxes

96
TABLE 11
General Certificates Water General Total Primary PercentageFiscal Obligation of Notes and Sewer Obligation Certificates Other Government of PersonalYear Bonds Obligation Payable Obligations Bonds of Obligation Obligations Debt Income Per Capita*
2004 72,140$ 69,735$ 1,138$ 26,300$ -$ 4,935$ 542$ 174,790$ 10.33% 3,719$
2005 71,775 67,055 863 24,448 - 4,715 415 169,271 9.53% 3,526
2006 71,755 70,600 521 22,545 - 4,485 282 170,188 9.39% 3,473
2007 66,275 68,905 3,611 13,300 6,820 4,240 144 163,295 9.26% 3,333
2008 60,690 63,675 3,195 11,570 6,685 3,980 - 149,795 8.32% 2,996
2009 54,315 65,960 6,945 6,780 12,540 - - 146,540 8.14% 2,431
2010 51,290 59,870 5,835 1,585 15,305 - - 130,690 6.88% 2,614
2011 46,291 55,473 4,852 1,035 14,042 - - 120,795 7.14% 2,570
2012 41,221 50,794 3,605 790 9,923 - - 106,333 6.21% 2,219
2013 106,019 45,861 6,296 - 10,962 - - 169,138 9.08% 3,452
* See Table 19 for personal income and population data.
CITY OF GRAPEVINE, TEXAS
RATIOS OF OUTSTANDING DEBT BY TYPE
LAST TEN FISCAL YEARS
Governmental Activities Business-type Activities
(Unaudited) (Amounts Expressed in Thousands, excluding Percentage of Personal Income and Per Capita)

97
TABLE 12
Business-typeActivities
(a) Percentage ofGeneral Certificates General Gross Actual
Fiscal Obligation of Obligation Bonded Taxable Value Per
Year Bonds Obligation Total Bonds Debt of Property a Capita b
2004 72,140$ 69,735$ 141,875$ -$ 141,875$ 2.71% 3,019$
2005 71,775 67,055 138,830 - 138,830 2.84% 2,892
2006 71,755 70,600 142,355 - 142,355 2.72% 2,905
2007 66,275 68,905 135,180 6,820 142,000 2.49% 2,898
2008 60,690 63,675 124,365 6,685 131,050 2.12% 2,621
2009 54,315 65,960 120,275 12,540 132,815 2.02% 2,656
2010 51,290 59,870 111,160 15,305 126,465 1.79% 2,529
2011 45,335 55,473 100,808 15,135 115,943 1.72% 2,467
2012 40,355 50,794 91,149 9,895 101,044 1.71% 2,109
2013 106,019 45,861 151,880 10,962 162,842 2.61% 3,323
Note: Details regarding the City's outstanding debt can be found in notes to the financial statements.
a See Table 5 for property value data.b See Table 19 for population data.
Percentage of Actual Taxable Value of Property and Per Capita)
CITY OF GRAPEVINE, TEXAS
RATIOS OF NET GENERAL BONDED DEBT OUTSTANDING
LAST TEN FISCAL YEARS
Governmental Activities
(Unaudited) (Amounts Expressed in Thousands except

98
TABLE 13
EstimatedShare of
Estimated Direct andDebt Percentage Overlapping
Outstanding Applicable Debt
Debt Repaid with Property Taxes: Carroll Independent School District 235,203,792$ 6.07% 14,276,870$ Coppell Independent School District 174,797,888 2.09% 3,653,276 Dallas County 136,430,000 0.11% 150,073 Dallas County Community College District 355,880,000 0.11% 391,468 Dallas County Hospital District 705,000,000 0.11% 775,500 Dallas County Schools 67,675,000 0.11% 74,443 Denton County 596,245,000 - % * - Grapevine-Colleyville Independent School District 345,235,467 61.81% 213,390,042 Northwest Independent School District 626,683,840 0.10% 626,684 Tarrant County 336,635,000 6.08% 20,467,408 Tarrant County College District 15,485,000 6.08% 941,488 Tarrant County Hospital District 25,375,001 6.08% 1,542,800
Subtotal overlapping debt 256,290,052
Total direct - City of Grapevine 159,122,254 100.00% 159,122,254
Direct and Overlapping Debt 415,412,306$
* Less than .01% The percentage of overlapping debt applicable is estimated using taxable assessed property values.
Source: Municipal Advisory Council of Texas
Government Unit
CITY OF GRAPEVINE, TEXAS
DIRECT AND OVERLAPPING GOVERNMENTAL ACTIVITIES DEBT
AS OF SEPTEMBER 30, 2013(Unaudited) (Amounts Expressed in Whole Numbers)

99
TABLE 14
CITY OF GRAPEVINE, TEXAS
LEGAL DEBT MARGIN INFORMATION
LAST TEN FISCAL YEARS
Tax rate limitations imposed by the Home Rules Section of the Texas Constitution, Article II, Section5, provide that a maximum tax rate of $2.50 per $100 valuation may be imposed in any one year.
(Unaudited)

100
TABLE 15
Less: Net PrincipalFiscal Total Operating Available and InterestYear Revenues a Expenses b Revenue Payments Coverage
2004 4,766$ 200$ 4,566$ 2,478$ 1.84$
2005 4,788 1 4,787 2,470 1.94
2006 4,960 1 4,959 2,470 2.01
2007 5,350 5 5,345 2,482 2.15
2008 5,076 1 5,075 2,498 2.03
2009 5,274 3,087 2,187 2,240 0.98
2010 7,991 1 7,990 2,313 3.45
2011 5,955 1,671 4,284 2,328 1.84
2012 6,696 2,440 4,256 2,344 1.82
2013 4,808 2,352 2,456 2,360 1.04
Notes: a Includes tax revenues onlyb Includes transfers out.
Source: Grapevine Tax Increment Financing District Reinvestment Zone Number One Basic Financial Statements
CITY OF GRAPEVINE, TEXAS
PLEDGED REVENUE COVERAGE
LAST TEN FISCAL YEARS(Unaudited) (Amounts Expressed in Thousands, except for Coverage)
Tax Increment Financing District Reinvestment Zone Number One

101
TABLE 16
Less: Net PrincipalFiscal Total Operating Available and InterestYear Revenues a Expenses b Revenue Payments Coverage
2004 1,953$ -$ 1,953$ 1,883$ 1.04$
2005 3,401 1,560 1,841 1,719 1.07
2006 4,056 - 4,056 1,686 2.41
2007 3,574 1,539 2,035 1,686 1.21
2008 3,392 1,536 1,856 2,691 0.69
2009 3,638 1,591 2,047 2,686 0.76
2010 5,749 726 5,023 2,677 1.88
2011 4,291 731 3,560 2,664 1.34
2012 5,736 1,548 4,188 2,672 1.57
2013 3,637 2,283 1,354 2,679 0.51
Notes: a Includes tax revenues onlyb Includes transfers out.
Source: Grapevine Tax Increment Financing District Reinvestment Zone Number Two Basic Financial Statements
CITY OF GRAPEVINE, TEXAS
PLEDGED REVENUE COVERAGE
LAST TEN FISCAL YEARS(Unaudited) (Amounts Expressed in Thousands, except for Coverage)
Tax Increment Financing District Reinvestment Zone Number Two

102
TABLE 17
(1)(1) Personal (1) (2) (3)
Calendar Estimated Personal Income Median School UnemploymentYear Population Income Per Capita Age Enrollment Rate
2004 47 1,692$ 36$ 34 14 2.8% 2005 48 1,776 37 34 14 3.5% 2006 49 1,813 37 34 13 3.5% 2007 49 1,764 36 34 14 3.5% 2008 50 1,800 36 36 14 4.2% 2009 50 1,800 36 36 14 6.6% 2010 50 1,900 38 36 14 6.0% 2011 47 1,692 36 35 14 6.3% 2012 48 1,711 36 35 14 5.6% 2013 49 1,862 38 38 14 5.1%
Sources: (1) CLARITAS Report(2) Grapevine/Colleyville ISD(3) Texas Workforce Commission Website
CITY OF GRAPEVINE, TEXAS
DEMOGRAPHIC AND ECONOMIC STATISTICS
LAST TEN FISCAL YEARS(Unaudited) (Amounts Expressed in Thousands except for
Median Age and Unemployment Rate)

103
TABLE 18
Percentage of Percentage ofof Total City of Total City
Employer Employees Employment (1) Employer Employees Employment
DFW International Airport 60.0 57.14% DFW International Airport 16.0 33.00%
Gaylord Texan Resort and Convention Center
2.0 1.90% Grapevine/Colleyville ISD 2.0 4.00%
United Parcel Service 2.0 1.90% United Parcel Service 2.0 4.00%
GameStop 2.0 1.90% GTE Directory Corporation 1.0 2.00%
Grapevine/Colleyville ISD 1.8 1.71% Baylor Medical Center 1.0 2.00%
Baylor Medical Center 1.0 0.95% Gamestop 1.0 2.00%
Great Wolf Lodge 0.6 0.57% City of Grapevine 0.5 0.50%
City of Grapevine 0.6 0.57% DFW Hilton Hotel 0.5 0.50%
Pavestone Mfg 0.4 0.38% SimuFlite Training Int'l. 0.5 0.50%
Wal-Mart/Sam's (250-500) 0.3 0.29% Apollo Paper 0.5 0.50%
70.7 67.31% 25.0 49.00%
Sources: City of Grapevine, Neilsen/Claritas Business Facts, Info. USA
(1) Per Neilsen/Claritas there are 104,761 total employees in the City (including 60,000 at DFW Airport) as of 2013.
CITY OF GRAPEVINE, TEXAS
PRINCIPAL EMPLOYERS
CURRENT YEAR AND NINE YEARS AGO
2013
(Unaudited) (Amounts Expressed in Thousands except for
2004
Percentage of Total City Employment)

104
TABLE 19
Function/Program 2004 2005 2006 2007 2008 2009 2010 2011 2012 2013
General government and administration 78 80 78 78 59 60 59 59 57 58
Public safety 228 231 231 230 238 237 236 237 237 240
Development services 23 21 17 15 15 15 15 15 15 15
Culture and recreational 150 153 162 159 163 174 175 169 169 172
Water and sewer 50 48 50 51 51 51 60 59 59 59
Golf course 32 31 31 31 29 29 28 26 26 26
Public works 59 59 58 54 75 67 67 65 65 66
Total 620 623 627 618 630 633 640 630 628 636
Source: Annual Budget Report - City of Grapevine
CITY OF GRAPEVINE, TEXAS
FULLTIME EQUIVALENT CITY GOVERNMENT EMPLOYEES
LAST TEN FISCAL YEARS(Unaudited) (Amounts Expressed in Whole Numbers)
Fiscal Year
BY FUNCTION/PROGRAM

105
TABLE 20
2004 2005 2006 2007 2008 2009 2010 2011 2012 2013
Public safety Police Calls for service 32,555 28,976 36,360 45,815 49,618 52,111 65,361 66,686 67,634 58,680 Traffic citations 24,379 13,603 13,406 17,367 27,363 26,068 25,533 18,995 23,817 21,447 Criminal offenses 3,615 2,714 1,157 3,764 3,905 3,796 3,552 3,346 1,366 3,219
Fire Fire runs 3,746 3,856 4,171 3,601 4,682 4,844 4,595 5,079 5,135 5,156 Ambulance runs 3,737 3,168 4,151 3,056 3,132 3,980 3,015 3,343 3,026 3,541
Development services Area in square miles 36 36 36 36 36 36 36 36 36 36
Cultural and recreational Picnic areas 35 35 35 35 35 49 49 49 49 49 Library Volumes 148,125 160,109 173,184 182,241 183,529 191,437 197,509 205,194 186,817 197,377 Annual circulation 617,938 579,497 568,431 531,229 320,267 347,215 341,726 330,975 316,236 303,622
Water and sewer Number of water connections 13,676 13,860 13,965 14,117 14,117 14,120 14,343 14,384 14,460 14,517 Average daily consumption MG (water) 9.04 9.62 11.37 8.61 10.75 10.37 10.23 11.98 10.74 10.40 System capacity - MG (Water) 23 24 24 24 26 26 27 27 27 27 Number of sewer connections 12,461 12,686 12,866 12,860 12,946 13,107 13,130 13,081 13,103 13,315 Number of refuse connections 11,484 11,673 12,180 11,279 11,279 11,955 11,865 11,895 11,911 11,964 Sewer system capacity (MGD) 6 6 6 8 8 8 8 8 8 8
Lake Enterprise Number of golfers, annually 74,183 77,282 74,000 66,874 70,200 62,882 56,053 65,052 67,555 71,706
Source: City departments
CITY OF GRAPEVINE, TEXAS
OPERATING INDICATORS BY FUNCTION/PROGRAM
(Unaudited) (Amounts Expressed in Whole Numbers)
Function/Program
Fiscal Year
LAST TEN FISCAL YEARS

106
TABLE 21
Function/Program 2004 2005 2006 2007 2008 2009 2010 2011 2012 2013
Public safety Police stations 2 2 2 2 2 2 2 2 2 2 Patrol units 31 26 26 26 36 30 30 32 32 35 Fire stations 5 5 5 5 5 5 5 5 5 5
Public works Streets - paved (miles) 180 180 180 180 180 180 208 208 208 208
Parks and recreation Acreage* 1,873 1,692 1,772 1,522 1,522 1,522 1,522 1,522 1,522 1,522 Playgrounds 35 35 34 34 35 35 35 35 35 35 Swimming pools 2 2 2 2 2 2 2 2 2 2 Recreation centers 1 1 1 1 1 1 1 1 1 1 Senior Center 1 1 1 1 1 1 1 1 1 1 Central Library 1 1 1 1 1 1 1 1 1 1 Number of golf courses 1 1 1 1 1 1 1 1 1 1
Water Water mains (miles) N/A N/A 247 280 280 280 280 280 280 290
Wastewater Sanitary sewers (miles) N/A N/A 210 230 230 227 227 227 227 224
Note: N/A - data not available.
Source: City departments
*Golf course included and land leased from Corp. of Engineers
CITY OF GRAPEVINE, TEXAS
CAPITAL ASSET STATISTICS BY FUNCTION/PROGRAM
LAST TEN FISCAL YEARS
Fiscal Year
(Unaudited) (Amounts Expressed in Whole Numbers)

INTERNAL CONTROL AND COMPLIANCE SECTION

THIS PAGE LEFT BLANK INTENTIONALLY

401 WEST HIGHWAY 6 P. O. BOX 20725 WACO, TX 76702-0725 (254) 772-4901 FAX: (254) 772-4920 www.pbhcpa.com AFFILIATE OFFICES: BROWNSVILLE, TX (956) 544-7778 HILLSBORO, TX (254) 582-2583
TEMPLE, TX (254) 791-3460 ALBUQUERQUE, NM (505) 266-5904
INDEPENDENT AUDITORS’ REPORT ON INTERNAL CONTROL OVER FINANCIAL REPORTING AND ON COMPLIANCE AND OTHER MATTERS BASED ON AN
AUDIT OF FINANCIAL STATEMENTS PERFORMED IN ACCORDANCE WITH GOVERNMENT AUDITING STANDARDS
To the Honorable Mayor and Members of the City Council City of Grapevine, Texas
We have audited, in accordance with the auditing standards generally accepted in the United States of America and the standards applicable to financial audits contained in Government Auditing Standards issued by the Comptroller General of the United States, the financial statements of the governmental activities, the business-type activities, the discretely presented component unit, each major fund, and the aggregate remaining fund information of the City of Grapevine, Texas (the “City”) as of and for the year ended September 30, 2013, and the related notes to the financial statements, which collectively comprise the City’s basic financial statements, and have issued our report thereon dated March 18, 2014. Internal Control Over Financial Reporting
In planning and performing our audit of the financial statements, we considered the City’s internal control over financial reporting (internal control) to determine the audit procedures that are appropriate in the circumstances for the purpose of expressing our opinions on the financial statements, but not for the purpose of expressing an opinion on the effectiveness of the City’s internal control. Accordingly, we do not express an opinion on the effectiveness of the City’s internal control.
A deficiency in internal control exists when the design or operation of a control does not allow management or employees, in the normal course of performing their assigned functions, to prevent, or detect and correct, misstatements on a timely basis. A material weakness is a deficiency, or a combination of deficiencies, in internal control, such that there is a reasonable possibility that a material misstatement of the entity’s financial statements will not be prevented, or detected and corrected on a timely basis. A significant deficiency is a deficiency, or a combination of deficiencies, in internal control that is less severe than a material weakness, yet important enough to merit attention by those charged with governance.
107

108
Our consideration of internal control was for the limited purpose described in the first paragraph of this section and was not designed to identify all deficiencies in internal control that might be material weaknesses or, significant deficiencies. Given these limitations, during our audit we did not identify any deficiencies in internal control that we consider to be material weaknesses. However, material weaknesses may exist that have not been identified. Compliance and Other Matters
As part of obtaining reasonable assurance about whether the City’s financial statements are free from material misstatement, we performed tests of its compliance with certain provisions of laws, regulations, contracts, and grant agreements, noncompliance with which could have a direct and material effect on the determination of financial statement amounts. However, providing an opinion on compliance with those provisions was not an objective of our audit, and accordingly, we do not express such an opinion. The results of our tests disclosed no instances of noncompliance or other matters that are required to be reported under Government Auditing Standards. Purpose of this Report
The purpose of this report is solely to describe the scope of our testing of internal control and compliance and the results of that testing, and not to provide an opinion on the effectiveness of the entity’s internal control or on compliance. This report is an integral part of an audit performed in accordance with Government Auditing Standards in considering the entity’s internal control and compliance. Accordingly, this communication is not suitable for any other purpose.
Waco, Texas March 18, 2014