Embed Size (px)
Citation preview

STATE OF MICHIGAN CONTRACT NO. 271N3200089
CITY OF FLINT WATER SUPPLY ASSESSMENT February 2013
For Submittal to:
State of Michigan, Department of Treasury
Submitted by:
C O N S U L T I N G E N G I N E E R S - P L A N N E R S 66
1
56
G ris w o l d S u i t e 6 0 0
D e t r o i t , M i c h i g a n 4 8 2 2 6 ( 3 1 3 ) 9 6 3 - 0 6 1 2 F A X ( 3 1 3 ) 9 6 3 - 2 1 5 6
J A C K S O N , T U L L I N C .
T U C K E R , Y O U N G ,

i
Table of Contents Table of Contents ........................................................................................................................................... i
Figures ........................................................................................................................................................... ii
Tables ............................................................................................................................................................ ii
Appendices .................................................................................................................................................... ii
1. Introduction .......................................................................................................................................... 1
Report Organization ...................................................................................................................................... 1
2. Flint Water Supply Options ................................................................................................................... 2
Karegnondi Water Authority (KWA) Lake Huron Water Supply ................................................................... 2
DWSD Water System .................................................................................................................................... 3
3. Data Collection ...................................................................................................................................... 6
4. Cost of Service ....................................................................................................................................... 8
DWSD Water Supply ..................................................................................................................................... 8
KWA Water Supply ...................................................................................................................................... 10
Flint WTP ..................................................................................................................................................... 11
5. Capital Requirements .......................................................................................................................... 12
KWA Supply System .................................................................................................................................... 12
Lake Intake .............................................................................................................................................. 12
Pumping Stations .................................................................................................................................... 13
Transmission Main .................................................................................................................................. 13
Other KWA Costs ..................................................................................................................................... 14
Summary ................................................................................................................................................. 14
Flint WTP Improvements ............................................................................................................................ 15
DWSD Imlay Station Supply Options ........................................................................................................... 15
Financing ..................................................................................................................................................... 15
6. Findings ............................................................................................................................................... 17
7. Other Considerations .......................................................................................................................... 19
Redundancy/Reliability ............................................................................................................................... 19
Additional Cost Considerations ................................................................................................................... 20
Flint’s Autonomy ......................................................................................................................................... 20

ii
Figures Figure 2-1: KWA Raw Water System …………………………………………………………………………………………………….. 5
Figure 2-2: DWSD Water System ………………………………………………………………………………………………………….. 4
Figure 6-1: Flint Water Supply Options through 2042 ………………………………………………………………….……... 18
Tables Table 2-1: DWSD Supply Options ….………………………………………………………………………………………………….….. 5
Table 4-1: Cost of DWSD Supply Options ………………………………………………………………………………………….….. 8
Table 4-2: Recent DWSD Water Rates ……..……………………………………………………………………………………….….. 9
Table 4-3: O&M Inflation Rates of Other Large Water Systems ……………………………………………………….….. 10
Table 4-4: O&M Inflation Rates of Other Comparable Systems to KWA ……………………………………….….….. 11
Table 4-5: FY 13 O&M Costs for Year-round Operations ……………………………………………………………….…….. 11
Table 5-1: KWA Intake Cost Estimate …………………………………………..………………………………………………….….. 12
Table 5-2: Pumping Stations Cost Estimate ………………………………….………………………………………………….….. 13
Table 5-3: Transmission Pipeline Cost Estimate ………………………………………..…………………………………….….. 14
Table 5-4: Other Costs ………………………………………………………………..………………………………………………….….. 14
Table 5-5: Total Cost Comparison ……………………………………………….………………………………………………….….. 15
Table 6-1: Total Cost of Options through 2042 ……………………………………………………………………………….….. 17
Appendices Appendices A – Meeting Minutes
Appendix B – Cost Worksheets
1
1. INTRODUCTION Tucker, Young, Jackson, Tull, Inc. (TYJT), at the request of the State Treasurer performed an analysis of the water supply options being considered by the City of Flint. The City of Flint is presently supplied potable water from the Detroit Water and Sewerage Department (DWSD). This supply is from a single 72-inch water main that terminates at a master meter located at Potter and Baxter. Additionally, downstream of the DWSD master meter, Flint supplies its customer Genesee County. The City of Flint also operates a water treatment plant that uses the Flint River as its source of supply to provide back up and redundancy to the DWSD supply as required by MDEQ
The Karegnondi Water Authority (KWA) is planning on constructing a raw water supply system that could provide Lake Huron water to the Flint Water Treatment Plant. Flint’s existing plant would be upgraded to treat the new raw water source.
The State Treasurer has appointed an emergency financial manager for the City of Flint. As such the Treasurer has requested TYJT to provide an analysis of the water supply options to assist the Treasurer in determining any potential risk and the best course going forward for supplying potable water to the City of Flint.
Report Organization The following sections of this report are described below:
Section 2 – The basis of the analysis is described in this section. The options include the KWA option and several options offered by DWSD.
Section 3 – A significant amount of information and data was collected including memorandums, reports, drawings, financial reports, and other documents. This section summarizes the information used in the analysis.
Section 4 – This section describes the evaluation of the cost of supply for the Flint options. The costs are comprised of the initial cost of operations plus the annual rate of escalation/inflation.
Section 5 – The evaluation process used to analyze the construction costs associated with the KWA supply system is described in this section. Additionally, the cost of financing the capital requirements is described.
Section 6 – This section presents the financial review of the options considered to supply potable water to Flint. A summary of these options is also provided.
Section 7 – In addition to the financial analysis other considerations were identified that should be considered in understanding the risks and determining the best option to supply Flint. They include items related to cost, redundancy and reliability, and Flint’s ability to control their future cost of water supply.

2
2. FLINT WATER SUPPLY OPTIONS Two water purveyor options were evaluated; the KWA water supply system and continued supply from DWSD. Both suppliers would provide water from Lake Huron as the source. The KWA system is a raw water supply, which means that the water would have to be treated by Flint before distributing the potable water to its customers. The DWSD supply is potable or “finished” water and would not need additional treatment.
Additionally, an option for the Flint WTP to supply the City of Flint without being supplied from either DWSD or KWA was initially considered. The preliminary investigation evaluated the cost associated with the required improvements to the plant and to the Flint River dam system. Although it appeared that this was a viable option, Flint in a meeting on December 20, 2012 with the Treasury, stated that the City did not want to pursue the option and it is no longer being considered.
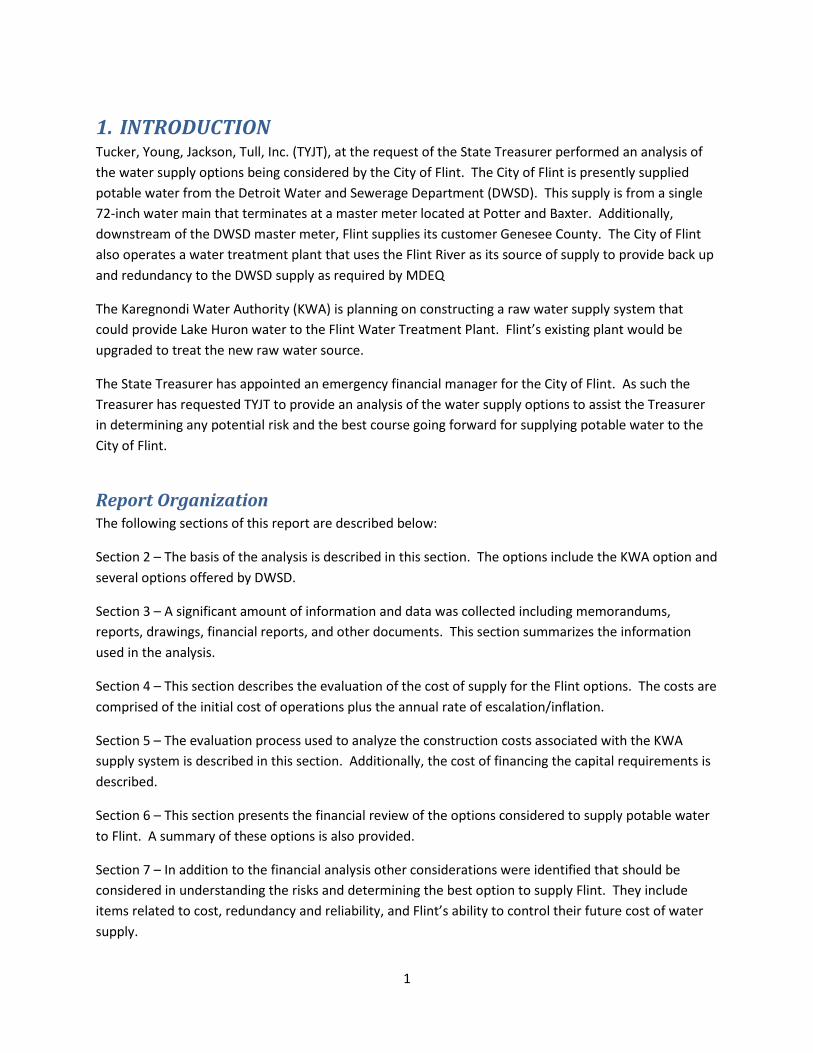
Karegnondi Water Authority (KWA) Lake Huron Water Supply The KWA water supply system schematic is shown in Figure 2-1. The system is comprised of an intake in Lake Huron that supplies water to the Lake Huron Pump Station (LHPS). The LHPS lifts the water and pumps it through an approximately 22 mile long 60-inch pipeline. The pipeline terminates at a 5 MG reservoir and is then pumped from the Intermediate Pump Station (IPS) through approximately 26 miles of 60-inch and 18 miles of 30-inch pipeline to the existing Flint WTP. Downstream of the IPS, approximately half way to the Flint WTP, the 60-inch line would also supply a new Genesee County WTP.
The raw water transmission system has a 60 MGD capacity and is sized to deliver a maximum of 18 MGD to the Flint WTP with an average day supply of 12 MGD. Improvements at the Flint WTP would also be required to treat the lake water as the plant is currently designed to treat the Flint River water.
The term of the KWA contract for Flint is 40 years.
3
Figure 2-1: KWA Raw Water System
DWSD Water System The DWSD system schematic is shown in Figure 2-2. Flint is currently supplied by DWSD at Master Meter FL-1, located at Potter and Baxter. Flint typically gets its water from the Lake Huron WTP, located in Fort Gratiot, Michigan; near the Lake Huron shoreline. Water is treated and pumped at the Lake Huron WTP and supplied through a 120-inch pipeline to an intermediate pump station called the Imlay Pump Station. The Imlay Pump Station has 20 MG of reservoir capacity. Depending on the time of year and the DWSD system demand, water is either bypassed directly to Flint or it is re-pumped at Imlay. It should be noted that the DWSD supply to Flint is part of a very large water system and during emergencies or outages water can be supplied from the south up to Flint in lieu of the Lake Huron facility.

4
Figure 2-2: DWSD Water System
The pipeline from Imlay to FL-1 is a 72-inch pipeline. It has been estimated that the 72-inch line serving Flint has a capacity in excess of 90 MGD.
DWSD has presented several contractual options to Flint and all of them are based on Flint signing a new 30 year contract. The options shown in Table 2-1 are based on two different supply points; one at the current master meter location FL-1 at Potter and Baxter (P&B) and the other at the location of the Imlay Pump Station. The reason for the varying options is to provide a lower water rate at the Imlay Station, since the DWSD rate formula is based on distance and elevation factors related to the supply location.
The rates are also dependent on the maximum amount of water DWSD supplies. As example, if DWSD supplies a maximum day demand of 18 MGD that would equal the entire amount of water required by Flint.
For the options less than the maximum of 18 MGD means that the Flint WTP would supplement the difference by supplying water treated from the Flint River. These options are known as “blending” and would allow for Flint to blend two sources of water to supply its customers; the Flint River using the Flint WTP and Lake Huron from DWSD system.

5
Description Average Day Demand
18 MGD Maximum Day Customer – FL-1 12 MGD
12 MGD Maximum Day Customer – FL-1 8 MGD
8 MGD Maximum Day Customer – FL-1 8 MGD
12 MGD Maximum Day Customer - Imlay 12 MGD
8 MGD Maximum Day Customer - Imlay 12 MGD
Table 2-1: DWSD Supply Options

6
3. DATA COLLECTION During the course of the investigation several documents were used to perform the analysis. The names of the documents are listed below for reference.
KWA and Flint
Preliminary Engineering Report, Lake Huron Water Supply Karegnondi Water Authority, September 2009;
Analysis of the Flint River as a Permanent Water Supply for the City of Flint, July 2011;
Cost Comparison, KWA vs. DWSD, Letter to Mr. Kurtz, October 31, 2012;
Lake Huron Supply Study, KWA, Appendix 20, October 2012 Preliminary Report Update, Final Report (DRAFT), October 4, 2012;
Articles of Incorporation of Karegnondi Water Authority, endorsed in 2010;
Karegnondi Water Authority Bylaws, October 26, 2010;
KWA Raw Water Supply Contract;
Flint WTP Statement of Revenues and Expenditures 09’ – 12’;
GCDC Division of Water and Waste Services Financial Statements 03’ – 11’; and
Assorted emails with further clarification of questions and documentation.
DWSD
Historical Rates and Charges to Flint 04’ – 13’;
Historical Rates and Charges to Flint with Hypothetical Model Contract 10’ – 13’;
2013 Rates and Charges for the following options:
18 MGD Maximum Day Customer at FL-1;
12 MGD Maximum Day Customer at FL-1 (Flint blending*);
8 MGD Maximum Day Customer at FL-1 (Flint blending*);
12 MGD Maximum Day Customer at Imlay (Flint blending*);
8 MGD Maximum Day Customer at Imlay (Flint blending*); and
Assorted emails with further clarification of questions and documentation.

7
* Flint blending based on DWSD supplying two-thirds and Flint one-third of 12 MGD average day demand.
Two meetings were also held; one with DWSD and one with Flint and Genesee County representing KWA. The meetings were held on November 19, 2012 and November 20, 2012, respectively. Minutes from these meetings are included in Appendix A.

8
4. COST OF SERVICE Information provided by DWSD, Flint, and representatives of the KWA were used in the cost of service evaluation. To evaluate the annual escalation/inflation rate over the planning period, the rate adjustment for DWSD was estimated based on the recent rate adjustment history. For the KWA system both the estimated cost of operations when the system begins supplying water and the annual rate adjustment or inflation was evaluated. The existing cost of operations and escalation for the Flint WTP was based on actual costs provided and then adjusted depending on the scenario considered. This section describes the evaluation process and the rates used in the analysis.
DWSD Water Supply The City of Flint has been a customer of DWSD since 1967. The Flint WTP has been maintained as a backup to the DWSD system. As indicated previously, several options were provided by DWSD depending on the type of service Flint was to select. The unit cost of water for each of these options is shown in Table 4-1. These rates are based on DWSD’s FY13, which are current until July 2013.
Description Average Day Demand (MGD)
Unit Rate ($/MCF)
18 MGD Maximum Day Customer – FL-1 12 16.37
12 MGD Maximum Day Customer – FL-1 8 16.31
8 MGD Maximum Day Customer – FL-1 8 12.68
12 MGD Maximum Day Customer - Imlay 12 14.38
8 MGD Maximum Day Customer - Imlay 12 11.11
Table 4-1: Cost of DWSD Supply Options
To determine annual escalation rate, DWSD’s last 10 years of history was used along with other large urban water systems in Michigan. The water systems used for benchmarking comparison were: Lansing, Grand Rapids, and Saginaw.
Table 4-2 identifies the annual and average rate of increase to Flint based on supplying water either to the current FL-1 at Potter and Baxter or Imlay. Note the last three years of the rates (FY 2011 through FY 2013) assumes that Flint’s cost would be based on the new 30 year contract; FY 2011 being the first year that the new contract was available.

9
Fiscal Year
Average Unit Cost ($/MCF)
Annual Change (%)
2004 11.06
2005 10.24 -7.4
2006 10.56 3.1
2007 11.09 5.0
2008 11.35 2.3
2009 13.07 15.2
2010 11.73 -10.3
2011 13.89 18.4
2012 15.08 8.6
2013 16.24 7.7
Average 4.4%
From FL-1
Fiscal Year
Average Unit Cost ($/MCF)
Annual Change (%)
2004 11.06
2005 10.24 -7.4
2006 10.56 3.1
2007 11.09 5.0
2008 11.35 2.3
2009 13.07 15.2
2010 11.16 -14.6
2011 12.23 9.6
2012 13.28 8.6
2013 14.32 7.8
Average 2.9%
From Imlay
Table 4-2: Recent DWSD Water Rates

10
Audited financial reports were used to determine the rate of inflation associated with other three large municipal systems. The results are shown in Table 4-3.
Water Systems Years Evaluated Average Rate (%)
Lansing 05’-12’ 4.6
Grand Rapids 04’-11’ 1.6
Saginaw 04’-11’ 7.0
Table 4-3: O&M Inflation Rates of Other Large Water Systems
Based on the information analyzed from DWSD and the other communities, it was determined that a fair annual rate of inflation for operations and maintenance cost for the analysis should be 4.4%. The 4.4% has historical significance from Flint’s current water supplier and falls within the range of the other communities.
KWA Water Supply The initial projected O&M cost for the KWA supply would be comprised of KWA’s O&M costs as well as Flint’s O&M costs. Because there was limited information provided, the initial estimated rate of $1.50/MCF was used. This rate is based on information from the cost comparison analysis attached to the letter to Mr. Kurtz, dated October 31, 2012.
The KWA cost evaluation used an annual O&M inflation rate of 5%. To validate this rate a similar analysis to DWSD’s operations and maintenance annual rate of inflation was used. First, in discussions with Flint and the Genesee County Drain Commission (GCDC), they believed that the annual rate of inflation for the new KWA system would be similar to the GCDC Water & Waste Services (WWS). Additionally, two large transmission systems were used to benchmark the inflation rates: the Southeastern Oakland County Water Authority (SOCWA) and the Ypsilanti Utility Community Authority (YUCA). Although both of these systems transmit finished water opposed to raw water, they were considered similar enough for comparison as they are comprised of only large water mains, pumping facilities and storage.
Once again audited financial statements were used to calculate the inflation rates. A summary of the findings are shown in Table 4-4. Based on the fact that the information analyzed showed a large difference between the two systems, it was determined that the KWA assumption of 5% was a good rate of inflation to use in the financial analysis. This rate is almost equally between the GCDC rate and the other two transmission systems.

11
Systems Years Evaluated Average Rate (%)
GCDC WWS 03’ – 11’ 10.5
SOCWA 04’-12’ --
YUCA 04’-12’ 0.7
Table 4-4: O&M Inflation Rates of Other Comparable Systems to KWA
Flint WTP The Flint WTP currently serves as a backup supply to the DWSD service to Flint. To maintain backup operations, the City of Flint operates the plant approximately 20 days each year. Flint indicated that the average production rate when they operate is 11 MGD.
For the blending options and the KWA supply considered, Flint would be required to operate its plant all year around. Therefore, their operating and maintenance costs were evaluated and adjusted to determine an annual cost associated with year-round operations.
The Flint WTP provided three years of operating costs for the assessment. Additionally, reports listed in Section 3 were also used as reference to determine both operating costs for the plant processing Flint River water (blending options) and Lake Huron raw water (KWA option).
Major cost centers were analyzed to estimate annual operation and maintenance. They included: labor, utilities, chemicals and residual management. In general, as recommended by the Flint plant staff, labor and overhead were increased from the current costs by two-thirds. Additionally, variable costs for power, chemicals and residual cost were increased to estimate full time treatment at the Flint WTP. Data from the KWA Preliminary Report and annual operating data for the Flint WTP (provided separately) were analyzed to make these forecasts.
The annual operating and maintenance costs developed for Flint WTP used are shown in Table 4-5.
Source of Supply Average Daily Production (MGD)
Estimated Annual O&M Cost
Flint River (Blending with DWSD) 4 $5,895,097
Lake Huron (Supplied by KWA) 12 $7,913,118
Table 4-5: FY 13 O&M Costs for Year-round Operations
It was determined that a fair annual rate of inflation for operations and maintenance cost for the Flint WTP plant should be 4.51%. The 4.51% is an average of Lansing, Grand Rapids and Saginaw facilities.
.

12
5. CAPITAL REQUIREMENTS Large capital investments would be required by Flint and GCDC to construct the KWA supply system. Furthermore, some of the options presented by DWSD (supply point from Imlay) would require the purchase by Flint of DWSD’s 72-inch water main. Performing the financial analysis; therefore, required an analysis of the KWA construction cost estimate for the transmission system and Flint WTP improvements.
Revenue bonds were also identified as the source of financing the new supply system and associated improvements. This section describes the assumptions made and the interest used for financing the improvements.
KWA Supply System The most current cost estimate of the KWA system was presented in the document titled; Lake Huron Supply Study, KWA, Appendix 20, October 2012 Preliminary Report Update, Final Report (DRAFT), October 4, 2012. The cost of construction is estimated at $272,421,558. Flint’s portion would be 30% or $81,726,467.
Due to the significance of this expenditure, a detailed review of the cost was performed and is presented in this section. The analysis was performed based on the main elements of the supply system: the lake intake, the two pumping stations, and the transmission pipeline. Additionally, an analysis was performed related to construction contingencies and other costs such as engineering, legal, and administration.
Lake Intake KWA representatives indicated in a meeting in November that the design documents for the intake were at 90% and that it was planned for advertisement in January 2013. A summary of the estimate is shown in Table 5-1.
Description Estimate
Intake and Crib $22,076,850
ELAC at 25% 5,519,213
Property 2,300,000
Total $29,896,063
Table 5-1: KWA Intake Cost Estimate
Based on the evaluation, it appeared that the cost estimate was reasonable. Given that the design was nearly complete, the engineering, legal, administration, and construction contingencies (ELAC) at 25% were also found to be appropriate.

13
Pumping Stations KWA representatives indicated that the pump stations were estimated at a level of design less than 15%. Therefore, in addition to an evaluation of their cost estimate, other water pumping station costs were used for comparison. Additionally, contractors were also contacted for costs. Table 5-2 summarizes the KWA cost estimate compared to our cost estimate performed for the Treasury.
Description KWA Estimate TYJT Estimate
Pumping Stations $24,618,080 $54,573,314
Land for Intermediate Pump Station and Reservoir
-- 75,000
Subtotal $24,618,080 $54,648,314
ELAC for Construction 25% 6,154,520 30% 16,394,494
Total $30,772,600 $71,042,808
Table 5-2: Pumping Stations Cost Estimate
Two things to note regarding the difference in the cost estimates; firstly, there is a large difference in the cost estimates of the pumping stations. The estimate developed for the Treasury used several other pumping stations construction costs from Southeastern Michigan and discussions with contractors. These costs were then computed on a $/MG’s for comparison.
Secondly, our estimate for the Treasury is based on an ELAC of 30% instead of KWA’s 25%. Although 25% was acceptable for the intake, it is believed to be too low for the pumping station estimate given that the engineering effort is less than 15%.
Transmission Main Although the specific route for the transmission main was not provided, an estimate was calculated based on the general information provided. Once again, the KWA estimate was based on a level of design less than 15%. The estimate performed for the Treasury used the line items provided by KWA for the pipeline and also consulted with contractors to evaluate the cost of construction. The comparison is shown in Table 5-3.
Although the cost of construction of the pipeline is similar, a value of 30% was used for ELAC due to the level of design. Additionally, KWA did not believe there would be any additional costs for easements; however, this did not seem practical. Therefore an estimate for acquiring the easements was added to the Treasury estimate and is based on the 277 easements identified by KWA. The cost shown includes surveying, legal, engineering, administration, etc.

14
Description KWA Estimate TYJT Estimate
Transmission Mains $166,202,316 $167,419,530
ELAC for Construction 25% 41,550,579 30% 50,225,859
Subtotal $207,752,895 $217,645,389
Easements -- 1,166,170
Total $207,752,895 $218,811,559
Table 5-3: Transmission Pipeline Cost Estimate
Other KWA Costs In prior estimates of the construction cost, KWA used an ELAC of 37%. In this case it could be considered that the engineering effort associated with the design would have been included. However, it is believed that KWA’s reduced ELAC of 25%, does not include the design effort. Additionally, it would be prudent to assume that the owner would want a construction manager during construction of this large project. A summary of these costs are shown in Table 5-4.
Description Estimate
Design Engineering for Pumping Stations and the Transmission Pipeline
$16,939,581
Construction Management at 5%of Project Cost Estimate of $217,645,389
14,434,609
Administration 349,440
Legal, Easements, Contract Documents 831,000
Total $32,554,630
Table 5-4: Other Costs
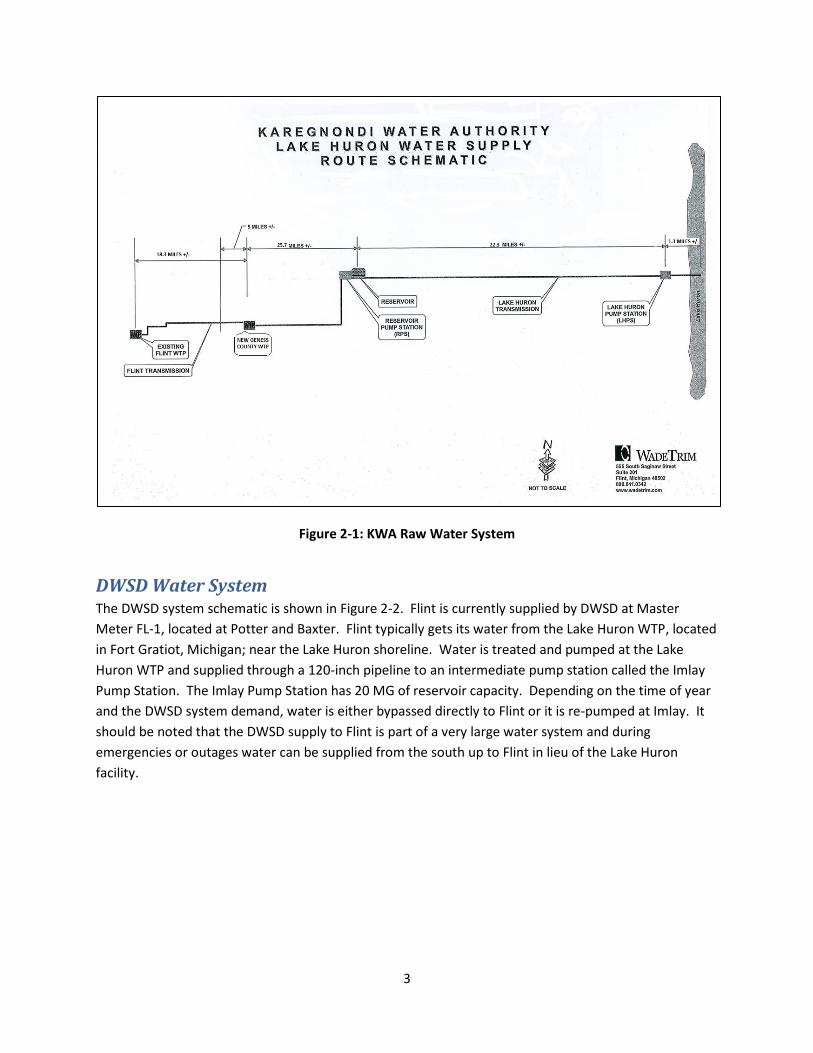
Summary Comparison A summary of the two cost estimates are shown in Table 5-5. Based on the comparison, the estimate performed by TYJT shows a higher cost to Flint by approximately $25,000,000.
Note that there are two other costs shown in the summary that were not previously addressed; power and backup power. Regarding the cost of providing power to the pumping facilities, the cost of $4,000,000 appears reasonable.
15
The KWA has repeatedly indicated that backup power is not needed. Backup power is a standard practice in the water industry. Furthermore, a loss of power at either pumping facility will prevent the supply of water to both Flint and Genesee County. For these reasons, the cost of providing backup power was included in our estimate for the Treasury.
Description KWA Estimate TYJT Estimate
Intake/Crib $ 27,596,063 $ 27,596,063 Pump Stations 30,772,600 71,042,808 Transmission Mains 207,752,895 217,645,389 Power 4,000,000 4,000,000 Redundant Power for PS 1,273,200 Land for Lake Huron Pumping Station 2,300,000 2,300,000 Design Engineering/PS and Transmission 16,939,581 Construction Management 14,434,410 Administration 349,440 Legal/Easement/Contract Documents
831,000
Easements
1,166,170 Total $ 272,421,558 $ 357,578,060
Flint Share at 30%
$81,726,467
$107,273,418 Table 5-5: Total Cost Comparison
Flint WTP Improvements The KWA analysis identified capital costs required to convert the existing WTP from river water treatment to treating lake water. The cost estimate was identified as $7,100,000 in the 2009 report. This number was used in the our analysis, since additional information was not provided. For the purpose of the financial analysis; however, the $7,100,000 was increased by 3% each year for three years to account for inflation.
DWSD Imlay Station Supply Options The options identified by DWSD to supply service to Flint at the Imlay Pump Station would require Flint to purchase the 72-inch water main from Imlay to Master Meter, FL-1. The pipeline is approximately 25 miles long. The estimated cost provided by DWSD for estimating purposes is $4,700,000.
Financing The cost of financing the revenue bonds for the capital work was investigated. Based on conversations with local financial advisors knowledgeable in bond financing, an interest rate of 5% for the 25 year

16
period was considered acceptable. This is based on a Standard and Poor’s bond rating of A without insurance.
Additional costs associated with the bond include the reserve and bond issuance fee. The bond holders will require a reserve of approximately 10% of the loan to be held for the 25 year payment period. The cost associated with the bond issuance has been estimated at 2.25% of the principal borrowed for the KWA project and 3% for the smaller loan associated with the Flint WTP improvements or the purchase of the 72-inch main.
Furthermore, since no revenue will be generated to pay on the bonds for the first three years that the system is being constructed, the cost associated with capitalizing the interest was also included.
Finally, interest on the reserve will be provided back to KWA and Flint. Although the interest is currently less than 1%, it was determined that a 3% rate would be more prudent long-term.

17
6. FINDINGS Using the information described in the previous sections, a cost evaluation was conducted for the KWA supply and the DWSD options. Individual worksheets for each option are provided in Appendix B. For the purpose of comparison a 30 year period was used. This period includes the 3 year construction period, the 25 loan period and an additional two years to get a sense of the cost of operation after the loans have been paid.
There were three separate cost sheets prepared for the KWA option. The first cost sheet (KWA) is based on the cost estimate provided by KWA. The costs provided assumed no overruns or delay in construction. With KWA’s own assumptions of an overrun in construction of 15% and a one year delay in operations, the KWA estimated cost becomes $686,375,920 through Year 2042.
Since this cost estimate did not appear to include the financing of revenue bonds, another cost sheet (KWA-1) was developed that included KWA’s cost estimate without overruns with the additional finance costs associated with the revenue bonds. A final cost sheet (KWA-2) includes the cost associated with the revenue bonds based on the estimate provided by TYJT for the Treasury.
A summary of the cost sheets provided in Appendix B are shown in Table 6-1. Figure 6-1 shows the cumulative annual costs associated with each option.
Option Costs through 2042 ($)
Ranking by Cost
DWSD 8 MGD Maximum Day at Imlay Station 634,795,488 1 KWA (10/31/12 No Overruns, As Provided)* 649,775,166 2 DWSD 8 MGD Maximum Day at FL-1 672,671,705 3 KWA-1 (10/31/12 No Overruns with Cost of Financing) 707,279,715 4 DWSD 12 MGD Maximum Day at Imlay Station 725,576,803 5 DWSD 12 MGD Maximum Day at FL-1 762,110,308 6 KWA-2 (Treasury Estimate) 766,784,313 7 DWSD 18 MGD Maximum Day at FL-1 821,226,268 8
* $686,375,920 with 15% overrun in construction and a one year delay in operations
Table 6-1: Total Cost of Options through 2042
Based on the analysis, it is prudent to assume the KWA water supply option costs would be somewhere between the KWA-1 and KWA-2 options. Therefore, the analysis indicates that the two DWSD options of supplying 8 MGD on a maximum day and up to 8 MGD on average are the least cost options for Flint. These options allow Flint to maximize the use of existing assets; the City of Flint’s (the Flint WTP) and DWSD’s (the existing 72-inch main).
Additionally, in recent conversations with the Treasury another option was discussed that could potentially be the most cost-effective solution. Currently the Flint WTP serves as a backup if service is

18
lost through either the DWSD or KWA pipeline. If the a twin pipe paralleling the DWSD 72-inch water main were constructed with interconnects with the 72-inch line, then the new water main could serve as the backup to Flint and the Flint WTP could be abandoned or potentially sold to Genesee County for their use.
The construction of the parallel pipeline would be considered in the DWSD capital expenditure as a Common to All (CTA) cost. This means that the capital cost of the pipeline would be shared by all DWSD customers and not just by Flint. Preliminary analysis of this option appears to be the most cost-effective of all the options discussed. However, a more thorough cost analysis is warranted and this approach would require an agreement between Flint and DWSD.
Figure 6-1: Flint Water Supply Options through 2042
$5,000,000
$10,000,000
$15,000,000
$20,000,000
$25,000,000
$30,000,000
$35,000,000
$40,000,000 Flint Water Supply Options
DWSD 18 MGD Max Day at P&B DWSD 12 MGD Max Day at P&B - Flint BlendingDWSD 8 MGD Max Day at P&B - Flint Blending DWSD 12 MGD Max Day at Imlay - Flint BlendingDWSD 8 MGD Max Day at Imlay - Flint Blending KWA-1KWA-2 KWA 10/31/12 No Overruns

19
7. OTHER CONSIDERATIONS As part of the investigation other issues were identified that may result in risks to Flint that should be considered by the Treasury in determining how Flint’s potable water should be supplied. These issues are related to redundancy and reliability, other items affecting cost, and Flint’s desire to control its own destiny related to its water supply. These are described further below.
Redundancy/Reliability In one of the first meetings related to this task assessment, which was held on November 1, 2012, the Genesee County Drain Commissioner, Mr. Jeff Wright, stated that one of the main reasons for pursuing the KWA supply option related to the lack of reliability of the DWSD system. He pointed to the Northeast blackout of 2003; a widespread power outage that occurred throughout parts of the Northeastern and Midwestern United States and Ontario, Canada, on Thursday, August 14, 2003. He stated that Flint and Genesee County were out of water for several days.
It is worth noting that this was a power outage of historic proportions that affected millions of Americans. However, DWSD did begin supplying water again relatively quickly in comparison to other major cities impacted by the same power outage.
Furthermore, the KWA supply system offers less redundancy to Flint than the current DWSD system. Under both options, Flint is supplied by a single pipeline; however, DWSD has backup power at all of its major facilities supplying Flint. The KWA system will not have a redundant power at its pumping facilities. This would be a major risk.
Currently, backup to the DWSD system for Flint is Flint’s WTP using the Flint River as the source of supply. KWA has stated that the Flint River source would also be used as backup to Flint if the KWA supply through its pipeline was lost. However, since the Flint WTP would be upgraded to treat Lake Huron water under the KWA option, using the Flint River as a backup source would require the Flint WTP to maintain two process treatment streams.
In addition to Flint and Genesee County, the DWSD’s 72-inch main supplies Imlay City, Mayfield and the Greater Lapeer County Utilities Authority (GLCUA). The volume of water contained within the 72-inch main is approximately 30 MG. Only supplying these three remaining communities would cause the water age to increase dramatically; somewhere in excess of three weeks old, before reaching the customers’ master meters. Since the half-life of chlorine in the DWSD system is approximately 5 days, the chlorine would most probably be near zero requiring re-chlorination of the finished water upstream of the master meters.
Re-chlorinating is a costly and risky process due to the instability of chlorine gas. It is unknown whether DWSD would pursue this improvement or possibly abandoned the 72-inch pipeline.
If Flint is supplied by the KWA system, then DWSD supplying their other customers along the 72-inch water main may be reconsidered. Since the KWA system is a raw water supply, the communities would

20
either have to build a treatment facility to treat the water from KWA or find another water source for their communities.
Additional Cost and Risk Considerations The design of the KWA supply and the construction of the system have not been completed; therefore, final costs and time to complete are unknown. Cost overruns and delays in completion will both negatively impact Flint’s final cost. As example, if the project is not completed within the three year period, payment on the bonds will be due, but the revenue source needed from the sale of water could not be provided.
Furthermore, there is always a risk with large water system construction; especially those including an intake in the Great Lakes, pumping stations and rehabilitation of older water treatment plants. These risks include the potential of explosive gases in tunneling below Lake Huron, changing site conditions associated with the large number of miles of pipe installation and rehabilitating an older WTP, and the startup and debugging of the entire pumping system.
Flint has indicated that they have a high water loss. Not addressing this issue prior to sizing the Flint supply pipeline from KWA could cause the water main to be oversized along with its incremental cost in construction.
Also, the KWA supply option appears to run counter to the Treasury’s Competitive Grant Assistance Program (Formerly EVIP Grant). This program has been put in place to allow for communities to consolidate their services and save money. Two existing customers of DWSD (Flint and Genesee County) along with the potential of others customers (GLCUA, Mayfield, Imlay City) separating to from another water system is in contradiction to the program.
Finally, there is a concern over the ability of smaller systems (KWA) over larger systems (DWSD) to pay for future unfunded mandates and regulations. Obviously, identifying regulation requirements over 30 years is hard to determine. However, it is widely accepted that a large system has greater ability to respond to unfunded mandates because the cost can be distributed over a large customer base.
Flint’s Autonomy Flint has indicated that a major point of consideration is that they have no control over the rate increases issued to Flint by DWSD. All other counties supplied by DWSD have representatives on the Board of Water Commissioners (BOWC). The BOWC is one of the governing bodies that approve the water rates. Since Flint and Genesee County do not have a representative on the BOWC, Flint believes they are held “hostage” to DWSD’s rates and cost of service.
This issue was stated in Flint’s handout at the November 1, 2012 meeting. The handout is titled, “Flint Water Supply Future.” However, it is worth noting in the same handout, Flint also identifies similar concerns with the governing board of the KWA system. Notably, that although Flint and Genesee County will be the only customers and Flint will be responsible for 30 percent of the construction cost,

21
they will have a minority vote on the KWA board. Furthermore, there are other communities (Lapeer County, the City of Lapeer, and Sanilac County) that sit on the board and vote. However, they are not purchasing water nor contributing to the construction costs.

STATE OF MICHIGAN CONTRACT NO. 271N3200089
CITY OF FLINT WATER SUPPLY ASSESSMENT
State of Michigan, Department of Treasury
Appendix A: Meeting Minutes

Comments: Meeting minutes were recorded based on the understanding of the author. Please contact the author within three days if you have any different understanding of the meeting. These minutes will be considered approved unless comments are provided within three days.
MEETING MINUTES CONSULTING ENGINEERS-PLANNERS565 E. Larned Suite 300Detroit, Michigan 48226(313)963-0612 FAX (313)963-2156
JACKSON, TULL INC.TUCKER, YOUNG,
IN ATTENDANCE: Sue McCormick, DWSD Director Darryl Latimer, DWSD Deputy Director George Karmo, TYJT Awni Qaqish, TYJT Dave Guastella, TYJT
DATE: November 24, 2012
PURPOSE OF MEETING:
Meeting with DWSD for the Indefinite-scope, Indefinite-delivery Contract Number 00383, 2012 Professional General Architectural/Engineering Services – City of Flint Water Supply Assessment
PREPARED BY: Dave Guastella
A meeting was held at the DWSD Main Office Building on November 19, 2012 to discuss the water supply options being presented by DWSD to the City of Flint. The main items discussed generally followed the attached DWSD Discussion/Questions that were provided to the Department prior to the meeting. A summary of the key points discussed are provided below.
DISCUSSION ITEMS
1. Question/Discussion Item: Verify that the four options presented at the November 1, 2012 meeting are still available for consideration:
a. Supplied from Potter & Baxter using the new model contract (assume a Maximum Day Customer),
b. Supplied from Imlay Station,
c. Finished un-pumped supply from Lake Huron WTP, and
d. Raw un-pumped supply from Lake Huron WTP.
DWSD prefers to focus on the first two supply point listed; from the current location at Potter & Baxter and at the Imlay Pump Station as these apply specifically to Flint.
DWSD provided the attached summary regarding the current costs to Flint based on the various options that DWSD is offering. The savings associated with each option is provided as well. As example, if Flint were to purchase water from the supply point located at Imlay Station, the current cost to Flint would be $5,661,000 and it would be a savings of nearly 50%

Comments: Meeting minutes were recorded based on the understanding of the author. Please contact the author within three days if you have any different understanding of the meeting. These minutes will be considered approved unless comments are provided within three days.
compared to Flint’s current rate.
2. Question/Discussion Item: What additional capital improvements will be required for each option?
If Imlay Pump Station is selected as the supply point then Flint would need to purchase the 72-inch water main and an agreement to supply Lapeer would need to be worked out. DWSD believes that this could be worked out through a “wheeling” charge over the 72-inch main or possibly moving the supply point downstream of the Lapeer connection.. DWSD estimates the value of the water main at $4.7M. Flint could bond for this amount or DWSD could include the cost into Flint’s rate.
3. Question/Discussion Item: Are there other options being presented that should be considered (e.g., blending)?
Only the two options indicated above are currently being considered and both would include blending; DWSD providing 2/3 of the supply and the Flint WTP providing the other 1/3.
4. Question/Discussion Item: To evaluate each option over the 25 year planning period, provide:
a. Annual water rate for Flint for 2002 through 2012, and the
b. Projected annual rate adjustment for each option. What are the proposed measures to keep the rate adjustments down in the future?
DWSD provided the attached historical rates from 2002 through 2012 for the existing water contract with Flint. The attachment also includes what the rates would have been if Flint had signed the new model contract or had taken service from Imlay. These rates were provided back to 2010.
DWSD believes that 5% would be a good estimation to assume for their annual escalation in rates over the 25 year planning period.
5. Question/Discussion Item: Flint stated a 10% increase in the capacity charge. What number did DWSD provide Flint?
It was unclear to DWSD where the 10% increase in capacity charge stated by Flint came from. DWSD’s information provided shows an average of 6.3%. DWSD offered a meeting with TYJT to discuss how the fixed and commodity charges are allocated.
6. Question/Discussion Item: Flint financial comparison is based on the initial Cost of $14,413,858, which includes $2,725,538 for Flint WTP operating cost; i.e, DWSD charge is $11,688,320. How good is this number?
DWSD indicated that the charge of $11,638,320 is good through 6/30/13.based on their existing contract with DWSD.
7. Question/Discussion Item: KWA’s initial charge to Flint is based on 12 MGD. Is DWSD charge
Comments: Meeting minutes were recorded based on the understanding of the author. Please contact the author within three days if you have any different understanding of the meeting. These minutes will be considered approved unless comments are provided within three days.
based on 12 MGD?
Yes, 12 MGD from DWSD would be a maximum with Flint supplying 6 MGD for a total of 18 MGD (2/3 vs. 1/3).

Comments: Meeting minutes were recorded based on the understanding of the author. Please contact the author within three days if you have any different understanding of the meeting. These minutes will be considered approved unless comments are provided within three days.
CONSULTING ENGINEERS-PLANNERS565 E. Larned Suite 300Detroit, Michigan 48226(313)963-0612 FAX (313)963-2156
JACKSON, TULL INC.TUCKER, YOUNG,
Indefinite-scope, Indefinite-delivery Contract Number 00383 2012 Professional General Architectural/Engineering Services
CITY OF FLINT WATER SUPPLY ASSESSMENT
DWSD Discussion/Questions for the November 19, 2012 Meeting
1. Verify that the four options presented at the November 1, 2012 meeting are still available
for consideration: c. Supplied from Potter & Baxter using the new model contract (assume a Maximum
Day Customer), d. Supplied from Imlay Station, e. Finished un-pumped supply from Lake Huron WTP, and f. Raw un-pumped supply from Lake Huron WTP.
2. What additional capital improvements will be required for each option? 3. Are there other options being presented that should be considered (e.g., blending)? 4. To evaluate each option over the 25 year planning period, provide:
g. Annual water rate for Flint for 2002 through 2012, and the h. Projected annual rate adjustment for each option. What are the proposed
measures to keep the rate adjustments down in the future? 5. Flint stated a 10% increase in the capacity charge. What number did DWSD provide Flint? 6. Flint financial comparison is based on the initial Cost of $14,413,858, which includes
$2,725,538 for Flint WTP operating cost, i.e DWSD charge is $11,688,320. How good is this number?
7. KWA’s initial charge to Flint is based on 12 MGD. Is DWSD charge based on 12 MGD?

PRELIMINARYTFG
THE FOSTER GROUP 11/11/12
RevenueRequirement Fixed Commodity Avg Unit Cost
1 Status Quo 11,461,700 357,271 12.46 19.91
2 Model Contract 9,732,100 275,517 11.16 16.90 3 Change (1,729,600) (81,754) (1.30) (3.00) 4 % Change -15.1% -22.9% -10.4% -15.1%
5 Max Day Only 9,424,700 271,010 10.72 16.37 6 Change (307,400) (4,507) (0.44) (0.53) 7 % Change -3.3% -1.7% -4.1% -3.3%
8 Allow Blending 6,302,800 182,369 10.72 16.42 9 Change (3,121,900) (88,641) 0.00 0.05
10 % Change -49.5% -48.6% 0.0% 0.3%
11 Imlay City Connections 5,800,700 170,912 9.77 15.11 12 Change (502,100) (11,457) (0.95) (1.31) 13 % Change -8.7% -6.7% -9.7% -8.7%
14 Cumulative Change (5,661,000) (186,359) (2.69) (4.80) 15 Cumulative %Change -49.4% -52.2% -21.6% -24.1%
Avg Day Max Day Peak Hour Distance Elevation Salesmgd mgd mgd miles feet mgd
1 Status Quo 11.8 21.6 22.6 52.0 866 11.82 Model Contract 11.8 17.9 18.8 52.0 866 11.83 Max Day Only 11.8 17.9 17.9 52.0 866 11.84 Allow Blending 7.9 11.9 11.9 52.0 866 7.95 Imlay City Connections 7.9 11.9 11.9 45.2 866 7.9
Rates and Charges
Summary of DWSD Cost Allocations to Flint Under Various ScenariosFlint Only
Assumptions

PRELIMINARYTFG
THE FOSTER GROUP 11/20/12
Recent DWSD Water Rates to Flint
Rates and Charges Annual Change AverageFY Fixed Commodity Avg Unit Cost Fixed Commodity Avg Unit Cost Annual Change
$/mo $/Mcf $/Mcf $/mo $/Mcf $/McfAs Charged
2004 11.06 11.062005 10.24 10.24 -7.4%2006 10.56 10.56 3.1%2007 11.09 11.09 5.0%2008 11.35 11.35 2.3%2009 13.07 13.07 15.2%2010 14.32 14.32 9.6%2011 182,301 14.29 16.01 -0.2% 11.8%2012 443,096 13.36 17.53 143.1% -6.5% 9.5%2013 707,000 12.46 19.12 59.6% -6.7% 9.1% 6.3%
Hypothetical Model Contract2004 11.06 11.062005 10.24 10.24 -7.4%2006 10.56 10.56 3.1%2007 11.09 11.09 5.0%2008 11.35 11.35 2.3%2009 13.07 13.07 15.2%2010 13.96 13.96 6.8%2011 145,918 13.74 15.28 -1.6% 9.5%2012 378,968 12.58 16.57 159.7% -8.4% 8.4%2013 597,323 11.63 17.93 57.6% -7.6% 8.2% 5.5%
Page 1
PRELIMINARYTFG
THE FOSTER GROUP 11/20/12
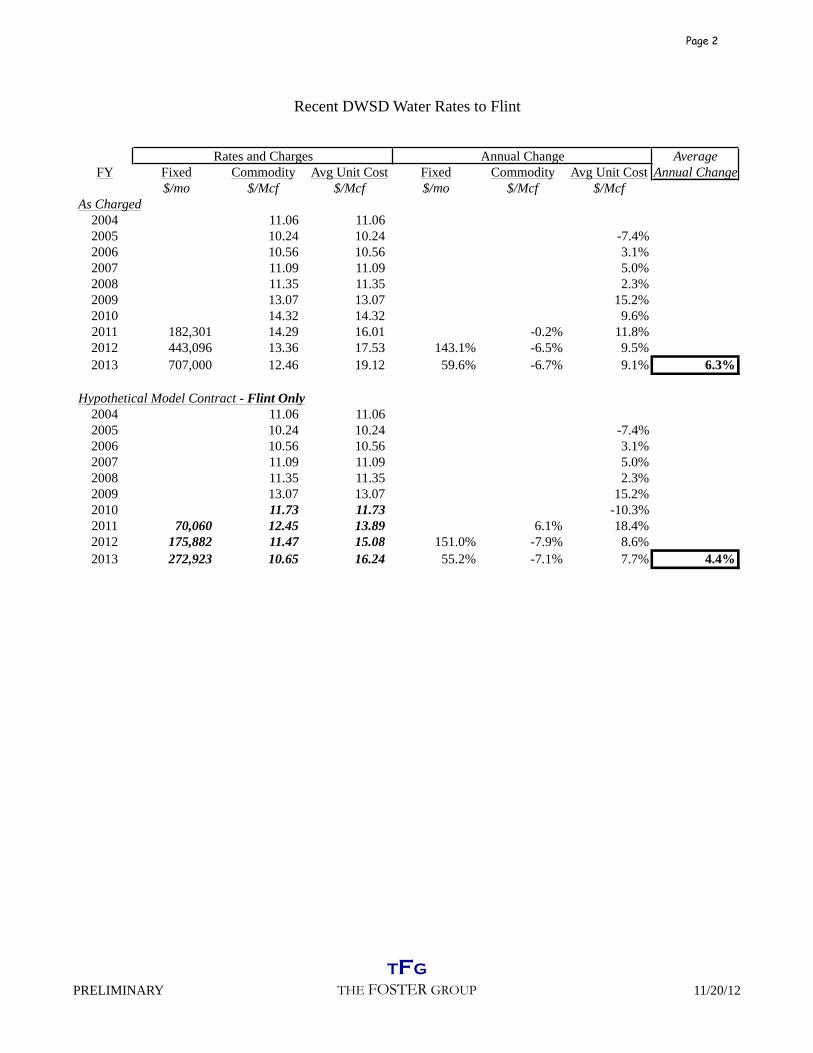
Recent DWSD Water Rates to Flint
Rates and Charges Annual Change AverageFY Fixed Commodity Avg Unit Cost Fixed Commodity Avg Unit Cost Annual Change
$/mo $/Mcf $/Mcf $/mo $/Mcf $/McfAs Charged
2004 11.06 11.062005 10.24 10.24 -7.4%2006 10.56 10.56 3.1%2007 11.09 11.09 5.0%2008 11.35 11.35 2.3%2009 13.07 13.07 15.2%2010 14.32 14.32 9.6%2011 182,301 14.29 16.01 -0.2% 11.8%2012 443,096 13.36 17.53 143.1% -6.5% 9.5%2013 707,000 12.46 19.12 59.6% -6.7% 9.1% 6.3%
Hypothetical Model Contract - Flint Only2004 11.06 11.062005 10.24 10.24 -7.4%2006 10.56 10.56 3.1%2007 11.09 11.09 5.0%2008 11.35 11.35 2.3%2009 13.07 13.07 15.2%2010 11.73 11.73 -10.3%2011 70,060 12.45 13.89 6.1% 18.4%2012 175,882 11.47 15.08 151.0% -7.9% 8.6%2013 272,923 10.65 16.24 55.2% -7.1% 7.7% 4.4%
Page 2

PRELIMINARYTFG
THE FOSTER GROUP 11/20/12
Recent DWSD Water Rates to Flint
Rates and Charges Annual Change AverageFY Fixed Commodity Avg Unit Cost Fixed Commodity Avg Unit Cost Annual Change
$/mo $/Mcf $/Mcf $/mo $/Mcf $/McfAs Charged
2004 11.06 11.062005 10.24 10.24 -7.4%2006 10.56 10.56 3.1%2007 11.09 11.09 5.0%2008 11.35 11.35 2.3%2009 13.07 13.07 15.2%2010 14.32 14.32 9.6%2011 182,301 14.29 16.01 -0.2% 11.8%2012 443,096 13.36 17.53 143.1% -6.5% 9.5%2013 707,000 12.46 19.12 59.6% -6.7% 9.1% 6.3%
Hypothetical Model Contract - Flint Only @ Imlay2004 11.06 11.062005 10.24 10.24 -7.4%2006 10.56 10.56 3.1%2007 11.09 11.09 5.0%2008 11.35 11.35 2.3%2009 13.07 13.07 15.2%2010 11.16 11.16 -14.6%2011 65,919 10.88 12.23 -2.5% 9.6%2012 165,275 9.89 13.28 150.7% -9.1% 8.6%2013 255,580 9.09 14.32 54.6% -8.1% 7.8% 2.9%

Comments: Meeting minutes were recorded based on the understanding of the author. Please contact the author within three days if you have any different understanding of the meeting. These minutes will be considered approved unless comments are provided within three days.
MEETING MINUTES CONSULTING ENGINEERS-PLANNERS565 E. Larned Suite 300Detroit, Michigan 48226(313)963-0612 FAX (313)963-2156
JACKSON, TULL INC.TUCKER, YOUNG,
IN ATTENDANCE: Ed Kurtz; Flint Emergency Financial Manager, City of Flint Dayne Walling; Mayor, City of Flint Mike Brown, City of Flint John O’Brien, Genesee County Howard Croft, City of Flint Dwayne “Duffy” Johnson, City of Flint Brent Wright, City of Flint Awni Qaqish, TYJT Dave Guastella, TYJT
DATE: November 24, 2012
PURPOSE OF MEETING:
Meeting with the City of Flint for the Indefinite-scope, Indefinite-delivery Contract Number 00383, 2012 Professional General Architectural/Engineering Services – City of Flint Water Supply Assessment
PREPARED BY: Dave Guastella
A meeting was held at the City of Flint Municipal Center on November 20, 2012 to discuss the water supply option being presented by the Karegnondi Water Authority (KWA) to the City of Flint. The main items discussed generally followed the attached KWA Discussion/Questions that were provided to City prior to the meeting. A summary of the key points discussed are provided below. The questions submitted are repeated in the Discussion Items for easy reference. A summary of the action items generated from the meeting follow the Discussion Items.
DISCUSSION ITEMS
1. Question/Discussion Item: Is the maximum day demand of 18 MGD for Flint the maximum day demand (MDD) throughout the 25 year planning period? If not, what is the 25 year projected MDD?
KWA would supply up to 18 MGD. 18 MGD has been assumed as the maximum day demand and 12 MGD is assumed as the average day demand throughout the 25 year planning period.
2. Question/Discussion Item: Copy of the intake contract documents and engineer’s estimate.
The intake contract documents are approximately 90% complete and are not available for distribution. However, the updated Appendix 20, dated October 4, 2012 includes the most recent cost estimate of the intake based on the current design in process.

Comments: Meeting minutes were recorded based on the understanding of the author. Please contact the author within three days if you have any different understanding of the meeting. These minutes will be considered approved unless comments are provided within three days.
3. Question/Discussion Item: Documentation of the Flint WTP improvements required and cost estimate.
The costs are approximately $7M as presented in the September 2009 Preliminary Engineering Report. However, this estimate has been updated. Some processes have been eliminated. John O’Brien will provide the updated costs and the description of the planned improvements to the plant.
4. Question/Discussion Item: Confirm Flint’s allocated percentage of the KWA capital improvements (30%?).
Yes, the allocation is based on 18 MGD/60 MGD total capacity.
5. Question/Discussion Item: Copy of the proposed KWA operating agreement for Flint.
John O’Brien will provide the operating agreement as well as the Capacity Contract and Articles of Incorporation.
6. Question/Discussion Item: What is the annual operating agreement adjustment projected for the 25 year planning period?
This information is provided in Appendix 14, Table 14.2 of the September 2009 Preliminary Engineering Report. Operating cost based on Table 1. Used 12 MGD as average day demand (ADD). Assumed 5% as the annual increase in operating costs. John O’Brien indicated that these operating costs were based on Genesee County’s operating costs. John O’Brien will provide the last 10 years of audited financial statements for the water fund.
To assess operating and maintenance costs for the Flint WTP, Duffy will provide multiple years of financial statements for the water fund. Duffy did not believe they had 10 years, but they will provide what they have.
Regarding operation and maintenance costs, Flint believes that these costs will increase by 2/3 of what they are now.
7. Question/Discussion Item: Need the route of the pipelines and the locations of the facilities proposed. Purpose is to identify constraints that impact costs (i.e., utilities, environmental (e.g. wetlands), easements, etc.).
KWA will not release the route due to concerns regarding speculation of land and easements. John O’Brien did indicate that the Lake Huron pump station would be at Fisher and M-25. The intermediate pump station site is near a location of the Lapeer/Sanilac/St. Clair border; where all three meet.
8. Question/Discussion Item: KWA’s initial charge to Flint is based on a 12 MGD average day demand. What is the basis of this number? Are there population projections and water use figures available that were used to determine the Flint demand for the 25 year planning period?
Comments: Meeting minutes were recorded based on the understanding of the author. Please contact the author within three days if you have any different understanding of the meeting. These minutes will be considered approved unless comments are provided within three days.
This was answered in Question No. 1 above.
9. Question/Discussion Item: Is there a transition plan and cost during construction of the KWA system identified?
Flint is looking for an agreement with DWSD for back-up supply from the 72-inch main at the Genesee border.
10. Question/Discussion Item: The October 4, 2012 Preliminary Engineering Report Update states: “no backup power is planned for the pumps” (LHPS) and “No backup power is planned for pumping” (IPS). In case of power loss, how would Flint supply its customers?
Flint indicated that they have adequate storage to supply the system for 6 to 7 days. Flint has 55 MG of storage and Genesee County has 65 MG for 2.5 days.
11. Question/Discussion Item: The latest plan shows only a 5 million gallon ground reservoir is planned for balancing between LHPS and IPS. How is redundancy maintained?
In cases of emergency, Flint indicated that the back-up for the KWA system will be the same as it is now with DWSD; they will use the Flint River as the source water. Flint currently operates their plant four times a year.
When questioned as to whether the WTP will be able to treat both lake water from the KWA system and river water Flint indicated that once the improvements identified in the September 2009 Preliminary Engineering Report are completed they will be able to accomplish both treatment processes. Flint will provide a schematic of the treatment trains at the WTP and a copy of the Flint transmission system.
Genesee County indicated that additional redundancy would also be provided from the new Genesee County WTP.
Regarding hydraulic transients; Genesee County indicated that a model analysis has not been included, but capital costs for mitigating transients have been included.
12. Question/Discussion Item: Related to the construction cost:
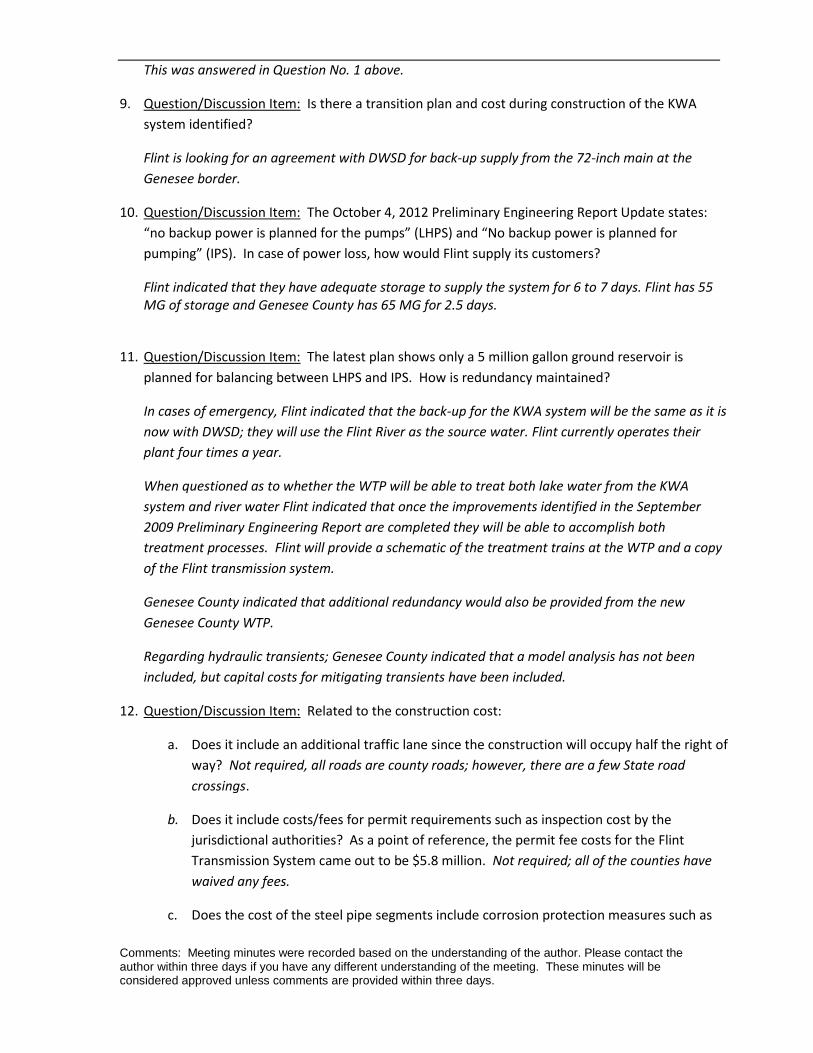
a. Does it include an additional traffic lane since the construction will occupy half the right of way? Not required, all roads are county roads; however, there are a few State road crossings.
b. Does it include costs/fees for permit requirements such as inspection cost by the jurisdictional authorities? As a point of reference, the permit fee costs for the Flint Transmission System came out to be $5.8 million. Not required; all of the counties have waived any fees.
c. Does the cost of the steel pipe segments include corrosion protection measures such as

Comments: Meeting minutes were recorded based on the understanding of the author. Please contact the author within three days if you have any different understanding of the meeting. These minutes will be considered approved unless comments are provided within three days.
anode stations and related O&M? Yes; however, the KWA has not settled on using steel pipe. PCCP pipe may be used. Steel shown in estimate because it is highest in cost and therefore the pricing is conservative.
d. SCADA monitoring stations require power. Is the cost of bring power to the SCADA stations included? Again, as a point of reference for the Flint Transmission System we estimated $800,000 for power to SCADA and valve operators. Yes, Genesee County did emphasize that the SCADA system will be simple and straightforward because a lot of controls are not required.
e. Other items discussed at the meeting included:
• The 2009 plant improvement cost is still good; however, there will be some reduction, such as a sulfuric chloride feed system that was eliminated. Plant capacity now is 36MGD, but will be 18 MGD.
• The KWA Lake Huron Pumping Station (LHPS) is now only high lift pump station. • Genesee County will provide the distance of the intake pipe from the crib to the
LHPS. • The intake project is almost ready to bid; waiting for the COE permit. • Genesee County is estimating the construction for the pipe lines and pump
stations will begin July 2013. • The route has been flown for survey. • Genesee County is estimating construction will be complete and the project will
be placed in service by Jan 2016. • Genesee County to provide a list of assumptions that the $272 million cost
estimate is based on since the route is now known.
13. The Flint River is identified as a backup: At what capacity? MDD or emergency supply?
The Flint River would serve as a back up supply.
14. Where did the 40 years come from (Flint hostage to Detroit)? DWSD’s new contracts are 30 years with openers to revise terms of supply (volume and pressure) after the first two years, then three years, and then in five year increments thereafter.
The 40 years was stated in error. The reference was to DWSD’s requirement to sign a 30 year contract.
After 40 years Flint will own 30% of the project and can sell their share of ownership if they want. Conversely, with DWSD, they continue to pay for the capital projects but have no ownership. Flint believes they will know what they will be charged for the next 25 years versus DWSD that can’t commit to a fixed escalation.

Comments: Meeting minutes were recorded based on the understanding of the author. Please contact the author within three days if you have any different understanding of the meeting. These minutes will be considered approved unless comments are provided within three days.
Action Items for Follow-up Items: Assigned To: Date to Complete
1. Updated Costs for the Flint WTP Improvements and a description of the improvements.
John O’Brien 11/21/12
2. KWA Operating Agreement, Capacity Contract and Articles of Incorporation.
John O’Brien 11/20/12
3. Provide the last 10 years of audited financial statements for the Genesee water fund.
John O’Brien 11/20/12
4. Provide multiple years of financial statements for the City of Flint water fund.
Duffy Johnson 11/26/12
5. Provide schematic of the Flint WTP and a map of the Flint transmission system.
Brent Wright 11/26/12
6. Provide the length of the intake pipe from the crib to the pump station.
John O’Brien 11/20/12
7. Provide a list of assumptions that the $272 million cost estimate is based on since the route is now known.
John O’Brien 11/26/12

Comments: Meeting minutes were recorded based on the understanding of the author. Please contact the author within three days if you have any different understanding of the meeting. These minutes will be considered approved unless comments are provided within three days.
CONSULTING ENGINEERS-PLANNERS565 E. Larned Suite 300Detroit, Michigan 48226(313)963-0612 FAX (313)963-2156
JACKSON, TULL INC.TUCKER, YOUNG,
Indefinite-scope, Indefinite-delivery Contract Number 00383 2012 Professional General Architectural/Engineering Services
CITY OF FLINT WATER SUPPLY ASSESSMENT
KWA Discussion/Questions for the November 20, 2012 Meeting
1. Is the maximum day demand of 18 MGD for Flint the maximum day demand (MDD)
throughout the 25 year planning period? If not, what is the 25 year projected MDD? 2. Copy of the intake contract documents and engineer’s estimate. 3. Documentation of the Flint WTP improvements required and cost estimate. 4. Confirm Flint’s allocated percentage of the KWA capital improvements (30%?). 5. Copy of the proposed KWA operating agreement for Flint. 6. What is the annual operating agreement adjustment projected for the 25 year planning
period? 7. Need the route of the pipelines and the locations of the facilities proposed. Purpose is to
identify constraints that impact costs (i.e., utilities, environmental (e.g. wetlands), easements, etc.).
8. KWA’s initial charge to Flint is based on a 12 MGD maximum day demand. What is the basis of this number? Are there population projections and water use figures available that were used to determine the Flint demand for the 25 year planning period?
9. Is there a transition plan and cost during construction of the KWA system identified? 10. The October 4, 2012 Preliminary Engineering Report Update states: “no backup
power is planned for the pumps” (LHPS) and “No backup power is planned for pumping” (IPS). In case of power loss, how would Flint supply its customers?
11. The latest plan shows only a 5 million gallon ground reservoir is planned for balancing between LHPS and IPS. How is redundancy maintained?
12. Related to the construction cost: a. Does it include an additional traffic lane since the construction will occupy
half the right of way? b. Does it include costs/fees for permit requirements such as inspection cost by
the jurisdictional authorities? As a point of reference, the permit fee costs for the Flint Transmission System came out to be $5.8 million.

Comments: Meeting minutes were recorded based on the understanding of the author. Please contact the author within three days if you have any different understanding of the meeting. These minutes will be considered approved unless comments are provided within three days.
c. Does the cost of the steel pipe segments include corrosion protection measures such as anode stations and related O&M?
d. SCADA monitoring stations require power. Is the cost of bring power to the SCADA stations included? Again, as a point of reference the for the Flint Transmission System we estimated $800,000 for power to SCADA and valve operators.
13. The Flint River is identified as a backup: At what capacity? MDD or emergency supply?
14. Where did the 40 years come from (Flint hostage to Detroit)? DWSD’s new contracts are 30 years with openers to revise terms of supply (volume and pressure) after the first two years, then three years, and then in five year increments thereafter.

STATE OF MICHIGAN CONTRACT NO. 271N3200089
CITY OF FLINT WATER SUPPLY ASSESSMENT
State of Michigan, Department of Treasury
Appendix B: Cost Worksheets

Capacity Year Flint WTP O&MWater
Purchase
Revenue Bond
Payment
Interest on
Reserve TOTALFlint ADD: 0.60 MGD 81 MCF/Day 1 2013 3,538,214$ 9,585,642 - 13,123,856$
DWSD ADD: 12 MGD 1,604 MCF/Day 2 2014 3,697,788$ 10,036,167 - 13,733,955$ 3 2015 3,864,558$ 10,507,867 - 14,372,425$
Annual Volume 4 2016 4,038,850$ 11,001,736 - - 15,040,586$ Flint: 29,412 MCF 5 2017 4,221,002$ 11,518,818 - - 15,739,820$
DWSD: 585,561 MCF 6 2018 4,411,369$ 12,060,203 - - 16,471,571$ 7 2019 4,610,322$ 12,627,032 - - 17,237,354$
2013 Cost of Supply 8 2020 4,818,247$ 13,220,503 - - 18,038,750$ Flint WTP O&M: 120.30 /MCF 3,538,214$ /Yr 9 2021 5,035,550$ 13,841,866 - - 18,877,416$
DWSD: 16.37$ /MCF 9,585,642$ /Yr 10 2022 5,262,653$ 14,492,434 - - 19,755,087$ 11 2023 5,499,999$ 15,173,578 - - 20,673,577$ 12 2024 5,748,049$ 15,886,736 - - 21,634,785$
Escalation/Inflation Rate 13 2025 6,007,286$ 16,633,413 - - 22,640,699$ Flint: 4.51% /Yr 14 2026 6,278,215$ 17,415,183 - - 23,693,398$
DWSD: 4.7% /Yr 15 2027 6,561,362$ 18,233,697 - - 24,795,059$ 16 2028 6,857,279$ 19,090,681 - - 25,947,960$ 17 2029 7,166,543$ 19,987,943 - - 27,154,486$
Capital Expenditure 18 2030 7,489,754$ 20,927,376 - - 28,417,130$ Amount: -$ 19 2031 7,827,542$ 21,910,963 - - 29,738,505$ Reserve: -$ 0% Reserve Rate: 0.00% 20 2032 8,180,564$ 22,940,778 - - 31,121,342$
Amount plus Reserve: -$ 21 2033 8,549,507$ 24,018,995 - - 32,568,502$ Revenue Bond Rate: 5% 22 2034 8,935,090$ 25,147,887 - - 34,082,977$
Number of Years: 25 23 2035 9,338,063$ 26,329,838 - - 35,667,901$ Annual Cost: $0 24 2036 9,759,209$ 27,567,341 - - 37,326,550$
25 2037 10,199,350$ 28,863,006 - - 39,062,355$ 2038 10,659,340$ 30,219,567 - - 40,878,907$ 2039 11,140,076$ 31,639,886 - - 42,779,963$ 2040 11,642,494$ 33,126,961 - - 44,769,455$ 2041 12,167,570$ 34,683,928 - - 46,851,499$ 2042 12,716,328$ 36,314,073 - - 49,030,401$
216,222,171$
DWSD Worksheet : 18 MGD Maximum Day Customer with Model Contract at Potter & Baxter
25 Yrs Cummulative596,916,044$
30 Yrs Cummulative821,226,268$
$5,000,000
$10,000,000
$15,000,000
$20,000,000
$25,000,000
$30,000,000
$35,000,000
$40,000,000
$45,000,000
$50,000,000
DWSD 18 MGD Maximum Day Customer at Potter & Baxter
DWSD 18 MGD Max Day Customer at P&B
Capacity YearFlint WTP
O&MWater
Purchase
Revenue Bond
PaymentInterest on
Reserve TOTALFlint ADD: 4 MGD 535 MCF/Day 1 2013 5,895,097$ 6,367,005 - 12,262,103$
DWSD ADD: 8 MGD 1,070 MCF/Day 2 2014 6,160,966$ 6,666,255 - 12,827,221$ 3 2015 6,438,826$ 6,979,569 - 13,418,395$
Annual Volume 4 2016 6,729,217$ 7,307,608 - - 14,036,825$ Flint: 195,187 MCF 195187.1658 5 2017 7,032,705$ 7,651,066 - - 14,683,771$
DWSD: 390,374 MCF 6 2018 7,349,880$ 8,010,666 - - 15,360,546$ 5895097.471 7 2019 7,681,359$ 8,387,167 - - 16,068,527$
2013 Cost of Supply 8 2020 8,027,789$ 8,781,364 - - 16,809,153$ Flint WTP O&M: 30.20$ /MCF 5,895,097$ /Yr 9 2021 8,389,842$ 9,194,088 - - 17,583,930$
DWSD: 16.31$ /MCF 6,367,005$ /Yr 10 2022 8,768,224$ 9,626,210 - - 18,394,434$ 11 2023 9,163,671$ 10,078,642 - - 19,242,313$ 12 2024 9,576,952$ 10,552,338 - - 20,129,291$
Escalation/Inflation Rate 13 2025 10,008,873$ 11,048,298 - - 21,057,171$ Flint: 4.51% /Yr 14 2026 10,460,273$ 11,567,568 - - 22,027,841$
DWSD: 4.7% /Yr 15 2027 10,932,031$ 12,111,244 - - 23,043,275$ 16 2028 11,425,066$ 12,680,473 - - 24,105,538$ 17 2029 11,940,336$ 13,276,455 - - 25,216,791$
Capital Expenditure 18 2030 12,478,845$ 13,900,448 - - 26,379,294$ Amount: -$ 19 2031 13,041,641$ 14,553,769 - - 27,595,410$ Reserve: -$ 0% Reserve Rate: 0.00% 20 2032 13,629,819$ 15,237,796 - - 28,867,616$
Amount plus Reserve: -$ 21 2033 14,244,524$ 15,953,973 - - 30,198,497$ Revenue Bond Rate: 5% 22 2034 14,886,952$ 16,703,810 - - 31,590,762$
Number of Years: 25 23 2035 15,558,354$ 17,488,889 - - 33,047,242$ Annual Cost: $0 24 2036 16,260,035$ 18,310,866 - - 34,570,902$
25 2037 16,993,363$ 19,171,477 - - 36,164,840$ 2038 17,759,764$ 20,072,537 - - 37,832,300$ 2039 18,560,729$ 21,015,946 - - 39,576,675$ 2040 19,397,818$ 22,003,695 - - 41,401,513$ 2041 20,272,660$ 23,037,869 43,310,528$ 2042 21,186,956$ 24,120,649 45,307,605$
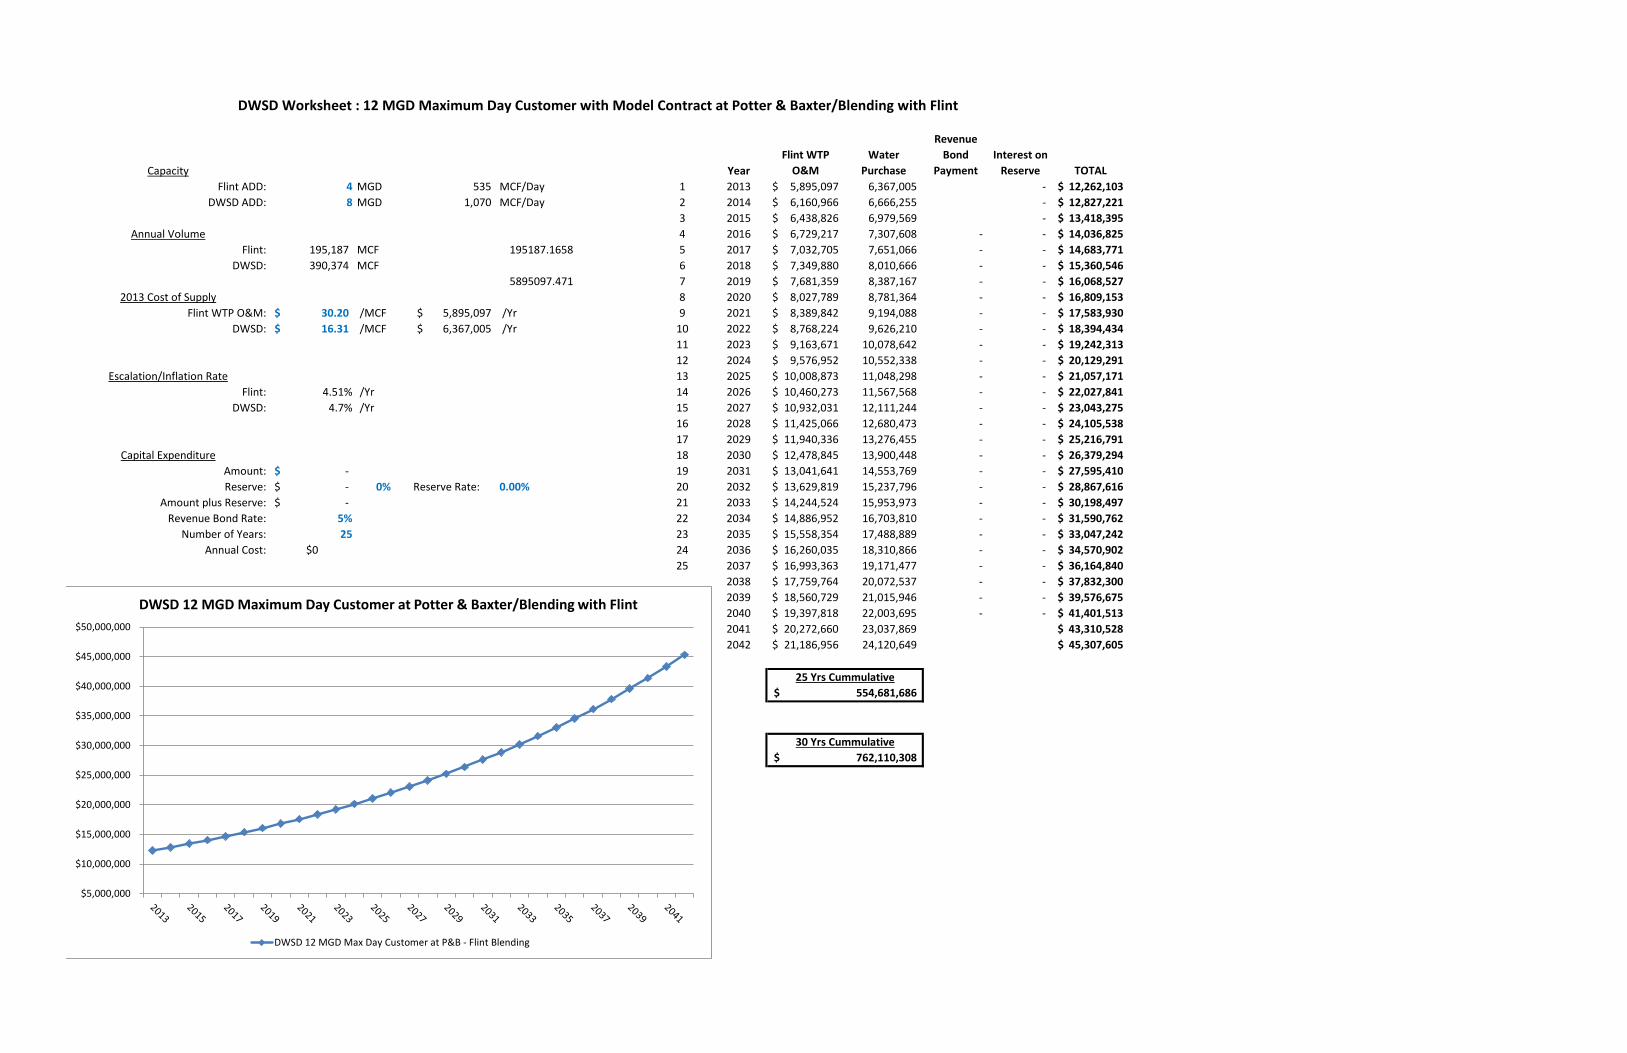
DWSD Worksheet : 12 MGD Maximum Day Customer with Model Contract at Potter & Baxter/Blending with Flint
554,681,686$ 25 Yrs Cummulative
30 Yrs Cummulative762,110,308$
$5,000,000
$10,000,000
$15,000,000
$20,000,000
$25,000,000
$30,000,000
$35,000,000
$40,000,000
$45,000,000
$50,000,000
DWSD 12 MGD Maximum Day Customer at Potter & Baxter/Blending with Flint
DWSD 12 MGD Max Day Customer at P&B - Flint Blending

Capacity YearFlint WTP
O&MWater
Purchase
Revenue Bond
PaymentInterest on
Reserve TOTALFlint ADD: 4 MGD 535 MCF/Day 1 2013 5,895,097$ 4,949,947 - 10,845,044$
DWSD ADD: 8 MGD 1,070 MCF/Day 2 2014 6,160,966$ 5,182,594 - 11,343,560$ 3 2015 6,438,826$ 5,426,176 - 11,865,002$
Annual Volume 4 2016 6,729,217$ 5,681,206 - - 12,410,423$ Flint: 195,187 MCF 5 2017 7,032,705$ 5,948,223 - - 12,980,928$
DWSD: 390,374 MCF 6 2018 7,349,880$ 6,227,789 - - 13,577,669$ 7 2019 7,681,359$ 6,520,495 - - 14,201,855$
2013 Cost of Supply 8 2020 8,027,789$ 6,826,959 - - 14,854,747$ Flint WTP O&M: 30.20$ /MCF 5,895,097$ /Yr 9 2021 8,389,842$ 7,147,826 - - 15,537,668$
DWSD: 12.68$ /MCF 4,949,947$ /Yr 10 2022 8,768,224$ 7,483,774 - - 16,251,997$ 11 2023 9,163,671$ 7,835,511 - - 16,999,182$ 12 2024 9,576,952$ 8,203,780 - - 17,780,732$
Escalation/Inflation Rate 13 2025 10,008,873$ 8,589,358 - - 18,598,230$ Flint: 4.51% /Yr 14 2026 10,460,273$ 8,993,057 - - 19,453,330$
DWSD: 4.7% /Yr 15 2027 10,932,031$ 9,415,731 - - 20,347,762$ 16 2028 11,425,066$ 9,858,271 - - 21,283,336$ 17 2029 11,940,336$ 10,321,609 - - 22,261,945$
Capital Expenditure 18 2030 12,478,845$ 10,806,725 - - 23,285,570$ Amount: -$ 19 2031 13,041,641$ 11,314,641 - - 24,356,282$ Reserve: -$ 0% Reserve Rate: 0.00% 20 2032 13,629,819$ 11,846,429 - - 25,476,248$
Amount plus Reserve: -$ 21 2033 14,244,524$ 12,403,211 - - 26,647,735$ Revenue Bond Rate: 5% 22 2034 14,886,952$ 12,986,162 - - 27,873,114$
Number of Years: 25 23 2035 15,558,354$ 13,596,512 - - 29,154,866$ Annual Cost: $0 24 2036 16,260,035$ 14,235,548 - - 30,495,583$
25 2037 16,993,363$ 14,904,619 - - 31,897,982$ 2038 17,759,764$ 15,605,136 - - 33,364,899$ 2039 18,560,729$ 16,338,577 - - 34,899,306$ 2040 19,397,818$ 17,106,490 - - 36,504,308$ 2041 20,272,660$ 17,910,495 38,183,155$ 2042 21,186,956$ 18,752,288 39,939,245$
DWSD Worksheet : 8 MGD Maximum Day Customer with Model Contract at Potter & Baxter/Blending with Flint
25 Yrs Cummulative489,780,792$
30 Yrs Cummulative672,671,705$
$5,000,000
$10,000,000
$15,000,000
$20,000,000
$25,000,000
$30,000,000
$35,000,000
$40,000,000
$45,000,000
$50,000,000
DWSD 8 MGD Maximum Day Customer at Potter & Baxter/Blending with Flint
DWSD 8 MGD Max Day Customer at P&B - Flint Blending

Capacity YearFlint WTP
O&MWater
Purchase
Revenue Bond
Payment
Interest on
Reserve TOTALFlint ADD: 4 MGD 535 MCF/Day 1 2013 5,895,097$ 5,613,583 19,500 11,489,180$
DWSD ADD: 8 MGD 1,070 MCF/Day 2 2014 6,160,966$ 5,877,421 19,500 12,018,888$ 3 2015 6,438,826$ 6,153,660 19,500 12,572,986$
Annual Volume 4 2016 6,729,217$ 6,442,882 462,610 19,500 13,615,209$ Flint: 195,187 MCF 5 2017 7,032,705$ 6,745,698 462,610 19,500 14,221,512$
DWSD: 390,374 MCF 6 2018 7,349,880$ 7,062,745 462,610 19,500 14,855,735$ 7 2019 7,681,359$ 7,394,694 462,610 19,500 15,519,164$
2013 Cost of Supply 8 2020 8,027,789$ 7,742,245 462,610 19,500 16,213,144$ Flint WTP O&M: 30.20$ /MCF 5,895,097$ /Yr 9 2021 8,389,842$ 8,106,131 462,610 19,500 16,939,082$
DWSD: 14.38$ /MCF 5,613,583$ /Yr 10 2022 8,768,224$ 8,487,119 462,610 19,500 17,698,452$ 11 2023 9,163,671$ 8,886,013 462,610 19,500 18,492,794$ 12 2024 9,576,952$ 9,303,656 462,610 19,500 19,323,718$
Escalation/Inflation Rate 13 2025 10,008,873$ 9,740,928 462,610 19,500 20,192,910$ Flint: 4.51% /Yr 14 2026 10,460,273$ 10,198,751 462,610 19,500 21,102,134$
DWSD: 4.7% /Yr 15 2027 10,932,031$ 10,678,093 462,610 19,500 22,053,234$ 16 2028 11,425,066$ 11,179,963 462,610 19,500 23,048,139$
Capital Expenditure 17 2029 11,940,336$ 11,705,421 462,610 19,500 24,088,867$ Capital: 4,700,000$ 18 2030 12,478,845$ 12,255,576 462,610 19,500 25,177,531$
Bond Issuance (3% of Total): 195,000 Check: 3.0% 19 2031 13,041,641$ 12,831,588 462,610 19,500 26,316,339$ 3 Years of Capitalized Interest: 975,000 Check: 5.0% /Yr (Bond Interest on Total) 20 2032 13,629,819$ 13,434,673 462,610 19,500 27,507,602$
Reserve (10% of Total): 650,000 Check: 10.0% 21 2033 14,244,524$ 14,066,102 462,610 19,500 28,753,736$ Total: 6,520,000$ 22 2034 14,886,952$ 14,727,209 462,610 19,500 30,057,271$
Revenue Bond Rate: 5% 23 2035 15,558,354$ 15,419,388 462,610 19,500 31,420,852$ Number of Years: 25 24 2036 16,260,035$ 16,144,099 462,610 19,500 32,847,245$
Annual Cost: $462,610 25 2037 16,993,363$ 16,902,872 462,610 19,500 34,339,345$ Interest on Reserve: 3% 2038 17,759,764$ 17,697,307 462,610 19,500 35,900,181$
2039 18,560,729$ 18,529,080 462,610 19,500 37,532,919$ 2040 19,397,818$ 19,399,947 462,610 19,500 39,240,875$ 2041 20,272,660$ 20,311,745 40,584,404$ 2042 21,186,956$ 21,266,397 42,453,353$
DWSD Worksheet : 12 MGD Maximum Day Customer with Model Contract at Imlay/Blending with Flint
25 Yrs Cummulative529,865,071$
30 Yrs Cummulative725,576,803$
$5,000,000
$10,000,000
$15,000,000
$20,000,000
$25,000,000
$30,000,000
$35,000,000
$40,000,000
$45,000,000
$50,000,000
DWSD 12 MGD Maximum Day Customer at Imlay/Blending with Flint
DWSD 12 MGD Max Day Customer at Imlay - Flint Blending

Capacity YearFlint WTP
O&MWater
Purchase
Revenue Bond
PaymentInterest on
Reserve TOTALFlint ADD: 4 MGD 535 MCF/Day 1 2013 5,895,097$ 4,337,059 19,500 10,212,656$
DWSD ADD: 8 MGD 1,070 MCF/Day 2 2014 6,160,966$ 4,540,901 19,500 10,682,367$ 3 2015 6,438,826$ 4,754,323 19,500 11,173,649$
Annual Volume 4 2016 6,729,217$ 4,977,776 462,610 19,500 12,150,103$ Flint: 195,187 MCF 5 2017 7,032,705$ 5,211,732 462,610 19,500 12,687,546$
DWSD: 390,374 MCF 6 2018 7,349,880$ 5,456,683 462,610 19,500 13,249,673$ 7 2019 7,681,359$ 5,713,147 462,610 19,500 13,837,616$
2013 Cost of Supply 8 2020 8,027,789$ 5,981,665 462,610 19,500 14,452,564$ Flint WTP O&M: 30.20$ /MCF 5,895,097$ /Yr 9 2021 8,389,842$ 6,262,803 462,610 19,500 15,095,755$
DWSD: 11.11$ /MCF 4,337,059$ /Yr 10 2022 8,768,224$ 6,557,155 462,610 19,500 15,768,489$ 11 2023 9,163,671$ 6,865,341 462,610 19,500 16,472,122$ 12 2024 9,576,952$ 7,188,012 462,610 19,500 17,208,074$
Escalation/Inflation Rate 13 2025 10,008,873$ 7,525,849 462,610 19,500 17,977,832$ Flint: 4.51% /Yr 14 2026 10,460,273$ 7,879,564 462,610 19,500 18,782,947$
DWSD: 4.7% /Yr 15 2027 10,932,031$ 8,249,903 462,610 19,500 19,625,044$ 16 2028 11,425,066$ 8,637,649 462,610 19,500 20,505,824$
Capital Expenditure 17 2029 11,940,336$ 9,043,618 462,610 19,500 21,427,064$ Capital: 4,700,000$ 18 2030 12,478,845$ 9,468,668 462,610 19,500 22,390,624$
Bond Issuance (3% of Total): 195,000 Check: 3.0% 19 2031 13,041,641$ 9,913,696 462,610 19,500 23,398,447$ 3 Years of Capitalized Interest: 975,000 Check: 5.0% /Yr (Bond Interest on Total) 20 2032 13,629,819$ 10,379,639 462,610 19,500 24,452,569$
Reserve (10% of Total): 650,000 Check: 10.0% 21 2033 14,244,524$ 10,867,482 462,610 19,500 25,555,117$ Total: 6,520,000$ 22 2034 14,886,952$ 11,378,254 462,610 19,500 26,708,316$
Revenue Bond Rate: 5% 23 2035 15,558,354$ 11,913,032 462,610 19,500 27,914,496$ Number of Years: 25 24 2036 16,260,035$ 12,472,945 462,610 19,500 29,176,090$
Annual Cost: $462,610 25 2037 16,993,363$ 13,059,173 462,610 19,500 30,495,646$ Interest on Reserve: 3% 2038 17,759,764$ 13,672,954 462,610 19,500 31,875,828$
2039 18,560,729$ 14,315,583 462,610 19,500 33,319,422$ 2040 19,397,818$ 14,988,415 462,610 19,500 34,829,343$ 2041 20,272,660$ 15,692,871 35,965,530$ 2042 21,186,956$ 16,430,436 37,617,392$
DWSD Worksheet : 8 MGD Maximum Day Customer with Model Contract at Imlay/Blending with Flint
25 Yrs Cummulative493,063,801$
30 Yrs Cummulative634,795,488$
$5,000,000
$10,000,000
$15,000,000
$20,000,000
$25,000,000
$30,000,000
$35,000,000
$40,000,000
$45,000,000
$50,000,000
DWSD 8 MGD Maximum Day Customer at Imlay/Blending with Flint
DWSD 8 MGD Max Day Customer at Imlay - Flint Blending
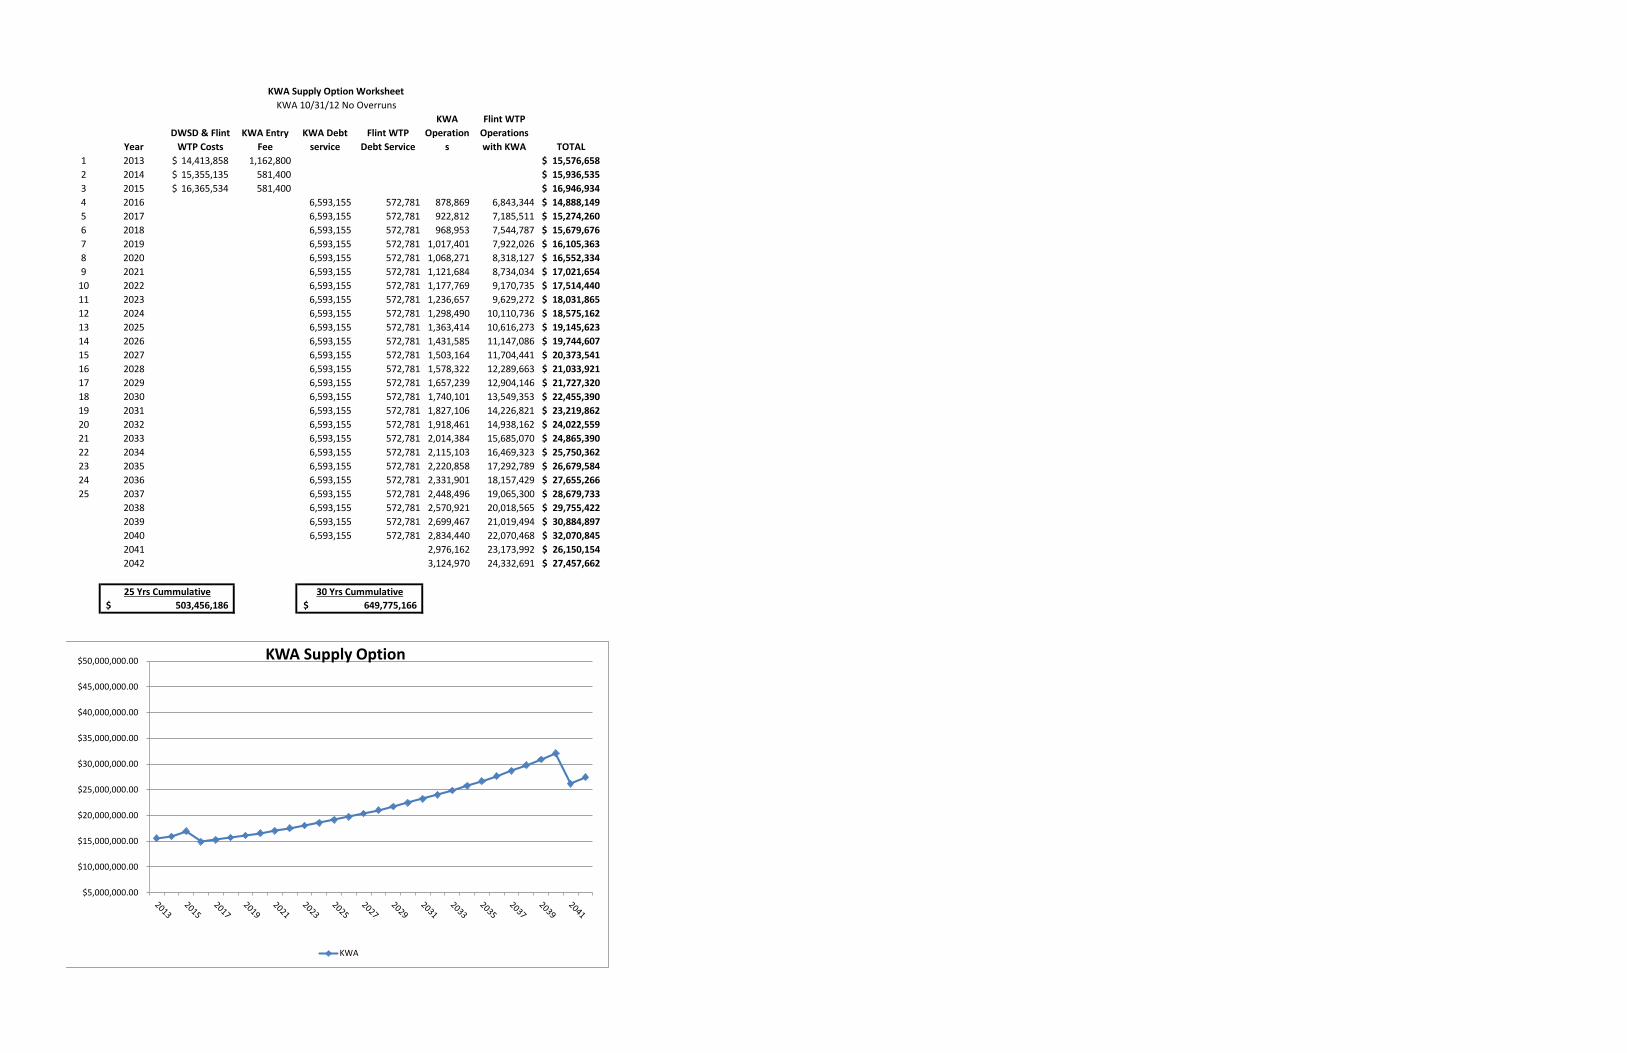
YearDWSD & Flint
WTP CostsKWA Entry
FeeKWA Debt
serviceFlint WTP
Debt Service
KWA Operation
s
Flint WTP Operations with KWA TOTAL
1 2013 14,413,858$ 1,162,800 15,576,658$ 2 2014 15,355,135$ 581,400 15,936,535$ 3 2015 16,365,534$ 581,400 16,946,934$ 4 2016 6,593,155 572,781 878,869 6,843,344 14,888,149$ 5 2017 6,593,155 572,781 922,812 7,185,511 15,274,260$ 6 2018 6,593,155 572,781 968,953 7,544,787 15,679,676$ 7 2019 6,593,155 572,781 1,017,401 7,922,026 16,105,363$ 8 2020 6,593,155 572,781 1,068,271 8,318,127 16,552,334$ 9 2021 6,593,155 572,781 1,121,684 8,734,034 17,021,654$
10 2022 6,593,155 572,781 1,177,769 9,170,735 17,514,440$ 11 2023 6,593,155 572,781 1,236,657 9,629,272 18,031,865$ 12 2024 6,593,155 572,781 1,298,490 10,110,736 18,575,162$ 13 2025 6,593,155 572,781 1,363,414 10,616,273 19,145,623$ 14 2026 6,593,155 572,781 1,431,585 11,147,086 19,744,607$ 15 2027 6,593,155 572,781 1,503,164 11,704,441 20,373,541$ 16 2028 6,593,155 572,781 1,578,322 12,289,663 21,033,921$ 17 2029 6,593,155 572,781 1,657,239 12,904,146 21,727,320$ 18 2030 6,593,155 572,781 1,740,101 13,549,353 22,455,390$ 19 2031 6,593,155 572,781 1,827,106 14,226,821 23,219,862$ 20 2032 6,593,155 572,781 1,918,461 14,938,162 24,022,559$ 21 2033 6,593,155 572,781 2,014,384 15,685,070 24,865,390$ 22 2034 6,593,155 572,781 2,115,103 16,469,323 25,750,362$ 23 2035 6,593,155 572,781 2,220,858 17,292,789 26,679,584$ 24 2036 6,593,155 572,781 2,331,901 18,157,429 27,655,266$ 25 2037 6,593,155 572,781 2,448,496 19,065,300 28,679,733$
2038 6,593,155 572,781 2,570,921 20,018,565 29,755,422$ 2039 6,593,155 572,781 2,699,467 21,019,494 30,884,897$ 2040 6,593,155 572,781 2,834,440 22,070,468 32,070,845$ 2041 2,976,162 23,173,992 26,150,154$ 2042 3,124,970 24,332,691 27,457,662$
KWA Supply Option Worksheet KWA 10/31/12 No Overruns
25 Yrs Cummulative503,456,186$
30 Yrs Cummulative649,775,166$
$5,000,000.00
$10,000,000.00
$15,000,000.00
$20,000,000.00
$25,000,000.00
$30,000,000.00
$35,000,000.00
$40,000,000.00
$45,000,000.00
$50,000,000.00 KWA Supply Option
KWA

KWA-1
Capacity YearFlint WTP
O&M Water Purchase
KWA Revenue Pre-bond Entry
Fee & Bond Payment
Flint Revenue Bond Payment
Interest on Reserve TOTAL
Flint ADD: 12 MGD 1,604 MCF/Day 1 2013 3,538,214$ 11,461,700 1,162,800 369,600 15,793,114$ KWA ADD: 12 MGD 1,604 MCF/Day 2 2014 3,697,788$ 12,034,785 581,400 369,600 15,944,373$
3 2015 3,864,558$ 12,636,524 581,400 369,600 16,712,882$ Annual Volume 4 2016 7,913,118$ 878,869 7,968,562 756,946 369,600 17,147,896$
Flint: 585,561 MCF 5 2017 8,270,000$ 922,812 7,968,562 756,946 369,600 17,548,721$ KWA: 585,561 MCF 6 2018 8,642,977$ 968,953 7,968,562 756,946 369,600 17,967,838$
7 2019 9,032,775$ 1,017,401 7,968,562 756,946 369,600 18,406,084$ 2016 Cost of Supply 8 2020 9,440,153$ 1,068,271 7,968,562 756,946 369,600 18,864,332$
Flint WTP O&M: 13.51 /MCF 7,913,118$ /Yr 9 2021 9,865,904$ 1,121,684 7,968,562 756,946 369,600 19,343,497$ KWA: 1.50$ /MCF 878,869$ /Yr 10 2022 10,310,857$ 1,177,769 7,968,562 756,946 369,600 19,844,533$
11 2023 10,775,876$ 1,236,657 7,968,562 756,946 369,600 20,368,441$ 12 2024 11,261,868$ 1,298,490 7,968,562 756,946 369,600 20,916,266$
Escalation/Inflation Rate 13 2025 11,769,779$ 1,363,414 7,968,562 756,946 369,600 21,489,101$ Flint: 4.51% /Yr 14 2026 12,300,596$ 1,431,585 7,968,562 756,946 369,600 22,088,089$ KWA: 5.0% /Yr 15 2027 12,855,352$ 1,503,164 7,968,562 756,946 369,600 22,714,425$
16 2028 13,435,129$ 1,578,322 7,968,562 756,946 369,600 23,369,359$ Capital Expenditure 17 2029 14,041,053$ 1,657,239 7,968,562 756,946 369,600 24,054,200$
18 2030 14,674,305$ 1,740,101 7,968,562 756,946 369,600 24,770,313$ Capital: 272,421,558$ 19 2031 15,336,116$ 1,827,106 7,968,562 756,946 369,600 25,519,130$
Bond Issuance (2.25% of Total): 8,440,000 Check: 2.25% 20 2032 16,027,775$ 1,918,461 7,968,562 756,946 369,600 26,302,144$ 3 Years of Capitalized Interest: 56,000,000 Check: 5.0% /Yr (Bond Interest on Total) 21 2033 16,750,627$ 2,014,384 7,968,562 756,946 369,600 27,120,919$
Reserve (10% of Total): 37,500,000 Check: 10.0% 22 2034 17,506,080$ 2,115,103 7,968,562 756,946 369,600 27,977,092$ Total: 374,361,558$ 23 2035 18,295,605$ 2,220,858 7,968,562 756,946 369,600 28,872,371$
Flint's Share (30%) 112,308,467$ 24 2036 19,120,737$ 2,331,901 7,968,562 756,946 369,600 29,808,546$ Revenue Bond Rate: 5% 25 2037 19,983,082$ 2,448,496 7,968,562 756,946 369,600 30,787,486$
Number of Years: 25 2038 20,884,319$ 2,570,921 7,968,562 756,946 369,600 31,811,148$ Annual Cost: $7,968,562 2039 21,826,201$ 2,699,467 7,968,562 756,946 369,600 32,881,577$
Interest on Reserve: 3% 2040 22,810,563$ 2,834,440 7,968,562 756,946 369,600 34,000,912$ 2041 23,839,320$ 2,976,162 26,815,482$
Capital: 7,758,362$ 2042 24,914,473$ 3,124,970 28,039,443$ Bond Issuance (3% of Total): 240,000 Check: 2.25%
3 Years of Capitalized Interest: 1,600,000 Check: 5.0% /Yr (Bond Interest on Total)Reserve (10% of Total): 1,070,000 Check: 10.0%
Total: 10,668,362$ Revenue Bond Rate: 5%
Number of Years: 25Annual Cost: $756,946
Interest on Reserve: 3%
707,279,715$
KWA Supply Option Worksheet
25 Yrs Cummulative553,731,153$
30 Yrs Cummulative
$5,000,000.00
$10,000,000.00
$15,000,000.00
$20,000,000.00
$25,000,000.00
$30,000,000.00
$35,000,000.00
$40,000,000.00
$45,000,000.00
$50,000,000.00 KWA Supply Option
KWA Supply
David Guastella:Flint buys water from DWSD for three years during KWA construction at current rate (assume 5% increase each year)
David Guastella:Assumes Bond Issuance and Reserver are not included
David Guastella:Increased by 3%/Yr to 2012 $'s
David Guastella:Highlighted portion is Flint's Entry Fee to KWA
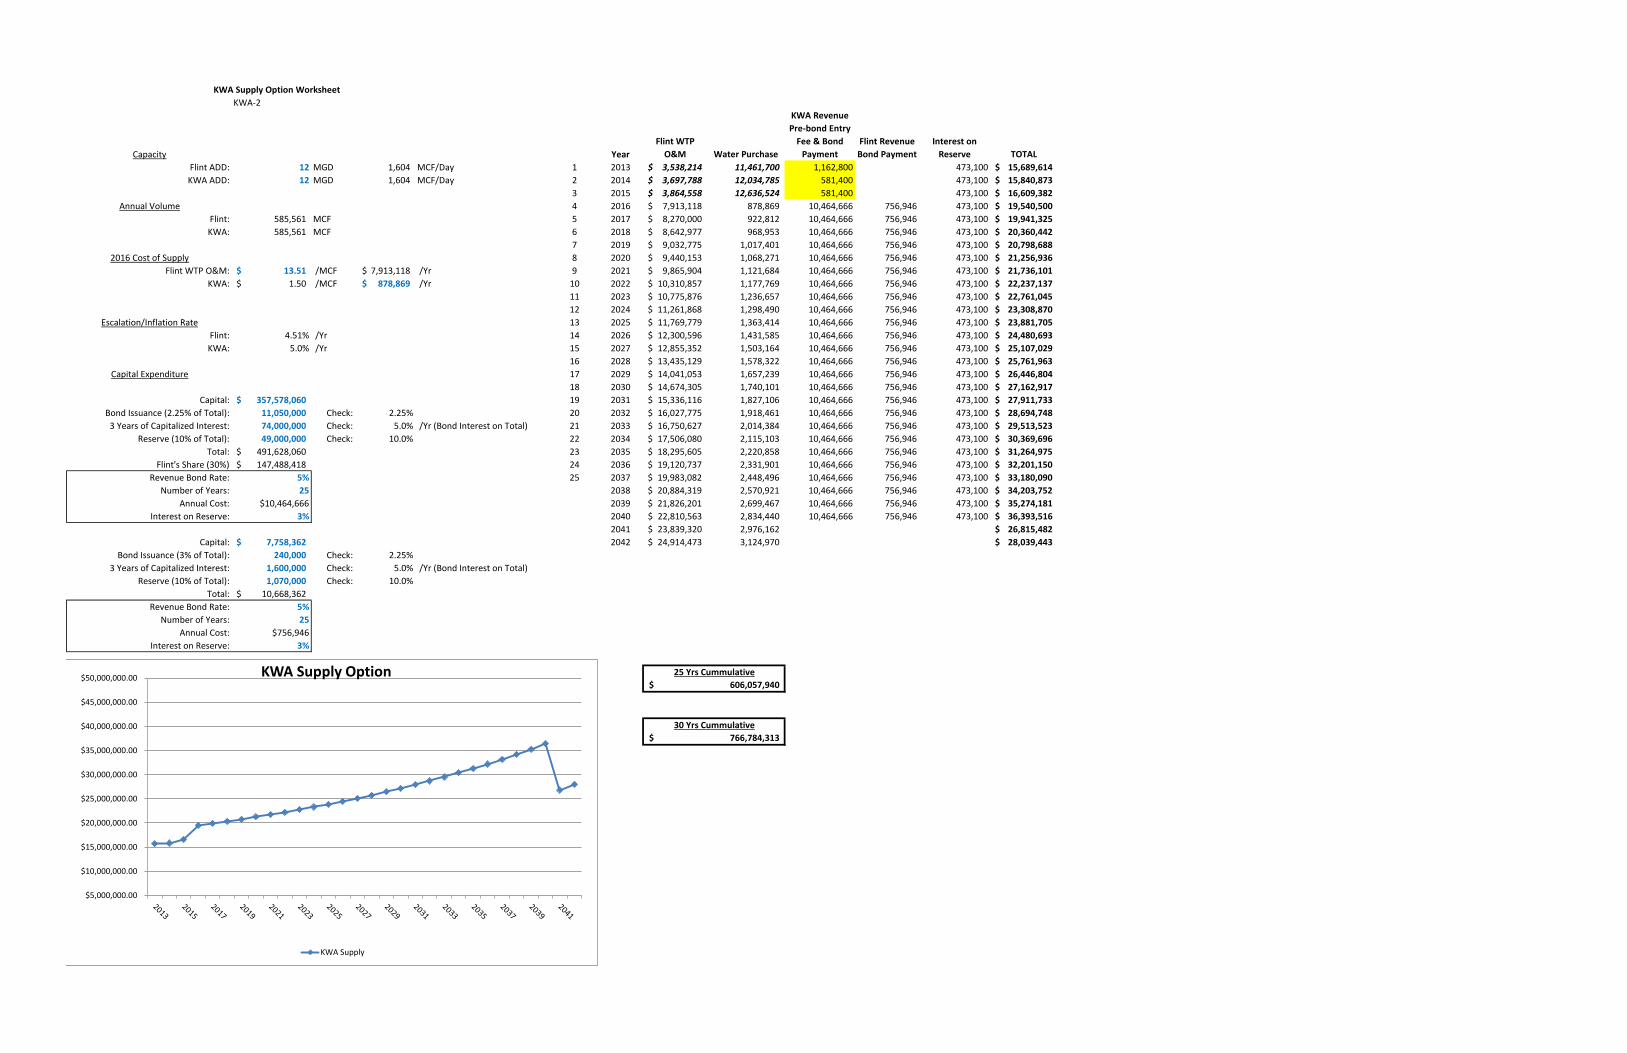
KWA-2
Capacity YearFlint WTP
O&M Water Purchase
KWA Revenue Pre-bond Entry
Fee & Bond Payment
Flint Revenue Bond Payment
Interest on Reserve TOTAL
Flint ADD: 12 MGD 1,604 MCF/Day 1 2013 3,538,214$ 11,461,700 1,162,800 473,100 15,689,614$ KWA ADD: 12 MGD 1,604 MCF/Day 2 2014 3,697,788$ 12,034,785 581,400 473,100 15,840,873$
3 2015 3,864,558$ 12,636,524 581,400 473,100 16,609,382$ Annual Volume 4 2016 7,913,118$ 878,869 10,464,666 756,946 473,100 19,540,500$
Flint: 585,561 MCF 5 2017 8,270,000$ 922,812 10,464,666 756,946 473,100 19,941,325$ KWA: 585,561 MCF 6 2018 8,642,977$ 968,953 10,464,666 756,946 473,100 20,360,442$
7 2019 9,032,775$ 1,017,401 10,464,666 756,946 473,100 20,798,688$ 2016 Cost of Supply 8 2020 9,440,153$ 1,068,271 10,464,666 756,946 473,100 21,256,936$
Flint WTP O&M: 13.51$ /MCF 7,913,118$ /Yr 9 2021 9,865,904$ 1,121,684 10,464,666 756,946 473,100 21,736,101$ KWA: 1.50$ /MCF 878,869$ /Yr 10 2022 10,310,857$ 1,177,769 10,464,666 756,946 473,100 22,237,137$
11 2023 10,775,876$ 1,236,657 10,464,666 756,946 473,100 22,761,045$ 12 2024 11,261,868$ 1,298,490 10,464,666 756,946 473,100 23,308,870$
Escalation/Inflation Rate 13 2025 11,769,779$ 1,363,414 10,464,666 756,946 473,100 23,881,705$ Flint: 4.51% /Yr 14 2026 12,300,596$ 1,431,585 10,464,666 756,946 473,100 24,480,693$ KWA: 5.0% /Yr 15 2027 12,855,352$ 1,503,164 10,464,666 756,946 473,100 25,107,029$
16 2028 13,435,129$ 1,578,322 10,464,666 756,946 473,100 25,761,963$ Capital Expenditure 17 2029 14,041,053$ 1,657,239 10,464,666 756,946 473,100 26,446,804$
18 2030 14,674,305$ 1,740,101 10,464,666 756,946 473,100 27,162,917$ Capital: 357,578,060$ 19 2031 15,336,116$ 1,827,106 10,464,666 756,946 473,100 27,911,733$
Bond Issuance (2.25% of Total): 11,050,000 Check: 2.25% 20 2032 16,027,775$ 1,918,461 10,464,666 756,946 473,100 28,694,748$ 3 Years of Capitalized Interest: 74,000,000 Check: 5.0% /Yr (Bond Interest on Total) 21 2033 16,750,627$ 2,014,384 10,464,666 756,946 473,100 29,513,523$
Reserve (10% of Total): 49,000,000 Check: 10.0% 22 2034 17,506,080$ 2,115,103 10,464,666 756,946 473,100 30,369,696$ Total: 491,628,060$ 23 2035 18,295,605$ 2,220,858 10,464,666 756,946 473,100 31,264,975$
Flint's Share (30%) 147,488,418$ 24 2036 19,120,737$ 2,331,901 10,464,666 756,946 473,100 32,201,150$ Revenue Bond Rate: 5% 25 2037 19,983,082$ 2,448,496 10,464,666 756,946 473,100 33,180,090$
Number of Years: 25 2038 20,884,319$ 2,570,921 10,464,666 756,946 473,100 34,203,752$ Annual Cost: $10,464,666 2039 21,826,201$ 2,699,467 10,464,666 756,946 473,100 35,274,181$
Interest on Reserve: 3% 2040 22,810,563$ 2,834,440 10,464,666 756,946 473,100 36,393,516$ 2041 23,839,320$ 2,976,162 26,815,482$
Capital: 7,758,362$ 2042 24,914,473$ 3,124,970 28,039,443$ Bond Issuance (3% of Total): 240,000 Check: 2.25%
3 Years of Capitalized Interest: 1,600,000 Check: 5.0% /Yr (Bond Interest on Total)Reserve (10% of Total): 1,070,000 Check: 10.0%
Total: 10,668,362$ Revenue Bond Rate: 5%
Number of Years: 25Annual Cost: $756,946
Interest on Reserve: 3%
766,784,313$
KWA Supply Option Worksheet
25 Yrs Cummulative606,057,940$
30 Yrs Cummulative
$5,000,000.00
$10,000,000.00
$15,000,000.00
$20,000,000.00
$25,000,000.00
$30,000,000.00
$35,000,000.00
$40,000,000.00
$45,000,000.00
$50,000,000.00 KWA Supply Option
KWA Supply
![버물리키드크림 설명서(201512) [변환됨] · 2017-07-27 · Title: 버물리키드크림 설명서(201512) [변환됨] Created Date: 3/10/2016 11:59:01 AM](https://img.pdfslide.us/doc/110x75/5fa2250be3773e1ff75b72b2/eeeeoee-eoe201512-ee-2017-07-27-title-eeeeoee.jpg)


![Presentation_Goodman's approach to real estate [Goodman | 201512]](https://img.pdfslide.us/doc/110x75/5695cf8d1a28ab9b028e9120/presentationgoodmans-approach-to-real-estate-goodman-201512.jpg)