Embed Size (px)
Citation preview

City of Cookeville Major Street Plan Update
EXISTING ROADWAY LEVEL OF SERVICE
June 2017

i Cookeville Major Street Plan Update: Existing LOS
Table of Contents 1. Introduction .......................................................................................................................................... 1
2. Data Collection ...................................................................................................................................... 1
3. Roadway Segment Level of Service Analysis......................................................................................... 1
3.1. Methodology ................................................................................................................................. 1
3.2. LOS Results .................................................................................................................................... 2
4. Growth Rate Methodology ................................................................................................................. 10
List of Tables Table 1: Existing LOS (2015) by Roadway Segment, Compared to 2003 MRTP ............................................ 4
Table 2: Annual Growth Rate Based on Historical Traffic Counts ................................................................. 9
List of Figures Figure 1: Florida DOT Generalized Service Volumes (figure referenced in Cookeville 2003 MRTP) ............ 1
Figure 2: Existing LOS (2015) by Roadway Segment ..................................................................................... 3

1 Cookeville Major Street Plan Update: Existing LOS
1. IntroductionPart of the update to the City’s Major Street Plan involves estimating the current level of service (LOS) for
each functionally classified road. This technical memo discusses data collection, the analysis method
used, and recommends an annual growth rate to be applied to existing traffic volumes to forecast future
year traffic. It then presents updated roadway LOS for existing conditions (2015) and compares those
values to the LOS projections developed for the 2003 Cookeville Major Route Transportation Plan.
2. Data CollectionAverage Annual Daily Traffic (AADT) counts were obtained from Tennessee Department of Transportation
(TDOT) traffic history1 and supplemented with AADT counts performed by the City of Cookeville. The most
recent traffic counts are from 2015. Along some segments, data at multiple count locations was available.
To be conservative, the highest count available was used. The growth rates assumed for projecting future
year AADT (see “Growth Rate Methodology” section below) were applied to any counts that were
collected prior to 2015 to grow them to 2015 volumes. This analysis used the highest volume along a
segment when more than one AADT count was available.
3. Roadway Segment Level of Service Analysis3.1. Methodology The methods used to calculate LOS for the 2003 MRTP were reviewed with the goal of using a comparable
approach so that values could be compared between the old and new plans.
The 2003 MRTP used 2002 traffic volumes to determine segment LOS values along street and roadway
segments throughout Cookeville. The 2002 traffic volumes were projected to what were then future years
of 2007 and 2027, and LOS values were determined for each of these two horizon years. Roadway
segment LOS was estimated based on using the Florida Department of Transportation (FDOT) generalized
planning methodology. The thresholds for the tables referenced in 2003 are shown graphically in Figure
1. As shown in the figure, link level of service values were determined using the number of lanes, signal
spacing, and the link volume as inputs.
Figure 1: FDOT Generalized Service Volumes (figure referenced in Cookeville 2003 MRTP)
1 https://www.tdot.tn.gov/APPLICATIONS/traffichistory
2 Cookeville Major Street Plan Update: Existing LOS
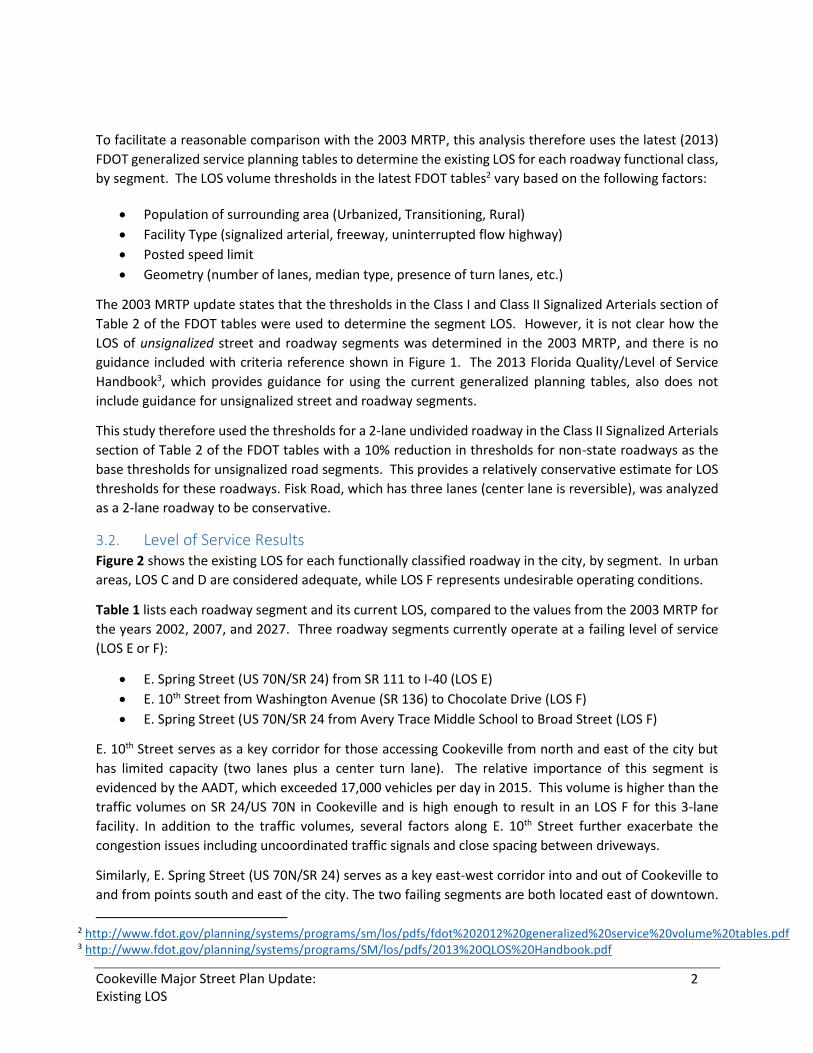
To facilitate a reasonable comparison with the 2003 MRTP, this analysis therefore uses the latest (2013)
FDOT generalized service planning tables to determine the existing LOS for each roadway functional class,
by segment. The LOS volume thresholds in the latest FDOT tables2 vary based on the following factors:
Population of surrounding area (Urbanized, Transitioning, Rural)
Facility Type (signalized arterial, freeway, uninterrupted flow highway)
Posted speed limit
Geometry (number of lanes, median type, presence of turn lanes, etc.)
The 2003 MRTP update states that the thresholds in the Class I and Class II Signalized Arterials section of
Table 2 of the FDOT tables were used to determine the segment LOS. However, it is not clear how the
LOS of unsignalized street and roadway segments was determined in the 2003 MRTP, and there is no
guidance included with criteria reference shown in Figure 1. The 2013 Florida Quality/Level of Service
Handbook3, which provides guidance for using the current generalized planning tables, also does not
include guidance for unsignalized street and roadway segments.
This study therefore used the thresholds for a 2-lane undivided roadway in the Class II Signalized Arterials
section of Table 2 of the FDOT tables with a 10% reduction in thresholds for non-state roadways as the
base thresholds for unsignalized road segments. This provides a relatively conservative estimate for LOS
thresholds for these roadways. Fisk Road, which has three lanes (center lane is reversible), was analyzed
as a 2-lane roadway to be conservative.
3.2. Level of Service Results Figure 2 shows the existing LOS for each functionally classified roadway in the city, by segment. In urban
areas, LOS C and D are considered adequate, while LOS F represents undesirable operating conditions.
Table 1 lists each roadway segment and its current LOS, compared to the values from the 2003 MRTP for
the years 2002, 2007, and 2027. Three roadway segments currently operate at a failing level of service
(LOS E or F):
E. Spring Street (US 70N/SR 24) from SR 111 to I-40 (LOS E)
E. 10th Street from Washington Avenue (SR 136) to Chocolate Drive (LOS F)
E. Spring Street (US 70N/SR 24 from Avery Trace Middle School to Broad Street (LOS F)
E. 10th Street serves as a key corridor for those accessing Cookeville from north and east of the city but
has limited capacity (two lanes plus a center turn lane). The relative importance of this segment is
evidenced by the AADT, which exceeded 17,000 vehicles per day in 2015. This volume is higher than the
traffic volumes on SR 24/US 70N in Cookeville and is high enough to result in an LOS F for this 3-lane
facility. In addition to the traffic volumes, several factors along E. 10th Street further exacerbate the
congestion issues including uncoordinated traffic signals and close spacing between driveways.
Similarly, E. Spring Street (US 70N/SR 24) serves as a key east-west corridor into and out of Cookeville to
and from points south and east of the city. The two failing segments are both located east of downtown.
2 http://www.fdot.gov/planning/systems/programs/sm/los/pdfs/fdot%202012%20generalized%20service%20volume%20tables.pdf 3 http://www.fdot.gov/planning/systems/programs/SM/los/pdfs/2013%20QLOS%20Handbook.pdf
3 Cookeville Major Street Plan Update: Existing LOS
The segment operating at LOS F, just east of downtown, has seen an increase of 1,800 vehicles per day in
traffic volume since the 2003 MRTP report, which also documented this segment as operating at LOS F.
Since the 2003 report was completed, this segment has been widened for a short distance to provide a
center turn amidst multi-family residential and commercial driveways; however, the analysis still shows
the segment operating at LOS F. The segment operating at LOS E is a two-lane segment with limited right
or left-turn lanes that serves primarily suburban and semi-rural land uses.
As part of the existing conditions analysis it was noted that a reversible lane operation exists on Fisk Road
between E. 10th Street and Shag Rag Road. A safety analysis of this segment determined that there is
presently no significant crash history along this segment. However, as traffic on this roadway segment
continues to increase this segment should be monitored to ensure that it continues to operate safely.
Details of the crash history and safety analysis can be found in the Safety Report.

4 Cookeville Major Street Plan Update - Existing LOS
Figure 2: Existing LOS (2015) by Roadway Segment

Table 1: Existing LOS (2015) by Roadway Segment, Compared to 2003 MRTP
2002 AADT2002LOS
Projected2007 LOS
Projected2027 LOS
1st Street West Cedar Ave Walnut Ave Minor Collector 4,200 C1st Street East Willow Ave Cedar Ave Minor Collector 948 C
4th Street West Broad St Whitney Ave Minor Collector 1,966 C 1,525 B B B
6th Street East Washington Ave Fisk Rd Minor Collector 1967* C 1,334 B B B
7th Street Willow Ave Dixie Ave Major Collector 8,414 D 8,711 D D F7th Street West Franklin Ave Willow Ave Minor Collector 3,523 C 2,778 B B C
9th Street East Dixie Ave Washington Ave Minor Collector need counts9th Street West/Crescent Drive Broad St Willow Ave Minor Collector 3,083 C 2,360
10th Street East Washington Ave Chocolate Major Arterial 17,505 F 14,127 D E F10th Street East Chocolate City Limits Major Arterial 13,907 D 12,536 B B B
12th Street (SR 290) City Limits Franklin Ave Minor Arterial need counts 7,500 C C D12th Street (SR 290) Franklin Ave Willow Ave Minor Arterial 9,283 C 8,272 B B B12th Street Willow Ave Mississippi Ave Minor Arterial 13796* D 7,157 C C C12th Street Mississippi Ave Washington Ave Minor Arterial 10,116 D 5,093 C C C
15th Street East Washington Ave Brown Ave Minor Arterial 1,677 C 1,369 B B B
20th Street East Washington Ave Summerfield Rd Minor Collector 3,232 C 2,851 B B C
Bill Smith Road / Foreman Drive Holladay Rd Willow Ave Major Collector 4,936 D 4,386 C C C
Broad Street / US 70N City Limits Jackson St Major Arterial 7,789 C 8,588 C C FBroad Street / US 70N Jackson St Spring St Major Arterial 7,789 C 8,588 C C FBroad Street Spring St Cedar Ave Major Collector 6,687 D 6,171 C C CBroad Street Cedar Ave Washington Ave Major Collector 6992* D 7,030 D D DBroad Street Washington Ave Spring Extension Major Collector 7941* D 7,568 C C DBroad Street Spring Extension US 111 Major Collector 5,461 D 4,300 C C CBroad Street / Buck Mt. Road US 111 City Limits Major Collector 4,750 D 3,248 C C C
Brown Avenue 10th St. Jere Whitson Rd Minor Collector 2,646 C 2,531 B B C
ToFromStreet Name
FROM 2003 MRTP
2015 LOS2015 AADTClass
*AADT value was forecasted from 2013 AADT value**AADT value was forecasted from 2012 AADT value***AADT value was forecasted from 2007 AADT value 1/5
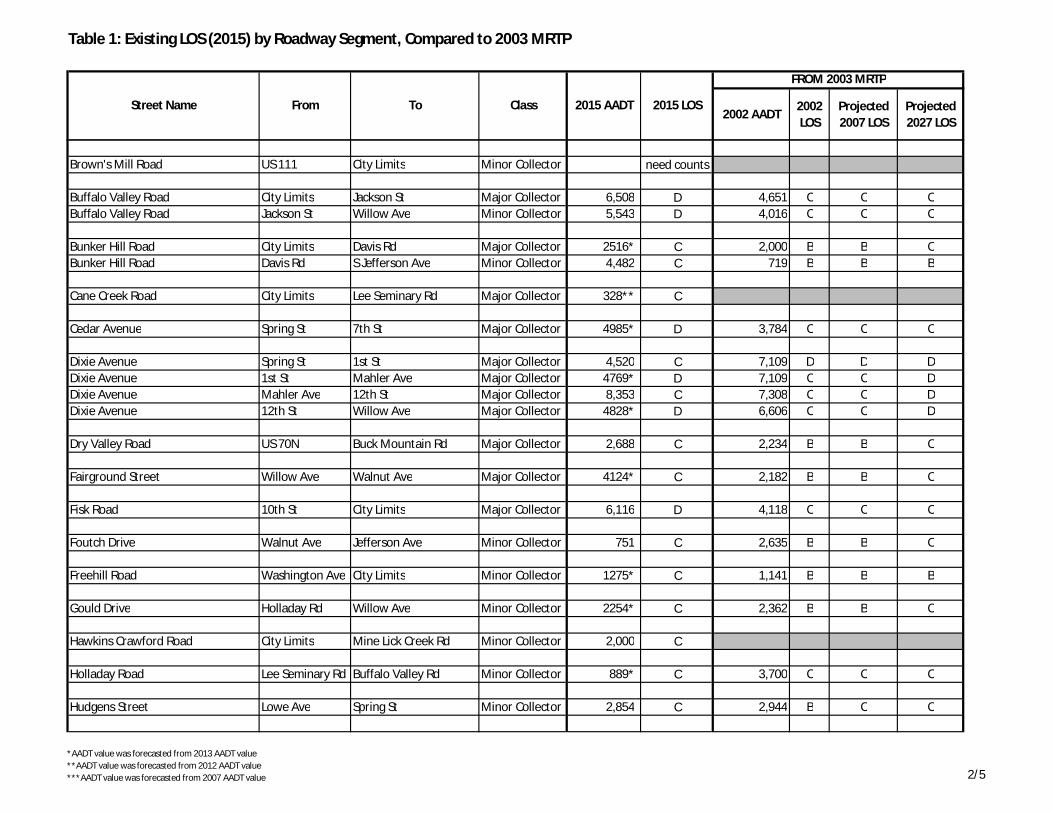
Table 1: Existing LOS (2015) by Roadway Segment, Compared to 2003 MRTP
2002 AADT2002LOS
Projected2007 LOS
Projected2027 LOS
ToFromStreet Name
FROM 2003 MRTP
2015 LOS2015 AADTClass
Brown's Mill Road US 111 City Limits Minor Collector need counts
Buffalo Valley Road City Limits Jackson St Major Collector 6,508 D 4,651 C C CBuffalo Valley Road Jackson St Willow Ave Minor Collector 5,543 D 4,016 C C C
Bunker Hill Road City Limits Davis Rd Major Collector 2516* C 2,000 B B CBunker Hill Road Davis Rd S Jefferson Ave Minor Collector 4,482 C 719 B B B
Cane Creek Road City Limits Lee Seminary Rd Major Collector 328** C
Cedar Avenue Spring St 7th St Major Collector 4985* D 3,784 C C C
Dixie Avenue Spring St 1st St Major Collector 4,520 C 7,109 D D DDixie Avenue 1st St Mahler Ave Major Collector 4769* D 7,109 C C DDixie Avenue Mahler Ave 12th St Major Collector 8,353 C 7,308 C C DDixie Avenue 12th St Willow Ave Major Collector 4828* D 6,606 C C D
Dry Valley Road US 70N Buck Mountain Rd Major Collector 2,688 C 2,234 B B C
Fairground Street Willow Ave Walnut Ave Major Collector 4124* C 2,182 B B C
Fisk Road 10th St City Limits Major Collector 6,116 D 4,118 C C C
Foutch Drive Walnut Ave Jefferson Ave Minor Collector 751 C 2,635 B B C
Freehill Road Washington Ave City Limits Minor Collector 1275* C 1,141 B B B
Gould Drive Holladay Rd Willow Ave Minor Collector 2254* C 2,362 B B C
Hawkins Crawford Road City Limits Mine Lick Creek Rd Minor Collector 2,000 C
Holladay Road Lee Seminary Rd Buffalo Valley Rd Minor Collector 889* C 3,700 C C C
Hudgens Street Lowe Ave Spring St Minor Collector 2,854 C 2,944 B C C
*AADT value was forecasted from 2013 AADT value**AADT value was forecasted from 2012 AADT value***AADT value was forecasted from 2007 AADT value 2/5

Table 1: Existing LOS (2015) by Roadway Segment, Compared to 2003 MRTP
2002 AADT2002LOS
Projected2007 LOS
Projected2027 LOS
ToFromStreet Name
FROM 2003 MRTP
2015 LOS2015 AADTClass
Interstate Drive Willow Ave Jefferson Ave Major Arterial 15,197 D 12,929 B B B
Jackson Street Broad St Cane Creek Elementary Major Arterial 10,132 C 8,138 B B BJackson Street Cane Creek ElementaryBuffalo Valley Rd Major Arterial 11,161 C 9,088 C C CJackson Street Buffalo Valley Rd Willow Ave Major Arterial 18,260 D 11,281 C C CJackson Street Willow Ave Scott Ave Minor Arterial 13182*** D 13,117 D D DJackson Street Scott Ave Walnut Ave Minor Arterial 13,048 D 13,117 D D EJackson Street Walnut Ave Jefferson Ave Minor Arterial 13,246 D 13,117 B B B
Jefferson Avenue City Limits US 111 NB Ramps Minor Collector 2,598 C 2,427 B B CJefferson Avene (SR 136) US 111 NB RampsDavis Rd Major Arterial 11,270 C 13,331 D D FJefferson Avene (SR 136) Davis Rd Bunker Hill Rd Major Arterial 14,836 C 13,331 B B CJefferson Avene (SR 136) Bunker Hill Rd I-40 Major Arterial 14,836 C 13,331 D D DJefferson Avene (SR 136) I-40 Stevens St Major Arterial 24,357 D 25,551 D D FJefferson Avene (SR 136) Stevens St Spring St Major Arterial 15,138 D 15,280 D D FJefferson Avenue Spring St 1st St Minor Collector 7874*** D 1,924 C C CJefferson Avenue 1st St 7th St Minor Collector 2221* C 2,060 B B CJefferson Avenue 7th St 10th St Minor Collector 5,870 D 4,828 C C C
Jere Whitson Road Willow Ave Brown Ave Minor Collector 4184* C 4,166 C C C
Lee Seminary Road Bennett Rd Holladay Rd Minor Collector 910 CLee Seminary Road Holladay Rd Burgess Falls Rd Minor Collector 1,063 C
Lovelady Road City Limits Jefferson Ave Minor Collector 441 C 533 B B B
Lowe Avenue Jackson St Spring St Minor Arterial 11048*** D 11,870 D D D
Mahler Avenue 1st St 6th St Major Collector 4,209 C 2,702 B B CMahler Avenue 6th St Dixie Ave Major Collector 4,209 C 2,702 B B C
Maple Avenue 10th St Broad St Major Collector 6154** D 2,983 B C CMaple Avenue Broad St Hudgens St Major Collector 4602* C 1,392 BMaple Avenue Hudgens St Veterans Dr Major Collector 3,647 C 2,123 B B CMaple Avenue Veterans Dr I-40 Overpass Minor Collector 4,204 C 2,196 B B BMaple Avenue I-40 Overpass US 111 Minor Collector 2,626 C 3,517 C C C
*AADT value was forecasted from 2013 AADT value**AADT value was forecasted from 2012 AADT value***AADT value was forecasted from 2007 AADT value 3/5

Table 1: Existing LOS (2015) by Roadway Segment, Compared to 2003 MRTP
2002 AADT2002LOS
Projected2007 LOS
Projected2027 LOS
ToFromStreet Name
FROM 2003 MRTP
2015 LOS2015 AADTClass
Mine Lick Creek Road City Limits Holladay Rd Minor Collector 1148* C
Neal Street Jefferson Ave Spring St Major Arterial 14,630 D 11,269 B B B
Old Kentucky Road Spring St 10th St Major Collector 7,732 D 5,701 C C C
Pigeon Roost Creek Road City Limits Jefferson Ave Minor Collector 1,127 C 1,247 B B B
Scott Avenue Jackson St Spring St Minor Collector 3797* C 2,827 C C C
Summerfield Road / Shag Rag Road Fisk Rd City Limits Minor Collector 1,579 C 1,712 B B B
Shipley Road City Limits Willow Ave Minor Collector 2382* C 2,343 B B C
Stevens Street Willow Ave Maple Avenue Minor Collector 4,478 C 3,369 C C C
Veterans Drive Walnut Ave Neal St Minor Collector 8,255 D 5,068 C C C
Walnut Avenue Broad St Interstate Dr Major Collector 8,931 D 4,845 C C CWalnut Avenue Interstate Dr Jefferson Ave Minor Collector 5,879 D 4,056 D D D
N Washington Ave (SR 136) Spring St Broad Ave Major Arterial 10301*** D 12,495 E E FN Washington Ave (SR 136) Broad Ave 1st St Major Arterial 11,523 D 12,495 C C CN Washington Ave (SR 136) 1st St 10th St Major Arterial 16,640 D 13,484 D E FN Washington Ave (SR 136) 10th St 15 St/17th* Major Arterial 15,256 D 9,446 B B BN Washington Ave (SR 136) 15 St/17th Whitaker Springs Major Arterial 9660* D 5,582 D D DN Washington Ave (SR 136) Whitaker Springs City Limits Minor Arterial 4,867 C 5,671 C C C
N Willow Ave (SR 135) Dixie Ave 12th St Major Arterial 8,495 D 7,711 C C EN Willow Ave (SR 135) 12th St Broad St Major Arterial 16,076 D 15,361 C C FS Willow Ave (SR 135) Broad St I-40 Major Arterial 24,690 C 23,878 C D FS Willow Ave (SR 135) I-40 City Limits Major Arterial 14,925 C 14,943 F F F
*AADT value was forecasted from 2013 AADT value**AADT value was forecasted from 2012 AADT value***AADT value was forecasted from 2007 AADT value 4/5

Table 1: Existing LOS (2015) by Roadway Segment, Compared to 2003 MRTP
2002 AADT2002LOS
Projected2007 LOS
Projected2027 LOS
ToFromStreet Name
FROM 2003 MRTP
2015 LOS2015 AADTClass
Spring St East (US 70N) City Limits I-40 Major Arterial 8,623 C 8,170 C C FSpring St East (US 70N) I-40 US 111 Major Arterial 11,256 ESpring St East (US 70N) US 111 Old Kentucky Rd Major Arterial 17,034 C 12,294 D D DSpring St East (US 70N) Old Kentucky Rd School Major Arterial 13,802 C 13,495 D D FSpring St East (US 70N) School Split Major Arterial 15269* F 13,495 F F FSpring St East (US 70N) Split Walnut Ave Major Arterial 10,760 D 10,312 D D FSpring St East (US 70N) Walnut Ave Broad St Major Arterial 8,341 D 8,415 C C D
*AADT value was forecasted from 2013 AADT value**AADT value was forecasted from 2012 AADT value***AADT value was forecasted from 2007 AADT value 5/5
10 Cookeville Major Street Plan Update - Existing LOS
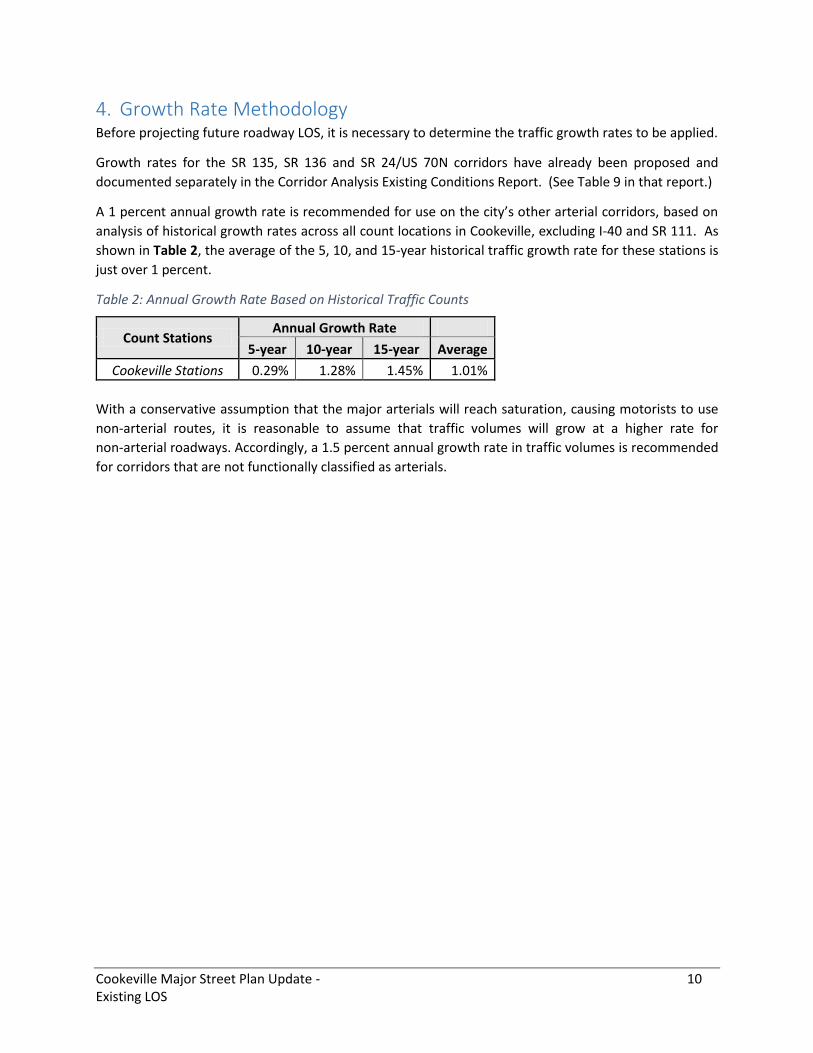
4. Growth Rate MethodologyBefore projecting future roadway LOS, it is necessary to determine the traffic growth rates to be applied.
Growth rates for the SR 135, SR 136 and SR 24/US 70N corridors have already been proposed and
documented separately in the Corridor Analysis Existing Conditions Report. (See Table 9 in that report.)
A 1 percent annual growth rate is recommended for use on the city’s other arterial corridors, based on
analysis of historical growth rates across all count locations in Cookeville, excluding I-40 and SR 111. As
shown in Table 2, the average of the 5, 10, and 15-year historical traffic growth rate for these stations is
just over 1 percent.
Table 2: Annual Growth Rate Based on Historical Traffic Counts
Count Stations Annual Growth Rate
5-year 10-year 15-year Average
Cookeville Stations 0.29% 1.28% 1.45% 1.01%
With a conservative assumption that the major arterials will reach saturation, causing motorists to use
non-arterial routes, it is reasonable to assume that traffic volumes will grow at a higher rate for
non-arterial roadways. Accordingly, a 1.5 percent annual growth rate in traffic volumes is recommended
for corridors that are not functionally classified as arterials.