Embed Size (px)
Citation preview
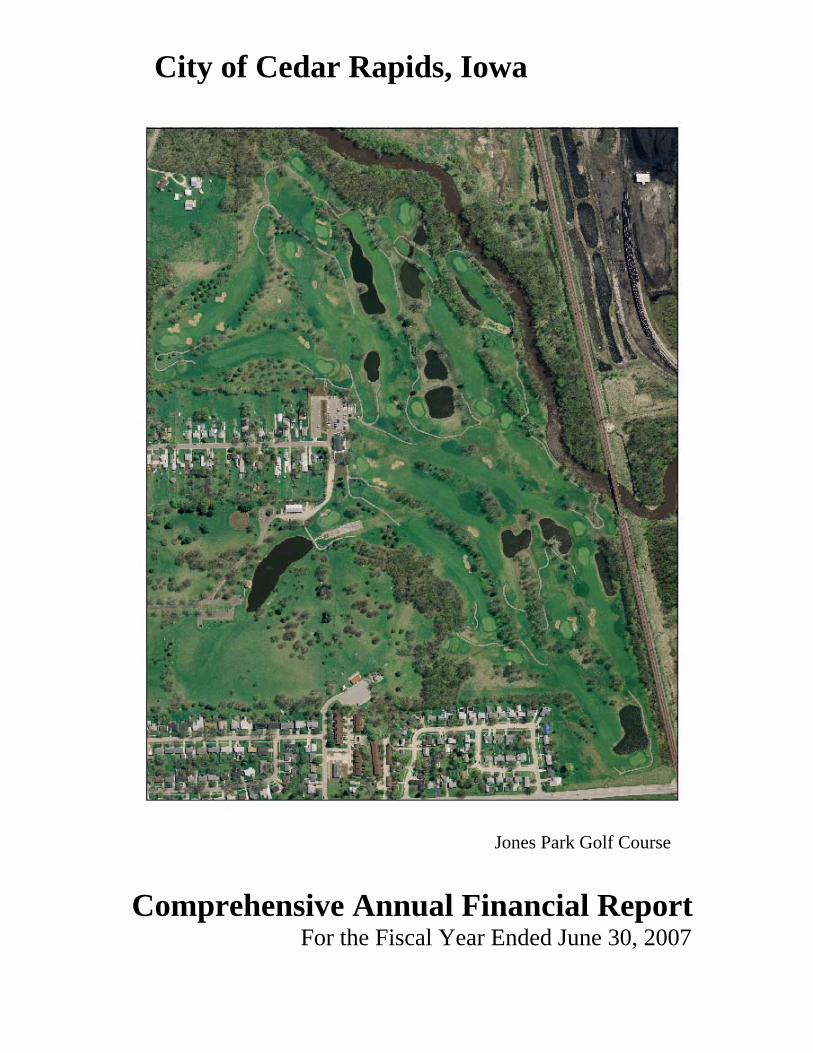
City of Cedar Rapids, Iowa
Jones Park Golf Course
Comprehensive Annual Financial Report For the Fiscal Year Ended June 30, 2007
About the Cover Pictured on the cover of this year’s Comprehensive Annual Financial Report is an aerial view of Jones Park Golf Course. Jones Park Golf Course opened for play in 1959 as a 9-hole facility set on the southwest side of Cedar Rapids. This course is close to the interstate and convenient to reach. The 9-hole facility continued until the spring of 2000, when the course was closed for the Master Plan Renovation. Lohmann Golf Design and The Bruce Company turned the course into an 18-hole course with 25 sand bunkers and 11 ponds. The total cost of the renovation was approximately $1.9 million and was funded with general obligation bonds. The 18-hole course was officially opened to the public May 24, 2001. Jones Memorial Park in southwest Cedar Rapids was named after Richard C. Jones, a former Parks Commissioner.
COMPREHENSIVE ANNUAL
FINANCIAL REPORT OF THE
CITY OF CEDAR RAPIDS, IOWA FOR THE FISCAL YEAR ENDED
JUNE 30, 2007
PUBLISHED BY
FINANCE DEPARTMENT
CITY OF CEDAR RAPIDS, IOWA
CITY OF CEDAR RAPIDS, IOWA Table of Contents
June 30, 2007
I. INTRODUCTORY SECTION Table of Contents ......................................................................................................................... 1 Letter of Transmittal .................................................................................................................... 3 Certificate of Achievement for Excellence in Financial Reporting.............................................. 9 Organizational Chart .................................................................................................................... 10
List of Principal Officials............................................................................................................. 11 II. FINANCIAL SECTION
A. INDEPENDENT AUDITOR’S REPORT ........................................................................ 12 B. MANAGEMENT’S DISCUSSION AND ANALYSIS ..................................................... 14
C. BASIC FINANCIAL STATEMENTS
Government-Wide Financial Statements Statement of Net Assets ................................................................................................. 22 Statement of Activities................................................................................................... 23 Fund Financial Statements Governmental Funds: Balance Sheet............................................................................................................ 25 Reconciliation of the Balance Sheet of Governmental Funds to the Statement of Net Assets ............................................................................... 26 Statement of Revenues, Expenditures, and Changes in Fund Balances .................... 27 Reconciliation of the Statement of Revenues, Expenditures, and Changes in Fund Balances of Governmental Funds to the Statement of Activities ........................................................................................... 28 Proprietary Funds: Statement of Net Assets ............................................................................................ 30 Statement of Revenues, Expenses, and Changes in Fund Net Assets ....................... 31 Statement of Cash Flows........................................................................................... 33 Fiduciary Funds: Statement of Assets and Liabilities – Agency Funds ................................................ 34 Notes to Financial Statements ............................................................................................ 35
D. REQUIRED SUPPLEMENTARY INFORMATION
Budget Comparison Schedule of Receipts, Disbursements, and Changes in Balances – Budget to Actual – All Governmental Funds and Proprietary Funds ....... 65 Notes to Required Supplementary Information – Budgetary Reporting.......................... 67 Schedule of Funding Progress ......................................................................................... 68
E. COMBINING STATEMENTS – NONMAJOR GOVERNMENTAL FUNDS
Combining Balance Sheet ................................................................................................ 69 Combining Statement of Revenues, Expenditures, and Changes in Fund Balances (Deficits)............................................................................................... 71
F. COMBINING STATEMENTS – NONMAJOR ENTERPRISE FUNDS
Combining Statement of Net Assets ................................................................................ 73 Combining Statement of Revenues, Expenses, and Changes in Fund Net Assets ........... 75 Combining Statement of Cash Flows............................................................................... 77
F. COMBINING STATEMENTS – INTERNAL SERVICE FUNDS
Combining Statement of Net Assets ................................................................................ 79 Combining Statement of Revenues, Expenses, and Changes in Fund Net Assets ........... 80
1
CITY OF CEDAR RAPIDS, IOWA Table of Contents
June 30, 2007
Combining Statement of Cash Flows............................................................................... 81
G. COMBINING STATEMENTS – AGENCY FUNDS Combining Statement of Assets and Liabilities ............................................................. 82 Combining Statement of Changes in Assets and Liabilities .......................................... 83
H. STATEMENTS OF REVENUES, EXPENSES, AND CHANGES IN FUND NET
ASSETS – DISCRETELY PRESENTED COMPONENT UNITS............................... 84
I. STATEMENTS OF CASH FLOWS – DISCRETELY PRESENTED COMPONENT UNITS ................................................................................................................................ 85
J. CAPITAL ASSETS USED IN THE OPERATION OF GOVERNMENTAL FUNDS:
Schedule By Source ....................................................................................................... 86 Schedule by Function and Activity ................................................................................ 87 Schedule of Changes by Function and Activity ............................................................. 88
III. STATISTICAL SECTION (Unaudited)
Statistical Section ............................................................................................................ 90 Net Assets by Component ............................................................................................... 92 Changes in Net Assets..................................................................................................... 93 Program Revenues by Function/Program........................................................................ 95 Fund Balances, Governmental Funds.............................................................................. 96 Changes in Fund Balances, Governmental Funds ........................................................... 97 Tax Revenues by Source, Governmental Funds.............................................................. 98 Assessed Value and Estimated Actual Value of Taxable Property ................................. 99 Direct and Overlapping Property Tax Rates....................................................................101 Principal Property Taxpayers ..........................................................................................104 Property Tax Levies and Collections ..............................................................................105 Ratios of Net General Bonded Debt Outstanding by Type .............................................107 Direct and Overlapping Governmental Activities Debt ..................................................110 Legal Debt Margin Information ......................................................................................111 Pledged-Revenue Coverage ............................................................................................113 Demographic and Economic Statistics ............................................................................114 Principal Employers ........................................................................................................116 Full-Time Equivalent Employees by Functions/Programs..............................................117 Operating Indicators by Function/Program .....................................................................119 Capital Asset Statistics by Function/Program .................................................................121
IV. COMPLIANCE SECTION
Schedule of Expenditures of Federal Awards ..............................................................................124 Notes to Schedule of Expenditures of Federal Awards................................................................127 Summary Schedule of Prior Audit Findings ................................................................................128 Independent Auditor’s Report on Compliance and on Internal Control Over Financing Reporting Based on an Audit of Financial Statements Performed in Accordance with Government Auditing Standards ................................................................................................129 Independent Auditor’s Report on Compliance with Requirements Applicable to Each Major Program and Internal Control Over Compliance in Accordance with OMB Circular A-133 ........................................................................................................131 Schedule of Findings and Questioned Costs ................................................................................133 Corrective Action Plan.................................................................................................................139
2
December 5, 2007 The Honorable Mayor, City Council Members, And Citizens of the City of Cedar Rapids, Iowa: The City of Cedar Rapids, Iowa, is required by various state and federal regulations to publish a complete set of financial statements presented in conformity with accounting principles generally accepted in the United States of America (generally accepted accounting principles or GAAP) and audited in accordance with auditing standards generally accepted in the United States of America by a firm of licensed certified public accountants. Pursuant to these requirements, the Comprehensive Annual Financial Report (CAFR) of the City of Cedar Rapids, Iowa (City) for the fiscal year ended June 30, 2007 as prepared by the Finance Department is hereby submitted in accordance with the provisions of Chapter 11.6 of the Code of Iowa. Management assumes full responsibility for the completeness and reliability of the information contained in this report, based upon a comprehensive framework of internal control that it has established for this purpose. Because the cost of internal control should not exceed anticipated benefits, the objective is to provide reasonable, rather than absolute, assurance that the financial statements are free of any material misstatements. McGladrey & Pullen, Certified Public Accountants, have issued an unqualified (“clean”) opinion on the City’s financial statements for the year ended June 30, 2007. The independent auditor’s report is located at the front of the financial section of this report. The independent audit of the financial statements of the City was part of a broader, federally mandated single audit designed to meet the special needs of federal grantor agencies. The standards governing single audit engagements require the independent auditor to report not only on the fair presentation of the financial statements, but also on the audited government’s internal controls and compliance with legal requirements, with special emphasis on internal controls and legal requirements involving the administration of federal awards. Information related to this single audit, including the Schedule of Expenditures of Federal Awards, Independent Auditors’ Report on Internal Control Over Financial Reporting and on Compliance and Other Matters Based on an Audit of Financial Statements Performed in Accordance with Government Auditing Standards, Independent Auditor’s Report on Compliance with Requirements Applicable to Each Major Program and Internal Control Over Compliance in Accordance with OMB Circular A-133, and Schedule of Findings and Questioned Costs is included in the section entitled Compliance Section. Management’s discussion and analysis (MD&A) immediately follows the independent auditor’s report and provides a narrative introduction, overview, and analysis of the basic financial statements. MD&A complement this letter of transmittal and should be read in conjunction with it. PROFILE OF THE CITY OF CEDAR RAPIDS The City of Cedar Rapids, incorporated in 1849, is located twenty-five miles north of Iowa City and one hundred-thirty miles east of Des Moines, the State Capitol. Cedar Rapids is an important manufacturing, service and trade area serving an eight county area with a combined population estimated at 419,245 and occupies 71 square miles. The population of Linn County based upon the 2005 census is 198,903 of which 122,206 reside within Cedar Rapids. The City of Cedar Rapids is empowered to levy a property tax on real
3
property located within its boundaries. It also is empowered by state statute to extend its corporate limits by annexation, which it has done from time to time. The City of Cedar Rapids has operated under the city council-manager form of government since January 2006. This form of government consists of nine council members. Five of the members represent a specific district. The remaining four council members are elected at-large, with the Mayor being one of those seats. Previously, the City had operated under the commission form of government from 1908 until 2005. The City of Cedar Rapids provides a full range of services, including public safety, public works, solid waste collection, animal control, parking, ground transportation, community development, and municipal water and sewer. The City also provides various cultural and recreational opportunities through various departments and commissions. The City’s financial statements include all funds, departments, boards and commissions, and other government entities that do not have separate legal status as required by accounting principles generally accepted in the United States of America. Three component units are included in our financial report: The Eastern Iowa Airport, Cedar Rapids/Linn County Solid Waste Agency, and Cedar Rapids Public Library Foundation. The annual budget serves as a foundation for the City’s financial planning and control. The City Council is responsible for developing a budget proposal. Council is required to hold public hearings on the proposed budget and to adopt the final budget no later than March 15 for the fiscal year beginning the following July 1. The budget is prepared by fund and function. Department heads may transfer resources within the department as they see fit. FACTORS AFFECTING FINANCIAL CONDITION Regionalism continues to be the focus of our economic development initiatives. The state’s first regional laborshed study was completed and confirmed that the Cedar Rapids/Iowa City Technology CorridorTM has one work force. Priority One, the economic development arm of the Cedar Rapids Chamber of Commerce, reported the following FY07 accomplishments: Business Development • Assisted in the creation of 1,516 jobs. • Located six new companies in the area. • Assisted sixteen area companies in expansion, training, and support. • Increased the tax base by $232,145,000 through industrial and office development. • During the Priorities 2010 Campaign ending December 31, 2011, Priority One looks to assist in the
creation of 7,200 new jobs and generate $1.02 billion in capital investment. In addition, the 2005 Laborshed Study, conducted by the Workforce Research Bureau of Iowa Workforce Development, reveals the Technology Corridor laborshed region has grown from 16 to 20 counties in two years. Based on figures in the 2005 study, the potential available laborforce in the Cedar Rapids area is estimated to be 88,500. Since the 2003 study, the workforce in Cedar Rapids’ metropolitan area has increased 52.3 percent. The increase reflects growth in the laborshed area, new population growth, increased numbers of people willing to re-enter the workforce and travel to the region’s central nodes for work. Nearly two-thirds of the workers in the Technology Corridor are employed in the following five areas: Education, Healthcare/Social Services, Advanced Manufacturing, Wholesale and Retail Trade, and Professional Services. The Cedar Rapids Area Chamber of Commerce partnered with The Greater Cedar Rapids Community Foundation to convene the entire county to focus on 15 initiatives that could be accomplished over the next
4
five years in Linn County. The 15 initiatives chosen are as follows: Designate an arts and entertainment district along 3rd Street SE, make health care accessible to the underserved, grow and sustain locally-owned businesses, make parks more attractive to youth and families, develop the riverfront, expand downtown housing, create a year-round district along Rockford Road SW, rejuvenate abandoned and deteriorating commercial property, build a state-of-the-art activity center, empower neighborhoods, upgrade and expand the U.S. Cellular Center, develop and implement a comprehensive solid waste management plan, connect and expand Linn County trails, launch a best-in-the-nation early childhood education program, and develop light rail service. Many of the initiatives outlined by the Fifteen in 5 Committee involve projects in the City. Over the course of the next few years the City will be working with citizens and business leaders to make these initiatives a reality. The City has also partnered with local organizations and businesses to launch an effort to bring the talents of a diverse work force from around the world to this region. This effort is essential for Technology Corridor businesses to compete in a global economy and the City has pledged financial support for this project through calendar year 2010. Cedar Rapids’ unemployment rate of 3.4% decreased for fiscal year ending 2007, and is lower than the state unemployment rate of 3.8% for fiscal year ending 2007 and was lower than the national unemployment rate for June 2007 of 4.5%. The Cedar Rapids MSA mean household income in 2007 was $68,155 as compared to $69,237 in 2006. These amounts are presented in 1996 constant dollar. Retail sales in the metro area increase to $3.01 billion for calendar year 2007 compared to $2.93 billion in calendar year 2006. Of this total, $2.44 billion was generated in Cedar Rapids. The total value of building permits in FY 2007 was approximately $186.0 million. This compares with an amount of $217 for FY 2006. This amount represents a decrease of 14 percent from the previous fiscal year. Long-term financial planning Unreserved fund balance in the general fund was $30.0 million or 36.5 percent of total general fund budgeted expenditures for fiscal year 2008. This percentage falls within the City’s policy guidelines for reserves, which at a minimum must be 25 percent of next fiscal year’s budgeted general fund expenditures as established by Council resolution. By maintaining an appropriate reserve balance the City is able to react to both known and unknown events that will have an impact on the City finances without disrupting services provided to its citizens in the short term. The City completed a ten year financial plan for all operating departments and capital improvement programs. The financial plan is a necessary element of Cedar Rapids strategy to remain competitive in today’s demanding environment. The City’s financial plan will provide a road map into the future and a framework for future decision-making. This financial plan reflects the following financial principles: 1) Sustainability; 2) Long-term Community Affordability; 3) Competitive and Responsive Community Services; and 4) Protecting Community Investment and Value. In addition to the financial plan, performance measurements have been created by all City departments to measure effectiveness, efficiency, customer service, and organizational climate. These measurements will be reported on a regular basis to the City Council, City staff, and citizens of Cedar Rapids.
5
Relevant financial policies Internal Controls The management of the City is responsible for the establishment and continued maintenance of an internal control structure to ensure that all City assets are protected from loss, theft, or misuse. The management must also ensure that adequate accounting data is available to allow for the preparation of financial statements in conformity with generally accepted accounting principles. The internal control structure is designed to provide reasonable assurance these objectives are met. The concept of reasonable assurance recognizes: (1) the cost of a control should not exceed the benefits likely to be derived; and (2) the valuation of costs and benefits requires estimates and judgments by management. Single Audit A recipient of federal and state financial assistance, the City is also responsible for ensuring that an adequate internal control structure is in place to ensure compliance with applicable laws and regulations related to those programs. This internal control structure is subject to periodic evaluation by management. Budgetary Controls The City's management team takes a very active role in the financial planning and management of the City for both short-term daily operations and long-range planning. The City adopts its annual program budget to include all funds except fiduciary funds. While budgetary control is exercised at the program level, management control is exercised on a major objective of expenditure basis. The daily operations are closely monitored through the City's automated and integrated on-line financial system which provides daily appropriations status capabilities, weekly cash management forecasting reports, and monthly, current and year-to-date budget by major object of expenditure reports. Estimated revenues are also closely monitored as to their impact on budgeted expenditures. If a department falls short of its discretionary revenue projections, adjustments must be made in its appropriations to reflect these shortfalls. Encumbrance accounting is employed in all funds for management control purposes. Appropriations, as adopted and amended, lapse at the end of the fiscal year. Encumbrances outstanding at year-end are reflected as reservations of the Governmental fund balances, which serve as authorizations for expenditures in the subsequent year. Capital projects are appropriated on a yearly basis. In terms of long-range planning, the City, in compliance with a Council resolution, annually develops and issues a ten-year capital improvements program, which is funded primarily through the sale of general obligation bonds. All operating departments are also required to submit a ten-year capital equipment program as part of the annual operating budget process. Retirement Plans With the exception of police and fire the City's employees are covered by the Iowa Public Employees Retirement System (IPERS). The State annually sets a tax rate to be contributed by all municipal entities that is sufficient to meet the needs of the State plan when combined with local employee contributions. All covered employees are required to contribute 3.7 percent of their salary--employers contribute 5.75 percent (prior to July 1, 1975, the rate of contribution was identical) except for airport safety employees, in which case the percentages are 6.08 percent and 9.12 percent respectively. There is no allocation of unfunded liability to any municipal entity and upon the retirement of employees, responsibility for their benefits is solely that of IPERS. Fire and police employees are covered by the Municipal Fire and Police Retirement System of Iowa (MFPRSI). This is a cost-sharing multiple-employer defined benefit retirement system administered by a board of trustees. Plan members are required to contribute 9.35 percent of their annual covered salary and the City is required to contribute at an actuarially determined rate with the current rate being 27.75 percent of annual covered payroll. There is no allocation of unfunded liability to any municipal entity and upon the retirement of employees, responsibility for their benefits is solely that of MFPRSI.
6
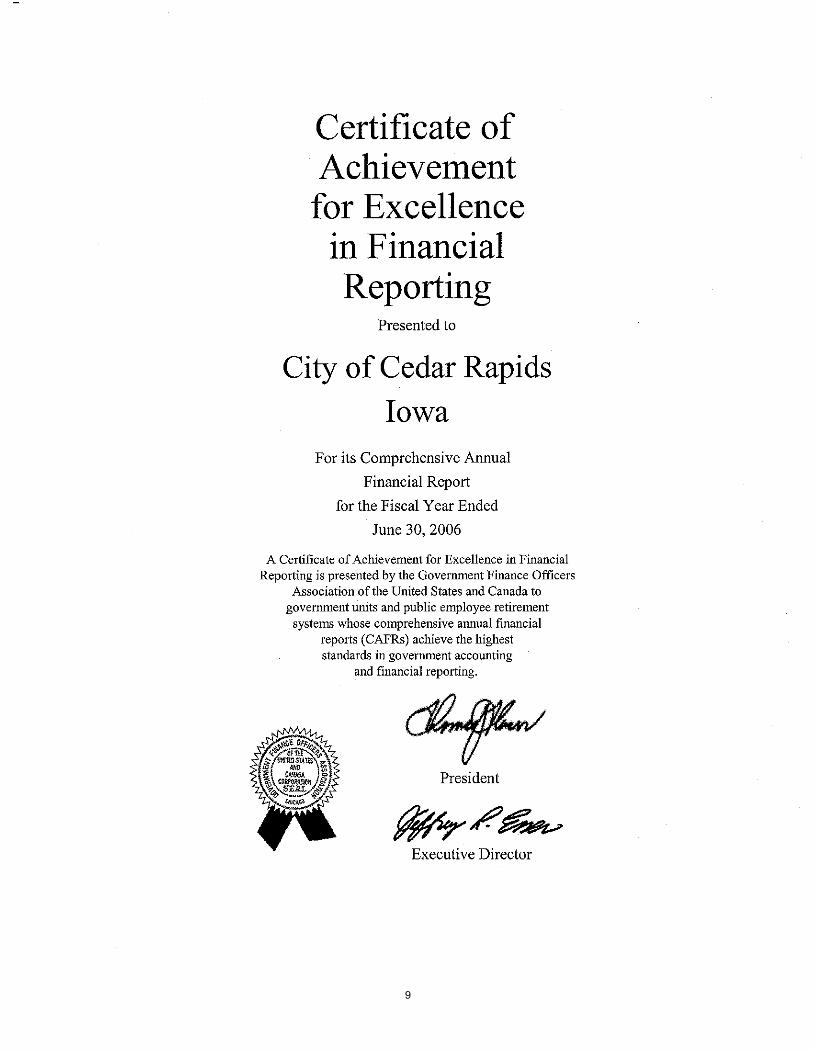
Debt Administration The City’s debt management policy strives to repay 30 to 60 percent of the principal amount of its general obligation debt within five years and at least 60 percent within ten fiscal years. Capital projects financed through issuance of debt are programmed to be paid off completely within the expected useful life of the capital project. Currently, the City is on pace to repay over 70 percent of its debt within ten fiscal years. Moody's Investor Services continues to rate the City’s general obligation bonds Aaa. This rating is predicated on the City's strong financial management, a diverse and substantial economic and tax base, and a low debt burden with a rapid payout. FY07 marked our thirty-fifth anniversary of maintaining this rating. Cash Management The City maintains almost all deposits, except for those funds that must maintain their demand deposits separately, in one demand deposit account in the General Fund. The majority of the City's investments are handled through an investment pool. This concept provides for greater investment earnings, which are then allocated on a systematic basis. Risk Management The City's risk management program strives to protect the City's assets in a cost effective and responsible manner using a combination of the four recognized methods of treating risks: elimination, reduction, transfer, and retention. Safety and loss prevention programs help reduce the City's exposure to risks. Those risks that cannot be eliminated or reduced are either transferred or retained. Funded self-retention of risks is being employed not only because it is cost effective but it also enables the City to: stabilize insurance costs; build a fund to provide a reliable and constant source of funds to pay claims; and provide a high level of service by handling claims promptly and courteously. In fiscal year 2007, the City transferred its risk through the purchase of liability insurance to cover its airport, underground fuel storage tanks, six vehicles, maintenance of a non-owned air-ambulance, lead paint hazard control program and liquor liability. The City retains or "self-insures" without excess insurance, the rest of its general liability, errors and employment practices liability, police liability, auto liability, bus liability, and owned aircraft liability exposures. The City also self-insures its workers compensation, health and dental benefits without stop loss insurance. A combination of risk transfer and risk retention is employed in handling the City's property exposures. Property insurance is purchased with large deductibles. The City accounts for and finances its retained risks through the Risk Management Internal Service Fund. In compliance with Statement 10 of the Governmental Accounting Standards Board, the City's financial statements show as an expense and liability, the estimated cost of all claims which have occurred. Claim liabilities are based on the estimated total cost of all claims including claims reported but not settled, and claims incurred but not reported. The tort liability and workers' compensation claims liabilities are shown at a 95% confidence level, as determined by an independent actuary, in the City's June 30, 2007, financial statements. The amount of incurred but unpaid health and dental bills were determined by an independent actuary along with calculations to comply with Statements 43, 45 and 47 of the Governmental Accounting Standards Board. AWARDS AND ACKNOWLEDGEMENTS The Government Finance Officers Association (GFOA) awarded a Certificate of Achievement for Excellence in Financial Reporting to the City of Cedar Rapids, Iowa, for its comprehensive annual financial report (CAFR) for the fiscal year ended June 30, 2006. This was the twenty-sixth consecutive year that the City has received this prestigious award. In order to be awarded a Certificate of Achievement, the City had to publish an easily readable and efficiently organized CAFR that satisfied both generally accepted accounting principles and applicable legal requirements. A Certificate of Achievement is valid for a period of one year only. We believe that our current CAFR continues to meet the Certificate of Achievement Program’s requirements and we are submitting it to the GFOA to determine its eligibility for another certificate.
7
In addition, the City also received the GFOA’s Distinguished Budget Presentation Award for its annual budget for the fiscal year beginning July 1, 2007. In order to qualify for the Distinguished Budget Presentation Award, the City’s budget document had to be judged proficient as a policy document, a financial plan, an operations guide, and a communications device. The City has received this award for nine years. The award is valid for a period of one year only. The preparation of this report could not be accomplished without the efficient and dedicated services of the entire staff of the Finance Department. We would also like to thank the members of the City Council for their prudent management of the City’s finances.
8
9
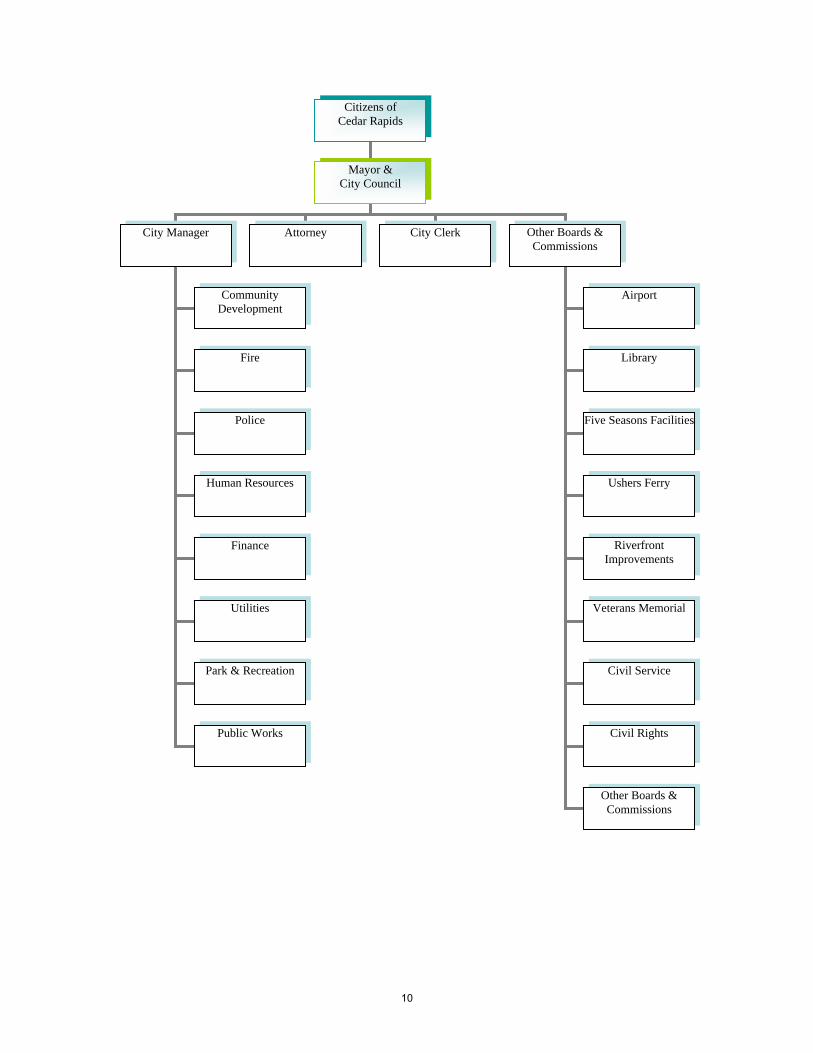
Citizens of Cedar Rapids
Mayor & City Council
City Manager Attorney City Clerk Other Boards & Commissions
Airport
Library
Five Seasons Facilities
Ushers Ferry
Riverfront Improvements
Veterans Memorial
Civil Service
Civil Rights
Other Boards & Commissions
Community Development
Fire
Police
Human Resources
Finance
Utilities
Public Works
Park & Recreation
10
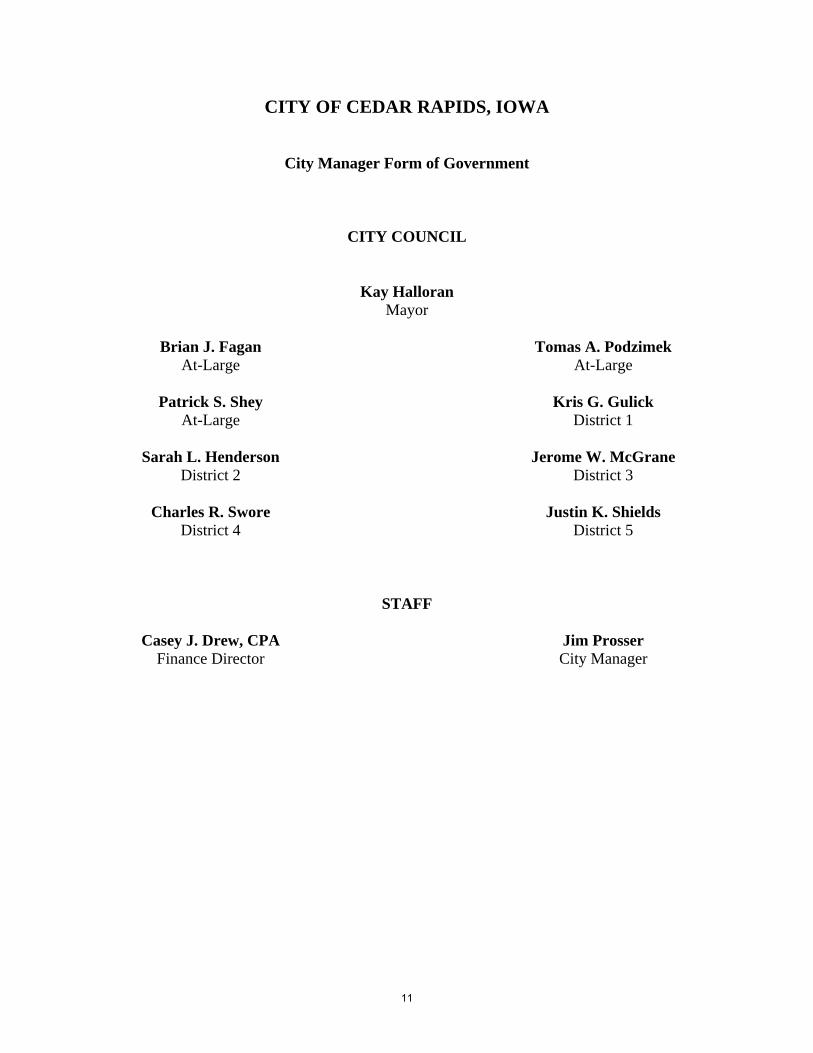
CITY OF CEDAR RAPIDS, IOWA
City Manager Form of Government
CITY COUNCIL Kay Halloran Mayor
Brian J. Fagan Tomas A. Podzimek At-Large At-Large
Patrick S. Shey Kris G. Gulick
At-Large District 1
Sarah L. Henderson Jerome W. McGrane District 2 District 3
Charles R. Swore Justin K. Shields
District 4 District 5 STAFF
Casey J. Drew, CPA Jim Prosser Finance Director City Manager
11
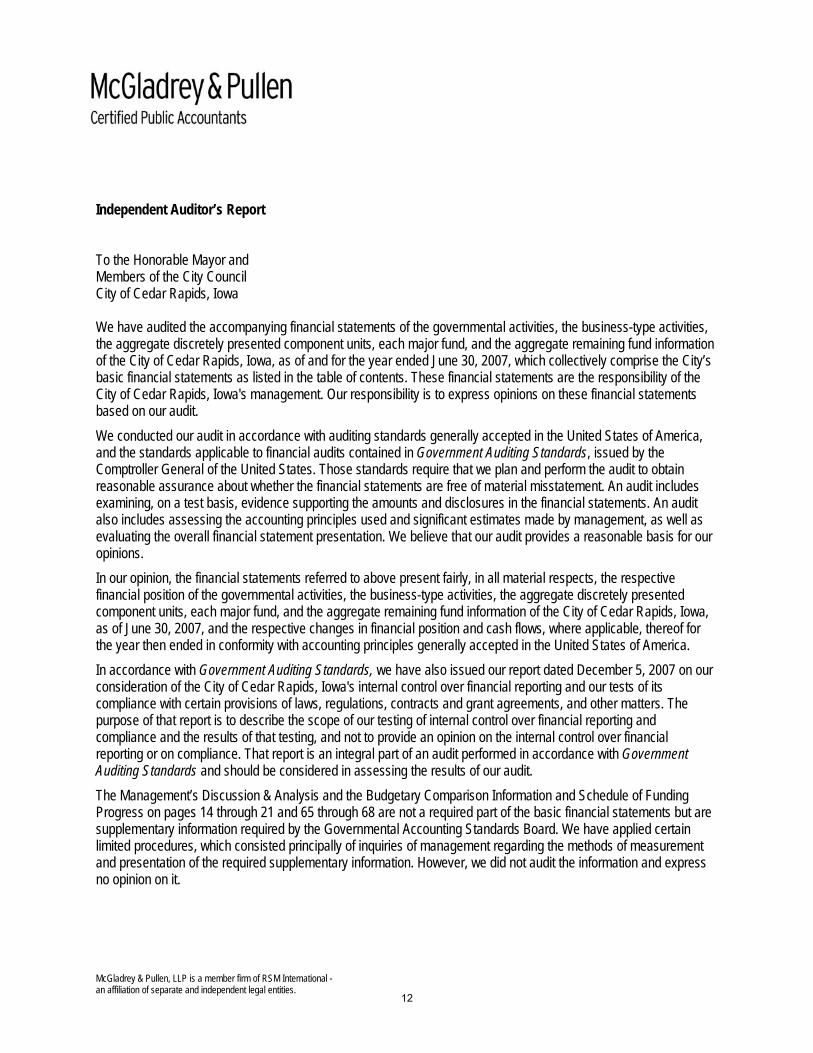
Independent Auditor’s Report
To the Honorable Mayor and Members of the City Council City of Cedar Rapids, Iowa We have audited the accompanying financial statements of the governmental activities, the business-type activities, the aggregate discretely presented component units, each major fund, and the aggregate remaining fund information of the City of Cedar Rapids, Iowa, as of and for the year ended June 30, 2007, which collectively comprise the City’s basic financial statements as listed in the table of contents. These financial statements are the responsibility of the City of Cedar Rapids, Iowa's management. Our responsibility is to express opinions on these financial statements based on our audit. We conducted our audit in accordance with auditing standards generally accepted in the United States of America, and the standards applicable to financial audits contained in Government Auditing Standards, issued by the Comptroller General of the United States. Those standards require that we plan and perform the audit to obtain reasonable assurance about whether the financial statements are free of material misstatement. An audit includes examining, on a test basis, evidence supporting the amounts and disclosures in the financial statements. An audit also includes assessing the accounting principles used and significant estimates made by management, as well as evaluating the overall financial statement presentation. We believe that our audit provides a reasonable basis for our opinions. In our opinion, the financial statements referred to above present fairly, in all material respects, the respective financial position of the governmental activities, the business-type activities, the aggregate discretely presented component units, each major fund, and the aggregate remaining fund information of the City of Cedar Rapids, Iowa, as of June 30, 2007, and the respective changes in financial position and cash flows, where applicable, thereof for the year then ended in conformity with accounting principles generally accepted in the United States of America.
In accordance with Government Auditing Standards, we have also issued our report dated December 5, 2007 on our consideration of the City of Cedar Rapids, Iowa's internal control over financial reporting and our tests of its compliance with certain provisions of laws, regulations, contracts and grant agreements, and other matters. The purpose of that report is to describe the scope of our testing of internal control over financial reporting and compliance and the results of that testing, and not to provide an opinion on the internal control over financial reporting or on compliance. That report is an integral part of an audit performed in accordance with Government Auditing Standards and should be considered in assessing the results of our audit.
The Management’s Discussion & Analysis and the Budgetary Comparison Information and Schedule of Funding Progress on pages 14 through 21 and 65 through 68 are not a required part of the basic financial statements but are supplementary information required by the Governmental Accounting Standards Board. We have applied certain limited procedures, which consisted principally of inquiries of management regarding the methods of measurement and presentation of the required supplementary information. However, we did not audit the information and express no opinion on it.
McGladrey & Pullen, LLP is a member firm of RSM International - an affiliation of separate and independent legal entities.
12
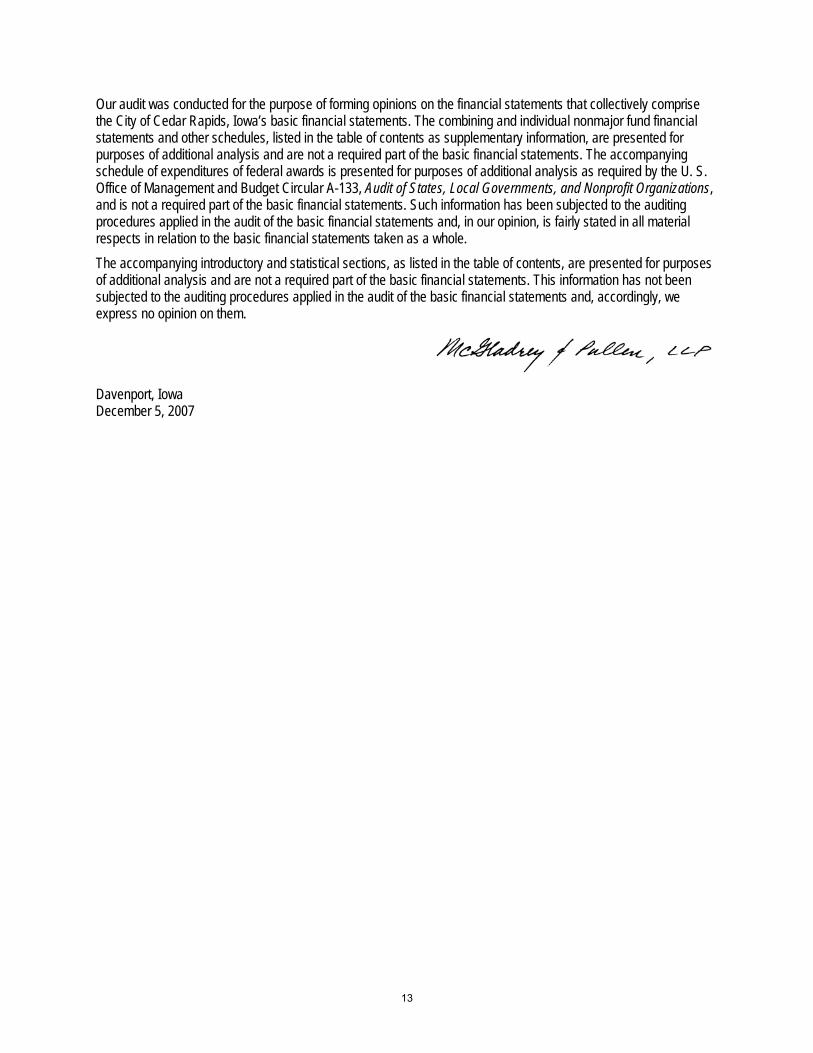
Our audit was conducted for the purpose of forming opinions on the financial statements that collectively comprise the City of Cedar Rapids, Iowa’s basic financial statements. The combining and individual nonmajor fund financial statements and other schedules, listed in the table of contents as supplementary information, are presented for purposes of additional analysis and are not a required part of the basic financial statements. The accompanying schedule of expenditures of federal awards is presented for purposes of additional analysis as required by the U. S. Office of Management and Budget Circular A-133, Audit of States, Local Governments, and Nonprofit Organizations, and is not a required part of the basic financial statements. Such information has been subjected to the auditing procedures applied in the audit of the basic financial statements and, in our opinion, is fairly stated in all material respects in relation to the basic financial statements taken as a whole.
The accompanying introductory and statistical sections, as listed in the table of contents, are presented for purposes of additional analysis and are not a required part of the basic financial statements. This information has not been subjected to the auditing procedures applied in the audit of the basic financial statements and, accordingly, we express no opinion on them.
Davenport, Iowa December 5, 2007
13
Management’s Discussion and Analysis As management of the City of Cedar Rapids, Iowa, we offer readers of the City of Cedar Rapids’ financial statements this narrative overview and analysis of the financial statements of the City of Cedar Rapids for the fiscal year ended June 30, 2007. We encourage readers to consider the information presented here in conjunction with additional information that we have furnished in our letter of transmittal, which can be found on pages 3-8 of this report. Financial Highlights • The assets of the City of Cedar Rapids exceeded its liabilities at the close of June 30, 2007, by $573.7
million (net assets). Of this amount, $163.9 million (unrestricted net assets) may be used to meet the government’s ongoing obligations to citizens and creditors.
• The government’s total assets increased by $100.6 million. • At the close of the current fiscal year, the City of Cedar Rapids’ governmental funds reported
combined ending fund balances of $141.5 million, an increase of 33.5 percent as compared to the prior fiscal year.
• At the end of the current fiscal year, unreserved fund balance and targeted fund balance for the general fund was $30.0 million, or 36.5 percent of the total general fund expenditures.
• Total debt increased by $67.3 million during the current fiscal year. The City issued $88.5 million of new bonds and retired $20.67 million of existing bonds.
Overview of the Financial Statements This discussion and analysis is intended to serve as an introduction to the City of Cedar Rapids’ basic financial statements. The City of Cedar Rapids’ basic financial statements are comprised of three components: 1) government-wide financial statements, 2) fund financial statements, and 3) notes to the financial statements. The report consists of government-wide statements, fund financial statements, notes to the financial statements, required budgetary schedules, combining schedules of non-major funds and supplementary information. The first several statements are highly condensed and present a government-wide view of the City’s finances. The governmental activities of the City of Cedar Rapids include general government, police and fire protection, streets and public buildings operation and maintenance, and parks and recreation oriented activities. The major business-type activities of the City include a water and wastewater treatment facilities and a sanitary sewer system. Included within others are a ground transportation system, parking system, solid waste management collection, golf courses, an ice arena, a theatre and an entertainment and convention facility. The City’s three component units, The Eastern Iowa Airport, Cedar Rapids/Linn County Solid Waste Agency, and Cedar Rapids Library Foundation are also included. Financial information for these component units is reported separately from the financial information presented for the primary government itself. Government–wide Financial Statements The government-wide financial statements include the Statement of Net Assets. The Statement of Net Assets presents information on all of the City of Cedar Rapids’ assets and liabilities, with the difference between the two reported as Net Assets. Over time, increases or decreases in net assets may serve as a useful indicator of whether the financial position of the City is improving or deteriorating. The Statement of Activities is also included in the government-wide financial statements. The focus of the Statement of Activities is to show how the government’s assets changed during the most recent fiscal year. All changes in net assets are reported as soon as the underlying event giving rise to the change occurs, regardless of the timing of related cash flows. Thus, revenues and expenses are reported in this statement for some items that will only result in cash flows in future fiscal periods (e.g., uncollected taxes and earned but unused vacation leave).
14
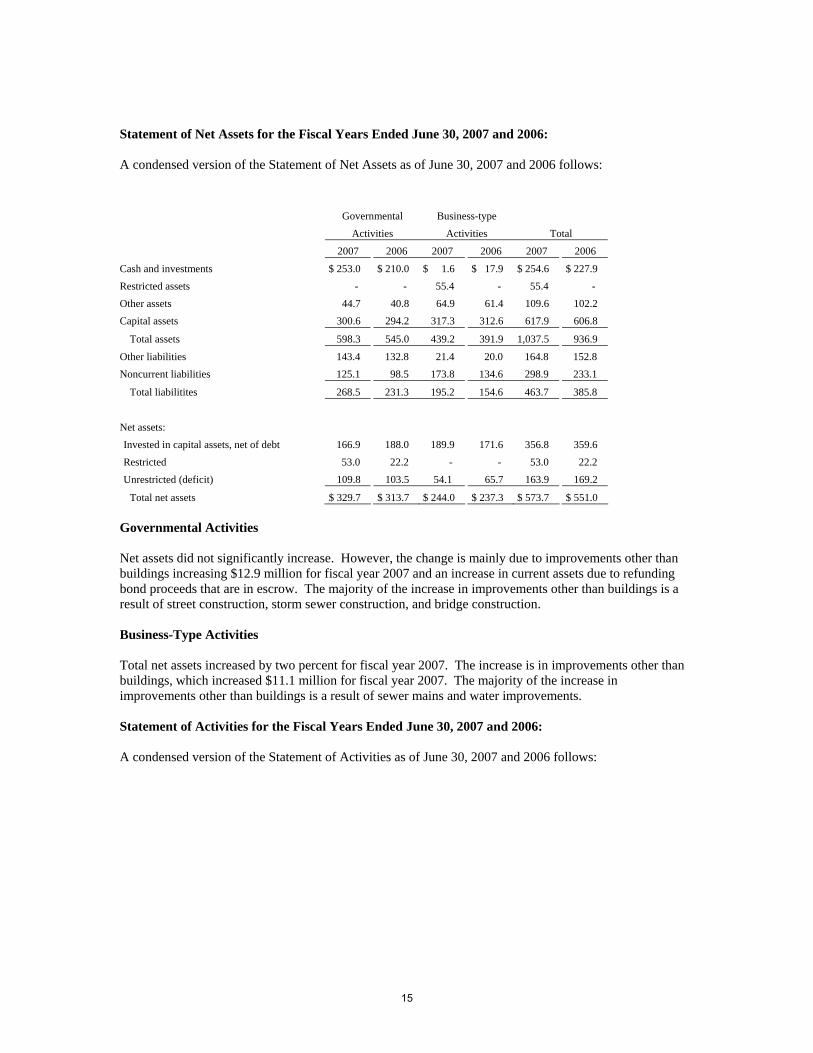
Statement of Net Assets for the Fiscal Years Ended June 30, 2007 and 2006: A condensed version of the Statement of Net Assets as of June 30, 2007 and 2006 follows: Governmental Business-type
Activities Activities Total
2007 2006 2007 2006 2007 2006
Cash and investments $ 253.0 $ 210.0 $ 1.6 $ 17.9 $ 254.6 $ 227.9 Restricted assets - - 55.4 - 55.4 - Other assets 44.7 40.8 64.9 61.4 109.6 102.2 Capital assets 300.6 294.2 317.3 312.6 617.9 606.8
Total assets 598.3 545.0 439.2 391.9 1,037.5 936.9
Other liabilities 143.4 132.8 21.4 20.0 164.8 152.8 Noncurrent liabilities 125.1 98.5 173.8 134.6 298.9 233.1
Total liabilitites 268.5 231.3 195.2 154.6 463.7 385.8
Net assets: Invested in capital assets, net of debt 166.9 188.0 189.9 171.6 356.8 359.6
Restricted 53.0 22.2 - - 53.0 22.2 Unrestricted (deficit) 109.8 103.5 54.1 65.7 163.9 169.2
Total net assets $ 329.7 $ 313.7 $ 244.0 $ 237.3 $ 573.7 $ 551.0 Governmental Activities Net assets did not significantly increase. However, the change is mainly due to improvements other than buildings increasing $12.9 million for fiscal year 2007 and an increase in current assets due to refunding bond proceeds that are in escrow. The majority of the increase in improvements other than buildings is a result of street construction, storm sewer construction, and bridge construction. Business-Type Activities Total net assets increased by two percent for fiscal year 2007. The increase is in improvements other than buildings, which increased $11.1 million for fiscal year 2007. The majority of the increase in improvements other than buildings is a result of sewer mains and water improvements. Statement of Activities for the Fiscal Years Ended June 30, 2007 and 2006: A condensed version of the Statement of Activities as of June 30, 2007 and 2006 follows:
15
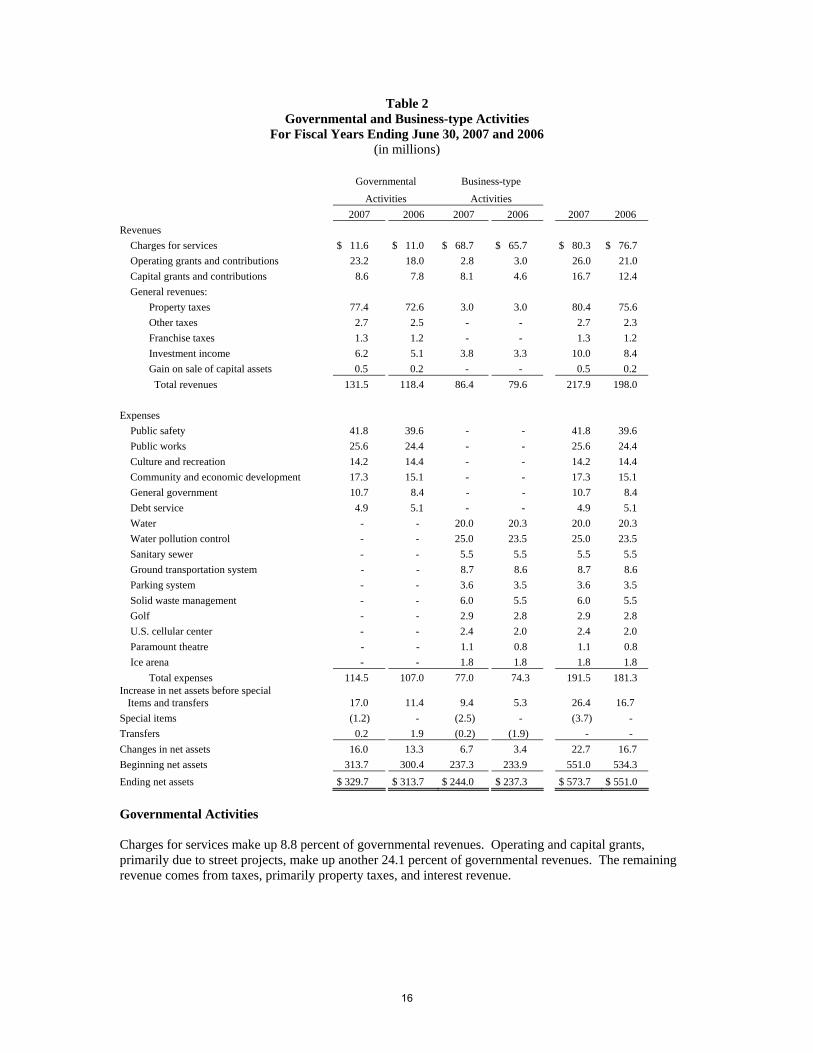
Table 2 Governmental and Business-type Activities
For Fiscal Years Ending June 30, 2007 and 2006 (in millions)
Governmental Business-type
Activities Activities 2007 2006 2007 2006 2007 2006 Revenues Charges for services $ 11.6 $ 11.0 $ 68.7 $ 65.7 $ 80.3 $ 76.7 Operating grants and contributions 23.2 18.0 2.8 3.0 26.0 21.0 Capital grants and contributions 8.6 7.8 8.1 4.6 16.7 12.4 General revenues: Property taxes 77.4 72.6 3.0 3.0 80.4 75.6 Other taxes 2.7 2.5 - - 2.7 2.3 Franchise taxes 1.3 1.2 - - 1.3 1.2 Investment income 6.2 5.1 3.8 3.3 10.0 8.4 Gain on sale of capital assets 0.5 0.2 - - 0.5 0.2 Total revenues 131.5 118.4 86.4 79.6 217.9 198.0 Expenses Public safety 41.8 39.6 - - 41.8 39.6 Public works 25.6 24.4 - - 25.6 24.4 Culture and recreation 14.2 14.4 - - 14.2 14.4 Community and economic development 17.3 15.1 - - 17.3 15.1 General government 10.7 8.4 - - 10.7 8.4 Debt service 4.9 5.1 - - 4.9 5.1 Water - - 20.0 20.3 20.0 20.3 Water pollution control - - 25.0 23.5 25.0 23.5 Sanitary sewer - - 5.5 5.5 5.5 5.5 Ground transportation system - - 8.7 8.6 8.7 8.6 Parking system - - 3.6 3.5 3.6 3.5 Solid waste management - - 6.0 5.5 6.0 5.5 Golf - - 2.9 2.8 2.9 2.8 U.S. cellular center - - 2.4 2.0 2.4 2.0 Paramount theatre - - 1.1 0.8 1.1 0.8 Ice arena - - 1.8 1.8 1.8 1.8 Total expenses 114.5 107.0 77.0 74.3 191.5 181.3 Increase in net assets before special Items and transfers 17.0 11.4 9.4 5.3 26.4 16.7 Special items (1.2) - (2.5) - (3.7) - Transfers 0.2 1.9 (0.2) (1.9) - - Changes in net assets 16.0 13.3 6.7 3.4 22.7 16.7 Beginning net assets 313.7 300.4 237.3 233.9 551.0 534.3 Ending net assets $ 329.7 $ 313.7 $ 244.0 $ 237.3 $ 573.7 $ 551.0
Governmental Activities Charges for services make up 8.8 percent of governmental revenues. Operating and capital grants, primarily due to street projects, make up another 24.1 percent of governmental revenues. The remaining revenue comes from taxes, primarily property taxes, and interest revenue.
16
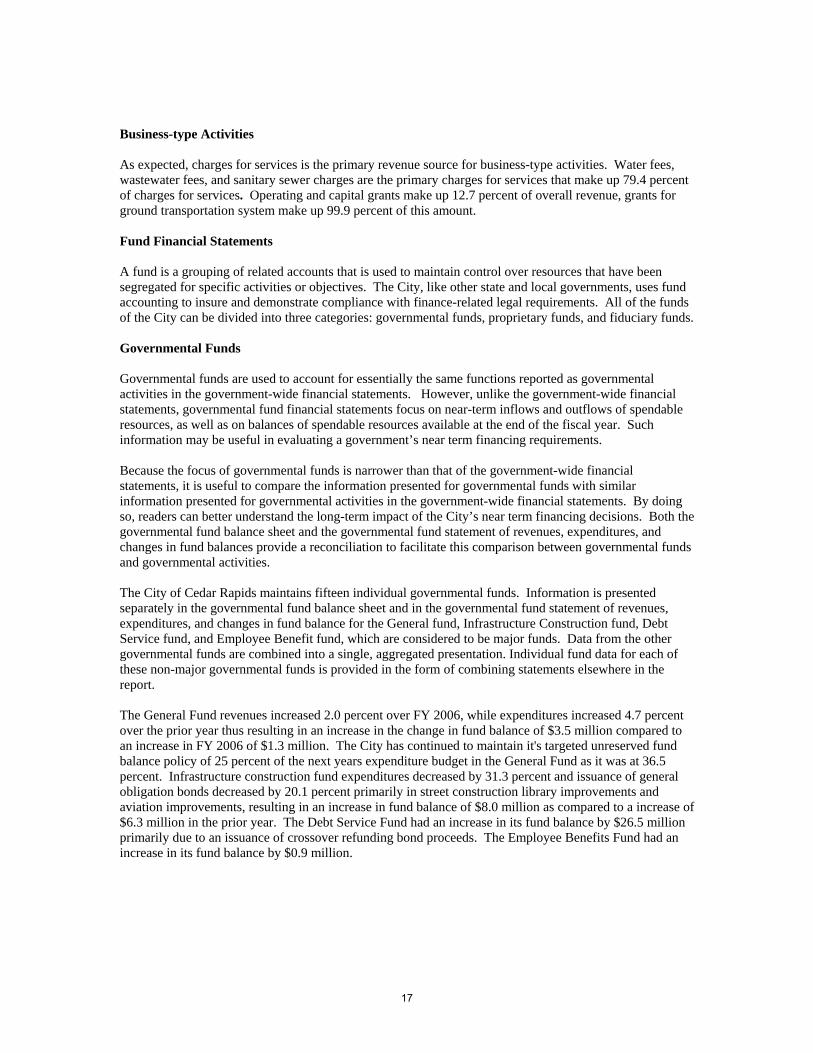
Business-type Activities As expected, charges for services is the primary revenue source for business-type activities. Water fees, wastewater fees, and sanitary sewer charges are the primary charges for services that make up 79.4 percent of charges for services. Operating and capital grants make up 12.7 percent of overall revenue, grants for ground transportation system make up 99.9 percent of this amount. Fund Financial Statements A fund is a grouping of related accounts that is used to maintain control over resources that have been segregated for specific activities or objectives. The City, like other state and local governments, uses fund accounting to insure and demonstrate compliance with finance-related legal requirements. All of the funds of the City can be divided into three categories: governmental funds, proprietary funds, and fiduciary funds. Governmental Funds Governmental funds are used to account for essentially the same functions reported as governmental activities in the government-wide financial statements. However, unlike the government-wide financial statements, governmental fund financial statements focus on near-term inflows and outflows of spendable resources, as well as on balances of spendable resources available at the end of the fiscal year. Such information may be useful in evaluating a government’s near term financing requirements. Because the focus of governmental funds is narrower than that of the government-wide financial statements, it is useful to compare the information presented for governmental funds with similar information presented for governmental activities in the government-wide financial statements. By doing so, readers can better understand the long-term impact of the City’s near term financing decisions. Both the governmental fund balance sheet and the governmental fund statement of revenues, expenditures, and changes in fund balances provide a reconciliation to facilitate this comparison between governmental funds and governmental activities. The City of Cedar Rapids maintains fifteen individual governmental funds. Information is presented separately in the governmental fund balance sheet and in the governmental fund statement of revenues, expenditures, and changes in fund balance for the General fund, Infrastructure Construction fund, Debt Service fund, and Employee Benefit fund, which are considered to be major funds. Data from the other governmental funds are combined into a single, aggregated presentation. Individual fund data for each of these non-major governmental funds is provided in the form of combining statements elsewhere in the report. The General Fund revenues increased 2.0 percent over FY 2006, while expenditures increased 4.7 percent over the prior year thus resulting in an increase in the change in fund balance of $3.5 million compared to an increase in FY 2006 of $1.3 million. The City has continued to maintain it's targeted unreserved fund balance policy of 25 percent of the next years expenditure budget in the General Fund as it was at 36.5 percent. Infrastructure construction fund expenditures decreased by 31.3 percent and issuance of general obligation bonds decreased by 20.1 percent primarily in street construction library improvements and aviation improvements, resulting in an increase in fund balance of $8.0 million as compared to a increase of $6.3 million in the prior year. The Debt Service Fund had an increase in its fund balance by $26.5 million primarily due to an issuance of crossover refunding bond proceeds. The Employee Benefits Fund had an increase in its fund balance by $0.9 million.
17
Proprietary Funds The City of Cedar Rapids maintains two different types of proprietary funds. Enterprise funds are used to report the same functions presented as business-type activities in the government-wide financial statements. The City uses enterprise funds to account for its water, water pollution control, sanitary sewer, and others. Internal service funds are an accounting device used to accumulate and allocate costs internally among the City’s various functions. The City of Cedar Rapids uses internal service funds to account for its risk management functions, its joint communications, and its public works building function. Because all of these services predominately benefit governmental rather than business type functions, they have been included within the governmental activities in the government-wide financial statements. Proprietary funds provide the same type of information as government-wide financial statements, only in more detail. The proprietary fund financial statements provide separate information for the Water, Water Pollution Control, and Sanitary Sewer as these are considered major funds of the City. Data from the other seven enterprise funds are combined into a single aggregate presentation. Individual fund data for each of the non-major enterprise funds is provided in the form of combining statements elsewhere in this report. All Internal Service funds are combined into a single aggregate presentation in the proprietary fund financial statements. Individual fund data for internal service funds is provided in the form of combining statements elsewhere in this report. Water revenues increased 1.8 percent over the prior year while expenses increased 0.1 percent thus increasing the operating income from $3.6 million in FY 2006 to $4.0 million in FY 2007. The change in net assets increased $2.0 million. Water Pollution Control's change in net assets increased by $0.1 million as compared to a increase of $1.0 million in FY 2006, mainly due to a smaller increase in charges for services and investment earnings. Sanitary Sewer’s change in net assets increased by $1.1 million in FY 2007 as compared to a increase of $2.8 million in FY 2006, mainly due to an increase in revenues and a decrease in expenditures. Fiduciary Funds Fiduciary funds are used to account for resources held for the benefit of parties outside the government. Fiduciary funds are not reflected on the government-wide financial statements because the resources of those funds are not available to support the City of Cedar Rapids’ own programs. The accounting used for fiduciary funds is much like that used for proprietary funds. Notes to the Financial Statements The notes provide additional information that is essential to a full understanding of the data provided in the government-wide and fund financial statements. The notes to the financial statements can be found on pages 35-63 of this report. Other Information The combining statements referred to earlier in connection with non-major governmental, non-major enterprise funds, and internal service funds are presented immediately following the required supplementary information. Combining and individual fund statements and schedules can be found on pages 69-83 of this report. Budgetary Highlights The City presents budgetary information as allowed by GASB Statement No. 41. Budgets are based on ten functional areas as required by state statute, not by fund or fund type. The City had one budget amendment during the fiscal year that is our common practice. This amendment decreased the expenditure budget by $8.9 million to a total of $297.4 million. This represented a 3.0
18
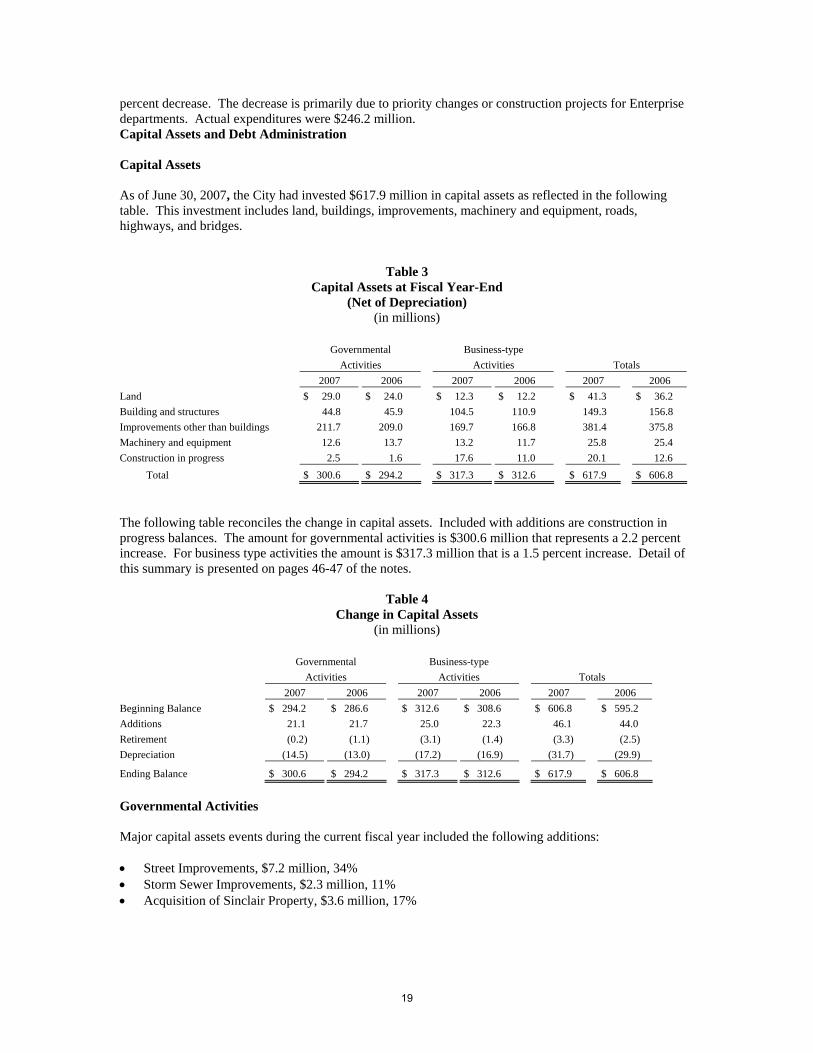
percent decrease. The decrease is primarily due to priority changes or construction projects for Enterprise departments. Actual expenditures were $246.2 million. Capital Assets and Debt Administration Capital Assets As of June 30, 2007, the City had invested $617.9 million in capital assets as reflected in the following table. This investment includes land, buildings, improvements, machinery and equipment, roads, highways, and bridges.
Table 3 Capital Assets at Fiscal Year-End
(Net of Depreciation) (in millions)
Governmental Business-type Activities Activities Totals 2007 2006 2007 2006 2007 2006 Land $ 29.0 $ 24.0 $ 12.3 $ 12.2 $ 41.3 $ 36.2 Building and structures 44.8 45.9 104.5 110.9 149.3 156.8 Improvements other than buildings 211.7 209.0 169.7 166.8 381.4 375.8 Machinery and equipment 12.6 13.7 13.2 11.7 25.8 25.4 Construction in progress 2.5 1.6 17.6 11.0 20.1 12.6 Total $ 300.6 $ 294.2 $ 317.3 $ 312.6 $ 617.9 $ 606.8
The following table reconciles the change in capital assets. Included with additions are construction in progress balances. The amount for governmental activities is $300.6 million that represents a 2.2 percent increase. For business type activities the amount is $317.3 million that is a 1.5 percent increase. Detail of this summary is presented on pages 46-47 of the notes.
Table 4 Change in Capital Assets
(in millions)
Governmental Business-type Activities Activities Totals 2007 2006 2007 2006 2007 2006 Beginning Balance $ 294.2 $ 286.6 $ 312.6 $ 308.6 $ 606.8 $ 595.2 Additions 21.1 21.7 25.0 22.3 46.1 44.0 Retirement (0.2) (1.1) (3.1) (1.4) (3.3) (2.5) Depreciation (14.5) (13.0) (17.2) (16.9) (31.7) (29.9)
Ending Balance $ 300.6 $ 294.2 $ 317.3 $ 312.6 $ 617.9 $ 606.8
Governmental Activities Major capital assets events during the current fiscal year included the following additions: • Street Improvements, $7.2 million, 34% • Storm Sewer Improvements, $2.3 million, 11% • Acquisition of Sinclair Property, $3.6 million, 17%
19
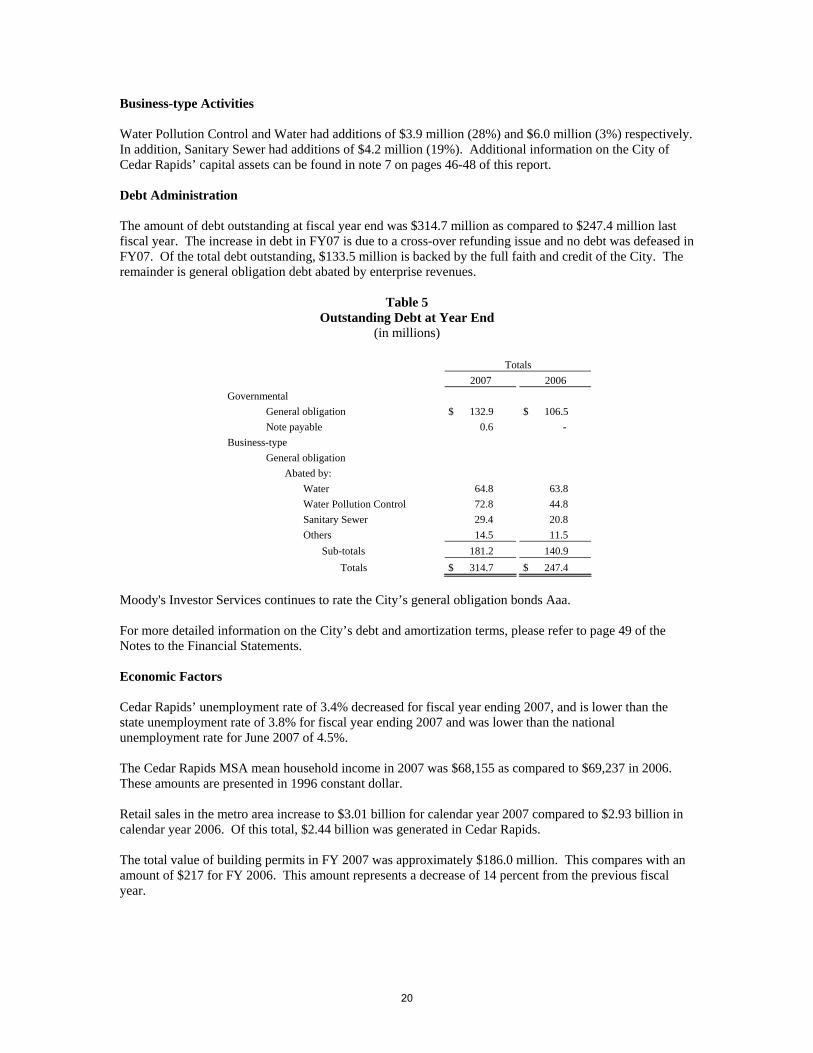
Business-type Activities Water Pollution Control and Water had additions of $3.9 million (28%) and $6.0 million (3%) respectively. In addition, Sanitary Sewer had additions of $4.2 million (19%). Additional information on the City of Cedar Rapids’ capital assets can be found in note 7 on pages 46-48 of this report. Debt Administration The amount of debt outstanding at fiscal year end was $314.7 million as compared to $247.4 million last fiscal year. The increase in debt in FY07 is due to a cross-over refunding issue and no debt was defeased in FY07. Of the total debt outstanding, $133.5 million is backed by the full faith and credit of the City. The remainder is general obligation debt abated by enterprise revenues.
Table 5 Outstanding Debt at Year End
(in millions) Totals 2007 2006 Governmental General obligation $ 132.9 $ 106.5 Note payable 0.6 - Business-type General obligation Abated by: Water 64.8 63.8 Water Pollution Control 72.8 44.8 Sanitary Sewer 29.4 20.8 Others 14.5 11.5 Sub-totals 181.2 140.9 Totals $ 314.7 $ 247.4
Moody's Investor Services continues to rate the City’s general obligation bonds Aaa. For more detailed information on the City’s debt and amortization terms, please refer to page 49 of the Notes to the Financial Statements. Economic Factors Cedar Rapids’ unemployment rate of 3.4% decreased for fiscal year ending 2007, and is lower than the state unemployment rate of 3.8% for fiscal year ending 2007 and was lower than the national unemployment rate for June 2007 of 4.5%. The Cedar Rapids MSA mean household income in 2007 was $68,155 as compared to $69,237 in 2006. These amounts are presented in 1996 constant dollar. Retail sales in the metro area increase to $3.01 billion for calendar year 2007 compared to $2.93 billion in calendar year 2006. Of this total, $2.44 billion was generated in Cedar Rapids. The total value of building permits in FY 2007 was approximately $186.0 million. This compares with an amount of $217 for FY 2006. This amount represents a decrease of 14 percent from the previous fiscal year.
20
Next Year’s Budget and Rates Approximately 79 percent of our operating costs in the General fund are for Personal Services. Changes in Personal Services can be due to changes in the pay rates, changes in benefits and cost of benefits, changes in number of employees, or any combination of these. The Personal Services within the General Fund increased by $0.2 million or an increase of 0.3 percent. Non-Personal Services were increased by $.9 million or 6.3 percent. Water, Sewer, and Solid Waste fees combined are expected to increase approximately 4.69 percent in FY2008 for the average residential customer. The amount of dollar increase on the average residential user (usage of 10 units of water per month) will be $4.69 bimonthly. Even with these increases in rates, our combined water and sewer rates are still far below other large cities in Iowa that provide similar services. The tax levy for bus operations and capital will remain at 63.481 cents/$1000 that will result in an increase of approximately $35,182 in revenues. State law provides the City could levy up to $.95/1000 as a part of the transit levy Financial Information Contact The City’s financial statements are designed to present users (citizens, taxpayers, customers, investors, and creditors with a general overview of the City’s finances and to demonstrate the City’s accountability. If you have questions about the report or need additional financial information, please contact the Finance Department at 51 First Avenue Bridge, 3rd Floor, City Hall, Cedar Rapids, Iowa, 52401-1113.
21
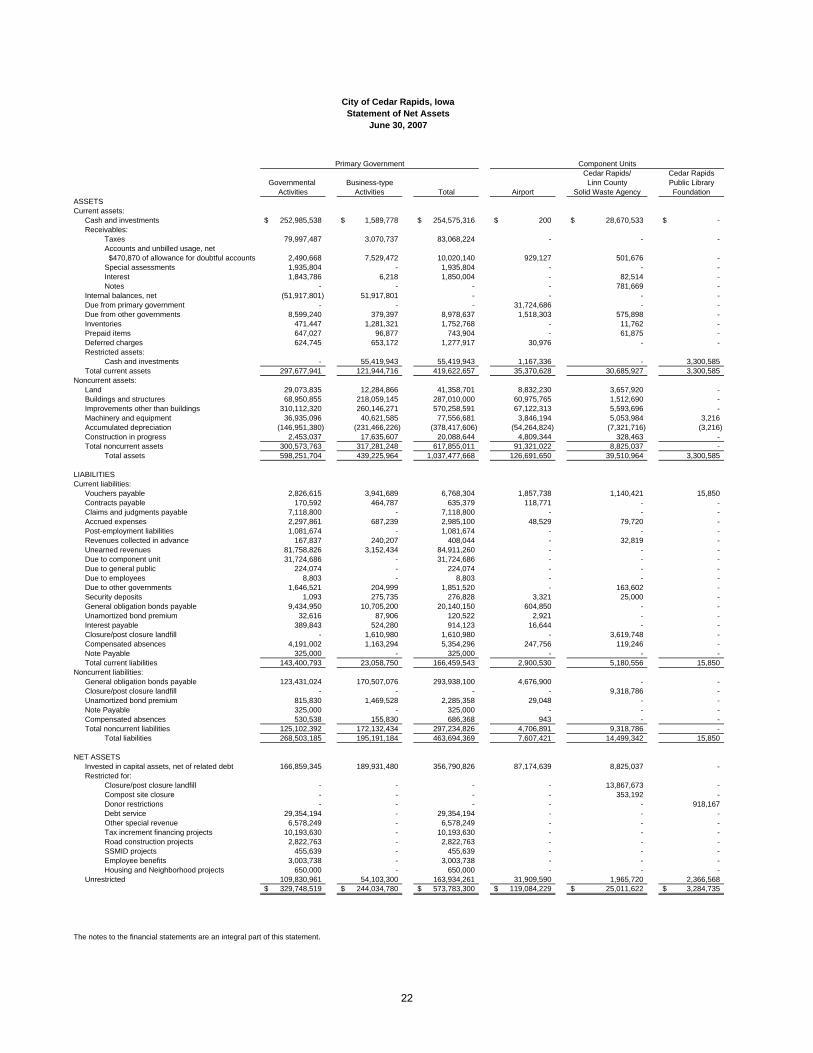
City of Cedar Rapids, IowaStatement of Net Assets
June 30, 2007
Primary Government Component UnitsCedar Rapids/ Cedar Rapids
Governmental Business-type Linn County Public LibraryActivities Activities Total Airport Solid Waste Agency Foundation
ASSETSCurrent assets:
Cash and investments 252,985,538$ 1,589,778$ 254,575,316$ 200$ 28,670,533$ -$ Receivables:
Taxes 79,997,487 3,070,737 83,068,224 - - - Accounts and unbilled usage, net $470,870 of allowance for doubtful accounts 2,490,668 7,529,472 10,020,140 929,127 501,676 - Special assessments 1,935,804 - 1,935,804 - - - Interest 1,843,786 6,218 1,850,004 - 82,514 - Notes - - - - 781,669 -
Internal balances, net (51,917,801) 51,917,801 - - - - Due from primary government - - - 31,724,686 - - Due from other governments 8,599,240 379,397 8,978,637 1,518,303 575,898 - Inventories 471,447 1,281,321 1,752,768 - 11,762 - Prepaid items 647,027 96,877 743,904 - 61,875 - Deferred charges 624,745 653,172 1,277,917 30,976 - - Restricted assets:
Cash and investments - 55,419,943 55,419,943 1,167,336 - 3,300,585 Total current assets 297,677,941 121,944,716 419,622,657 35,370,628 30,685,927 3,300,585
Noncurrent assets:Land 29,073,835 12,284,866 41,358,701 8,832,230 3,657,920 - Buildings and structures 68,950,855 218,059,145 287,010,000 60,975,765 1,512,690 - Improvements other than buildings 310,112,320 260,146,271 570,258,591 67,122,313 5,593,696 - Machinery and equipment 36,935,096 40,621,585 77,556,681 3,846,194 5,053,984 3,216 Accumulated depreciation (146,951,380) (231,466,226) (378,417,606) (54,264,824) (7,321,716) (3,216) Construction in progress 2,453,037 17,635,607 20,088,644 4,809,344 328,463 - Total noncurrent assets 300,573,763 317,281,248 617,855,011 91,321,022 8,825,037 -
Total assets 598,251,704 439,225,964 1,037,477,668 126,691,650 39,510,964 3,300,585
LIABILITIESCurrent liabilities:
Vouchers payable 2,826,615 3,941,689 6,768,304 1,857,738 1,140,421 15,850 Contracts payable 170,592 464,787 635,379 118,771 - - Claims and judgments payable 7,118,800 - 7,118,800 - - - Accrued expenses 2,297,861 687,239 2,985,100 48,529 79,720 - Post-employment liabilities 1,081,674 - 1,081,674 - - - Revenues collected in advance 167,837 240,207 408,044 - 32,819 - Unearned revenues 81,758,826 3,152,434 84,911,260 - - - Due to component unit 31,724,686 - 31,724,686 - - - Due to general public 224,074 - 224,074 - - - Due to employees 8,803 - 8,803 - - - Due to other governments 1,646,521 204,999 1,851,520 - 163,602 - Security deposits 1,093 275,735 276,828 3,321 25,000 - General obligation bonds payable 9,434,950 10,705,200 20,140,150 604,850 - - Unamortized bond premium 32,616 87,906 120,522 2,921 - - Interest payable 389,843 524,280 914,123 16,644 - - Closure/post closure landfill - 1,610,980 1,610,980 - 3,619,748 - Compensated absences 4,191,002 1,163,294 5,354,296 247,756 119,246 - Note Payable 325,000 - 325,000 - - - Total current liabilities 143,400,793 23,058,750 166,459,543 2,900,530 5,180,556 15,850
Noncurrent liabilities:General obligation bonds payable 123,431,024 170,507,076 293,938,100 4,676,900 - - Closure/post closure landfill - - - - 9,318,786 - Unamortized bond premium 815,830 1,469,528 2,285,358 29,048 - - Note Payable 325,000 - 325,000 - - - Compensated absences 530,538 155,830 686,368 943 - - Total noncurrent liabilities 125,102,392 172,132,434 297,234,826 4,706,891 9,318,786 -
Total liabilities 268,503,185 195,191,184 463,694,369 7,607,421 14,499,342 15,850
NET ASSETSInvested in capital assets, net of related debt 166,859,345 189,931,480 356,790,826 87,174,639 8,825,037 - Restricted for:
Closure/post closure landfill - - - - 13,867,673 - Compost site closure - - - - 353,192 - Donor restrictions - - - - - 918,167 Debt service 29,354,194 - 29,354,194 - - - Other special revenue 6,578,249 - 6,578,249 - - - Tax increment financing projects 10,193,630 - 10,193,630 - - - Road construction projects 2,822,763 - 2,822,763 - - - SSMID projects 455,639 - 455,639 - - - Employee benefits 3,003,738 - 3,003,738 - - - Housing and Neighborhood projects 650,000 - 650,000 - - -
Unrestricted 109,830,961 54,103,300 163,934,261 31,909,590 1,965,720 2,366,568 329,748,519$ 244,034,780$ 573,783,300$ 119,084,229$ 25,011,622$ 3,284,735$
The notes to the financial statements are an integral part of this statement.
22
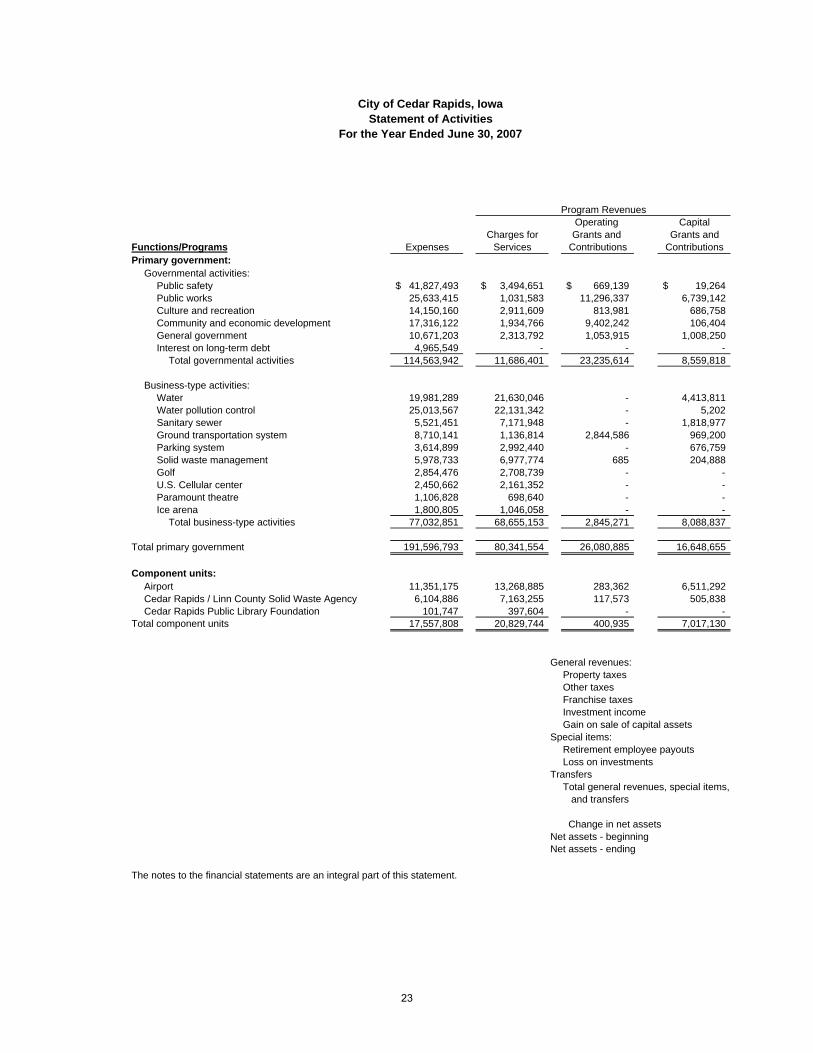
Operating CapitalCharges for Grants and Grants and
Functions/Programs Expenses Services Contributions ContributionsPrimary government:
Governmental activities:Public safety 41,827,493$ 3,494,651$ 669,139$ 19,264$ Public works 25,633,415 1,031,583 11,296,337 6,739,142 Culture and recreation 14,150,160 2,911,609 813,981 686,758 Community and economic development 17,316,122 1,934,766 9,402,242 106,404 General government 10,671,203 2,313,792 1,053,915 1,008,250 Interest on long-term debt 4,965,549 - - -
Total governmental activities 114,563,942 11,686,401 23,235,614 8,559,818
Business-type activities:Water 19,981,289 21,630,046 - 4,413,811 Water pollution control 25,013,567 22,131,342 - 5,202 Sanitary sewer 5,521,451 7,171,948 - 1,818,977 Ground transportation system 8,710,141 1,136,814 2,844,586 969,200 Parking system 3,614,899 2,992,440 - 676,759 Solid waste management 5,978,733 6,977,774 685 204,888 Golf 2,854,476 2,708,739 - - U.S. Cellular center 2,450,662 2,161,352 - - Paramount theatre 1,106,828 698,640 - - Ice arena 1,800,805 1,046,058 - -
Total business-type activities 77,032,851 68,655,153 2,845,271 8,088,837
Total primary government 191,596,793 80,341,554 26,080,885 16,648,655
Component units:Airport 11,351,175 13,268,885 283,362 6,511,292 Cedar Rapids / Linn County Solid Waste Agency 6,104,886 7,163,255 117,573 505,838 Cedar Rapids Public Library Foundation 101,747 397,604 - -
Total component units 17,557,808 20,829,744 400,935 7,017,130
General revenues:Property taxesOther taxesFranchise taxesInvestment incomeGain on sale of capital assets
Special items:Retirement employee payoutsLoss on investments
TransfersTotal general revenues, special items, and transfers
Change in net assetsNet assets - beginningNet assets - ending
The notes to the financial statements are an integral part of this statement.
Program Revenues
City of Cedar Rapids, IowaStatement of Activities
For the Year Ended June 30, 2007
23
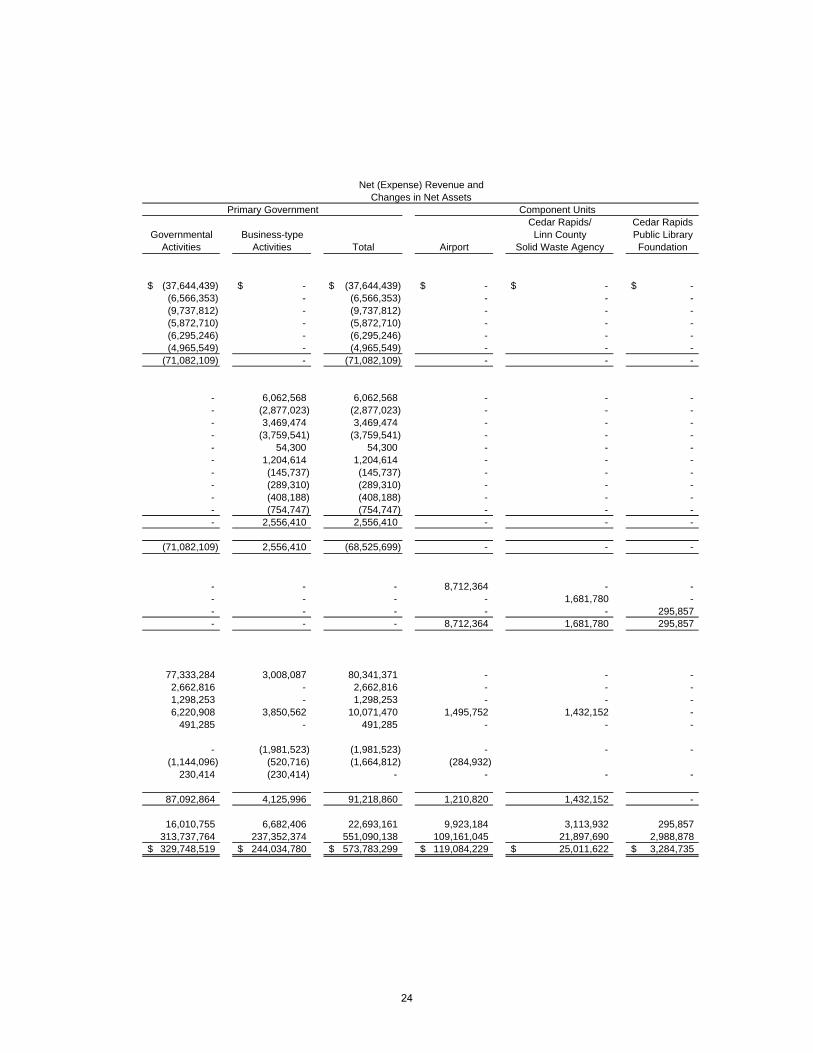
Cedar Rapids/ Cedar RapidsGovernmental Business-type Linn County Public Library
Activities Activities Total Airport Solid Waste Agency Foundation
(37,644,439)$ -$ (37,644,439)$ -$ -$ -$ (6,566,353) - (6,566,353) - - - (9,737,812) - (9,737,812) - - - (5,872,710) - (5,872,710) - - - (6,295,246) - (6,295,246) - - - (4,965,549) - (4,965,549) - - -
(71,082,109) - (71,082,109) - - -
- 6,062,568 6,062,568 - - - - (2,877,023) (2,877,023) - - - - 3,469,474 3,469,474 - - - - (3,759,541) (3,759,541) - - - - 54,300 54,300 - - - - 1,204,614 1,204,614 - - - - (145,737) (145,737) - - - - (289,310) (289,310) - - - - (408,188) (408,188) - - - - (754,747) (754,747) - - - - 2,556,410 2,556,410 - - -
(71,082,109) 2,556,410 (68,525,699) - - -
- - - 8,712,364 - - - - - - 1,681,780 - - - - - - 295,857 - - - 8,712,364 1,681,780 295,857
77,333,284 3,008,087 80,341,371 - - - 2,662,816 - 2,662,816 - - - 1,298,253 - 1,298,253 - - - 6,220,908 3,850,562 10,071,470 1,495,752 1,432,152 -
491,285 - 491,285 - - -
- (1,981,523) (1,981,523) - - - (1,144,096) (520,716) (1,664,812) (284,932)
230,414 (230,414) - - - -
87,092,864 4,125,996 91,218,860 1,210,820 1,432,152 -
16,010,755 6,682,406 22,693,161 9,923,184 3,113,932 295,857 313,737,764 237,352,374 551,090,138 109,161,045 21,897,690 2,988,878 329,748,519$ 244,034,780$ 573,783,299$ 119,084,229$ 25,011,622$ 3,284,735$
Primary Government Component UnitsChanges in Net Assets
Net (Expense) Revenue and
24
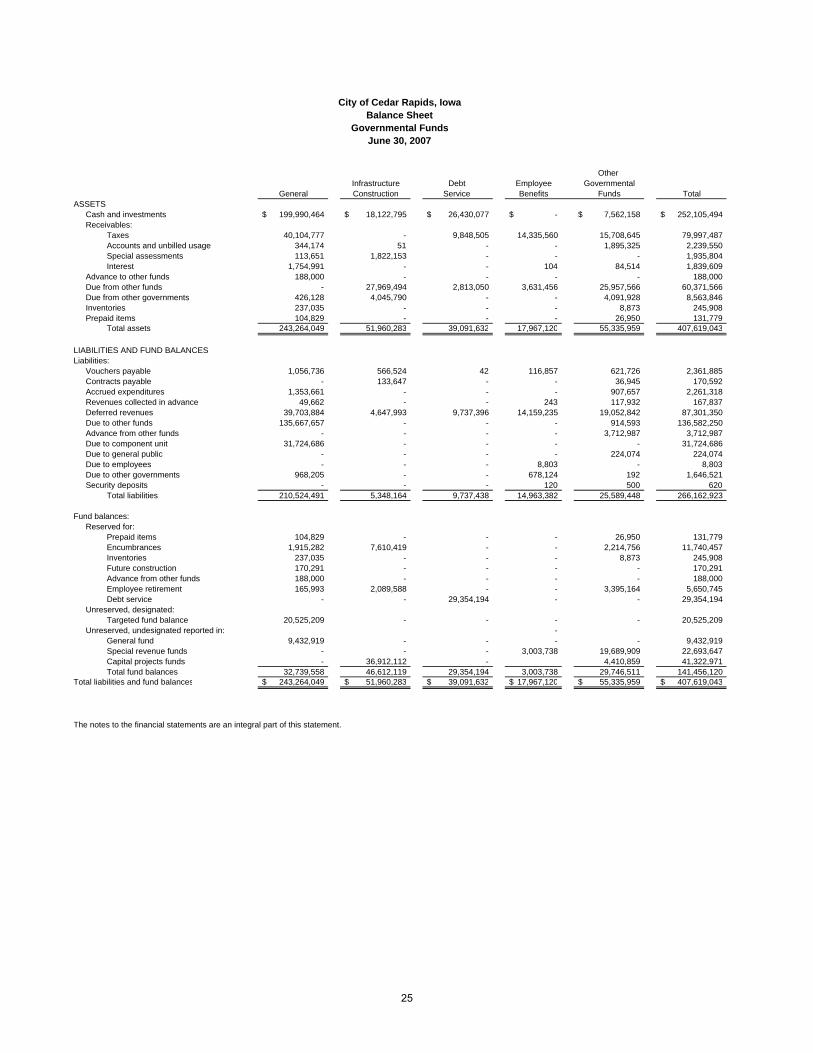
City of Cedar Rapids, IowaBalance Sheet
Governmental FundsJune 30, 2007
Other Infrastructure Debt Employee Governmental
General Construction Service Benefits Funds TotalASSETS
Cash and investments 199,990,464$ 18,122,795$ 26,430,077$ -$ 7,562,158$ 252,105,494$ Receivables:
Taxes 40,104,777 - 9,848,505 14,335,560 15,708,645 79,997,487 Accounts and unbilled usage 344,174 51 - - 1,895,325 2,239,550 Special assessments 113,651 1,822,153 - - - 1,935,804 Interest 1,754,991 - - 104 84,514 1,839,609
Advance to other funds 188,000 - - - - 188,000 Due from other funds - 27,969,494 2,813,050 3,631,456 25,957,566 60,371,566 Due from other governments 426,128 4,045,790 - - 4,091,928 8,563,846 Inventories 237,035 - - - 8,873 245,908 Prepaid items 104,829 - - - 26,950 131,779
Total assets 243,264,049 51,960,283 39,091,632 17,967,120 55,335,959 407,619,043
LIABILITIES AND FUND BALANCESLiabilities:
Vouchers payable 1,056,736 566,524 42 116,857 621,726 2,361,885 Contracts payable - 133,647 - - 36,945 170,592 Accrued expenditures 1,353,661 - - - 907,657 2,261,318 Revenues collected in advance 49,662 - - 243 117,932 167,837 Deferred revenues 39,703,884 4,647,993 9,737,396 14,159,235 19,052,842 87,301,350 Due to other funds 135,667,657 - - - 914,593 136,582,250 Advance from other funds - - - - 3,712,987 3,712,987 Due to component unit 31,724,686 - - - - 31,724,686 Due to general public - - - - 224,074 224,074 Due to employees - - - 8,803 - 8,803 Due to other governments 968,205 - - 678,124 192 1,646,521 Security deposits - - - 120 500 620
Total liabilities 210,524,491 5,348,164 9,737,438 14,963,382 25,589,448 266,162,923
Fund balances:Reserved for:
Prepaid items 104,829 - - - 26,950 131,779 Encumbrances 1,915,282 7,610,419 - - 2,214,756 11,740,457 Inventories 237,035 - - - 8,873 245,908 Future construction 170,291 - - - - 170,291 Advance from other funds 188,000 - - - - 188,000 Employee retirement 165,993 2,089,588 - - 3,395,164 5,650,745 Debt service - - 29,354,194 - - 29,354,194
Unreserved, designated:Targeted fund balance 20,525,209 - - - - 20,525,209
Unreserved, undesignated reported in: - General fund 9,432,919 - - - - 9,432,919 Special revenue funds - - - 3,003,738 19,689,909 22,693,647 Capital projects funds - 36,912,112 - 4,410,859 41,322,971 Total fund balances 32,739,558 46,612,119 29,354,194 3,003,738 29,746,511 141,456,120
Total liabilities and fund balances 243,264,049$ 51,960,283$ 39,091,632$ 17,967,120$ 55,335,959$ 407,619,043$
The notes to the financial statements are an integral part of this statement.
25
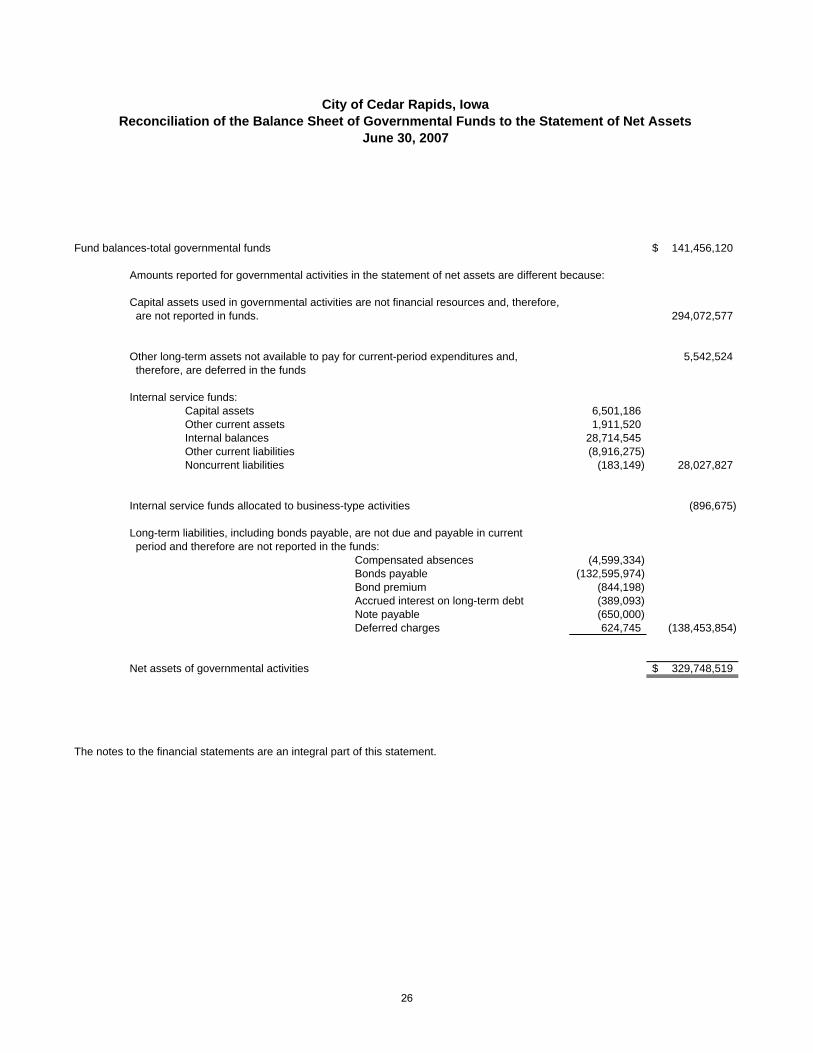
Fund balances-total governmental funds 141,456,120$
Amounts reported for governmental activities in the statement of net assets are different because:
Capital assets used in governmental activities are not financial resources and, therefore, are not reported in funds. 294,072,577
Other long-term assets not available to pay for current-period expenditures and, 5,542,524 therefore, are deferred in the funds
Internal service funds: Capital assets 6,501,186 Other current assets 1,911,520 Internal balances 28,714,545 Other current liabilities (8,916,275) Noncurrent liabilities (183,149) 28,027,827
Internal service funds allocated to business-type activities (896,675)
Long-term liabilities, including bonds payable, are not due and payable in current period and therefore are not reported in the funds:
Compensated absences (4,599,334) Bonds payable (132,595,974) Bond premium (844,198) Accrued interest on long-term debt (389,093) Note payable (650,000) Deferred charges 624,745 (138,453,854)
Net assets of governmental activities 329,748,519$
The notes to the financial statements are an integral part of this statement.
City of Cedar Rapids, IowaReconciliation of the Balance Sheet of Governmental Funds to the Statement of Net Assets
June 30, 2007
26
OtherInfrastructure Debt Employee Governmental
General Construction Service Benefits Funds TotalRevenues:
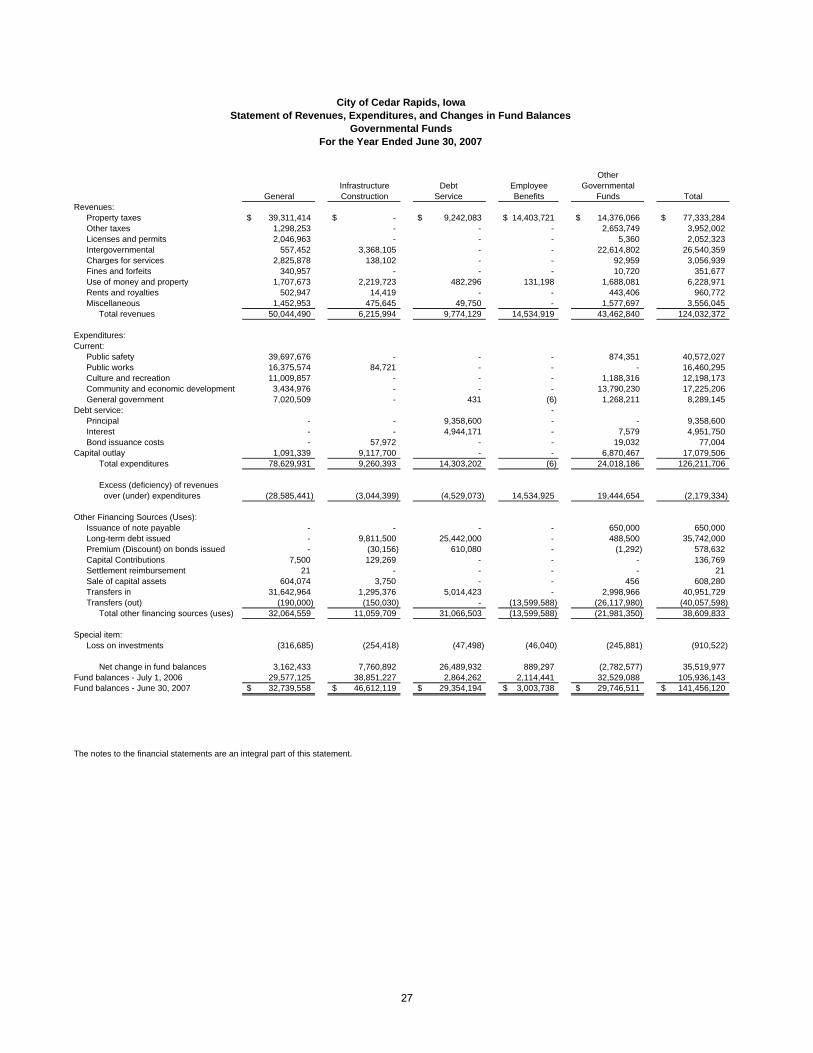
Property taxes 39,311,414$ -$ 9,242,083$ 14,403,721$ 14,376,066$ 77,333,284$ Other taxes 1,298,253 - - - 2,653,749 3,952,002 Licenses and permits 2,046,963 - - - 5,360 2,052,323 Intergovernmental 557,452 3,368,105 - - 22,614,802 26,540,359 Charges for services 2,825,878 138,102 - - 92,959 3,056,939 Fines and forfeits 340,957 - - - 10,720 351,677 Use of money and property 1,707,673 2,219,723 482,296 131,198 1,688,081 6,228,971 Rents and royalties 502,947 14,419 - - 443,406 960,772 Miscellaneous 1,452,953 475,645 49,750 - 1,577,697 3,556,045
Total revenues 50,044,490 6,215,994 9,774,129 14,534,919 43,462,840 124,032,372
Expenditures:Current:
Public safety 39,697,676 - - - 874,351 40,572,027 Public works 16,375,574 84,721 - - - 16,460,295 Culture and recreation 11,009,857 - - - 1,188,316 12,198,173 Community and economic development 3,434,976 - - - 13,790,230 17,225,206 General government 7,020,509 - 431 (6) 1,268,211 8,289,145
Debt service: - Principal - - 9,358,600 - - 9,358,600 Interest - - 4,944,171 - 7,579 4,951,750 Bond issuance costs - 57,972 - - 19,032 77,004
Capital outlay 1,091,339 9,117,700 - - 6,870,467 17,079,506 Total expenditures 78,629,931 9,260,393 14,303,202 (6) 24,018,186 126,211,706
Excess (deficiency) of revenues over (under) expenditures (28,585,441) (3,044,399) (4,529,073) 14,534,925 19,444,654 (2,179,334)
Other Financing Sources (Uses):Issuance of note payable - - - - 650,000 650,000 Long-term debt issued - 9,811,500 25,442,000 - 488,500 35,742,000 Premium (Discount) on bonds issued - (30,156) 610,080 - (1,292) 578,632 Capital Contributions 7,500 129,269 - - - 136,769 Settlement reimbursement 21 - - - - 21 Sale of capital assets 604,074 3,750 - - 456 608,280 Transfers in 31,642,964 1,295,376 5,014,423 - 2,998,966 40,951,729 Transfers (out) (190,000) (150,030) - (13,599,588) (26,117,980) (40,057,598)
Total other financing sources (uses) 32,064,559 11,059,709 31,066,503 (13,599,588) (21,981,350) 38,609,833
Special item:Loss on investments (316,685) (254,418) (47,498) (46,040) (245,881) (910,522)
Net change in fund balances 3,162,433 7,760,892 26,489,932 889,297 (2,782,577) 35,519,977 Fund balances - July 1, 2006 29,577,125 38,851,227 2,864,262 2,114,441 32,529,088 105,936,143 Fund balances - June 30, 2007 32,739,558$ 46,612,119$ 29,354,194$ 3,003,738$ 29,746,511$ 141,456,120$
The notes to the financial statements are an integral part of this statement.
City of Cedar Rapids, IowaStatement of Revenues, Expenditures, and Changes in Fund Balances
Governmental FundsFor the Year Ended June 30, 2007
27
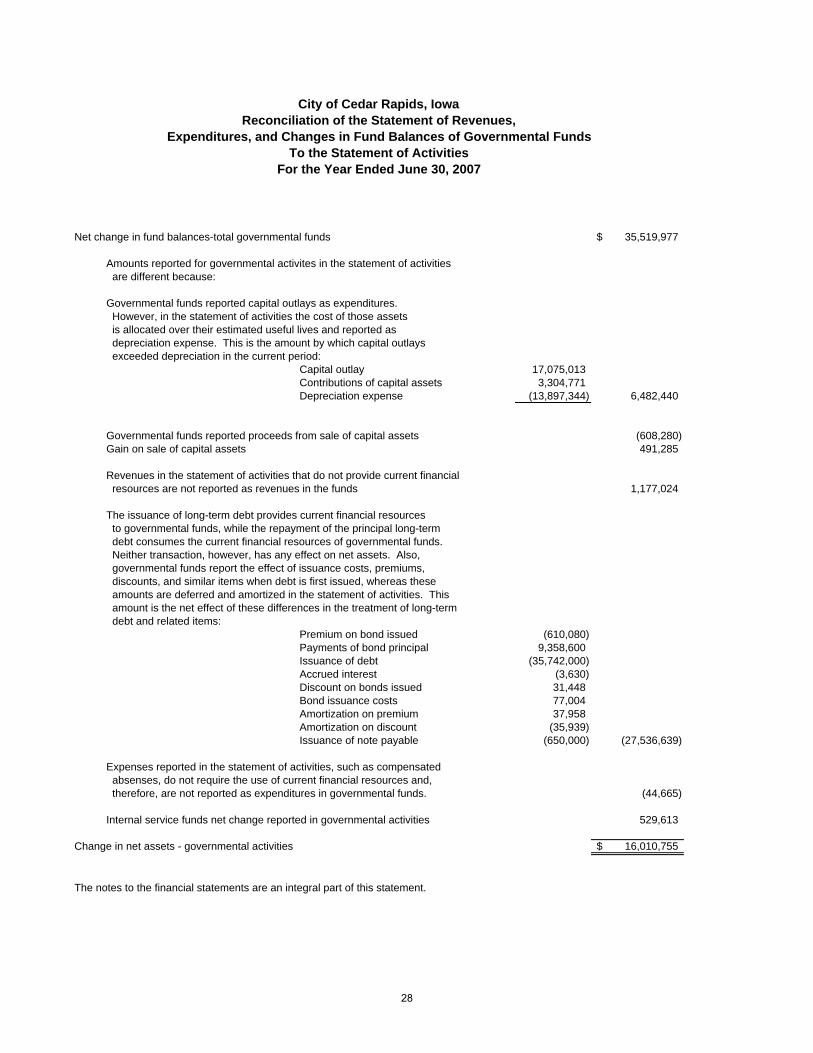
Net change in fund balances-total governmental funds 35,519,977$
Amounts reported for governmental activites in the statement of activities are different because:
Governmental funds reported capital outlays as expenditures. However, in the statement of activities the cost of those assets is allocated over their estimated useful lives and reported as depreciation expense. This is the amount by which capital outlays exceeded depreciation in the current period: Capital outlay 17,075,013 Contributions of capital assets 3,304,771 Depreciation expense (13,897,344) 6,482,440
Governmental funds reported proceeds from sale of capital assets (608,280) Gain on sale of capital assets 491,285
Revenues in the statement of activities that do not provide current financial resources are not reported as revenues in the funds 1,177,024
The issuance of long-term debt provides current financial resources to governmental funds, while the repayment of the principal long-term debt consumes the current financial resources of governmental funds. Neither transaction, however, has any effect on net assets. Also, governmental funds report the effect of issuance costs, premiums, discounts, and similar items when debt is first issued, whereas these amounts are deferred and amortized in the statement of activities. This amount is the net effect of these differences in the treatment of long-term debt and related items: Premium on bond issued (610,080) Payments of bond principal 9,358,600 Issuance of debt (35,742,000) Accrued interest (3,630) Discount on bonds issued 31,448 Bond issuance costs 77,004 Amortization on premium 37,958 Amortization on discount (35,939) Issuance of note payable (650,000) (27,536,639)
Expenses reported in the statement of activities, such as compensated absenses, do not require the use of current financial resources and, therefore, are not reported as expenditures in governmental funds. (44,665)
Internal service funds net change reported in governmental activities 529,613
Change in net assets - governmental activities 16,010,755$
The notes to the financial statements are an integral part of this statement.
For the Year Ended June 30, 2007
City of Cedar Rapids, IowaReconciliation of the Statement of Revenues,
Expenditures, and Changes in Fund Balances of Governmental FundsTo the Statement of Activities
28

29
City of Cedar Rapids, IowaStatement of Net Assets
Proprietary FundsJune 30, 2007
Business-type Activities - Enterprise FundsGovernmental
Water Pollution Sanitary Activities - InternalWater Control Sewer Other Total Service Funds
ASSETSCurrent assets:
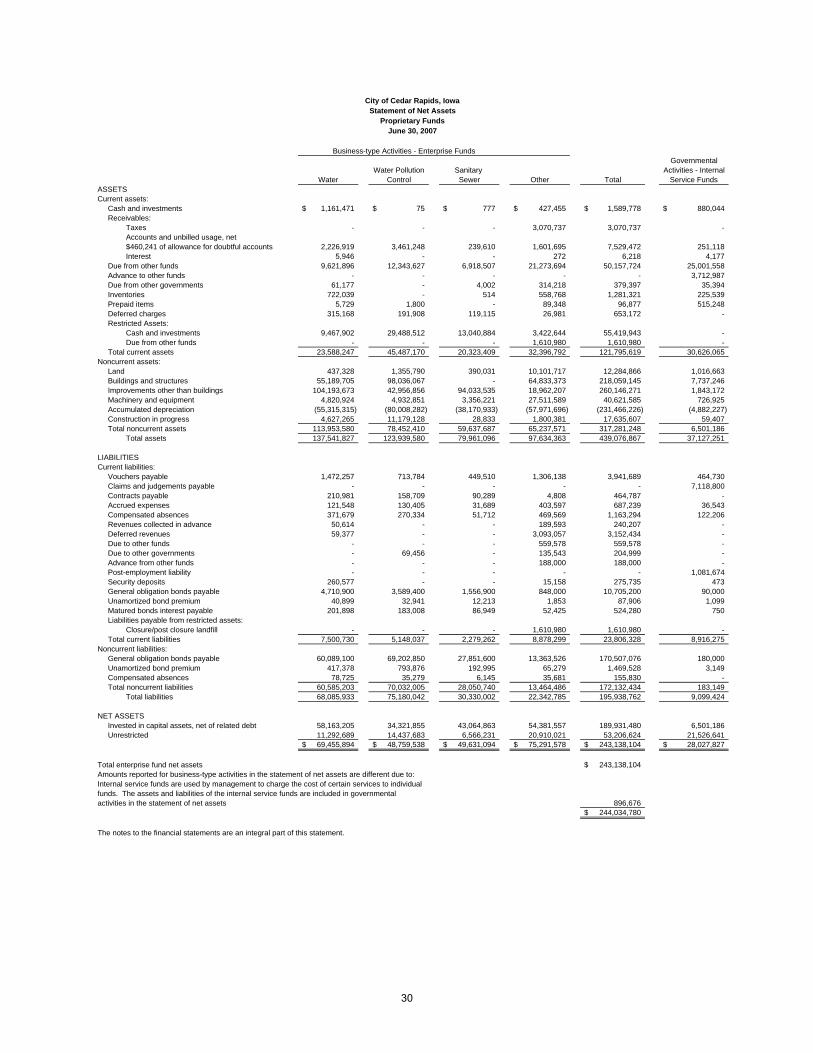
Cash and investments 1,161,471$ 75$ 777$ 427,455$ 1,589,778$ 880,044$ Receivables:
Taxes - - - 3,070,737 3,070,737 - Accounts and unbilled usage, net$460,241 of allowance for doubtful accounts 2,226,919 3,461,248 239,610 1,601,695 7,529,472 251,118 Interest 5,946 - - 272 6,218 4,177
Due from other funds 9,621,896 12,343,627 6,918,507 21,273,694 50,157,724 25,001,558 Advance to other funds - - - - - 3,712,987 Due from other governments 61,177 - 4,002 314,218 379,397 35,394 Inventories 722,039 - 514 558,768 1,281,321 225,539 Prepaid items 5,729 1,800 - 89,348 96,877 515,248 Deferred charges 315,168 191,908 119,115 26,981 653,172 - Restricted Assets:
Cash and investments 9,467,902 29,488,512 13,040,884 3,422,644 55,419,943 - Due from other funds - - - 1,610,980 1,610,980 -
Total current assets 23,588,247 45,487,170 20,323,409 32,396,792 121,795,619 30,626,065 Noncurrent assets:
Land 437,328 1,355,790 390,031 10,101,717 12,284,866 1,016,663 Buildings and structures 55,189,705 98,036,067 - 64,833,373 218,059,145 7,737,246 Improvements other than buildings 104,193,673 42,956,856 94,033,535 18,962,207 260,146,271 1,843,172 Machinery and equipment 4,820,924 4,932,851 3,356,221 27,511,589 40,621,585 726,925 Accumulated depreciation (55,315,315) (80,008,282) (38,170,933) (57,971,696) (231,466,226) (4,882,227) Construction in progress 4,627,265 11,179,128 28,833 1,800,381 17,635,607 59,407 Total noncurrent assets 113,953,580 78,452,410 59,637,687 65,237,571 317,281,248 6,501,186
Total assets 137,541,827 123,939,580 79,961,096 97,634,363 439,076,867 37,127,251
LIABILITIESCurrent liabilities:
Vouchers payable 1,472,257 713,784 449,510 1,306,138 3,941,689 464,730 Claims and judgements payable - - - - - 7,118,800 Contracts payable 210,981 158,709 90,289 4,808 464,787 - Accrued expenses 121,548 130,405 31,689 403,597 687,239 36,543 Compensated absences 371,679 270,334 51,712 469,569 1,163,294 122,206 Revenues collected in advance 50,614 - - 189,593 240,207 - Deferred revenues 59,377 - - 3,093,057 3,152,434 - Due to other funds - - - 559,578 559,578 - Due to other governments - 69,456 - 135,543 204,999 - Advance from other funds - - - 188,000 188,000 - Post-employment liability - - - - - 1,081,674 Security deposits 260,577 - - 15,158 275,735 473 General obligation bonds payable 4,710,900 3,589,400 1,556,900 848,000 10,705,200 90,000 Unamortized bond premium 40,899 32,941 12,213 1,853 87,906 1,099 Matured bonds interest payable 201,898 183,008 86,949 52,425 524,280 750 Liabilities payable from restricted assets:
Closure/post closure landfill - - - 1,610,980 1,610,980 - Total current liabilities 7,500,730 5,148,037 2,279,262 8,878,299 23,806,328 8,916,275
Noncurrent liabilities:General obligation bonds payable 60,089,100 69,202,850 27,851,600 13,363,526 170,507,076 180,000 Unamortized bond premium 417,378 793,876 192,995 65,279 1,469,528 3,149 Compensated absences 78,725 35,279 6,145 35,681 155,830 - Total noncurrent liabilities 60,585,203 70,032,005 28,050,740 13,464,486 172,132,434 183,149
Total liabilities 68,085,933 75,180,042 30,330,002 22,342,785 195,938,762 9,099,424
NET ASSETSInvested in capital assets, net of related debt 58,163,205 34,321,855 43,064,863 54,381,557 189,931,480 6,501,186 Unrestricted 11,292,689 14,437,683 6,566,231 20,910,021 53,206,624 21,526,641
69,455,894$ 48,759,538$ 49,631,094$ 75,291,578$ 243,138,104$ 28,027,827$
Total enterprise fund net assets 243,138,104$ Amounts reported for business-type activities in the statement of net assets are different due to:Internal service funds are used by management to charge the cost of certain services to individual funds. The assets and liabilities of the internal service funds are included in governmentalactivities in the statement of net assets 896,676
244,034,780$
The notes to the financial statements are an integral part of this statement.
30
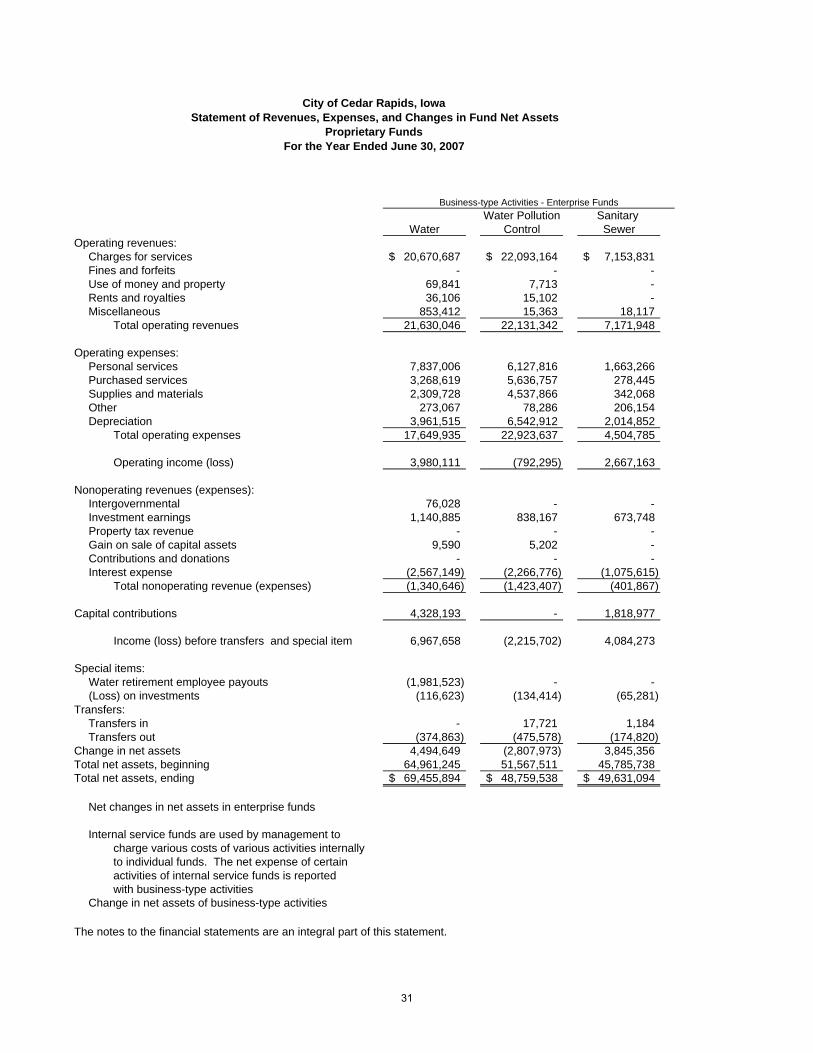
Water Pollution Sanitary Water Control Sewer
Operating revenues: Charges for services 20,670,687$ 22,093,164$ 7,153,831$
Fines and forfeits - - - Use of money and property 69,841 7,713 - Rents and royalties 36,106 15,102 - Miscellaneous 853,412 15,363 18,117
Total operating revenues 21,630,046 22,131,342 7,171,948
Operating expenses:Personal services 7,837,006 6,127,816 1,663,266 Purchased services 3,268,619 5,636,757 278,445 Supplies and materials 2,309,728 4,537,866 342,068 Other 273,067 78,286 206,154 Depreciation 3,961,515 6,542,912 2,014,852
Total operating expenses 17,649,935 22,923,637 4,504,785
Operating income (loss) 3,980,111 (792,295) 2,667,163
Nonoperating revenues (expenses):Intergovernmental 76,028 - - Investment earnings 1,140,885 838,167 673,748 Property tax revenue - - - Gain on sale of capital assets 9,590 5,202 - Contributions and donations - - - Interest expense (2,567,149) (2,266,776) (1,075,615)
Total nonoperating revenue (expenses) (1,340,646) (1,423,407) (401,867)
Capital contributions 4,328,193 - 1,818,977
Income (loss) before transfers and special item 6,967,658 (2,215,702) 4,084,273
Special items:Water retirement employee payouts (1,981,523) - - (Loss) on investments (116,623) (134,414) (65,281)
Transfers:Transfers in - 17,721 1,184 Transfers out (374,863) (475,578) (174,820)
Change in net assets 4,494,649 (2,807,973) 3,845,356 Total net assets, beginning 64,961,245 51,567,511 45,785,738 Total net assets, ending 69,455,894$ 48,759,538$ 49,631,094$
Net changes in net assets in enterprise funds
Internal service funds are used by management tocharge various costs of various activities internallyto individual funds. The net expense of certainactivities of internal service funds is reportedwith business-type activities
Change in net assets of business-type activities
The notes to the financial statements are an integral part of this statement.
Business-type Activities - Enterprise Funds
City of Cedar Rapids, IowaStatement of Revenues, Expenses, and Changes in Fund Net Assets
Proprietary FundsFor the Year Ended June 30, 2007
31
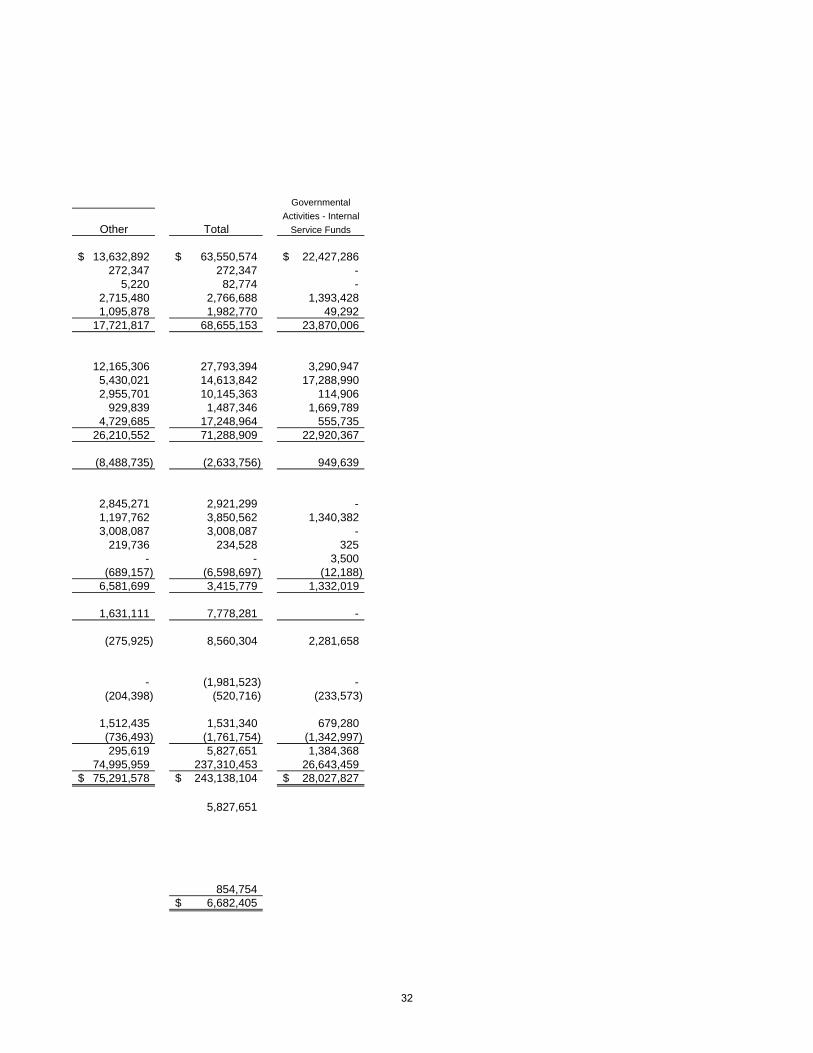
GovernmentalActivities - Internal
Other Total Service Funds
13,632,892$ 63,550,574$ 22,427,286$ 272,347 272,347 -
5,220 82,774 - 2,715,480 2,766,688 1,393,428 1,095,878 1,982,770 49,292
17,721,817 68,655,153 23,870,006
12,165,306 27,793,394 3,290,947 5,430,021 14,613,842 17,288,990 2,955,701 10,145,363 114,906
929,839 1,487,346 1,669,789 4,729,685 17,248,964 555,735
26,210,552 71,288,909 22,920,367
(8,488,735) (2,633,756) 949,639
2,845,271 2,921,299 - 1,197,762 3,850,562 1,340,382 3,008,087 3,008,087 -
219,736 234,528 325 - - 3,500
(689,157) (6,598,697) (12,188) 6,581,699 3,415,779 1,332,019
1,631,111 7,778,281 -
(275,925) 8,560,304 2,281,658
- (1,981,523) - (204,398) (520,716) (233,573)
1,512,435 1,531,340 679,280 (736,493) (1,761,754) (1,342,997) 295,619 5,827,651 1,384,368
74,995,959 237,310,453 26,643,459 75,291,578$ 243,138,104$ 28,027,827$
5,827,651
854,754 6,682,405$
32
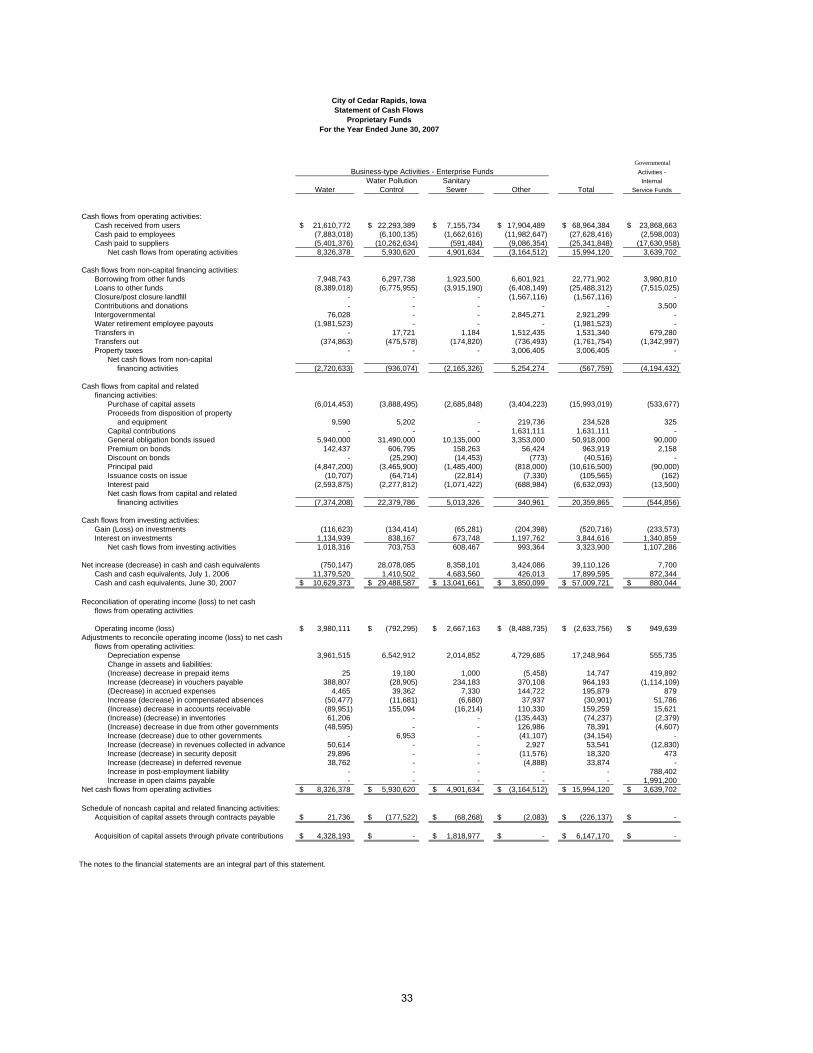
GovernmentalActivities -
Water Pollution Sanitary InternalWater Control Sewer Other Total Service Funds
Cash flows from operating activities:Cash received from users 21,610,772$ 22,293,389$ 7,155,734$ 17,904,489$ 68,964,384$ 23,868,663$ Cash paid to employees (7,883,018) (6,100,135) (1,662,616) (11,982,647) (27,628,416) (2,598,003) Cash paid to suppliers (5,401,376) (10,262,634) (591,484) (9,086,354) (25,341,848) (17,630,958)
Net cash flows from operating activities 8,326,378 5,930,620 4,901,634 (3,164,512) 15,994,120 3,639,702
Cash flows from non-capital financing activities:Borrowing from other funds 7,948,743 6,297,738 1,923,500 6,601,921 22,771,902 3,980,810 Loans to other funds (8,389,018) (6,775,955) (3,915,190) (6,408,149) (25,488,312) (7,515,025) Closure/post closure landfill - - - (1,567,116) (1,567,116) - Contributions and donations - - - - - 3,500 Intergovernmental 76,028 - - 2,845,271 2,921,299 - Water retirement employee payouts (1,981,523) - - - (1,981,523) - Transfers in - 17,721 1,184 1,512,435 1,531,340 679,280 Transfers out (374,863) (475,578) (174,820) (736,493) (1,761,754) (1,342,997) Property taxes - - - 3,006,405 3,006,405 -
Net cash flows from non-capitalfinancing activities (2,720,633) (936,074) (2,165,326) 5,254,274 (567,759) (4,194,432)
Cash flows from capital and relatedfinancing activities:
Purchase of capital assets (6,014,453) (3,888,495) (2,685,848) (3,404,223) (15,993,019) (533,677) Proceeds from disposition of property
and equipment 9,590 5,202 - 219,736 234,528 325 Capital contributions - - - 1,631,111 1,631,111 - General obligation bonds issued 5,940,000 31,490,000 10,135,000 3,353,000 50,918,000 90,000 Premium on bonds 142,437 606,795 158,263 56,424 963,919 2,158 Discount on bonds - (25,290) (14,453) (773) (40,516) - Principal paid (4,847,200) (3,465,900) (1,485,400) (818,000) (10,616,500) (90,000) Issuance costs on issue (10,707) (64,714) (22,814) (7,330) (105,565) (162) Interest paid (2,593,875) (2,277,812) (1,071,422) (688,984) (6,632,093) (13,500) Net cash flows from capital and related
financing activities (7,374,208) 22,379,786 5,013,326 340,961 20,359,865 (544,856)
Cash flows from investing activities:Gain (Loss) on investments (116,623) (134,414) (65,281) (204,398) (520,716) (233,573) Interest on investments 1,134,939 838,167 673,748 1,197,762 3,844,616 1,340,859
Net cash flows from investing activities 1,018,316 703,753 608,467 993,364 3,323,900 1,107,286
Net increase (decrease) in cash and cash equivalents (750,147) 28,078,085 8,358,101 3,424,086 39,110,126 7,700 Cash and cash equivalents, July 1, 2006 11,379,520 1,410,502 4,683,560 426,013 17,899,595 872,344 Cash and cash equivalents, June 30, 2007 10,629,373$ 29,488,587$ 13,041,661$ 3,850,099$ 57,009,721$ 880,044$
Reconciliation of operating income (loss) to net cashflows from operating activities
Operating income (loss) 3,980,111$ (792,295)$ 2,667,163$ (8,488,735)$ (2,633,756)$ 949,639$ Adjustments to reconcile operating income (loss) to net cash
flows from operating activities:Depreciation expense 3,961,515 6,542,912 2,014,852 4,729,685 17,248,964 555,735 Change in assets and liabilities:(Increase) decrease in prepaid items 25 19,180 1,000 (5,458) 14,747 419,892 Increase (decrease) in vouchers payable 388,807 (28,905) 234,183 370,108 964,193 (1,114,109) (Decrease) in accrued expenses 4,465 39,362 7,330 144,722 195,879 879 Increase (decrease) in compensated absences (50,477) (11,681) (6,680) 37,937 (30,901) 51,786 (Increase) decrease in accounts receivable (89,951) 155,094 (16,214) 110,330 159,259 15,621 (Increase) (decrease) in inventories 61,206 - - (135,443) (74,237) (2,379) (Increase) decrease in due from other governments (48,595) - - 126,986 78,391 (4,607) Increase (decrease) due to other governments - 6,953 - (41,107) (34,154) - Increase (decrease) in revenues collected in advance 50,614 - - 2,927 53,541 (12,830) Increase (decrease) in security deposit 29,896 - - (11,576) 18,320 473 Increase (decrease) in deferred revenue 38,762 - - (4,888) 33,874 - Increase in post-employment liability - - - - - 788,402 Increase in open claims payable - - - - - 1,991,200
Net cash flows from operating activities 8,326,378$ 5,930,620$ 4,901,634$ (3,164,512)$ 15,994,120$ 3,639,702$
Schedule of noncash capital and related financing activities:Acquisition of capital assets through contracts payable 21,736$ (177,522)$ (68,268)$ (2,083)$ (226,137)$ -$
Acquisition of capital assets through private contributions 4,328,193$ -$ 1,818,977$ -$ 6,147,170$ -$
The notes to the financial statements are an integral part of this statement.
Business-type Activities - Enterprise Funds
City of Cedar Rapids, IowaStatement of Cash Flows
Proprietary FundsFor the Year Ended June 30, 2007
33
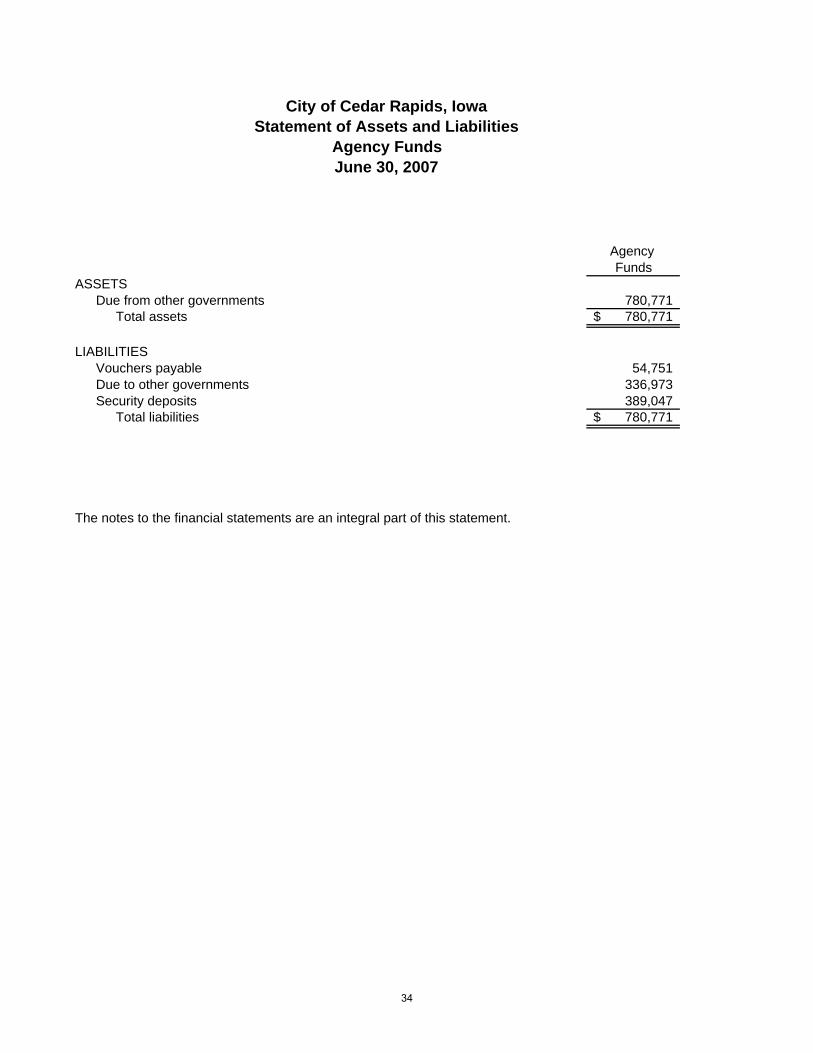
Agency Funds
ASSETSDue from other governments 780,771
Total assets 780,771$
LIABILITIES Vouchers payable 54,751 Due to other governments 336,973 Security deposits 389,047
Total liabilities 780,771$
The notes to the financial statements are an integral part of this statement.
City of Cedar Rapids, IowaStatement of Assets and Liabilities
Agency FundsJune 30, 2007
34
CITY OF CEDAR RAPIDS, IOWA NOTES TO FINANCIAL STATEMENTS
JUNE 30, 2007
Note 1: Summary of Significant Accounting Policies Reporting Entity
The City of Cedar Rapids, incorporated in 1849, operates under the council-manager form of government. The City provides a broad range of service to its citizens, including general government, public safety, street cleaning and maintenance, cultural, and park facilities. It also operates a parking system, a mass transportation system, water, sewer and other sanitation utilities, several recreational, convention and entertainment oriented facilities, and through its component units, an airport and solid waste disposal facilities.
The accompanying financial statements present the City and its component units. Component units, although legally separate entities, are, in substance, part of the City’s operations. The component units discussed below are included in the City’s reporting entity because of the significance of their operational or financial relationships with the City. Each discretely presented component unit is reported in a separate column in the government-wide financial statements to emphasize that it is legally separate from the City. The Eastern Iowa Airport and Cedar Rapids/Linn County Solid Waste Agency have a June 30 year end and the Cedar Rapids Public Library Foundation has a year end of December 31. They are as follows: 1. The Eastern Iowa Airport and related parking is operated by the Cedar Rapids Airport Commission. The Commission has all the powers granted to the City except for the authority to sell the airport. The Mayor appoints the members of the Airport Commission with City Council approval. The City also approves its operating budget. The Eastern Iowa Airport does not publish its own annual financial report.
2. The Cedar Rapids/Linn County Solid Waste Agency(CRLCSWA) is the result of a 28E agreement as provided under the Code of Iowa. CRLCSWA disposes of solid wastes into the combined City/County landfills in an integrated manner for the public benefit. The City of Cedar Rapids has the authority to appoint the majority of CRLCSWA’s board of directors, and is able to impose its will on CRLCSWA’s operations. CRLCSWA publishes its own annual financial report, which is available at their office 1954 County Home Road, Marion, Iowa 52302 upon request. Further reference regarding the City’s on going financial interest as a result of this agreement can be found in Note 14 Closure and Postclosure Care Cost. 3. The Cedar Rapids Public Library Foundation is a nonprofit corporation organized under the laws of the State of Iowa for the purpose of providing resources to be used for the benefit of the Cedar Rapids Public Library. The Foundation publishes its own annual financial report, using the not-for-profit reporting model, which is available at their office 500 1st Street S.E., Cedar Rapids, Iowa 52401.
Government-wide and fund financial statements The government-wide financial statements (i.e., the statement of net assets and the statement of activities) report information on all of the non-fiduciary activities of the City and its component units. For the most part, the effect of interfund activity has been removed from these statements. Governmental activities, which normally are supported by taxes and intergovernmental revenues, are reported separately from business-type activities, which rely to a significant extent on fees and charges for services. Likewise, the City is reported separately from component units. The statement of activities demonstrates the degree to which the direct expenses of a given function or segment are offset by program revenues. Direct expenses are those that are clearly identifiable with a specific function or segment. Program revenues include 1) charges to customers or applicants who purchase, use, or directly benefit from goods, services, or privileges provided by a given function or segment and 2) grants and contributions that are restricted to meeting the operational or capital
35
CITY OF CEDAR RAPIDS, IOWA NOTES TO FINANCIAL STATEMENTS
JUNE 30, 2007
requirements of a particular function or segment. Taxes and other items not properly included among program revenues are reported instead as general revenues. Separate financial statements are provided for governmental funds, proprietary funds, and fiduciary funds, even though the latter are excluded from the government-wide financial statements. Major individual governmental funds and major individual enterprise funds are reported as separate columns in the fund financial statements. Non-major funds are combined into a single column within the governmental and proprietary funds in the financial section of the basic financial statements and are detailed in the supplemental information. Measurement focus, basis of accounting, and financial statement presentation The government-wide financial statements are reported using the economic resources measurement focus and the accrual basis of accounting, as are the proprietary fund and fiduciary fund financial statements. Revenues are recorded when earned and expenses are recorded when a liability is incurred, regardless of the timing of related cash flows. Property taxes are recognized as revenues in the year for which they are levied. Grants and similar items are recognized as revenue as soon as all eligibility requirements imposed by the provider have been met. Governmental fund financial statements are reported using the current financial resources measurement focus and the modified accrual basis of accounting. Revenues are recognized as soon as they are both measurable and available. Revenues are considered to be available when they are collectible within the current period or soon enough thereafter to pay liabilities of the current period. For this purpose, the government considers revenues to be available if they are collected within 60 days of the end of the current fiscal period. Expenditures generally are recorded when a liability is incurred, as under accrual accounting. However, debt service expenditures, as well as expenditures related to compensated absences and claims and judgements, are recorded only when payment is due (matured). Property taxes, franchise taxes, licenses, and interest associated with the current fiscal period are all considered to be susceptible to accrual and so have been recognized as revenues of the current fiscal period. Only the portion of special assessments receivable due within the current fiscal period is considered to be susceptible to accrual as revenue of the current period. Substantially all shared revenues are recorded when the underlying exchange transaction has occurred. For governmental funds revenue from grant revenues is recorded as deferred revenue until they become available. Revenue from federal awards is recognized when the City has done everything necessary to establish its right to revenue. For governmental funds, revenue from federal grants is recognized when they become both measurable and available. Expenditures of federal awards are recognized in the accounting period when the liability is incurred. Income from accounts receivables and unbilled usage is recognized when earned. Licenses and permits, fines and forfeits, fees and refunds, charges for services (other than enterprise), miscellaneous and other revenues are recorded as revenue when received in cash because they are generally not measurable until actually received. Special assessment receivables are recorded at the time of their levy. The related revenue is recognized at the time it is due in the governmental funds and when levied for government-wide statements. All other revenue items are considered to be measurable and available only when cash is received by the City. The City of Cedar Rapids reports the following major governmental funds:
36
CITY OF CEDAR RAPIDS, IOWA NOTES TO FINANCIAL STATEMENTS
JUNE 30, 2007
General Fund
The General Fund accounts for all the financial resources of the City, except for those required to be accounted for by other funds. The revenues of the General Fund are primarily derived from general property taxes, charges for services, fines and forfeitures, licenses and permits, and certain revenues from state and federal sources. The expenditures of the General Fund primarily relate to general administration, police and fire protection, streets and public buildings operation and maintenance, and parks and recreation oriented activities.
Infrastructure Construction Fund The Infrastructure Construction Fund (a capital project fund) accounts for the construction or replacement of City infrastructure fixed assets such as streets, bridges, dams, sidewalks, and storm sewers. Debt Service Fund The Debt service fund accounts for the accumulation of resources for, and the payment of, long-term and special debt principal, interest, and related costs. Employee Benefits
The Employee benefits fund accounts for the employment benefits provided to the City’s employees in the general fund, which include FICA, health and dental insurance, retirement, workers comp, unemployment, life insurance, and long term disability.
The City reports the following major enterprise funds: Water Fund The Water Fund accounts for the operation and maintenance of the City’s water system. Water Pollution Control Fund The Water Pollution Control Fund accounts for the operation and maintenance of the City’s water pollution control facility. This facility also provides services to the cities of Hiawatha, Marion, and Robins, Iowa for fees based on usage. Sanitary Sewer Fund The Sanitary Sewer Fund accounts for the operation and maintenance of the City’s sanitary sewer system. Additionally, the City reports the following fund types: Internal service funds account for the financing of goods or services provided by one department or agency to other departments or agencies of the City, or to other governments, on a cost reimbursement basis. These include the risk management activities, public works building, and joint communications services for the City. Special revenue funds account for revenues derived from specific sources, which are required to be accounted for as separate funds. The Other Construction Fund (a capital project fund) accounts for the construction or replacement of City capital assets such as parks, police, and fire facilities and equipment. Fiduciary funds account for assets held by the City in a trustee or agency capacity for others and cannot be used to support the City’s own programs. The City’s fiduciary funds consist of: Agency funds, which are custodial in nature, report on assets and liabilities and do not involve
measurement of the results of operations. The City has the following agency funds: developers security deposits, regional planning, contractors permit deposits, and area ambulance.
Other enterprise funds account for operations and activities that are financed and operated in
37
CITY OF CEDAR RAPIDS, IOWA NOTES TO FINANCIAL STATEMENTS
JUNE 30, 2007
a manner similar to a private business enterprise, and where the costs of providing goods or services to the general public on a continuing basis are expected to be financed or recovered primarily through user charges, or where the City has decided that periodic determination of revenues earned, expenses incurred, and/or net income is appropriate for capital maintenance, public policy, management control, accountability or other purposes. The City has seven funds classified as other enterprise funds and they are as follows: Ground Transportation System, Parking System, Solid Waste Management, Golf, U.S. Cellular Center, Paramount Theatre, and Ice Arena. Private-sector standards of accounting and financial reporting issued prior to November 30, 1989, generally are followed in the government-wide and enterprise fund financial statements to the extent that those standards do not conflict with or contradict guidance of the Governmental Accounting Standards Board. Governments also have the option of following subsequent private-sector guidance for their government wide and enterprise funds, subject to this same limitation. The City has elected not to follow subsequent private-sector guidance. Transactions among City funds that would be treated as revenues and expenditures or expenses if they involved organizations external to City government are accounted for as revenues and expenditures or expenses in the funds involved. Transactions, which constitute reimbursements to a fund for expenditures initially made from it, which are properly applicable to another fund, are recorded as expenditures in the reimbursing fund and as reductions of expenditures in the reimbursed fund. Transactions, which constitute the transfer of resources from a fund receiving revenues to a fund through which the revenues are to be expended, are separately reported in the respective funds’ operating statements. Amounts reported as program revenues include 1) charges to customers or applicants for goods, services, or privileges provided, 2) operating grants and contributions, and 3) capital grants and contributions, including special assessments. Internally dedicated resources are reported as general revenues rather than as program revenues. Likewise, general revenues include all taxes. Proprietary funds distinguish operating revenues and expenses from non-operating items. Operating revenues and expenses generally result from providing services and producing and delivering goods in connection with a proprietary fund’s principal ongoing operations. The principal operating revenues of proprietary funds are user fees and charges to customers for sales and services. Operating expenses for proprietary funds include the cost of sales and services, administrative expenses, and depreciation on capital assets. All revenues and expenses not meeting this definition are reported as non-operating revenues and expenses. When both restricted and unrestricted resources are available for use, it is the City’s policy to use restricted resources first, then unrestricted resources as they are needed. Assets, liabilities, and net assets or equity Cash Management and Investments The City maintains one primary demand deposit account through which the majority of the City’s cash resources are processed. Substantially all City investment activity is transacted by the City in an investment pool of the General Fund, except for those funds required to maintain their investments separately. The earnings on the pooled investments are allocated to the funds on a systematic basis. Investments are stated at fair value.
38
CITY OF CEDAR RAPIDS, IOWA NOTES TO FINANCIAL STATEMENTS
JUNE 30, 2007
Short-term investments are reported at cost, which approximates fair value. Securities traded on a national or international exchange are valued at the last reported sales price at current exchange rates. The City invests in the Iowa Public Agency Investment Trust, which is a 2a7 – like pool. The Iowa Public Agency Investment Trust is a common law trust established under Iowa code law and is administered by an appointed investment management company. The fair value of the position in the trust is the same as the value of the shares. For purposes of the Statement of Cash Flows, the City considers the pooled cash and investments to be cash equivalents as these pooled amounts have the same characteristics of demand deposits. Receivables and Payables Activity between funds that are representative of lending/borrowing arrangements outstanding at the end of the fiscal year are referred to as either “due to/from other funds” (i.e., the current portion of interfund loans) or “advances to/from other funds” (i.e., the non-current portion of interfund loans). All other outstanding balances between funds are reported as “due to/from other funds”. Any residual balances outstanding between the governmental activities and business-type activities are reported in the government-wide financial statements as “internal balances”. Advances between funds, as reported in the fund financial statements, are offset by a fund balance reserve account in applicable governmental funds to indicate that they are not available for appropriation and are not expendable available financial resources. Property taxes receivable are recognized at the time an enforceable legal claim is established. This is determined to occur when the budget is certified. All City property taxes must be certified to the Linn County Auditor on or before the fifteenth day of March of each year for the upcoming fiscal year, which runs from July 1 to June 30. The county auditor is then required to place these City taxes upon the tax list. This levying of property taxes procedurally occurs during June prior to the fiscal year for which the taxes are to be collected. The property taxes actually become an enforceable lien against the property when the budget is certified. Property taxes levied by the Linn County Auditor for the year ended June 30, 2007, were due by July 1, 2006, with the first half installment being delinquent after September 30, 2006, and the second half installment being delinquent after March 31, 2007. Any collections remitted to the City within sixty days subsequent to year-end are recorded as property tax revenue. The current tax receivable represents the 2007 levy certified on March 15, 2007, based on 2006 assessed valuations. As the levy is intended for use in the 2008 fiscal year, the revenue has been recorded as unearned revenue. Inventories and prepaid items Inventories are recognized only in those funds in which they are material to the extent of affecting operations. All inventories are carried at lower of cost or market (first-in, first-out). The consumption method of accounting is applied to the governmental fund type inventories. Certain payments to vendors reflect costs applicable to future accounting periods and are recorded as prepaid items in both government-wide and fund financial statements. Restricted assets Assets within the individual funds, which can be designated by the City Council for any use within the fund’s purpose, are considered to be unrestricted assets. Assets, which are restricted for specific uses by bonded debt requirements, grant provisions, or other requirements are classified as restricted assets. Liabilities which are payable from restricted assets, are classified as such.
39
CITY OF CEDAR RAPIDS, IOWA NOTES TO FINANCIAL STATEMENTS
JUNE 30, 2007
Capital Assets Capital assets, which include land, buildings and structures, improvements other than buildings, which includes infrastructure, construction in progress, and machinery and equipment are reported in the applicable governmental or business-type activities columns in the government-wide financial statements. Capital assets are defined by the City as assets with an initial, individual cost of more than $5,000 and an estimated useful life in excess of two years. Such assets are recorded at historical cost. Donated capital assets are recorded at estimated fair value at the date of donation. The costs of normal maintenance and repairs that do not add to the value of the asset or materially extend assets lives are not capitalized. Major outlays for capital assets and improvements are capitalized as projects are constructed. Interest incurred during the construction phase of capital assets of business-type activities is included as part of the capitalized value of the assets constructed. During the year ended June 30, 2007, no interest expense was added to the cost of assets acquired in the business-type activities. Buildings, improvements other than buildings, and machinery and equipment of the primary government, as well as component units, are depreciated using the straight line method over the following estimated useful lives: Buildings and structures 20 to 50 years Improvements other than buildings 5 to 100 years Infrastructure 10 to 70 years Machinery and equipment 3 to 20 years Collections such as library books, are held for public exhibition, education, or research in the furtherance of public service rather than financial gain, protected, kept unencumbered, cared for, and preserved, and are subject to an organizational policy that requires the proceeds from sales of collections to be used to acquire other items for collections or access to the collections and therefore are not capitalized. Compensated Absences All full-time employees accumulate compensated absence and sick leave hours for subsequent use or for payment annually and/or upon termination, death, or retirement. Compensated absence benefits vest when earned. Sick leave accumulations consist of a vesting and non-vested portion. The non-vested portion of sick leave benefits, which are not included within these financial statements, at June 30, 2007, are as follows: Governmental $ 13,675,993 Business-type 3,976,710 Subtotal 17,652,703 Component Units 459,175 Total $ 18,111,878 For governmental funds, the current portion of unpaid compensated absences is the amount that is due. The amount of the liability not considered due is not reported in the fund financial statements. However, the entire compensated absence liability is reported on the government-wide financial statements. Long-term obligations In the government-wide financial statements, and proprietary fund types in the fund financial statements, long-term debt and other long-term obligations are reported as liabilities in the applicable governmental
40
CITY OF CEDAR RAPIDS, IOWA NOTES TO FINANCIAL STATEMENTS
JUNE 30, 2007
activities, business-type activities, or proprietary fund type statement of net assets. Bond premiums and discounts, as well as issuance costs, are deferred and amortized over the life of the bonds using the effective interest method. Bond issuance costs are reported as deferred charges and amortized over the term of the related debt. In the fund financial statements, governmental fund types recognize bond premiums and discounts, as well as bond issuance costs, during the current period. The face amount of debt issued is reported as other financing sources. Premiums received on debt issuance are reported as other financing sources while discounts on debt issuance are reported as other financing uses. Issuance costs, whether or not withheld from the actual debt proceeds received, are reported as debt service expenditures. Deferred Revenue Governmental funds report deferred revenue in connection with receivables for revenues that are not considered to be available to liquidate liabilities of the current period. Except for property taxes, which is not budgeted for in the current year, unavailable revenue is recognized for governmental activities in the government-wide statement. Governmental funds also defer revenue recognition in connection with resources that have been received, but not yet earned. Fund equity In the fund financial statements, governmental funds report reservations of fund balance for amounts that are not available for appropriation or are legally restricted by outside parties for use for a specific purpose. Designations of fund balance represent tentative management plans that are subject to change. Net assets Net assets represent the difference between assets and liabilities. Net assets invested in capital assets, net of related debt, consists of capital assets, net of accumulated depreciation, reduced by the outstanding balances of any borrowings used for the acquisition, construction or improvement of those assets. Net assets invested in capital assets, net of related debt excludes unspent debt proceeds. Net assets are reported as restricted when there are limitations imposed on their use through external restrictions imposed by creditors, grantors, or laws or regulations of other governments. The City first applies restricted resources when an expense is incurred for purposes for which both restricted and unrestricted net assets are available. Net assets restricted through enabling legislation included $29,354,194 for debt service, $6,578,249 for other special revenue, $10,193,630 for tax increment financing projects, $2,822,163 for road construction projects, $455,639 for Self-Supported Municipal Improvement District (SSMID) projects, and $3,003,738 for employee benefits. Budgetary Control, Compliance, and Appropriation Data As allowed by GASB Statement No. 41, Budgetary Comparison Schedules-Perspective Differences, the City presents budgetary comparison schedules as required supplementary information based on the program structure of ten functional areas as required by state statute for its legally adopted budget.
41
CITY OF CEDAR RAPIDS, IOWA NOTES TO FINANCIAL STATEMENTS
JUNE 30, 2007
Note 2: Internal and Component Unit Balances, Receivables and Payables Fund receivables and payables at June 30, 2007, were: Receivables Payables Due to/from other funds: Governmental: General Fund $ - $ 135,667,657 Infrastructure Construction Fund 27,969,494 - Debt Service Fund 2,813,050 - Employee Benefits 3,631,456 Nonmajor Funds 25,957,566 914,593 Internal Service Funds 25,001,558 - Total Governmental 85,373,124 136,582,250 Business-type: Water 9,621,896 - Water Pollution Control 12,343,627 - Sanitary Sewer 6,918,507 - Nonmajor Funds 22,884,674 559,578 Total Business-type 51,768,704 559,578 Total due to/from other funds $ 137,141,828 $ 137,141,828 These balances resulted from the time lag between the dates that (1) interfund goods and services are provided or reimbursable expenditures occur, (2) transactions are recorded in the accounting system, (3) payments between funds are made, and (4) the cash and investment pool. Advances to Advances from Governmental: General Fund $ 188,000 $ - Internal Service Funds 3,712,987 - Nonmajor Funds - 3,712,987 Business-type Nonmajor Funds - 188,000 Total advance to/from other funds $ 3,900,987 $ 3,900,987 These balances resulted from 1) advances from Risk Management to fund a site cleanup project in the Other Construction Fund until subsequent funding is received and 2) cash flow advances from the General Fund to U.S. Cellular Center Fund until further revenue is generated.
42
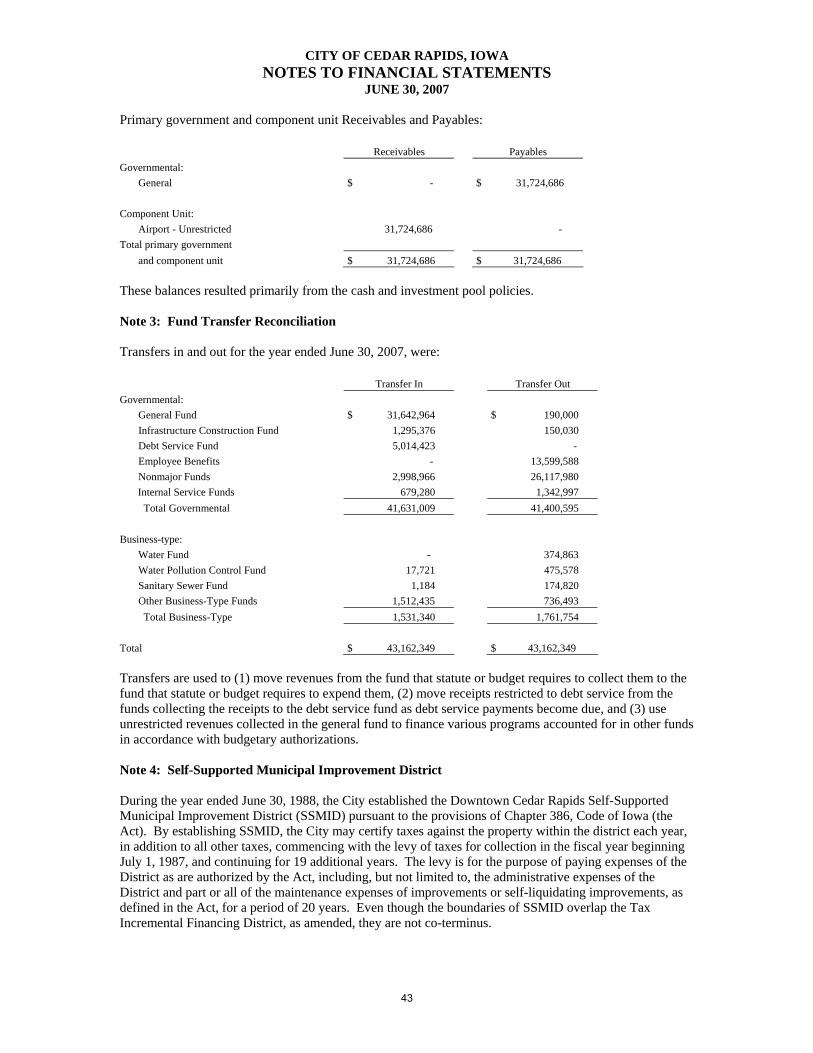
CITY OF CEDAR RAPIDS, IOWA NOTES TO FINANCIAL STATEMENTS
JUNE 30, 2007
Primary government and component unit Receivables and Payables: Receivables Payables Governmental: General $ - $ 31,724,686 Component Unit: Airport - Unrestricted 31,724,686 - Total primary government and component unit $ 31,724,686 $ 31,724,686 These balances resulted primarily from the cash and investment pool policies. Note 3: Fund Transfer Reconciliation Transfers in and out for the year ended June 30, 2007, were: Transfer In Transfer Out Governmental: General Fund $ 31,642,964 $ 190,000 Infrastructure Construction Fund 1,295,376 150,030 Debt Service Fund 5,014,423 - Employee Benefits - 13,599,588 Nonmajor Funds 2,998,966 26,117,980 Internal Service Funds 679,280 1,342,997 Total Governmental 41,631,009 41,400,595 Business-type: Water Fund - 374,863 Water Pollution Control Fund 17,721 475,578 Sanitary Sewer Fund 1,184 174,820 Other Business-Type Funds 1,512,435 736,493 Total Business-Type 1,531,340 1,761,754 Total $ 43,162,349 $ 43,162,349 Transfers are used to (1) move revenues from the fund that statute or budget requires to collect them to the fund that statute or budget requires to expend them, (2) move receipts restricted to debt service from the funds collecting the receipts to the debt service fund as debt service payments become due, and (3) use unrestricted revenues collected in the general fund to finance various programs accounted for in other funds in accordance with budgetary authorizations. Note 4: Self-Supported Municipal Improvement District During the year ended June 30, 1988, the City established the Downtown Cedar Rapids Self-Supported Municipal Improvement District (SSMID) pursuant to the provisions of Chapter 386, Code of Iowa (the Act). By establishing SSMID, the City may certify taxes against the property within the district each year, in addition to all other taxes, commencing with the levy of taxes for collection in the fiscal year beginning July 1, 1987, and continuing for 19 additional years. The levy is for the purpose of paying expenses of the District as are authorized by the Act, including, but not limited to, the administrative expenses of the District and part or all of the maintenance expenses of improvements or self-liquidating improvements, as defined in the Act, for a period of 20 years. Even though the boundaries of SSMID overlap the Tax Incremental Financing District, as amended, they are not co-terminus.
43
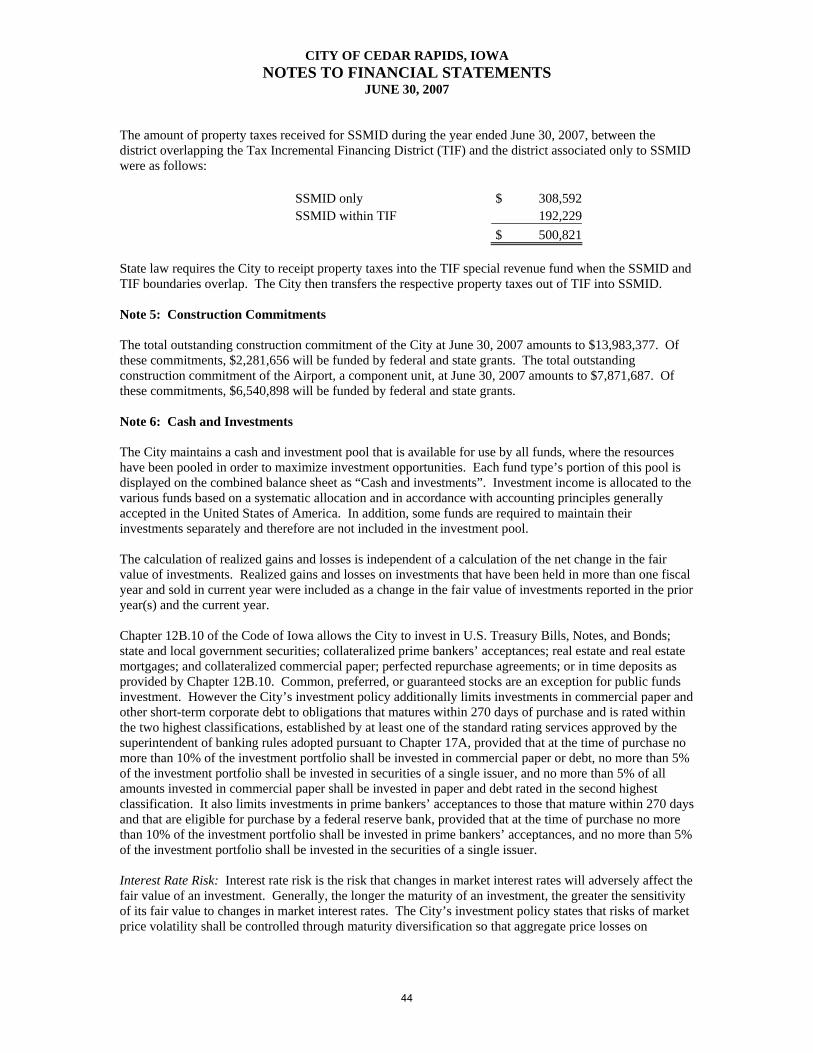
CITY OF CEDAR RAPIDS, IOWA NOTES TO FINANCIAL STATEMENTS
JUNE 30, 2007
The amount of property taxes received for SSMID during the year ended June 30, 2007, between the district overlapping the Tax Incremental Financing District (TIF) and the district associated only to SSMID were as follows: SSMID only $ 308,592 SSMID within TIF 192,229 $ 500,821 State law requires the City to receipt property taxes into the TIF special revenue fund when the SSMID and TIF boundaries overlap. The City then transfers the respective property taxes out of TIF into SSMID. Note 5: Construction Commitments The total outstanding construction commitment of the City at June 30, 2007 amounts to $13,983,377. Of these commitments, $2,281,656 will be funded by federal and state grants. The total outstanding construction commitment of the Airport, a component unit, at June 30, 2007 amounts to $7,871,687. Of these commitments, $6,540,898 will be funded by federal and state grants. Note 6: Cash and Investments The City maintains a cash and investment pool that is available for use by all funds, where the resources have been pooled in order to maximize investment opportunities. Each fund type’s portion of this pool is displayed on the combined balance sheet as “Cash and investments”. Investment income is allocated to the various funds based on a systematic allocation and in accordance with accounting principles generally accepted in the United States of America. In addition, some funds are required to maintain their investments separately and therefore are not included in the investment pool. The calculation of realized gains and losses is independent of a calculation of the net change in the fair value of investments. Realized gains and losses on investments that have been held in more than one fiscal year and sold in current year were included as a change in the fair value of investments reported in the prior year(s) and the current year. Chapter 12B.10 of the Code of Iowa allows the City to invest in U.S. Treasury Bills, Notes, and Bonds; state and local government securities; collateralized prime bankers’ acceptances; real estate and real estate mortgages; and collateralized commercial paper; perfected repurchase agreements; or in time deposits as provided by Chapter 12B.10. Common, preferred, or guaranteed stocks are an exception for public funds investment. However the City’s investment policy additionally limits investments in commercial paper and other short-term corporate debt to obligations that matures within 270 days of purchase and is rated within the two highest classifications, established by at least one of the standard rating services approved by the superintendent of banking rules adopted pursuant to Chapter 17A, provided that at the time of purchase no more than 10% of the investment portfolio shall be invested in commercial paper or debt, no more than 5% of the investment portfolio shall be invested in securities of a single issuer, and no more than 5% of all amounts invested in commercial paper shall be invested in paper and debt rated in the second highest classification. It also limits investments in prime bankers’ acceptances to those that mature within 270 days and that are eligible for purchase by a federal reserve bank, provided that at the time of purchase no more than 10% of the investment portfolio shall be invested in prime bankers’ acceptances, and no more than 5% of the investment portfolio shall be invested in the securities of a single issuer. Interest Rate Risk: Interest rate risk is the risk that changes in market interest rates will adversely affect the fair value of an investment. Generally, the longer the maturity of an investment, the greater the sensitivity of its fair value to changes in market interest rates. The City’s investment policy states that risks of market price volatility shall be controlled through maturity diversification so that aggregate price losses on
44
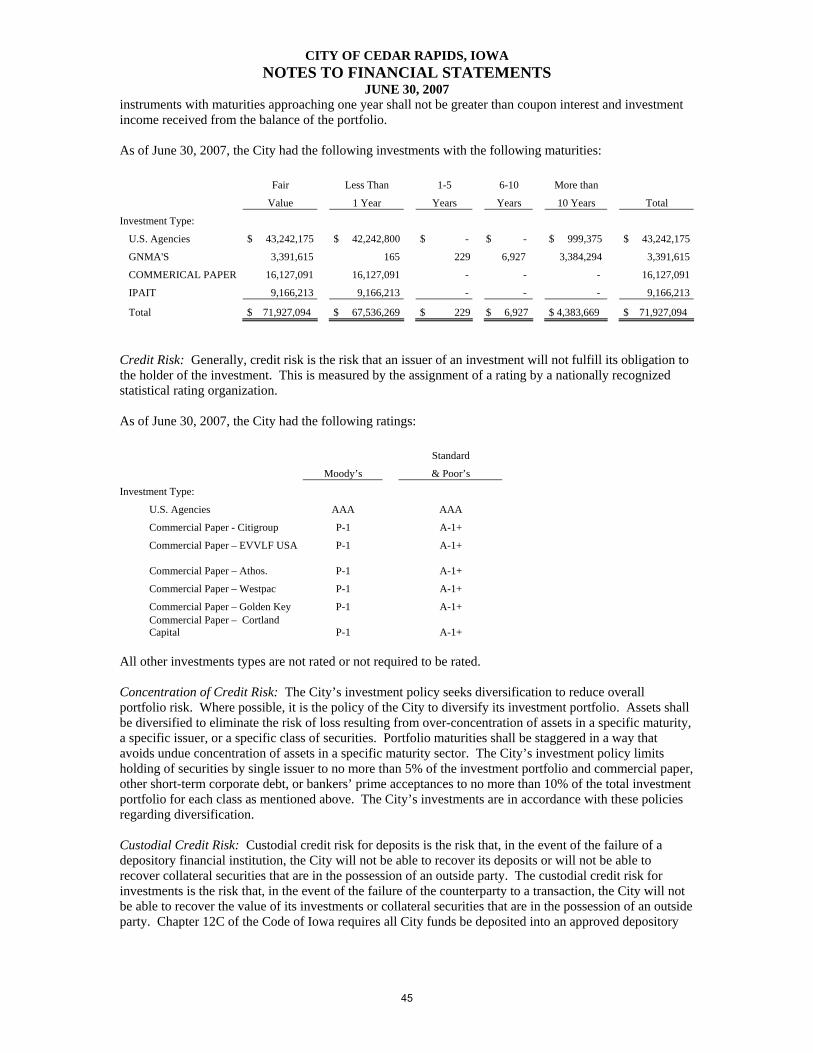
CITY OF CEDAR RAPIDS, IOWA NOTES TO FINANCIAL STATEMENTS
JUNE 30, 2007
instruments with maturities approaching one year shall not be greater than coupon interest and investment income received from the balance of the portfolio. As of June 30, 2007, the City had the following investments with the following maturities: Fair Less Than 1-5 6-10 More than
Value 1 Year Years Years 10 Years Total
Investment Type:
U.S. Agencies $ 43,242,175 $ 42,242,800 $ - $ - $ 999,375 $ 43,242,175
GNMA'S 3,391,615 165 229 6,927 3,384,294 3,391,615
COMMERICAL PAPER 16,127,091 16,127,091 - - - 16,127,091
IPAIT 9,166,213 9,166,213 - - - 9,166,213
Total $ 71,927,094 $ 67,536,269 $ 229 $ 6,927 $ 4,383,669 $ 71,927,094
Credit Risk: Generally, credit risk is the risk that an issuer of an investment will not fulfill its obligation to the holder of the investment. This is measured by the assignment of a rating by a nationally recognized statistical rating organization. As of June 30, 2007, the City had the following ratings: Standard
Moody’s & Poor’s
Investment Type:
U.S. Agencies AAA AAA
Commercial Paper - Citigroup P-1 A-1+
Commercial Paper – EVVLF USA P-1 A-1+
Commercial Paper – Athos.
P-1
A-1+
Commercial Paper – Westpac P-1 A-1+
Commercial Paper – Golden Key P-1 A-1+
Commercial Paper – Cortland Capital P-1
A-1+
All other investments types are not rated or not required to be rated. Concentration of Credit Risk: The City’s investment policy seeks diversification to reduce overall portfolio risk. Where possible, it is the policy of the City to diversify its investment portfolio. Assets shall be diversified to eliminate the risk of loss resulting from over-concentration of assets in a specific maturity, a specific issuer, or a specific class of securities. Portfolio maturities shall be staggered in a way that avoids undue concentration of assets in a specific maturity sector. The City’s investment policy limits holding of securities by single issuer to no more than 5% of the investment portfolio and commercial paper, other short-term corporate debt, or bankers’ prime acceptances to no more than 10% of the total investment portfolio for each class as mentioned above. The City’s investments are in accordance with these policies regarding diversification. Custodial Credit Risk: Custodial credit risk for deposits is the risk that, in the event of the failure of a depository financial institution, the City will not be able to recover its deposits or will not be able to recover collateral securities that are in the possession of an outside party. The custodial credit risk for investments is the risk that, in the event of the failure of the counterparty to a transaction, the City will not be able to recover the value of its investments or collateral securities that are in the possession of an outside party. Chapter 12C of the Code of Iowa requires all City funds be deposited into an approved depository
45
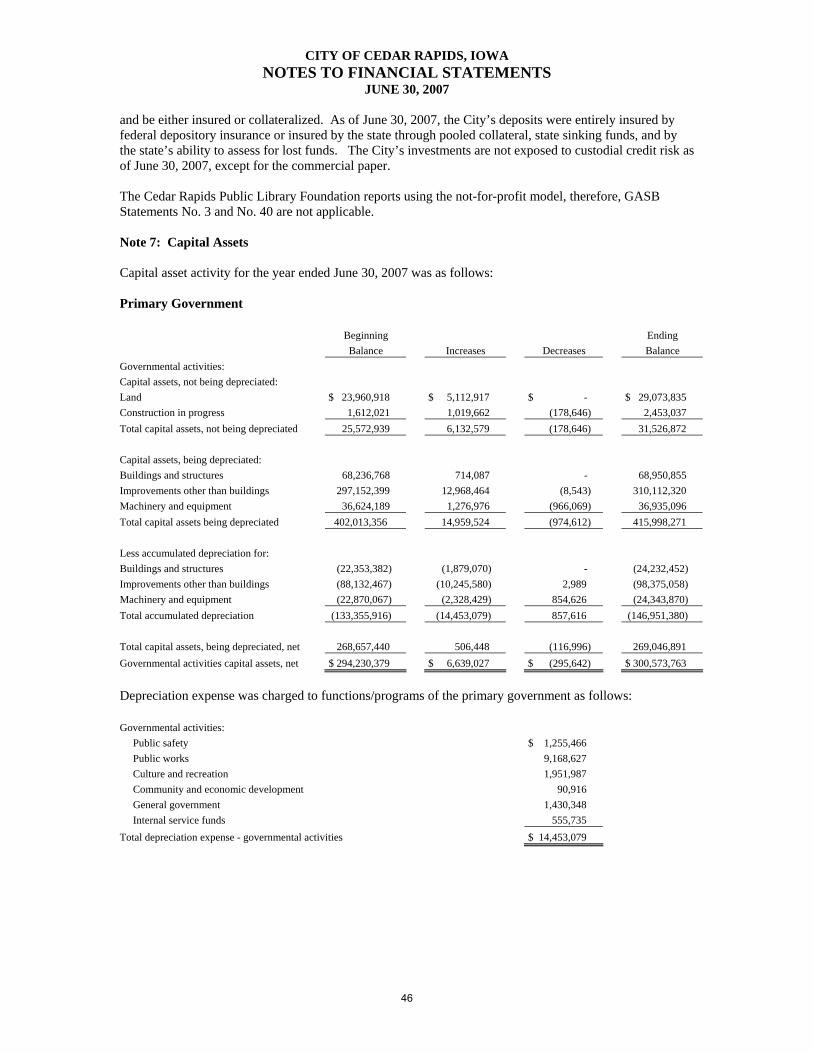
CITY OF CEDAR RAPIDS, IOWA NOTES TO FINANCIAL STATEMENTS
JUNE 30, 2007
and be either insured or collateralized. As of June 30, 2007, the City’s deposits were entirely insured by federal depository insurance or insured by the state through pooled collateral, state sinking funds, and by the state’s ability to assess for lost funds. The City’s investments are not exposed to custodial credit risk as of June 30, 2007, except for the commercial paper. The Cedar Rapids Public Library Foundation reports using the not-for-profit model, therefore, GASB Statements No. 3 and No. 40 are not applicable. Note 7: Capital Assets Capital asset activity for the year ended June 30, 2007 was as follows: Primary Government Beginning Ending Balance Increases Decreases Balance Governmental activities: Capital assets, not being depreciated: Land $ 23,960,918 $ 5,112,917 $ - $ 29,073,835 Construction in progress 1,612,021 1,019,662 (178,646) 2,453,037 Total capital assets, not being depreciated 25,572,939 6,132,579 (178,646) 31,526,872 Capital assets, being depreciated: Buildings and structures 68,236,768 714,087 - 68,950,855 Improvements other than buildings 297,152,399 12,968,464 (8,543) 310,112,320 Machinery and equipment 36,624,189 1,276,976 (966,069) 36,935,096 Total capital assets being depreciated 402,013,356 14,959,524 (974,612) 415,998,271 Less accumulated depreciation for: Buildings and structures (22,353,382) (1,879,070) - (24,232,452) Improvements other than buildings (88,132,467) (10,245,580) 2,989 (98,375,058) Machinery and equipment (22,870,067) (2,328,429) 854,626 (24,343,870) Total accumulated depreciation (133,355,916) (14,453,079) 857,616 (146,951,380) Total capital assets, being depreciated, net 268,657,440 506,448 (116,996) 269,046,891 Governmental activities capital assets, net $ 294,230,379 $ 6,639,027 $ (295,642) $ 300,573,763
Depreciation expense was charged to functions/programs of the primary government as follows: Governmental activities: Public safety $ 1,255,466 Public works 9,168,627 Culture and recreation 1,951,987 Community and economic development 90,916 General government 1,430,348 Internal service funds 555,735 Total depreciation expense - governmental activities $ 14,453,079
46
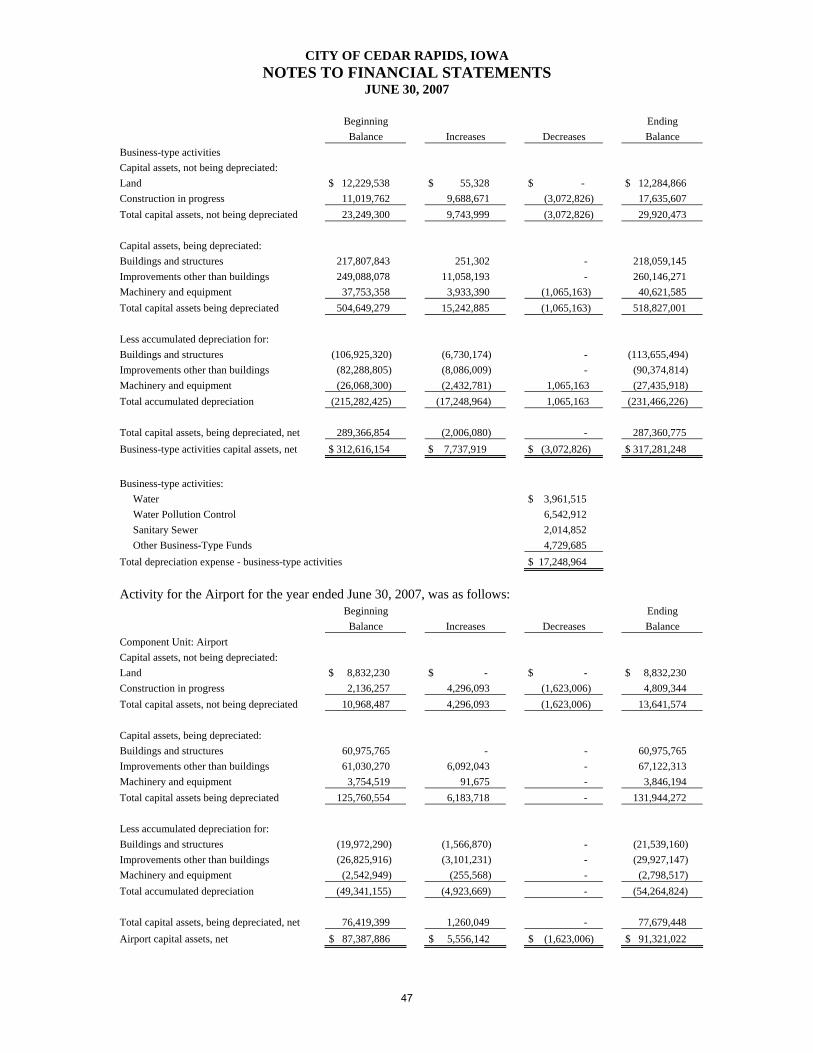
CITY OF CEDAR RAPIDS, IOWA NOTES TO FINANCIAL STATEMENTS
JUNE 30, 2007
Beginning Ending Balance Increases Decreases Balance Business-type activities Capital assets, not being depreciated: Land $ 12,229,538 $ 55,328 $ - $ 12,284,866 Construction in progress 11,019,762 9,688,671 (3,072,826) 17,635,607 Total capital assets, not being depreciated 23,249,300 9,743,999 (3,072,826) 29,920,473 Capital assets, being depreciated: Buildings and structures 217,807,843 251,302 - 218,059,145 Improvements other than buildings 249,088,078 11,058,193 - 260,146,271 Machinery and equipment 37,753,358 3,933,390 (1,065,163) 40,621,585 Total capital assets being depreciated 504,649,279 15,242,885 (1,065,163) 518,827,001 Less accumulated depreciation for: Buildings and structures (106,925,320) (6,730,174) - (113,655,494) Improvements other than buildings (82,288,805) (8,086,009) - (90,374,814) Machinery and equipment (26,068,300) (2,432,781) 1,065,163 (27,435,918) Total accumulated depreciation (215,282,425) (17,248,964) 1,065,163 (231,466,226) Total capital assets, being depreciated, net 289,366,854 (2,006,080) - 287,360,775 Business-type activities capital assets, net $ 312,616,154 $ 7,737,919 $ (3,072,826) $ 317,281,248
Business-type activities: Water $ 3,961,515 Water Pollution Control 6,542,912 Sanitary Sewer 2,014,852 Other Business-Type Funds 4,729,685 Total depreciation expense - business-type activities $ 17,248,964
Activity for the Airport for the year ended June 30, 2007, was as follows: Beginning Ending Balance Increases Decreases Balance Component Unit: Airport Capital assets, not being depreciated: Land $ 8,832,230 $ - $ - $ 8,832,230 Construction in progress 2,136,257 4,296,093 (1,623,006) 4,809,344 Total capital assets, not being depreciated 10,968,487 4,296,093 (1,623,006) 13,641,574 Capital assets, being depreciated: Buildings and structures 60,975,765 - - 60,975,765 Improvements other than buildings 61,030,270 6,092,043 - 67,122,313 Machinery and equipment 3,754,519 91,675 - 3,846,194 Total capital assets being depreciated 125,760,554 6,183,718 - 131,944,272 Less accumulated depreciation for: Buildings and structures (19,972,290) (1,566,870) - (21,539,160) Improvements other than buildings (26,825,916) (3,101,231) - (29,927,147) Machinery and equipment (2,542,949) (255,568) - (2,798,517) Total accumulated depreciation (49,341,155) (4,923,669) - (54,264,824) Total capital assets, being depreciated, net 76,419,399 1,260,049 - 77,679,448 Airport capital assets, net $ 87,387,886 $ 5,556,142 $ (1,623,006) $ 91,321,022
47
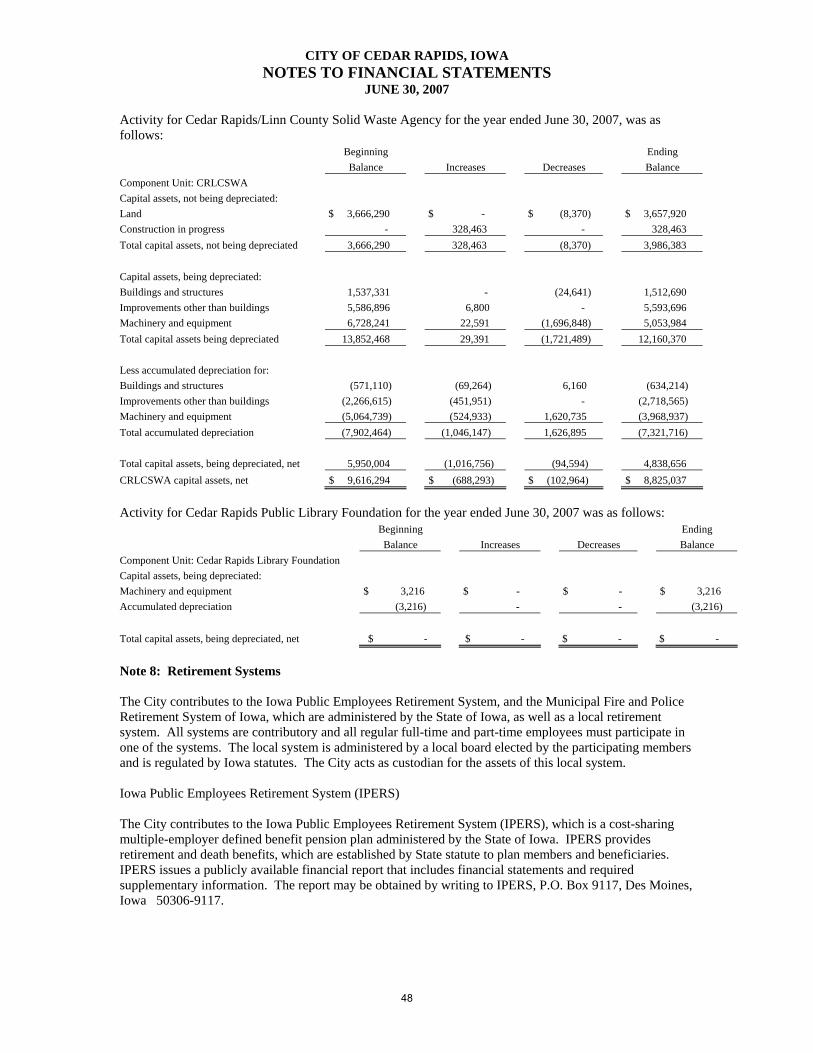
CITY OF CEDAR RAPIDS, IOWA NOTES TO FINANCIAL STATEMENTS
JUNE 30, 2007
Activity for Cedar Rapids/Linn County Solid Waste Agency for the year ended June 30, 2007, was as follows: Beginning Ending Balance Increases Decreases Balance Component Unit: CRLCSWA Capital assets, not being depreciated: Land $ 3,666,290 $ - $ (8,370) $ 3,657,920 Construction in progress - 328,463 - 328,463 Total capital assets, not being depreciated 3,666,290 328,463 (8,370) 3,986,383 Capital assets, being depreciated: Buildings and structures 1,537,331 - (24,641) 1,512,690 Improvements other than buildings 5,586,896 6,800 - 5,593,696 Machinery and equipment 6,728,241 22,591 (1,696,848) 5,053,984 Total capital assets being depreciated 13,852,468 29,391 (1,721,489) 12,160,370 Less accumulated depreciation for: Buildings and structures (571,110) (69,264) 6,160 (634,214) Improvements other than buildings (2,266,615) (451,951) - (2,718,565) Machinery and equipment (5,064,739) (524,933) 1,620,735 (3,968,937) Total accumulated depreciation (7,902,464) (1,046,147) 1,626,895 (7,321,716) Total capital assets, being depreciated, net 5,950,004 (1,016,756) (94,594) 4,838,656 CRLCSWA capital assets, net $ 9,616,294 $ (688,293) $ (102,964) $ 8,825,037
Activity for Cedar Rapids Public Library Foundation for the year ended June 30, 2007 was as follows: Beginning Ending Balance Increases Decreases Balance Component Unit: Cedar Rapids Library Foundation Capital assets, being depreciated: Machinery and equipment $ 3,216 $ - $ - $ 3,216 Accumulated depreciation (3,216) - - (3,216) Total capital assets, being depreciated, net $ - $ - $ - $ -
Note 8: Retirement Systems The City contributes to the Iowa Public Employees Retirement System, and the Municipal Fire and Police Retirement System of Iowa, which are administered by the State of Iowa, as well as a local retirement system. All systems are contributory and all regular full-time and part-time employees must participate in one of the systems. The local system is administered by a local board elected by the participating members and is regulated by Iowa statutes. The City acts as custodian for the assets of this local system.
Iowa Public Employees Retirement System (IPERS)
The City contributes to the Iowa Public Employees Retirement System (IPERS), which is a cost-sharing multiple-employer defined benefit pension plan administered by the State of Iowa. IPERS provides retirement and death benefits, which are established by State statute to plan members and beneficiaries. IPERS issues a publicly available financial report that includes financial statements and required supplementary information. The report may be obtained by writing to IPERS, P.O. Box 9117, Des Moines, Iowa 50306-9117.
48
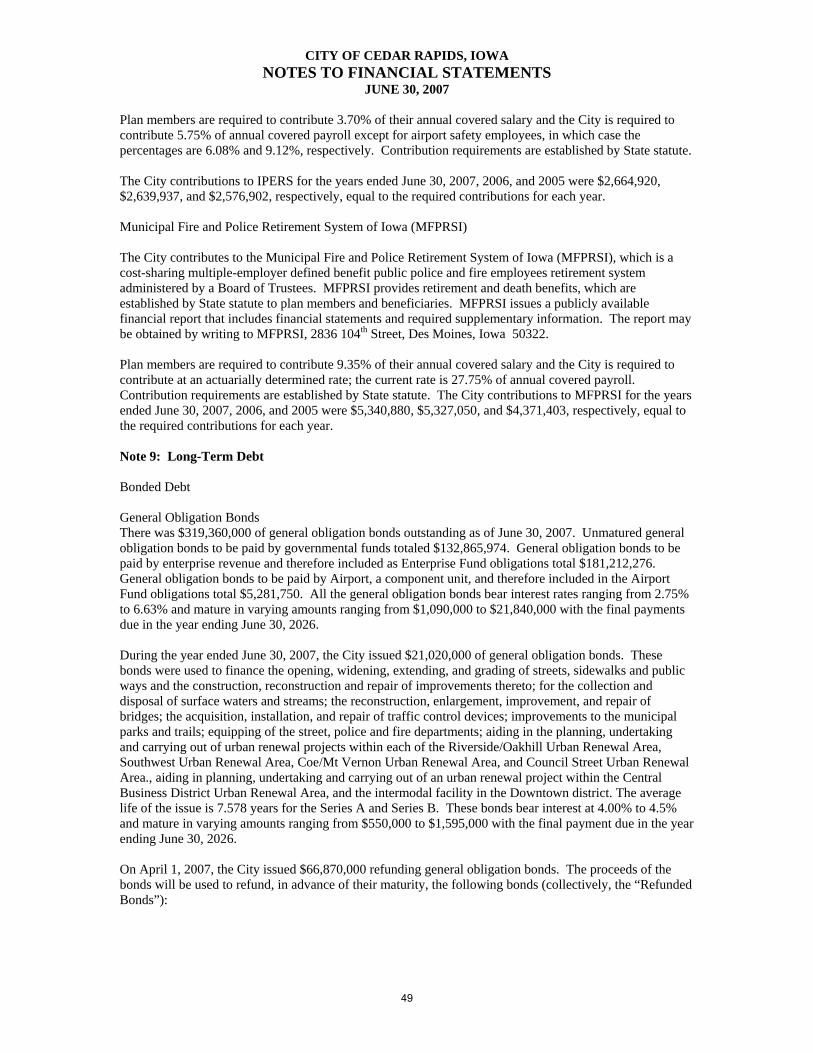
CITY OF CEDAR RAPIDS, IOWA NOTES TO FINANCIAL STATEMENTS
JUNE 30, 2007
Plan members are required to contribute 3.70% of their annual covered salary and the City is required to contribute 5.75% of annual covered payroll except for airport safety employees, in which case the percentages are 6.08% and 9.12%, respectively. Contribution requirements are established by State statute. The City contributions to IPERS for the years ended June 30, 2007, 2006, and 2005 were $2,664,920, $2,639,937, and $2,576,902, respectively, equal to the required contributions for each year. Municipal Fire and Police Retirement System of Iowa (MFPRSI)
The City contributes to the Municipal Fire and Police Retirement System of Iowa (MFPRSI), which is a cost-sharing multiple-employer defined benefit public police and fire employees retirement system administered by a Board of Trustees. MFPRSI provides retirement and death benefits, which are established by State statute to plan members and beneficiaries. MFPRSI issues a publicly available financial report that includes financial statements and required supplementary information. The report may be obtained by writing to MFPRSI, 2836 104th Street, Des Moines, Iowa 50322. Plan members are required to contribute 9.35% of their annual covered salary and the City is required to contribute at an actuarially determined rate; the current rate is 27.75% of annual covered payroll. Contribution requirements are established by State statute. The City contributions to MFPRSI for the years ended June 30, 2007, 2006, and 2005 were $5,340,880, $5,327,050, and $4,371,403, respectively, equal to the required contributions for each year. Note 9: Long-Term Debt Bonded Debt General Obligation Bonds There was $319,360,000 of general obligation bonds outstanding as of June 30, 2007. Unmatured general obligation bonds to be paid by governmental funds totaled $132,865,974. General obligation bonds to be paid by enterprise revenue and therefore included as Enterprise Fund obligations total $181,212,276. General obligation bonds to be paid by Airport, a component unit, and therefore included in the Airport Fund obligations total $5,281,750. All the general obligation bonds bear interest rates ranging from 2.75% to 6.63% and mature in varying amounts ranging from $1,090,000 to $21,840,000 with the final payments due in the year ending June 30, 2026. During the year ended June 30, 2007, the City issued $21,020,000 of general obligation bonds. These bonds were used to finance the opening, widening, extending, and grading of streets, sidewalks and public ways and the construction, reconstruction and repair of improvements thereto; for the collection and disposal of surface waters and streams; the reconstruction, enlargement, improvement, and repair of bridges; the acquisition, installation, and repair of traffic control devices; improvements to the municipal parks and trails; equipping of the street, police and fire departments; aiding in the planning, undertaking and carrying out of urban renewal projects within each of the Riverside/Oakhill Urban Renewal Area, Southwest Urban Renewal Area, Coe/Mt Vernon Urban Renewal Area, and Council Street Urban Renewal Area., aiding in planning, undertaking and carrying out of an urban renewal project within the Central Business District Urban Renewal Area, and the intermodal facility in the Downtown district. The average life of the issue is 7.578 years for the Series A and Series B. These bonds bear interest at 4.00% to 4.5% and mature in varying amounts ranging from $550,000 to $1,595,000 with the final payment due in the year ending June 30, 2026. On April 1, 2007, the City issued $66,870,000 refunding general obligation bonds. The proceeds of the bonds will be used to refund, in advance of their maturity, the following bonds (collectively, the “Refunded Bonds”):
49
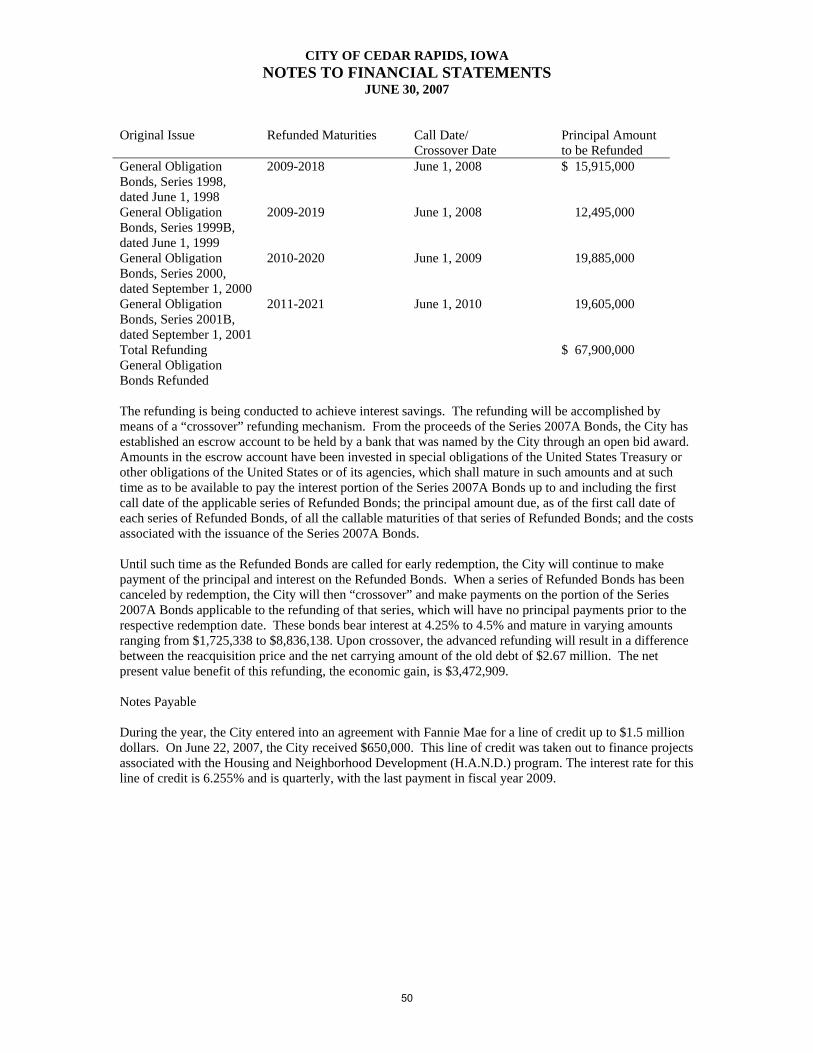
CITY OF CEDAR RAPIDS, IOWA NOTES TO FINANCIAL STATEMENTS
JUNE 30, 2007
Original Issue Refunded Maturities Call Date/
Crossover Date Principal Amount to be Refunded
General Obligation Bonds, Series 1998, dated June 1, 1998
2009-2018 June 1, 2008 $ 15,915,000
General Obligation Bonds, Series 1999B, dated June 1, 1999
2009-2019 June 1, 2008 12,495,000
General Obligation Bonds, Series 2000, dated September 1, 2000
2010-2020 June 1, 2009 19,885,000
General Obligation Bonds, Series 2001B, dated September 1, 2001
2011-2021 June 1, 2010 19,605,000
Total Refunding General Obligation Bonds Refunded
$ 67,900,000
The refunding is being conducted to achieve interest savings. The refunding will be accomplished by means of a “crossover” refunding mechanism. From the proceeds of the Series 2007A Bonds, the City has established an escrow account to be held by a bank that was named by the City through an open bid award. Amounts in the escrow account have been invested in special obligations of the United States Treasury or other obligations of the United States or of its agencies, which shall mature in such amounts and at such time as to be available to pay the interest portion of the Series 2007A Bonds up to and including the first call date of the applicable series of Refunded Bonds; the principal amount due, as of the first call date of each series of Refunded Bonds, of all the callable maturities of that series of Refunded Bonds; and the costs associated with the issuance of the Series 2007A Bonds. Until such time as the Refunded Bonds are called for early redemption, the City will continue to make payment of the principal and interest on the Refunded Bonds. When a series of Refunded Bonds has been canceled by redemption, the City will then “crossover” and make payments on the portion of the Series 2007A Bonds applicable to the refunding of that series, which will have no principal payments prior to the respective redemption date. These bonds bear interest at 4.25% to 4.5% and mature in varying amounts ranging from $1,725,338 to $8,836,138. Upon crossover, the advanced refunding will result in a difference between the reacquisition price and the net carrying amount of the old debt of $2.67 million. The net present value benefit of this refunding, the economic gain, is $3,472,909. Notes Payable During the year, the City entered into an agreement with Fannie Mae for a line of credit up to $1.5 million dollars. On June 22, 2007, the City received $650,000. This line of credit was taken out to finance projects associated with the Housing and Neighborhood Development (H.A.N.D.) program. The interest rate for this line of credit is 6.255% and is quarterly, with the last payment in fiscal year 2009.
50
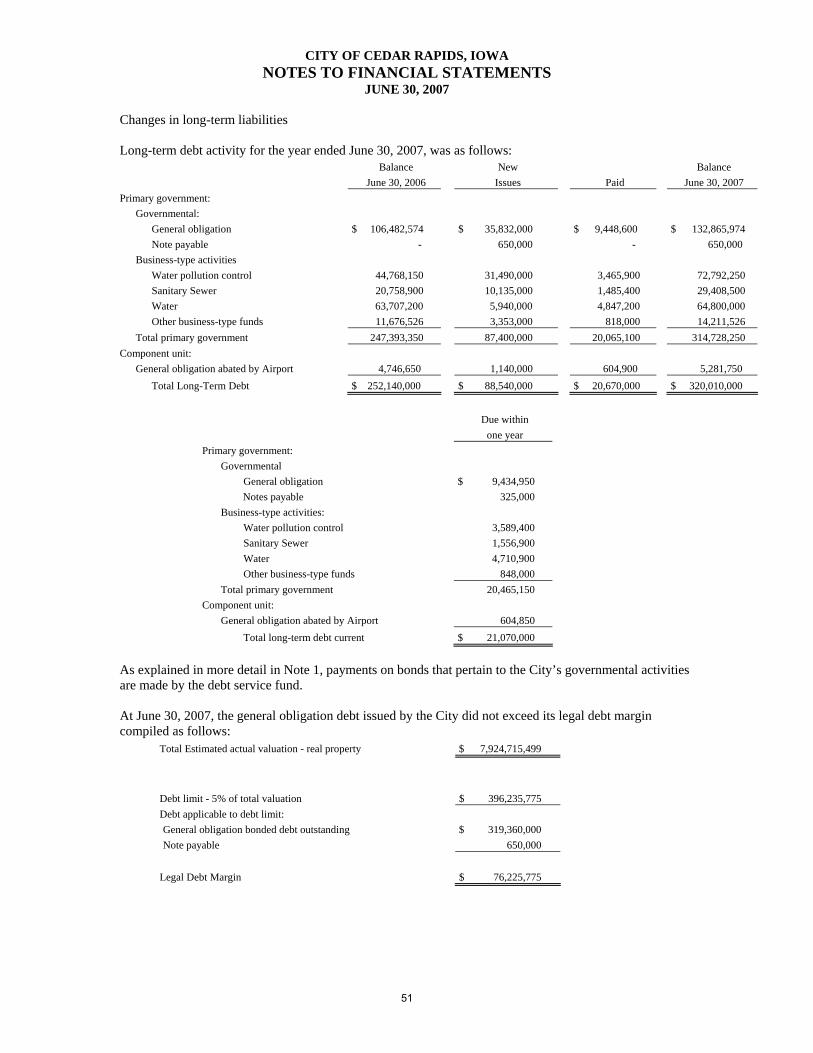
CITY OF CEDAR RAPIDS, IOWA NOTES TO FINANCIAL STATEMENTS
JUNE 30, 2007
Changes in long-term liabilities Long-term debt activity for the year ended June 30, 2007, was as follows: Balance New Balance June 30, 2006 Issues Paid June 30, 2007 Primary government: Governmental: General obligation $ 106,482,574 $ 35,832,000 $ 9,448,600 $ 132,865,974 Note payable - 650,000 - 650,000 Business-type activities Water pollution control 44,768,150 31,490,000 3,465,900 72,792,250 Sanitary Sewer 20,758,900 10,135,000 1,485,400 29,408,500 Water 63,707,200 5,940,000 4,847,200 64,800,000 Other business-type funds 11,676,526 3,353,000 818,000 14,211,526 Total primary government 247,393,350 87,400,000 20,065,100 314,728,250 Component unit: General obligation abated by Airport 4,746,650 1,140,000 604,900 5,281,750 Total Long-Term Debt $ 252,140,000 $ 88,540,000 $ 20,670,000 $ 320,010,000
Due within one year Primary government: Governmental General obligation $ 9,434,950 Notes payable 325,000 Business-type activities: Water pollution control 3,589,400 Sanitary Sewer 1,556,900 Water 4,710,900 Other business-type funds 848,000 Total primary government 20,465,150 Component unit: General obligation abated by Airport 604,850 Total long-term debt current $ 21,070,000
As explained in more detail in Note 1, payments on bonds that pertain to the City’s governmental activities are made by the debt service fund. At June 30, 2007, the general obligation debt issued by the City did not exceed its legal debt margin compiled as follows: Total Estimated actual valuation - real property $ 7,924,715,499
Debt limit - 5% of total valuation $ 396,235,775 Debt applicable to debt limit: General obligation bonded debt outstanding $ 319,360,000 Note payable 650,000 Legal Debt Margin $ 76,225,775
51
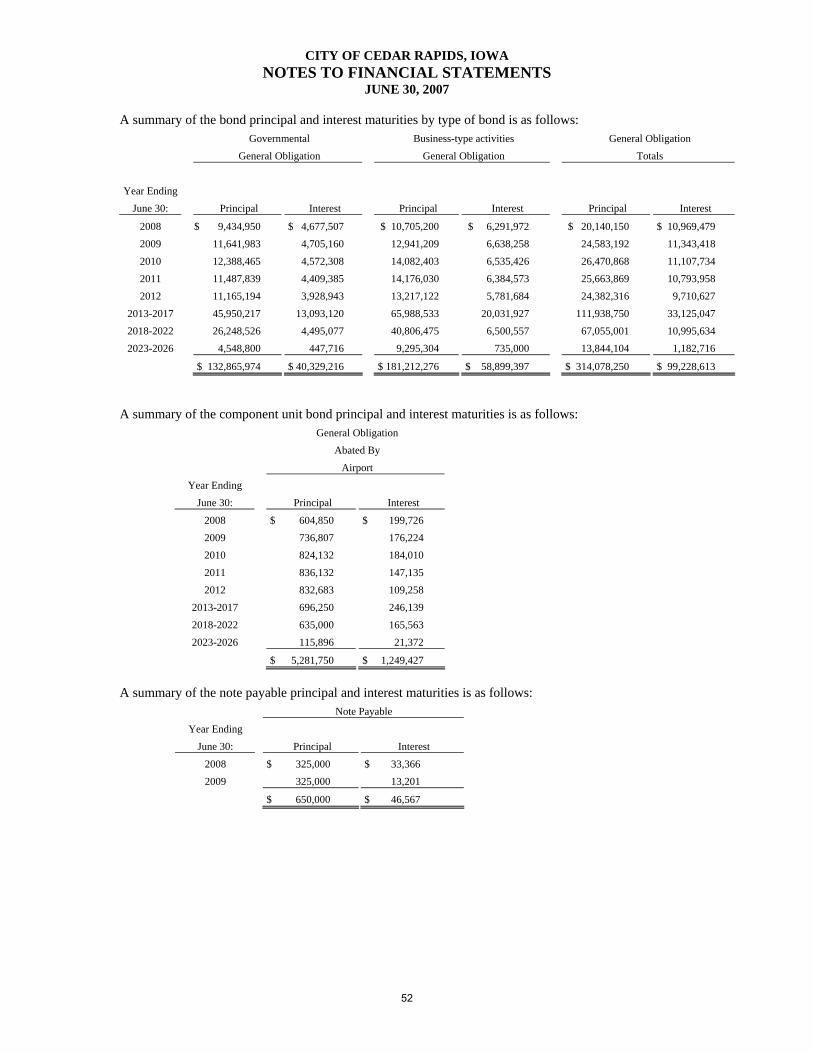
CITY OF CEDAR RAPIDS, IOWA NOTES TO FINANCIAL STATEMENTS
JUNE 30, 2007
A summary of the bond principal and interest maturities by type of bond is as follows: Governmental Business-type activities General Obligation General Obligation General Obligation Totals
Year Ending
June 30: Principal Interest Principal Interest Principal Interest
2008 $ 9,434,950 $ 4,677,507 $ 10,705,200 $ 6,291,972 $ 20,140,150 $ 10,969,479 2009 11,641,983 4,705,160 12,941,209 6,638,258 24,583,192 11,343,418
2010 12,388,465 4,572,308 14,082,403 6,535,426 26,470,868 11,107,734 2011 11,487,839 4,409,385 14,176,030 6,384,573 25,663,869 10,793,958 2012 11,165,194 3,928,943 13,217,122 5,781,684 24,382,316 9,710,627
2013-2017 45,950,217 13,093,120 65,988,533 20,031,927 111,938,750 33,125,047 2018-2022 26,248,526 4,495,077 40,806,475 6,500,557 67,055,001 10,995,634 2023-2026 4,548,800 447,716 9,295,304 735,000 13,844,104 1,182,716
$ 132,865,974 $ 40,329,216 $ 181,212,276 $ 58,899,397 $ 314,078,250 $ 99,228,613
A summary of the component unit bond principal and interest maturities is as follows: General Obligation Abated By
Airport
Year Ending June 30: Principal Interest
2008 $ 604,850 $ 199,726 2009 736,807 176,224 2010 824,132 184,010
2011 836,132 147,135 2012 832,683 109,258 2013-2017 696,250 246,139
2018-2022 635,000 165,563 2023-2026 115,896 21,372
$ 5,281,750 $ 1,249,427
A summary of the note payable principal and interest maturities is as follows:
Note Payable
Year Ending June 30: Principal Interest
2008 $ 325,000 $ 33,366 2009 325,000 13,201
$ 650,000 $ 46,567
52
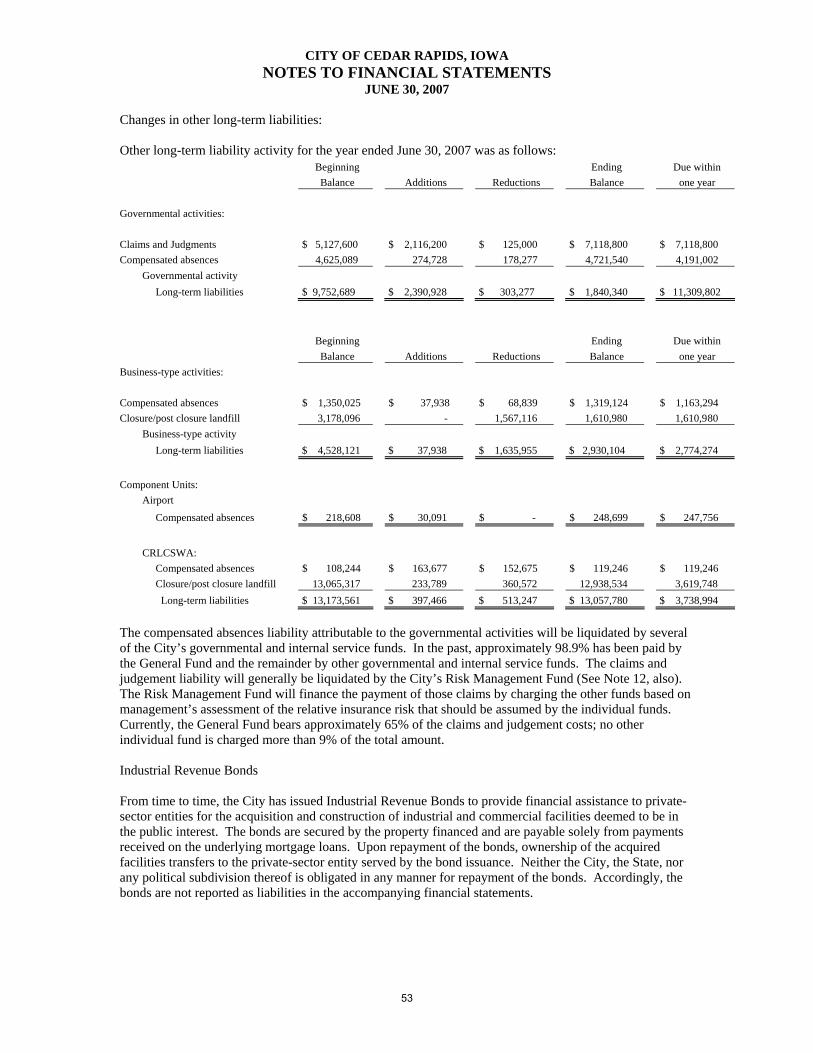
CITY OF CEDAR RAPIDS, IOWA NOTES TO FINANCIAL STATEMENTS
JUNE 30, 2007
Changes in other long-term liabilities: Other long-term liability activity for the year ended June 30, 2007 was as follows:
Beginning Ending Due within Balance Additions Reductions Balance one year
Governmental activities: Claims and Judgments $ 5,127,600 $ 2,116,200 $ 125,000 $ 7,118,800 $ 7,118,800 Compensated absences 4,625,089 274,728 178,277 4,721,540 4,191,002 Governmental activity Long-term liabilities $ 9,752,689 $ 2,390,928 $ 303,277 $ 1,840,340 $ 11,309,802
Beginning Ending Due within Balance Additions Reductions Balance one year Business-type activities: Compensated absences $ 1,350,025 $ 37,938 $ 68,839 $ 1,319,124 $ 1,163,294 Closure/post closure landfill 3,178,096 - 1,567,116 1,610,980 1,610,980 Business-type activity Long-term liabilities $ 4,528,121 $ 37,938 $ 1,635,955 $ 2,930,104 $ 2,774,274
Component Units: Airport
Compensated absences $ 218,608 $ 30,091 $ - $ 248,699 $ 247,756
CRLCSWA: Compensated absences $ 108,244 $ 163,677 $ 152,675 $ 119,246 $ 119,246 Closure/post closure landfill 13,065,317 233,789 360,572 12,938,534 3,619,748 Long-term liabilities $ 13,173,561 $ 397,466 $ 513,247 $ 13,057,780 $ 3,738,994
The compensated absences liability attributable to the governmental activities will be liquidated by several of the City’s governmental and internal service funds. In the past, approximately 98.9% has been paid by the General Fund and the remainder by other governmental and internal service funds. The claims and judgement liability will generally be liquidated by the City’s Risk Management Fund (See Note 12, also). The Risk Management Fund will finance the payment of those claims by charging the other funds based on management’s assessment of the relative insurance risk that should be assumed by the individual funds. Currently, the General Fund bears approximately 65% of the claims and judgement costs; no other individual fund is charged more than 9% of the total amount. Industrial Revenue Bonds
From time to time, the City has issued Industrial Revenue Bonds to provide financial assistance to private-sector entities for the acquisition and construction of industrial and commercial facilities deemed to be in the public interest. The bonds are secured by the property financed and are payable solely from payments received on the underlying mortgage loans. Upon repayment of the bonds, ownership of the acquired facilities transfers to the private-sector entity served by the bond issuance. Neither the City, the State, nor any political subdivision thereof is obligated in any manner for repayment of the bonds. Accordingly, the bonds are not reported as liabilities in the accompanying financial statements.
53
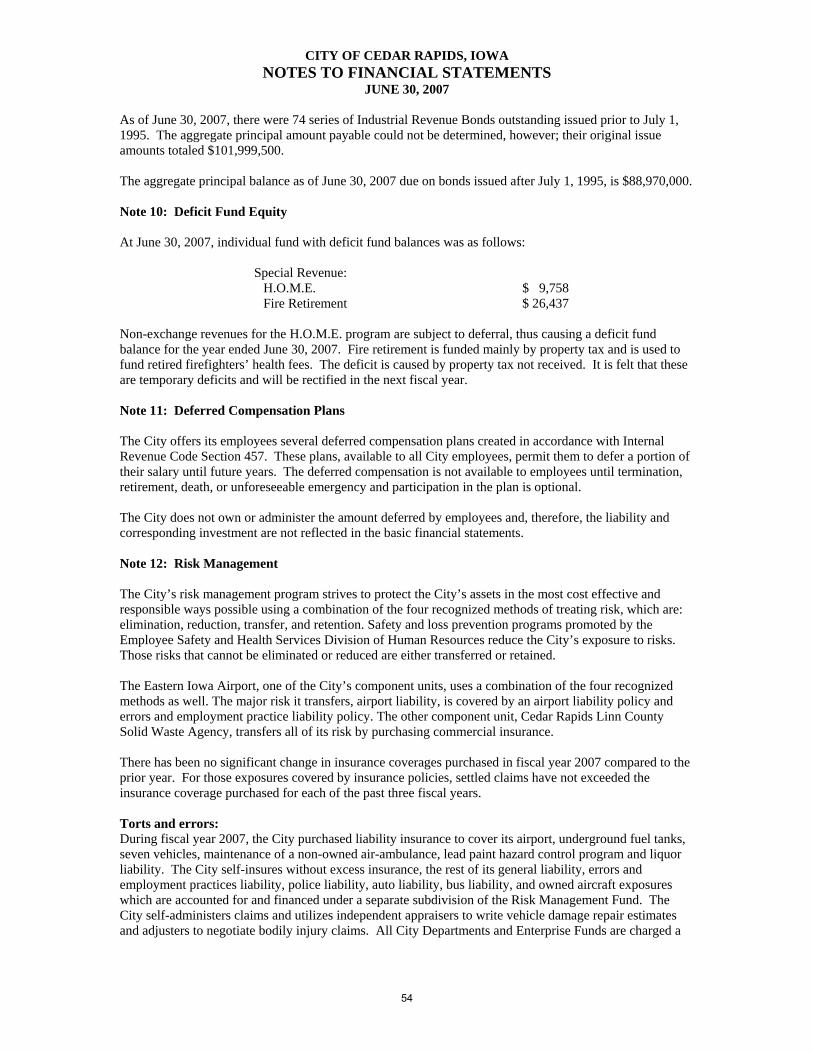
CITY OF CEDAR RAPIDS, IOWA NOTES TO FINANCIAL STATEMENTS
JUNE 30, 2007
As of June 30, 2007, there were 74 series of Industrial Revenue Bonds outstanding issued prior to July 1, 1995. The aggregate principal amount payable could not be determined, however; their original issue amounts totaled $101,999,500.
The aggregate principal balance as of June 30, 2007 due on bonds issued after July 1, 1995, is $88,970,000. Note 10: Deficit Fund Equity At June 30, 2007, individual fund with deficit fund balances was as follows:
Special Revenue: H.O.M.E. $ 9,758 Fire Retirement $ 26,437
Non-exchange revenues for the H.O.M.E. program are subject to deferral, thus causing a deficit fund balance for the year ended June 30, 2007. Fire retirement is funded mainly by property tax and is used to fund retired firefighters’ health fees. The deficit is caused by property tax not received. It is felt that these are temporary deficits and will be rectified in the next fiscal year. Note 11: Deferred Compensation Plans The City offers its employees several deferred compensation plans created in accordance with Internal Revenue Code Section 457. These plans, available to all City employees, permit them to defer a portion of their salary until future years. The deferred compensation is not available to employees until termination, retirement, death, or unforeseeable emergency and participation in the plan is optional. The City does not own or administer the amount deferred by employees and, therefore, the liability and corresponding investment are not reflected in the basic financial statements. Note 12: Risk Management The City’s risk management program strives to protect the City’s assets in the most cost effective and responsible ways possible using a combination of the four recognized methods of treating risk, which are: elimination, reduction, transfer, and retention. Safety and loss prevention programs promoted by the Employee Safety and Health Services Division of Human Resources reduce the City’s exposure to risks. Those risks that cannot be eliminated or reduced are either transferred or retained. The Eastern Iowa Airport, one of the City’s component units, uses a combination of the four recognized methods as well. The major risk it transfers, airport liability, is covered by an airport liability policy and errors and employment practice liability policy. The other component unit, Cedar Rapids Linn County Solid Waste Agency, transfers all of its risk by purchasing commercial insurance. There has been no significant change in insurance coverages purchased in fiscal year 2007 compared to the prior year. For those exposures covered by insurance policies, settled claims have not exceeded the insurance coverage purchased for each of the past three fiscal years. Torts and errors: During fiscal year 2007, the City purchased liability insurance to cover its airport, underground fuel tanks, seven vehicles, maintenance of a non-owned air-ambulance, lead paint hazard control program and liquor liability. The City self-insures without excess insurance, the rest of its general liability, errors and employment practices liability, police liability, auto liability, bus liability, and owned aircraft exposures which are accounted for and financed under a separate subdivision of the Risk Management Fund. The City self-administers claims and utilizes independent appraisers to write vehicle damage repair estimates and adjusters to negotiate bodily injury claims. All City Departments and Enterprise Funds are charged a
54
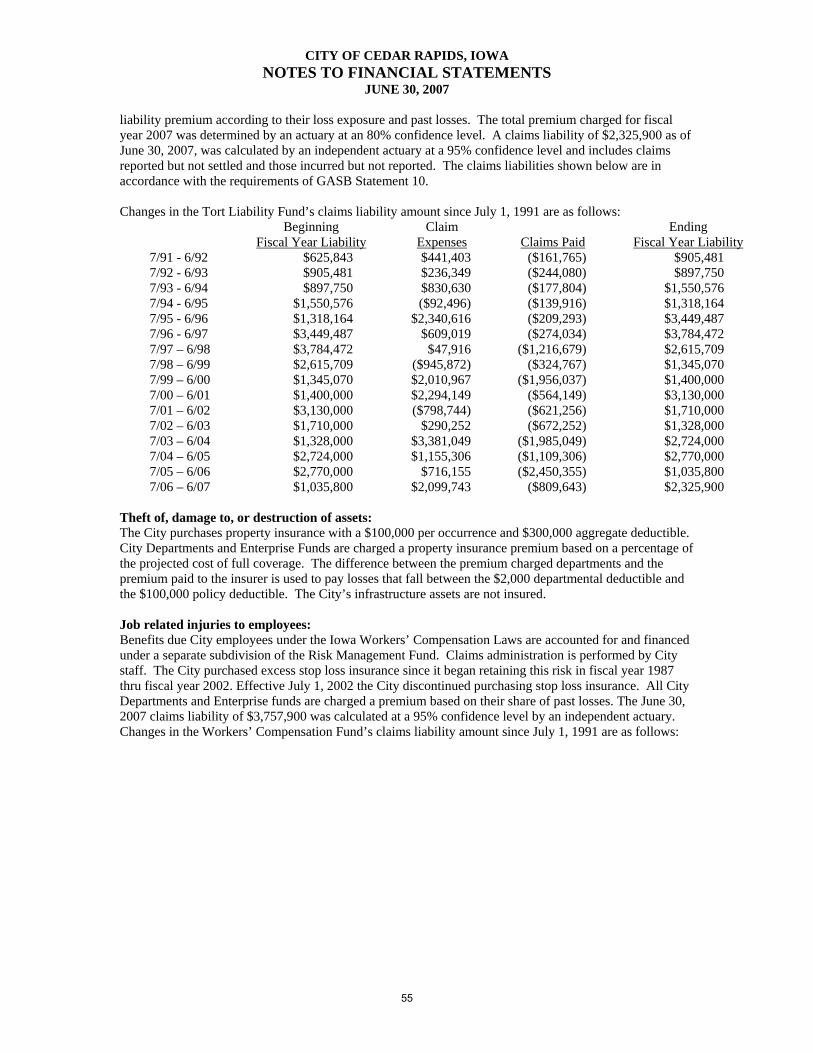
CITY OF CEDAR RAPIDS, IOWA NOTES TO FINANCIAL STATEMENTS
JUNE 30, 2007
liability premium according to their loss exposure and past losses. The total premium charged for fiscal year 2007 was determined by an actuary at an 80% confidence level. A claims liability of $2,325,900 as of June 30, 2007, was calculated by an independent actuary at a 95% confidence level and includes claims reported but not settled and those incurred but not reported. The claims liabilities shown below are in accordance with the requirements of GASB Statement 10. Changes in the Tort Liability Fund’s claims liability amount since July 1, 1991 are as follows:
Beginning Fiscal Year Liability
Claim Expenses
Claims Paid
Ending Fiscal Year Liability
7/91 - 6/92 $625,843 $441,403 ($161,765) $905,481 7/92 - 6/93 $905,481 $236,349 ($244,080) $897,750 7/93 - 6/94 $897,750 $830,630 ($177,804) $1,550,576 7/94 - 6/95 $1,550,576 ($92,496) ($139,916) $1,318,164 7/95 - 6/96 $1,318,164 $2,340,616 ($209,293) $3,449,487 7/96 - 6/97 $3,449,487 $609,019 ($274,034) $3,784,472 7/97 – 6/98 $3,784,472 $47,916 ($1,216,679) $2,615,709 7/98 – 6/99 $2,615,709 ($945,872) ($324,767) $1,345,070 7/99 – 6/00 $1,345,070 $2,010,967 ($1,956,037) $1,400,000 7/00 – 6/01 $1,400,000 $2,294,149 ($564,149) $3,130,000 7/01 – 6/02 $3,130,000 ($798,744) ($621,256) $1,710,000 7/02 – 6/03 $1,710,000 $290,252 ($672,252) $1,328,000 7/03 – 6/04 $1,328,000 $3,381,049 ($1,985,049) $2,724,000 7/04 – 6/05 $2,724,000 $1,155,306 ($1,109,306) $2,770,000 7/05 – 6/06 $2,770,000 $716,155 ($2,450,355) $1,035,800 7/06 – 6/07 $1,035,800 $2,099,743 ($809,643) $2,325,900
Theft of, damage to, or destruction of assets: The City purchases property insurance with a $100,000 per occurrence and $300,000 aggregate deductible. City Departments and Enterprise Funds are charged a property insurance premium based on a percentage of the projected cost of full coverage. The difference between the premium charged departments and the premium paid to the insurer is used to pay losses that fall between the $2,000 departmental deductible and the $100,000 policy deductible. The City’s infrastructure assets are not insured.
Job related injuries to employees: Benefits due City employees under the Iowa Workers’ Compensation Laws are accounted for and financed under a separate subdivision of the Risk Management Fund. Claims administration is performed by City staff. The City purchased excess stop loss insurance since it began retaining this risk in fiscal year 1987 thru fiscal year 2002. Effective July 1, 2002 the City discontinued purchasing stop loss insurance. All City Departments and Enterprise funds are charged a premium based on their share of past losses. The June 30, 2007 claims liability of $3,757,900 was calculated at a 95% confidence level by an independent actuary. Changes in the Workers’ Compensation Fund’s claims liability amount since July 1, 1991 are as follows:
55
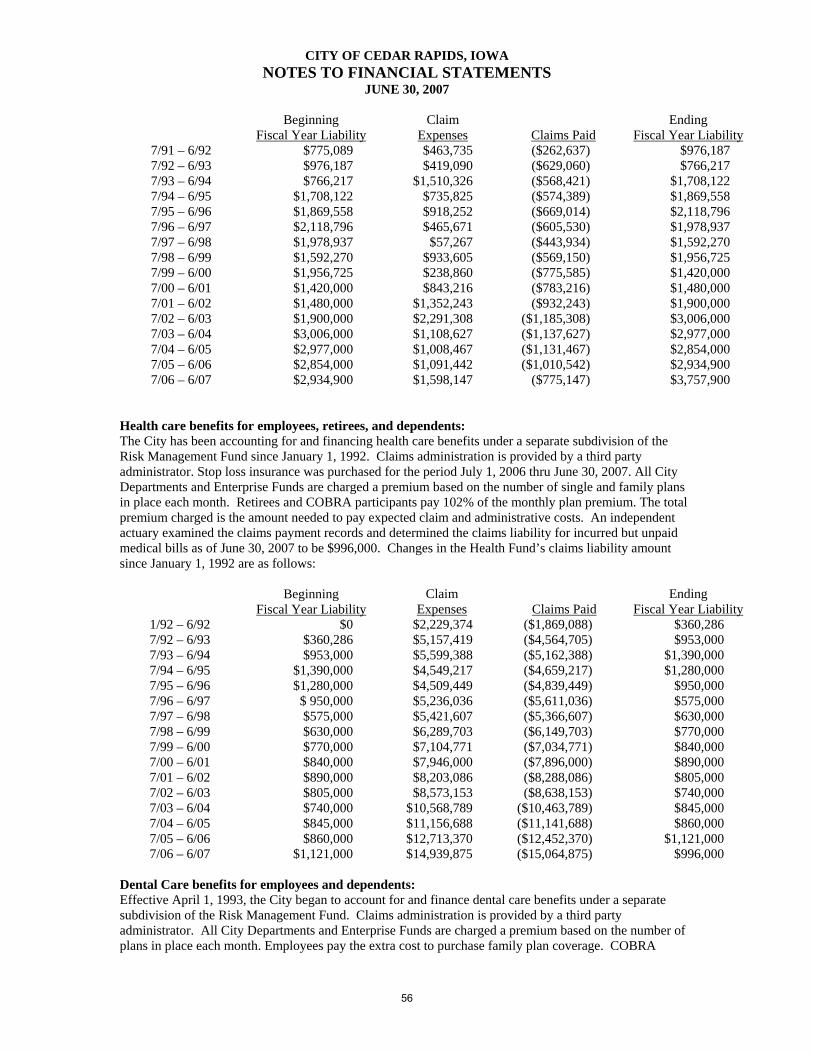
CITY OF CEDAR RAPIDS, IOWA NOTES TO FINANCIAL STATEMENTS
JUNE 30, 2007
Beginning
Fiscal Year Liability Claim
Expenses
Claims Paid Ending
Fiscal Year Liability 7/91 – 6/92 $775,089 $463,735 ($262,637) $976,187 7/92 – 6/93 $976,187 $419,090 ($629,060) $766,217 7/93 – 6/94 $766,217 $1,510,326 ($568,421) $1,708,122 7/94 – 6/95 $1,708,122 $735,825 ($574,389) $1,869,558 7/95 – 6/96 $1,869,558 $918,252 ($669,014) $2,118,796 7/96 – 6/97 $2,118,796 $465,671 ($605,530) $1,978,937 7/97 – 6/98 $1,978,937 $57,267 ($443,934) $1,592,270 7/98 – 6/99 $1,592,270 $933,605 ($569,150) $1,956,725 7/99 – 6/00 $1,956,725 $238,860 ($775,585) $1,420,000 7/00 – 6/01 $1,420,000 $843,216 ($783,216) $1,480,000 7/01 – 6/02 $1,480,000 $1,352,243 ($932,243) $1,900,000 7/02 – 6/03 $1,900,000 $2,291,308 ($1,185,308) $3,006,000 7/03 – 6/04 $3,006,000 $1,108,627 ($1,137,627) $2,977,000 7/04 – 6/05 $2,977,000 $1,008,467 ($1,131,467) $2,854,000 7/05 – 6/06 $2,854,000 $1,091,442 ($1,010,542) $2,934,900 7/06 – 6/07 $2,934,900 $1,598,147 ($775,147) $3,757,900
Health care benefits for employees, retirees, and dependents: The City has been accounting for and financing health care benefits under a separate subdivision of the Risk Management Fund since January 1, 1992. Claims administration is provided by a third party administrator. Stop loss insurance was purchased for the period July 1, 2006 thru June 30, 2007. All City Departments and Enterprise Funds are charged a premium based on the number of single and family plans in place each month. Retirees and COBRA participants pay 102% of the monthly plan premium. The total premium charged is the amount needed to pay expected claim and administrative costs. An independent actuary examined the claims payment records and determined the claims liability for incurred but unpaid medical bills as of June 30, 2007 to be $996,000. Changes in the Health Fund’s claims liability amount since January 1, 1992 are as follows:
Beginning
Fiscal Year Liability Claim
Expenses
Claims Paid Ending
Fiscal Year Liability 1/92 – 6/92 $0 $2,229,374 ($1,869,088) $360,286 7/92 – 6/93 $360,286 $5,157,419 ($4,564,705) $953,000 7/93 – 6/94 $953,000 $5,599,388 ($5,162,388) $1,390,000 7/94 – 6/95 $1,390,000 $4,549,217 ($4,659,217) $1,280,000 7/95 – 6/96 $1,280,000 $4,509,449 ($4,839,449) $950,000 7/96 – 6/97 $ 950,000 $5,236,036 ($5,611,036) $575,000 7/97 – 6/98 $575,000 $5,421,607 ($5,366,607) $630,000 7/98 – 6/99 $630,000 $6,289,703 ($6,149,703) $770,000 7/99 – 6/00 $770,000 $7,104,771 ($7,034,771) $840,000 7/00 – 6/01 $840,000 $7,946,000 ($7,896,000) $890,000 7/01 – 6/02 $890,000 $8,203,086 ($8,288,086) $805,000 7/02 – 6/03 $805,000 $8,573,153 ($8,638,153) $740,000 7/03 – 6/04 $740,000 $10,568,789 ($10,463,789) $845,000 7/04 – 6/05 $845,000 $11,156,688 ($11,141,688) $860,000 7/05 – 6/06 $860,000 $12,713,370 ($12,452,370) $1,121,000 7/06 – 6/07 $1,121,000 $14,939,875 ($15,064,875) $996,000
Dental Care benefits for employees and dependents: Effective April 1, 1993, the City began to account for and finance dental care benefits under a separate subdivision of the Risk Management Fund. Claims administration is provided by a third party administrator. All City Departments and Enterprise Funds are charged a premium based on the number of plans in place each month. Employees pay the extra cost to purchase family plan coverage. COBRA
56
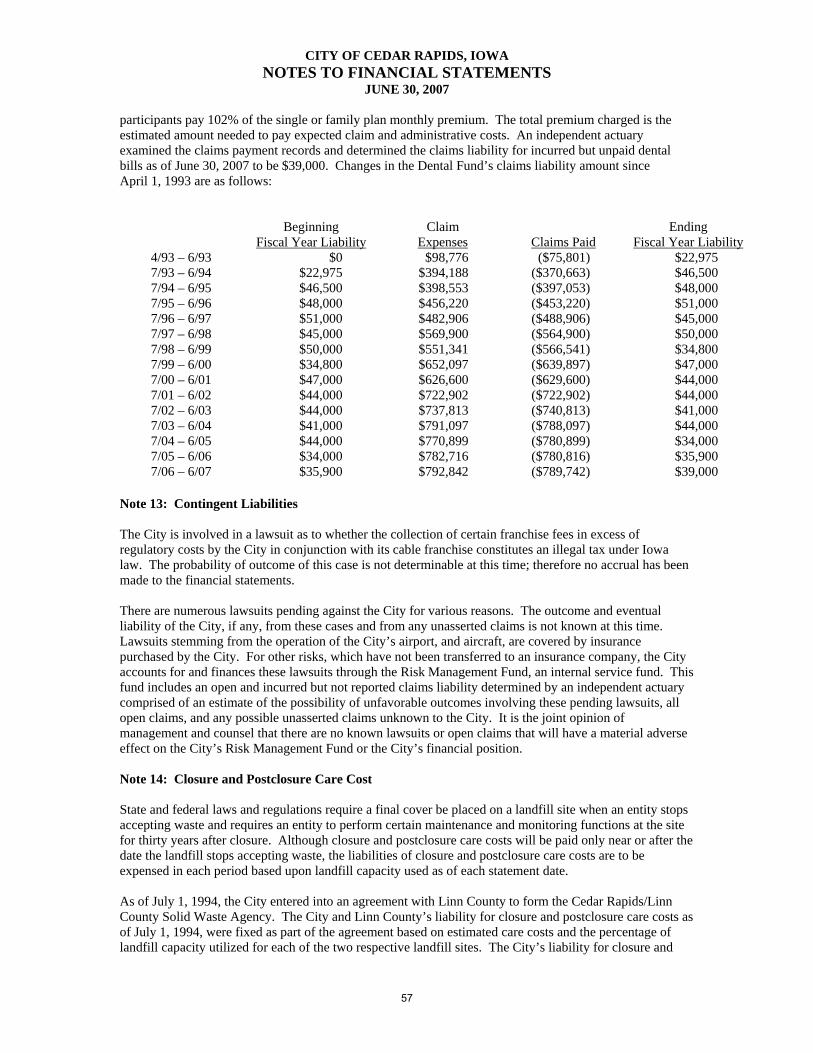
CITY OF CEDAR RAPIDS, IOWA NOTES TO FINANCIAL STATEMENTS
JUNE 30, 2007
participants pay 102% of the single or family plan monthly premium. The total premium charged is the estimated amount needed to pay expected claim and administrative costs. An independent actuary examined the claims payment records and determined the claims liability for incurred but unpaid dental bills as of June 30, 2007 to be $39,000. Changes in the Dental Fund’s claims liability amount since April 1, 1993 are as follows:
Beginning Fiscal Year Liability
Claim Expenses
Claims Paid
Ending Fiscal Year Liability
4/93 – 6/93 $0 $98,776 ($75,801) $22,975 7/93 – 6/94 $22,975 $394,188 ($370,663) $46,500 7/94 – 6/95 $46,500 $398,553 ($397,053) $48,000 7/95 – 6/96 $48,000 $456,220 ($453,220) $51,000 7/96 – 6/97 $51,000 $482,906 ($488,906) $45,000 7/97 – 6/98 $45,000 $569,900 ($564,900) $50,000 7/98 – 6/99 $50,000 $551,341 ($566,541) $34,800 7/99 – 6/00 $34,800 $652,097 ($639,897) $47,000 7/00 – 6/01 $47,000 $626,600 ($629,600) $44,000 7/01 – 6/02 $44,000 $722,902 ($722,902) $44,000 7/02 – 6/03 $44,000 $737,813 ($740,813) $41,000 7/03 – 6/04 $41,000 $791,097 ($788,097) $44,000 7/04 – 6/05 $44,000 $770,899 ($780,899) $34,000 7/05 – 6/06 $34,000 $782,716 ($780,816) $35,900 7/06 – 6/07 $35,900 $792,842 ($789,742) $39,000
Note 13: Contingent Liabilities The City is involved in a lawsuit as to whether the collection of certain franchise fees in excess of regulatory costs by the City in conjunction with its cable franchise constitutes an illegal tax under Iowa law. The probability of outcome of this case is not determinable at this time; therefore no accrual has been made to the financial statements. There are numerous lawsuits pending against the City for various reasons. The outcome and eventual liability of the City, if any, from these cases and from any unasserted claims is not known at this time. Lawsuits stemming from the operation of the City’s airport, and aircraft, are covered by insurance purchased by the City. For other risks, which have not been transferred to an insurance company, the City accounts for and finances these lawsuits through the Risk Management Fund, an internal service fund. This fund includes an open and incurred but not reported claims liability determined by an independent actuary comprised of an estimate of the possibility of unfavorable outcomes involving these pending lawsuits, all open claims, and any possible unasserted claims unknown to the City. It is the joint opinion of management and counsel that there are no known lawsuits or open claims that will have a material adverse effect on the City’s Risk Management Fund or the City’s financial position. Note 14: Closure and Postclosure Care Cost State and federal laws and regulations require a final cover be placed on a landfill site when an entity stops accepting waste and requires an entity to perform certain maintenance and monitoring functions at the site for thirty years after closure. Although closure and postclosure care costs will be paid only near or after the date the landfill stops accepting waste, the liabilities of closure and postclosure care costs are to be expensed in each period based upon landfill capacity used as of each statement date. As of July 1, 1994, the City entered into an agreement with Linn County to form the Cedar Rapids/Linn County Solid Waste Agency. The City and Linn County’s liability for closure and postclosure care costs as of July 1, 1994, were fixed as part of the agreement based on estimated care costs and the percentage of landfill capacity utilized for each of the two respective landfill sites. The City’s liability for closure and
57
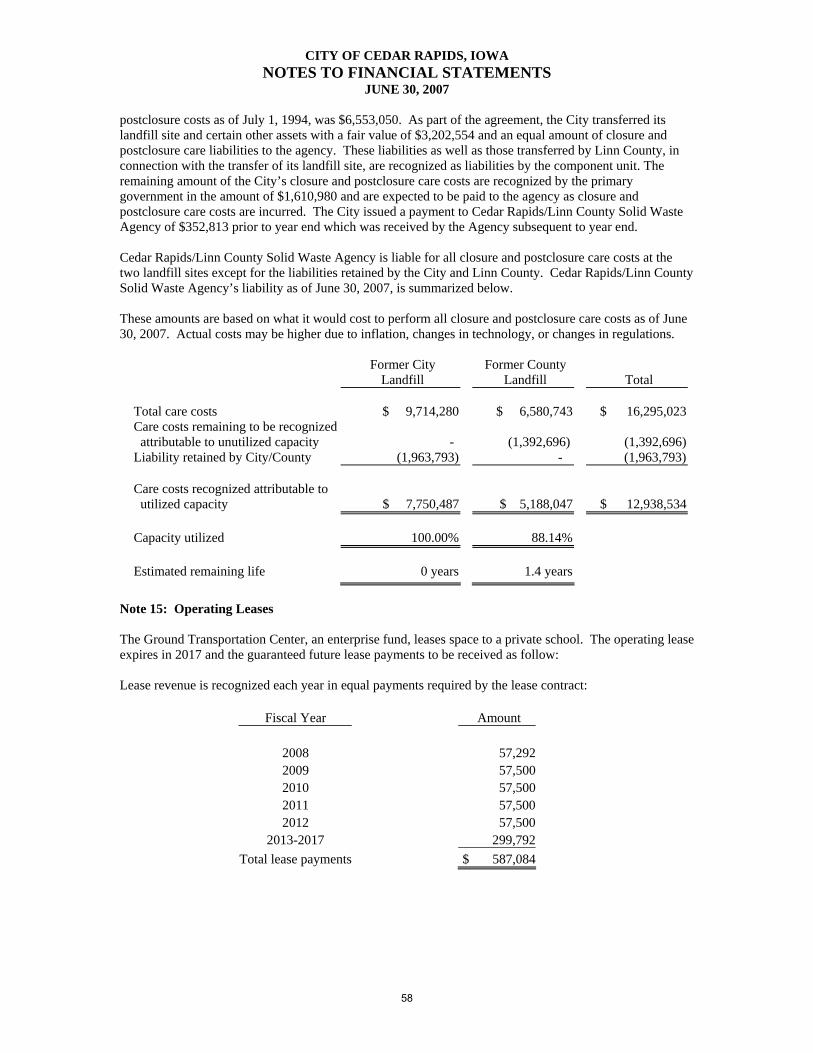
CITY OF CEDAR RAPIDS, IOWA NOTES TO FINANCIAL STATEMENTS
JUNE 30, 2007
postclosure costs as of July 1, 1994, was $6,553,050. As part of the agreement, the City transferred its landfill site and certain other assets with a fair value of $3,202,554 and an equal amount of closure and postclosure care liabilities to the agency. These liabilities as well as those transferred by Linn County, in connection with the transfer of its landfill site, are recognized as liabilities by the component unit. The remaining amount of the City’s closure and postclosure care costs are recognized by the primary government in the amount of $1,610,980 and are expected to be paid to the agency as closure and postclosure care costs are incurred. The City issued a payment to Cedar Rapids/Linn County Solid Waste Agency of $352,813 prior to year end which was received by the Agency subsequent to year end. Cedar Rapids/Linn County Solid Waste Agency is liable for all closure and postclosure care costs at the two landfill sites except for the liabilities retained by the City and Linn County. Cedar Rapids/Linn County Solid Waste Agency’s liability as of June 30, 2007, is summarized below. These amounts are based on what it would cost to perform all closure and postclosure care costs as of June 30, 2007. Actual costs may be higher due to inflation, changes in technology, or changes in regulations.
Former City Former County
Landfill Landfill Total
Total care costs $ 9,714,280 $ 6,580,743 $ 16,295,023Care costs remaining to be recognized attributable to unutilized capacity - (1,392,696) (1,392,696)Liability retained by City/County (1,963,793) - (1,963,793)
Care costs recognized attributable to utilized capacity $ 7,750,487 $ 5,188,047 $ 12,938,534
Capacity utilized 100.00% 88.14%
Estimated remaining life 0 years 1.4 years
Note 15: Operating Leases The Ground Transportation Center, an enterprise fund, leases space to a private school. The operating lease expires in 2017 and the guaranteed future lease payments to be received as follow: Lease revenue is recognized each year in equal payments required by the lease contract: Fiscal Year Amount 2008 57,292 2009 57,500 2010 57,500 2011 57,500 2012 57,500 2013-2017 299,792 Total lease payments $ 587,084
58
CITY OF CEDAR RAPIDS, IOWA NOTES TO FINANCIAL STATEMENTS
JUNE 30, 2007
Leasing operations of the Airport, a component unit, consist primarily of space rentals, car rentals, and landing fees, which are governed by written agreements. These agreements range from month-to-month leases to long-term leases with various specified terms. Some of these lease agreements contain cancelable conditions, which eliminate any future guaranteed rentals or are contingent upon the income produced by the lease. The Airport also leases land and building space under various long-term leases, which expire between January 2008 and January 2051. Guaranteed minimum future lease payments to be received under all operating lease agreements are as follows: Fiscal Year Amount 2008 $ 2,793,307 2009 1,984,001 2010 1,590,740 2011 1,189,439 2012 1,396,459 2013-2017 4,915,411 2018-2022 1,764,113 2023-2027 1,357,440 2028-2032 906,744 2033-2037 5,350 2038-2042 5,350 2043-2047 3,236 2048-2051 682 Total lease payments $ 17,912,272 Cedar Rapids/Linn County Solid Waste Agency, a component unit, leases certain equipment under operating leases expiring at various dates through the year 2011. Minimum lease payments under noncancellable operating leases with an initial term of one year or more as of June 30, 2007 are summarized as follows: Fiscal Year Amount 2008 50,000 2009 50,000 2010 50,000 2011 50,000 Total lease payments $ 200,000 Note 16: Subsequent events and special items Cedar Rapids/Linn County Solid Waste Agency (CRLCSWA) Commercial Paper Subsequent to year-end, on July 26, 2007, the CRLCSWA purchased an investment in Rhinebridge, PLC commercial paper. CRLCSWA has a cost basis of $5,921,250 ($6,000,000 par) in Rhinebridge PLC commercial paper that failed to pay at maturity (10/24/07) due to illiquidity in the financial markets as an effect of the subprime mortgage crisis. A receiver and manager has been appointed of all the undertakings, property, and assets and is working to determine the market value of Rhinebridge PLC’s assets. It is unknown at this time as to the final settlement amount of this investment.
59
CITY OF CEDAR RAPIDS, IOWA NOTES TO FINANCIAL STATEMENTS
JUNE 30, 2007
Special Items City of Cedar Rapids Commercial Paper The City of Cedar Rapids has been informed that the Golden Key commercial paper it holds for the investment pool, with a cost basis of $1,948,700 ($2,000,000 par), has been delayed in its maturity payment on 12/05/07 due to illiquidity in the financial markets as an effect of the subprime mortgage crisis. A security trustee has been appointed and of all the undertakings, property, and assets and is working to determine the market value of Golden Key’s assets. As of June 30, 2007, a loss of $1,948,700 has been recognized as a special item. Water Retirement Employee Payout During the year ended June 30, 2007, $1,981,523 was paid to water retirement plan employees in the form of annuities or direct cash payouts from the remaining balance. The payment to employees is recorded as a special item since this item is infrequent occurrence. Note 17: Other Post Employment Benefits (OPEB) Plan Description and Funding Policy The City sponsors a single-employer health care plan that provides medical benefits to employees and retirees. Full-time fire fighters and police officers participate in MFPRSI and may retire after age 55 with 22 years of service or if disabled. All other full-time employees participate in the IPERS and may retire with health coverage after age 55 with 33 years of service, under the Rule of 88, at age 60 with 22 years of service or if disabled. Employees pay a small (5% or less) share of the health insurance premium. The City pays the remainder of the health insurance premium for employees. Retirees may elect to stay on the City’s group health plan until they reach age 65. Retirees pay 102% of the group rates calculated on the expected costs based on the entire group of actives, COBRA participants, and retirees. COBRA participants may elect to stay of the City’s group health plan and dental plan by paying 102% of the group rates. The current funding policy of the City is to pay health and dental claims as they occur through internal allocated funds. This arrangement does not qualify as OPEB plan assets under GASB for current GASB reporting. The City establishes and amends contribution requirements. The required contribution is based on projected pay-as-you-go financing. For fiscal year 2007, the City contributed $0. Retiree and COBRA participants receiving benefits contributed $682,568 through their required contribution of $473.23 per month for single health coverage, $1,124.04 for family health coverage, $24.58 per month for single dental coverage, and $74.05 per month for family dental coverage. The City’s annual other post-employment benefit (OPEB) cost (expense) is calculated based on the annual required contribution (ARC) of the employer, an amount actuarially determined in accordance to the parameters of GASB Statement No. 45. The ARC represents a level of funding that, if paid on an ongoing basis, is projected to cover the normal cost each year and amortize any unfunded actuarial liabilities over a period not to exceed 30 years. The following table shows the components of the City’s annual OPEB cost for the year, the amount actuarially contributed to the plan, and changes in the City’s annual OPEB obligation:
60
CITY OF CEDAR RAPIDS, IOWA NOTES TO FINANCIAL STATEMENTS
JUNE 30, 2007
Annual required contribution $ 743,776 Interest on net OPEB obligation 44,626 Adjustment to annual required contribution 682,568 Annual OPEB cost (expense) $ 1,470,970 Contributions made (682,568) Increase in net OPEB obligation $ 788,402 Net OPEB obligation – July 1, 2007 293,272 Net OPEB obligation – June 30, 2007 $ 1,081,674 The City’s annual OPEB cost, the percentage of annual OPEB cost contributed to the plan, and the net OPEB obligations for fiscal 2007 follows. % of Annual OPEB Net OPEB Fiscal Year Ended Annual OPEB Cost Cost Contributed Obligation 6/30/06 $1,014,332 71.1% $ 293,272 6/30/07 $1,470,970 46.4% $1,081,674 Funded Status and Funding Progress Post Employment Benefit Obligations Under GASB 45 calculated as of July 1, 2006, the most recent actuarial valuation date: Actuarial Accrued Liability Total Members Actives not yet eligible to receive benefits $ 4,460,440 1,198 Actives eligible to receive benefits 1,430,317 88 Retirees 1,903,245 73 Total Actuarial Accrued Liability (AAL) 7,794,002 OPEB Plan Assets - Unfunded Actuarial Accrued Liability (UAAL) 7,794,002 The covered payroll (annual payroll of active employees covered by the plan was $59,572,345 and the ratio of the UAAL to the covered payroll was 13.08%. Actuarial Methods and Assumptions The actuarial calculations were performed in accordance with the Projected Unit Credit Actuarial Cost Method as allowed under GASB 45. The excess of the AAL over the actuarial value of plan assets is the Unfunded Actuarial Accrued Liability. The Unfunded Actuarial Accrued Liability is amortized over a maximum 30 years in level dollar amounts on an open period amortization basis. The sum of the Normal Cost and the amortization of the Unfunded Actuarial Accrued Liability is the Annual Required Contribution, which with interest at the valuation rate, determines the Annual OPEB Cost. Demographic Assumptions Since benefits end at age 65, mortality is not a significant decrement. 1983 Group Annuity Mortality Table is used with males set back 1 year and females set back 6 years. Retirement rates are based on an analysis of census information and retirements provided by the City. Disability rates are modified from the 1987 Commissioner’s Group Disability Table with 12-month elimination period, male and female. The City assumes no recovery from disability. 1983 Group Annuity Mortality Table is used with males set forward 9 years and females set forward 4 years. 80% of current actives who receive benefits in the future will be Retirees married but only 50% of their spouses will participate due to the “family rate” surcharge. 60% of future retirees and 100% of current retirees are expected to continue to participate in their current plans.
61
CITY OF CEDAR RAPIDS, IOWA NOTES TO FINANCIAL STATEMENTS
JUNE 30, 2007
Economic Cost Assumptions The rate at which projected cash flows are to be discounted should reflect rates of return on high-quality fixed-income investments currently available and expected to be available during the period in which the benefits are expected to be paid. Fiscal 2007 per capita health care costs for retirees were determined based on an analysis of the retiree’s claims experience provided by the City over the prior five fiscal years. Per capita costs are adjusted for age, and illustrative costs are shown below: Monthly Per Age Capita Costs 57 $ 751.93 62 919.03 These costs are expected to increase at the Health Care Cost Trend. Retiree required monthly contributions are equal to the COBRA rates. The rate of contribution for FY2007 is shown below and is assumed to increase by the HCCT shown below. Required Category Monthly Contributions Single Health $ 473.28 Family Health 1,124.04 Health care cost trend rates are used to anticipate increases in medical benefit costs expected to be experienced by the retiree health plan in each future year. The trend rates used are based on a long term general inflation assumption of 4.0%, and real economic growth of 1.5%. Fiscal Year Beginning Medical Change Over Prior Trend 2008 8.50% 2009 8.00% 2010 7.50% 2011 7.00% 2012 6.50% 2013+ 6.00% Actuarial calculations reflect a long-term perspective that involves estimates of reported amounts and assumptions about the probability of events far into the future. Actuarially determined amounts are subject to continual revision as actual results are compared to past expectations and new estimates are made about the future. Benefits are projected based on benefit levels and cost-sharing arrangements as of July 1, 2006 and do not explicitly reflect the potential effects of legal or contractual funding limitations. Note 17: New Pronouncements As of June 30, 2007, the GASB had issued several statements not yet implemented by the City. The statements which might impact the City are as follows:
GASB Statement No. 48, Sales and Pledges of Receivables and Future Revenues and Intra-Entity Transfers of Assets and Future Revenues, issued September 2006, will be effective for the City beginning with its year ending June 30, 2008. This Statement establishes accounting and financial reporting standards for transactions in which a government receives, or is entitled to, resources in exchange for future cash flows generated by collecting specific receivables or specific future revenues. It also provides disclosure requirements for a government that pledges or commits future cash flows from a
62
CITY OF CEDAR RAPIDS, IOWA NOTES TO FINANCIAL STATEMENTS
JUNE 30, 2007
specific revenue source. In addition, this Statement establishes accounting and financial reporting standards for intra-entity transfers of assets and future revenues. GASB Statement No. 49, Accounting and Financial Reporting for Pollution Remediation Obligations, issued November 2006, will be effective for the City beginning with its year ending June 30, 2009. This Statement addresses accounting and financial reporting standards for pollution (including contamination) remediation obligations, which are obligations to address the current or potential detrimental effects of existing pollution by participating in pollution remediation activities, such as site assessments and cleanups. This standard requires the City to estimate the components of expected pollution remediation outlays and determine whether the outlays for those components should be accrued as a liability or, if appropriate, capitalized when goods and services are acquired. GASB Statement No. 50, Pension Disclosures, an amendment of GASB Statement Nos. 25 and 27, issued May 2007, will be effective for the City beginning with its year ending June 30, 2008. This Statement more closely aligns the financial reporting requirements for pensions with those for other postemployment benefits (OPEB) and, in doing so, enhances information disclosed in notes to the financial statements or presented as required supplementary information (RSI) by pension plans and by employers that provide pension benefits. GASB Statement No. 51, Accounting and Financial Reporting for Intangible Assets, issued July 2007, will be effective for the City beginning with its year ending June 30, 2010. This Statement provides guidance regarding how to identify, account for and report intangible assets. The new standard characterizes an intangible asset as an asset that lacks physical substance, is nonfinancial in nature and has an initial useful life extending beyond a single reporting period. Examples of intangible assets include easements, computer software, water rights, timber rights, patents and trademarks. This standard provides that intangible assets be classified as capital assets (except for those explicitly excluded from the scope of the new standard, such as capital leases). Relevant authoritative guidance for capital assets should be applied to these intangible assets.
The City’s management has not yet determined the effect these Statements will have on the City’s financial statements.
63

64
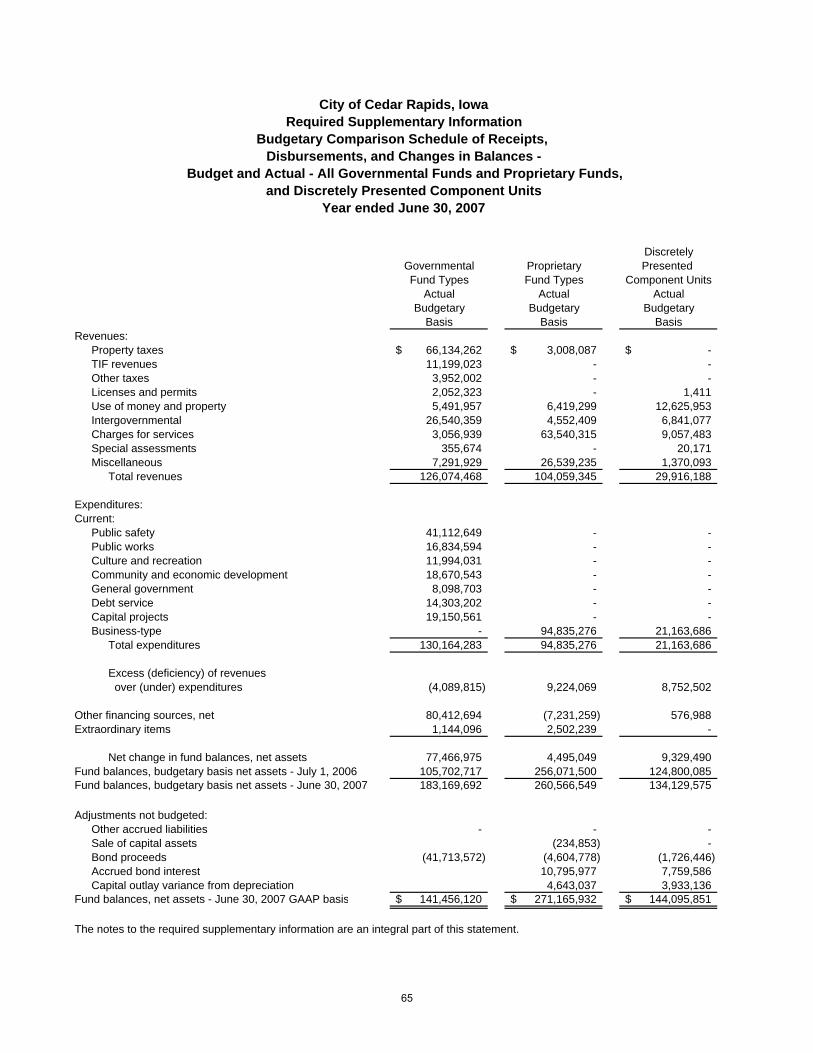
DiscretelyGovernmental Proprietary Presented Fund Types Fund Types Component Units
Actual Actual ActualBudgetary Budgetary Budgetary
Basis Basis BasisRevenues:
Property taxes 66,134,262$ 3,008,087$ -$ TIF revenues 11,199,023 - - Other taxes 3,952,002 - - Licenses and permits 2,052,323 - 1,411 Use of money and property 5,491,957 6,419,299 12,625,953 Intergovernmental 26,540,359 4,552,409 6,841,077 Charges for services 3,056,939 63,540,315 9,057,483 Special assessments 355,674 - 20,171 Miscellaneous 7,291,929 26,539,235 1,370,093
Total revenues 126,074,468 104,059,345 29,916,188
Expenditures:Current:
Public safety 41,112,649 - - Public works 16,834,594 - - Culture and recreation 11,994,031 - - Community and economic development 18,670,543 - - General government 8,098,703 - -
Debt service 14,303,202 - - Capital projects 19,150,561 - - Business-type - 94,835,276 21,163,686
Total expenditures 130,164,283 94,835,276 21,163,686
Excess (deficiency) of revenues over (under) expenditures (4,089,815) 9,224,069 8,752,502
Other financing sources, net 80,412,694 (7,231,259) 576,988 Extraordinary items 1,144,096 2,502,239 -
Net change in fund balances, net assets 77,466,975 4,495,049 9,329,490 Fund balances, budgetary basis net assets - July 1, 2006 105,702,717 256,071,500 124,800,085 Fund balances, budgetary basis net assets - June 30, 2007 183,169,692 260,566,549 134,129,575
Adjustments not budgeted: Other accrued liabilities - - - Sale of capital assets (234,853) - Bond proceeds (41,713,572) (4,604,778) (1,726,446) Accrued bond interest 10,795,977 7,759,586 Capital outlay variance from depreciation 4,643,037 3,933,136
Fund balances, net assets - June 30, 2007 GAAP basis 141,456,120$ 271,165,932$ 144,095,851$
The notes to the required supplementary information are an integral part of this statement.
Budget and Actual - All Governmental Funds and Proprietary Funds,
Year ended June 30, 2007
City of Cedar Rapids, IowaRequired Supplementary Information
Budgetary Comparison Schedule of Receipts, Disbursements, and Changes in Balances -
and Discretely Presented Component Units
65
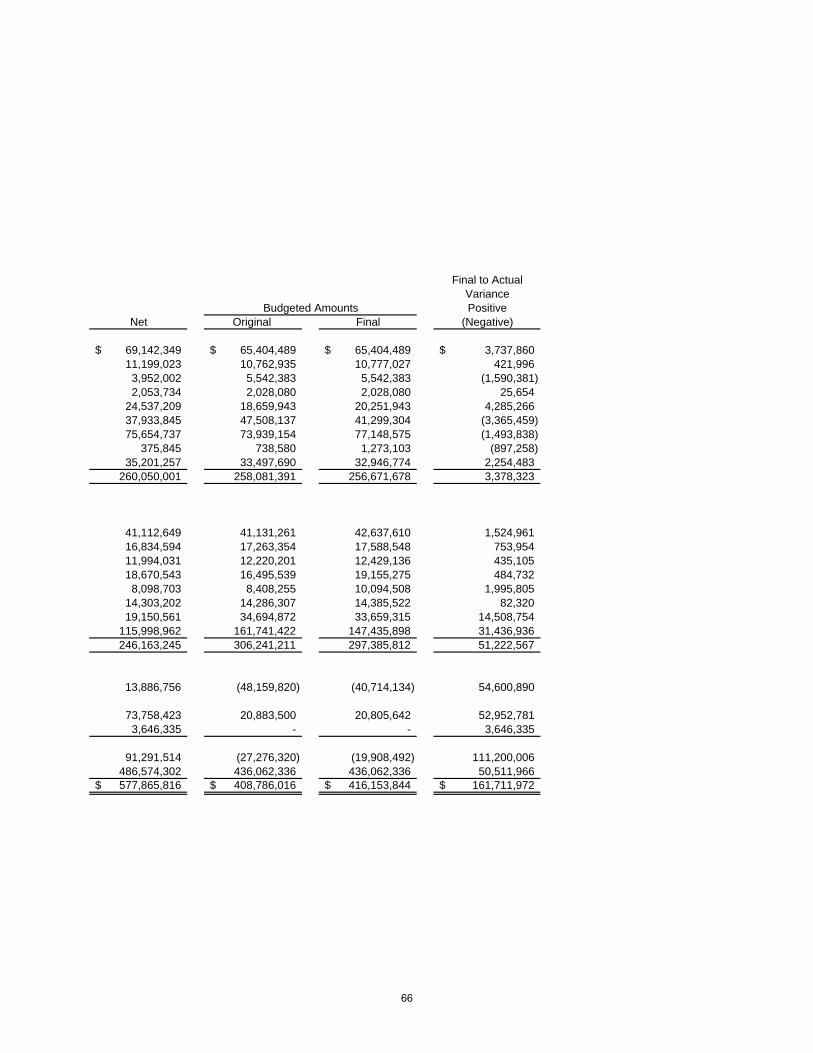
Final to Actual
VariancePositive
Net Original Final (Negative)
69,142,349$ 65,404,489$ 65,404,489$ 3,737,860$ 11,199,023 10,762,935 10,777,027 421,996
3,952,002 5,542,383 5,542,383 (1,590,381) 2,053,734 2,028,080 2,028,080 25,654
24,537,209 18,659,943 20,251,943 4,285,266 37,933,845 47,508,137 41,299,304 (3,365,459) 75,654,737 73,939,154 77,148,575 (1,493,838)
375,845 738,580 1,273,103 (897,258) 35,201,257 33,497,690 32,946,774 2,254,483
260,050,001 258,081,391 256,671,678 3,378,323
41,112,649 41,131,261 42,637,610 1,524,961 16,834,594 17,263,354 17,588,548 753,954 11,994,031 12,220,201 12,429,136 435,105 18,670,543 16,495,539 19,155,275 484,732
8,098,703 8,408,255 10,094,508 1,995,805 14,303,202 14,286,307 14,385,522 82,320 19,150,561 34,694,872 33,659,315 14,508,754
115,998,962 161,741,422 147,435,898 31,436,936 246,163,245 306,241,211 297,385,812 51,222,567
13,886,756 (48,159,820) (40,714,134) 54,600,890
73,758,423 20,883,500 20,805,642 52,952,781 3,646,335 - - 3,646,335
91,291,514 (27,276,320) (19,908,492) 111,200,006 486,574,302 436,062,336 436,062,336 50,511,966 577,865,816$ 408,786,016$ 416,153,844$ 161,711,972$
Budgeted Amounts
66
CITY OF CEDAR RAPIDS, IOWA REQUIRED SUPPLEMENTARY INFORMATION
Notes to Required Supplementary Information – Budgetary Reporting June 30, 2007
Formal and legal budgetary control is based upon ten major classes of disbursements known as functions, not by fund or fund type. These ten functions are: public safety, public works, health and social services, culture and recreation, community and economic development, general government, debt service, capital projects, business-type and non-program. Function disbursements required to be budgeted include disbursements for the general fund, special revenue funds, debt service fund, capital projects funds, and permanent funds. The legal level of control is at the aggregated function level, not at the fund or fund type level. During the year, one budget amendment decrease budget disbursements by $8,855,399. This budget amendment is reflected in the final budgeted amounts. The operations of the Cedar Rapids Public Library Foundation discretely presented component unit are not included in the City’s budget.
67
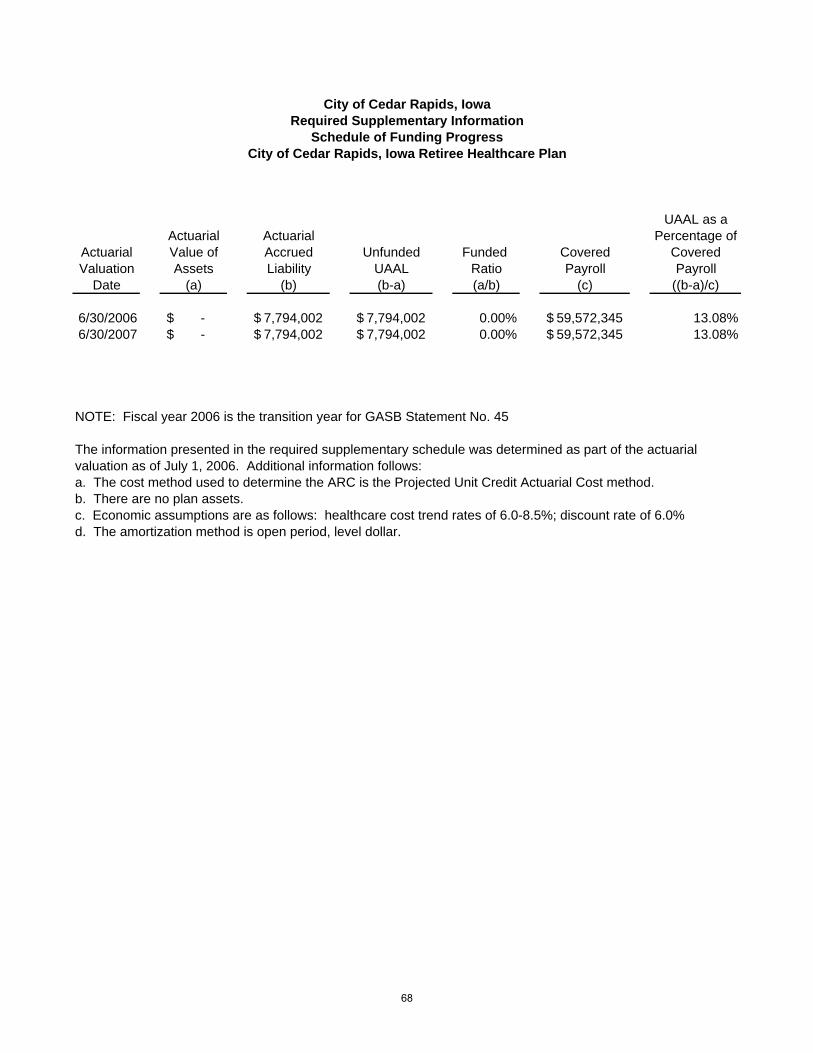
UAAL as aActuarial Actuarial Percentage of
Actuarial Value of Accrued Unfunded Funded Covered CoveredValuation Assets Liability UAAL Ratio Payroll Payroll
Date (a) (b) (b-a) (a/b) (c) ((b-a)/c)
6/30/2006 -$ 7,794,002$ 7,794,002$ 0.00% 59,572,345$ 13.08%6/30/2007 -$ 7,794,002$ 7,794,002$ 0.00% 59,572,345$ 13.08%
NOTE: Fiscal year 2006 is the transition year for GASB Statement No. 45
The information presented in the required supplementary schedule was determined as part of the actuarialvaluation as of July 1, 2006. Additional information follows:a. The cost method used to determine the ARC is the Projected Unit Credit Actuarial Cost method.b. There are no plan assets.c. Economic assumptions are as follows: healthcare cost trend rates of 6.0-8.5%; discount rate of 6.0%d. The amortization method is open period, level dollar.
City of Cedar Rapids, IowaRequired Supplementary Information
Schedule of Funding ProgressCity of Cedar Rapids, Iowa Retiree Healthcare Plan
68
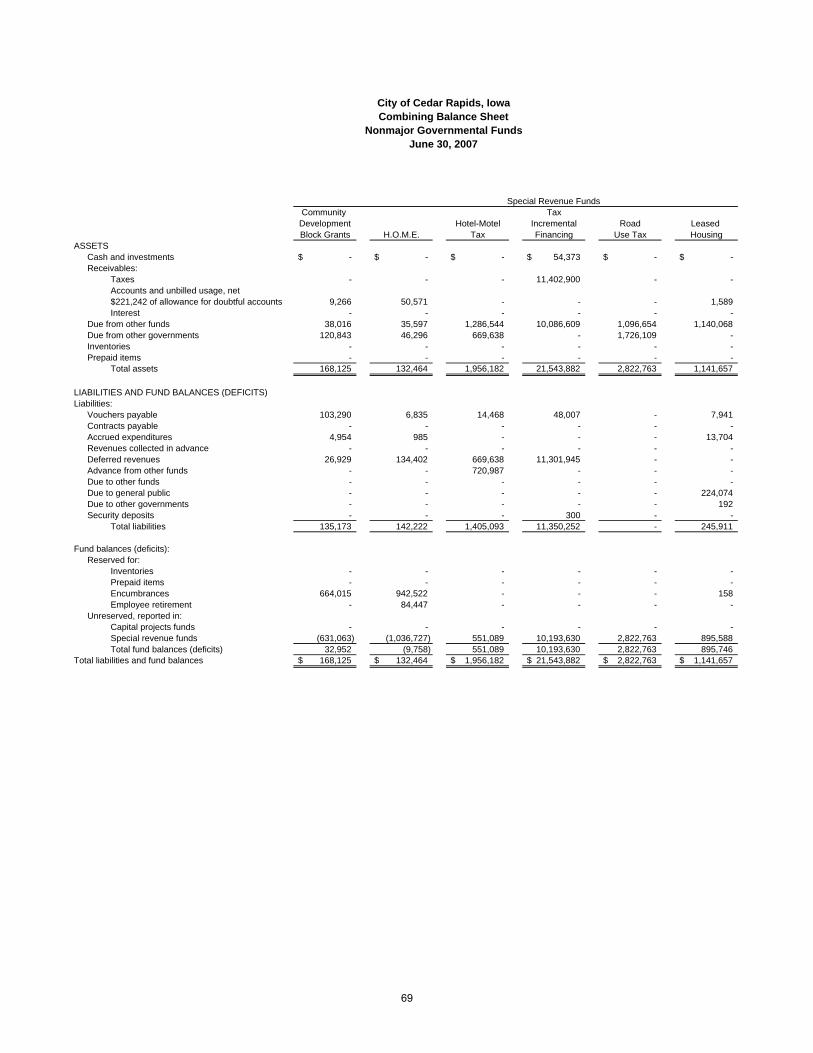
Community TaxDevelopment Hotel-Motel Incremental Road Leased Block Grants H.O.M.E. Tax Financing Use Tax Housing
ASSETSCash and investments -$ -$ -$ 54,373$ -$ -$ Receivables:
Taxes - - - 11,402,900 - - Accounts and unbilled usage, net$221,242 of allowance for doubtful accounts 9,266 50,571 - - - 1,589 Interest - - - - - -
Due from other funds 38,016 35,597 1,286,544 10,086,609 1,096,654 1,140,068 Due from other governments 120,843 46,296 669,638 - 1,726,109 - Inventories - - - - - - Prepaid items - - - - - -
Total assets 168,125 132,464 1,956,182 21,543,882 2,822,763 1,141,657
LIABILITIES AND FUND BALANCES (DEFICITS)Liabilities:
Vouchers payable 103,290 6,835 14,468 48,007 - 7,941 Contracts payable - - - - - - Accrued expenditures 4,954 985 - - - 13,704 Revenues collected in advance - - - - - - Deferred revenues 26,929 134,402 669,638 11,301,945 - - Advance from other funds - - 720,987 - - - Due to other funds - - - - - - Due to general public - - - - - 224,074 Due to other governments - - - - - 192 Security deposits - - - 300 - -
Total liabilities 135,173 142,222 1,405,093 11,350,252 - 245,911
Fund balances (deficits):Reserved for:
Inventories - - - - - - Prepaid items - - - - - - Encumbrances 664,015 942,522 - - - 158 Employee retirement - 84,447 - - - -
Unreserved, reported in:Capital projects funds - - - - - - Special revenue funds (631,063) (1,036,727) 551,089 10,193,630 2,822,763 895,588 Total fund balances (deficits) 32,952 (9,758) 551,089 10,193,630 2,822,763 895,746
Total liabilities and fund balances 168,125$ 132,464$ 1,956,182$ 21,543,882$ 2,822,763$ 1,141,657$
June 30, 2007
City of Cedar Rapids, Iowa
Special Revenue Funds
Combining Balance SheetNonmajor Governmental Funds
69
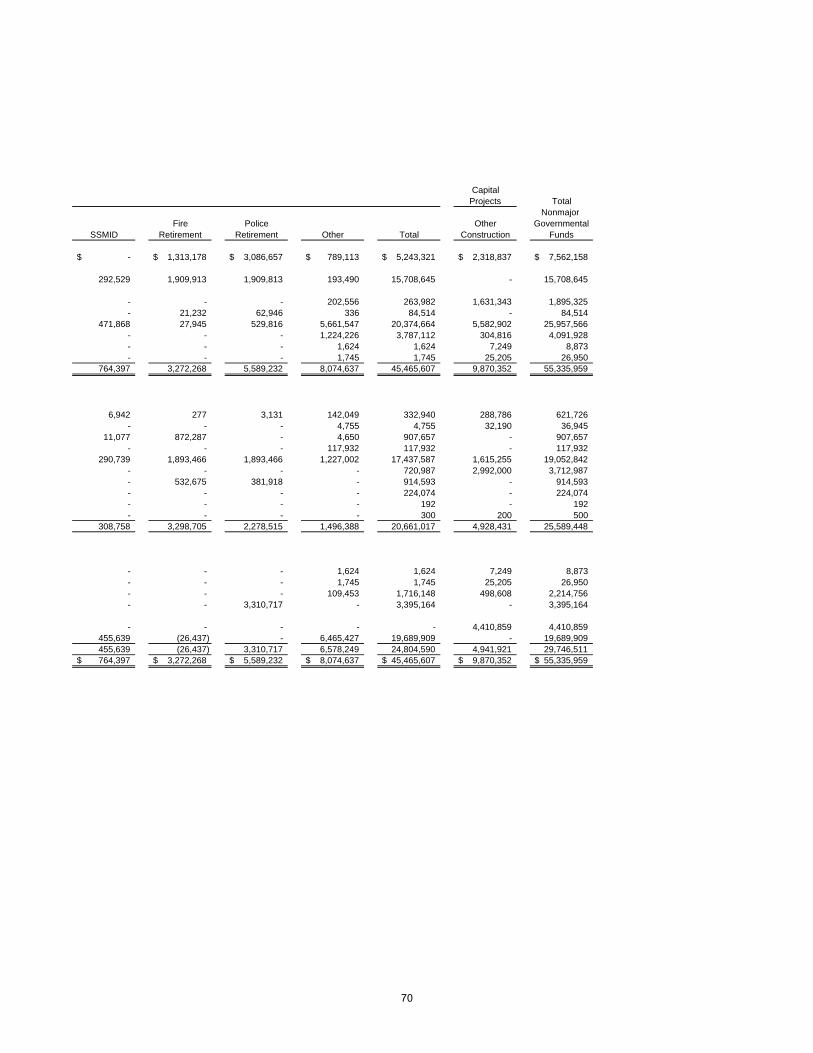
CapitalProjects Total
Nonmajor Fire Police Other Governmental
SSMID Retirement Retirement Other Total Construction Funds
-$ 1,313,178$ 3,086,657$ 789,113$ 5,243,321$ 2,318,837$ 7,562,158$
292,529 1,909,913 1,909,813 193,490 15,708,645 - 15,708,645
- - - 202,556 263,982 1,631,343 1,895,325 - 21,232 62,946 336 84,514 - 84,514
471,868 27,945 529,816 5,661,547 20,374,664 5,582,902 25,957,566 - - - 1,224,226 3,787,112 304,816 4,091,928 - - - 1,624 1,624 7,249 8,873 - - - 1,745 1,745 25,205 26,950
764,397 3,272,268 5,589,232 8,074,637 45,465,607 9,870,352 55,335,959
6,942 277 3,131 142,049 332,940 288,786 621,726 - - - 4,755 4,755 32,190 36,945
11,077 872,287 - 4,650 907,657 - 907,657 - - - 117,932 117,932 - 117,932
290,739 1,893,466 1,893,466 1,227,002 17,437,587 1,615,255 19,052,842 - - - - 720,987 2,992,000 3,712,987 - 532,675 381,918 - 914,593 - 914,593 - - - - 224,074 - 224,074 - - - - 192 - 192 - - - - 300 200 500
308,758 3,298,705 2,278,515 1,496,388 20,661,017 4,928,431 25,589,448
- - - 1,624 1,624 7,249 8,873 - - - 1,745 1,745 25,205 26,950 - - - 109,453 1,716,148 498,608 2,214,756 - - 3,310,717 - 3,395,164 - 3,395,164
- - - - - 4,410,859 4,410,859
455,639 (26,437) - 6,465,427 19,689,909 - 19,689,909 455,639 (26,437) 3,310,717 6,578,249 24,804,590 4,941,921 29,746,511 764,397$ 3,272,268$ 5,589,232$ 8,074,637$ 45,465,607$ 9,870,352$ 55,335,959$
70
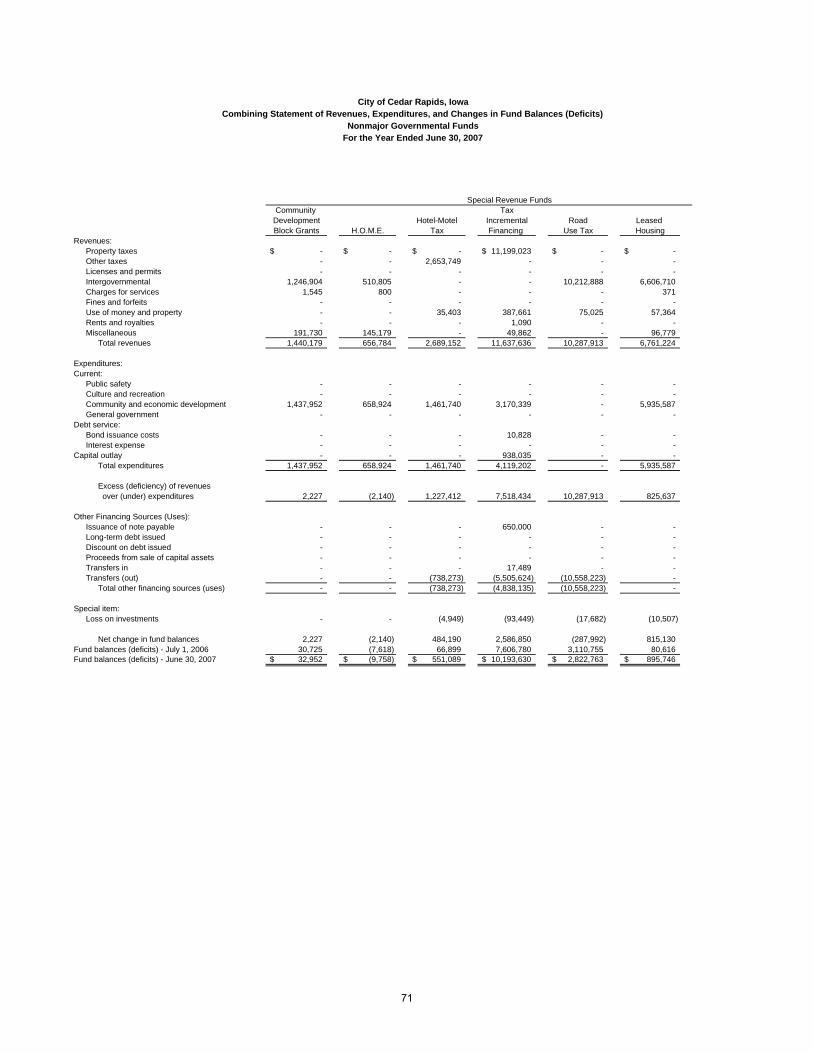
Community TaxDevelopment Hotel-Motel Incremental Road Leased Block Grants H.O.M.E. Tax Financing Use Tax Housing
Revenues:Property taxes -$ -$ -$ 11,199,023$ -$ -$ Other taxes - - 2,653,749 - - - Licenses and permits - - - - - - Intergovernmental 1,246,904 510,805 - - 10,212,888 6,606,710 Charges for services 1,545 800 - - - 371 Fines and forfeits - - - - - - Use of money and property - - 35,403 387,661 75,025 57,364 Rents and royalties - - - 1,090 - - Miscellaneous 191,730 145,179 - 49,862 - 96,779
Total revenues 1,440,179 656,784 2,689,152 11,637,636 10,287,913 6,761,224
Expenditures:Current:
Public safety - - - - - - Culture and recreation - - - - - - Community and economic development 1,437,952 658,924 1,461,740 3,170,339 - 5,935,587 General government - - - - - -
Debt service: Bond issuance costs - - - 10,828 - - Interest expense - - - - - -
Capital outlay - - - 938,035 - - Total expenditures 1,437,952 658,924 1,461,740 4,119,202 - 5,935,587
Excess (deficiency) of revenues over (under) expenditures 2,227 (2,140) 1,227,412 7,518,434 10,287,913 825,637
Other Financing Sources (Uses):Issuance of note payable - - - 650,000 - - Long-term debt issued - - - - - - Discount on debt issued - - - - - - Proceeds from sale of capital assets - - - - - - Transfers in - - - 17,489 - - Transfers (out) - - (738,273) (5,505,624) (10,558,223) -
Total other financing sources (uses) - - (738,273) (4,838,135) (10,558,223) -
Special item:Loss on investments - - (4,949) (93,449) (17,682) (10,507)
Net change in fund balances 2,227 (2,140) 484,190 2,586,850 (287,992) 815,130 Fund balances (deficits) - July 1, 2006 30,725 (7,618) 66,899 7,606,780 3,110,755 80,616 Fund balances (deficits) - June 30, 2007 32,952$ (9,758)$ 551,089$ 10,193,630$ 2,822,763$ 895,746$
Special Revenue Funds
City of Cedar Rapids, IowaCombining Statement of Revenues, Expenditures, and Changes in Fund Balances (Deficits)
Nonmajor Governmental FundsFor the Year Ended June 30, 2007
71
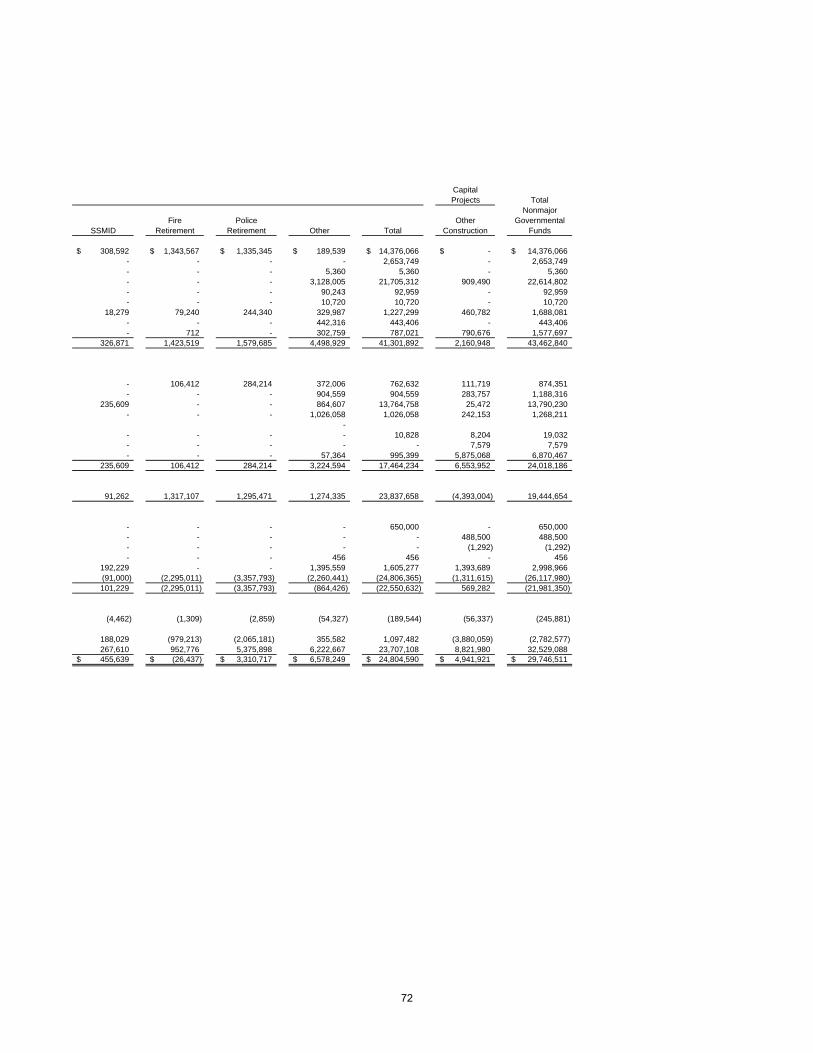
CapitalProjects Total
Nonmajor Fire Police Other Governmental
SSMID Retirement Retirement Other Total Construction Funds
308,592$ 1,343,567$ 1,335,345$ 189,539$ 14,376,066$ -$ 14,376,066$ - - - - 2,653,749 - 2,653,749 - - - 5,360 5,360 - 5,360 - - - 3,128,005 21,705,312 909,490 22,614,802 - - - 90,243 92,959 - 92,959 - - - 10,720 10,720 - 10,720
18,279 79,240 244,340 329,987 1,227,299 460,782 1,688,081 - - - 442,316 443,406 - 443,406 - 712 - 302,759 787,021 790,676 1,577,697
326,871 1,423,519 1,579,685 4,498,929 41,301,892 2,160,948 43,462,840
- 106,412 284,214 372,006 762,632 111,719 874,351 - - - 904,559 904,559 283,757 1,188,316
235,609 - - 864,607 13,764,758 25,472 13,790,230 - - - 1,026,058 1,026,058 242,153 1,268,211
- - - - - 10,828 8,204 19,032 - - - - - 7,579 7,579 - - - 57,364 995,399 5,875,068 6,870,467
235,609 106,412 284,214 3,224,594 17,464,234 6,553,952 24,018,186
91,262 1,317,107 1,295,471 1,274,335 23,837,658 (4,393,004) 19,444,654
- - - - 650,000 - 650,000 - - - - - 488,500 488,500 - - - - - (1,292) (1,292) - - - 456 456 - 456
192,229 - - 1,395,559 1,605,277 1,393,689 2,998,966 (91,000) (2,295,011) (3,357,793) (2,260,441) (24,806,365) (1,311,615) (26,117,980) 101,229 (2,295,011) (3,357,793) (864,426) (22,550,632) 569,282 (21,981,350)
(4,462) (1,309) (2,859) (54,327) (189,544) (56,337) (245,881)
188,029 (979,213) (2,065,181) 355,582 1,097,482 (3,880,059) (2,782,577) 267,610 952,776 5,375,898 6,222,667 23,707,108 8,821,980 32,529,088 455,639$ (26,437)$ 3,310,717$ 6,578,249$ 24,804,590$ 4,941,921$ 29,746,511$
72
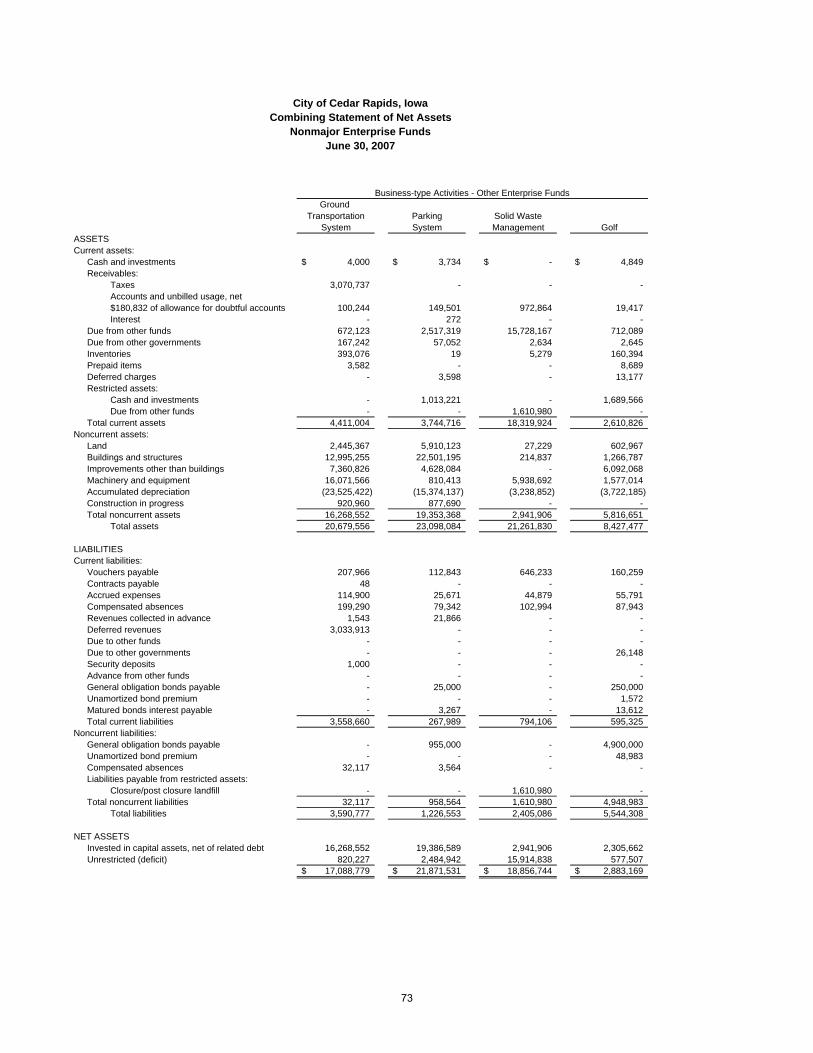
Ground Transportation Parking Solid Waste
System System Management GolfASSETSCurrent assets:
Cash and investments 4,000$ 3,734$ -$ 4,849$ Receivables:
Taxes 3,070,737 - - - Accounts and unbilled usage, net$180,832 of allowance for doubtful accounts 100,244 149,501 972,864 19,417 Interest - 272 - -
Due from other funds 672,123 2,517,319 15,728,167 712,089 Due from other governments 167,242 57,052 2,634 2,645 Inventories 393,076 19 5,279 160,394 Prepaid items 3,582 - - 8,689 Deferred charges - 3,598 - 13,177 Restricted assets:
Cash and investments - 1,013,221 - 1,689,566 Due from other funds - - 1,610,980 -
Total current assets 4,411,004 3,744,716 18,319,924 2,610,826 Noncurrent assets:
Land 2,445,367 5,910,123 27,229 602,967 Buildings and structures 12,995,255 22,501,195 214,837 1,266,787 Improvements other than buildings 7,360,826 4,628,084 - 6,092,068 Machinery and equipment 16,071,566 810,413 5,938,692 1,577,014 Accumulated depreciation (23,525,422) (15,374,137) (3,238,852) (3,722,185) Construction in progress 920,960 877,690 - - Total noncurrent assets 16,268,552 19,353,368 2,941,906 5,816,651
Total assets 20,679,556 23,098,084 21,261,830 8,427,477
LIABILITIESCurrent liabilities:
Vouchers payable 207,966 112,843 646,233 160,259 Contracts payable 48 - - - Accrued expenses 114,900 25,671 44,879 55,791 Compensated absences 199,290 79,342 102,994 87,943 Revenues collected in advance 1,543 21,866 - - Deferred revenues 3,033,913 - - - Due to other funds - - - - Due to other governments - - - 26,148 Security deposits 1,000 - - - Advance from other funds - - - - General obligation bonds payable - 25,000 - 250,000 Unamortized bond premium - - - 1,572 Matured bonds interest payable - 3,267 - 13,612 Total current liabilities 3,558,660 267,989 794,106 595,325
Noncurrent liabilities:General obligation bonds payable - 955,000 - 4,900,000 Unamortized bond premium - - - 48,983 Compensated absences 32,117 3,564 - - Liabilities payable from restricted assets:
Closure/post closure landfill - - 1,610,980 - Total noncurrent liabilities 32,117 958,564 1,610,980 4,948,983
Total liabilities 3,590,777 1,226,553 2,405,086 5,544,308
NET ASSETSInvested in capital assets, net of related debt 16,268,552 19,386,589 2,941,906 2,305,662 Unrestricted (deficit) 820,227 2,484,942 15,914,838 577,507
17,088,779$ 21,871,531$ 18,856,744$ 2,883,169$
Business-type Activities - Other Enterprise Funds
City of Cedar Rapids, IowaCombining Statement of Net Assets
Nonmajor Enterprise FundsJune 30, 2007
73
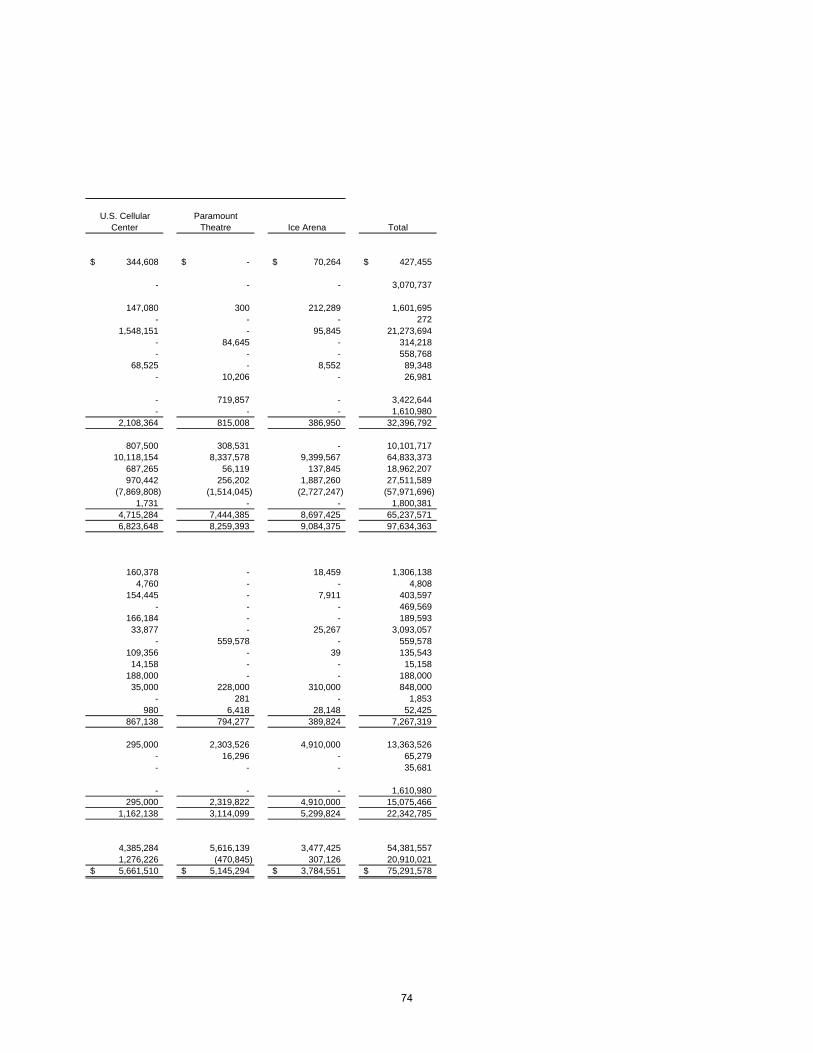
U.S. Cellular ParamountCenter Theatre Ice Arena Total
344,608$ -$ 70,264$ 427,455$
- - - 3,070,737
147,080 300 212,289 1,601,695 - - - 272
1,548,151 - 95,845 21,273,694 - 84,645 - 314,218 - - - 558,768
68,525 - 8,552 89,348 - 10,206 - 26,981
- 719,857 - 3,422,644 - - - 1,610,980
2,108,364 815,008 386,950 32,396,792
807,500 308,531 - 10,101,717 10,118,154 8,337,578 9,399,567 64,833,373
687,265 56,119 137,845 18,962,207 970,442 256,202 1,887,260 27,511,589
(7,869,808) (1,514,045) (2,727,247) (57,971,696) 1,731 - - 1,800,381
4,715,284 7,444,385 8,697,425 65,237,571 6,823,648 8,259,393 9,084,375 97,634,363
160,378 - 18,459 1,306,138 4,760 - - 4,808
154,445 - 7,911 403,597 - - - 469,569
166,184 - - 189,593 33,877 - 25,267 3,093,057
- 559,578 - 559,578 109,356 - 39 135,543 14,158 - - 15,158
188,000 - - 188,000 35,000 228,000 310,000 848,000
- 281 - 1,853 980 6,418 28,148 52,425
867,138 794,277 389,824 7,267,319
295,000 2,303,526 4,910,000 13,363,526 - 16,296 - 65,279 - - - 35,681
- - - 1,610,980 295,000 2,319,822 4,910,000 15,075,466
1,162,138 3,114,099 5,299,824 22,342,785
4,385,284 5,616,139 3,477,425 54,381,557 1,276,226 (470,845) 307,126 20,910,021 5,661,510$ 5,145,294$ 3,784,551$ 75,291,578$
74
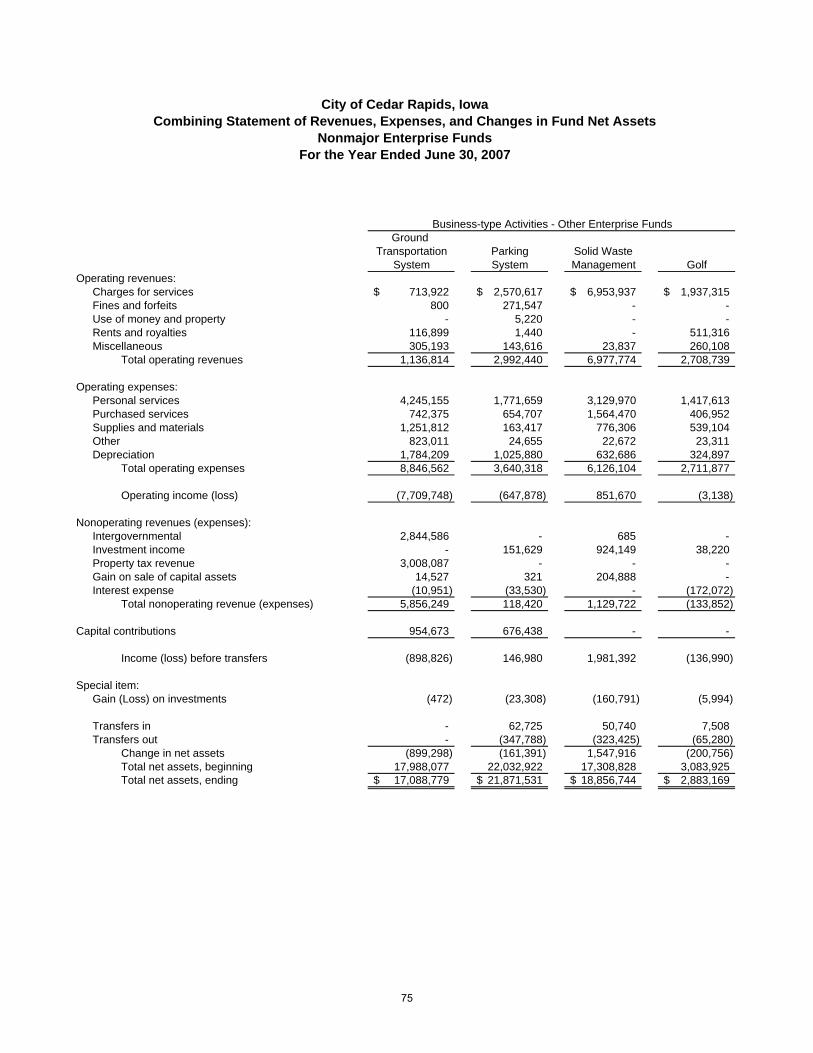
Ground Transportation Parking Solid Waste
System System Management GolfOperating revenues: Charges for services 713,922$ 2,570,617$ 6,953,937$ 1,937,315$
Fines and forfeits 800 271,547 - - Use of money and property - 5,220 - - Rents and royalties 116,899 1,440 - 511,316 Miscellaneous 305,193 143,616 23,837 260,108
Total operating revenues 1,136,814 2,992,440 6,977,774 2,708,739
Operating expenses:Personal services 4,245,155 1,771,659 3,129,970 1,417,613 Purchased services 742,375 654,707 1,564,470 406,952 Supplies and materials 1,251,812 163,417 776,306 539,104 Other 823,011 24,655 22,672 23,311 Depreciation 1,784,209 1,025,880 632,686 324,897
Total operating expenses 8,846,562 3,640,318 6,126,104 2,711,877
Operating income (loss) (7,709,748) (647,878) 851,670 (3,138)
Nonoperating revenues (expenses):Intergovernmental 2,844,586 - 685 - Investment income - 151,629 924,149 38,220 Property tax revenue 3,008,087 - - - Gain on sale of capital assets 14,527 321 204,888 - Interest expense (10,951) (33,530) - (172,072)
Total nonoperating revenue (expenses) 5,856,249 118,420 1,129,722 (133,852)
Capital contributions 954,673 676,438 - -
Income (loss) before transfers (898,826) 146,980 1,981,392 (136,990)
Special item:Gain (Loss) on investments (472) (23,308) (160,791) (5,994)
Transfers in - 62,725 50,740 7,508 Transfers out - (347,788) (323,425) (65,280)
Change in net assets (899,298) (161,391) 1,547,916 (200,756) Total net assets, beginning 17,988,077 22,032,922 17,308,828 3,083,925 Total net assets, ending 17,088,779$ 21,871,531$ 18,856,744$ 2,883,169$
Business-type Activities - Other Enterprise Funds
City of Cedar Rapids, IowaCombining Statement of Revenues, Expenses, and Changes in Fund Net Assets
Nonmajor Enterprise FundsFor the Year Ended June 30, 2007
75
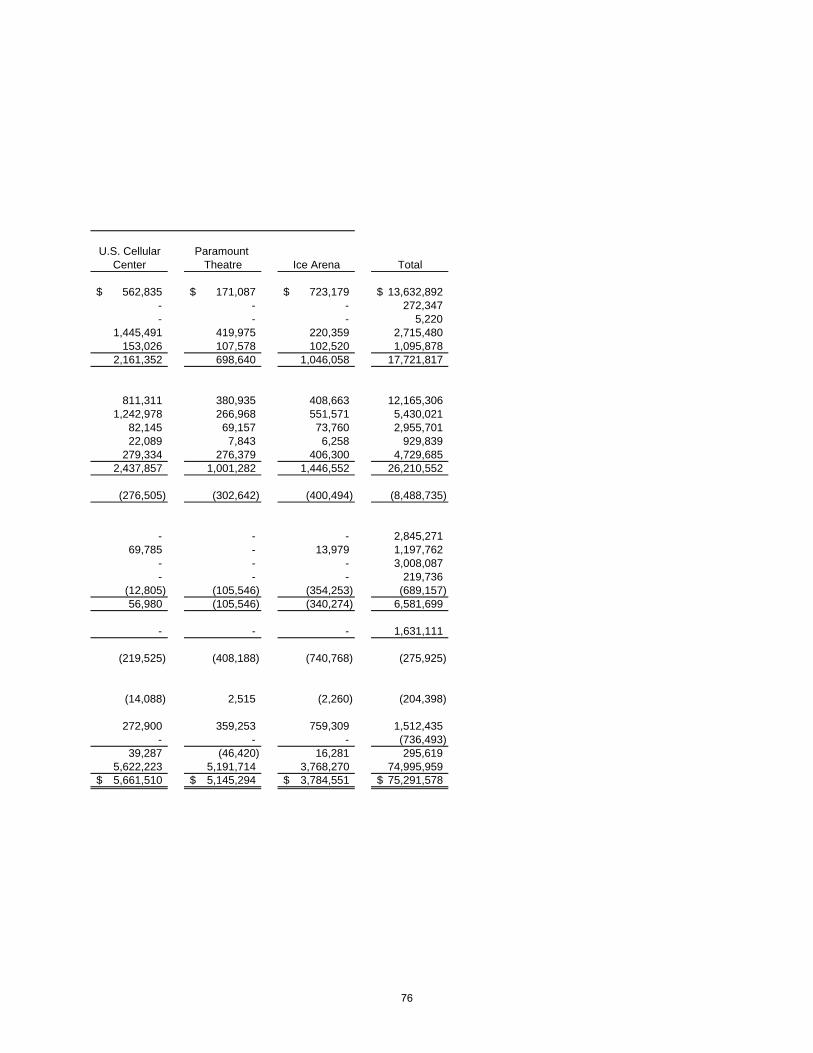
U.S. Cellular Paramount Center Theatre Ice Arena Total
562,835$ 171,087$ 723,179$ 13,632,892$ - - - 272,347 - - - 5,220
1,445,491 419,975 220,359 2,715,480 153,026 107,578 102,520 1,095,878
2,161,352 698,640 1,046,058 17,721,817
811,311 380,935 408,663 12,165,306 1,242,978 266,968 551,571 5,430,021
82,145 69,157 73,760 2,955,701 22,089 7,843 6,258 929,839
279,334 276,379 406,300 4,729,685 2,437,857 1,001,282 1,446,552 26,210,552
(276,505) (302,642) (400,494) (8,488,735)
- - - 2,845,271 69,785 - 13,979 1,197,762
- - - 3,008,087 - - - 219,736
(12,805) (105,546) (354,253) (689,157) 56,980 (105,546) (340,274) 6,581,699
- - - 1,631,111
(219,525) (408,188) (740,768) (275,925)
(14,088) 2,515 (2,260) (204,398)
272,900 359,253 759,309 1,512,435 - - - (736,493)
39,287 (46,420) 16,281 295,619 5,622,223 5,191,714 3,768,270 74,995,959 5,661,510$ 5,145,294$ 3,784,551$ 75,291,578$
76
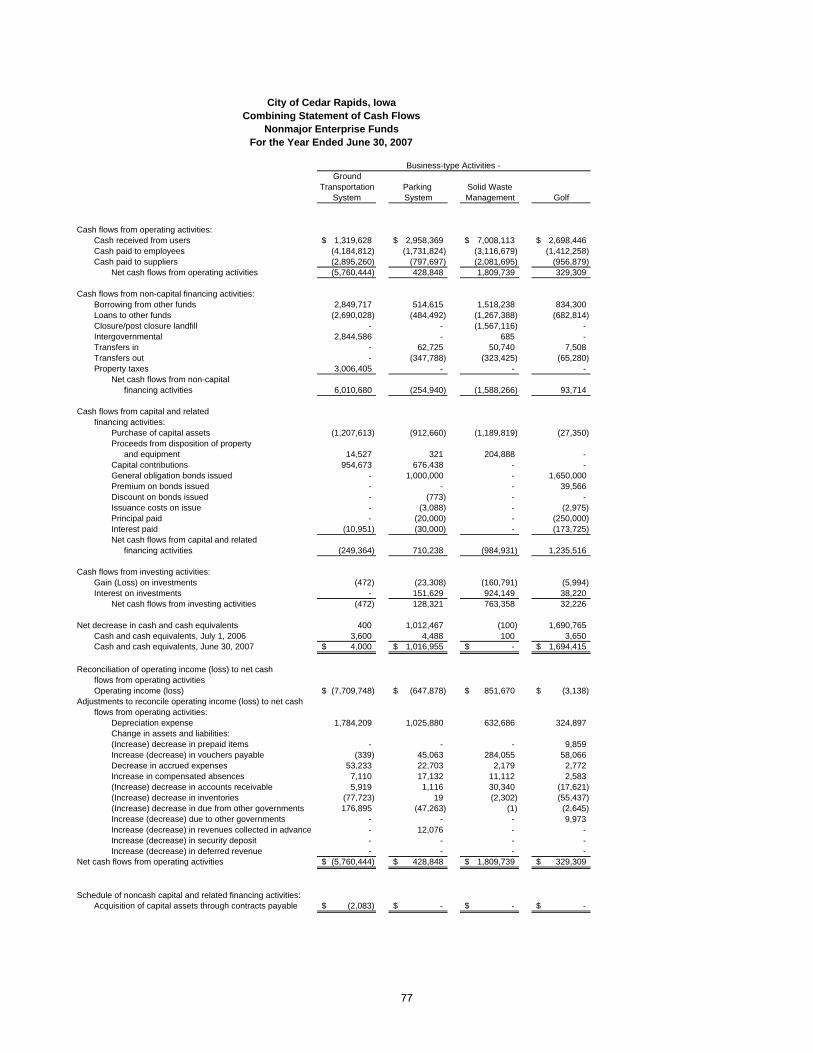
GroundTransportation Parking Solid Waste
System System Management Golf
Cash flows from operating activities:Cash received from users 1,319,628$ 2,958,369$ 7,008,113$ 2,698,446$ Cash paid to employees (4,184,812) (1,731,824) (3,116,679) (1,412,258) Cash paid to suppliers (2,895,260) (797,697) (2,081,695) (956,879)
Net cash flows from operating activities (5,760,444) 428,848 1,809,739 329,309
Cash flows from non-capital financing activities:Borrowing from other funds 2,849,717 514,615 1,518,238 834,300 Loans to other funds (2,690,028) (484,492) (1,267,388) (682,814) Closure/post closure landfill - - (1,567,116) - Intergovernmental 2,844,586 - 685 - Transfers in - 62,725 50,740 7,508 Transfers out - (347,788) (323,425) (65,280) Property taxes 3,006,405 - - -
Net cash flows from non-capitalfinancing activities 6,010,680 (254,940) (1,588,266) 93,714
Cash flows from capital and relatedfinancing activities:
Purchase of capital assets (1,207,613) (912,660) (1,189,819) (27,350) Proceeds from disposition of property
and equipment 14,527 321 204,888 - Capital contributions 954,673 676,438 - - General obligation bonds issued - 1,000,000 - 1,650,000 Premium on bonds issued - - - 39,566 Discount on bonds issued - (773) - - Issuance costs on issue - (3,088) - (2,975) Principal paid - (20,000) - (250,000) Interest paid (10,951) (30,000) - (173,725) Net cash flows from capital and related
financing activities (249,364) 710,238 (984,931) 1,235,516
Cash flows from investing activities:Gain (Loss) on investments (472) (23,308) (160,791) (5,994) Interest on investments - 151,629 924,149 38,220
Net cash flows from investing activities (472) 128,321 763,358 32,226
Net decrease in cash and cash equivalents 400 1,012,467 (100) 1,690,765 Cash and cash equivalents, July 1, 2006 3,600 4,488 100 3,650 Cash and cash equivalents, June 30, 2007 4,000$ 1,016,955$ -$ 1,694,415$
Reconciliation of operating income (loss) to net cashflows from operating activitiesOperating income (loss) (7,709,748)$ (647,878)$ 851,670$ (3,138)$
Adjustments to reconcile operating income (loss) to net cashflows from operating activities:
Depreciation expense 1,784,209 1,025,880 632,686 324,897 Change in assets and liabilities:(Increase) decrease in prepaid items - - - 9,859 Increase (decrease) in vouchers payable (339) 45,063 284,055 58,066 Decrease in accrued expenses 53,233 22,703 2,179 2,772 Increase in compensated absences 7,110 17,132 11,112 2,583 (Increase) decrease in accounts receivable 5,919 1,116 30,340 (17,621) (Increase) decrease in inventories (77,723) 19 (2,302) (55,437) (Increase) decrease in due from other governments 176,895 (47,263) (1) (2,645) Increase (decrease) due to other governments - - - 9,973 Increase (decrease) in revenues collected in advance - 12,076 - - Increase (decrease) in security deposit - - - - Increase (decrease) in deferred revenue - - - -
Net cash flows from operating activities (5,760,444)$ 428,848$ 1,809,739$ 329,309$
Schedule of noncash capital and related financing activities:Acquisition of capital assets through contracts payable (2,083)$ -$ -$ -$
Business-type Activities -
City of Cedar Rapids, IowaCombining Statement of Cash Flows
Nonmajor Enterprise FundsFor the Year Ended June 30, 2007
77
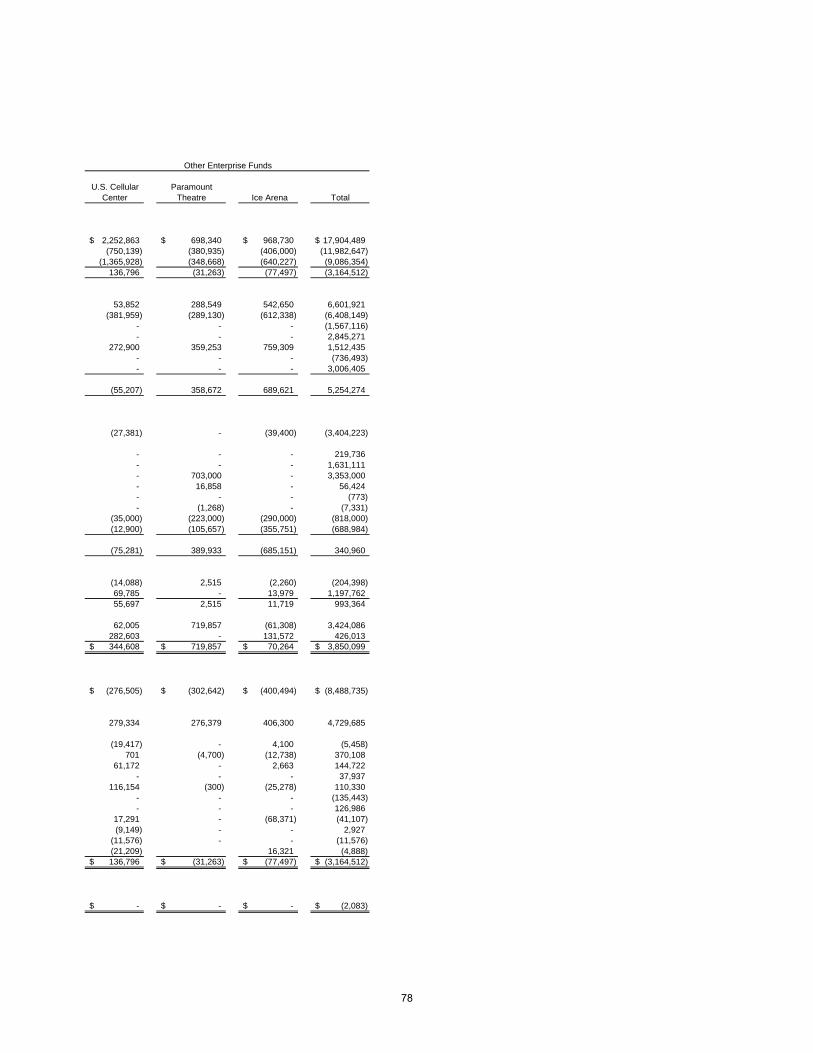
U.S. Cellular Paramount Center Theatre Ice Arena Total
2,252,863$ 698,340$ 968,730$ 17,904,489$ (750,139) (380,935) (406,000) (11,982,647)
(1,365,928) (348,668) (640,227) (9,086,354) 136,796 (31,263) (77,497) (3,164,512)
53,852 288,549 542,650 6,601,921 (381,959) (289,130) (612,338) (6,408,149)
- - - (1,567,116) - - - 2,845,271
272,900 359,253 759,309 1,512,435 - - - (736,493) - - - 3,006,405
(55,207) 358,672 689,621 5,254,274
(27,381) - (39,400) (3,404,223)
- - - 219,736 - - - 1,631,111 - 703,000 - 3,353,000 - 16,858 - 56,424 - - - (773) - (1,268) - (7,331)
(35,000) (223,000) (290,000) (818,000) (12,900) (105,657) (355,751) (688,984)
(75,281) 389,933 (685,151) 340,960
(14,088) 2,515 (2,260) (204,398) 69,785 - 13,979 1,197,762 55,697 2,515 11,719 993,364
62,005 719,857 (61,308) 3,424,086 282,603 - 131,572 426,013 344,608$ 719,857$ 70,264$ 3,850,099$
(276,505)$ (302,642)$ (400,494)$ (8,488,735)$
279,334 276,379 406,300 4,729,685
(19,417) - 4,100 (5,458) 701 (4,700) (12,738) 370,108
61,172 - 2,663 144,722 - - - 37,937
116,154 (300) (25,278) 110,330 - - - (135,443) - - - 126,986
17,291 - (68,371) (41,107) (9,149) - - 2,927
(11,576) - - (11,576) (21,209) 16,321 (4,888) 136,796$ (31,263)$ (77,497)$ (3,164,512)$
-$ -$ -$ (2,083)$
Other Enterprise Funds
78
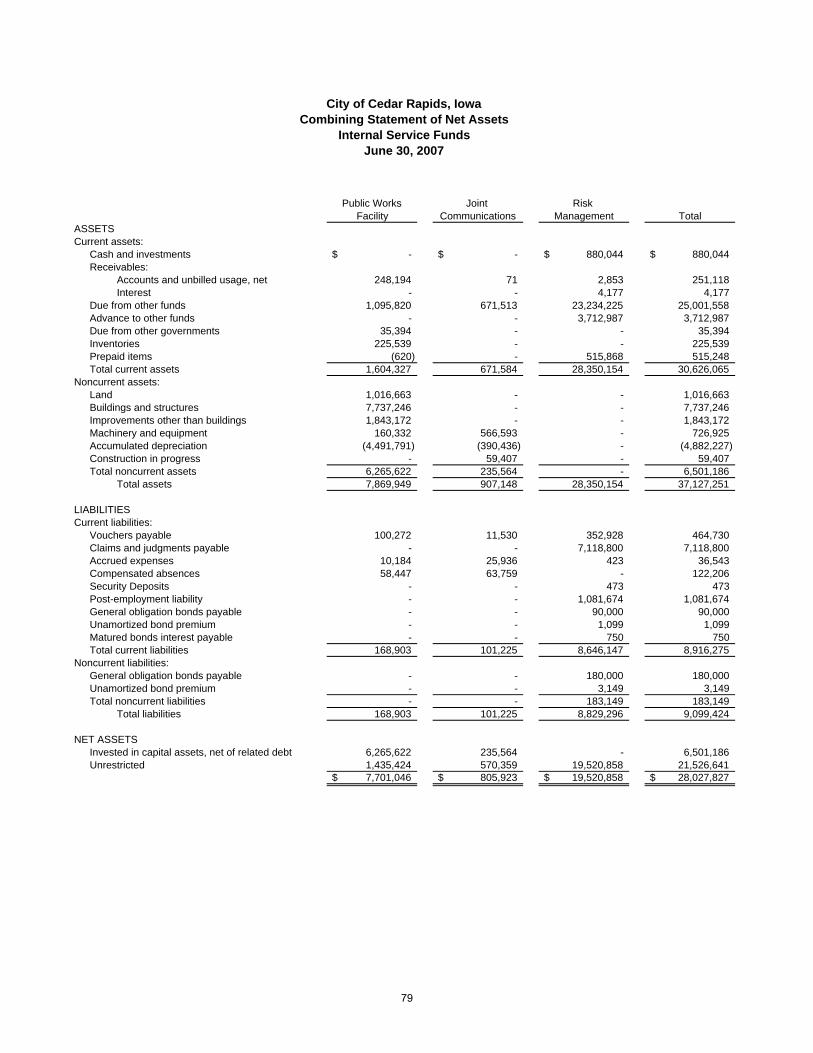
Public Works Joint Risk Facility Communications Management Total
ASSETSCurrent assets:
Cash and investments -$ -$ 880,044$ 880,044$ Receivables:
Accounts and unbilled usage, net 248,194 71 2,853 251,118 Interest - - 4,177 4,177
Due from other funds 1,095,820 671,513 23,234,225 25,001,558 Advance to other funds - - 3,712,987 3,712,987 Due from other governments 35,394 - - 35,394 Inventories 225,539 - - 225,539 Prepaid items (620) - 515,868 515,248 Total current assets 1,604,327 671,584 28,350,154 30,626,065
Noncurrent assets:Land 1,016,663 - - 1,016,663 Buildings and structures 7,737,246 - - 7,737,246 Improvements other than buildings 1,843,172 - - 1,843,172 Machinery and equipment 160,332 566,593 - 726,925 Accumulated depreciation (4,491,791) (390,436) - (4,882,227) Construction in progress - 59,407 - 59,407 Total noncurrent assets 6,265,622 235,564 - 6,501,186
Total assets 7,869,949 907,148 28,350,154 37,127,251
LIABILITIESCurrent liabilities:
Vouchers payable 100,272 11,530 352,928 464,730 Claims and judgments payable - - 7,118,800 7,118,800 Accrued expenses 10,184 25,936 423 36,543 Compensated absences 58,447 63,759 - 122,206 Security Deposits - - 473 473 Post-employment liability - - 1,081,674 1,081,674 General obligation bonds payable - - 90,000 90,000 Unamortized bond premium - - 1,099 1,099 Matured bonds interest payable - - 750 750 Total current liabilities 168,903 101,225 8,646,147 8,916,275
Noncurrent liabilities:General obligation bonds payable - - 180,000 180,000 Unamortized bond premium - - 3,149 3,149 Total noncurrent liabilities - - 183,149 183,149
Total liabilities 168,903 101,225 8,829,296 9,099,424
NET ASSETSInvested in capital assets, net of related debt 6,265,622 235,564 - 6,501,186 Unrestricted 1,435,424 570,359 19,520,858 21,526,641
7,701,046$ 805,923$ 19,520,858$ 28,027,827$
City of Cedar Rapids, IowaCombining Statement of Net Assets
Internal Service FundsJune 30, 2007
79
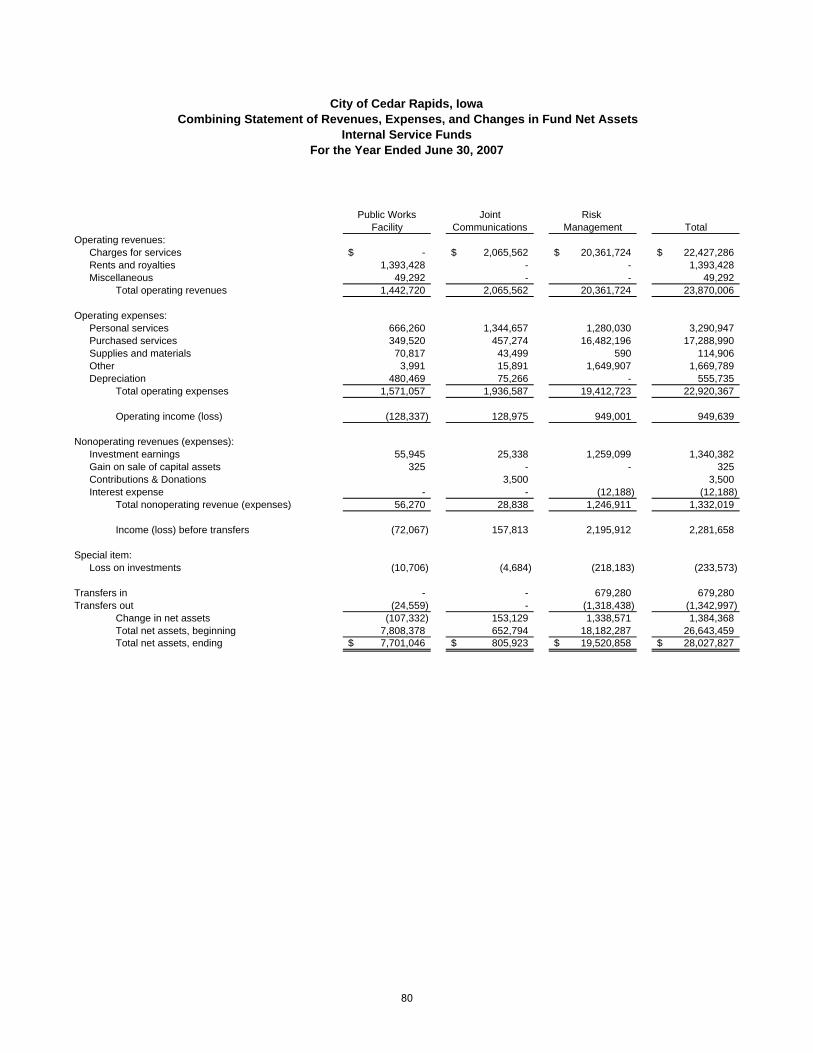
Public Works Joint Risk Facility Communications Management Total
Operating revenues: Charges for services -$ 2,065,562$ 20,361,724$ 22,427,286$
Rents and royalties 1,393,428 - - 1,393,428 Miscellaneous 49,292 - - 49,292
Total operating revenues 1,442,720 2,065,562 20,361,724 23,870,006
Operating expenses:Personal services 666,260 1,344,657 1,280,030 3,290,947 Purchased services 349,520 457,274 16,482,196 17,288,990 Supplies and materials 70,817 43,499 590 114,906 Other 3,991 15,891 1,649,907 1,669,789 Depreciation 480,469 75,266 - 555,735
Total operating expenses 1,571,057 1,936,587 19,412,723 22,920,367
Operating income (loss) (128,337) 128,975 949,001 949,639
Nonoperating revenues (expenses):Investment earnings 55,945 25,338 1,259,099 1,340,382 Gain on sale of capital assets 325 - - 325 Contributions & Donations 3,500 3,500 Interest expense - - (12,188) (12,188)
Total nonoperating revenue (expenses) 56,270 28,838 1,246,911 1,332,019
Income (loss) before transfers (72,067) 157,813 2,195,912 2,281,658
Special item:Loss on investments (10,706) (4,684) (218,183) (233,573)
Transfers in - - 679,280 679,280 Transfers out (24,559) - (1,318,438) (1,342,997)
Change in net assets (107,332) 153,129 1,338,571 1,384,368 Total net assets, beginning 7,808,378 652,794 18,182,287 26,643,459 Total net assets, ending 7,701,046$ 805,923$ 19,520,858$ 28,027,827$
City of Cedar Rapids, IowaCombining Statement of Revenues, Expenses, and Changes in Fund Net Assets
Internal Service FundsFor the Year Ended June 30, 2007
80
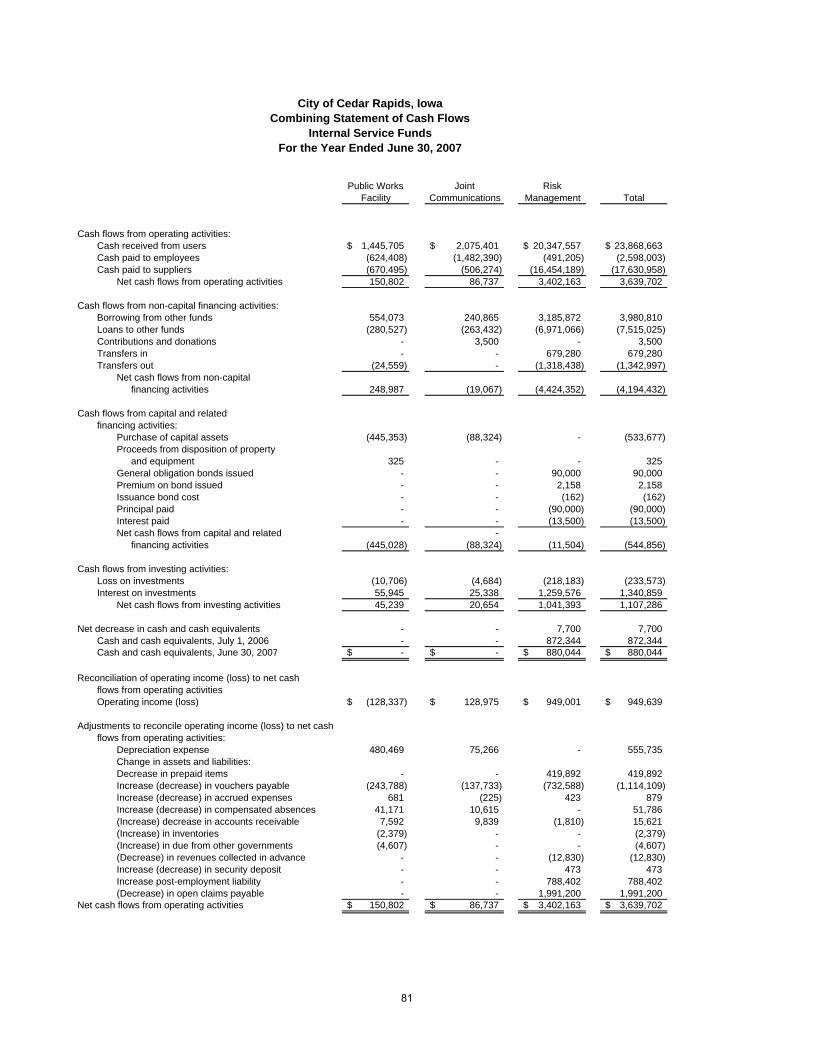
Public Works Joint RiskFacility Communications Management Total
Cash flows from operating activities:Cash received from users 1,445,705$ 2,075,401$ 20,347,557$ 23,868,663$ Cash paid to employees (624,408) (1,482,390) (491,205) (2,598,003) Cash paid to suppliers (670,495) (506,274) (16,454,189) (17,630,958)
Net cash flows from operating activities 150,802 86,737 3,402,163 3,639,702
Cash flows from non-capital financing activities:Borrowing from other funds 554,073 240,865 3,185,872 3,980,810 Loans to other funds (280,527) (263,432) (6,971,066) (7,515,025) Contributions and donations - 3,500 - 3,500 Transfers in - - 679,280 679,280 Transfers out (24,559) - (1,318,438) (1,342,997)
Net cash flows from non-capitalfinancing activities 248,987 (19,067) (4,424,352) (4,194,432)
Cash flows from capital and relatedfinancing activities:
Purchase of capital assets (445,353) (88,324) - (533,677) Proceeds from disposition of property
and equipment 325 - - 325 General obligation bonds issued - - 90,000 90,000 Premium on bond issued - - 2,158 2,158 Issuance bond cost - - (162) (162) Principal paid - - (90,000) (90,000) Interest paid - - (13,500) (13,500) Net cash flows from capital and related -
financing activities (445,028) (88,324) (11,504) (544,856)
Cash flows from investing activities:Loss on investments (10,706) (4,684) (218,183) (233,573) Interest on investments 55,945 25,338 1,259,576 1,340,859
Net cash flows from investing activities 45,239 20,654 1,041,393 1,107,286
Net decrease in cash and cash equivalents - - 7,700 7,700 Cash and cash equivalents, July 1, 2006 - - 872,344 872,344 Cash and cash equivalents, June 30, 2007 -$ -$ 880,044$ 880,044$
Reconciliation of operating income (loss) to net cashflows from operating activitiesOperating income (loss) (128,337)$ 128,975$ 949,001$ 949,639$
Adjustments to reconcile operating income (loss) to net cashflows from operating activities:
Depreciation expense 480,469 75,266 - 555,735 Change in assets and liabilities:Decrease in prepaid items - - 419,892 419,892 Increase (decrease) in vouchers payable (243,788) (137,733) (732,588) (1,114,109) Increase (decrease) in accrued expenses 681 (225) 423 879 Increase (decrease) in compensated absences 41,171 10,615 - 51,786 (Increase) decrease in accounts receivable 7,592 9,839 (1,810) 15,621 (Increase) in inventories (2,379) - - (2,379) (Increase) in due from other governments (4,607) - - (4,607) (Decrease) in revenues collected in advance - - (12,830) (12,830) Increase (decrease) in security deposit - - 473 473 Increase post-employment liability - - 788,402 788,402 (Decrease) in open claims payable - - 1,991,200 1,991,200
Net cash flows from operating activities 150,802$ 86,737$ 3,402,163$ 3,639,702$
City of Cedar Rapids, IowaCombining Statement of Cash Flows
Internal Service FundsFor the Year Ended June 30, 2007
81
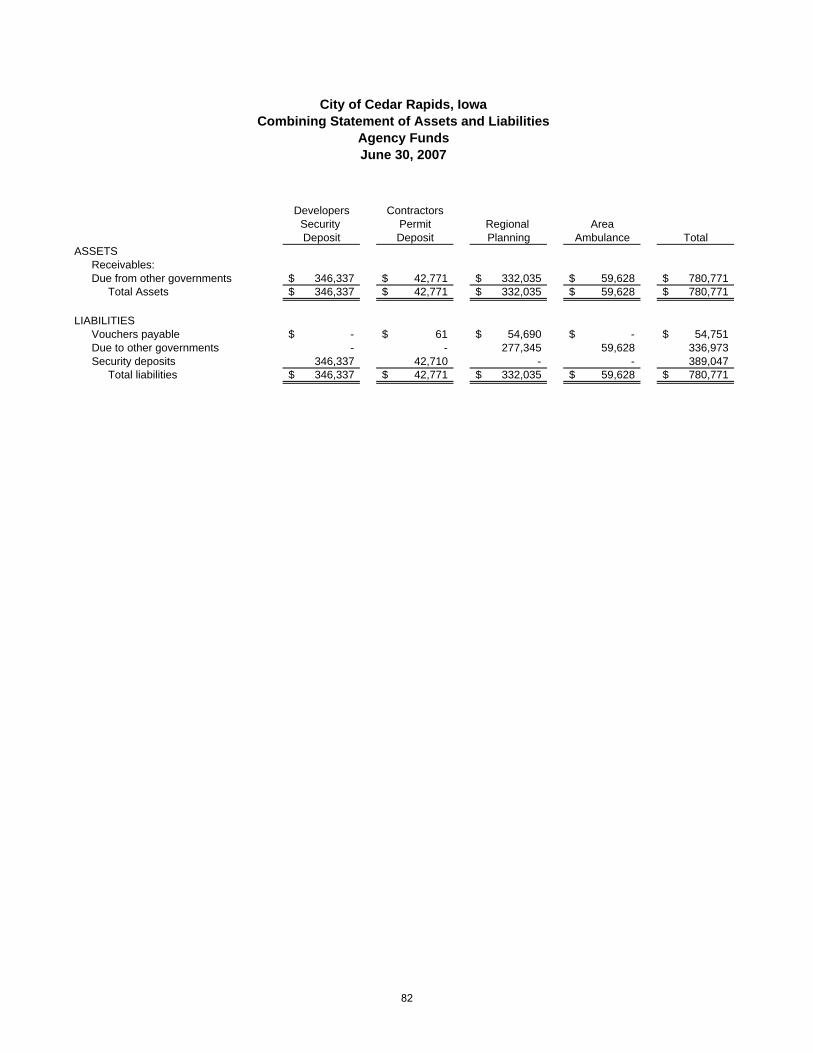
Developers ContractorsSecurity Permit Regional Area Deposit Deposit Planning Ambulance Total
ASSETSReceivables:Due from other governments 346,337$ 42,771$ 332,035$ 59,628$ 780,771$
Total Assets 346,337$ 42,771$ 332,035$ 59,628$ 780,771$
LIABILITIES Vouchers payable -$ 61$ 54,690$ -$ 54,751$ Due to other governments - - 277,345 59,628 336,973 Security deposits 346,337 42,710 - - 389,047
Total liabilities 346,337$ 42,771$ 332,035$ 59,628$ 780,771$
City of Cedar Rapids, IowaCombining Statement of Assets and Liabilities
Agency FundsJune 30, 2007
82

Balance BalanceJune 30, 2006 Additions Deletions June 30, 2007
Developers Security DepositAssets:
Due from other governments 305,253$ 47,503$ 6,419$ 346,337$
Liabilities:Security deposits 305,253$ 47,503$ 6,419$ 346,337$
Contractors Permit DepositAssets:
Due from other governments 48,471$ 42,771$ 48,471$ 42,771$
Liabilities:Vouchers payable 61$ 406$ 406$ 61$ Security deposits 48,410 192,595 198,295 42,710 Total liabilities 48,471$ 193,001$ 198,701$ 42,771$
Regional PlanningAssets:
Due from other governments 187,642$ 334,003$ 189,610$ 332,035$ Total Assets 187,642$ 334,003$ 189,610$ 332,035$
Liabilities:Vouchers payable 196$ 177,781$ 123,287$ 54,690$ Due to other governments 187,446 89,899 - 277,345 Total liabilities 187,642$ 267,680$ 123,287$ 332,035$
Area AmbulanceAssets:
Due from other governments 104,817$ 60,226$ 105,415$ 59,628$
Liabilities:Due to other governments 104,817 - 45,189 59,628 Total liabilities 104,817$ -$ 45,189$ 59,628$
TotalAssets:
Due from other governments 646,183 484,503 349,915 780,771 646,183$ 484,503$ 349,915$ 780,771$
Liabilities:Vouchers payable 257$ 178,187$ 123,693$ 54,751$ Due to other governments 292,263 89,899 45,189 336,973 Security deposits 353,663 240,098 204,714 389,047 Total liabilities 646,183$ 508,184$ 373,596$ 780,771$
CITY OF CEDAR RAPIDS, IOWACOMBINING STATEMENT OF CHANGES IN ASSETS AND LIABILITIES
AGENCY FUNDSFISCAL YEAR ENDED JUNE 30, 2007
83
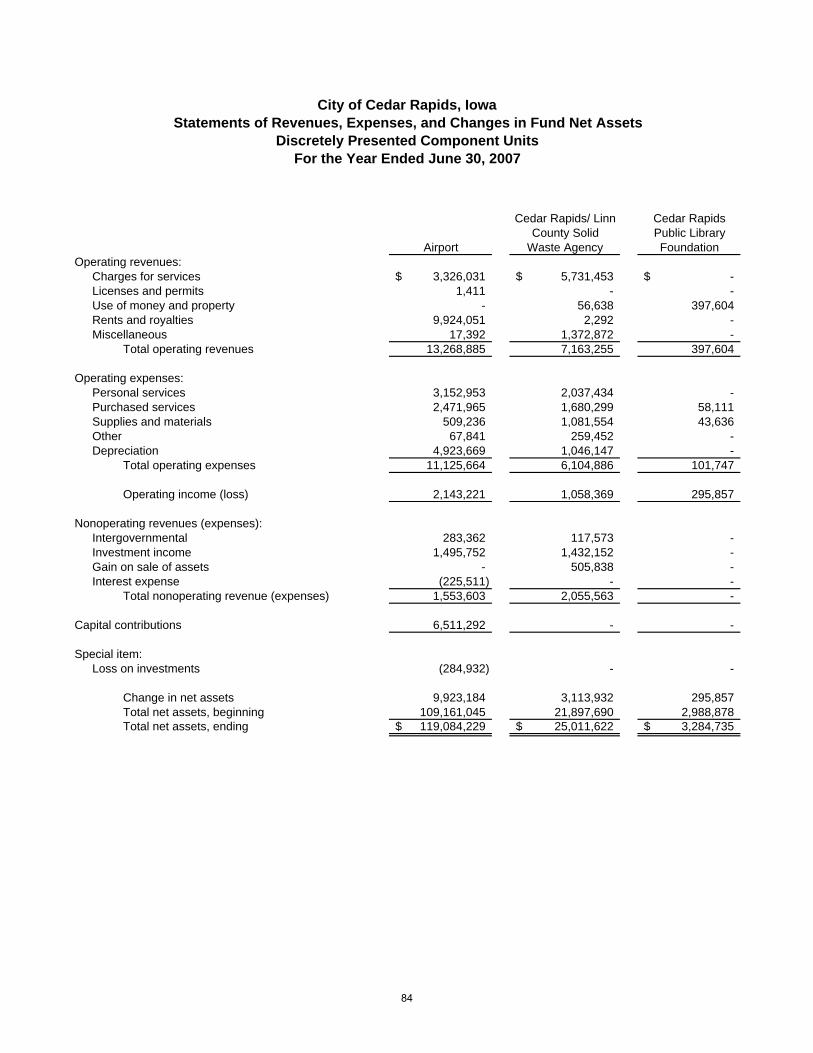
City of Cedar Rapids, IowaStatements of Revenues, Expenses, and Changes in Fund Net Assets
Discretely Presented Component UnitsFor the Year Ended June 30, 2007
Cedar Rapids/ Linn Cedar Rapids County Solid Public Library
Airport Waste Agency FoundationOperating revenues: Charges for services 3,326,031$ 5,731,453$ -$
Licenses and permits 1,411 - - Use of money and property - 56,638 397,604 Rents and royalties 9,924,051 2,292 - Miscellaneous 17,392 1,372,872 -
Total operating revenues 13,268,885 7,163,255 397,604
Operating expenses:Personal services 3,152,953 2,037,434 - Purchased services 2,471,965 1,680,299 58,111 Supplies and materials 509,236 1,081,554 43,636 Other 67,841 259,452 - Depreciation 4,923,669 1,046,147 -
Total operating expenses 11,125,664 6,104,886 101,747
Operating income (loss) 2,143,221 1,058,369 295,857
Nonoperating revenues (expenses):Intergovernmental 283,362 117,573 - Investment income 1,495,752 1,432,152 - Gain on sale of assets - 505,838 - Interest expense (225,511) - -
Total nonoperating revenue (expenses) 1,553,603 2,055,563 -
Capital contributions 6,511,292 - -
Special item:Loss on investments (284,932) - -
Change in net assets 9,923,184 3,113,932 295,857 Total net assets, beginning 109,161,045 21,897,690 2,988,878 Total net assets, ending 119,084,229$ 25,011,622$ 3,284,735$
84
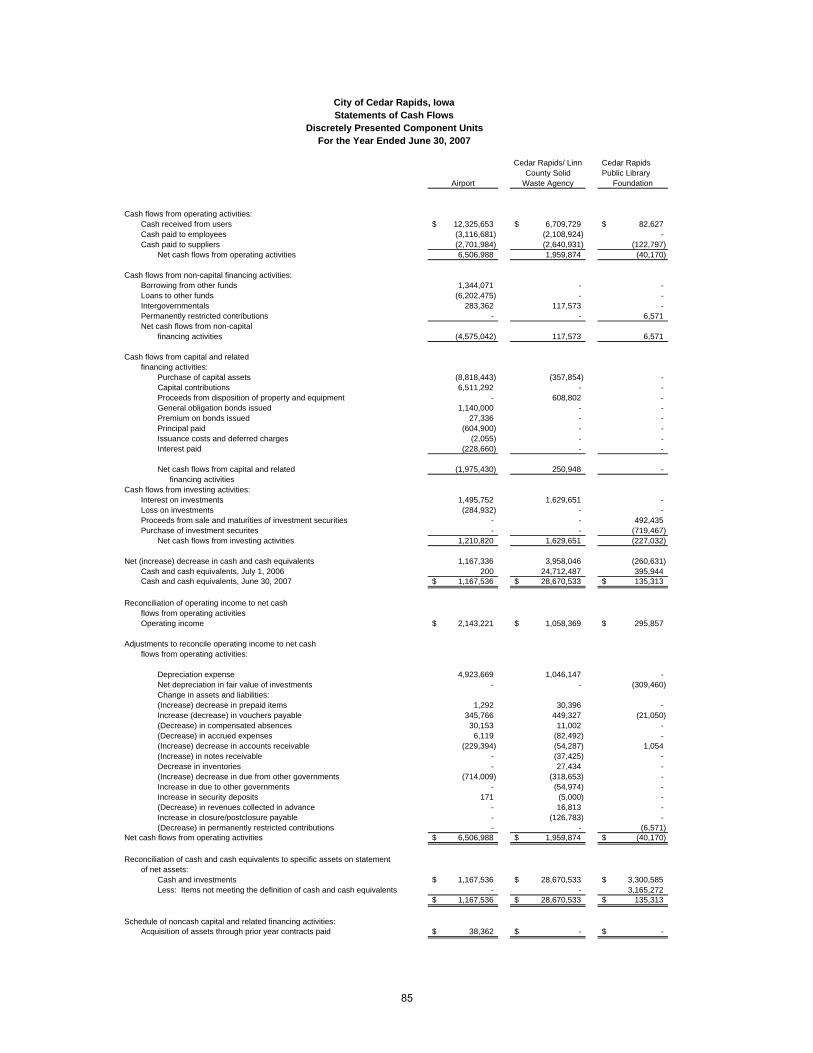
Cedar Rapids/ Linn Cedar Rapids County Solid Public Library
Airport Waste Agency Foundation
Cash flows from operating activities:Cash received from users 12,325,653$ 6,709,729$ 82,627$ Cash paid to employees (3,116,681) (2,108,924) - Cash paid to suppliers (2,701,984) (2,640,931) (122,797)
Net cash flows from operating activities 6,506,988 1,959,874 (40,170)
Cash flows from non-capital financing activities:Borrowing from other funds 1,344,071 - - Loans to other funds (6,202,475) - - Intergovernmentals 283,362 117,573 - Permanently restricted contributions - - 6,571 Net cash flows from non-capital
financing activities (4,575,042) 117,573 6,571
Cash flows from capital and relatedfinancing activities:
Purchase of capital assets (8,818,443) (357,854) - Capital contributions 6,511,292 - - Proceeds from disposition of property and equipment - 608,802 - General obligation bonds issued 1,140,000 - - Premium on bonds issued 27,336 - - Principal paid (604,900) - - Issuance costs and deferred charges (2,055) - - Interest paid (228,660) - -
Net cash flows from capital and related (1,975,430) 250,948 - financing activities
Cash flows from investing activities:Interest on investments 1,495,752 1,629,651 - Loss on investments (284,932) - - Proceeds from sale and maturities of investment securities - - 492,435 Purchase of investment securites - - (719,467)
Net cash flows from investing activities 1,210,820 1,629,651 (227,032)
Net (increase) decrease in cash and cash equivalents 1,167,336 3,958,046 (260,631) Cash and cash equivalents, July 1, 2006 200 24,712,487 395,944 Cash and cash equivalents, June 30, 2007 1,167,536$ 28,670,533$ 135,313$
Reconciliation of operating income to net cashflows from operating activitiesOperating income 2,143,221$ 1,058,369$ 295,857$
Adjustments to reconcile operating income to net cashflows from operating activities:
Depreciation expense 4,923,669 1,046,147 - Net depreciation in fair value of investments - - (309,460) Change in assets and liabilities:(Increase) decrease in prepaid items 1,292 30,396 - Increase (decrease) in vouchers payable 345,766 449,327 (21,050) (Decrease) in compensated absences 30,153 11,002 - (Decrease) in accrued expenses 6,119 (82,492) - (Increase) decrease in accounts receivable (229,394) (54,287) 1,054 (Increase) in notes receivable - (37,425) - Decrease in inventories - 27,434 - (Increase) decrease in due from other governments (714,009) (318,653) - Increase in due to other governments - (54,974) - Increase in security deposits 171 (5,000) - (Decrease) in revenues collected in advance - 16,813 - Increase in closure/postclosure payable - (126,783) - (Decrease) in permanently restricted contributions - - (6,571)
Net cash flows from operating activities 6,506,988$ 1,959,874$ (40,170)$
Reconciliation of cash and cash equivalents to specific assets on statement of net assets:
Cash and investments 1,167,536$ 28,670,533$ 3,300,585$ Less: Items not meeting the definition of cash and cash equivalents - - 3,165,272
1,167,536$ 28,670,533$ 135,313$
Schedule of noncash capital and related financing activities:Acquisition of assets through prior year contracts paid 38,362$ -$ -$
City of Cedar Rapids, IowaStatements of Cash Flows
Discretely Presented Component UnitsFor the Year Ended June 30, 2007
85
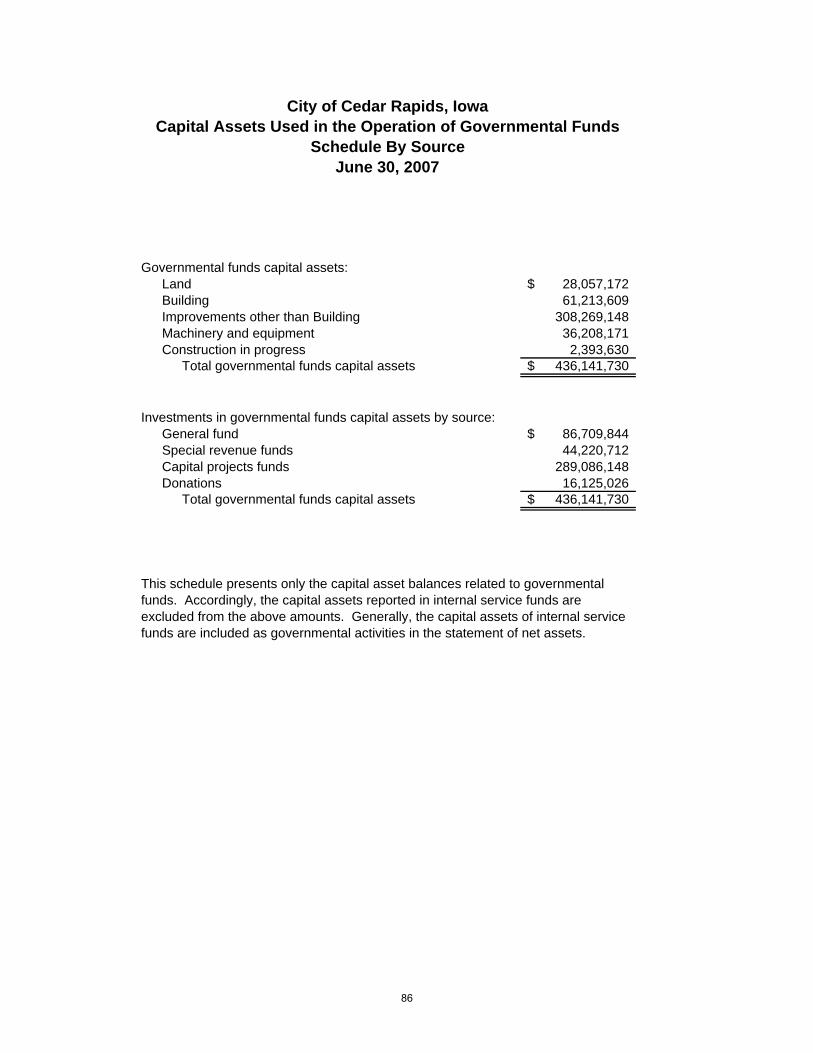
Governmental funds capital assets:Land 28,057,172$ Building 61,213,609 Improvements other than Building 308,269,148 Machinery and equipment 36,208,171 Construction in progress 2,393,630
Total governmental funds capital assets 436,141,730$
Investments in governmental funds capital assets by source:General fund 86,709,844$ Special revenue funds 44,220,712 Capital projects funds 289,086,148 Donations 16,125,026
Total governmental funds capital assets 436,141,730$
This schedule presents only the capital asset balances related to governmentalfunds. Accordingly, the capital assets reported in internal service funds are excluded from the above amounts. Generally, the capital assets of internal servicefunds are included as governmental activities in the statement of net assets.
City of Cedar Rapids, IowaCapital Assets Used in the Operation of Governmental Funds
Schedule By SourceJune 30, 2007
86
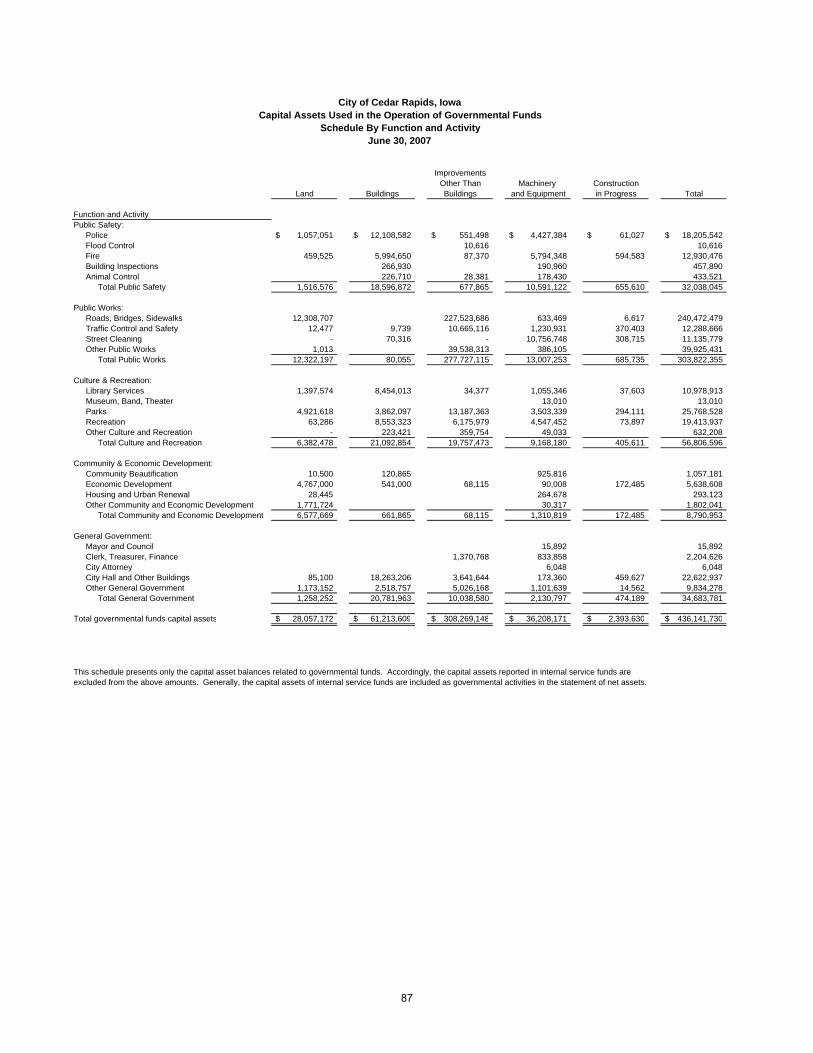
Improvements Other Than Machinery Construction
Land Buildings Buildings and Equipment in Progress Total
Function and ActivityPublic Safety: Police 1,057,051$ 12,108,582$ 551,498$ 4,427,384$ 61,027$ 18,205,542$
Flood Control 10,616 10,616 Fire 459,525 5,994,650 87,370 5,794,348 594,583 12,930,476 Building Inspections 266,930 190,960 457,890 Animal Control 226,710 28,381 178,430 433,521
Total Public Safety 1,516,576 18,596,872 677,865 10,591,122 655,610 32,038,045
Public Works:Roads, Bridges, Sidewalks 12,308,707 227,523,686 633,469 6,617 240,472,479 Traffic Control and Safety 12,477 9,739 10,665,116 1,230,931 370,403 12,288,666 Street Cleaning - 70,316 - 10,756,748 308,715 11,135,779 Other Public Works 1,013 39,538,313 386,105 39,925,431
Total Public Works 12,322,197 80,055 277,727,115 13,007,253 685,735 303,822,355
Culture & Recreation:Library Services 1,397,574 8,454,013 34,377 1,055,346 37,603 10,978,913 Museum, Band, Theater 13,010 13,010 Parks 4,921,618 3,862,097 13,187,363 3,503,339 294,111 25,768,528 Recreation 63,286 8,553,323 6,175,979 4,547,452 73,897 19,413,937 Other Culture and Recreation - 223,421 359,754 49,033 632,208
Total Culture and Recreation 6,382,478 21,092,854 19,757,473 9,168,180 405,611 56,806,596
Community & Economic Development:Community Beautification 10,500 120,865 925,816 1,057,181 Economic Development 4,767,000 541,000 68,115 90,008 172,485 5,638,608 Housing and Urban Renewal 28,445 264,678 293,123 Other Community and Economic Development 1,771,724 30,317 1,802,041
Total Community and Economic Development 6,577,669 661,865 68,115 1,310,819 172,485 8,790,953
General Government:Mayor and Council 15,892 15,892 Clerk, Treasurer, Finance 1,370,768 833,858 2,204,626 City Attorney 6,048 6,048 City Hall and Other Buildings 85,100 18,263,206 3,641,644 173,360 459,627 22,622,937 Other General Government 1,173,152 2,518,757 5,026,168 1,101,639 14,562 9,834,278
Total General Government 1,258,252 20,781,963 10,038,580 2,130,797 474,189 34,683,781
Total governmental funds capital assets 28,057,172$ 61,213,609$ 308,269,148$ 36,208,171$ 2,393,630$ 436,141,730$
This schedule presents only the capital asset balances related to governmental funds. Accordingly, the capital assets reported in internal service funds areexcluded from the above amounts. Generally, the capital assets of internal service funds are included as governmental activities in the statement of net assets.
City of Cedar Rapids, IowaCapital Assets Used in the Operation of Governmental Funds
Schedule By Function and ActivityJune 30, 2007
87
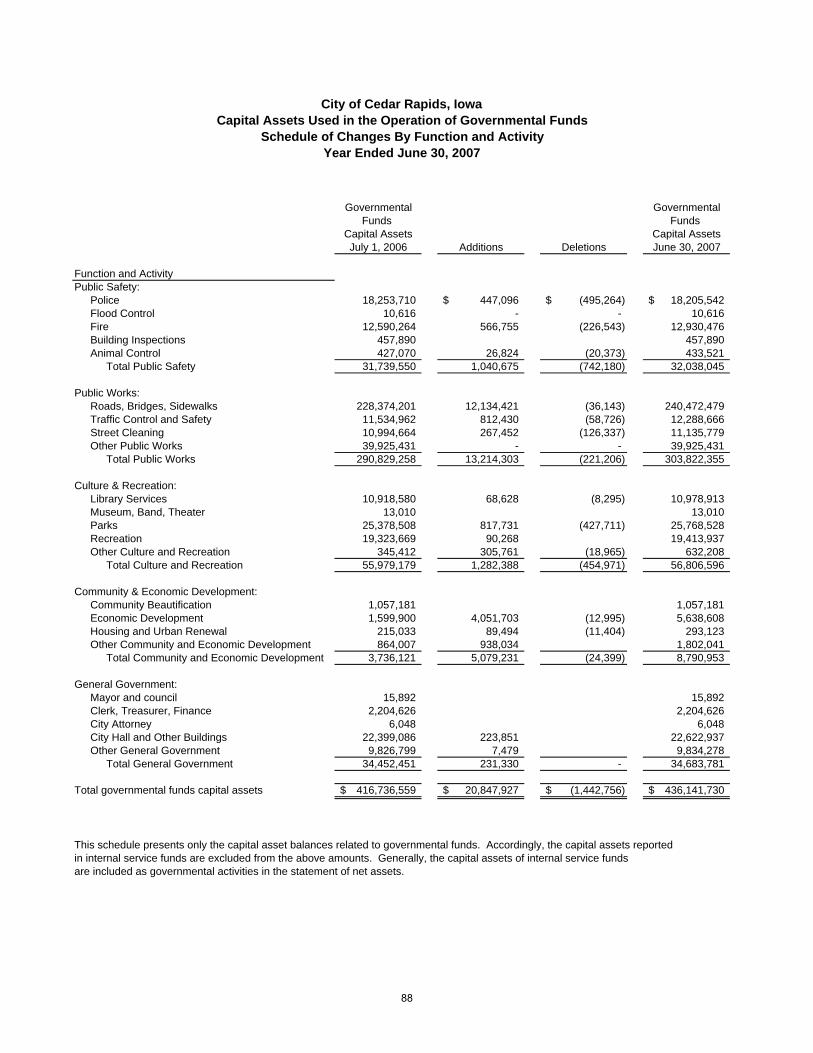
Governmental Governmental
Funds Funds Capital Assets Capital AssetsJuly 1, 2006 Additions Deletions June 30, 2007
Function and ActivityPublic Safety: Police 18,253,710 447,096$ (495,264)$ 18,205,542$
Flood Control 10,616 - - 10,616 Fire 12,590,264 566,755 (226,543) 12,930,476 Building Inspections 457,890 457,890 Animal Control 427,070 26,824 (20,373) 433,521
Total Public Safety 31,739,550 1,040,675 (742,180) 32,038,045
Public Works:Roads, Bridges, Sidewalks 228,374,201 12,134,421 (36,143) 240,472,479 Traffic Control and Safety 11,534,962 812,430 (58,726) 12,288,666 Street Cleaning 10,994,664 267,452 (126,337) 11,135,779 Other Public Works 39,925,431 - - 39,925,431
Total Public Works 290,829,258 13,214,303 (221,206) 303,822,355
Culture & Recreation:Library Services 10,918,580 68,628 (8,295) 10,978,913 Museum, Band, Theater 13,010 13,010 Parks 25,378,508 817,731 (427,711) 25,768,528 Recreation 19,323,669 90,268 19,413,937 Other Culture and Recreation 345,412 305,761 (18,965) 632,208
Total Culture and Recreation 55,979,179 1,282,388 (454,971) 56,806,596
Community & Economic Development:Community Beautification 1,057,181 1,057,181 Economic Development 1,599,900 4,051,703 (12,995) 5,638,608 Housing and Urban Renewal 215,033 89,494 (11,404) 293,123 Other Community and Economic Development 864,007 938,034 1,802,041
Total Community and Economic Development 3,736,121 5,079,231 (24,399) 8,790,953
General Government:Mayor and council 15,892 15,892 Clerk, Treasurer, Finance 2,204,626 2,204,626 City Attorney 6,048 6,048 City Hall and Other Buildings 22,399,086 223,851 22,622,937 Other General Government 9,826,799 7,479 9,834,278
Total General Government 34,452,451 231,330 - 34,683,781
Total governmental funds capital assets 416,736,559$ 20,847,927$ (1,442,756)$ 436,141,730$
This schedule presents only the capital asset balances related to governmental funds. Accordingly, the capital assets reportedin internal service funds are excluded from the above amounts. Generally, the capital assets of internal service fundsare included as governmental activities in the statement of net assets.
City of Cedar Rapids, IowaCapital Assets Used in the Operation of Governmental Funds
Schedule of Changes By Function and ActivityYear Ended June 30, 2007
88

89
STATISTICAL SECTION
The statistical section of the City of Cedar Rapids’ comprehensive annual financial report presents detailed information as a context for understanding what the information presented in the financial statements, note disclosures and required supplementary information say about the City’s overall financial health. Contents Page Financial Trends 92 These schedules contain trend information to help the reader understand how the City’s financial performance and well being have changed over time. Revenue Capacity 98 These schedules contain information to help the reader assess the City’s most significant local revenue sources, the property tax (or sales tax). Debt Capacity 107 These schedules present information to help the reader assess the affordability of the City’s current level of outstanding debt and the City’s ability to issue additional debt in the future. Demographic and Economic Information 114 These schedules offer demographic and economic indicators to help the reader understand the environment within which the City’s financial activities take place. Operating Information 117 These schedules contain service and infrastructure data to help the reader under- stand how the information in the City’s financial report relates to the services the City provides and the activities it performs. Sources: Unless otherwise noted, the information in these schedules is derived from the comprehensive annual report for the relevant year. The City implemented GASB 34 in fiscal year 2003; schedules presenting government-wide information include information beginning that year.
90

91
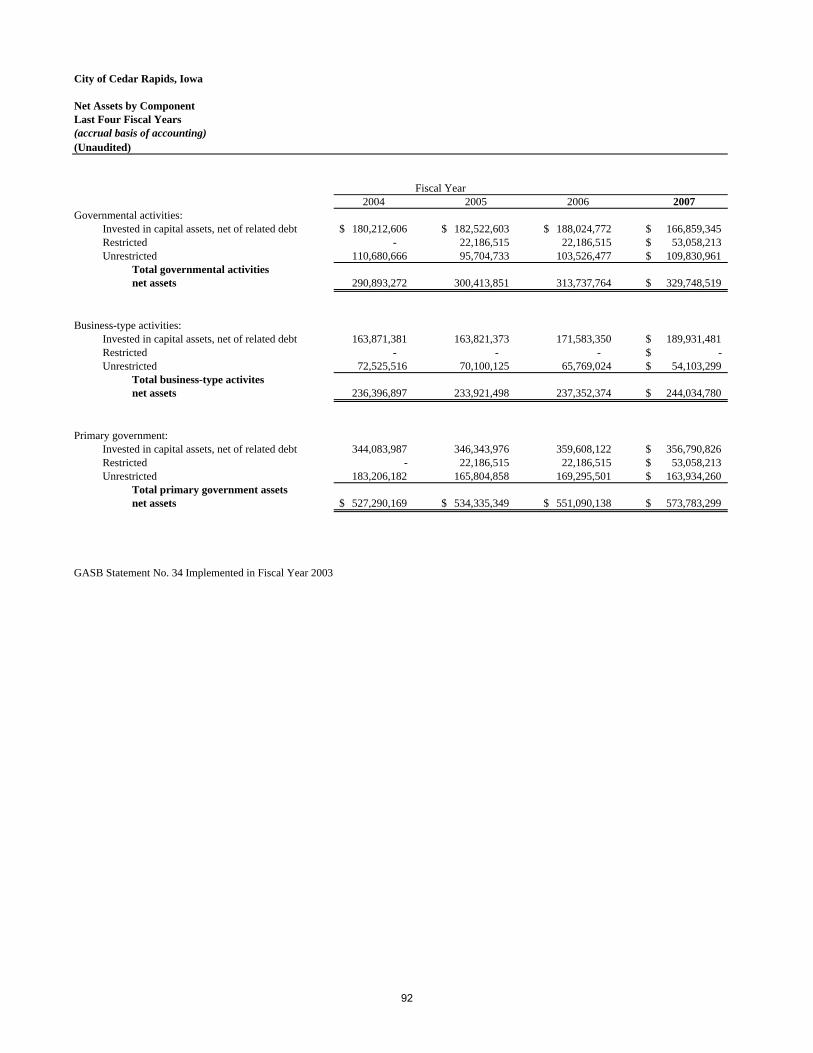
City of Cedar Rapids, Iowa
Net Assets by ComponentLast Four Fiscal Years(accrual basis of accounting)(Unaudited)
Fiscal Year2004 2005 2006 2007
Governmental activities:Invested in capital assets, net of related debt 180,212,606$ 182,522,603$ 188,024,772$ 166,859,345$ Restricted - 22,186,515 22,186,515 53,058,213$ Unrestricted 110,680,666 95,704,733 103,526,477 109,830,961$
Total governmental activities net assets 290,893,272 300,413,851 313,737,764 329,748,519$
Business-type activities:Invested in capital assets, net of related debt 163,871,381 163,821,373 171,583,350 189,931,481$ Restricted - - - -$ Unrestricted 72,525,516 70,100,125 65,769,024 54,103,299$
Total business-type activitesnet assets 236,396,897 233,921,498 237,352,374 244,034,780$
Primary government:Invested in capital assets, net of related debt 344,083,987 346,343,976 359,608,122 356,790,826$ Restricted - 22,186,515 22,186,515 53,058,213$ Unrestricted 183,206,182 165,804,858 169,295,501 163,934,260$
Total primary government assetsnet assets 527,290,169$ 534,335,349$ 551,090,138$ 573,783,299$
GASB Statement No. 34 Implemented in Fiscal Year 2003
92
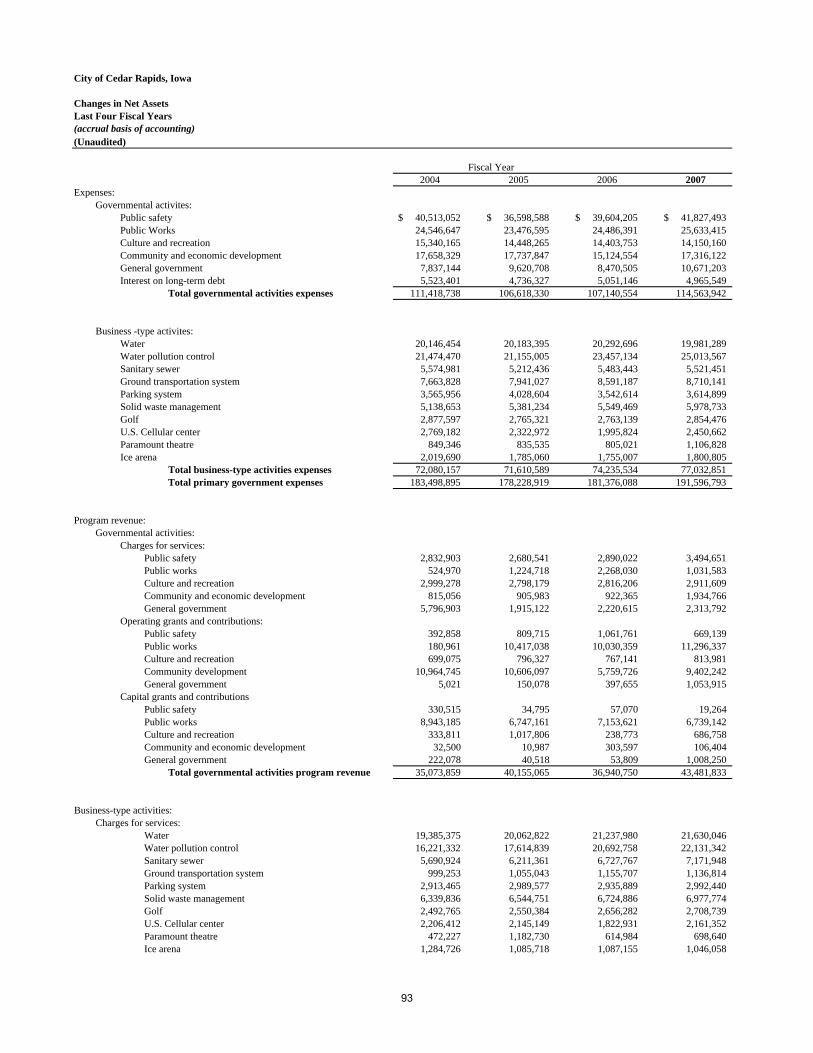
City of Cedar Rapids, Iowa
Changes in Net AssetsLast Four Fiscal Years(accrual basis of accounting)(Unaudited)
Fiscal Year2004 2005 2006 2007
Expenses:Governmental activites:
Public safety 40,513,052$ 36,598,588$ 39,604,205$ 41,827,493$ Public Works 24,546,647 23,476,595 24,486,391 25,633,415 Culture and recreation 15,340,165 14,448,265 14,403,753 14,150,160 Community and economic development 17,658,329 17,737,847 15,124,554 17,316,122 General government 7,837,144 9,620,708 8,470,505 10,671,203 Interest on long-term debt 5,523,401 4,736,327 5,051,146 4,965,549
Total governmental activities expenses 111,418,738 106,618,330 107,140,554 114,563,942
Business -type activites:Water 20,146,454 20,183,395 20,292,696 19,981,289 Water pollution control 21,474,470 21,155,005 23,457,134 25,013,567 Sanitary sewer 5,574,981 5,212,436 5,483,443 5,521,451 Ground transportation system 7,663,828 7,941,027 8,591,187 8,710,141 Parking system 3,565,956 4,028,604 3,542,614 3,614,899 Solid waste management 5,138,653 5,381,234 5,549,469 5,978,733 Golf 2,877,597 2,765,321 2,763,139 2,854,476 U.S. Cellular center 2,769,182 2,322,972 1,995,824 2,450,662 Paramount theatre 849,346 835,535 805,021 1,106,828 Ice arena 2,019,690 1,785,060 1,755,007 1,800,805
Total business-type activities expenses 72,080,157 71,610,589 74,235,534 77,032,851 Total primary government expenses 183,498,895 178,228,919 181,376,088 191,596,793
Program revenue:Governmental activities:
Charges for services:Public safety 2,832,903 2,680,541 2,890,022 3,494,651 Public works 524,970 1,224,718 2,268,030 1,031,583 Culture and recreation 2,999,278 2,798,179 2,816,206 2,911,609 Community and economic development 815,056 905,983 922,365 1,934,766 General government 5,796,903 1,915,122 2,220,615 2,313,792
Operating grants and contributions:Public safety 392,858 809,715 1,061,761 669,139 Public works 180,961 10,417,038 10,030,359 11,296,337 Culture and recreation 699,075 796,327 767,141 813,981 Community development 10,964,745 10,606,097 5,759,726 9,402,242 General government 5,021 150,078 397,655 1,053,915
Capital grants and contributionsPublic safety 330,515 34,795 57,070 19,264 Public works 8,943,185 6,747,161 7,153,621 6,739,142 Culture and recreation 333,811 1,017,806 238,773 686,758 Community and economic development 32,500 10,987 303,597 106,404 General government 222,078 40,518 53,809 1,008,250
Total governmental activities program revenue 35,073,859 40,155,065 36,940,750 43,481,833
Business-type activities:Charges for services:
Water 19,385,375 20,062,822 21,237,980 21,630,046 Water pollution control 16,221,332 17,614,839 20,692,758 22,131,342 Sanitary sewer 5,690,924 6,211,361 6,727,767 7,171,948 Ground transportation system 999,253 1,055,043 1,155,707 1,136,814 Parking system 2,913,465 2,989,577 2,935,889 2,992,440 Solid waste management 6,339,836 6,544,751 6,724,886 6,977,774 Golf 2,492,765 2,550,384 2,656,282 2,708,739 U.S. Cellular center 2,206,412 2,145,149 1,822,931 2,161,352 Paramount theatre 472,227 1,182,730 614,984 698,640 Ice arena 1,284,726 1,085,718 1,087,155 1,046,058
93
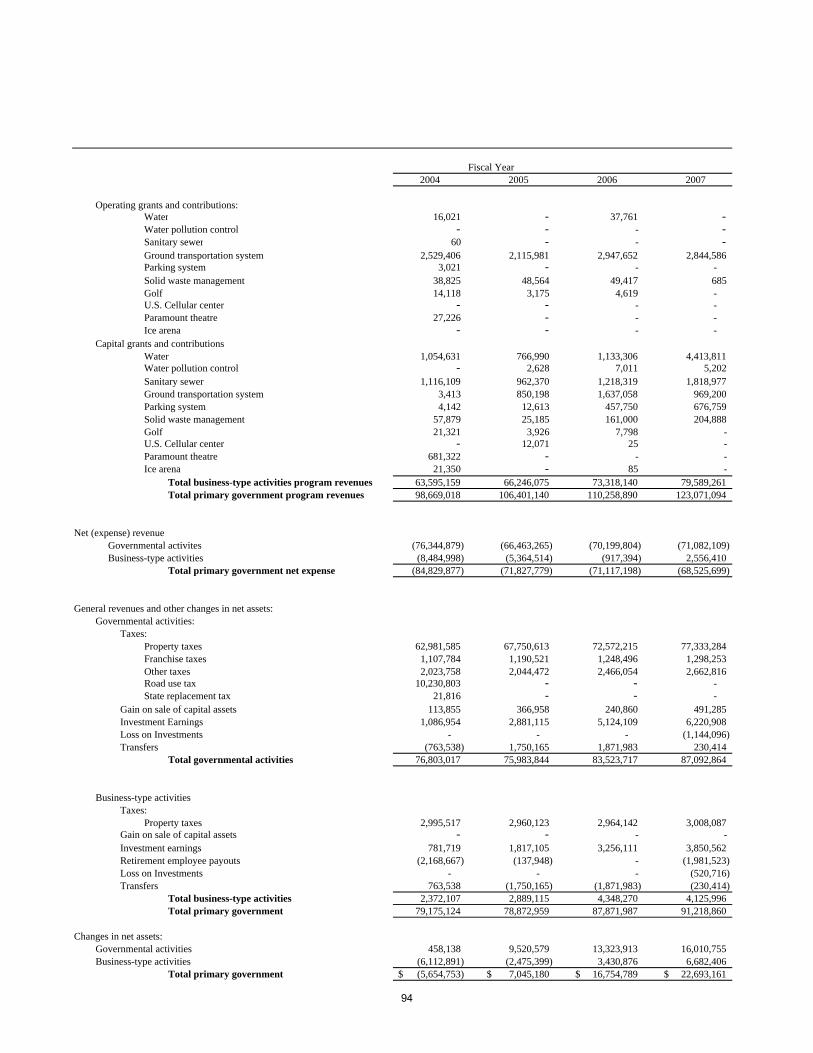
Fiscal Year2004 2005 2006 2007
Operating grants and contributions:Water 16,021 - 37,761 - Water pollution control - - - - Sanitary sewer 60 - - - Ground transportation system 2,529,406 2,115,981 2,947,652 2,844,586 Parking system 3,021 - - - Solid waste management 38,825 48,564 49,417 685 Golf 14,118 3,175 4,619 - U.S. Cellular center - - - - Paramount theatre 27,226 - - - Ice arena - - - -
Capital grants and contributionsWater 1,054,631 766,990 1,133,306 4,413,811 Water pollution control - 2,628 7,011 5,202 Sanitary sewer 1,116,109 962,370 1,218,319 1,818,977 Ground transportation system 3,413 850,198 1,637,058 969,200 Parking system 4,142 12,613 457,750 676,759 Solid waste management 57,879 25,185 161,000 204,888 Golf 21,321 3,926 7,798 - U.S. Cellular center - 12,071 25 - Paramount theatre 681,322 - - - Ice arena 21,350 - 85 -
Total business-type activities program revenues 63,595,159 66,246,075 73,318,140 79,589,261 Total primary government program revenues 98,669,018 106,401,140 110,258,890 123,071,094
Net (expense) revenue Governmental activites (76,344,879) (66,463,265) (70,199,804) (71,082,109) Business-type activities (8,484,998) (5,364,514) (917,394) 2,556,410
Total primary government net expense (84,829,877) (71,827,779) (71,117,198) (68,525,699)
General revenues and other changes in net assets:Governmental activities:
Taxes:Property taxes 62,981,585 67,750,613 72,572,215 77,333,284 Franchise taxes 1,107,784 1,190,521 1,248,496 1,298,253 Other taxes 2,023,758 2,044,472 2,466,054 2,662,816 Road use tax 10,230,803 - - - State replacement tax 21,816 - - -
Gain on sale of capital assets 113,855 366,958 240,860 491,285 Investment Earnings 1,086,954 2,881,115 5,124,109 6,220,908 Loss on Investments - - - (1,144,096) Transfers (763,538) 1,750,165 1,871,983 230,414
Total governmental activities 76,803,017 75,983,844 83,523,717 87,092,864
Business-type activitiesTaxes:
Property taxes 2,995,517 2,960,123 2,964,142 3,008,087 Gain on sale of capital assets - - - - Investment earnings 781,719 1,817,105 3,256,111 3,850,562 Retirement employee payouts (2,168,667) (137,948) - (1,981,523) Loss on Investments - - - (520,716) Transfers 763,538 (1,750,165) (1,871,983) (230,414)
Total business-type activities 2,372,107 2,889,115 4,348,270 4,125,996 Total primary government 79,175,124 78,872,959 87,871,987 91,218,860
Changes in net assets:Governmental activities 458,138 9,520,579 13,323,913 16,010,755 Business-type activities (6,112,891) (2,475,399) 3,430,876 6,682,406
Total primary government (5,654,753)$ 7,045,180$ 16,754,789$ 22,693,161$
94
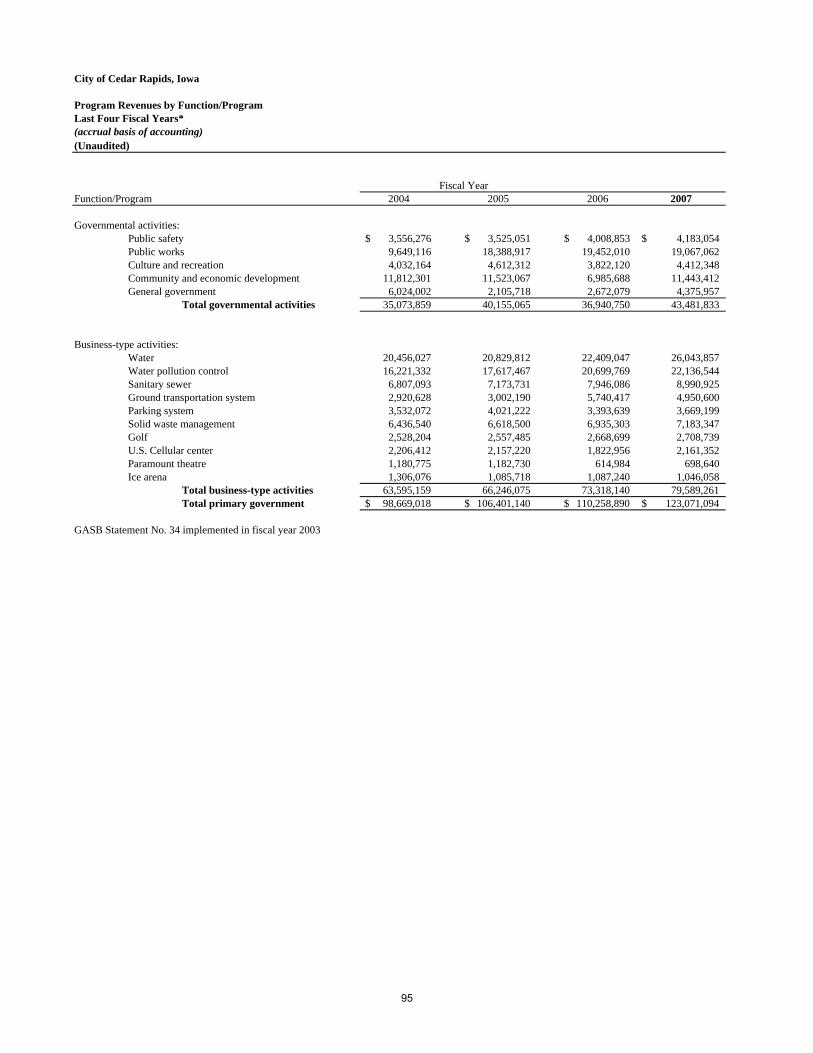
City of Cedar Rapids, Iowa
Program Revenues by Function/ProgramLast Four Fiscal Years*(accrual basis of accounting)(Unaudited)
Fiscal YearFunction/Program 2004 2005 2006 2007
Governmental activities:Public safety 3,556,276$ 3,525,051$ 4,008,853$ 4,183,054$ Public works 9,649,116 18,388,917 19,452,010 19,067,062 Culture and recreation 4,032,164 4,612,312 3,822,120 4,412,348 Community and economic development 11,812,301 11,523,067 6,985,688 11,443,412 General government 6,024,002 2,105,718 2,672,079 4,375,957
Total governmental activities 35,073,859 40,155,065 36,940,750 43,481,833
Business-type activities:Water 20,456,027 20,829,812 22,409,047 26,043,857 Water pollution control 16,221,332 17,617,467 20,699,769 22,136,544 Sanitary sewer 6,807,093 7,173,731 7,946,086 8,990,925 Ground transportation system 2,920,628 3,002,190 5,740,417 4,950,600 Parking system 3,532,072 4,021,222 3,393,639 3,669,199 Solid waste management 6,436,540 6,618,500 6,935,303 7,183,347 Golf 2,528,204 2,557,485 2,668,699 2,708,739 U.S. Cellular center 2,206,412 2,157,220 1,822,956 2,161,352 Paramount theatre 1,180,775 1,182,730 614,984 698,640 Ice arena 1,306,076 1,085,718 1,087,240 1,046,058
Total business-type activities 63,595,159 66,246,075 73,318,140 79,589,261 Total primary government 98,669,018$ 106,401,140$ 110,258,890$ 123,071,094$
GASB Statement No. 34 implemented in fiscal year 2003
95
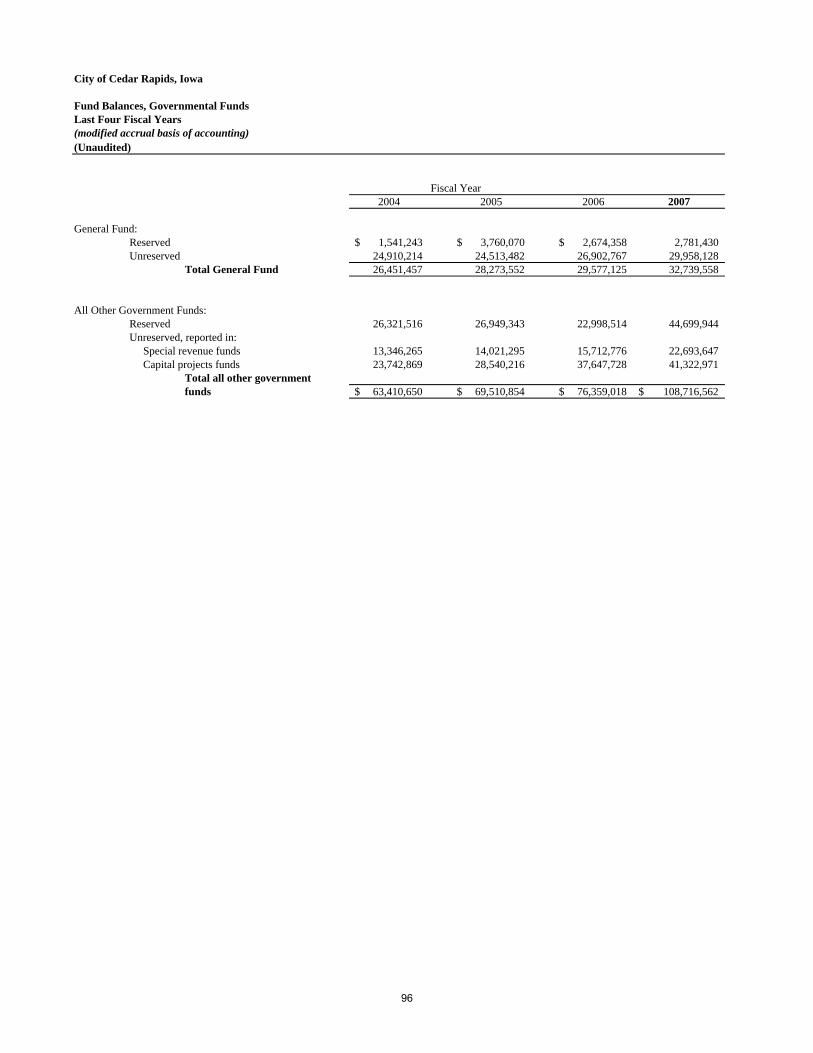
City of Cedar Rapids, Iowa
Fund Balances, Governmental FundsLast Four Fiscal Years(modified accrual basis of accounting)(Unaudited)
Fiscal Year2004 2005 2006 2007
General Fund:Reserved 1,541,243$ 3,760,070$ 2,674,358$ 2,781,430 Unreserved 24,910,214 24,513,482 26,902,767 29,958,128
Total General Fund 26,451,457 28,273,552 29,577,125 32,739,558
All Other Government Funds:Reserved 26,321,516 26,949,343 22,998,514 44,699,944 Unreserved, reported in: Special revenue funds 13,346,265 14,021,295 15,712,776 22,693,647 Capital projects funds 23,742,869 28,540,216 37,647,728 41,322,971
Total all other governmentfunds 63,410,650$ 69,510,854$ 76,359,018$ 108,716,562$
96
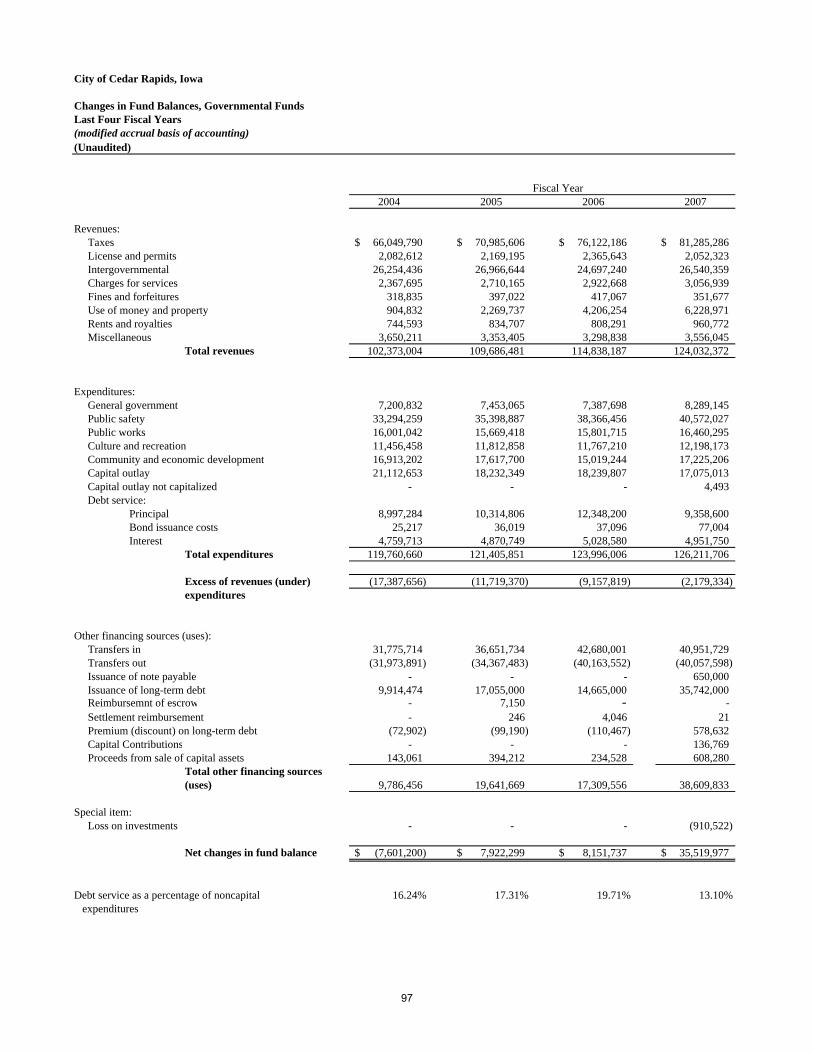
City of Cedar Rapids, Iowa
Changes in Fund Balances, Governmental FundsLast Four Fiscal Years(modified accrual basis of accounting)(Unaudited)
Fiscal Year2004 2005 2006 2007
Revenues: Taxes 66,049,790$ 70,985,606$ 76,122,186$ 81,285,286$ License and permits 2,082,612 2,169,195 2,365,643 2,052,323 Intergovernmental 26,254,436 26,966,644 24,697,240 26,540,359 Charges for services 2,367,695 2,710,165 2,922,668 3,056,939 Fines and forfeitures 318,835 397,022 417,067 351,677 Use of money and property 904,832 2,269,737 4,206,254 6,228,971 Rents and royalties 744,593 834,707 808,291 960,772 Miscellaneous 3,650,211 3,353,405 3,298,838 3,556,045
Total revenues 102,373,004 109,686,481 114,838,187 124,032,372
Expenditures: General government 7,200,832 7,453,065 7,387,698 8,289,145 Public safety 33,294,259 35,398,887 38,366,456 40,572,027 Public works 16,001,042 15,669,418 15,801,715 16,460,295 Culture and recreation 11,456,458 11,812,858 11,767,210 12,198,173 Community and economic development 16,913,202 17,617,700 15,019,244 17,225,206 Capital outlay 21,112,653 18,232,349 18,239,807 17,075,013 Capital outlay not capitalized - - - 4,493 Debt service:
Principal 8,997,284 10,314,806 12,348,200 9,358,600 Bond issuance costs 25,217 36,019 37,096 77,004 Interest 4,759,713 4,870,749 5,028,580 4,951,750
Total expenditures 119,760,660 121,405,851 123,996,006 126,211,706
Excess of revenues (under) (17,387,656) (11,719,370) (9,157,819) (2,179,334) expenditures
Other financing sources (uses): Transfers in 31,775,714 36,651,734 42,680,001 40,951,729 Transfers out (31,973,891) (34,367,483) (40,163,552) (40,057,598) Issuance of note payable - - - 650,000 Issuance of long-term debt 9,914,474 17,055,000 14,665,000 35,742,000 Reimbursemnt of escrow - 7,150 - - Settlement reimbursement - 246 4,046 21 Premium (discount) on long-term debt (72,902) (99,190) (110,467) 578,632 Capital Contributions - - - 136,769 Proceeds from sale of capital assets 143,061 394,212 234,528 608,280
Total other financing sources(uses) 9,786,456 19,641,669 17,309,556 38,609,833
Special item: Loss on investments - - - (910,522)
Net changes in fund balance (7,601,200)$ 7,922,299$ 8,151,737$ 35,519,977$
Debt service as a percentage of noncapital 16.24% 17.31% 19.71% 13.10% expenditures
97
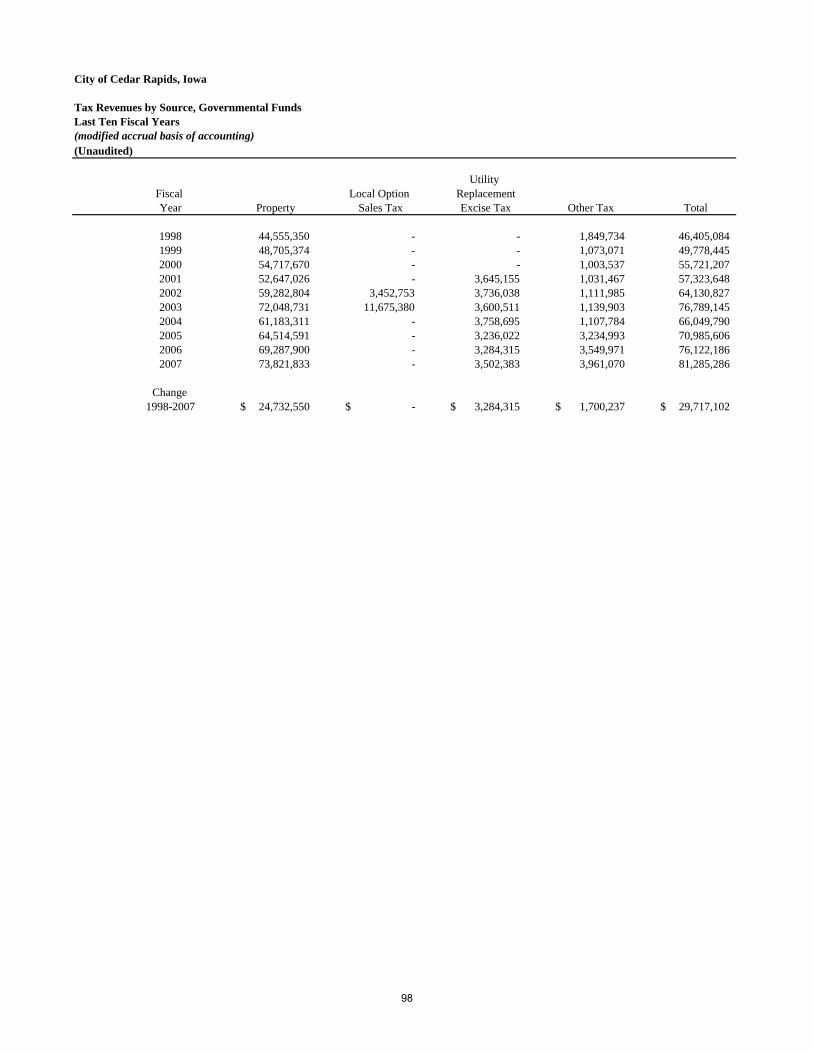
City of Cedar Rapids, Iowa
Tax Revenues by Source, Governmental FundsLast Ten Fiscal Years (modified accrual basis of accounting)(Unaudited)
Utility Fiscal Local Option ReplacementYear Property Sales Tax Excise Tax Other Tax Total
1998 44,555,350 - - 1,849,734 46,405,084 1999 48,705,374 - - 1,073,071 49,778,445 2000 54,717,670 - - 1,003,537 55,721,207 2001 52,647,026 - 3,645,155 1,031,467 57,323,648 2002 59,282,804 3,452,753 3,736,038 1,111,985 64,130,827 2003 72,048,731 11,675,380 3,600,511 1,139,903 76,789,145 2004 61,183,311 - 3,758,695 1,107,784 66,049,790 2005 64,514,591 - 3,236,022 3,234,993 70,985,606 2006 69,287,900 - 3,284,315 3,549,971 76,122,186 2007 73,821,833 - 3,502,383 3,961,070 81,285,286
Change 1998-2007 24,732,550$ -$ 3,284,315$ 1,700,237$ 29,717,102$
98
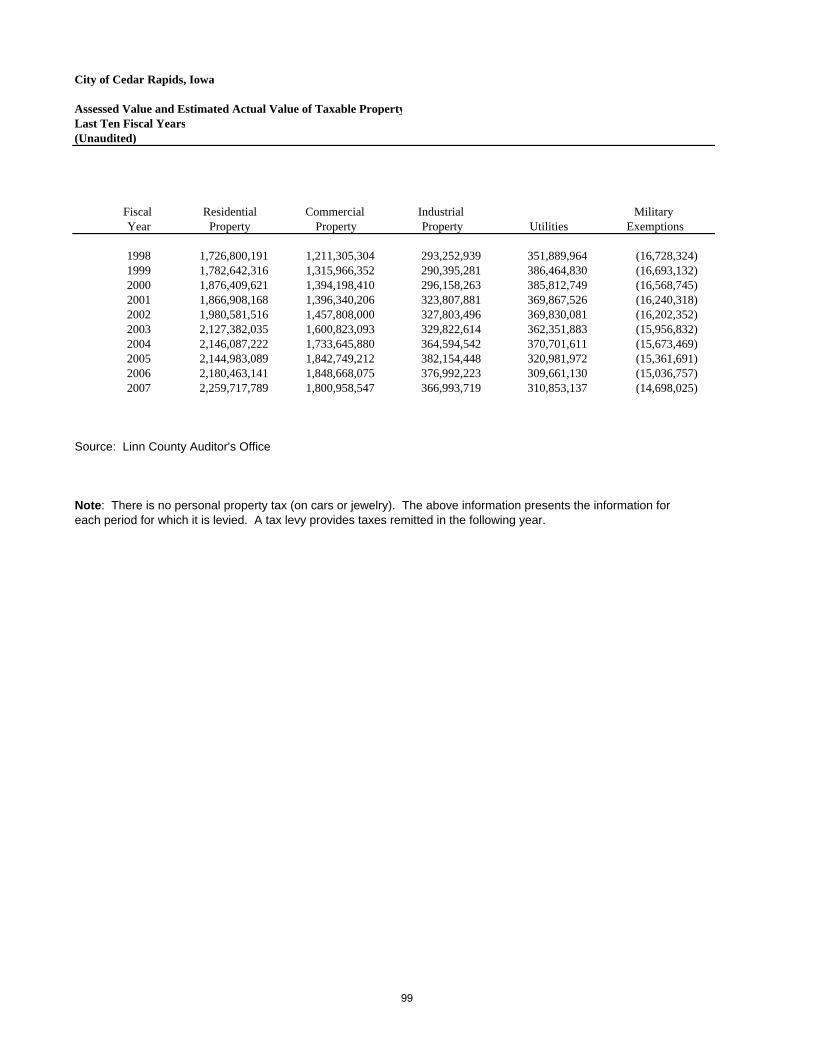
City of Cedar Rapids, Iowa
Assessed Value and Estimated Actual Value of Taxable PropertyLast Ten Fiscal Years(Unaudited)
Fiscal Residential Commercial Industrial Military Year Property Property Property Utilities Exemptions
1998 1,726,800,191 1,211,305,304 293,252,939 351,889,964 (16,728,324) 1999 1,782,642,316 1,315,966,352 290,395,281 386,464,830 (16,693,132) 2000 1,876,409,621 1,394,198,410 296,158,263 385,812,749 (16,568,745) 2001 1,866,908,168 1,396,340,206 323,807,881 369,867,526 (16,240,318) 2002 1,980,581,516 1,457,808,000 327,803,496 369,830,081 (16,202,352) 2003 2,127,382,035 1,600,823,093 329,822,614 362,351,883 (15,956,832) 2004 2,146,087,222 1,733,645,880 364,594,542 370,701,611 (15,673,469) 2005 2,144,983,089 1,842,749,212 382,154,448 320,981,972 (15,361,691) 2006 2,180,463,141 1,848,668,075 376,992,223 309,661,130 (15,036,757) 2007 2,259,717,789 1,800,958,547 366,993,719 310,853,137 (14,698,025)
Source: Linn County Auditor's Office
Note: There is no personal property tax (on cars or jewelry). The above information presents the information for each period for which it is levied. A tax levy provides taxes remitted in the following year.
99
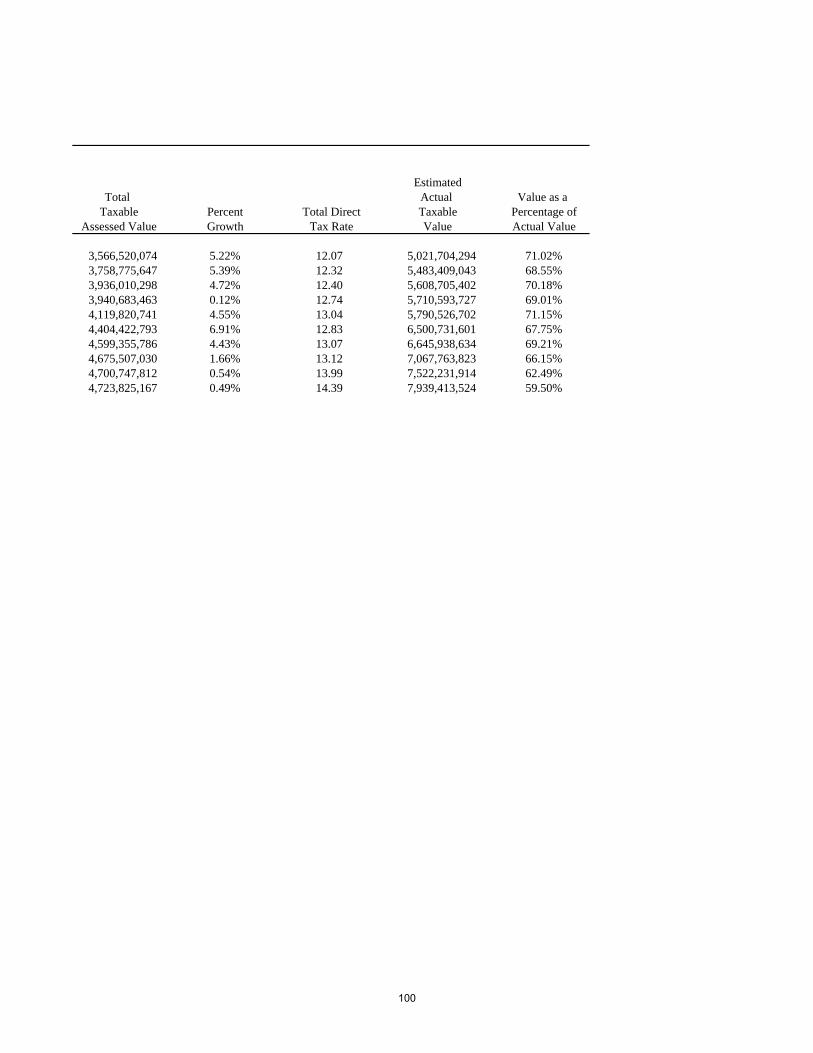
EstimatedTotal Actual Value as a
Taxable Percent Total Direct Taxable Percentage ofAssessed Value Growth Tax Rate Value Actual Value
3,566,520,074 5.22% 12.07 5,021,704,294 71.02%3,758,775,647 5.39% 12.32 5,483,409,043 68.55%3,936,010,298 4.72% 12.40 5,608,705,402 70.18%3,940,683,463 0.12% 12.74 5,710,593,727 69.01%4,119,820,741 4.55% 13.04 5,790,526,702 71.15%4,404,422,793 6.91% 12.83 6,500,731,601 67.75%4,599,355,786 4.43% 13.07 6,645,938,634 69.21%4,675,507,030 1.66% 13.12 7,067,763,823 66.15%4,700,747,812 0.54% 13.99 7,522,231,914 62.49%4,723,825,167 0.49% 14.39 7,939,413,524 59.50%
100
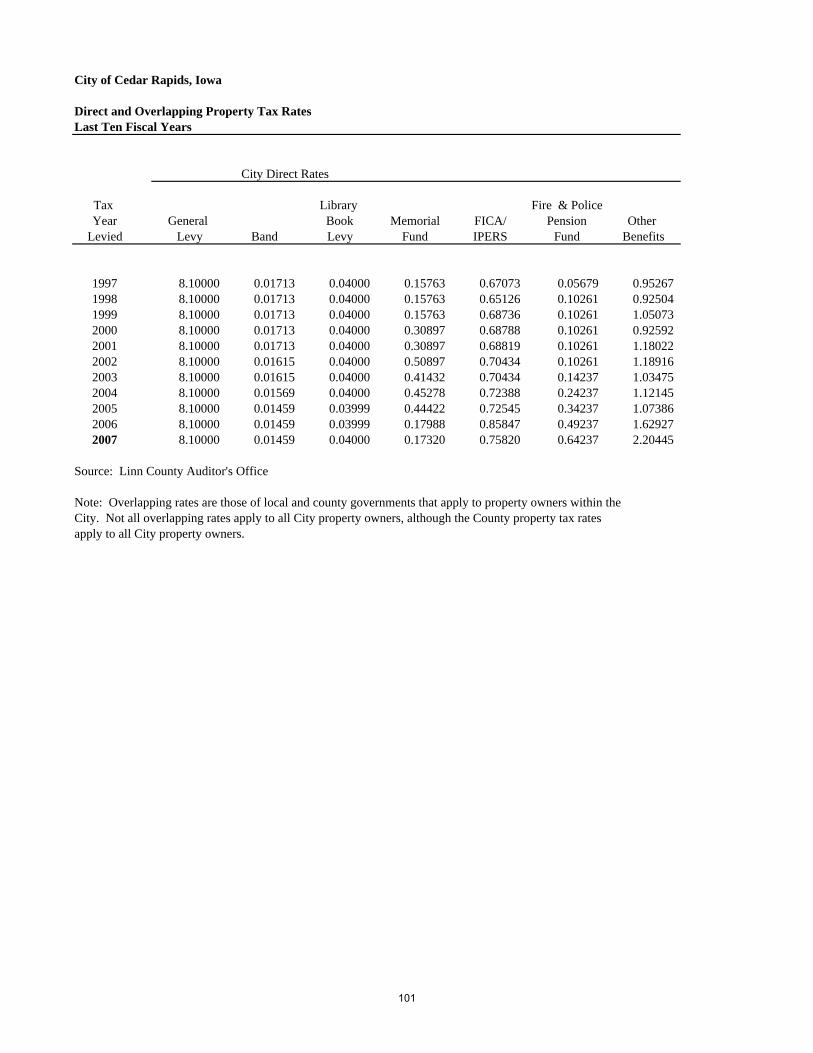
City of Cedar Rapids, Iowa
Direct and Overlapping Property Tax RatesLast Ten Fiscal Years
City Direct Rates
Tax Library Fire & PoliceYear General Book Memorial FICA/ Pension Other
Levied Levy Band Levy Fund IPERS Fund Benefits
1997 8.10000 0.01713 0.04000 0.15763 0.67073 0.05679 0.95267 1998 8.10000 0.01713 0.04000 0.15763 0.65126 0.10261 0.92504 1999 8.10000 0.01713 0.04000 0.15763 0.68736 0.10261 1.05073 2000 8.10000 0.01713 0.04000 0.30897 0.68788 0.10261 0.92592 2001 8.10000 0.01713 0.04000 0.30897 0.68819 0.10261 1.18022 2002 8.10000 0.01615 0.04000 0.50897 0.70434 0.10261 1.18916 2003 8.10000 0.01615 0.04000 0.41432 0.70434 0.14237 1.03475 2004 8.10000 0.01569 0.04000 0.45278 0.72388 0.24237 1.12145 2005 8.10000 0.01459 0.03999 0.44422 0.72545 0.34237 1.07386 2006 8.10000 0.01459 0.03999 0.17988 0.85847 0.49237 1.62927 2007 8.10000 0.01459 0.04000 0.17320 0.75820 0.64237 2.20445
Source: Linn County Auditor's Office
Note: Overlapping rates are those of local and county governments that apply to property owners within the City. Not all overlapping rates apply to all City property owners, although the County property tax rates apply to all City property owners.
101
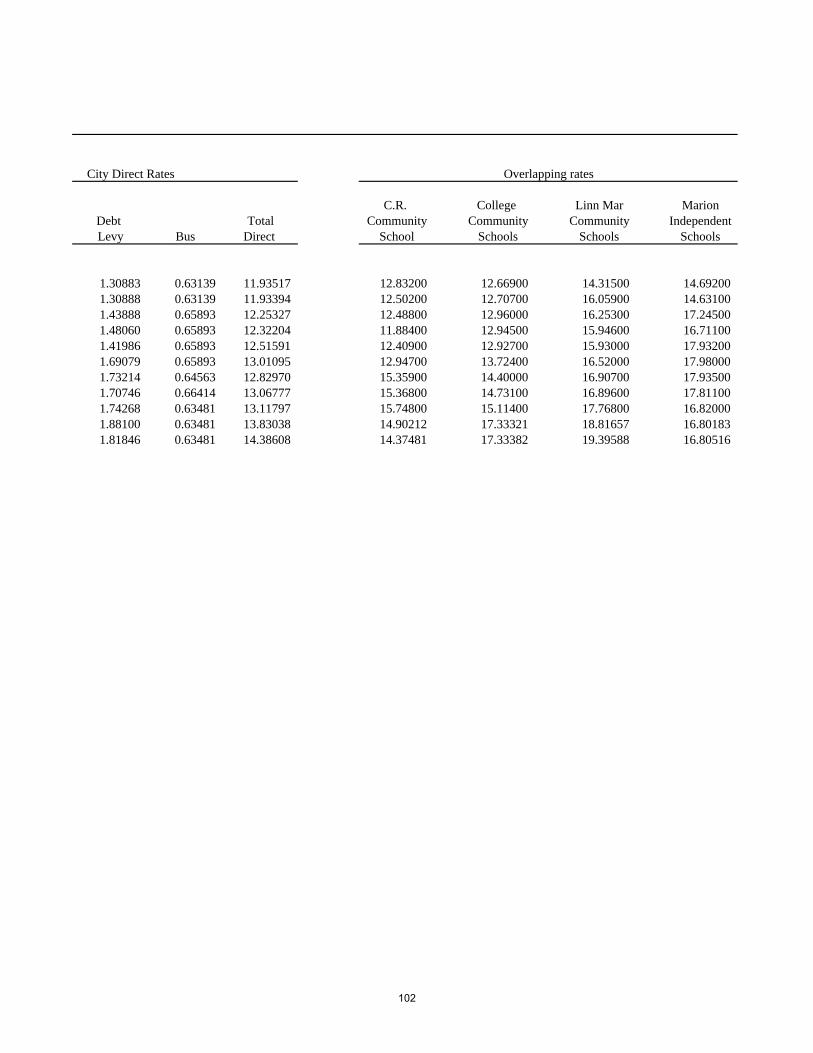
City Direct Rates Overlapping rates
C.R. College Linn Mar MarionDebt Total Community Community Community IndependentLevy Bus Direct School Schools Schools Schools
1.30883 0.63139 11.93517 12.83200 12.66900 14.31500 14.69200 1.30888 0.63139 11.93394 12.50200 12.70700 16.05900 14.63100 1.43888 0.65893 12.25327 12.48800 12.96000 16.25300 17.24500 1.48060 0.65893 12.32204 11.88400 12.94500 15.94600 16.71100 1.41986 0.65893 12.51591 12.40900 12.92700 15.93000 17.93200 1.69079 0.65893 13.01095 12.94700 13.72400 16.52000 17.98000 1.73214 0.64563 12.82970 15.35900 14.40000 16.90700 17.93500 1.70746 0.66414 13.06777 15.36800 14.73100 16.89600 17.81100 1.74268 0.63481 13.11797 15.74800 15.11400 17.76800 16.82000 1.88100 0.63481 13.83038 14.90212 17.33321 18.81657 16.80183 1.81846 0.63481 14.38608 14.37481 17.33382 19.39588 16.80516
102

103
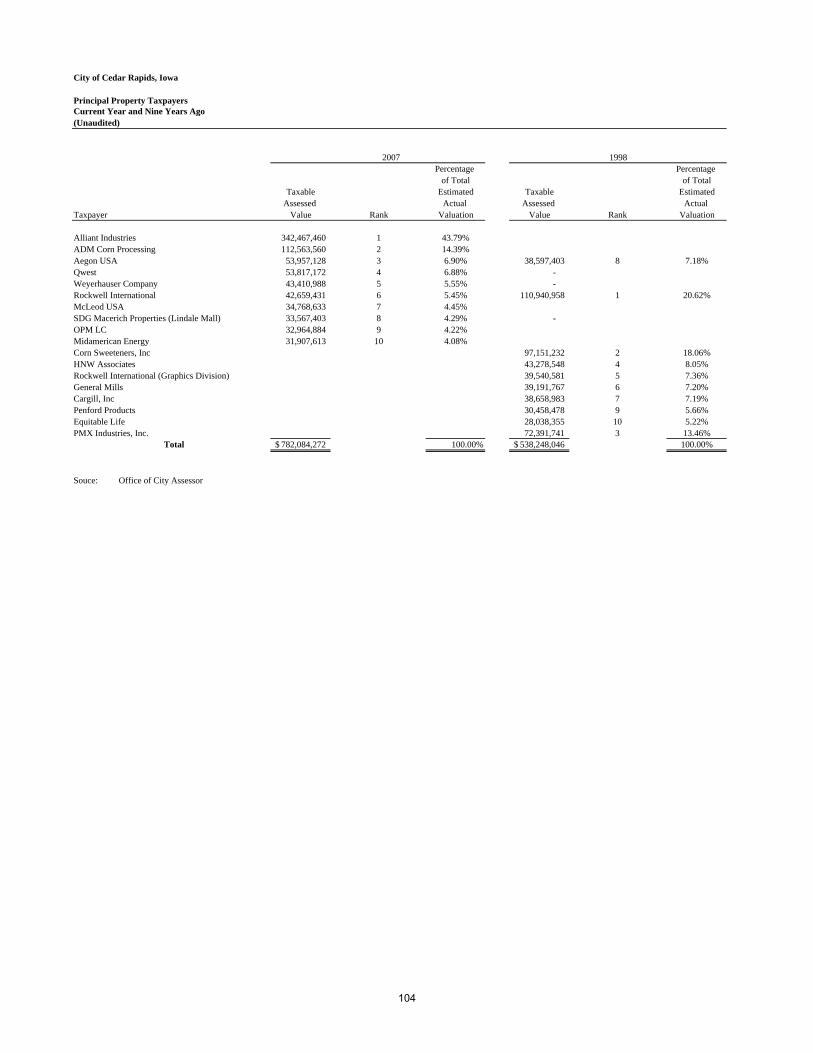
City of Cedar Rapids, Iowa
Principal Property TaxpayersCurrent Year and Nine Years Ago(Unaudited)
Percentage Percentage of Total of Total
Taxable Estimated Taxable EstimatedAssessed Actual Assessed Actual
Taxpayer Value Rank Valuation Value Rank Valuation
Alliant Industries 342,467,460 1 43.79%ADM Corn Processing 112,563,560 2 14.39%Aegon USA 53,957,128 3 6.90% 38,597,403 8 7.18%Qwest 53,817,172 4 6.88% - Weyerhauser Company 43,410,988 5 5.55% - Rockwell International 42,659,431 6 5.45% 110,940,958 1 20.62%McLeod USA 34,768,633 7 4.45%SDG Macerich Properties (Lindale Mall) 33,567,403 8 4.29% - OPM LC 32,964,884 9 4.22%Midamerican Energy 31,907,613 10 4.08%Corn Sweeteners, Inc 97,151,232 2 18.06%HNW Associates 43,278,548 4 8.05%Rockwell International (Graphics Division) 39,540,581 5 7.36%General Mills 39,191,767 6 7.20%Cargill, Inc 38,658,983 7 7.19%Penford Products 30,458,478 9 5.66%Equitable Life 28,038,355 10 5.22%PMX Industries, Inc. 72,391,741 3 13.46%
Total 782,084,272$ 100.00% 538,248,046$ 100.00%
Souce: Office of City Assessor
2007 1998
104
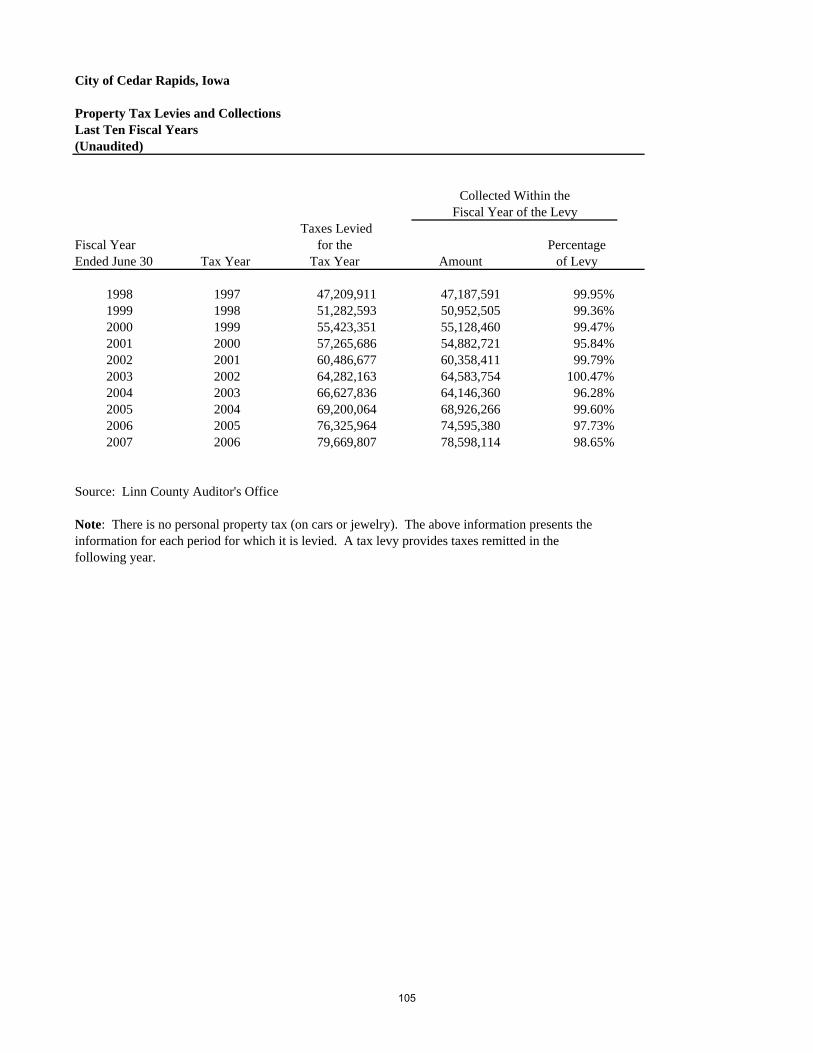
City of Cedar Rapids, Iowa
Property Tax Levies and CollectionsLast Ten Fiscal Years(Unaudited)
Taxes LeviedFiscal Year for the PercentageEnded June 30 Tax Year Tax Year Amount of Levy
1998 1997 47,209,911 47,187,591 99.95%1999 1998 51,282,593 50,952,505 99.36%2000 1999 55,423,351 55,128,460 99.47%2001 2000 57,265,686 54,882,721 95.84%2002 2001 60,486,677 60,358,411 99.79%2003 2002 64,282,163 64,583,754 100.47%2004 2003 66,627,836 64,146,360 96.28%2005 2004 69,200,064 68,926,266 99.60%2006 2005 76,325,964 74,595,380 97.73%2007 2006 79,669,807 78,598,114 98.65%
Source: Linn County Auditor's Office
Note: There is no personal property tax (on cars or jewelry). The above information presents theinformation for each period for which it is levied. A tax levy provides taxes remitted in the following year.
Collected Within theFiscal Year of the Levy
105
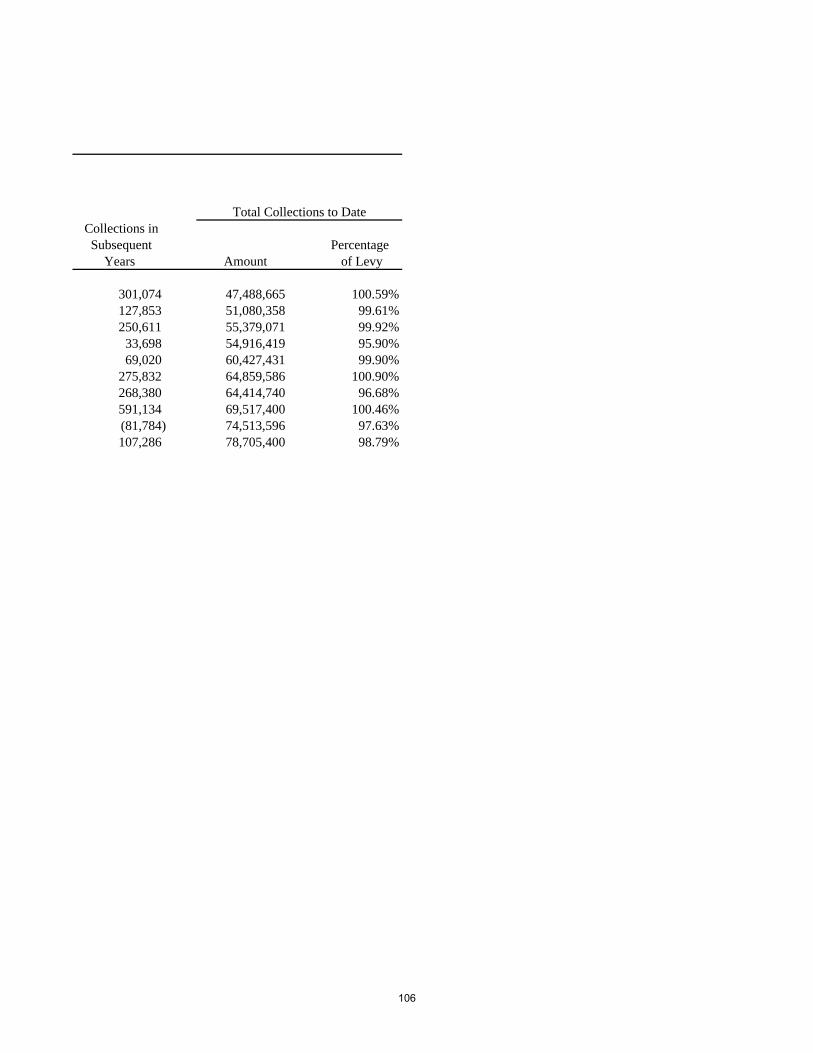
Collections inSubsequent Percentage
Years Amount of Levy
301,074 47,488,665 100.59%127,853 51,080,358 99.61%250,611 55,379,071 99.92%
33,698 54,916,419 95.90%69,020 60,427,431 99.90%
275,832 64,859,586 100.90%268,380 64,414,740 96.68%591,134 69,517,400 100.46%(81,784) 74,513,596 97.63%107,286 78,705,400 98.79%
Total Collections to Date
106
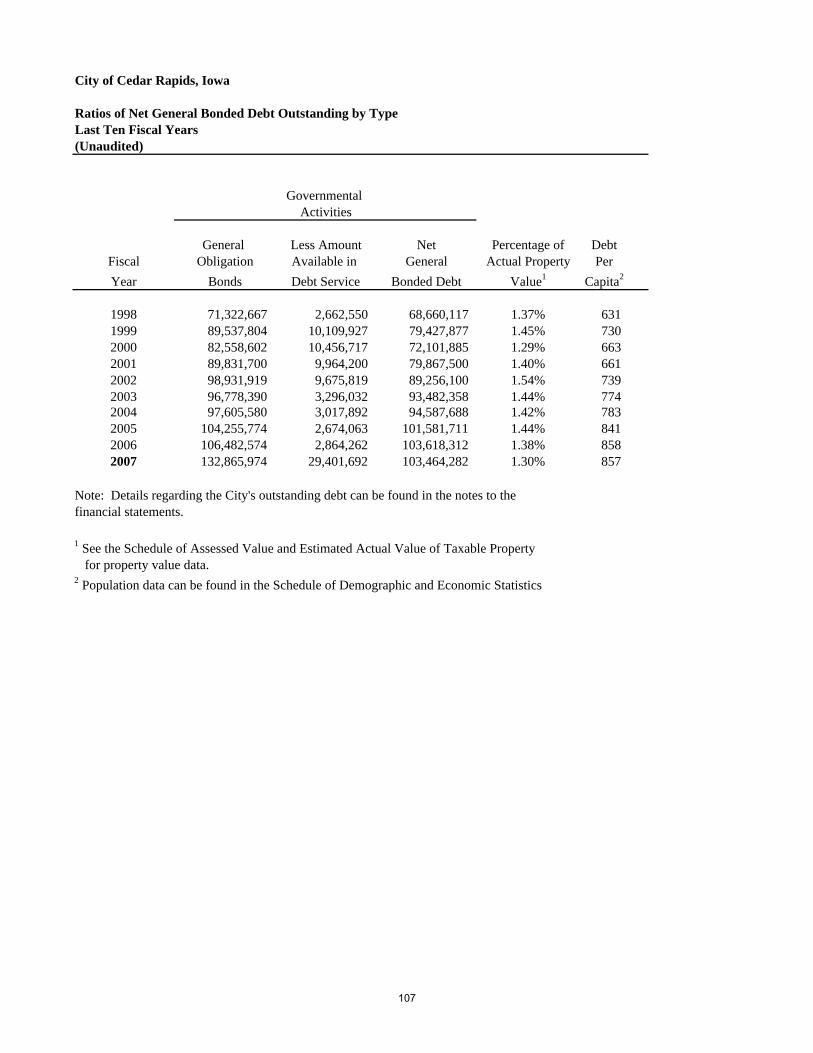
City of Cedar Rapids, Iowa
Ratios of Net General Bonded Debt Outstanding by TypeLast Ten Fiscal Years(Unaudited)
General Less Amount Net Percentage of DebtFiscal Obligation Available in General Actual Property PerYear Bonds Debt Service Bonded Debt Value1 Capita2
1998 71,322,667 2,662,550 68,660,117 1.37% 631 1999 89,537,804 10,109,927 79,427,877 1.45% 730 2000 82,558,602 10,456,717 72,101,885 1.29% 663 2001 89,831,700 9,964,200 79,867,500 1.40% 661 2002 98,931,919 9,675,819 89,256,100 1.54% 739 2003 96,778,390 3,296,032 93,482,358 1.44% 774 2004 97,605,580 3,017,892 94,587,688 1.42% 783 2005 104,255,774 2,674,063 101,581,711 1.44% 841 2006 106,482,574 2,864,262 103,618,312 1.38% 858 2007 132,865,974 29,401,692 103,464,282 1.30% 857
Note: Details regarding the City's outstanding debt can be found in the notes to the financial statements.
1 See the Schedule of Assessed Value and Estimated Actual Value of Taxable Property for property value data.2 Population data can be found in the Schedule of Demographic and Economic Statistics
Governmental Activities
107
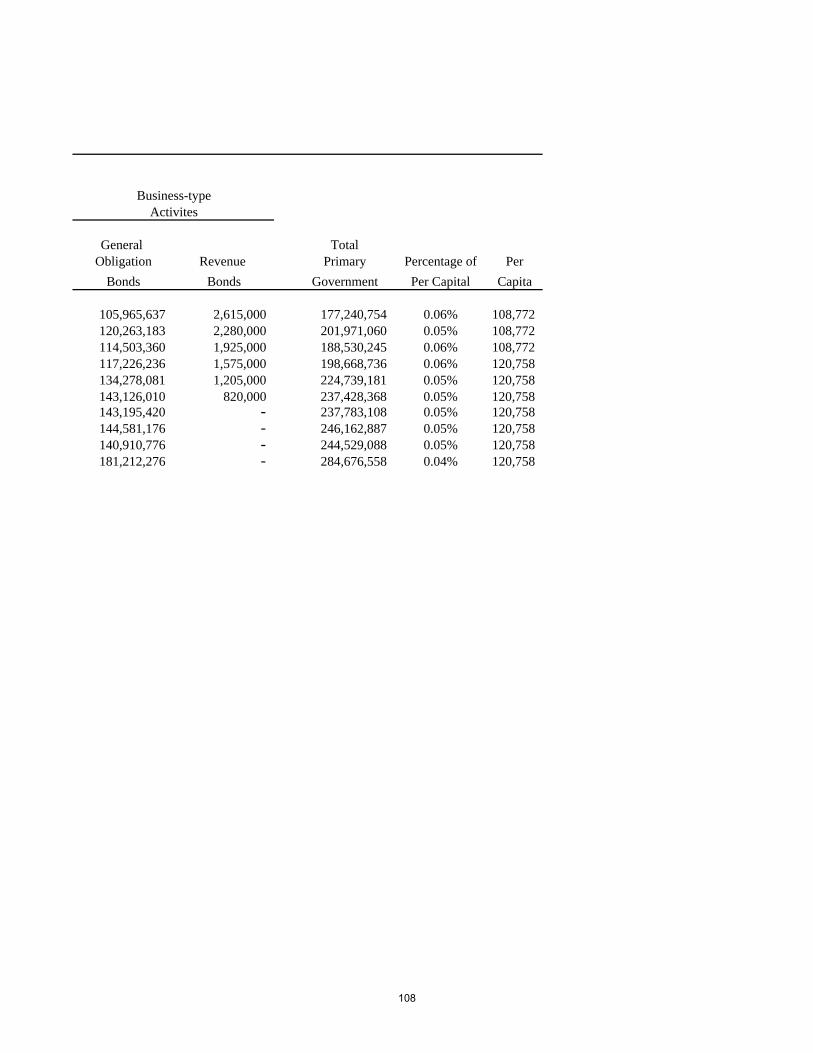
General TotalObligation Revenue Primary Percentage of Per
Bonds Bonds Government Per Capital Capita
105,965,637 2,615,000 177,240,754 0.06% 108,772 120,263,183 2,280,000 201,971,060 0.05% 108,772 114,503,360 1,925,000 188,530,245 0.06% 108,772 117,226,236 1,575,000 198,668,736 0.06% 120,758 134,278,081 1,205,000 224,739,181 0.05% 120,758 143,126,010 820,000 237,428,368 0.05% 120,758 143,195,420 - 237,783,108 0.05% 120,758144,581,176 - 246,162,887 0.05% 120,758140,910,776 - 244,529,088 0.05% 120,758181,212,276 - 284,676,558 0.04% 120,758
Business-typeActivites
108

109
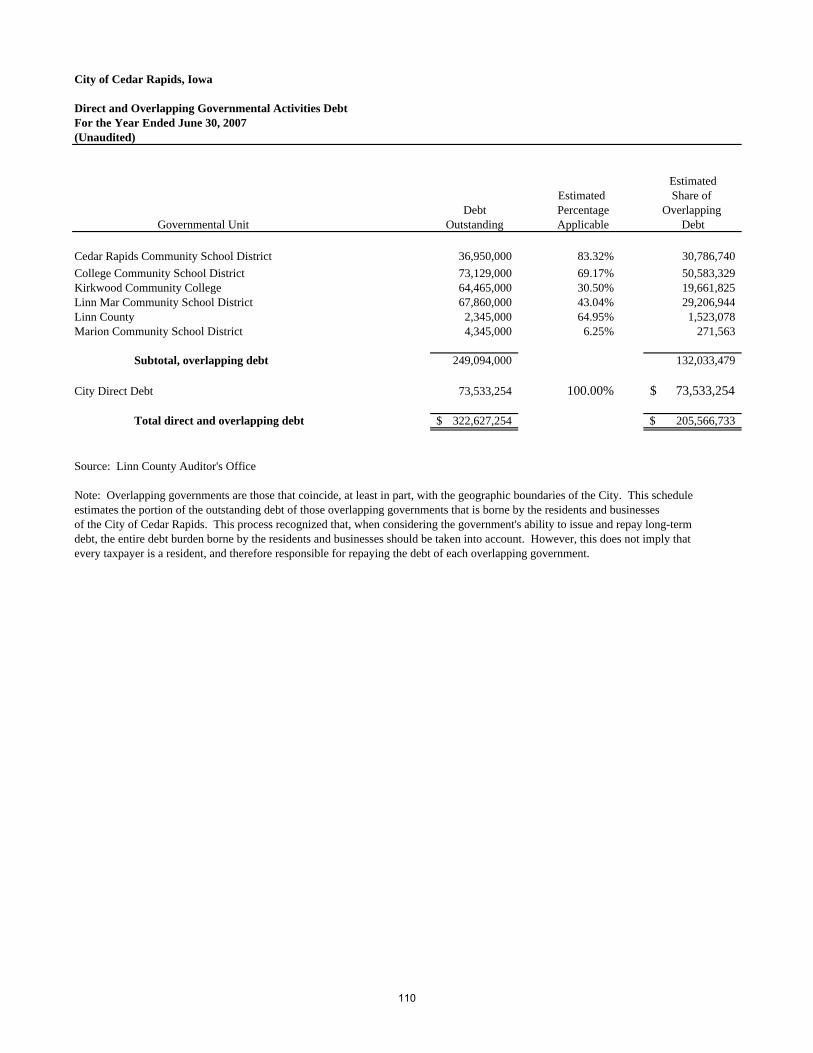
City of Cedar Rapids, Iowa
Direct and Overlapping Governmental Activities DebtFor the Year Ended June 30, 2007(Unaudited)
EstimatedEstimated Share of
Debt Percentage Overlapping Governmental Unit Outstanding Applicable Debt
Cedar Rapids Community School District 36,950,000 83.32% 30,786,740 College Community School District 73,129,000 69.17% 50,583,329 Kirkwood Community College 64,465,000 30.50% 19,661,825 Linn Mar Community School District 67,860,000 43.04% 29,206,944 Linn County 2,345,000 64.95% 1,523,078 Marion Community School District 4,345,000 6.25% 271,563
Subtotal, overlapping debt 249,094,000 132,033,479
City Direct Debt 73,533,254 100.00% 73,533,254$
Total direct and overlapping debt 322,627,254$ 205,566,733$
Source: Linn County Auditor's Office
Note: Overlapping governments are those that coincide, at least in part, with the geographic boundaries of the City. This scheduleestimates the portion of the outstanding debt of those overlapping governments that is borne by the residents and businessesof the City of Cedar Rapids. This process recognized that, when considering the government's ability to issue and repay long-termdebt, the entire debt burden borne by the residents and businesses should be taken into account. However, this does not imply thatevery taxpayer is a resident, and therefore responsible for repaying the debt of each overlapping government.
110
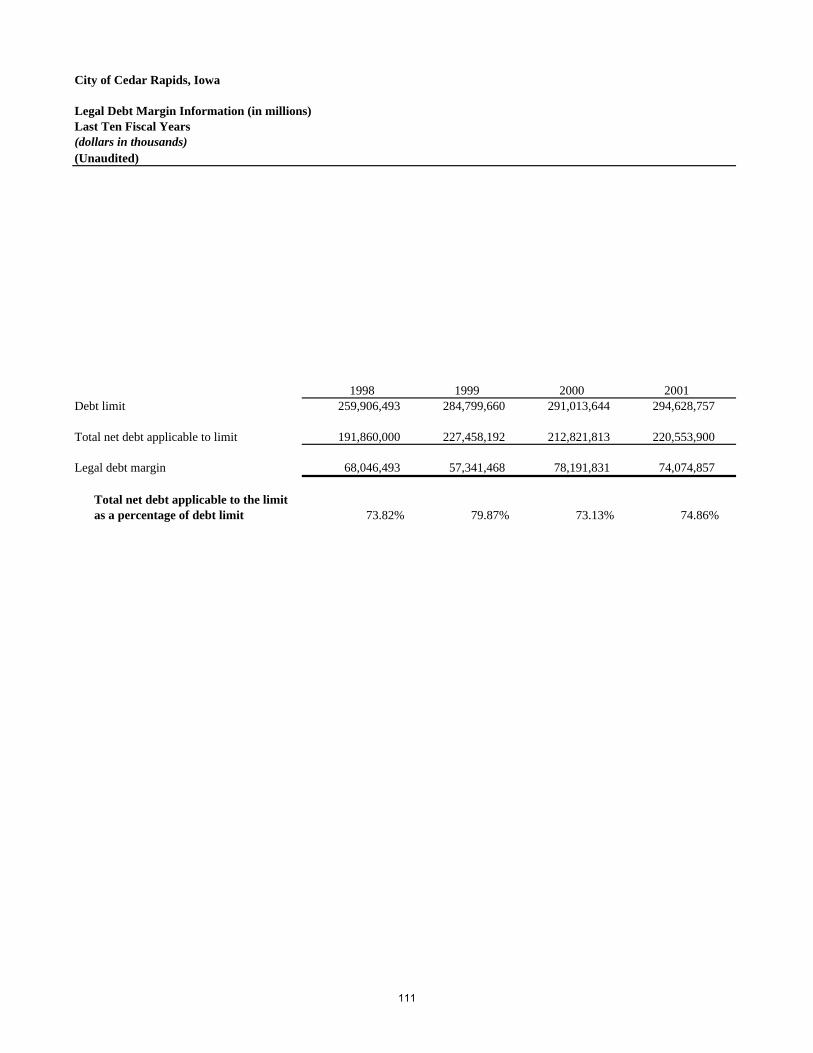
City of Cedar Rapids, Iowa
Legal Debt Margin Information (in millions)Last Ten Fiscal Years(dollars in thousands)(Unaudited)
1998 1999 2000 2001Debt limit 259,906,493 284,799,660 291,013,644 294,628,757
Total net debt applicable to limit 191,860,000 227,458,192 212,821,813 220,553,900
Legal debt margin 68,046,493 57,341,468 78,191,831 74,074,857
Total net debt applicable to the limitas a percentage of debt limit 73.82% 79.87% 73.13% 74.86%
111
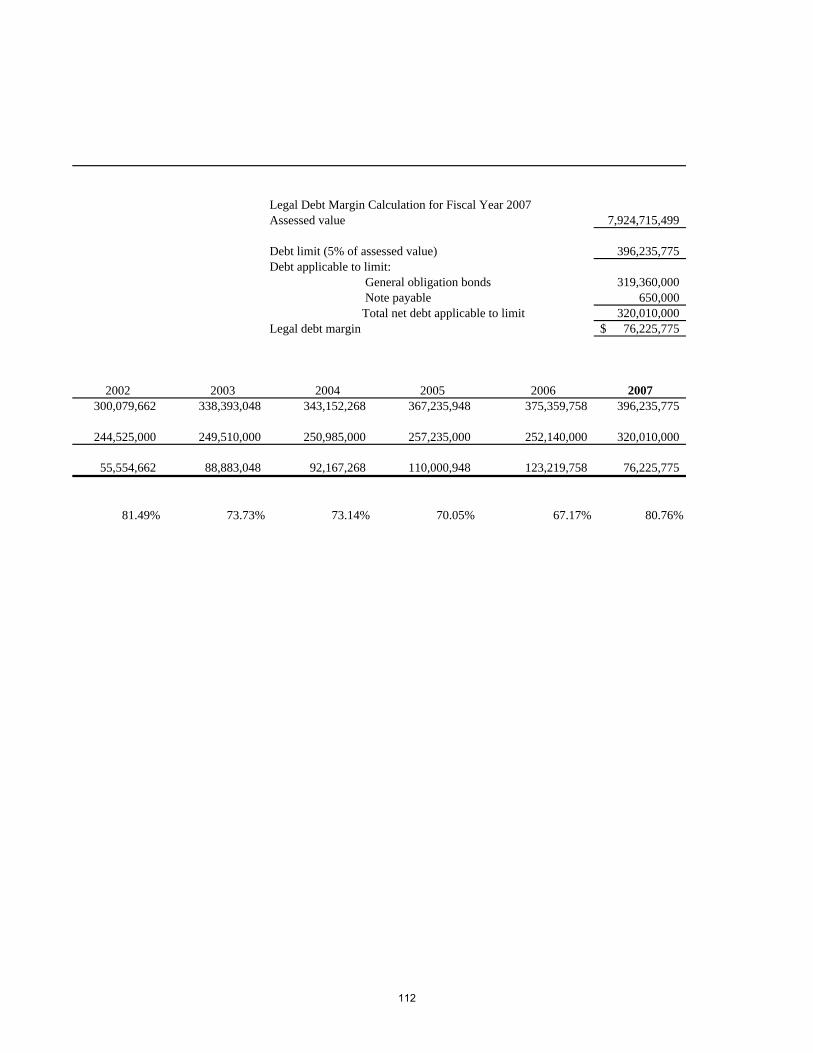
Legal Debt Margin Calculation for Fiscal Year 2007Assessed value 7,924,715,499
Debt limit (5% of assessed value) 396,235,775 Debt applicable to limit:
General obligation bonds 319,360,000 Note payable 650,000 Total net debt applicable to limit 320,010,000
Legal debt margin 76,225,775$
2002 2003 2004 2005 2006 2007300,079,662 338,393,048 343,152,268 367,235,948 375,359,758 396,235,775
244,525,000 249,510,000 250,985,000 257,235,000 252,140,000 320,010,000
55,554,662 88,883,048 92,167,268 110,000,948 123,219,758 76,225,775
81.49% 73.73% 73.14% 70.05% 67.17% 80.76%
112
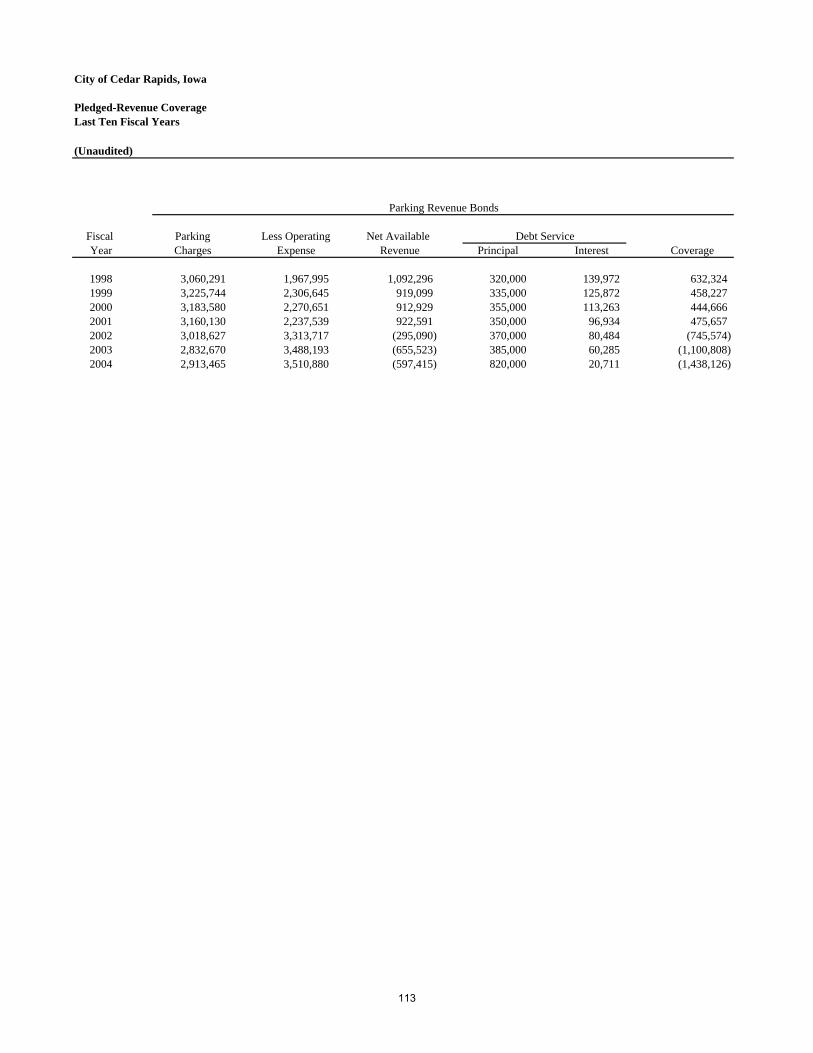
City of Cedar Rapids, Iowa
Pledged-Revenue CoverageLast Ten Fiscal Years
(Unaudited)
Fiscal Parking Less Operating Net Available Year Charges Expense Revenue Principal Interest Coverage
1998 3,060,291 1,967,995 1,092,296 320,000 139,972 632,324 1999 3,225,744 2,306,645 919,099 335,000 125,872 458,227 2000 3,183,580 2,270,651 912,929 355,000 113,263 444,666 2001 3,160,130 2,237,539 922,591 350,000 96,934 475,657 2002 3,018,627 3,313,717 (295,090) 370,000 80,484 (745,574) 2003 2,832,670 3,488,193 (655,523) 385,000 60,285 (1,100,808) 2004 2,913,465 3,510,880 (597,415) 820,000 20,711 (1,438,126)
Debt Service
Parking Revenue Bonds
113
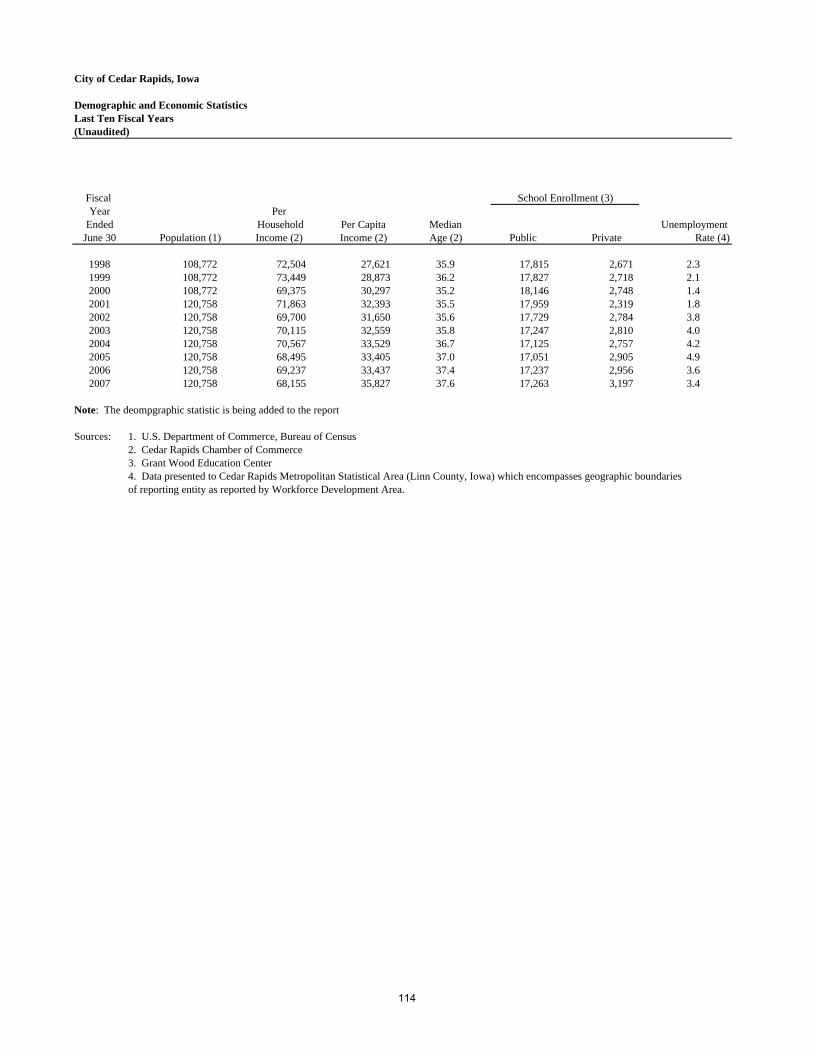
City of Cedar Rapids, Iowa
Demographic and Economic StatisticsLast Ten Fiscal Years(Unaudited)
Fiscal Year Per
Ended Household Per Capita Median Unemployment June 30 Population (1) Income (2) Income (2) Age (2) Public Private Rate (4)
1998 108,772 72,504 27,621 35.9 17,815 2,671 2.31999 108,772 73,449 28,873 36.2 17,827 2,718 2.12000 108,772 69,375 30,297 35.2 18,146 2,748 1.42001 120,758 71,863 32,393 35.5 17,959 2,319 1.82002 120,758 69,700 31,650 35.6 17,729 2,784 3.82003 120,758 70,115 32,559 35.8 17,247 2,810 4.02004 120,758 70,567 33,529 36.7 17,125 2,757 4.22005 120,758 68,495 33,405 37.0 17,051 2,905 4.92006 120,758 69,237 33,437 37.4 17,237 2,956 3.62007 120,758 68,155 35,827 37.6 17,263 3,197 3.4
Note: The deompgraphic statistic is being added to the report
Sources: 1. U.S. Department of Commerce, Bureau of Census2. Cedar Rapids Chamber of Commerce3. Grant Wood Education Center4. Data presented to Cedar Rapids Metropolitan Statistical Area (Linn County, Iowa) which encompasses geographic boundaries of reporting entity as reported by Workforce Development Area.
School Enrollment (3)
114

115
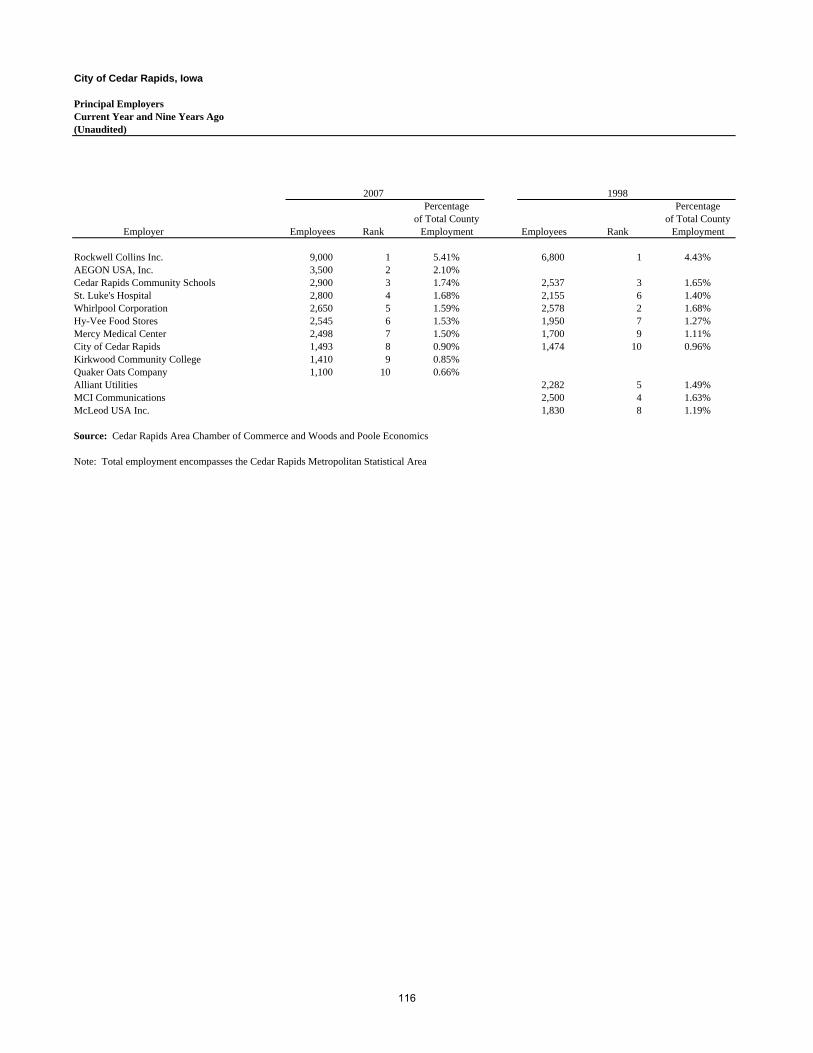
City of Cedar Rapids, Iowa
Principal EmployersCurrent Year and Nine Years Ago(Unaudited)
2007 1998 Percentage Percentage
of Total County of Total CountyEmployer Employees Rank Employment Employees Rank Employment
Rockwell Collins Inc. 9,000 1 5.41% 6,800 1 4.43%AEGON USA, Inc. 3,500 2 2.10% Cedar Rapids Community Schools 2,900 3 1.74% 2,537 3 1.65%St. Luke's Hospital 2,800 4 1.68% 2,155 6 1.40%Whirlpool Corporation 2,650 5 1.59% 2,578 2 1.68%Hy-Vee Food Stores 2,545 6 1.53% 1,950 7 1.27%Mercy Medical Center 2,498 7 1.50% 1,700 9 1.11%City of Cedar Rapids 1,493 8 0.90% 1,474 10 0.96%Kirkwood Community College 1,410 9 0.85% Quaker Oats Company 1,100 10 0.66% Alliant Utilities 2,282 5 1.49%MCI Communications 2,500 4 1.63%McLeod USA Inc. 1,830 8 1.19%
Source: Cedar Rapids Area Chamber of Commerce and Woods and Poole Economics
Note: Total employment encompasses the Cedar Rapids Metropolitan Statistical Area
116
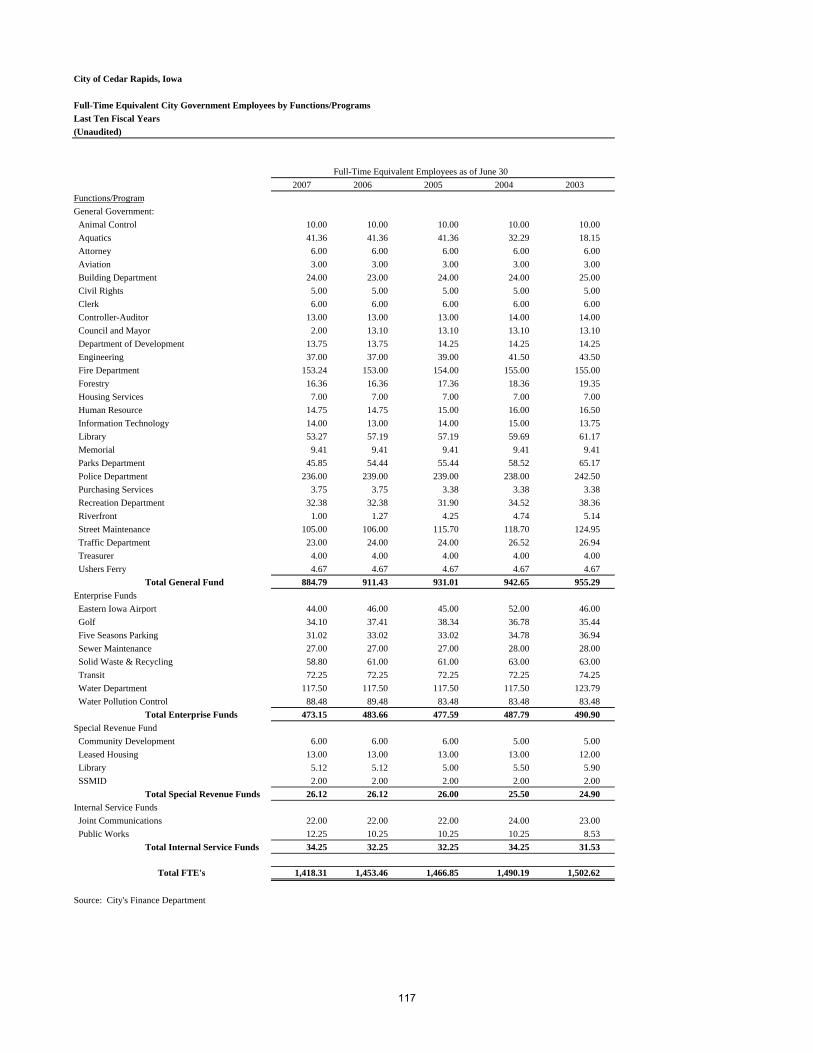
City of Cedar Rapids, Iowa
Full-Time Equivalent City Government Employees by Functions/ProgramsLast Ten Fiscal Years(Unaudited)
Full-Time Equivalent Employees as of June 302007 2006 2005 2004 2003
Functions/ProgramGeneral Government: Animal Control 10.00 10.00 10.00 10.00 10.00 Aquatics 41.36 41.36 41.36 32.29 18.15 Attorney 6.00 6.00 6.00 6.00 6.00 Aviation 3.00 3.00 3.00 3.00 3.00 Building Department 24.00 23.00 24.00 24.00 25.00 Civil Rights 5.00 5.00 5.00 5.00 5.00 Clerk 6.00 6.00 6.00 6.00 6.00 Controller-Auditor 13.00 13.00 13.00 14.00 14.00 Council and Mayor 2.00 13.10 13.10 13.10 13.10 Department of Development 13.75 13.75 14.25 14.25 14.25 Engineering 37.00 37.00 39.00 41.50 43.50 Fire Department 153.24 153.00 154.00 155.00 155.00 Forestry 16.36 16.36 17.36 18.36 19.35 Housing Services 7.00 7.00 7.00 7.00 7.00 Human Resource 14.75 14.75 15.00 16.00 16.50 Information Technology 14.00 13.00 14.00 15.00 13.75 Library 53.27 57.19 57.19 59.69 61.17 Memorial 9.41 9.41 9.41 9.41 9.41 Parks Department 45.85 54.44 55.44 58.52 65.17 Police Department 236.00 239.00 239.00 238.00 242.50 Purchasing Services 3.75 3.75 3.38 3.38 3.38 Recreation Department 32.38 32.38 31.90 34.52 38.36 Riverfront 1.00 1.27 4.25 4.74 5.14 Street Maintenance 105.00 106.00 115.70 118.70 124.95 Traffic Department 23.00 24.00 24.00 26.52 26.94 Treasurer 4.00 4.00 4.00 4.00 4.00 Ushers Ferry 4.67 4.67 4.67 4.67 4.67
Total General Fund 884.79 911.43 931.01 942.65 955.29 Enterprise Funds Eastern Iowa Airport 44.00 46.00 45.00 52.00 46.00 Golf 34.10 37.41 38.34 36.78 35.44 Five Seasons Parking 31.02 33.02 33.02 34.78 36.94 Sewer Maintenance 27.00 27.00 27.00 28.00 28.00 Solid Waste & Recycling 58.80 61.00 61.00 63.00 63.00 Transit 72.25 72.25 72.25 72.25 74.25 Water Department 117.50 117.50 117.50 117.50 123.79 Water Pollution Control 88.48 89.48 83.48 83.48 83.48
Total Enterprise Funds 473.15 483.66 477.59 487.79 490.90 Special Revenue Fund Community Development 6.00 6.00 6.00 5.00 5.00 Leased Housing 13.00 13.00 13.00 13.00 12.00 Library 5.12 5.12 5.00 5.50 5.90 SSMID 2.00 2.00 2.00 2.00 2.00
Total Special Revenue Funds 26.12 26.12 26.00 25.50 24.90 Internal Service Funds Joint Communications 22.00 22.00 22.00 24.00 23.00 Public Works 12.25 10.25 10.25 10.25 8.53
Total Internal Service Funds 34.25 32.25 32.25 34.25 31.53
Total FTE's 1,418.31 1,453.46 1,466.85 1,490.19 1,502.62
Source: City's Finance Department
117
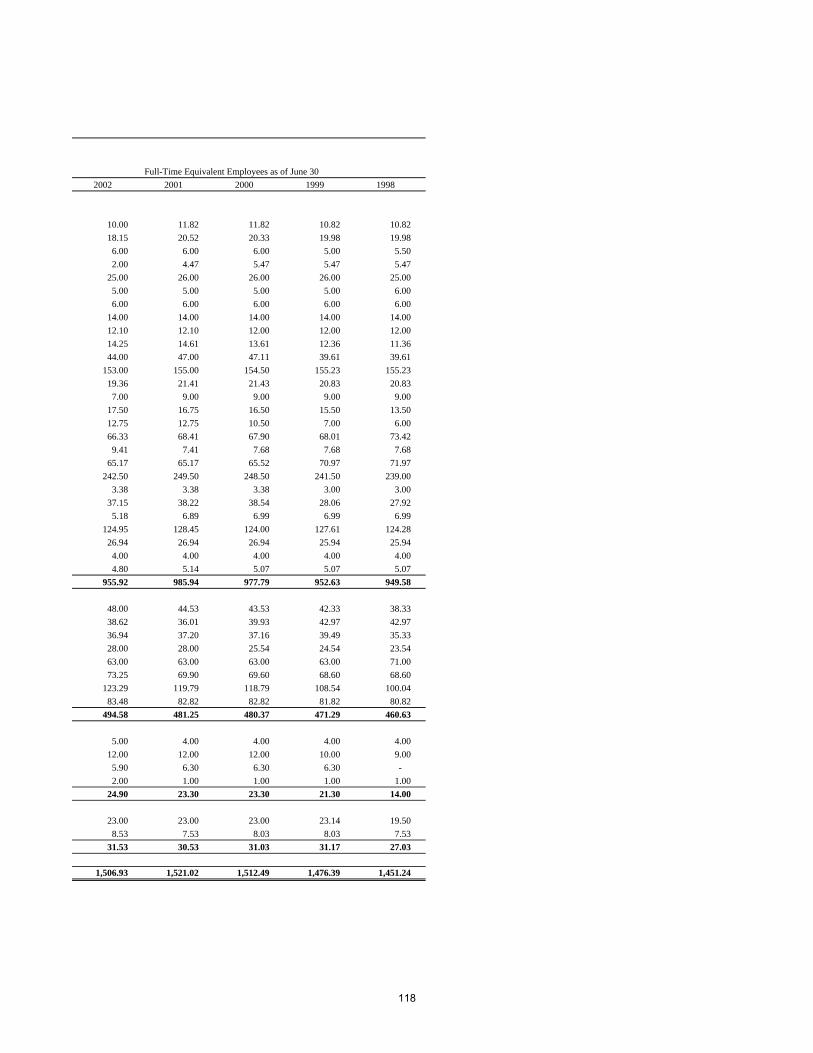
Full-Time Equivalent Employees as of June 302002 2001 2000 1999 1998
10.00 11.82 11.82 10.82 10.82 18.15 20.52 20.33 19.98 19.98 6.00 6.00 6.00 5.00 5.50 2.00 4.47 5.47 5.47 5.47
25.00 26.00 26.00 26.00 25.00 5.00 5.00 5.00 5.00 6.00 6.00 6.00 6.00 6.00 6.00
14.00 14.00 14.00 14.00 14.00 12.10 12.10 12.00 12.00 12.00 14.25 14.61 13.61 12.36 11.36 44.00 47.00 47.11 39.61 39.61
153.00 155.00 154.50 155.23 155.23 19.36 21.41 21.43 20.83 20.83 7.00 9.00 9.00 9.00 9.00
17.50 16.75 16.50 15.50 13.50 12.75 12.75 10.50 7.00 6.00 66.33 68.41 67.90 68.01 73.42 9.41 7.41 7.68 7.68 7.68
65.17 65.17 65.52 70.97 71.97 242.50 249.50 248.50 241.50 239.00
3.38 3.38 3.38 3.00 3.00 37.15 38.22 38.54 28.06 27.92 5.18 6.89 6.99 6.99 6.99
124.95 128.45 124.00 127.61 124.28 26.94 26.94 26.94 25.94 25.94 4.00 4.00 4.00 4.00 4.00 4.80 5.14 5.07 5.07 5.07
955.92 985.94 977.79 952.63 949.58
48.00 44.53 43.53 42.33 38.33 38.62 36.01 39.93 42.97 42.97 36.94 37.20 37.16 39.49 35.33 28.00 28.00 25.54 24.54 23.54 63.00 63.00 63.00 63.00 71.00 73.25 69.90 69.60 68.60 68.60
123.29 119.79 118.79 108.54 100.04 83.48 82.82 82.82 81.82 80.82
494.58 481.25 480.37 471.29 460.63
5.00 4.00 4.00 4.00 4.00 12.00 12.00 12.00 10.00 9.00 5.90 6.30 6.30 6.30 - 2.00 1.00 1.00 1.00 1.00
24.90 23.30 23.30 21.30 14.00
23.00 23.00 23.00 23.14 19.50 8.53 7.53 8.03 8.03 7.53
31.53 30.53 31.03 31.17 27.03
1,506.93 1,521.02 1,512.49 1,476.39 1,451.24
118
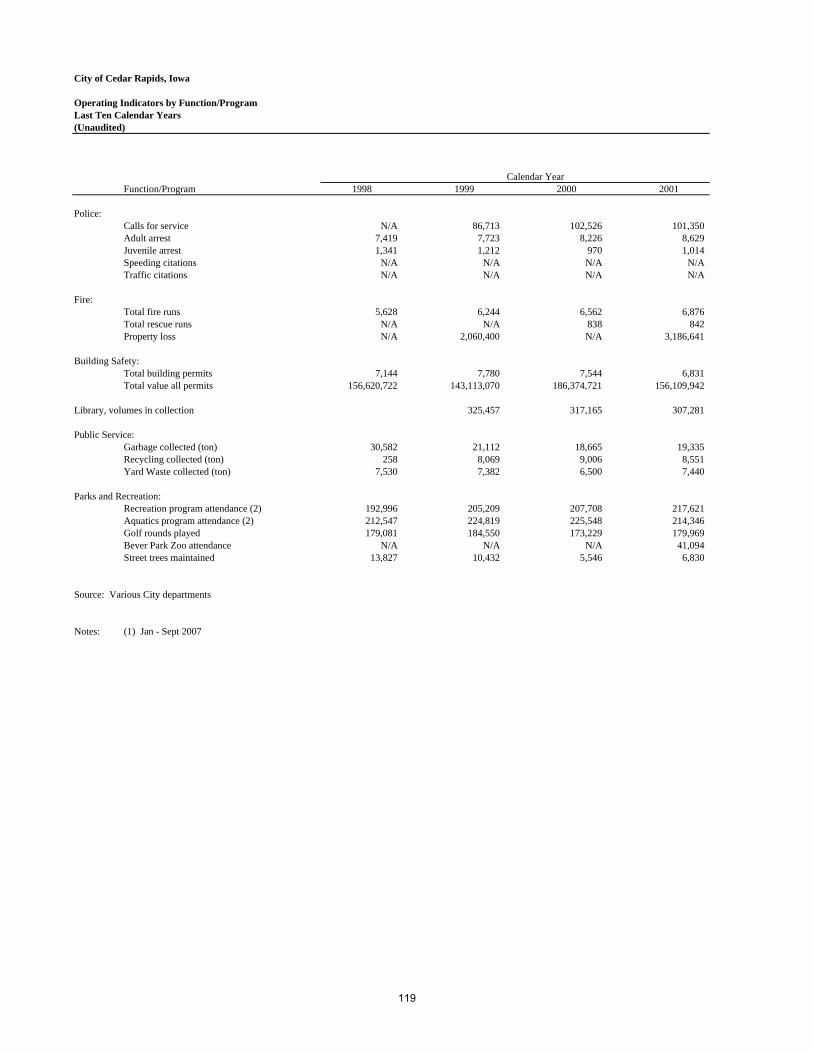
City of Cedar Rapids, Iowa
Operating Indicators by Function/ProgramLast Ten Calendar Years(Unaudited)
Calendar YearFunction/Program 1998 1999 2000 2001
Police:Calls for service N/A 86,713 102,526 101,350 Adult arrest 7,419 7,723 8,226 8,629 Juvenile arrest 1,341 1,212 970 1,014 Speeding citations N/A N/A N/A N/ATraffic citations N/A N/A N/A N/A
Fire:Total fire runs 5,628 6,244 6,562 6,876 Total rescue runs N/A N/A 838 842 Property loss N/A 2,060,400 N/A 3,186,641
Building Safety:Total building permits 7,144 7,780 7,544 6,831 Total value all permits 156,620,722 143,113,070 186,374,721 156,109,942
Library, volumes in collection 325,457 317,165 307,281
Public Service:Garbage collected (ton) 30,582 21,112 18,665 19,335 Recycling collected (ton) 258 8,069 9,006 8,551 Yard Waste collected (ton) 7,530 7,382 6,500 7,440
Parks and Recreation:Recreation program attendance (2) 192,996 205,209 207,708 217,621 Aquatics program attendance (2) 212,547 224,819 225,548 214,346 Golf rounds played 179,081 184,550 173,229 179,969 Bever Park Zoo attendance N/A N/A N/A 41,094 Street trees maintained 13,827 10,432 5,546 6,830
Source: Various City departments
Notes: (1) Jan - Sept 2007
119
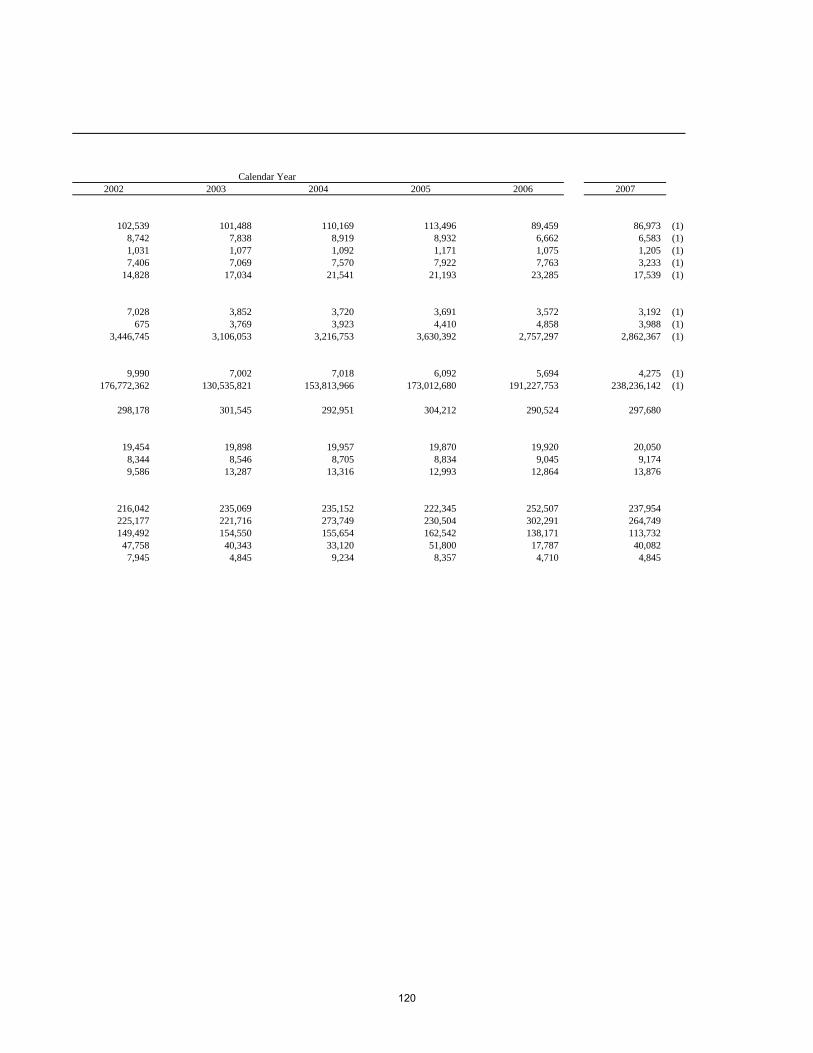
Calendar Year2002 2003 2004 2005 2006 2007
102,539 101,488 110,169 113,496 89,459 86,973 (1) 8,742 7,838 8,919 8,932 6,662 6,583 (1) 1,031 1,077 1,092 1,171 1,075 1,205 (1) 7,406 7,069 7,570 7,922 7,763 3,233 (1)
14,828 17,034 21,541 21,193 23,285 17,539 (1)
7,028 3,852 3,720 3,691 3,572 3,192 (1) 675 3,769 3,923 4,410 4,858 3,988 (1)
3,446,745 3,106,053 3,216,753 3,630,392 2,757,297 2,862,367 (1)
9,990 7,002 7,018 6,092 5,694 4,275 (1) 176,772,362 130,535,821 153,813,966 173,012,680 191,227,753 238,236,142 (1)
298,178 301,545 292,951 304,212 290,524 297,680
19,454 19,898 19,957 19,870 19,920 20,050 8,344 8,546 8,705 8,834 9,045 9,174 9,586 13,287 13,316 12,993 12,864 13,876
216,042 235,069 235,152 222,345 252,507 237,954 225,177 221,716 273,749 230,504 302,291 264,749 149,492 154,550 155,654 162,542 138,171 113,732
47,758 40,343 33,120 51,800 17,787 40,082 7,945 4,845 9,234 8,357 4,710 4,845
120
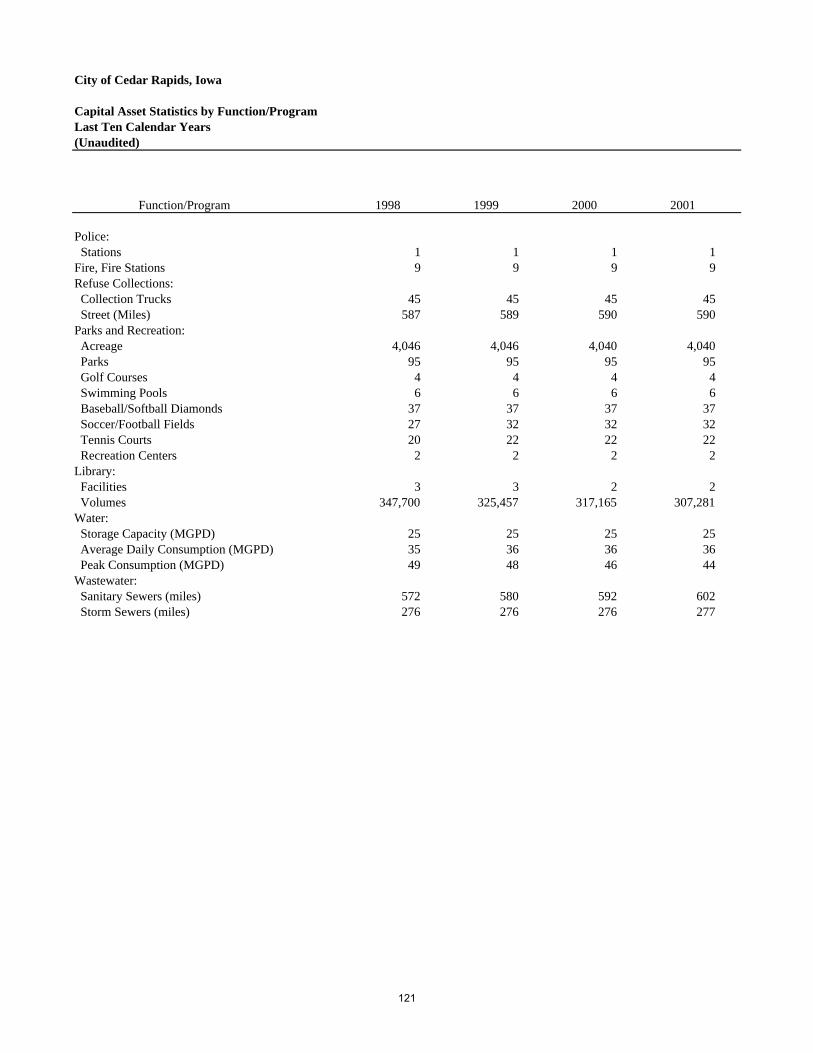
City of Cedar Rapids, Iowa
Capital Asset Statistics by Function/ProgramLast Ten Calendar Years(Unaudited)
Function/Program 1998 1999 2000 2001
Police: Stations 1 1 1 1 Fire, Fire Stations 9 9 9 9 Refuse Collections: Collection Trucks 45 45 45 45 Street (Miles) 587 589 590 590 Parks and Recreation: Acreage 4,046 4,046 4,040 4,040 Parks 95 95 95 95 Golf Courses 4 4 4 4 Swimming Pools 6 6 6 6 Baseball/Softball Diamonds 37 37 37 37 Soccer/Football Fields 27 32 32 32 Tennis Courts 20 22 22 22 Recreation Centers 2 2 2 2 Library: Facilities 3 3 2 2 Volumes 347,700 325,457 317,165 307,281 Water: Storage Capacity (MGPD) 25 25 25 25 Average Daily Consumption (MGPD) 35 36 36 36 Peak Consumption (MGPD) 49 48 46 44 Wastewater: Sanitary Sewers (miles) 572 580 592 602 Storm Sewers (miles) 276 276 276 277
121
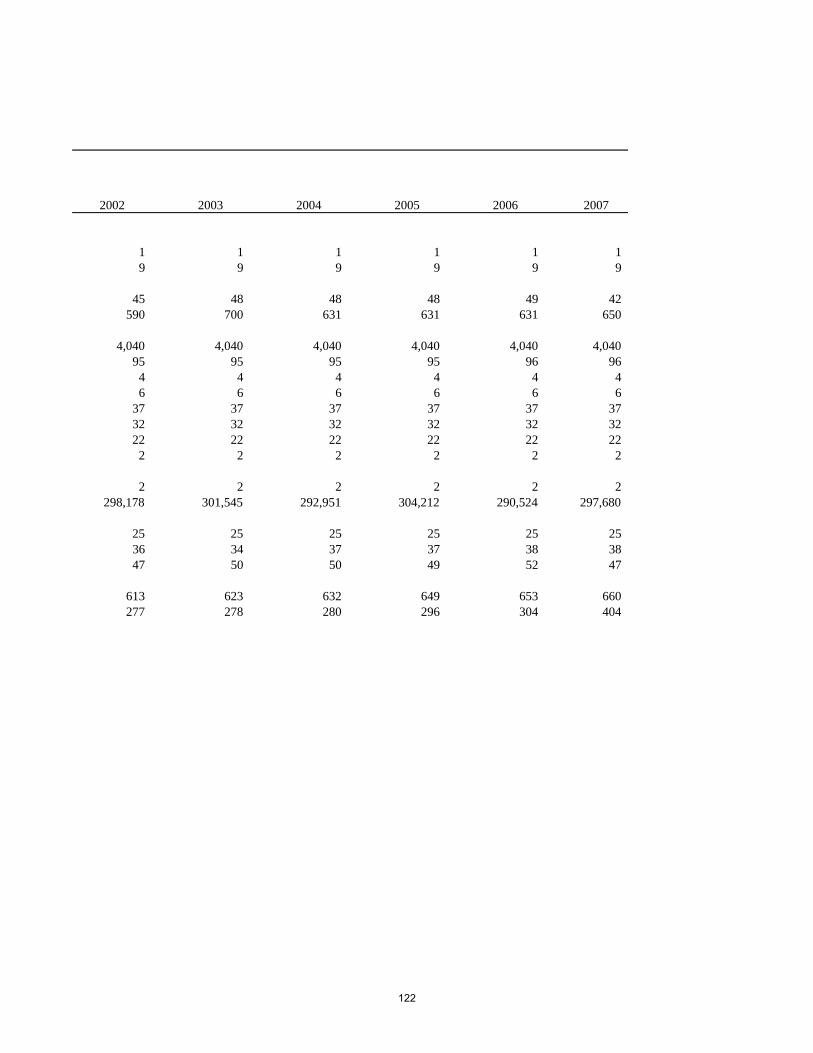
2002 2003 2004 2005 2006 2007
1 1 1 1 1 1 9 9 9 9 9 9
45 48 48 48 49 42 590 700 631 631 631 650
4,040 4,040 4,040 4,040 4,040 4,040 95 95 95 95 96 96
4 4 4 4 4 4 6 6 6 6 6 6
37 37 37 37 37 37 32 32 32 32 32 32 22 22 22 22 22 22
2 2 2 2 2 2
2 2 2 2 2 2 298,178 301,545 292,951 304,212 290,524 297,680
25 25 25 25 25 25 36 34 37 37 38 38 47 50 50 49 52 47
613 623 632 649 653 660 277 278 280 296 304 404
122

123
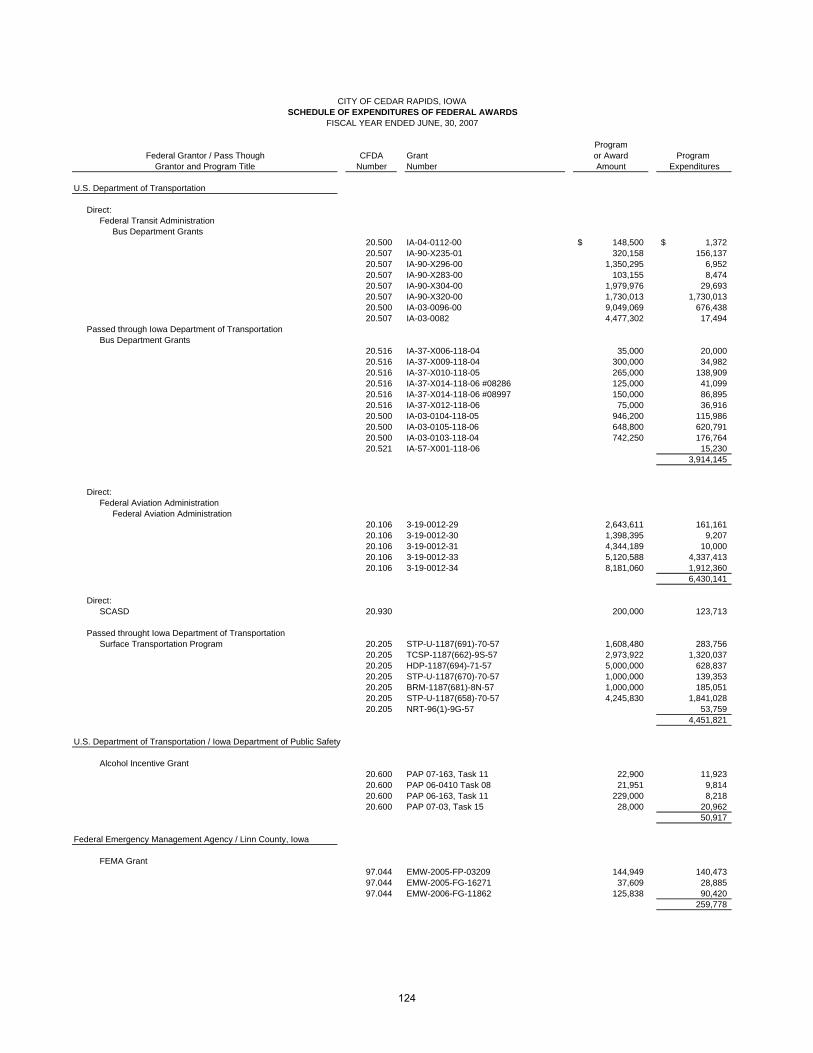
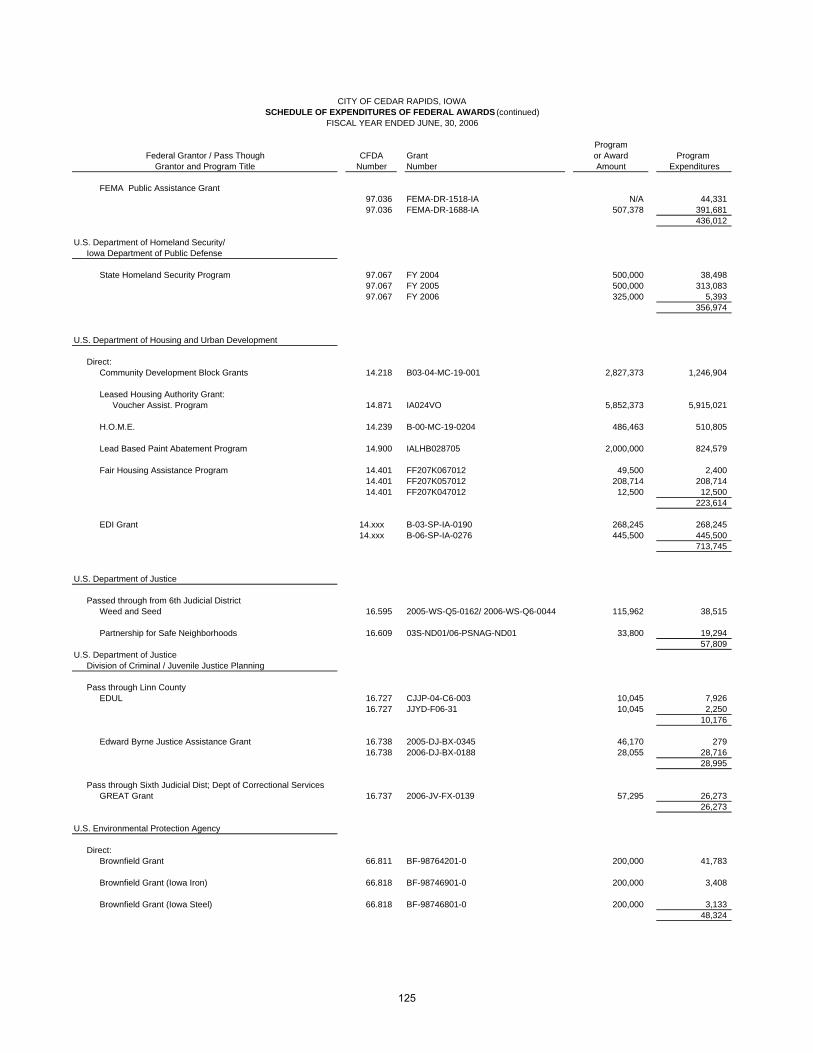
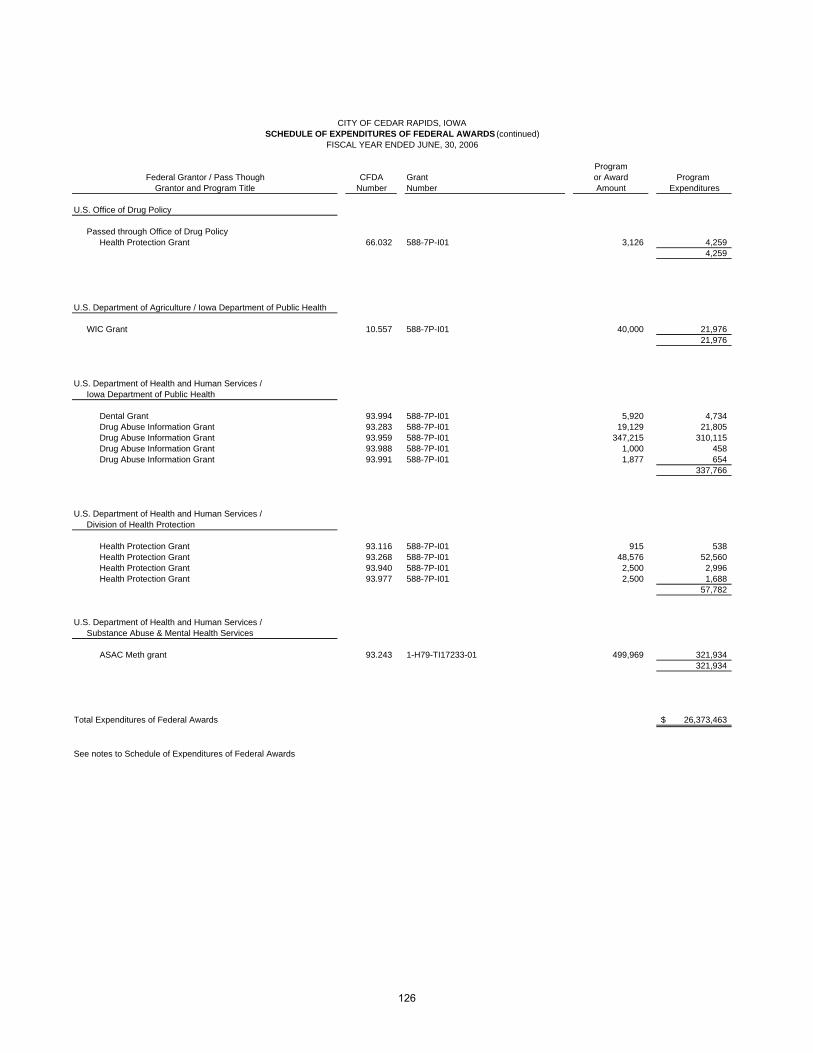
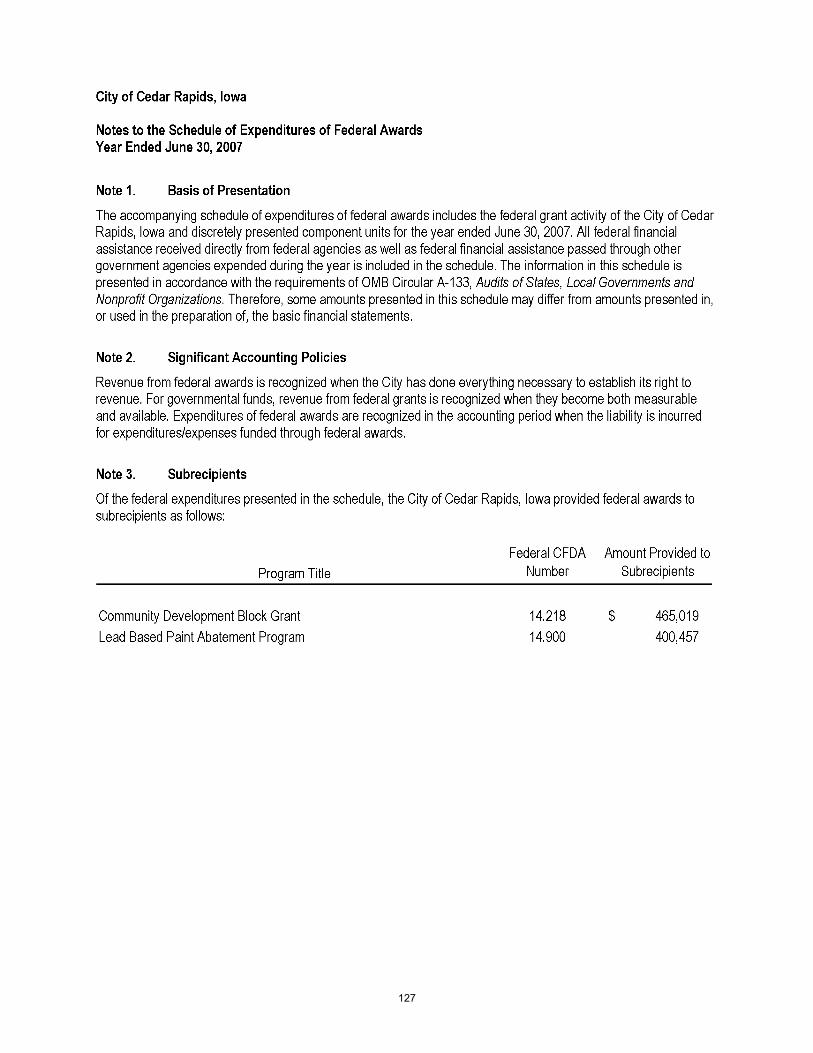
127
128
129
130
131
132
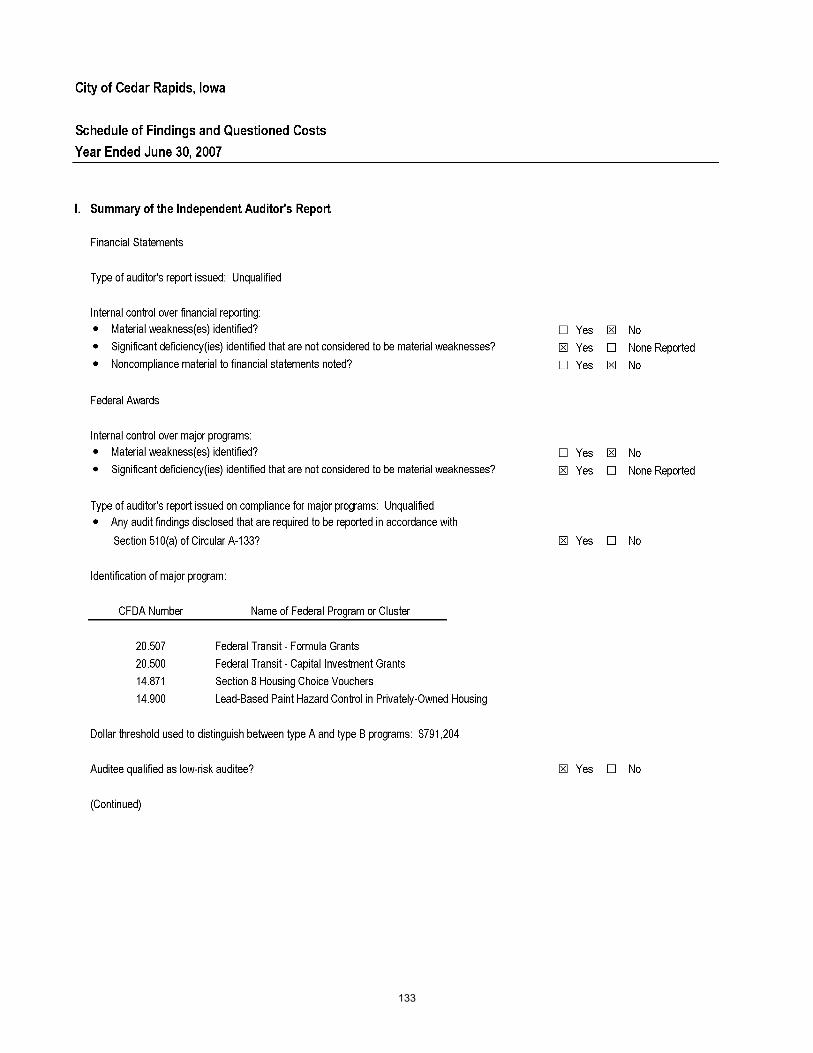
133
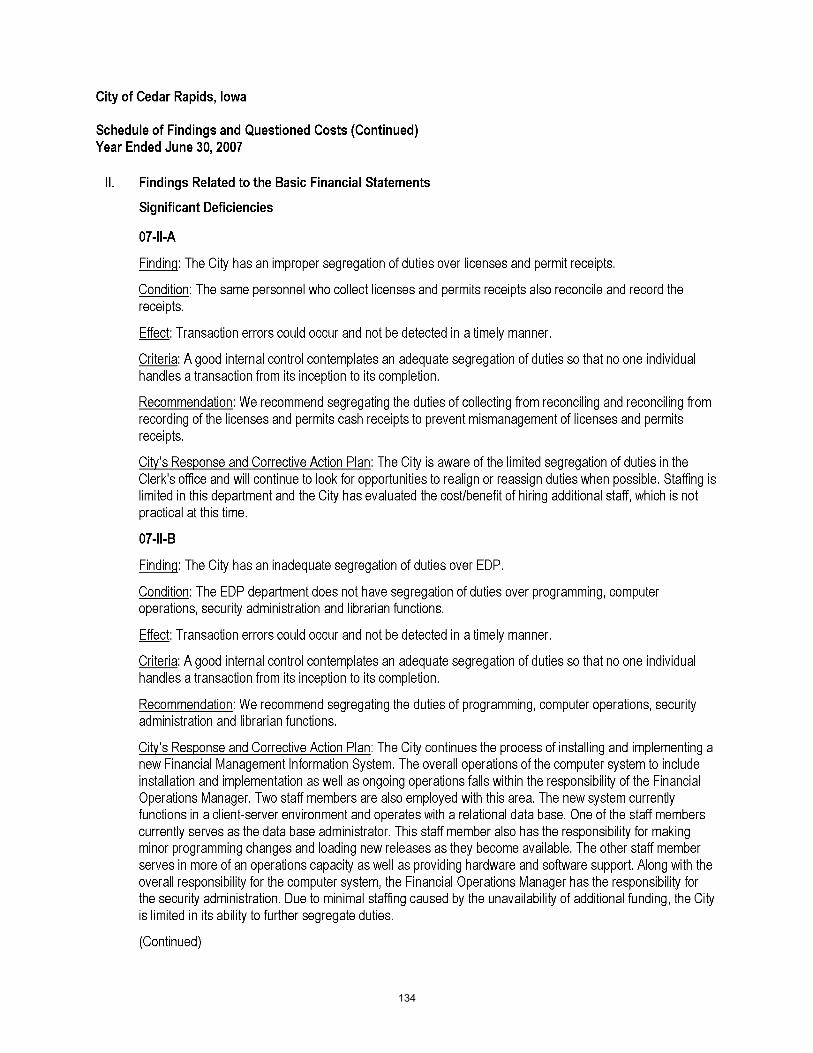
134
135
136
137
138
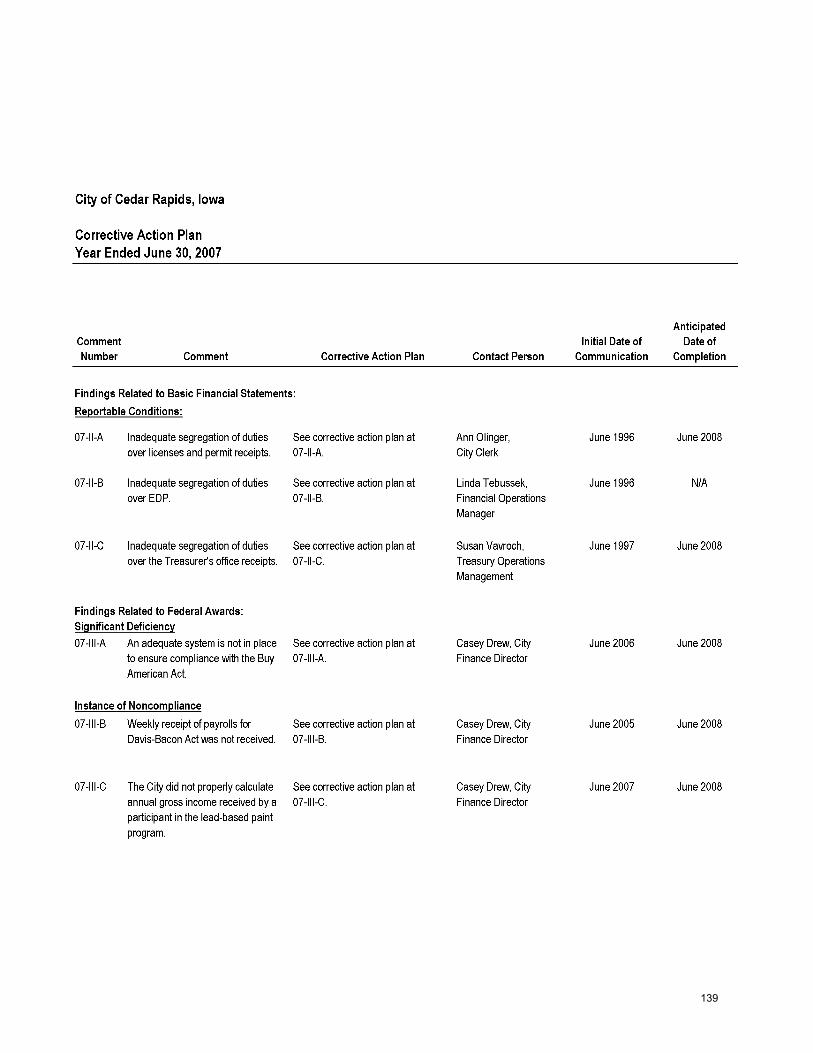
139