Embed Size (px)
Citation preview


CITY COUNCIL REPORT
TO: Ed Zuercher
City Manager
FROM: Jeff Barton
Budget and Research Director
SUBJECT: 2016-17 CITY MANAGER’S PROPOSED BUDGET
This report transmits the balanced 2016-17 City Manager’s Proposed Budget, which includes:
1. The elimination of over 119 vacant positions and other administrative savings actions totaling approximately $11.1 million.
2. A $0.35 increase to the secondary property tax rate to generate approximately $37 million needed to address ongoing debt service payments allowing the use of the General Fund surplus for other uses as described.
3. No service reductions and some General Fund (GF) additions for critical public safety enhancements; the first two-years of employee compensation restoration; partial restoration of prior cuts and expanded services; Additional Support for Youth and Veterans; as well as non-General Fund additions for important community services in Transit, Parks, Planning and Development, Sanitation and Street Transportation.
4. Hiring of 145 Police Officers and 36 Firefighters, increasing the City’s sworn Police and Fire forces, even while balancing the Public Safety Funds as called for in the Council-adopted multi-year plan.
THE ISSUE
Staff presented the Trial Budget to the Mayor and City Council on March 22, 2016. For the first time ever, the Trial Budget included five alternate options to balance the GF Budget. These options included:
1. Floating the secondary property tax rate by up to $0.35 to preserve GF services and to partially restore employee compensation
2. Identifying other revenue sources to maintain the current property tax rate and to partially restore employee compensation
3. Using the GF surplus to maintain the current property tax rate for two years
4. Using the GF surplus to maintain the current property tax rate for one year and to partially restore employee compensation
5. Reducing GF programs and services by $37 million to maintain the current property tax rate and to partially restore employee compensation

General Fund Trial Budget Additions: Over the course of the last few months and as part of the Trial Budget, City Staff and Council have discussed several key areas that must be addressed in the 2016-17 budget. These issues included debt service and property tax; critical public safety needs; employee compensation; and community needs for increased service. As part of the Trial Budget, the City Manager recommended increasing the secondary property tax rate by $0.35 and using the $60 million GF surplus to address the following areas:
Public Safety Enhancement: Additional funding for a multi-year plan to implement a body camera program; one-time funding needed to replace the obsolete Emergency Transportation System (ETS) billing system with an electronic billing and records system known as Electronic Patient Care Records (ePCR); funding to finance the repair and replacement of the road and obsolete radio tower at North Mountain; and funding for a Police psychologist for an Employee Assistance and Wellness program.
Partial Restoration of Employee Concessions: The City continues to negotiate with labor units on the development of labor contracts for FY 2016-17 and FY 2017-18. Current labor contracts expire June 30, 2016, and include the continuation of approximately 4.2% in ongoing concessions that date back to FY 2010-11. The GF cost to restore the 2.6% of these concessions for all labor units is approximately $44 million. The 2016-17 City Manager’s Trial Budget reflects the funding needed to partially restore employee compensation over the next two years. Negotiations with labor groups are ongoing and will be concluded by May 17.
Partial Restoration of Prior Cuts and Expanded Services: Increased funding for electronic media for the library; partial restoration of blight maintenance in the Right-of-Way; partial restoration of arts grants; enhanced air quality monitoring by restoring a position that was previously eliminated.
Additional Support for Youth and Veterans: Additional funding for the operating costs associated with the Chavez Park expansion; additional programming for disengaged youth in areas without a community center; funding needed to further address chronic veteran’s homelessness; and funding to initiate a Veteran’s Entrepreneurship Program.
Public Involvement and Feedback: Following the Trial Budget presentation, fifteen community budget hearings were held throughout the City in all Council districts to present the Trial Budget and gather feedback from the public. Two new locations were used this year: Pilgrim Rest Baptist Church in a citywide forum hosted by Mayor Stanton, and Country Place Elementary School in southwest Phoenix hosted by Councilman Nowakowski. Additionally, citywide hearings were held for Spanish-language speakers and youth.
Attendance at budget hearings and comments on the budget through other channels was strong. In all, approximately 350 (unduplicated) individuals spoke at the hearings and approximately 200 comments were received via e-mail. Public comments at the budget hearings mostly focused on the following topics:
Restoring employee concessions

Hiring of Police Officers and Firefighters
Increased library access and expanded hours
Increasing youth programs and access to technology
Funding for arts and public art maintenance
Increased funding for homelessness
Increased funding for street maintenance and repair
Increased funding for community centers and senior programs
Options for addressing voter registration challenges Of the 350 individual speakers who attended the budget hearings at least 106 stated that they “supported either a property tax increase or some other revenue increase to balance the budget”. Several speakers advocated that if Option 5 were selected that cuts to arts and cultural facilities, seniors, homeless services, public safety, and youth were unacceptable. Not all of the 350 speakers specified which budget option they supported. Of those who did (109), the results were as follows:
Budget Option # of supporters % of total Option 1 92 84.0% Option 2 14 13.0% Option 3 0 0% Option 4 0 0% Option 5 3 3.0%
Total 109 100% Of the 200 comments received via email, 182 or approximately 91% were to express support for increased or expanded library service. The remaining comments expressed support for option 1 or other tax increases (5); support for employee restoration (2); and increased public safety funding (2). The rest of the email comments expressed support for other items such as seniors, arts, homelessness, and parks and youth services. The public can access the written minutes and video recordings of completed budget hearings, including speaker comments and questions at phoenix.gov/budget.
Proposed Changes to the Trial Budget: Community input at budget hearings is a critical component of the City’s Trial Budget process. Each year the City Manager’s Proposed Budget is developed based on the feedback and input obtained during the community budget hearings. The feedback received this year and discussed earlier in this report focused on employee compensation, public safety, library services, youth programming, and arts funding. The City Manager’s Proposed Budget includes additional funding to address these areas where possible.
These additions were made possible due to a reduction in the estimated financing costs of the North Mountain Road and Radio Tower Project. Because of the City’s high Bond Rating and our ability to leverage this project with other projects, the annual costs have been reduced by approximately $285,000. Using these savings, the City Manager’s Proposed Budget reflects the following additions:

Additional Library Funding for Children and Teen Programming: Add $50,000 to engage youth in educational activities by providing programming at branches in high-need areas throughout the city. Programs would include computer coding, STEAM activities, resume building, and job readiness training.
Additional Funding for Parks Disengaged Youth Programming: Increase funding originally proposed in the Trial Budget by $50,000 to further enhance programming for youth in high-need areas without recreation facilities.
Arts Grants and Arts Maintenance: Restore funding originally proposed for arts grants by an additional $10,000. This provides for a total increase of $60,000 for arts grants and restores arts grants funding to approximately 94% of the peak level of General Fund support. Additionally the proposed budget adds $25,000 to assist with the maintenance of the City’s extensive public art collection in the community.
Additional Funding for Homelessness: Restore funding for Central Arizona Shelter Service (CASS) by $25,000. This restores General Fund support of CASS to approximately 89% of peak levels. This will result in an increase in the overall quality of case management services to clients served on the Human Services Campus.
Laveen/Estrella Loop 202 Economic Development Program Manager: Add a position to target specific high-wage sectors, such as Advanced Manufacturing and Advanced Business Services, for development along the future Loop 202 Laveen and Estrella Villages. The position will be focused on attracting quality, high-wage, manufacturing and export-oriented development to the area in advance of, and in concurrence with, the new Loop 202, spanning from the I-10 in west Phoenix south to the area just south of Baseline Road, along the north/south alignment in West Phoenix.
Although other community needs are not able to be addressed in this budget due to lack of available funding, the City will continue to examine how these requests, such as concerns about voting access, from residents may be addressed in the future. A high level summary of the City Manager’s Proposed Budget can be found in Attachment A. Additional detail on the proposed additions can be found in Attachment B.
Non-General Fund Additions: Significant services to the City are provided through non-General Fund resources. There are Special Revenue funds like voter-approved Public Safety and Transit taxes, and Enterprise Funds like Aviation and Solid Waste. The City Manager’s Proposed Budget also includes the following critical non-General Fund service additions, which are described in more detail in Attachment C:
Development Services Fund: In order to meet the needs of expected increases in development activity, Planning and Development proposes to add eight new positions to support the increased demand for development services.
Phoenix Parks and Preserves Initiative Fund (PPPI): The PPPI fund includes proposed additions to operate and maintain the new facilities at Lindo Park and the dog park at Esteban Park.
Solid Waste: Solid Waste proposes to add fifteen positions and equipment needed to support the Curbside Green Organics, Diversion and Illegal Dumping programs.

TRANSIT 2050: Increase bus service in the City of Phoenix as a result of funding from the Phoenix Transportation 2050 Plan. The service increases include progressively longer hours of bus operations seven days a week for all routes.
OTHER INFORMATION
General Fund: As reflected in the five-year forecast, rising pension costs are expected to continue to place significant pressure on the General Fund Budget. The growth in City of Phoenix Employee Retirement System (COPERS) costs is tied to recent actuarial changes that changed previous assumptions related to mortality rates, plan earnings and payroll growth. However the pension reform measures enacted by the City Council and approved by Phoenix voters mean these short-term increases are anticipated to slow over time and will result in savings of approximately $1.1 billion over the next two decades. Like COPERS, the costs of sworn Police and Fire pensions are also expected to increase over the next few years due to actuarial changes, pending court challenges and system funding issues. However proposed state Public Safety Personnel Retirement System (PSPRS) reforms are expected to reduce contribution rates in the future and save the system billions of dollars over the next two decades.
The forecast presented by staff also discussed other potential budget challenges the City may face over the next few years including potential actions by the state that could reduce ongoing City revenue and/or increase ongoing City costs. The five-year forecast provides City Council and staff time to develop prudent and reasonable fiscal policies to address these challenges in advance.
The proposed balanced 2016-17 General Fund budget is $1,222,155,000. This is a 5.7 percent increase from the adopted 2015-16 General Fund budget of $1,156,540,000. It is $22.9 million, or 1.9 percent, above the 2007-08 peak amount of $1,199,298,000 for the General Fund.
Projected General Fund revenue in 2016-17 is estimated to be $1.102 billion, an annual increase of 3.1 percent over the revised current year estimate. This reflects continued City and State sales tax growth based on projections from the University of Arizona, increased income tax collections and continued growth in vehicle license tax revenue.
Including revenue along with the estimated beginning fund balance of approximately $102 million, and fund transfers and recoveries estimated at $18 million, total 2016-17 General Fund resources are estimated to be $1.222 billion.
All Funds: For all funds, which include General, Enterprise and Special Revenue Funds such as grants, and all debt service and pay-as-you-go capital costs, the proposed 2016-17 budget amount is $3,697,495,000. This is a -0.13 percent decrease from the adopted 2015-16 budget of $3,702,298,000 for all funds. The 2016-17 All Funds budget is below the 2008-09 budget of $3,735,754,000 for all funds by $38.3 million, or -0.9 percent.
Extensive budget detail for all City funds is provided in several schedules in Attachment D to this report. The various budget schedules include:
Resources and expenditures by fund for 2014-15 actual, 2015-16 estimate, and 2016-17 proposed budget

Proposed revenues for all City funds by major source Proposed expenditures by department, including fund source Proposed debt service by program, source of funds, and expense type Preliminary pay-as-you-go 2016-17 Capital Improvement Program budget Proposed interfund transfers Proposed full-time equivalent (FTE) positions by department Preliminary 2016-17 Capital Improvement Program resources and expenditures
by capital fund, program, and fund source Summary of proposed property tax levy and rate information
NEXT STEPS
The City Manager’s Proposed Budget is presented for information and discussion only at the May 3, 2016 City Council meeting. The Council and public have two weeks to review and comment on the proposal, and the 2016-17 budget is scheduled for Council action on the May 17, 2016 Policy agenda. Final decisions on labor contracts will be incorporated at that time. Following the Council’s budget action on May 17, both the City Charter and state law require subsequent public notification, advertising, and City Council actions. The May 17 Council action provides staff with direction and sufficient time to prepare the required legal publications for the following actions:
June 1, 2016 Formal meeting: public hearing, adoption of tentative budget ordinances and five-year capital improvement program resolution
June 15, 2016 Formal meeting: 2nd public hearing and adoption of formal budget ordinances
July 1, 2016 Formal meeting: adoption of property tax levy ordinance
RECOMMENDATION
No action is requested at this time. Action on the 2016-17 budget is scheduled for the May 17, 2016 meeting.
ATTACHMENTS
Attachment A- City Manager’s Proposed Budget Summary
Attachment B- General Fund Additions
Attachment C- Non-General Fund Additions
Attachment D- Various Budget Schedules

REVISED ATTACHMENT A
2016-17
City Manager's
Budget
Total Resources 1,222,155,000
Total Expenditures 1,162,005,000
Available Surplus 60,150,000
Recommended Additions and Set-Asides:
Public Safety Enhancement
*Police Body Cameras (Year 1) 600,000
*Police Body Cameras (Partial Set-Aside for Years 2-5)** 4,800,000
Fire Electronic Patient Records System (ePCR) 2,800,000
*North Mountain Road and Radio Tower (Annual Debt Service Payment) 715,000
Employee Assistance and Wellness 173,000
Security Training and Emergency Notification System 50,000
Partial Restoration of Prior Concessions
Employee Compensation Costs (Year One Cost) 20,000,000
Employee Compensation Costs (Year Two Cost Set-Aside) 30,000,000
Partial Restoration of Prior Cuts and Expanded Services
Electronic Media for Library 100,000
Blight Maintenance for Unimproved Right-of-Way and Other Areas 135,000
*Arts Grants 60,000
*Arts Maintenance 25,000
Air Quality Specialist 88,000
*Additional Funding for Central Arizona Shelter Service (CASS) 25,000
*Loop 202 Laveen/Estrella Economic Development Program Manager 125,000
Additional Support for Veterans and Youth
Operating Costs for Chavez Park 54,000
Disengaged Youth Program 150,000
*Additional Funding for Disengaged Youth Programming 50,000
*Library Funding for Children and Teen Programming 50,000
Veterans Homelessness 100,000
Veterans Entrepreneurship Fund 50,000
Total of Recommended Additions and Set-Asides 60,150,000
Updated Balance -
*Highlighted entries reflect items that have changed since Trial Budget
** Partial set-aside for years 2 through 5; estimated ongoing annual cost is $5.0M starting in Year 5
CITY MANAGER'S PROPOSED BUDGET (Trial Budget Option 1)
• Property Tax Revenues Increased to Close Debt Service Gap
• Public Safety Enhancements
• 4.2% Employee Compensation Restoration Over 3 Years (2.9% in Set Aside)
• Other Service Restorations and Additions

ATTACHMENT B
2016-17 PROPOSED SUPPLEMENTALS
GENERAL FUND
PUBLIC SAFETY ENHANCEMENT
Department 2016-17
Fire
Program: Emergency Transportation Services 1. Add funding to replace the obsolete Emergency Transportation
(ETS) billing system with an electronic billing and records system (ePCR). The billing solution currently used by the department is antiquated and paper-based. Next year major insurance carriers, including Medicare and Medicaid, will begin withholding payment and charging providers for not having an electronic billing system. This will result in lost revenue to the General Fund as ETS currently brings in approximately $36 million annually.
2,800,000-
Total Fire $2,800,000-
Police
New Program: Body Worn Camera Unit 1. Add funding for the first year of a three-year plan to implement a
body camera program. A fully functional and operational body camera program will require approximately 2,000 cameras and between 30 and 40 additional staff in the Police and the City Prosecutor’s Office to manage and process video for use in the judicial process. This first phase adds 700 cameras, fourteen support positions for Police and the City Prosecutor’s Office and contract cloud storage of the video.
2,400,00014.0
Administration 2. Add a Police Psychologist to provide counseling, crisis
intervention and psychology consultation services for department staff. Recent local and national events have shed light on the importance of wellness and safety of law enforcement employees. Most major law enforcement agencies have a similar position.
173,0001.0
Total Police $2,573,00015.0

Information Technology Program: Radio Communications (Capital Improvement Project)
1. Add funding to repair the road and radio communications tower located at North Mountain. The tower is a major component of the Regional Wireless Cooperative Network (RWC) that supports our first responders as well as many public safety entities across the valley and state. This project will be reflected as a Capital Improvement Project and the funding reflects annual debt service costs. The total estimated cost of this project is approximately $7 million.
715,000-
Total Information Technology $715,000
- Office of Homeland Security & Emergency Management Program: Homeland Security and Emergency Management 1. Add an Emergency Management Training and Exercise
Coordinator position to assist with emergency planning, training and overall preparedness of the City. The cost for this position will be offset with the reallocation of funds currently provided to Maricopa County for emergency planning and grants funds.
-1.0
Program: Homeland Security and Emergency Management 2. In an effort to improve emergency preparedness and to enhance
the dissemination of information during a major event, the City must implement an emergency notification system.
50,000-
Total Office of Homeland Security & Emergency
Management $50,000
1.0

PARTIAL RESTORATION OF PRIOR CUTS AND INCREASED SERVICES
Community and Economic Development
Program: Business Attraction Program 1. Add funding to target specific high-wage sectors, such as
Advanced Manufacturing and Advanced Business Services, for development along the future Loop 202 in the West Valley. An Economic Development Program Manager will be added to focus on attracting development to the area in advance of, and in concurrence with, the new Loop 202, spanning from south of I-10 to the area just south of Baseline Road, along the north/south alignment in West Phoenix.
125,0001.0
Total Community and Economic Development $125,0001.0
Human Services
Program: Central Arizona Shelter Services (CASS) Contract 1. Restore funding for Central Arizona Shelter Services by over 3%.
This funding restores approximately 89% of the peak level of General Fund support for the contract to CASS. This will result in an increase in the overall quality of case management services to clients served on the Human Services Campus.
25,000-
Total Human Services $25,000-
Library
Program: Collection Development and Processing 1. Increase funding for e-materials checked out by users. This
represents a 22% increase in these types of e-materials. This funding provides the library with an alternate method of delivering services to patrons following reductions to branch hours in 2009- 10 and 2010-11.
100,000-
Total Library $100,000-

Office of Arts and Culture Program: Arts Grants Services and Community Initiatives
Program 1. Restore funding for arts grants by almost 9%. This funding
restores approximately 94% of the peak level of GF support of the Arts Grant Program.
60,000-
Program: Public Art Program 2. Increase funding for the maintenance of the City’s public art
installations by 51%. This would more than fully restore arts preservation funding to pre-recession levels.
25,000-
Total Office of Arts and Culture $85,000
- Office of Environmental Programs Program: Pollution Prevention 1. Restore an Environmental Quality Specialist position to provide
oversight and support for the City’s air quality and climate resiliency programs.
88,0001.0
Total Office of Environmental Programs
$88,000
1.0
Street Transportation Program: Street Maintenance
1. Restore funding for contracted street maintenance services for unimproved right-of-way, city-owned lots, and under/overpasses. This will reduce weeds, litter, and other debris in these areas.
135,000-
Program: Transportation & Drainage Design & Construction
2. Convert a temporary Principal Engineering Technician (PET) position to assist with additional Capital Improvement Program (CIP) pavement preservation and Americans with Disabilities Act (ADA) projects for the Street Maintenance Division.
--

Program: On-Street Parking Program 3. Install 300 new Smart Parking Meters, expanding the footprint of
parking meters north of Downtown in the Roosevelt Row and Evans Churchill neighborhoods. These new meters have been directly requested by businesses in the area that believe unrestricted on-street parking is detrimental in the face of increased usage of the area. New operating costs will be offset by additional revenue.
--
Total Street Transportation
$135,000
- ADDITIONAL SUPPORT FOR VETERANS AND YOUTH
Community and Economic Development
Program: Business Attraction Program 1. Add funding to support entrepreneurship among veterans.
Funding will support incubator and accelerator space, mentoring, business planning and other educational and networking events on an ongoing basis to promote and facilitate business ownership among veterans.
50,000-
Total Community and Economic Development $50,000
- Human Services Program: Emergency Shelter Grant (ESG) Contracts
1. Add funding to provide essential services to achieve the City’s commitment to ending Veteran Homelessness in Phoenix. Phoenix was the first city in the nation to end Chronic Veteran Homelessness. The City of Phoenix is one of 25 Cities selected by the U.S. Department of Housing and Urban Development, the U.S. Department of Veterans Affairs and the Interagency Council on Homelessness to participate in a National effort to end Veterans Homelessness. As part of the “25 Cities Initiative”, the City of Phoenix is leading a regional team to achieve this goal. As of February 1, 2016, over 700 homeless Veterans had been identified in the region. This request will support 2 contract peer navigators that will assist in housing up to 45 homeless veterans within an average of 90 days of engagement.
100,000-
Total Human Services Department $100,000
-

Library Program: Children and Teen Services
1. Add funding to engage youth in educational activities by providing programming at branches in high-need areas throughout the city. Programs would include computer coding, STEAM activities, resume building, and job readiness training.
$50,000-
Total Library $50,000
- Parks and Recreation
Program: Parks Maintenance 1. Add part-time staff and materials to maintain the Chavez Park
expansion area opening this spring. The expansion area includes lit soccer fields, a performance stage, and family-style ramadas.
54,0001.0
New Program: Youth Engagement Services
2. Add part-time staff, technology equipment and recreation supplies to provide after-school programs for youth in high-need areas without recreation facilities. Programs could include computer coding, resume building, job readiness training, STEAM programming, recreational opportunities for arts and crafts, physical activity, team building, and open recreation/play.
200,0004.0
Total Parks and Recreation $254,000
5.0 Total Proposed General Fund Additions $7,150,000
23.0

ATTACHMENT C
2016-17 PROPOSED SUPPLEMENTALS
NON-GENERAL FUND
Department 2016-17
Community and Economic Development
Program: Business Workforce Development 1. Add funding to expand the City’s ability to enhance job training
and hiring opportunities for city residents in the Business Workforce Youth Program.
73,0001.0
Total Community and Economic Development $73,0001.0
Parks and Recreation
Program: Park Maintenance 1. Add staff and materials to operate and maintain the new dog park
at Esteban Park, which recently opened. 58,000
1.0
Program: General Recreation 2. Add staff and materials to operate and maintain the new Lindo
Park facility opening in October 2016. This facility is multi-generational and will provide classes for seniors and youth recreational programming. In addition, this facility offers a community meeting room, a teen room, a recreation room, and a computer lab.
76,0002.4
Total Parks and Recreation $134,0003.4
Phoenix Community Development and Investment Corporation (PCDIC)
Program: New Market Tax Credit 1. Add funding for one Accountant III position and one
Administrative Assistant I position to provide support to assist in maintaining regulatory compliance requirements as a 501(c)(3) non-profit public charity.
159,0002.0
Total Phoenix Community Development and Investment Corporation
$159,0002.0
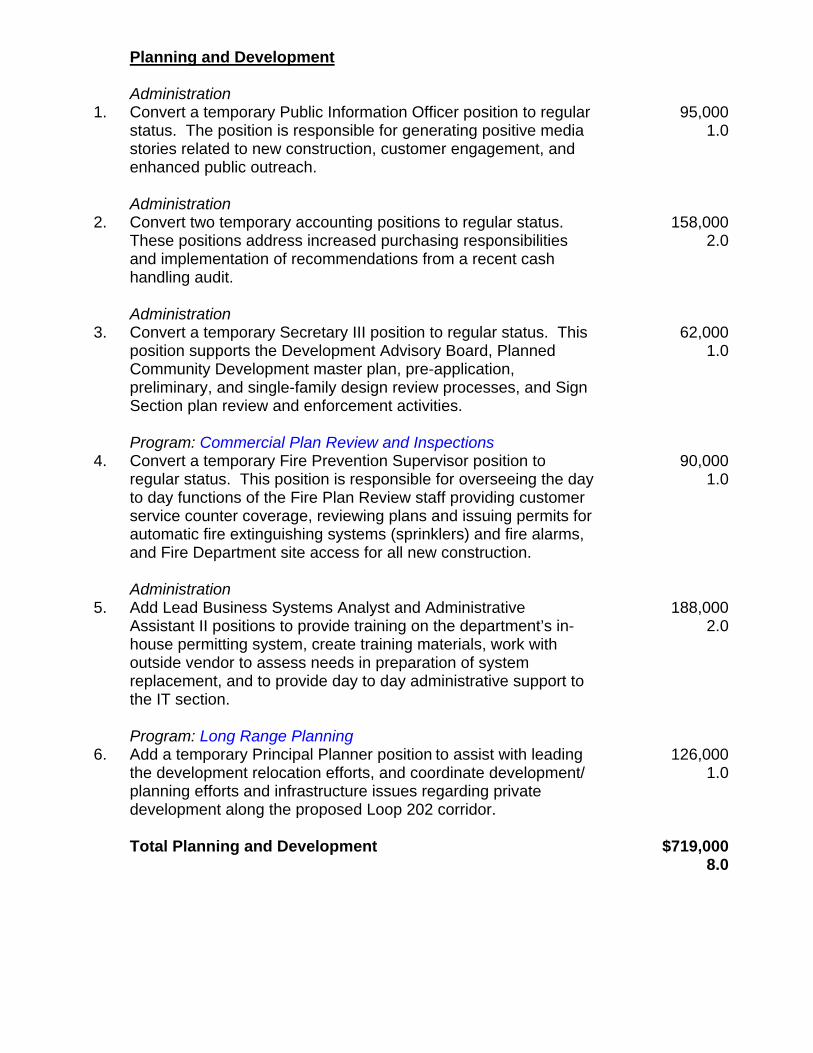
Planning and Development Administration
1. Convert a temporary Public Information Officer position to regular status. The position is responsible for generating positive media stories related to new construction, customer engagement, and enhanced public outreach.
95,0001.0
Administration
2. Convert two temporary accounting positions to regular status. These positions address increased purchasing responsibilities and implementation of recommendations from a recent cash handling audit.
158,0002.0
Administration
3. Convert a temporary Secretary III position to regular status. This position supports the Development Advisory Board, Planned Community Development master plan, pre-application, preliminary, and single-family design review processes, and Sign Section plan review and enforcement activities.
62,0001.0
Program: Commercial Plan Review and Inspections
4. Convert a temporary Fire Prevention Supervisor position to regular status. This position is responsible for overseeing the day to day functions of the Fire Plan Review staff providing customer service counter coverage, reviewing plans and issuing permits for automatic fire extinguishing systems (sprinklers) and fire alarms, and Fire Department site access for all new construction.
90,0001.0
Administration
5. Add Lead Business Systems Analyst and Administrative Assistant II positions to provide training on the department’s in-house permitting system, create training materials, work with outside vendor to assess needs in preparation of system replacement, and to provide day to day administrative support to the IT section.
188,0002.0
Program: Long Range Planning
6. Add a temporary Principal Planner position to assist with leading the development relocation efforts, and coordinate development/ planning efforts and infrastructure issues regarding private development along the proposed Loop 202 corridor.
126,0001.0
Total Planning and Development $719,000
8.0
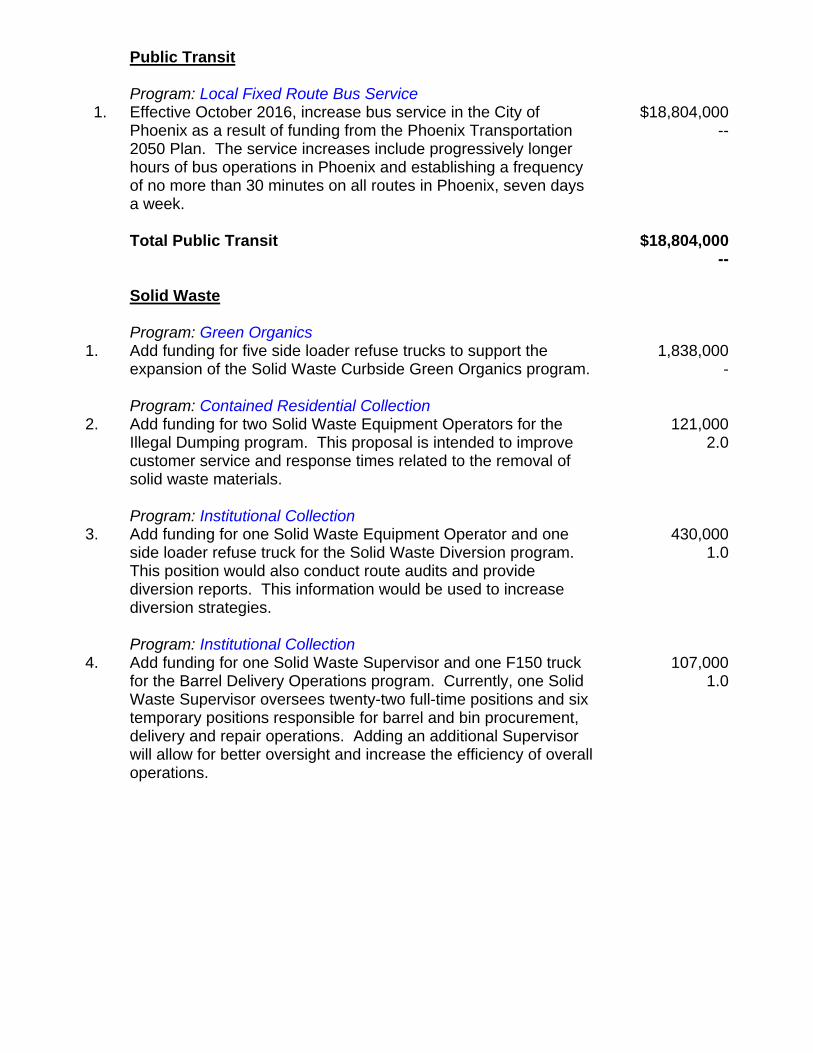
Public Transit Program: Local Fixed Route Bus Service
1. Effective October 2016, increase bus service in the City of Phoenix as a result of funding from the Phoenix Transportation 2050 Plan. The service increases include progressively longer hours of bus operations in Phoenix and establishing a frequency of no more than 30 minutes on all routes in Phoenix, seven days a week.
$18,804,000--
Total Public Transit $18,804,000
--
Solid Waste Program: Green Organics 1. Add funding for five side loader refuse trucks to support the
expansion of the Solid Waste Curbside Green Organics program. 1,838,000
- Program: Contained Residential Collection 2. Add funding for two Solid Waste Equipment Operators for the
Illegal Dumping program. This proposal is intended to improve customer service and response times related to the removal of solid waste materials.
121,0002.0
Program: Institutional Collection 3. Add funding for one Solid Waste Equipment Operator and one
side loader refuse truck for the Solid Waste Diversion program. This position would also conduct route audits and provide diversion reports. This information would be used to increase diversion strategies.
430,0001.0
Program: Institutional Collection 4. Add funding for one Solid Waste Supervisor and one F150 truck
for the Barrel Delivery Operations program. Currently, one Solid Waste Supervisor oversees twenty-two full-time positions and six temporary positions responsible for barrel and bin procurement, delivery and repair operations. Adding an additional Supervisor will allow for better oversight and increase the efficiency of overall operations.
107,0001.0

Program: Green Organics 5. Reallocate a portion of the existing Composting Facility funding to
add three Solid Waste Workers, one Laborer, one Solid Waste Foreman, three Equipment Operator IV’s, one Solid Waste Equipment Operator, one Solid Waste Supervisor and one Support Services Aide to maintain the City’s new compost facility operations. This request shifts a portion of existing contractual services funding to fund eleven new full time positions to enhance operations. The Composting Facility’s operations will be a combination of City staff and contractual services.
-11.0
Total Solid Waste $2,496,000
15.0 Street Transportation Program: Transportation Planning
1. Add a temporary Assistant to the City Manager position to lead a multidisciplinary team and directly interact with Arizona Department of Transportation (ADOT) officials to protect Phoenix’s best interests during design and construction of the South Mountain (Loop 202) Freeway extension. The position will also lead the coordination of Phoenix’s extensive involvement relating to streets, storm sewer/drainage, dry/wet utilities, construction traffic control activities, right-of-way, relocations, residential/commercial demolitions, neighborhood impacts, coordination of final design, verification of environmental commitments, construction oversight, transportation network/project connectivity, and other issues.
188,0001.0
Total Street Transportation $188,000
1.0
Housing Administration 1. Convert a temporary Accountant III position within Housing’s
Central Office to full-time regular status. -
1.0 Total Housing $-
1.0

Human Resources Program: Benefits
1. Convert a temporary Benefits Analyst II position charged to the Deferred Compensation Plan Trust to regular status.
--
Total $-
- Water Services Administration
1. Reclassify a temporary Special Project Administrator to a Deputy Water Services Director position overseeing the Business Analytics and Technology Services sections.
(73,000)-
Administration
2. Convert a temporary Water Service Project coordinator position in the Technology Services section to regular status.
--
Total Water Services $(73,000)
- Total Proposed Supplementals $22,500,000
31.4

Beginning Ending
Fund Fund Transfer Debt Fund
Balances Revenue1/ Recovery To From Total Operating Capital Service Total Balances
General Funds:
General 78,579$ 253,494$ 891$ 802,370$ 106,070$ 1,029,264$ 927,478$ 1,351$ -$ 928,829$ 100,435$
Parks and Recreation - 16,050 48 68,538 - 84,636 84,636 - - 84,636 -
Library - 36,621 7 - 2,659 33,969 33,911 58 - 33,969 -
Cable Communications - 9,574 23 - 5,636 3,961 3,961 - - 3,961 -
Total General 78,579$ 315,739$ 969$ 870,908$ 114,365$ 1,151,830$ 1,049,986$ 1,409$ -$ 1,051,395$ 100,435$
Special Revenue Funds:
Excise Tax -$ 1,074,261$ -$ -$ 1,074,261$ -$ -$ -$ -$ -$ -$
Nghbrhd Protection-Police (4,978) (15) - 20,917 218 15,706 13,026 - - 13,026 2,680
Nghbrhd Protection-Fire 8,523 77 - 7,470 8 16,062 4,482 - - 4,482 11,580
Nghbrhd Protection-Block Watch 2,564 207 - 1,494 2 4,263 1,461 - - 1,461 2,802
2007 Public Safety Exp-Police (18,804) (126) 1 47,808 512 28,367 39,109 - - 39,109 (10,742) 2/
2007 Public Safety Exp-Fire 1,340 16 - 11,952 88 13,220 9,416 - - 9,416 3,804
Public Safety Enhance-Police (10,525) 8 - 15,542 204 4,821 9,914 - - 9,914 (5,093) 2/
Public Safety Enhance-Fire (1,224) - 1 9,526 - 8,303 6,107 - - 6,107 2,196
Parks and Preserves 30,270 371 486 29,882 4,564 56,445 3,351 13,807 - 17,158 39,287
Transit 2000 295,929 54,620 838 110,347 48,420 413,314 125,311 15,208 - 140,519 272,795
Court Awards 761 7,774 4 - - 8,539 4,928 155 - 5,083 3,456
Development Services 28,437 42,633 2 - 2,782 68,290 34,184 475 - 34,659 33,631
Capital Construction 5,659 69 242 14,281 - 20,251 206 16,880 - 17,086 3,165
Sports Facilities 23,911 289 - 18,086 195 42,091 2,036 987 20,807 23,830 18,261
AZ Highway User Revenue 18,657 112,307 413 1,009 3,830 128,556 48,282 39,066 - 87,348 41,208
Regional Transit (4,572) 31,477 168 - - 27,073 27,414 13,569 - 40,983 (13,910) 3/
Community Reinvestment 15,714 5,047 4 - 2,068 18,697 502 5,084 - 5,586 13,111
Secondary Property Tax 279 54,283 - - - 54,562 - - 54,462 54,462 100
Impact Fee Program Admin 793 272 - - - 1,065 115 - - 115 950
Regional Wireless Cooperative 2,132 4,814 - - - 6,946 4,065 - - 4,065 2,881
Golf Course (4,532) 6,217 9 4,532 - 6,226 6,226 - - 6,226 -
City Improvement - - - 142,213 61,628 80,585 - - 80,579 80,579 6
Other Restricted Funds 53,099 24,469 52 6,215 1,395 82,440 21,344 348 - 21,692 60,748
Grant Funds 14,631 233,679 1,422 - 197 249,535 194,589 42,867 - 237,456 12,079
Total Special Revenue 458,064$ 1,652,749$ 3,642$ 441,274$ 1,200,372$ 1,355,357$ 556,068$ 148,446$ 155,848$ 860,362$ 494,995$
Enterprise Funds:
Aviation 319,159$ 339,733$ 2,368$ 16,131$ 55,678$ 621,713$ 226,147$ 17,719$ 50,560$ 294,426$ 327,287$
Water 136,623 370,886 706 201 19,478 488,938 160,412 116,868 113,969 391,249 97,689
Wastewater 89,241 211,389 818 - 12,489 288,959 81,495 38,892 58,063 178,450 110,509
Solid Waste 57,763 148,384 17 2,922 13,114 195,972 107,722 25,039 15,419 148,180 47,792
Convention Center 32,487 22,165 28 47,034 2,476 99,238 40,708 2,839 17,192 60,739 38,499
Total Enterprise 635,273$ 1,092,557$ 3,937$ 66,288$ 103,235$ 1,694,820$ 616,484$ 201,357$ 255,203$ 1,073,044$ 621,776$
GRAND TOTAL 1,171,916$ 3,061,045$ 8,548$ 1,378,470$ 1,417,972$ 4,202,007$ 2,222,538$ 351,212$ 411,051$ 2,984,801$ 1,217,206$
1/ General fund sales tax revenue is reflected as a transfer from the excise tax fund. Total transfer equates to $736.9 million, and is included in the General Funds revenue total of
$1,052.6 million shown on Schedule 2.
2/ The dedicated public safety funds have been severely impacted by declines in sales tax revenues. In November 2010, the Mayor and City Council adopted a plan to balance these
funds as soon as possible using an attrition approach. This plan is modified annually to account for changes in attrition and revised revenue forecasts. In FY 2016-17 staff plans to
rebalance each fund to ensure a positive fund balance by year-end.3/ The negative fund balance in Regional Transit is due to less than anticipated revenues caused by timing delays in reimbursements for project costs from the regional transportation
plan (Proposition 400). The reimbursements are expected to be received in FY 2015-16 and will resolve the negative ending balance.
2014-15 SCHEDULE 1
RESOURCES AND EXPENDITURES BY FUND
ACTUAL
(In Thousands of Dollars)
Resources Expenditures
ATTACHMENT D

Beginning Ending
Fund Fund Transfer Debt Fund
Balances Revenue1/ Recovery To From Total Operating Capital Service Total Balances
General Funds:
General 100,435$ 260,472$ 1,000$ 811,748$ 128,259$ 1,045,396$ 939,430$ 3,920$ -$ 943,350$ 102,046$
Parks and Recreation - 16,069 - 70,263 - 86,332 86,332 - - 86,332 -
Library - 36,397 - - 2,006 34,391 34,191 200 - 34,391 -
Cable Communications - 9,772 - - 5,475 4,297 4,297 - - 4,297 -
Total General 100,435 322,710 1,000 882,011 135,740 1,170,416 1,064,250 4,120 - 1,068,370 102,046
Special Revenue Funds:
Excise Tax -$ 1,123,799$ -$ -$ 1,123,799$ -$ -$ -$ -$ -$ -$
Nghbrhd Protection-Police 2,680 23 - 19,954 227 22,430 16,082 - - 16,082 6,348
Nghbrhd Protection-Fire 11,580 80 - 7,127 11 18,776 11,788 - - 11,788 6,988
Nghbrhd Protection-Block Watch 2,802 192 - 1,425 2 4,417 1,466 - - 1,466 2,951
2007 Public Safety Exp-Police (10,742) (75) - 45,612 476 34,319 36,018 - - 36,018 (1,699) 2/
2007 Public Safety Exp-Fire 3,804 17 - 11,403 83 15,141 13,842 - - 13,842 1,299
Public Safety Enhance-Police (5,093) - - 15,949 206 10,650 9,330 - - 9,330 1,320
Public Safety Enhance-Fire 2,196 - - 9,774 - 11,970 9,629 - - 9,629 2,341
Parks and Preserves 39,287 324 50 28,507 43 68,125 3,900 50,989 - 54,889 13,236
Transit 20003/ 272,795 55,577 1,000 55,915 50,964 334,323 160,201 10,615 - 170,816 163,507
Transportation 20503/ - 100 - 100,514 - 100,614 1 16,300 - 16,301 84,313
Court Awards 3,456 7,900 - - - 11,356 4,384 3,000 - 7,384 3,972
Development Services 33,631 46,686 - - 3,064 77,253 40,587 450 - 41,037 36,216
Capital Construction 3,165 65 200 12,465 - 15,895 214 13,902 - 14,116 1,779
Sports Facilities 18,261 7,844 - 19,728 275 45,558 2,199 250 22,292 24,741 20,817
AZ Highway User Revenue 41,208 114,561 400 290 - 156,459 49,653 54,346 - 103,999 52,460
Regional Transit (13,910) 65,543 - - - 51,633 28,510 23,123 - 51,633 -
Community Reinvestment 13,111 4,780 - - 2,065 15,826 380 4,589 - 4,969 10,857
Secondary Property Tax 100 54,821 - 72,003 - 126,924 - - 126,824 126,824 100
Impact Fee Program Admin 950 310 - - - 1,260 321 - - 321 939
Regional Wireless Cooperative 2,881 5,036 - - - 7,917 5,852 - - 5,852 2,065
Golf Course - 6,103 - - - 6,103 5,656 - - 5,656 447
City Improvement 6 - - 92,965 1,024 91,947 - - 91,941 91,941 6
Other Restricted Funds 60,748 28,251 - 21,356 2,452 107,903 45,518 14,418 - 59,936 47,967
Grant Funds 12,079 264,729 - - 374 276,434 206,269 64,781 - 271,050 5,384
Total Special Revenue 494,995$ 1,786,666$ 1,650$ 514,987$ 1,185,065$ 1,613,233$ 651,800$ 256,763$ 241,057$ 1,149,620$ 463,613$
Enterprise Funds:
Aviation 327,287$ 341,256$ -$ 14,622$ 51,750$ 631,415$ 234,431$ 68,084$ 52,964$ 355,479$ 275,936$
Water 97,689 395,615 - - 19,712 473,592 172,439 136,533 113,290 422,262 51,330
Wastewater 110,509 219,861 - - 12,530 317,840 87,568 51,596 76,006 215,170 102,670
Solid Waste 47,792 146,706 - - 9,283 185,215 111,283 22,672 14,434 148,389 36,826
Convention Center 38,499 17,320 - 45,919 2,784 98,954 43,104 4,485 19,014 66,603 32,351
Total Enterprise 621,776$ 1,120,758$ -$ 60,541$ 96,059$ 1,707,016$ 648,825$ 283,370$ 275,708$ 1,207,903$ 499,113$
GRAND TOTAL 1,217,206$ 3,230,134$ 2,650$ 1,457,539$ 1,416,864$ 4,490,665$ 2,364,875$ 544,253$ 516,765$ 3,425,893$ 1,064,772$
2015-16 SCHEDULE 1
RESOURCES AND EXPENDITURES BY FUND
PROPOSED ESTIMATE
(In Thousands of Dollars)
Resources Expenditures
1/ General fund sales tax revenue is reflected as a transfer from the excise tax fund. Total transfer equates to $745.8 million, and is included in the General Funds revenue total of
$1,068.5 million shown on Schedule 2.2/ The dedicated public safety funds have been severely impacted by declines in sales tax revenues. In November 2010, the Mayor and City Council adopted a plan to balance these
funds as soon as possible using an attrition approach. This plan is modified annually to account for changes in attrition and revised revenue forecasts. In FY 2016-17 staff plans to
rebalance each fund to ensure a positive fund balance by year-end.3/ The Transportation 2050 sales tax (Proposition 104) was established by the voters effective January 1, 2016 and increased the Transit 2000 sales tax (Proposition 2000) to fund a
comprehensive transportation plan with a 35 year sunset date. The Proposition increased the transaction privilege (sales) tax rates by 0.3% for various business activities.

Beginning Ending
Fund Fund Transfer Debt Fund
Balances Revenue1/ Recovery To From Total Operating Capital Service Total Balances
General Funds:
General 102,046$ 260,430$ 1,000$ 861,063$ 133,546$ 1,090,993$ 1,081,267$ 9,726$ -$ 1,090,993$ -$
Parks and Recreation - 16,510 - 74,729 - 91,239 91,239 - - 91,239 -
Library - 37,166 - 10 1,747 35,429 35,229 200 - 35,429 -
Cable Communications - 10,090 - - 5,596 4,494 4,494 - - 4,494 -
Total General 102,046$ 324,196$ 1,000$ 935,802$ 140,889$ 1,222,155$ 1,212,229$ 9,926$ -$ 1,222,155$ -$
Special Revenue Funds:
Excise Tax -$ 1,211,934$ -$ -$ 1,211,934$ -$ -$ -$ -$ -$ -$
Nghbrhd Protection-Police 6,348 23 - 20,744 215 26,900 19,459 - - 19,459 7,441
Nghbrhd Protection-Fire 6,988 80 - 7,413 7 14,474 11,123 1,290 - 12,413 2,061
Nghbrhd Protection-Block Watch 2,951 192 - 1,481 1 4,623 1,250 - - 1,250 3,373
2007 Public Safety Exp-Police (1,699) 25 - 47,415 450 45,291 48,119 - - 48,119 (2,828) 2/
2007 Public Safety Exp-Fire 1,299 20 - 11,854 76 13,097 14,750 1,290 - 16,040 (2,943) 2/
Public Safety Enhance-Police 1,320 - - 16,592 206 17,706 14,022 - - 14,022 3,684
Public Safety Enhance-Fire 2,341 - - 10,169 - 12,510 10,303 1,289 - 11,592 918
Parks and Preserves 13,236 358 50 29,634 26 43,252 4,010 27,649 - 31,659 11,593
Transit 20003/ 163,507 1,688 2,000 - 25,236 141,959 141,689 270 - 141,959 -
Transportation 20503/ 84,313 54,750 211,782 38,028 312,817 66,795 50,118 - 116,913 195,904
Court Awards 3,972 4,089 - - - 8,061 4,089 - - 4,089 3,972
Development Services 36,216 47,058 - - 3,064 80,210 52,430 255 - 52,685 27,525
Capital Construction 1,779 50 450 12,001 - 14,280 200 9,949 - 10,149 4,131
Sports Facilities 20,817 8,816 - 19,728 275 49,086 2,260 250 18,795 21,305 27,781
AZ Highway User Revenue 52,460 116,542 500 - 5,000 164,502 51,356 70,422 - 121,778 42,724
Regional Transit - 44,353 - - - 44,353 29,365 9,589 - 38,954 5,399
Community Reinvestment 10,857 5,414 - - 2,064 14,207 431 3,521 - 3,952 10,255
Secondary Property Tax 100 95,364 - 31,763 - 127,227 - - 127,127 127,127 100
Impact Fee Program Admin 939 326 - - - 1,265 471 - - 471 794
Regional Wireless Cooperative 2,065 4,967 - - - 7,032 5,084 - - 5,084 1,948
Golf Course 447 6,020 - - - 6,467 5,681 - - 5,681 786
City Improvement 6 - - 103,540 1,026 102,520 - - 102,514 102,514 6
Other Restricted Funds 47,967 29,627 - 23,512 1,680 99,426 50,570 5,753 - 56,323 43,103
Grant Funds 5,384 235,996 - - 376 241,004 210,479 28,596 - 239,075 1,929
Total Special Revenue 463,613$ 1,867,692$ 3,000$ 547,628$ 1,289,664$ 1,592,269$ 743,936$ 210,241$ 248,436$ 1,202,613$ 389,656$
Enterprise Funds:
Aviation 275,936$ 341,495$ -$ 15,000$ 8,352$ 624,079$ 260,563$ 43,120$ 54,957$ 358,640$ 265,439$
Water 51,330 420,996 - - 19,971 452,355 194,907 127,312 113,355 435,574 16,781
Wastewater 102,670 223,815 - - 12,706 313,779 104,668 57,783 70,736 233,187 80,592
Solid Waste 36,826 147,788 - - 9,307 175,307 133,626 27,436 13,086 174,148 1,159
Convention Center 32,351 17,521 - 46,726 2,705 93,893 49,087 2,325 19,766 71,178 22,715
Total Enterprise 499,113$ 1,151,615$ -$ 61,726$ 53,041$ 1,659,413$ 742,851$ 257,976$ 271,900$ 1,272,727$ 386,686$
GRAND TOTAL 1,064,772$ 3,343,503$ 4,000$ 1,545,156$ 1,483,594$ 4,473,837$ 2,699,016$ 478,143$ 520,336$ 3,697,495$ 776,342$
1/ General fund sales tax revenue is reflected as a transfer from the excise tax fund. Total transfer equates to $777.7 million, and is included in the General Funds revenue total of
$1,101.9 million shown on Schedule 2.
2/ The dedicated public safety funds have been severely impacted by declines in sales tax revenues. In November 2010, the Mayor and City Council adopted a plan to balance these
funds as soon as possible using an attrition approach. This plan is modified annually to account for changes in attrition and revised revenue forecasts. In FY 2016-17 staff plans to
rebalance each fund to ensure a positive fund balance by year-end.
3/ The Transportation 2050 sales tax (Proposition 104) was established by the voters effective January 1, 2016 and increased the Transit 2000 sales tax (Proposition 2000) to fund a
comprehensive transportation plan with a 35 year sunset date. The Proposition increased the transaction privilege (sales) tax rates by 0.3% for various business activities.
2016-17 SCHEDULE 1
RESOURCES AND EXPENDITURES BY FUND
PROPOSED BUDGET
(In Thousands of Dollars)
Resources Expenditures

Percent Increase/ Percent Increase/2014-15 2015-16 Decrease from 2016-17 Decrease from
Revenue Source Actuals Estimate 2014-15 Actuals Budget 2015-16 Estimate
GENERAL FUND
Local Taxes and Related Fees
Local Sales Tax 407,014$ 411,045$ 1.0% 425,568$ 3.5%Privilege License Fees 2,477 2,461 -0.6% 2,455 -0.2%
Other General Fund Excise Taxes 17,174 17,740 3.3% 17,963 1.3% Subtotal 426,665$ 431,246$ 1.1% 445,986$ 3.4%
State Shared Revenues
Sales Tax 132,218 137,502 4.0% 141,696 3.1%State Income Tax 175,184 174,234 -0.5% 187,210 7.4%Vehicle License Tax 55,293 58,600 6.0% 61,042 4.2% Subtotal 362,695$ 370,336$ 2.1% 389,948$ 5.3%
Primary Property Tax 138,244$ 140,363$ 1.5% 145,141$ 3.4%
User Fees/Other Revenue
Licenses & Permits 2,783 2,788 0.2% 2,786 -0.1%Cable Communications 9,574 9,772 2.1% 10,090 3.3%Fines and Forfeitures 15,676 14,320 -8.7% 14,327 0.0%Court Default Fee 897 915 2.0% 915 0.0%Fire 46,479 50,366 8.4% 45,449 -9.8%Hazardous Materials Inspection Fee 1,312 1,500 14.3% 1,550 3.3%Library Fees 947 673 -28.9% 672 -0.1%
Parks and Recreation 7,990 7,698 -3.7% 7,818 1.6%Planning 1,312 1,630 24.2% 1,680 3.1%Police 14,687 13,855 -5.7% 13,803 -0.4%Street Transportation 4,672 3,514 -24.8% 3,477 -1.1%
Other Service Charges 14,710 16,782 14.1% 15,697 -6.5%
Other 3,946 2,722 -31.0% 2,535 -6.9% Subtotal 124,985$ 126,535$ 1.2% 120,799$ -4.5%
TOTAL GENERAL FUNDS 1,052,589$ 1,068,480$ 1.5% 1,101,874$ 3.1%
SCHEDULE 2
PROPOSED REVENUES BY MAJOR SOURCE
(In Thousands of Dollars)

Percent Increase/ Percent Increase/2014-15 2015-16 Decrease from 2016-17 Decrease from
Revenue Source Actuals Estimate 2014-15 Actuals Budget 2015-16 Estimate
SPECIAL REVENUE FUNDS
Neighborhood Protection 30,150$ 28,801$ -4.5% 29,933$ 3.9%2007 Public Safety Expansion 59,650 56,957 -4.5% 59,314 4.1%Public Safety Enhancement 25,076 25,723 2.6% 26,761 4.0%Parks and Preserves 30,253 28,831 -4.7% 29,992 4.0%
Transit 20001/
164,967 111,492 -32.4% 1,688 -98.5%
Transportation 20501/
- 100,614 - 261,532 159.9%Court Awards 7,774 7,900 1.6% 4,089 -48.2%Development Services 42,633 46,686 9.5% 47,058 0.8%Capital Construction 14,350 12,530 -12.7% 12,051 -3.8%Sports Facilities 17,351 26,548 53.0% 27,518 3.7%Arizona Highway User Revenue 112,307 114,561 2.0% 116,542 1.7%Regional Transit Revenues 31,477 65,543 108.2% 44,353 -32.3%Community Reinvestment 5,047 4,780 -5.3% 5,414 13.3%Secondary Property Tax 54,283 54,821 1.0% 95,364 74.0%Impact Fee Program Administration 272 310 14.0% 326 5.2%Regional Wireless Cooperative 4,814 5,036 4.6% 4,967 -1.4%Golf Courses 6,217 6,103 -1.8% 6,020 -1.4%Other Restricted Revenues 29,197 33,012 13.1% 34,370 4.1% Grants
Public Housing Grants 77,453 89,270 15.3% 87,049 -2.5% Human Services Grants 29,249 48,522 65.9% 43,065 -11.2% Community Development 22,564 20,972 -7.1% 34,804 66.0% Criminal Justice 7,825 8,961 14.5% 4,810 -46.3% Public Transit Grants 58,552 64,436 10.0% 33,940 -47.3% Other Grants 38,036 32,568 -14.4% 32,328 -0.7% Subtotal - Grants 233,679$ 264,729$ 13.3% 235,996$ -10.9%
SUBTOTAL SPECIAL REVENUE FUNDS 869,497$ 994,977$ 14.4% 1,043,288$ 4.9%
ENTERPRISE FUNDS
Aviation 339,733 341,256 0.4% 341,495 0.1%Water System 370,886 395,615 6.7% 420,996 6.4%Wastewater System 211,389 219,861 4.0% 223,815 1.8%Solid Waste 148,384 146,706 -1.1% 147,788 0.7%Convention Center 68,567 63,239 -7.8% 64,247 1.6%
SUBTOTAL ENTERPRISE FUNDS 1,138,959$ 1,166,677$ 2.4% 1,198,341$ 2.7%
TOTAL ALL OPERATING FUNDS 3,061,045$ 3,230,134$ 5.5% 3,343,503$ 3.5%
PROPOSED REVENUES BY MAJOR SOURCE (Continued)
(In Thousands of Dollars)
1/ The Transportation 2050 sales tax (Proposition 104) was established by the voters effective January 1, 2016 and increased the Transit 2000 sales tax (Proposition
2000) to fund a comprehensive transportation plan with a 35 year sunset date. The Proposition increased the transaction privilege (sales) tax rates by 0.3% for
various business activities.
SCHEDULE 2

2016-172014-15 City Manager
Program Actual Budget Estimate Recommended Budget Estimate
General GovernmentMayor 1,460$ 1,831$ 1,831$ 1,831 0.0% 0.0%City Council 3,221 3,536 3,537 3,536 0.0% 0.0%City Manager 2,461 2,536 2,476 2,423 (4.5%) (2.1%)Government Relations 919 1,064 1,068 1,104 3.8% 3.4%
Communications Office 2,251 2,293 2,115 2,306 0.6% 9.1%City Auditor 2,036 2,440 2,450 2,765 13.3% 12.9%Equal Opportunity 2,655 2,811 2,731 2,984 6.2% 9.3%Human Resources 10,238 11,018 12,141 12,060 9.5% (0.7%)Phoenix Employment Relations Board 57 84 84 91 8.3% 8.3%Regional Wireless Cooperative 4,065 5,004 5,852 5,084 1.6% (13.1%)Retirement Systems - - - - - - Law 4,339 4,843 5,213 5,793 19.6% 11.1%
Information Technology 35,322 37,509 37,074 38,943 3.8% 5.0%City Clerk and Elections 4,003 5,070 4,761 4,717 (7.0%) (0.9%)Finance 19,205 33,347 32,640 35,192 5.5% 7.8%Budget and Research 2,742 3,057 2,726 3,270 7.0% 20.0%#DIV/0!
Total General Government 94,974$ 116,443$ 116,699$ 122,099$ 4.9% 4.6%
Public Safety
Police 549,531$ 572,949$ 573,460$ 613,816$ 7.1% 7.0%Fire 291,568 312,745 304,601 318,579 1.9% 4.6%Emergency Management 717 649 588 815 25.6% 38.6%
Total Public Safety 841,816$ 886,343$ 878,649$ 933,210$ 5.3% 6.2%
Criminal JusticeMunicipal Court 34,431$ 40,705$ 40,274$ 42,941$ 5.5% 6.6%City Prosecutor 13,720 15,196 14,428 15,616 2.8% 8.2%Public Defender 4,834 5,081 5,025 5,089 0.2% 1.3%
Total Criminal Justice 52,985$ 60,982$ 59,727$ 63,646$ 4.4% 6.6%
Transportation
Street Transportation 66,955$ 71,444$ 69,222$ 74,645$ 4.5% 7.8%Aviation 225,583 236,851 233,773 245,863 3.8% 5.2%Public Transit 239,575 263,299 256,166 296,230 12.5% 15.6%
Total Transportation 532,113$ 571,594$ 559,161$ 616,738$ 7.9% 10.3%
SCHEDULE 3
(In Thousands of Dollars)
from 2015-162015-16 Percent Change
PROPOSED EXPENDITURES BY DEPARTMENT 1

2016-172014-15 City Manager
Program Actual Budget Estimate Recommended Budget Estimate
SCHEDULE 3 (continued)
(In Thousands of Dollars)
from 2015-162015-16 Percent Change
PROPOSED EXPENDITURES BY DEPARTMENT 1
Community Development
Planning and Development 39,443$ 46,258$ 45,037$ 53,273$ 15.2% 18.3%
Housing 79,004 89,697 87,971 91,423 1.9% 3.9%
Community and Economic Development 26,366 29,497 29,163 30,456 3.3% 4.4%
Neighborhood Services 32,683 56,192 34,031 56,579 0.7% 66.3%
PCDIC - 776 710 962 24.0% 35.5%
Total Community Development 177,496$ 222,420$ 196,912$ 232,693$ 4.6% 18.2%
Community Enrichment
Parks and Recreation 99,056$ 107,016$ 102,556$ 106,417$ (0.6%) 3.8%
Library 34,727 35,778 34,763 35,734$ (0.1%) 2.8%Phoenix Convention Center 42,058 45,667 44,703 48,104$ 5.3% 7.6%
Human Services 55,928 62,030 67,126 62,959$ 1.5% (6.2%)Office of Arts and Culture 1,451 3,968 3,953 4,113$ 3.5% 4.0%
Total Community Enrichment 233,220$ 254,459$ 253,101$ 257,327$ 1.1% 1.7%
Environmental ServicesWater 241,235$ 266,725$ 259,100$ 285,125$ 6.9% 10.0%Solid Waste Management 107,370$ 121,013 110,932 131,208 8.4% 18.3%
Public Works 20,898$ 22,323 20,918 21,751 (2.6%) 4.0%Environmental Programs 1,010$ 1,113 1,235 1,412 26.9% 14.4%Office of Sustainability -$ 293 382 421 43.8% 10.2%
Total Environmental Services 370,513$ 411,467$ 392,567$ 439,917$ 6.9% 12.1%
Contingencies -$ 139,900$ -$ 135,900$ - -
GRAND TOTAL 2,303,117$ 2,663,608$ 2,456,816$ 2,801,530$ 5.2% 14.0%
1 For purposes of this schedule, department budget allocations include Grants and City Improvement debt service payments.

Special
General Enterprise Revenue
Total Funds Funds Funds1
Mayor 1,831$ 1,831$ -$ -$ City Council 3,536 3,536 - - City Manager 2,423 2,350 63 10 Government Relations 1,104 1,104 - -
Communications Office 2,306 1,953 - 353 City Auditor 2,765 2,765 - - Equal Opportunity 2,984 2,544 - 440 Human Resources 12,060 10,711 - 1,349 Phoenix Employment Relations Board 91 91 - - Regional Wireless Cooperative 5,084 - - 5,084 Retirement Systems - - - - Law 5,793 5,793 - - Information Technology 38,943 35,995 893 2,055 City Clerk and Elections 4,717 4,698 - 19 Finance 35,192 23,206 2,392 9,594 Budget and Research 3,270 3,270 - -
Total General Government 122,099$ 99,847$ 3,348$ 18,904$
Public Safety
Police 613,816$ 498,939$ -$ 114,877$ Fire 318,579 272,568 - 46,011 Emergency Management 815 92 - 723
Total Public Safety 933,210$ 771,599$ -$ 161,611$
Criminal Justice
Municipal Court 42,941$ 28,034$ -$ 14,907$ City Prosecutor 15,616 14,710 - 906 Public Defender 5,089 5,089 - -
Total Criminal Justice 63,646$ 47,833$ -$ 15,813$
Transportation
Street Transportation 74,645$ 20,084$ -$ 54,561$ Aviation 245,863 - 245,863 - Public Transit 296,230 1,651 - 294,579
Total Transportation 616,738$ 21,735$ 245,863$ 349,140$
SCHEDULE 4
2016-2017 PROPOSED EXPENDITURES BY DEPARTMENT 1
BY SOURCE OF FUNDS
(In Thousands of Dollars)
General Government
Program

Special
General Enterprise Revenue
Total Funds Funds Funds1
SCHEDULE 4 (continued)
2016-2017 PROPOSED EXPENDITURES BY DEPARTMENT 1
BY SOURCE OF FUNDS
(In Thousands of Dollars)
Program
Community Development
Planning and Development Services 53,273$ 4,306$ -$ 48,967$
Housing 91,423 55 - 91,368
Community and Economic Development 30,456 5,048 611 24,797
Neighborhood Services 56,579 12,084 - 44,495
PCDIC 962 - - 962
Total Community Development 232,693$ 21,493$ 611$ 210,589$
Community Enrichment
Parks and Recreation 106,417$ 91,238 -$ 15,179$
Library 35,734 35,229 - 505 Phoenix Convention Center 48,104 1,823 45,580 701
Human Services 62,959 18,460 350 44,149 Office of Arts and Culture 4,113 3,988 - 125
Total Community Enrichment 257,327$ 150,738$ 45,930$ 60,659$
Environmental Services
Water 285,125$ -$ 283,064$ 2,061$ Solid Waste Management 131,208 - 131,208 -
Public Works 21,751 13,495 - 8,256 Environmental Programs 1,412 666 327 419 Office of Sustainability 421 421 - -
Total Environmental Services 439,917$ 14,582$ 414,599$ 10,736$
Contingencies 135,900$ 84,402$ 32,500$ 18,998$
GRAND TOTAL 2,801,530$ 1,212,229$ 742,851$ 846,450$
1 For purposes of this schedule, department budget allocations include Grants and City Improvement debt service payments.

2016-17
2014-15 2015-16 Proposed
Program Actual Estimate Budget
Aviation 137,636$ 122,333$ 125,137$
Cultural Facilities 11,355 14,578 15,511
Economic Development 47,818 51,526 47,970
Environmental Programs 1,363 1,136 1,140
Fire Protection 6,125 4,859 4,529
Freeway Mitigation 684 400 342
Historic Preservation 554 974 712
Human Services 2,023 2,082 2,077
Information Systems 938 1,914 1,654
Libraries 7,696 7,536 6,436
Local Streets/Street Improvements/Lighting 8,813 5,103 5,086Maintenance Service Centers 1,254 1,408 1,279
Municipal Administration Building 50 895 390
Neighborhood Preservation & Senior Services Centers 11,459 12,641 12,646
Parks & Recreation/Open Space 9,509 11,410 12,564
Phoenix Convention Center 37,641 39,463 40,215
Police, Fire and Computer Tech 6,420 3,499 5,394
Police Protection 9,869 6,991 6,890
Public Housing 3,718 6,326 5,401
Public Transit 47,520 50,027 61,008
Solid Waste Disposal 15,419 14,434 13,086
Storm Sewer 11,996 15,103 15,968
Street Light Refinancing 6 6 6
Wastewater 58,063 76,006 70,736
Water 113,969 113,290 113,355
Early Redemption (66,473) - -
General Government Nonprofit Corporation Bonds 32,921 41,341 41,432
Bond Issuance Costs 1,027 3,005 1
Total Program 519,373$ 608,286$ 610,965$
Type of Expenditure
Principal 277,299$ 273,590$ 295,355$
Interest and Other 242,074 334,696 315,610
Total Debt Service Expenditures 519,373$ 608,286$ 610,965$
SCHEDULE 5
PROPOSED DEBT SERVICE EXPENDITURES
BY PROGRAM, SOURCE OF FUNDS AND TYPE OF EXPENDITURE
(In Thousands of Dollars)

2016-172014-15 2015-16 Proposed
Source of Funds Actual Estimate Budget
Operating Funds
Secondary Property Tax 54,462$ 126,824$ 127,127$
Sports Facilities 20,807 22,292 18,795
City Improvement
General 31,555 39,023 39,113
Housing 34 72 74
Transit 2000 47,520 50,069 23,022
Transportation 2050 - - 38,028
Library - 135 135
Other Operating 104 2,642 2,142
Capital Funds 1 1,366 - -
Aviation 50,560 52,964 54,957$
Convention Center 17,192 19,014 19,766
Solid Waste 15,419 14,434 13,086
Wastewater 58,063 76,006 70,736
Water 113,969 113,290 113,355
Subtotal Operating Funds 411,051$ 516,765$ 520,336$
Capital Funds
Nonprofit Corporation Bonds
Aviation 42,210$ 24,426$ 23,520$
Convention Center 20,449 20,450 20,449
Water 796 - -
Customer Facility Charge - 3 3
Passenger Facility Charges 44,867 45,842 46,657
Capital Reserve - 800 -
Subtotal Capital Funds 108,322$ 91,521$ 90,629$
Total Source of Funds 519,373$ 608,286$ 610,965$
1 Reflects transfer of capital funds to City Improvement.
PROPOSED DEBT SERVICE EXPENDITURES
BY PROGRAM, SOURCE OF FUNDS AND TYPE OF EXPENDITURE (continued)(In Thousands of Dollars)
SCHEDULE 5

PRELIMINARY CAPITAL IMPROVEMENT PROGRAM
2015-16 2016-17
FINANCED FROM OPERATING FUNDS
(In Thousands of Dollars)
SCHEDULE 6
2014-15
Estimate ProposedActualProgram
Arts and Cultural Facilities 44- 9Aviation 42,07067,05616,752Economic Development 8,0808,9474,896Energy Conservation 1,2001,5001,175Facilities Management 6,5063,9542,172Finance - 127967Fire Protection 7,7377,70838Housing 5,45314,7435,310Human Services - - 6Information Technology 8,8886,1384,320Libraries 20020058Neighborhood Services - 2,393127Parks, Recreation and Mountain Preserves 27,96651,46814,687Phoenix Convention Center 2,5754,7354,184Police Protection - 3,000555Public Transit 55,11386,06765,480Solid Waste Disposal 20,34016,59521,838Street Transportation and Drainage 108,75980,99756,119Wastewater 56,25147,52537,578Water 126,961141,100114,941Total $ 351,212 $ 544,253 $ 478,143
9,7263,9201,351
Source of Funds General Fund: General Fund General Fund - Library 20020058Total General Fund $ 1,409 $ 4,120 $ 9,926
Special Revenue Funds:
Arizona Highway User Revenue 70,42254,34639,066Capital Construction 9,94913,90216,880Community Reinvestment 3,5214,5895,084Court Awards - 3,000155Development Services 255450475Neighborhood Protection 1,290- - Operating Grants 23,14654,96438,781Operating Grants - Public Housing 5,4509,8174,086Other Restricted 5,75313,400345Other Restricted - Affordable Housing - 8952Other Restricted - Parks Monopole - 1231Parks and Preserves 27,64950,98913,807Public Safety Enhancement 1,289- - Public Safety Expansion 1,290- - Regional Transit 9,58923,12313,569Sports Facilities 250250987Transit 2000 27010,61515,208Transportation 2050 50,11816,300- Total Special Revenue Funds $ 148,446 $ 256,763 $ 210,241
Enterprise Funds:
Aviation 43,12068,08417,719Convention Center 2,3254,4852,839Solid Waste 27,43622,67225,039Wastewater 57,78351,59638,892Water 127,312136,533116,868Total Enterprise Funds $ 201,357 $ 283,370 $ 257,976
Total Operating Funds $ 351,212 $ 544,253 $ 478,143

SCHEDULE 7PROPOSED INTERFUND TRANSFERS TO THE GENERAL FUND
(In Thousands of Dollars)
2014-15 2015-16 Increase/
Actuals Estimate Budget (Decrease)
Transfers to the General Fund
Enterprise FundsAviation Central Service Cost Allocation 7,969$ 7,716$ 7,716$ -$
Water Funds Central Service Cost Allocation 7,556 7,051 7,051 - In-Lieu Property Taxes 11,674 12,123 12,382 259 Total 19,230 19,174 19,433 259
Wastewater Funds Central Service Cost Allocation 5,037 4,701 4,701 - In-Lieu Property Taxes 7,287 7,470 7,646 176 Total 12,324 12,171 12,347 176
Solid Waste Central Service Cost Allocation 6,701 6,411 6,411 - In-Lieu Property Taxes 1,208 1,248 1,272 24 Total 7,909 7,659 7,683 24
Convention Center Central Service Cost Allocation 2,330 2,501 2,501 -
Total From Enterprise Funds 49,762$ 49,221$ 49,680$ 459$
2016-17

SCHEDULE 7PROPOSED INTERFUND TRANSFERS TO THE GENERAL FUND (Continued)
(In Thousands of Dollars)
2014-15 2015-16 Increase/
Actuals Estimate Budget (Decrease)
Special Revenue FundsExcise Transfer to General Fund 736,850$ 745,770$ 777,678$ 31,908$
Development Services Central Service Cost Allocation 2,782 2,974 2,974 -
Sports Facilities Central Service Cost Allocation 116 196 196 - Phoenix Union Parking Maintenance 79 79 79 - Total 195 275 275 -
Public Housing In-Lieu Property Taxes 163 302 302 -
ASU Facilities Operations Fund 779 783 779 (4)
Downtown Community Reinvestment Fund 2,068 2,065 2,064 (1)
T2000 Central Service Costs 766 725 725 -
Neighborhood Protection Central Service Costs 196 197 197 -
Public Safety Enhancement Central Service Costs 204 206 206 -
Public Safety Expansion Central Service Costs 536 474 474 -
Housing Central Office Central Service Costs 270 222 222 -
Other Restricted - Sale of Land 346 1,447 669 (778)
Library Reserve Fund - - 10 10
Arizona Highway User Revenue Capital Reserve - - 2,600 2,600
Workers Compensation Fund - - 15,000 15,000
Total From Special Revenue Funds 745,155$ 755,440$ 804,175$ 48,735$
Total Transfers to the General Fund 794,917$ 804,661$ 853,855$ 49,194$
Transfers from the General Fund
Arizona Highway User Revenue Reimbursement 1,009$ 290$ -$ (290)$
Strategic Economic Development Fund - 336 1,250 914
Public Safety Other Restricted Fund - 16,000 16,000 -
Other Restricted - - 213 213
Regional Wireless Cooperative L/P Fund 3,684 - - -
Library Reserve Fund 842 259 - (259)
Change for Phoenix Fund 8 - - -
Retiree Rate Stabilization Fund 1,024 1,024 1,026 2
Infrastructure Repayment Agreements 252 1,323 1,205 (118)
City Improvement - Library - 135 135 -
City Improvement 31,555 39,023 39,113 90
Total Transfers from the General Fund 38,374$ 58,390$ 58,942$ 552$
Net Transfers to the General Fund 756,543$ 746,271$ 794,913$ 48,642$
2016-17

SCHEDULE 8
PROPOSED POSITIONS BY DEPARTMENT
Number of Full Time Equivalent Positions
2016-17
Allowances Ending
2014-15 2015-16 June 30,2017
Program Actual Estimate 2015-16 2016-17 Authorized
General Government
Mayor 12.5 12.5 - - 12.5
City Council 33.0 33.0 (1.0) - 32.0
City Manager 18.0 17.0 - - 17.0
Government Relations 5.0 5.0 - 1.0 6.0
Communications Office2
18.6 18.6 - - 18.6
City Auditor 26.5 26.5 (1.0) - 25.5
Equal Opportunity 25.0 25.0 1.0 - 26.0
Human Resources 99.1 99.1 4.0 - 103.1
Phoenix Employment Relations Board 1.0 1.0 - - 1.0
Retirement Systems 14.0 14.0 (1.0) - 13.0
Law 194.0 194.0 2.0 4.0 200.0
Information Technology 168.0 170.0 23.0 (5.0) 188.0
City Clerk and Elections 56.0 56.0 1.0 (2.0) 55.0
Finance 219.0 218.0 (2.0) (2.0) 214.0
Budget and Research 24.0 24.0 1.0 - 25.0
Regional Wireless Cooperative 4.0 4.0 - - 4.0
Total General Government 917.7 917.7 27.0 (4.0) 940.7
Public Safety
Police 4,328.5 4,329.5 (11.0) (18.0) 4,300.5
Fire 1,990.6 2,000.3 10.6 (3.0) 2,007.9
Emergency Management 6.0 6.0 1.0 1.0 8.0
Total Public Safety 6,325.1 6,335.8 0.6 (20.0) 6,316.4
Criminal Justice
Municipal Court 285.0 279.0 - (6.0) 273.0
Public Defender 9.0 11.0 - - 11.0
Total Criminal Justice 294.0 290.0 0.0 (6.0) 284.0
1/Additions/Reductions

SCHEDULE 8
PROPOSED POSITIONS BY DEPARTMENT
Number of Full Time Equivalent Positions (Continued)
2016-17
Allowances Ending
2014-15 2015-16 June 30,2017
Program Actual Estimate 2015-16 2016-17 Authorized
1/Additions/Reductions
Transportation
Street Transportation 653.0 652.0 (2.0) (13.0) 637.0
Aviation 853.0 856.0 1.0 (1.0) 856.0
Public Transit 104.5 104.5 (1.0) - 103.5
Total Transportation 1,610.5 1,612.5 (2.0) (14.0) 1,596.5
Community Development
Planning and Development 295.8 304.8 21.2 8.0 334.0
Housing 181.0 181.0 (2.0) - 179.0
Community and Economic Development 96.0 90.0 (1.0) 2.0 91.0
Neighborhood Services 194.0 194.0 (5.0) (2.0) 187.0
PCDIC - 6.0 - 2.0 8.0
Total Community Development 766.8 775.8 13.2 10.0 799.0
Community Enrichment
Parks and Recreation 1,048.6 1,056.0 (1.0) (19.5) 1,035.5
Library 377.3 378.3 (1.3) (7.1) 369.9
Phoenix Convention Center 229.0 229.0 (1.0) - 228.0
Human Services 327.0 327.0 (3.0) (3.0) 321.0
Office of Arts and Culture 10.0 10.5 - - 10.5
Total Community Enrichment 1,991.9 2,000.8 (6.3) (29.6) 1,964.9
Environmental Services
Water Services 1,463.1 1,463.1 (9.1) (1.0) 1,453.0
Solid Waste Management 585.5 585.5 (6.0) 2.0 581.5
Public Works 433.0 427.0 (5.0) (4.0) 418.0
Environmental Programs 10.0 10.0 (1.0) - 9.0
Office of Sustainability 0.0 3.0 1.0 - 4.0
Total Environmental Services 2,491.6 2,488.6 (20.1) (3.0) 2,465.5
TOTAL 14,397.6 14,421.2 12.4 (66.6) 14,367.0
1. Additions/Reductions reflect the combined total of proposed and year-to-date budget reductions, budget additions and new
positions associated with opening new facilities.

EXPENDITURES
Capital Fund
Beginning
Balance
Projected
Revenue 1 Total
Estimated
Expenditures
Ending Fund
Balance
Projected
Resources
Beyond 16/172
Funds Available
Beyond 16/17
BONDS AND RELATED FUNDS
2006 Bonds
Libraries, Senior & Cultural Centers (3,704)$ -$ (3,704)$ 42$ (3,746)$ 27,190$ 23,444$
Education (4,564) - (4,564) - (4,564) 8,090 3,526
Affordable Housing & Neighborhoods 3,064 - 3,064 721 2,343 17,795 20,138
Parks and Open Spaces 5,215 - 5,215 3,319 1,896 13,685 15,581
Police, Fire & Homeland Security 25 - 25 - 25 36,700 36,725
Police, Fire & City Technology 114 - 114 - 114 4,790 4,904
Street and Storm Sewer Improvement 3,116 - 3,116 49 3,067 27,495 30,562
2001 Bonds
Affordable Housing & Homeless Shelter 1,053 - 1,053 - 1,053 - 1,053
Educational, Youth & Cultural Facilities (108) - (108) 1,074 (1,182) 1,700 518
Environmental Improvement & Cleanup 261 - 261 - 261 630 891
Fire Protection Facilities & Equipment - - - - - 800 800
Neighborhood Protection & Senior Centers 4,882 - 4,882 - 4,882 2,355 7,237
New & Improved Libraries 3,444 - 3,444 - 3,444 900 4,344
Parks, Open Space & Recreation (332) - (332) - (332) 4,425 4,093
Police Protection Facilities & Equipment (524) - (524) - (524) 1,115 591
Police, Fire & Computer Technology (50) - (50) - (50) 615 565
Preserving Phoenix Heritage (103) - (103) 79 (182) 795 613
Storm Sewers - - - - - 50 50
Street Improvements (601) - (601) - (601) 2,225 1,624
1989 Historic Preservation 2 - 2 - 2 - 2
1988 Bonds
Freeway Mitigation, Neighborhood Stabilization,
Slum & Blight Elimination 845 - 845 - 845 1,000 1,845
Parks, Recreation & Mountain Preserves 413 - 413 - 413 - 413
Police Protection 27 - 27 - 27 - 27
Storm Sewers 2 - 2 - 2 - 2
Nonprofit Corporation Bonds
Aviation (233,164) 21,273 (211,891) 27,757 (239,648) 442,235 202,587
Phoenix Convention Center 9,714 20,449 30,163 20,449 9,714 - 9,714
Solid Waste 91 - 91 265 (174) 75,000 74,826
Wastewater (4,570) - (4,570) 29,333 (33,903) 405,000 371,097
Water (614) - (614) 30,614 (31,228) 525,000 493,772
Other (80,971) (1,026) (81,997) 40,204 (122,201) 182,345 60,144
OTHER FINANCING
Impact Fees 116,607 - 116,607 65,774 50,833 - 50,833
Passenger Facility Charge 27,909 80,000 107,909 79,387 28,522 - 28,522
Customer Facility Charge 3,944 25,815 29,759 3 29,756 - 29,756
Other Cities' Participation in Joint Ventures 20,280 23,880 44,160 23,880 20,280 - 20,280
Solid Waste Remediation 4,661 - 4,661 - 4,661 - 4,661
Capital Grants (19,537) 33,727 14,190 33,727 (19,537) 19,537 -
Federal, State & Other Participation (5,282) 22,771 17,489 22,771 (5,282) 5,282 -
Capital Gifts 171 - 171 - 171 - 171
Capital Reserves 306,353 (1,400) 304,953 3,495 301,458 - 301,458
Other Capital 4,379 - 4,379 - 4,379 - 4,379
TOTAL 162,448$ 225,489$ 387,937$ 382,943$ 4,994$ 1,806,754$ 1,811,748$
1 Includes bond proceeds and funds which "pass through" bond funds such as grants, land sales and other agency and private participation.2 Includes bonds authorized and available for sale, pledged resources and cost recovery for projects billed and/or reimbursed on a cash flow basis.
SCHEDULE 9
PRELIMINARY 2016-17 CAPITAL IMPROVEMENT PROGRAM
RESOURCES AND EXPENDITURES BY CAPITAL FUND
(In Thousands of Dollars)
RESOURCES FUND BALANCES

PRELIMINARY 2016-17 CAPITAL IMPROVEMENT PROGRAM
Pay-As-You-Go
Operating2001
Bonds2006
Bonds
Nonprofit Corporation
Bonds
Other Capital
SourcesTotal
Program
SCHEDULE 10
BY PROGRAM AND SOURCE OF FUNDS
(In Thousands of Dollars)
Program
44 1,074 - - - 1,118Arts and Cultural Facilities42,070 - - 27,757 105,003174,829Aviation8,080 - 250 - - 8,330Economic Development1,200 - - - - 1,200Energy Conservation6,506 - 150 - - 6,656Facilities Management7,737 - - - - 7,737Fire Protection
- 79 287 - - 366Historic Preservation5,453 - 2 - 3,4488,903Housing8,888 - - 10,204 - 19,092Information Technology
200 - 41 - - 241Libraries27,966 - 3,297 12 2,45533,730Parks, Recreation and Mountain Preserves2,575 - - 20,449 - 23,024Phoenix Convention Center
55,113 - - - 4,54659,659Public Transit- - - - 7,4217,421Regional Wireless Cooperative
20,340 - 19 263 50021,122Solid Waste Disposal108,759 - 63 30,214 37,879176,916Street Transportation and Drainage56,251 - - 29,077 45,971131,299Wastewater
126,961 - 22 30,646 21,814179,443Water
$ 478,143 $ 1,153 $ 4,131 $ 148,622 $ 229,037$ 861,086Total Preliminary CIP

(In Thousands)2015-16 2016-17
FISCAL YEAR FISCAL YEAR1. Maximum allowable primary property tax levy.
A.R.S. §42-17051(A) $ 149,919 $ 156,1332. Amount received from primary property taxation
in the current year in excess of the sum of thatyear's maximum allowable primary property taxlevy. A.R.S. §42-17102(A)(18) $ -
3. Property tax levy amountsA. Primary property taxes * $ 141,880 $ 146,711B. Secondary property taxes * 50,622 91,602C. Total property tax levy amounts * $ 192,502 $ 238,313
4. Property taxes collected **A. Primary property taxes
(1) Current year's levy $ 140,363(2) Prior years’ levies 485(3) Total primary property taxes $ 140,848
B. Secondary property taxes(1) Current year's levy $ 50,080(2) Prior years’ levies 101(3) Total secondary property taxes $ 50,181
C. Total property taxes collected $ 191,0295. Property tax rates
A. City/Town tax rate(1) Primary property tax rate 1.3414 1.3359(2) Secondary property tax rate 0.4786 0.8341(3) Total city/town tax rate 1.8200 2.1700
B. Special assessment district tax rates
Secondary property tax rates - As of the date the proposed budget was prepared, the1 special assessment districts for which secondary
property taxes are levied. For information pertaining to these special assessment districtsand their tax rates, please contact the city/town.
* The 2016-17 planned primary levy is $146,710,553; the 2016-17 planned secondary levy is$91,602,120. Historically, actual property tax collections are slightly lower than the amountlevied. For 2016-17, actual collections are estimated to be $145,141,000 for the primary property tax and $90,622,000 for the secondary property tax, or 98.9% of the levy amounts.
** Includes actual property taxes collected as of the date the proposed budget was prepared, plus estimated property tax collections for the remainder of the fiscal year.
city/town was operating
SCHEDULE 11Summary of Tax Levy and Tax Rate Information
Fiscal Year 2015-16 and 2016-17