Embed Size (px)
Citation preview

Second Quarter 2016
Fixed Income Investor Review
July 21, 2016
Citi | Fixed Income Investor Relations
John Gerspach
Chief Financial Officer
James von Moltke
Treasurer

2
Agenda
2Q’16 Results
• Earned $4.0B in a challenging and volatile environment
• Achieved significant QoQ improvement in Efficiency Ratio, ROA and RoTCE
• Utilized approximately $2.4B of DTA in 1H’16
Balance Sheet
• $1,819B of GAAP assets at 2Q’16
• Net interest margin of 2.86% for 2Q’16
• Credit quality broadly stable
Funding
• $938B of deposits at 2Q’16
• Long-term debt issuance and redemptions
• Updated TLAC estimates
Regulatory Metrics(1)
• 12.5% Common Equity Tier 1 (CET1) Capital Ratio
• 7.5% Supplementary Leverage Ratio (SLR)
• 121% Liquidity Coverage Ratio (LCR)
Note: TLAC: Total Loss-Absorbing Capacity.
(1) Preliminary. CET1 Capital ratio and SLR, which reflect full implementation of the U.S. Basel III rules, are non-GAAP financial measures. For additional information on
CET1 and SLR, please refer to Slides 30 and 31.
2Q'16 QoQ %r YoY %r 1H'16 YoY %r
Net Interest Revenue $11,236 0% (5)% $22,463 (4)%
Non-Interest Revenue 6,312 (0)% (14)% 12,640 (19)%
Revenues 17,548 (0)% (8)% 35,103 (10)%
Core Operating 9,918 1% (6)% 19,785 (6)%
Legal & Repositioning 451 (31)% 7% 1,107 34%
Operating Expenses 10,369 (1)% (5)% 20,892 (4)%
Cost of Credit 1,409 (31)% (15)% 3,454 (3)%
EBT 5,770 16% (12)% 10,757 (21)%
Net Income $3,998 14% (14)% $7,499 (21)%
Return on Assets 0.89% 0.84%
Return on Tangible Common Equity 8.0% 7.7%
Diluted EPS $1.24 13% (14)% $2.35 (21)%
Average Diluted Shares 2,916 (1)% (4)% 2,930 (3)%
EOP Assets (Constant $B) $1,819 2% 1% $1,819 1%
EOP Loans (Constant $B) 634 3% 2% 634 2%
EOP Deposits (Constant $B) 938 1% 5% 938 5%
3
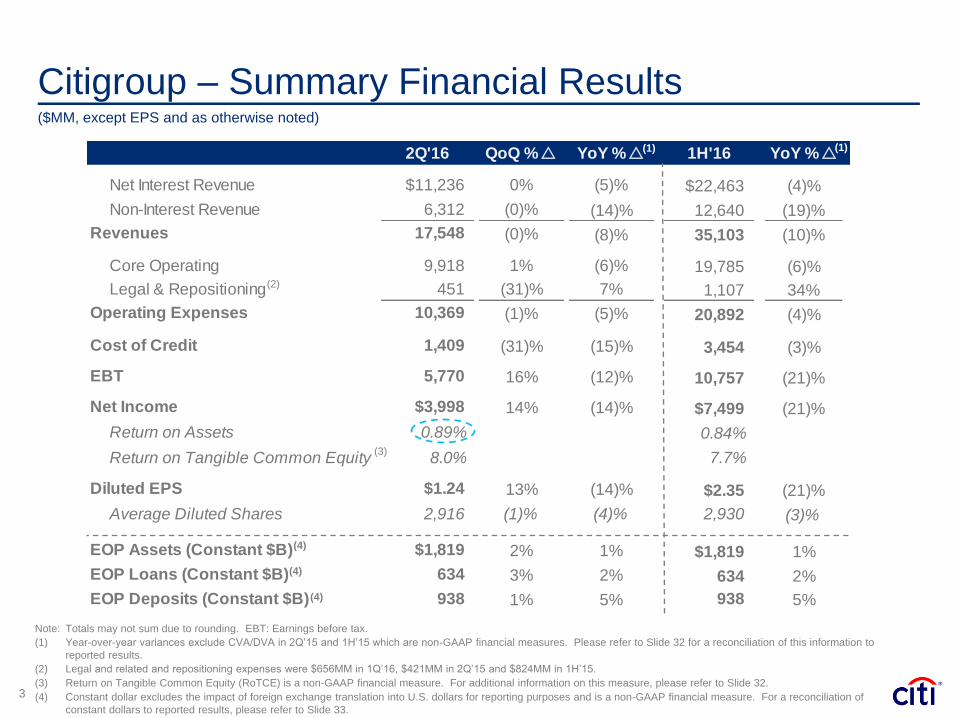
Citigroup – Summary Financial Results($MM, except EPS and as otherwise noted)
Note: Totals may not sum due to rounding. EBT: Earnings before tax.
(1) Year-over-year variances exclude CVA/DVA in 2Q’15 and 1H’15 which are non-GAAP financial measures. Please refer to Slide 32 for a reconciliation of this information to
reported results.
(2) Legal and related and repositioning expenses were $656MM in 1Q’16, $421MM in 2Q’15 and $824MM in 1H’15.
(3) Return on Tangible Common Equity (RoTCE) is a non-GAAP financial measure. For additional information on this measure, please refer to Slide 32.
(4) Constant dollar excludes the impact of foreign exchange translation into U.S. dollars for reporting purposes and is a non-GAAP financial measure. For a reconciliation of
constant dollars to reported results, please refer to Slide 33.
(3)
(4)
(4)
(4)
(2)
(1) (1)

4
213 203 183 185 191
60 57 47 43 40
547 551 558 559 582
274 266 251 272 272
234 231220 223 229
326 340342 351 356
156 163135
158 150
$1,809 $1,810$1,736
$1,792 $1,819
2Q'15 3Q'15 4Q'15 1Q'16 2Q'16
$1,829 $1,808 $1,731 $1,801 $1,819
221 222 223 229 233
211 214 203 207 207
891 901 908 929 938
153 158 118 116 12826 24
21 21 18134 125
118 135 136
173 166145
155 158
$1,809 $1,810$1,736
$1,792 $1,819
2Q'15 3Q'15 4Q'15 1Q'16 2Q'16
YoY %r
Balance Sheet Trends
EOP Assets
Liabilities & Equity
Cash
Investments
Trading
Citicorp
Loans, net
All Other
Securities
Borrowed /
FF Sold
Securities
Loaned /
FF Purch.
Trading
Deposits
LTD
Equity
S-T Borrowings
All Other
Citi Holdings
Loans, net
EOP Assets(as reported)
Note: Totals may not sum due to rounding. For a reconciliation of constant dollars to reported results, please refer to Slide 33.
(Constant $B, except as noted)
5%
1%
YoY %r
Avg. Quarterly
Assets$1,819 $1,815 $1,787 $1,787 $1,807
Assets
5%
6%
(2)%
(4)%

157 159 166 161 176
23 23 24 24 2588 88 87 85 85
$268 $270 $277 $270 $285
$63 $60 $50 $46 $41
2Q'15 3Q'15 4Q'15 1Q'16 2Q'16
117 120 118 123 124
73 74 72 73 74
98 98 101 104 109
$289 $291 $291 $299 $307
$621 $621 $618 $615$634
5
Private Bank /
Markets
Loan TrendsNorth America
Corporate
6%
Consumer
6%
Note: Totals may not sum due to rounding. Data represents end of period loans, net of unearned income. For a reconciliation of constant dollars to reported results, please
refer to Slide 33.
(1) For reporting purposes, Asia GCB includes the results of operations of EMEA GCB for all periods presented.
Citi
Holdings
YoY %r
Citi
Holdings
Citicorp
Corporate
Citicorp
Consumer
North
America
(1)%
12%
Citigroup
2%
Citigroup
(EOP Constant $B)
0%
6%
TTS
Corporate
Lending
Latin America Asia(1)
International
(35)%
11%
6%
Citicorp
GCB:

6
GCB – Credit Trends
Net Credit Losses (%)
Note: GCB: Global Consumer Banking. Net credit loss (NCL) rates shown are percentages of average loans. 90+ DPD rates shown are percentages of end-of-period loans.
(1) For reporting purposes, Asia GCB includes the results of operations of EMEA GCB for all periods presented.
(2) Loan loss reserves divided by 90+ days past due.
2Q’16
Total LLR = $7.6B
Delinquency
Coverage(2) = 3.9x
North America LATAM Asia(1) GCB
2.34%
4.25%
0.76%
2.02%
0%
1%
2%
3%
4%
5%
6%
2Q'14 3Q'14 4Q'14 1Q'15 2Q'15 3Q'15 4Q'15 1Q'16 2Q'16
90+ DPD (%)
0.75%
1.23%
0.42%
0.69%
0.0%
0.5%
1.0%
1.5%
2.0%
2.5%
2Q'14 3Q'14 4Q'14 1Q'15 2Q'15 3Q'15 4Q'15 1Q'16 2Q'16
GCB Loan Loss Reserve Trends
8.0 7.6 7.6 7.7 7.6
16 17
16 17 17
2Q'15 3Q'15 4Q'15 1Q'16 2Q'16
Months of NCL Coverage

7
ICG – Credit Trends
Note: ICG: Institutional Clients Group.
(1) Non-accrual loans shown as percentages of end-of-period loans. Non-accrual loans as defined in Citigroup’s 2015 Form 10-K.
Corporate Credit Overview
0.94%
1.06%
0.63%
0.25%
0.79%
0.0%
0.5%
1.0%
1.5%
2Q'14 3Q'14 4Q'14 1Q'15 2Q'15 3Q'15 4Q'15 1Q'16 2Q'16
North America EMEA LATAM Asia ICG
ICG Loan Loss Reserve Trends
Non-Accrual Loans(1) as % of Loans
• ICG cost of credit of $82 million in 2Q’16
• Minimal cost of credit related to energy
• Non-accrual loan increase of $135 million in
2Q’16
2.42.6
2.8 2.9 2.8
2Q'15 3Q'15 4Q'15 1Q'16 2Q'16
LLR / NAL: 1.2x in 2Q’16
($B)

$17 $15 $23 $25 $29
2Q'15 3Q'15 4Q'15 1Q'16 2Q'16
8
392 399 393 414 405
107 117 119 114 116
79 78 76 76 85
$579 $593 $588 $604 $607
183 180 182 184 183
113 112 115 116 119
$295 $292 $297 $300 $302
$891 $901 $908$929 $938
Note: Totals may not sum due to rounding. For a reconciliation of constant dollars to reported results, please refer to Slide 33.
(1) Banking ex-TTS includes Private Bank and Issuer Services.
5%
Citigroup
Corporate
5%
YoY %r
Citicorp
Corporate
Citicorp
Consumer
Citi Holdings &
Corp / Other
Consumer
2%
Citigroup
(EOP Constant $B)
Treasury
& Trade
Solutions
(TTS)
North
America
International 5%
0%
8%
3%
Markets /
Sec. Svcs.Banking(1)
(ex-TTS)8%
Deposit Trends
Total Citicorp
6%

9
111% 112% 113%120% 121%
2Q'15 3Q'15 4Q'15 1Q'16 2Q'16
Regulatory Liquidity Metrics
Note: Totals may not sum due to rounding. IG: Investment Grade.
(1) Beginning in 4Q’15, disclosed LCR based on average HQLA and average net outflows, pursuant to the Federal Reserve Board’s November 2015 proposed disclosure requirements.
(2) Preliminary.
(3) Includes securities issued or guaranteed by foreign sovereigns, agencies and multilateral development banks.
(4) Estimated.
High Quality Liquid Assets (HQLA) CompositionLiquidity Coverage Ratio (LCR)(1)
LCR
Requirement
100%
(2)
($B)
HQLA $386 $399 $389 $400 $411
Net
Outflows$347 $356 $344 $333 $340
End-of-Period Average
2Q'162Q'16
Level 1
Assets
83%
Level 2 Assets
17%
Level 2
Assets
Limit
40%
Available Cash
Foreign Govt.(3)
U.S. Treasuries
U.S. Agency / Govt. Gtd.
IG Corporate / Equities(2)(4) (2)
$411
22%
34%
26%
17%
1%

10
(2)%
2.95% 2.94% 2.92% 2.92% 2.86%
Net Interest Margin & RevenueNet Interest Margin
Note: Totals may not sum due to rounding. For a reconciliation of constant dollars to reported results, please refer to Slide 32.
(1) Net Interest Revenue (NIR) excludes the taxable equivalent adjustment.
(2) Excludes deposit insurance and FDIC assessment. Includes effect of non-interest-bearing deposits.
Citicorp NIR(1) (Constant $B)
10.3 10.5 10.5 10.7 10.7
1.2 1.1 0.9 0.6 0.5
$11.5 $11.6 $11.4 $11.3 $11.2
2Q'15 3Q'15 4Q'15 1Q'16 2Q'16
Citicorp Net Interest Revenue / Day (Constant $MM)
$113 $114 $114 $117 $117 4%
Cost of Total Average Deposits(2)
0.44% 0.42% 0.42% 0.43% 0.45% 1 bp
Cost of Long-Term Debt
2.37% 2.39% 2.38% 2.35% 2.39% 2 bps
YoY %r
(9) bps
Citi Holdings NIR(1) (Constant $B)
(53)%
4%

$223
$201$208 $207
27 29 31 31
98 90 94 96 160
2825
27 26
$158$146
$156 $155
4Q'14 4Q'15 1Q'16 2Q'16 4Q'16E
38 31 29 27
2018 17 20
$65$55 $52 $53
11
Long-Term Debt and Preferred Stock Outstanding
Note: Totals may not sum due to rounding.
(1) Customer-related debt includes structured notes, such as equity- and credit-linked notes, as well as non-structured notes.
(2) Includes Trust Preferred Securities of $2B for all periods presented.
(3) Includes long-term debt issued to third parties by Citi’s non-bank subsidiaries (including broker-dealer subsidiaries) that are consolidated into Citigroup Inc.
(4) Weighted average maturity (WAM) includes Bank and Parent unsecured debt with remaining life > 1 year. Excludes Local Country & Other Debt and Trust Preferred Securities.
WAM (years)(4) 6.9 6.9 7.0 7.0 >7
Preferred Stock
Outstanding$10 $17 $18 $19 $19
Senior Debt Customer-Related Debt(1)
Subordinated Debt(2)
FHLB
Local Country & Other
Parent(3)
Bank
Total Citigroup
(EOP in $B, except otherwise noted)Securitizations
52
4
67 6
2
7
~$210
~$50
~$160

12
$28 ~$25
$6
$2.5
$(18)
$(4)
$(10)$(14)
$(17)
Benchmark Debt and Preferred Stock: Issuances & Maturities
Issuance &
Redemptions
Maturities
Net Benchmark(2) Issuance: $0 Net Benchmark(2) Issuance: ~$8
2017E2015(1) 2016E
Benchmark Debt(2)
Note: Totals may not sum due to rounding.
(1) Excludes the impact of foreign exchange translation and mark-to-market adjustments of $(6)B.
(2) Benchmark debt includes senior and subordinated debt.
(3) Reflects the impact of foreign exchange translation and mark-to-market adjustments.
Preferred Stock
($B)
Preferred Stock
Issuance &
Redemptions
Maturities Issuance &
Redemptions
Maturities
Benchmark Debt(2)
TBD
1H’16
Senior Debt 12
Subordinated Debt 2
Benchmark Issuance $14
Maturities (8)
Redemptions (3)
Net Benchmark Issuance $3
Other Changes(3) 5
Net Benchmark Change $8
Preferred Stock Issuance $2.5
13
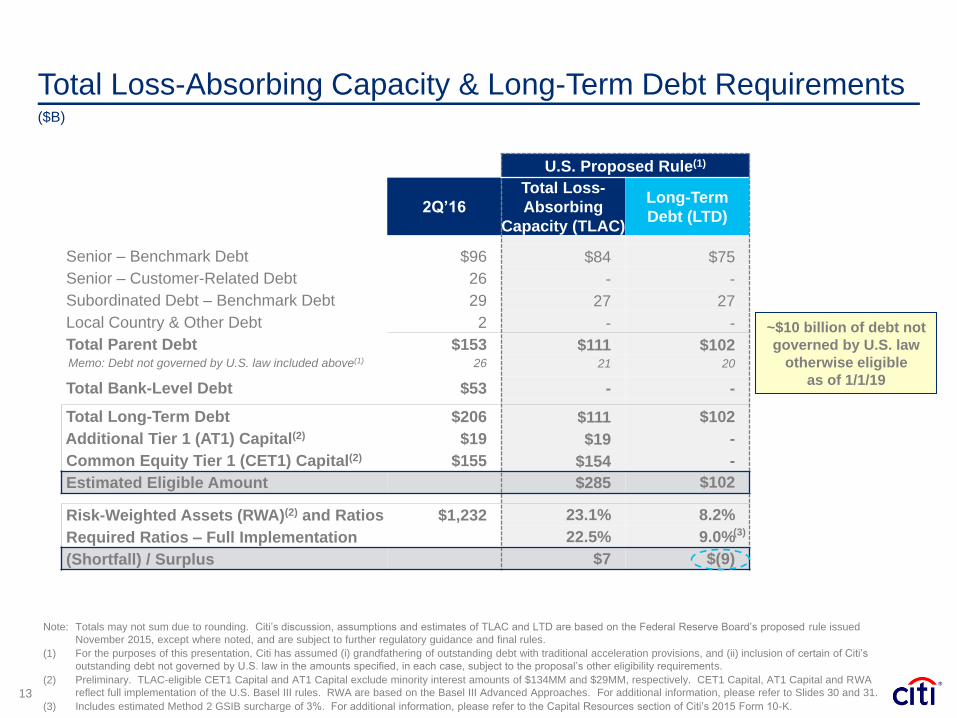
Total Loss-Absorbing Capacity & Long-Term Debt Requirements
Note: Totals may not sum due to rounding. Citi’s discussion, assumptions and estimates of TLAC and LTD are based on the Federal Reserve Board’s proposed rule issued
November 2015, except where noted, and are subject to further regulatory guidance and final rules.
(1) For the purposes of this presentation, Citi has assumed (i) grandfathering of outstanding debt with traditional acceleration provisions, and (ii) inclusion of certain of Citi’s
outstanding debt not governed by U.S. law in the amounts specified, in each case, subject to the proposal’s other eligibility requirements.
(2) Preliminary. TLAC-eligible CET1 Capital and AT1 Capital exclude minority interest amounts of $134MM and $29MM, respectively. CET1 Capital, AT1 Capital and RWA
reflect full implementation of the U.S. Basel III rules. RWA are based on the Basel III Advanced Approaches. For additional information, please refer to Slides 30 and 31.
(3) Includes estimated Method 2 GSIB surcharge of 3%. For additional information, please refer to the Capital Resources section of Citi’s 2015 Form 10-K.
($B)
U.S. Proposed Rule(1)
2Q’16
Total Loss-
Absorbing
Capacity (TLAC)
Long-Term
Debt (LTD)
Senior – Benchmark Debt $96 $84 $75
Senior – Customer-Related Debt 26 - -
Subordinated Debt – Benchmark Debt 29 27 27
Local Country & Other Debt 2 - -
Total Parent Debt $153 $111 $102 Memo: Debt not governed by U.S. law included above(1) 26 21 20
Total Bank-Level Debt $53 - -
Total Long-Term Debt $206 $111 $102
Additional Tier 1 (AT1) Capital(2) $19 $19 -
Common Equity Tier 1 (CET1) Capital(2) $155 $154 -
Estimated Eligible Amount $285 $102
Risk-Weighted Assets (RWA)(2) and Ratios $1,232 23.1% 8.2%
Required Ratios – Full Implementation 22.5% 9.0%
(Shortfall) / Surplus $7 $(9)
~$10 billion of debt not
governed by U.S. law
otherwise eligible
as of 1/1/19
(3)

14
Basel III Advanced Approaches – Risk-Weighted Assets
$1,281 $1,302 $1,293 $1,284 $1,279 $1,254 $1,216 $1,240 $1,232
Supplementary Leverage Ratio – Total Leverage Exposure
$2,498 $2,485 $2,493 $2,406 $2,386 $2,364 $2,318 $2,300 $2,329
5.8% 6.0% 5.9%6.4% 6.7% 6.9% 7.1%
7.4% 7.5%
10.6% 10.6% 10.6%11.1%
11.4%11.7%
12.1% 12.3% 12.5%12.7% 12.8% 12.8%13.4%
14.1%14.6%
15.3%15.7%
16.1%
2Q'14 3Q'14 4Q'14 1Q'15 2Q'15 3Q'15 4Q'15 1Q'16 2Q'16
Regulatory Capital Metrics
Note: 2Q’16 data is preliminary. Certain reclassifications have been made to the prior periods’ presentation to conform to the current period’s presentation.
(1) For additional information, please refer to Slides 30 and 31.
(2) Citi’s Total Capital Ratio, which reflects full implementation of the U.S. Basel III rules, is a non-GAAP financial measure.
($B) Common Equity Tier 1 Capital Ratio(1) Supplementary Leverage Ratio(1)Total Capital Ratio(2)

15
Conclusions
Operating
Performance
Stable
Funding
Strong
Regulatory
Capital &
Liquidity(1)
Active
Balance Sheet
Management
• $4.0B 2Q’16 net income
• Approximately $2.4B of DTA utilized in 1H’16
• Continued progress de-risking the firm
• $938B of deposits
• Long-term debt issuance on track
• $1,819B of GAAP assets at 2Q’16
• Net interest margin of 2.86% for 2Q’16
• Actively managed credit exposure
• 12.5% CET1 Capital Ratio
• 7.5% SLR
• 121% average LCR, $411B average HQLA
Note:
(1) Preliminary. For additional information on CET1 and SLR, please refer to Slides 30 and 31.

Certain statements in this presentation, including without limitation eligible
TLAC and Long-Term Debt under the Federal Reserve Board’s TLAC
proposal, are “forward-looking statements” within the meaning of the U.S.
Private Securities Litigation Reform Act of 1995. These statements are
based on management’s current expectations and are subject to
uncertainty and changes in circumstances. These statements are not
guarantees of future results or occurrences. Actual results and capital and
other financial condition may differ materially from those included in these
statements due to a variety of factors, including, among others, the final
TLAC rules adopted by the Federal Reserve Board and the precautionary
statements included in this presentation and those contained in Citigroup’s
filings with the U.S. Securities and Exchange Commission, including
without limitation the “Risk Factors” section of Citigroup’s 2015 Form 10-K.
Any forward-looking statements made by or on behalf of Citigroup speak
only as to the date they are made, and Citi does not undertake to update
forward-looking statements to reflect the impact of circumstances or
events that arise after the date the forward-looking statements were made.
16


18
Appendix
19. Regulatory Landscape Update
20. Citicorp – Regional Credit Portfolio
21. Citigroup – Consumer Credit
22. GCB – Commercial Energy Exposure
23. ICG – Corporate Credit Exposure
ex-Private Bank
24. ICG – Corporate Energy Exposure
25. ICG – Unfunded Corporate Energy
Exposure
26. Benchmark Debt and Preferred Stock:
Liability Management & Issuance
27. Select Additional Tier 1 Capital Securities
28. OCI and Other Effects on Capital
29. Rating Agency Perspectives
30. Common Equity Tier 1 Capital Ratio and
Components
31. Supplementary Leverage Ratio; TCE
Reconciliation
32. Adjusted Results Reconciliation and FX
Impact Reconciliation on Net Interest
Revenue
33. FX Impact Reconciliation on Balance
Sheet Assets and Liabilities
Table of Contents

19
Capital
Requirements
Regulatory Landscape Update
CCAR / DFAST• Received non-objection to 2016 Capital Plan
• Proposed revisions to 2017 process expected 2016
• Final U.S. rule issued October 2014LCR
NSFR• Final BCBS rule issued October 2014
• Proposed U.S. rule issued May 2016
Note: BCBS = Basel Committee on Banking Supervision. CCAR = Comprehensive Capital Analysis and Review. DFAST = Dodd-Frank Act Stress Testing.
FRTB = Fundamental Review of the Trading Book. GSIB = Global Systemically Important Bank Holding Companies. LCR = Liquidity Coverage Ratio.
NSFR = Net Stable Funding Ratio. SCCL = Single Counterparty Credit Limit. TLAC = Total Loss-Absorbing Capacity.
(1) The Basel III leverage ratio framework under consideration by the BCBS is most closely aligned with the U.S. Basel III Supplementary Leverage Ratio.
• Feedback provided on 2015 resolution plans
• Guidance issued for 2017 resolution plan submission
Resolution &
Recovery
Volcker Rule
Final Rule
Final Rule
Proposed
Final Rule
Final Rule
TLAC Proposed • Proposed U.S. rule issued November 2015
Derivatives Reform Various
Liquidity
Requirements
Other• Final U.S. rule issued January 2014
• Implemented July 2015
• Credit Risk – Proposed BCBS rules issued
December 2015 and March 2016
• Market Risk – Final BCBS rule issued January 2016 (FRTB)
• Operational Risk – Proposed BCBS rule issued March 2016
GSIB Surcharge Final Rule • Final U.S. rule issued August 2015
Revised RWA
MethodologiesVarious
• Multiple reforms in various jurisdictions
SCCL • Proposed U.S. rule issued March 2016Proposed
Leverage Ratio(1) Proposed • Proposed BCBS rule issued April 2016

36% 47%
18%34%
46%
19%
$189
$118
DM EM
67%
19%
2%
26%
27%
32%
5%
23%
$186
$99
DM EM
Mexico9%
Korea 7%
Singapore 5%
Hong Kong 4%
Taiwan 3%
Other EM8%
Developed Asia 4%
North America62%
Citicorp – Regional Credit Portfolio(2Q’16 EOP in $B)
Brazil 5%Singapore 4%
Hong Kong 4%
India 3%
China 2%
Other EM20%
Developed Asia 2%
North America44%
Western Europe
15%
Co
ns
um
er
Co
rpo
rate
Geographic Loan Distribution Loan Composition
Note: Totals may not sum due to rounding. DM: Developed Markets. EM: Emerging Markets.20
Private Bank / Markets
Treasury and Trade
Solutions
Corporate Lending
Commercial Markets
Real Estate Lending
Cards
Personal & Other

Citigroup – Consumer Credit
21 Note: Totals may not sum due to rounding.
(Constant $B)
Growth
($B) (%) YoY % 2Q'16 1Q'16 2Q'15 2Q'16 1Q'16 2Q'15
Korea 19.3 6.8% (5.6)% 0.2% 0.2% 0.3% 0.3% 0.4% 0.6%
Singapore 13.3 4.6% (7.7)% 0.1% 0.1% 0.1% 0.4% 0.3% 0.3%
Hong Kong 10.4 3.6% (4.2)% 0.2% 0.1% 0.1% 0.4% 0.3% 0.5%
Australia 10.2 3.6% (7.1)% 0.6% 0.7% 0.7% 1.4% 1.2% 1.4%
Taiwan 8.0 2.8% 7.8% 0.1% 0.2% 0.1% 0.3% 0.4% 0.2%
India 6.3 2.2% 7.0% 0.7% 0.7% 0.6% 0.8% 0.7% 0.6%
Malaysia 4.8 1.7% (1.1)% 1.0% 1.0% 1.0% 0.6% 0.7% 0.8%
China 4.5 1.6% (4.8)% 0.2% 0.2% 0.2% 0.2% 0.5% 0.8%
Thailand 1.9 0.7% (1.0)% 1.5% 1.5% 1.7% 2.6% 2.8% 2.9%
Indonesia 1.1 0.4% (13.7)% 1.4% 1.3% 1.1% 4.4% 3.0% 4.1%
All Other 1.2 0.4% 15.6% 1.4% 1.5% 1.6% 3.1% 3.2% 3.7%
Asia 81.0 28.4% (3.4)% 0.4% 0.4% 0.4% 0.7% 0.7% 0.8%
Poland 1.6 0.6% 5.6% 0.5% 0.5% 0.5% 0.7% 0.7% 0.6%
UAE 1.3 0.5% 2.7% 1.4% 1.3% 1.0% 4.1% 4.0% 2.5%
Russia 0.9 0.3% (5.5)% 0.9% 1.0% 1.1% 2.5% 3.2% 3.5%
All Other 0.2 0.1% 8.0% 0.9% 0.7% 1.0% 2.6% 3.6% 1.9%
EMEA 4.1 1.4% 2.1% 0.9% 0.9% 0.8% 2.3% 2.5% 2.0%
Latin America 24.5 8.6% 5.3% 1.2% 1.3% 1.8% 4.3% 4.5% 4.7%
Total International 109.6 38.4% (1.3)% 0.6% 0.6% 0.7% 1.5% 1.6% 1.6%
North America 175.6 61.6% 11.9% 0.7% 0.8% 0.8% 2.3% 2.3% 2.6%
Total Citicorp Consumer 285.2 100.0% 6.4% 0.7% 0.7% 0.7% 2.0% 2.0% 2.2%
Citi Holdings Consumer:
North America 35.7 NM (34.1)% 2.1% 2.1% 2.8% 0.3% 0.7% 1.4%
International 5.5 NM (37.2)% 3.1% 2.3% 2.0% 5.0% 4.7% 4.8%
2Q'16 Loans 90+ DPD Ratio NCL Ratio

22
GCB – Commercial Energy Exposure
Key Takeaways 2Q’16
Energy(1) Subsector Exposures
Geographic Distribution as of 2Q’16(2)
Ratings Detail
Note: 2Q’16 data is preliminary. Totals may not sum due to rounding. GCB: Global Consumer Banking.
(1) Includes energy-related exposures classified in other industries, primarily Public Sector and Transportation, consistent with corporate credit in the Institutional Clients Group.
(2) Total exposure includes direct outstandings (loans) and unfunded commitments.
(3) E&P: Exploration and Production. RBL: Reserve-Based Lending. Energy Process Industries includes Oil and Gas Storage & Transportation and Oil and Gas Refining &
Marketing. Services and Drilling includes Oil and Gas Equipment & Services, Oil and Gas Drilling and Offshore Drilling.
Funded Total Exposure(2)
2Q’16 1Q’16 2Q’16 1Q’16
AAA / AA / A 9 % 5 % 10 % 9 %
BBB 14 17 19 20
BB / B 48 53 48 52
CCC or below 29 26 23 19
Total 100 % 100 % 100 % 100 %
($B)
Funded
Total
Exposure(2)
2Q’16 1Q’16 2Q’16 1Q’16
Oil and Gas E&P(3) $0.8 $0.7 $1.1 $1.1
Memo: NA RBL(3) 0.8 0.7 1.1 1.1
Services and Drilling(3) 0.2 0.3 0.3 0.4
Energy Process
Industries(3) 0.4 0.4 0.6 0.7
Integrated Oil and Gas 0.0 0.0 0.0 0.0
Total $1.4 $1.4 $2.0 $2.1
• Cost of credit related to energy was $19MM in 2Q’16
• 9.8% funded reserve ratio
• No junior / second lien exposure
North America
88%
LATAM5%
Asia7%

23
Region 2Q’16 1Q’16
North America 54 % 56 %
EMEA 26 25
Asia 12 12
Latin America 8 7
Total 100 % 100 %
ICG – Corporate Credit Exposure ex-Private Bank
Exposures
Industry Composition – % of Portfolio
Geographic Distribution – % of Portfolio
Ratings Detail – % of Portfolio
Note: 2Q’16 data is preliminary. Totals may not sum due to rounding.
Loan Type 2Q’16 1Q’16
Direct outstandings $234 $231
Unfunded lending commitments 342 351
Total $576 $582
2Q’16 1Q’16
AAA / AA / A 48 % 48 %
BBB 34 35
BB / B 15 15
CCC or below 2 2
Unrated - -
Total 100 % 100 %
Industry 2Q’16 1Q’16
Transportation and industrial 21% 21%
Consumer retail and health 17 16
Technology, media and telecom 11 11
Power, chemical, metals & mining 11 12
Energy 9 8
Banks / broker-dealers 7 7
Real estate 6 6
Public sector 5 5
Hedge funds 5 5
Insurance & special purpose
entities5 5
Other industries 3 4
Total 100% 100%
($B)

24
ICG – Corporate Energy Exposure
Key Takeaways 2Q’16
Energy(1) Subsector Exposures
Geographic Distribution as of 2Q’16(2)
Ratings Detail
Note: 2Q’16 data is preliminary. Totals may not sum due to rounding. ICG: Institutional Clients Group.
(1) Includes energy-related exposures classified in other industries on Slide 23, primarily Public Sector and Transportation.
(2) Total exposure includes direct outstandings (loans) and unfunded commitments.
(3) E&P: Exploration and Production. RBL: Reserve-Based Lending. Energy Process Industries includes Oil and Gas Storage & Transportation and Oil and Gas Refining &
Marketing. Services and Drilling includes Oil and Gas Equipment & Services, Oil and Gas Drilling and Offshore Drilling.
Funded Total Exposure(2)
2Q’16 1Q’16 2Q’16 1Q’16
AAA / AA / A 22 % 20 % 36 % 36 %
BBB 43 43 37 37
BB / B 18 20 18 17
CCC or below 17 17 10 10
Total 100 % 100 % 100 % 100 %
($B)
Funded
Total
Exposure(2)
2Q’16 1Q’16 2Q’16 1Q’16
Oil and Gas E&P(3) $6.5 $6.9 $15.2 $16.2
Memo: NA RBL(3) 1.2 1.4 2.6 3.0
Services and Drilling(3) 3.3 3.3 9.5 9.8
Energy Process
Industries(3) 5.4 5.3 15.1 15.1
Integrated Oil and Gas 5.8 5.6 14.8 13.8
Other 1.1 1.1 2.4 2.3
Total $22.1 $22.3 $56.9 $57.2
• Cost of credit related to energy was minimal in 2Q’16
• 3.9% funded reserve ratio
• ~73% of total exposures investment grade as of 2Q’16
North America
55%
LATAM6%
UK17%
Other EMEA10%
Asia13%

25
ICG – Unfunded Corporate Energy Exposure(1)
Facility Structure Ratings Detail
Subsector Ratings Detail Unfunded Exposures
Key Takeaways 2Q’16
Note: 2Q’16 data is preliminary. Totals may not sum due to rounding. ICG: Institutional Clients Group.
(1) Represents unfunded commitments. Includes energy-related exposures classified in other industries on Slide 23, primarily Public Sector and Transportation.
(2) E&P: Exploration and Production. Energy Process Industries includes Oil and Gas Storage & Transportation and Oil and Gas Refining & Marketing. Services and Drilling
includes Oil and Gas Equipment & Services, Oil and Gas Drilling and Offshore Drilling.
AAA /
AA / ABBB BB / B
CCC
or
below
Total
Oil and Gas E&P(2) $2.8 $2.6 $2.4 $0.9 $8.6
Services and Drilling(2) 3.0 1.0 1.7 0.6 6.2
Energy Process
Industries(2) 4.0 4.5 1.0 0.2 9.7
Integrated Oil and Gas 5.6 2.7 0.6 - 9.0
Other 0.2 0.6 0.4 0.1 1.3
Total $15.6 $11.4 $6.0 $1.8 $34.8
($B)
• Fronting exposure represents advances to borrowers on behalf of participating banks
• Letters of credit are generally short-term and trade-related
• Revolving exposures rated A or higher include, as an example, commercial paper backstop facilities
• Non-investment grade exposures are generally protected by maintenance covenants; ~20% of exposures are secured
AAA /
AA / ABBB BB / B
CCC
or
below
Total
Fronting Exposure $5.5 $0.6 $0.2 - $6.3
Letters of Credit 2.2 1.1 0.8 0.3 4.4
Revolving Facility &
Other7.9 9.6 5.1 1.5 24.1
Total $15.6 $11.4 $6.0 $1.8 $34.8
A
B
C D
A
B
C
D

26
$2.9 $2.6$0.9
$11.3
$0.0
$2.6
1Q'15 2Q'15 3Q'15 4Q'15 1Q'16 2Q'16
Benchmark Debt and Preferred Stock: Liability Management & Issuance
Liability Management Activity – Benchmark Debt Tenders / Buybacks
Issuance Volumes
($B)
Note: Totals may not sum due to rounding.
6.1 5.4 3.4
5.2 5.26.7
1.0 3.0
2.0 1.5 1.5
1.0
1.5 2.0
1.3 1.5 1.0
1.5 $8.6
$10.4
$6.7$8.2 $7.7
$9.1
1Q'15 2Q'15 3Q'15 4Q'15 1Q'16 2Q'16
Senior Unsecured Preferred StockSubordinated Debt
Benchmark:
Benchmark &
Preferred Stock:
$7.1$8.4
$5.4$6.7 $6.7
$7.6

27
Note:
(1) Offerings 2010 – present.
(2) Based on three-month LIBOR, as applicable.
(3) Citigroup Capital XIII represent trust preferred securities (TruPs) that are permanently grandfathered as Additional Tier 1 Capital under the U.S. Basel III rules.
(4) Reflects dividend to third party investors on TruPS.
Select Additional Tier 1 Capital Securities(1)
Preferred Stock & Trust Preferred Securities
Series
Par
Value Issue Date
Face Amount
($B)
Current Dividend
Rate First Call Date
Dividend Rate
After First Call
Date(2)
Series T $1,000 4/25/2016 $1.50 6.250% 8/15/2026 LIBOR + 4.517%
Series S 25 2/2/2016 1.04 6.300% 2/12/2021 6.300%
Series R 1,000 11/13/2015 1.50 6.125% 11/15/2020 LIBOR + 4.478%
Series Q 1,000 8/12/2015 1.25 5.950% 8/15/2020 LIBOR + 4.095%
Series P 1,000 4/24/2015 2.00 5.950% 5/15/2025 LIBOR + 3.905%
Series O 1,000 3/20/2015 1.50 5.875% 3/27/2020 LIBOR + 4.059%
Series N 1,000 10/29/2014 1.50 5.800% 11/15/2019 LIBOR + 4.093%
Series M 1,000 4/30/2014 1.75 6.300% 5/15/2024 LIBOR + 3.423%
Series L 25 2/12/2014 0.48 6.875% 2/12/2019 6.875%
Series K 25 10/31/2013 1.50 6.875% 11/15/2023 LIBOR + 4.130%
Series J 25 9/19/2013 0.95 7.125% 9/30/2023 LIBOR + 4.040%
Series D 1,000 4/30/2013 1.25 5.350% 5/15/2023 LIBOR + 3.466%
Series C 25 3/26/2013 0.58 5.800% 4/22/2018 5.800%
Series B 1,000 12/13/2012 0.75 5.900% 2/15/2023 LIBOR + 4.230%
Series A 1,000 10/29/2012 1.50 5.950% 1/30/2023 LIBOR + 4.068%
Citigroup Capital XIII(3) 25 10/05/2010 2.25 LIBOR + 6.37%(4) 10/30/2015 LIBOR + 6.370%
28
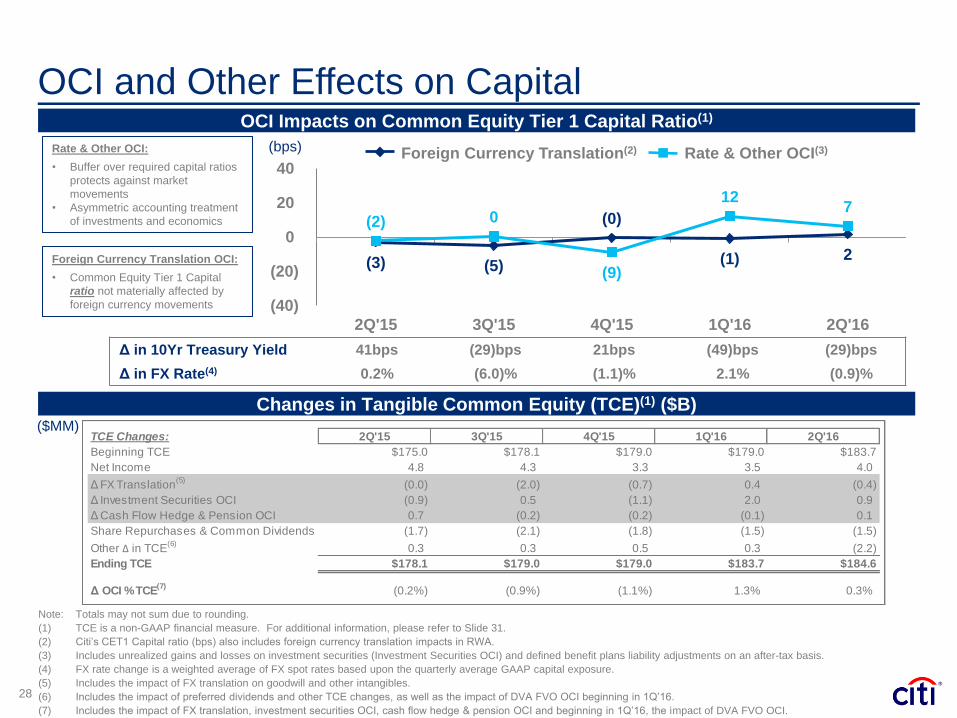
OCI and Other Effects on Capital
Note: Totals may not sum due to rounding.
(1) TCE is a non-GAAP financial measure. For additional information, please refer to Slide 31.
(2) Citi’s CET1 Capital ratio (bps) also includes foreign currency translation impacts in RWA.
(3) Includes unrealized gains and losses on investment securities (Investment Securities OCI) and defined benefit plans liability adjustments on an after-tax basis.
(4) FX rate change is a weighted average of FX spot rates based upon the quarterly average GAAP capital exposure.
(5) Includes the impact of FX translation on goodwill and other intangibles.
(6) Includes the impact of preferred dividends and other TCE changes, as well as the impact of DVA FVO OCI beginning in 1Q’16.
(7) Includes the impact of FX translation, investment securities OCI, cash flow hedge & pension OCI and beginning in 1Q’16, the impact of DVA FVO OCI.
OCI Impacts on Common Equity Tier 1 Capital Ratio(1)
Foreign Currency Translation OCI:
• Common Equity Tier 1 Capital
ratio not materially affected by
foreign currency movements
Rate & Other OCI:
• Buffer over required capital ratios
protects against market
movements
• Asymmetric accounting treatment
of investments and economics
Changes in Tangible Common Equity (TCE)(1) ($B)
Foreign Currency Translation(2) Rate & Other OCI(3)(bps)
(3) (5)
(0)
(1) 2
(2) 0
(9)
12 7
(40)
(20)
0
20
40
2Q'15 3Q'15 4Q'15 1Q'16 2Q'16
Δ in 10Yr Treasury Yield 41bps (29)bps 21bps (49)bps (29)bps
Δ in FX Rate(4) 0.2% (6.0)% (1.1)% 2.1% (0.9)%
($MM)TCE Changes: 2Q'15 3Q'15 4Q'15 1Q'16 2Q'16
Beginning TCE $175.0 $178.1 $179.0 $179.0 $183.7
Net Income 4.8 4.3 3.3 3.5 4.0
Δ FX Translation(5)
(0.0) (2.0) (0.7) 0.4 (0.4)
Δ Investment Securities OCI (0.9) 0.5 (1.1) 2.0 0.9
Δ Cash Flow Hedge & Pension OCI 0.7 (0.2) (0.2) (0.1) 0.1
Share Repurchases & Common Dividends (1.7) (2.1) (1.8) (1.5) (1.5)
Other Δ in TCE(6)
0.3 0.3 0.5 0.3 (2.2)
Ending TCE $178.1 $179.0 $179.0 $183.7 $184.6
Δ OCI % TCE(7)
(0.2%) (0.9%) (1.1%) 1.3% 0.3%

29
Rating Agency Perspectives
Rating
Notches to
Supported
Rating
Outlook Rating
Notches to
Supported
Rating
Outlook Rating
Notches to
Supported
Rating
Outlook
Citigroup Inc.
Senior Debt A - Stable BBB+ - Stable Baa1 2 Stable
Commercial Paper F1 A-2 P-2
Subordinated Debt A- BBB Baa3
Preferred Stock BB+ BB+ Ba2
Citibank, N.A.
Senior Debt A+ - Stable A 1 Positive A1 4 Stable
Long-Term Deposits AA- A A1
Short-Term Obligations F1 A-1 P-1
Fitch S&P Moody's
Recent Developments On June 14, 2016, Fitch affirmed Citigroup Inc.’s
Viability Rating (VR) and Long-Term Issuer
Default Rating (IDR) at ‘a/A’, respectively. At the
same time, Fitch affirmed Citibank, N.A.’s VR
and IDR at ‘a/A+’, respectively. The outlooks for
the Long-Term IDRs are Stable.
On December 2, 2015, as expected, S&P
downgraded the holding company ratings of all 8
U.S. GSIBs, including Citigroup Inc.’s, by one
notch, reflecting its view of the likelihood of
extraordinary government support to be
“uncertain.” As a result, Citigroup Inc.'s long-
term rating now stands at BBB+ and the outlook
was upgraded to "Stable." The short-term
rating of Citigroup Inc. remains at A-2.
The operating company ratings of the GSIBs
remained unchanged as S&P waits for further
clarity from the regulators regarding TLAC
eligibility of certain instruments. S&P has stated
it expects to conclude its credit watch within the
second half of 2016.
30
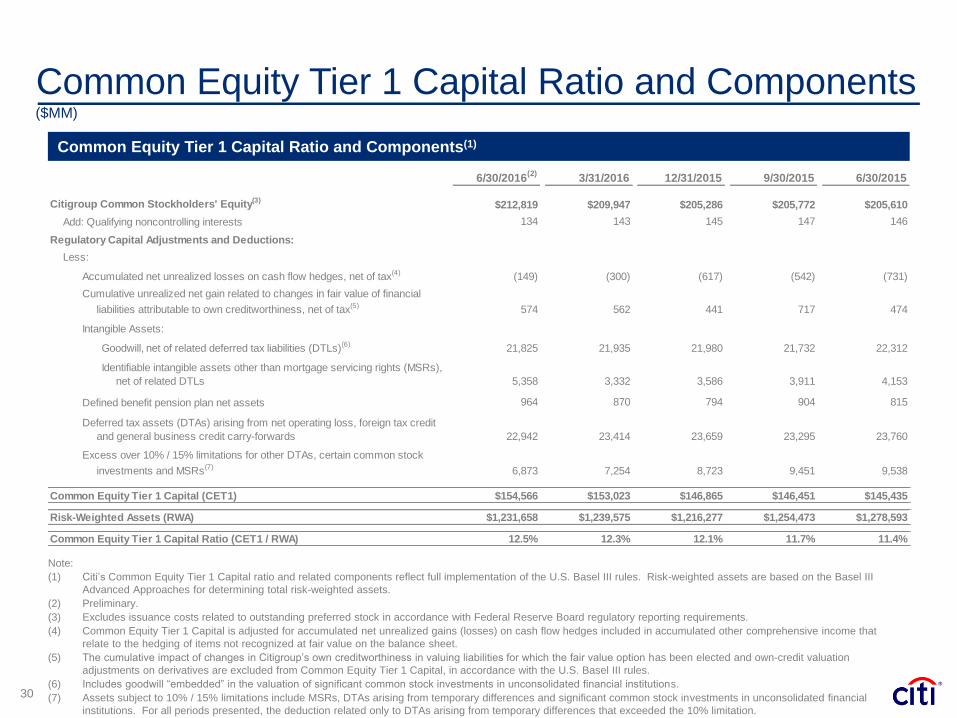
Common Equity Tier 1 Capital Ratio and Components(1)
($MM)
Note:
(1) Citi’s Common Equity Tier 1 Capital ratio and related components reflect full implementation of the U.S. Basel III rules. Risk-weighted assets are based on the Basel III
Advanced Approaches for determining total risk-weighted assets.
(2) Preliminary.
(3) Excludes issuance costs related to outstanding preferred stock in accordance with Federal Reserve Board regulatory reporting requirements.
(4) Common Equity Tier 1 Capital is adjusted for accumulated net unrealized gains (losses) on cash flow hedges included in accumulated other comprehensive income that
relate to the hedging of items not recognized at fair value on the balance sheet.
(5) The cumulative impact of changes in Citigroup’s own creditworthiness in valuing liabilities for which the fair value option has been elected and own-credit valuation
adjustments on derivatives are excluded from Common Equity Tier 1 Capital, in accordance with the U.S. Basel III rules.
(6) Includes goodwill “embedded” in the valuation of significant common stock investments in unconsolidated financial institutions.
(7) Assets subject to 10% / 15% limitations include MSRs, DTAs arising from temporary differences and significant common stock investments in unconsolidated financial
institutions. For all periods presented, the deduction related only to DTAs arising from temporary differences that exceeded the 10% limitation.
Common Equity Tier 1 Capital Ratio and Components
6/30/2016(2)
3/31/2016 12/31/2015 9/30/2015 6/30/2015
Citigroup Common Stockholders' Equity(3) $212,819 $209,947 $205,286 $205,772 $205,610
Add: Qualifying noncontrolling interests 134 143 145 147 146
Regulatory Capital Adjustments and Deductions:
Less:
Accumulated net unrealized losses on cash flow hedges, net of tax(4) (149) (300) (617) (542) (731)
Cumulative unrealized net gain related to changes in fair value of financial
liabilities attributable to own creditworthiness, net of tax(5) 574 562 441 717 474
Intangible Assets:
Goodwill, net of related deferred tax liabilities (DTLs)(6) 21,825 21,935 21,980 21,732 22,312
Identifiable intangible assets other than mortgage servicing rights (MSRs),
net of related DTLs 5,358 3,332 3,586 3,911 4,153
Defined benefit pension plan net assets 964 870 794 904 815
Deferred tax assets (DTAs) arising from net operating loss, foreign tax credit
and general business credit carry-forwards 22,942 23,414 23,659 23,295 23,760
Excess over 10% / 15% limitations for other DTAs, certain common stock
investments and MSRs(7) 6,873 7,254 8,723 9,451 9,538
Common Equity Tier 1 Capital (CET1) $154,566 $153,023 $146,865 $146,451 $145,435
Risk-Weighted Assets (RWA) $1,231,658 $1,239,575 $1,216,277 $1,254,473 $1,278,593
Common Equity Tier 1 Capital Ratio (CET1 / RWA) 12.5% 12.3% 12.1% 11.7% 11.4%

Supplementary Leverage Ratio and Components(1)
Tangible Common Equity
Supplementary Leverage Ratio; TCE Reconciliation
31
($MM, except per share amounts)
Note:
(1) Citi's Supplementary Leverage Ratio and related components reflect full implementation of the U.S. Basel III rules.
(2) Preliminary.
(3) Additional Tier 1 Capital primarily includes qualifying noncumulative perpetual preferred stock and qualifying trust preferred securities.
2Q'16(2) 1Q'16 4Q'15 3Q'15 2Q'15
Common Equity Tier 1 Capital (CET1) $154,566 $153,023 $146,865 $146,451 $145,435
Additional Tier 1 Capital (AT1)(3) 19,475 18,119 17,171 15,548 14,956
Total Tier 1 Capital (T1C) (CET1 + AT1) $174,041 $171,142 $164,036 $161,999 $160,391
Total Leverage Exposure (TLE) $2,328,601 $2,300,427 $2,317,849 $2,363,506 $2,386,189
Supplementary Leverage Ratio (T1C / TLE) 7.5% 7.4% 7.1% 6.9% 6.7%
2Q'16(2) 1Q'16 4Q'15 3Q'15 2Q'15
Total Citigroup Stockholders' Equity $231,888 $227,522 $221,857 $220,848 $219,440
Less: Preferred Stock 19,253 17,753 16,718 15,218 13,968
Common Equity $212,635 $209,769 $205,139 $205,630 $205,472
Less:
Goodwill 22,496 22,575 22,349 22,444 23,012
Intangible Assets (other than Mortgage Servicing Rights) 5,521 3,493 3,721 3,880 4,071
Goodwill and Intangible Assets (other than Mortgage Servicing
Rights) Related to Assets Held-for-Sale 30 30 68 345 274
Tangible Common Equity (TCE) $184,588 $183,671 $179,001 $178,961 $178,115
Common Shares Outstanding (CSO) 2,905 2,935 2,953 2,979 3,010
Tangible Book Value Per Share (TCE / CSO) $63.53 $62.58 $60.61 $60.07 $59.18

32
Adjusted Results and FX Impact Reconciliations($MM)
Note: Totals may not sum due to rounding.
(1) Net Interest Revenue (NIR) excludes the taxable equivalent adjustment.
Citigroup 2Q'16 1Q'16 2Q'15 1H'16 1H'15Reported Revenues (GAAP) $17,548 $17,555 $19,470 $35,103 $39,206
Impact of CVA / DVA - - 312 - 239
Adjusted Revenues $17,548 $17,555 $19,158 $35,103 $38,967
Reported Net Income (GAAP) $3,998 $3,501 $4,846 $7,499 $9,616
Impact of CVA / DVA - - 196 - 149
Adjusted Net Income $3,998 $3,501 $4,650 $7,499 $9,467
Preferred Dividends 322 210 202 532 330
Adjusted Net Income to Common $3,676 $3,291 $4,448 $6,967 $9,137
Reported EPS (GAAP) $1.24 $1.10 $1.51 $2.35 $3.02
Impact of CVA / DVA - - 0.06 - 0.05
Adjusted EPS 1.24 1.10 1.45 2.35 2.97
Average Assets ($B) $1,807 $1,778 $1,840 $1,793 $1,846
Adjusted ROA 0.89% 0.79% 1.01% 0.84% 1.03%
Average TCE $184,130 $181,336 $176,538 $182,420 $174,855
Adjusted ROTCE 8.0% 7.3% 10.1% 7.7% 10.5%
Citigroup 2Q'16 1Q'16 4Q'15 3Q'15 2Q'15
Reported Net Interest Revenue(1) $11,236 $11,227 $11,463 $11,773 $11,822
Impact of FX Translation - 55 (83) (139) (368)
Net Interest Revenue in Constant Dollars(1)
$11,236 $11,282 $11,380 $11,634 $11,454

33
FX Impact Reconciliations($B)
Note: Preliminary. Totals may not sum due to rounding.
Citigroup Assets 2Q'16 1Q'16 4Q'15 3Q'15 2Q'15Reported EOP Assets $1,819 $1,801 $1,731 $1,808 $1,829
Impact of FX Translation - (9) 5 2 (20)
EOP Assets in Constant Dollars $1,819 $1,792 $1,736 $1,810 $1,809
Reported EOP Fed Funds Sold / Rev. Repos $229 $225 $220 $232 $237
Impact of FX Translation - (2) 0 (1) (3)
EOP Fed Funds Sold / Rev. Repos in Constant Dollars $229 $223 $220 $231 $234
Reported EOP Trading Account Assets $272 $274 $250 $267 $279
Impact of FX Translation - (2) 1 (1) (5)
EOP Trading Account Assets in Constant Dollars $272 $272 $251 $266 $274
Reported EOP Loans $634 $619 $618 $622 $632
Impact of FX Translation - (4) (0) (1) (12)
EOP Loans in Constant Dollars $634 $615 $618 $621 $621
Citigroup Liabilities 2Q'16 1Q'16 4Q'15 3Q'15 2Q'15Reported EOP Fed Funds Purch. / Repos $158 $157 $146 $169 $177
Impact of FX Translation - (2) (2) (3) (4)
EOP Fed Funds Purch. / Repos in Constant Dollars $158 $155 $145 $166 $173
Reported EOP Trading Account Liabilities $136 $136 $118 $126 $136
Impact of FX Translation - (1) 1 (1) (2)
EOP Trading Account Liabilities in Constant Dollars $136 $135 $118 $125 $134
Reported EOP Deposits $938 $935 $908 $904 $908
Impact of FX Translation - (5) 0 (4) (17)
EOP Deposits in Constant Dollars $938 $929 $908 $901 $891
Citicorp 2Q'16 1Q'16 4Q'15 3Q'15 2Q'15Reported EOP Loans $592 $573 $569 $563 $568
Impact of FX Translation - (4) (1) (2) (11)
EOP Loans in Constant Dollars $592 $570 $568 $561 $557
Reported EOP Deposits $932 $925 $898 $894 $896
Impact of FX Translation - (6) (0) (2) (15)
EOP Deposits in Constant Dollars $932 $920 $897 $891 $881