Embed Size (px)
DESCRIPTION
Citi Bank
Citation preview
how to analyze your business using financial ratios
business builder 6
zions business resource center
zions business resource center 2
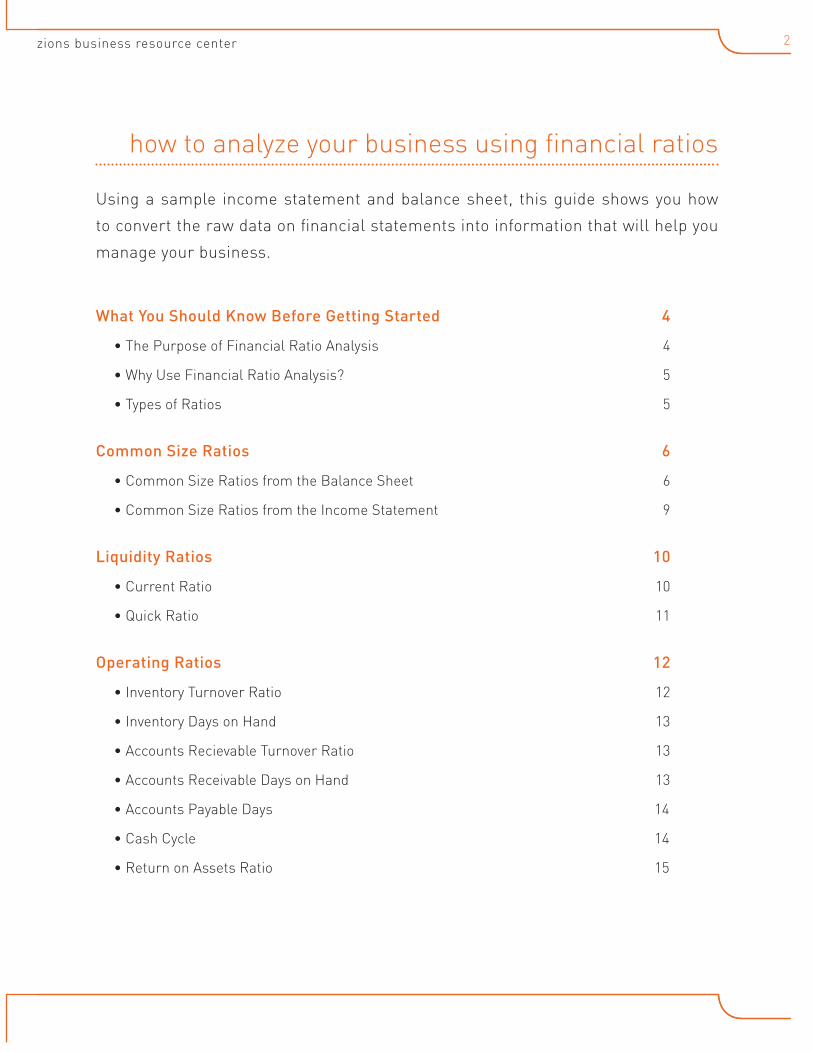
What You Should Know Before Getting Started 4
• The Purpose of Financial Ratio Analysis 4
• Why Use Financial Ratio Analysis? 5
• Types of Ratios 5
Common Size Ratios 6
• Common Size Ratios from the Balance Sheet 6
• Common Size Ratios from the Income Statement 9
Liquidity Ratios 10
• Current Ratio 10
• Quick Ratio 11
Operating Ratios 12
• Inventory Turnover Ratio 12
• Inventory Days on Hand 13
• Accounts Recievable Turnover Ratio 13
• Accounts Receivable Days on Hand 13
• Accounts Payable Days 14
• Cash Cycle 14
• Return on Assets Ratio 15
how to analyze your business using financial ratios
Using a sample income statement and balance sheet, this guide shows you how
to convert the raw data on financial statements into information that will help you
manage your business.

how to analyze your business using financial ratios 3
Solvency Ratios 15
• Debt-to-Worth Ratio 16
• Working Capital 16
• Net Sales to Working Capital 17
• Z-Score 17
Business Ratios 18
Financial Ratio Definitions 19
Checklist 20
Resources 21
Notes 22
zions business resource center 4
Many small and mid-sized companies are run by entrepreneurs who are highly skilled in some
key aspect of their business, perhaps technology, marketing or sales, but are less savvy in
financial matters. The goal of this document is to help you become familiar with some of the
most powerful and widely-used tools for analyzing the financial health of your company.
Some of the names, “common size ratios” and “liquidity ratios,” for example, may be unfamiliar.
However, nothing in the following pages is actually very difficult to calculate or complicated
to use. The payoff can be enormous. The goal of this document is to provide you with some
ways to look at how your company is doing compared to earlier periods of time, and how its
performance compares to other companies in your industry. Once you get comfortable with
these tools you will be able to turn the raw numbers in your company’s financial statements
into information that will help you to better manage your business.
what you should know before getting started
The Purpose of Financial Ratio Analysis
For most of us, accounting is not the easiest thing in the world to understand, and often the terminology used by accountants is part of the problem. “Financial ratio analysis” sounds pretty complicated. In fact, it is not. Think of it as “batting averages for business.”
If you want to compare the ability of two Major League home-run sluggers, you are likely to look at their batting averages. If one is hitting .357 and the other’s average is .244, you immediately know which is doing better, even if you don’t know precisely how a batting average is calculated. In fact, this classic sports statistic is a ratio: it’s the number of hits made by the batter, divided by the number of times the player was at bat. (For baseball purists, those are “official at-bats,” which is total appearances at the plate minus walks, sacrifice plays and any time the player was hit by a pitch.)
You can think of the batting average as a measure of a baseball player’s productivity; it is the ratio of hits made to the total opportunities to make a hit. Financial ratios measure your company’s productivity. There are many ratios you can use, but they all measure how good a job your company is doing in using its assets, generating profits from each dollar of sales, turning over inventory, or whatever aspect of your company’s operation you are evaluating.
what to expect
how to analyze your business using financial ratios 5
Why Use Financial Ratio Analysis?
The use of financial ratios is a time-tested method of analyzing a business. Wall Street investment firms, bank loan officers and knowledgeable business owners all use financial ratio analysis to learn more about a company’s current financial health as well as its potential.
Although it may be somewhat unfamiliar to you, financial ratio analysis is neither sophisticated nor complicated. It is nothing more than simple comparisons between specific pieces of information pulled from your company’s balance sheet and income statement.
A ratio, you will remember from school, is the relationship between two numbers. As your math teacher might have put it, it is “the relative size of two quantities, expressed as the quotient of one divided by the other.” If you are thinking about buying shares of a publicly-traded company, you might look at its price-earnings ratio. If the stock is selling for $60 per share, and the company’s earnings are $2 per share, the ratio of price ($60) to earnings ($2) is 30 to 1. In common usage, we would say the “P/E ratio is 30.”
Financial ratio analysis can be used in two different but equally useful ways. You can use them to examine the current performance of your company in comparison to past periods of time, from the prior quarter to years ago. Frequently, this can help you identify problems that need fixing. Even better, it can direct your attention to potential problems that can be avoided. In addition, you can use these ratios to compare the performance of your company against that of your competitors or other members of your industry.
Remember the ratios you will be calculating are intended simply to show broad trends and thus to help you with your decision-making. They need only to be accurate enough to be useful to you. Don’t get bogged down calculating ratios to more than one or two decimal places. Any change measured in hundredths of a percent will almost certainly have no meaning. Make sure your math is correct, but don’t agonize over it.
A ratio can be expressed in several ways. A ratio of two-to-one can be shown as:
2:1 2-to-1 2/1
In these pages, when we present a ratio in the text it will be written out, using the word “to.” If the ratio is in a formula, the slash sign (/) will be used to indicate division.
Types of Ratios
As you use this guide you will become familiar with the following types of ratios:
• Common size ratios
• Liquidity ratios
• Efficiency ratios
• Solvency ratios
zions business resource center 6
common size ratiosOne of the most useful ways for the owner of a small business to look at the company’s
financial statements is by using “common size” ratios. Common size ratios can be developed
from both balance sheet and income statement items. The phrase “common size ratio” may
be unfamiliar to you, but it is simple in concept and just as simple to create. You just calculate
each line item on the statement as a percentage of the total.
For example, each of the items on the income statement would be calculated as a percentage of total sales. (Divide each line item by total sales, then multiply each one by 100 to turn it into a percentage.) Similarly, items on the balance sheet would be calculated as percentages of total assets (or total liabilities plus owners’ equity).
This simple process converts numbers on your financial statements into information that you can use to make period-to-period and company-to-company comparisons. If you want to evaluate your cash position compared to the cash position of one of your key competitors, you need more information than what you have, say, $12,000 and he or she has $22,000. That’s a lot less informative than knowing that your company’s cash is equal to 7% of total assets, while your competitor’s cash is 9% of their assets. Common size ratios make comparisons more meaningful; they provide a context for your data.
Common Size Ratios from the Balance Sheet
To calculate common size ratios from your balance sheet, simply compute every asset category as a percentage of total assets, and every liability account as a percentage of total liabilities plus owners’ equity.
Common size ratios make comparisons more meaningful; they provide a context for your data.
how to analyze your business using financial ratios 7
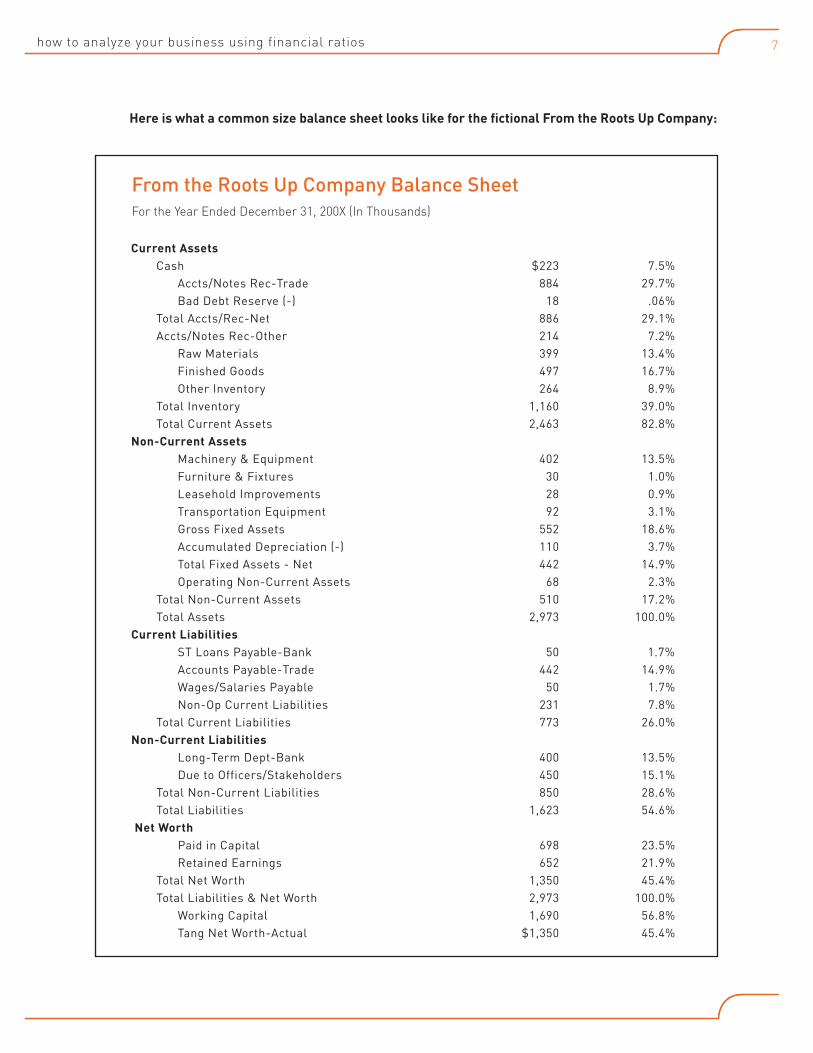
Here is what a common size balance sheet looks like for the fictional From the Roots Up Company:
Current Assets Cash $223 7.5% Accts/Notes Rec-Trade 884 29.7% Bad Debt Reserve (-) 18 .06% Total Accts/Rec-Net 886 29.1% Accts/Notes Rec-Other 214 7.2% Raw Materials 399 13.4% Finished Goods 497 16.7% Other Inventory 264 8.9% Total Inventory 1,160 39.0% Total Current Assets 2,463 82.8%Non-Current Assets Machinery & Equipment 402 13.5% Furniture & Fixtures 30 1.0% Leasehold Improvements 28 0.9% Transportation Equipment 92 3.1% Gross Fixed Assets 552 18.6% Accumulated Depreciation (-) 110 3.7% Total Fixed Assets - Net 442 14.9% Operating Non-Current Assets 68 2.3% Total Non-Current Assets 510 17.2% Total Assets 2,973 100.0%Current Liabilities ST Loans Payable-Bank 50 1.7% Accounts Payable-Trade 442 14.9% Wages/Salaries Payable 50 1.7% Non-Op Current Liabilities 231 7.8% Total Current Liabilities 773 26.0%Non-Current Liabilities Long-Term Dept-Bank 400 13.5% Due to Officers/Stakeholders 450 15.1% Total Non-Current Liabilities 850 28.6% Total Liabilities 1,623 54.6% Net Worth Paid in Capital 698 23.5% Retained Earnings 652 21.9% Total Net Worth 1,350 45.4% Total Liabilities & Net Worth 2,973 100.0% Working Capital 1,690 56.8% Tang Net Worth-Actual $1,350 45.4%
From the Roots Up Company Balance Sheet For the Year Ended December 31, 200X (In Thousands)
zions business resource center 8
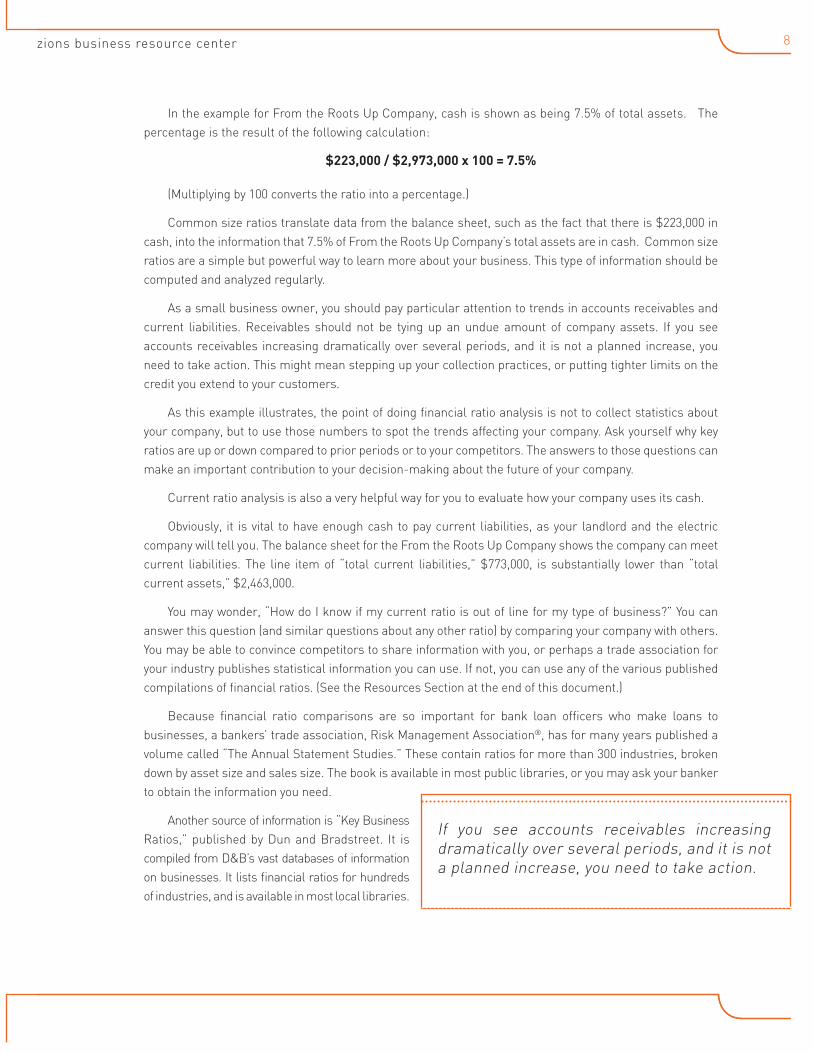
In the example for From the Roots Up Company, cash is shown as being 7.5% of total assets. The percentage is the result of the following calculation:
$223,000 / $2,973,000 x 100 = 7.5%
(Multiplying by 100 converts the ratio into a percentage.)
Common size ratios translate data from the balance sheet, such as the fact that there is $223,000 in cash, into the information that 7.5% of From the Roots Up Company’s total assets are in cash. Common size ratios are a simple but powerful way to learn more about your business. This type of information should be computed and analyzed regularly.
As a small business owner, you should pay particular attention to trends in accounts receivables and current liabilities. Receivables should not be tying up an undue amount of company assets. If you see accounts receivables increasing dramatically over several periods, and it is not a planned increase, you need to take action. This might mean stepping up your collection practices, or putting tighter limits on the credit you extend to your customers.
As this example illustrates, the point of doing financial ratio analysis is not to collect statistics about your company, but to use those numbers to spot the trends affecting your company. Ask yourself why key ratios are up or down compared to prior periods or to your competitors. The answers to those questions can make an important contribution to your decision-making about the future of your company.
Current ratio analysis is also a very helpful way for you to evaluate how your company uses its cash.
Obviously, it is vital to have enough cash to pay current liabilities, as your landlord and the electric company will tell you. The balance sheet for the From the Roots Up Company shows the company can meet current liabilities. The line item of “total current liabilities,” $773,000, is substantially lower than “total current assets,” $2,463,000.
You may wonder, “How do I know if my current ratio is out of line for my type of business?” You can answer this question (and similar questions about any other ratio) by comparing your company with others. You may be able to convince competitors to share information with you, or perhaps a trade association for your industry publishes statistical information you can use. If not, you can use any of the various published compilations of financial ratios. (See the Resources Section at the end of this document.)
Because financial ratio comparisons are so important for bank loan officers who make loans to businesses, a bankers’ trade association, Risk Management Association®, has for many years published a volume called “The Annual Statement Studies.” These contain ratios for more than 300 industries, broken down by asset size and sales size. The book is available in most public libraries, or you may ask your banker to obtain the information you need.
Another source of information is “Key Business Ratios,” published by Dun and Bradstreet. It is compiled from D&B’s vast databases of information on businesses. It lists financial ratios for hundreds of industries, and is available in most local libraries.
If you see accounts receivables increasing dramatically over several periods, and it is not a planned increase, you need to take action.
how to analyze your business using financial ratios 9
These and other similar publications will give you an industry standard or “benchmark” you can use to compare your firm to others. The ratios described in this guide, and many others, are included in these publications. While period-to-period comparisons based on your own company’s data are helpful, comparing your company’s performance with other similar businesses can be even more informative.
Step 1: Compute common size ratios using your company’s balance sheet.
Common Size Ratios from the Income Statement
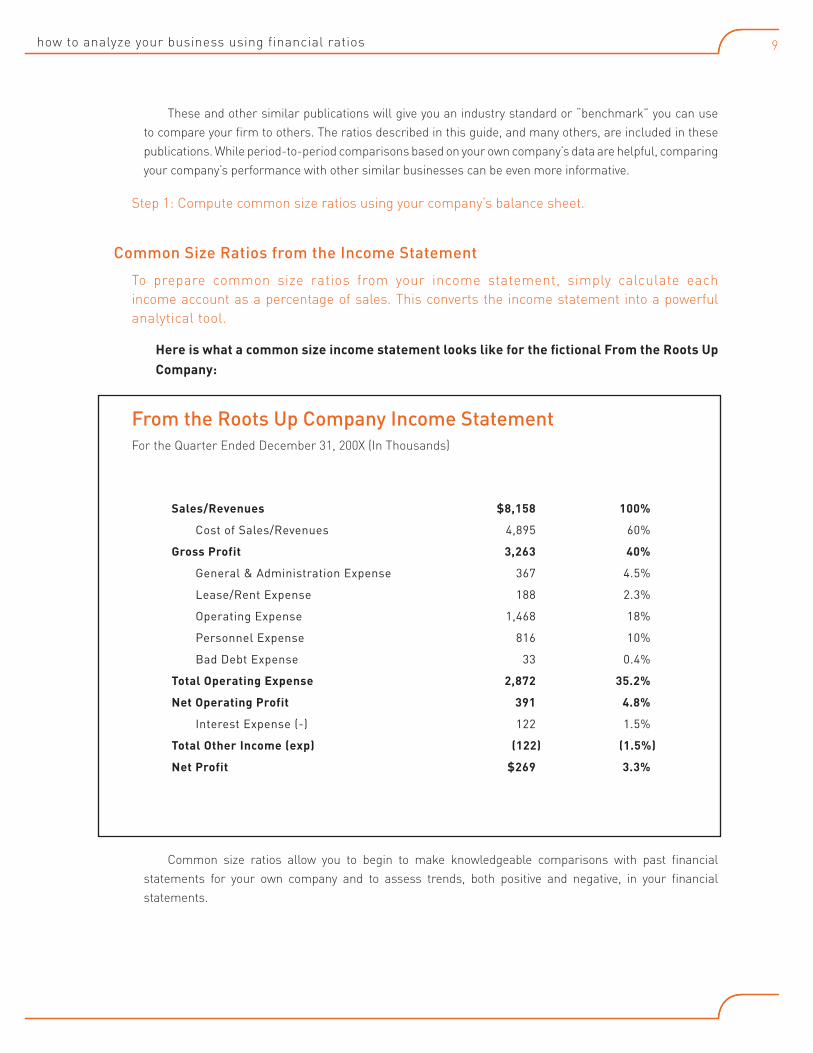
To prepare common size ratios from your income statement, simply calculate each income account as a percentage of sales. This converts the income statement into a powerful analytical tool.
Here is what a common size income statement looks like for the fictional From the Roots Up Company:
Common size ratios allow you to begin to make knowledgeable comparisons with past financial statements for your own company and to assess trends, both positive and negative, in your financial statements.
Sales/Revenues $8,158 100%
Cost of Sales/Revenues 4,895 60%
Gross Profit 3,263 40%
General & Administration Expense 367 4.5%
Lease/Rent Expense 188 2.3%
Operating Expense 1,468 18%
Personnel Expense 816 10%
Bad Debt Expense 33 0.4%
Total Operating Expense 2,872 35.2%
Net Operating Profit 391 4.8%
Interest Expense (-) 122 1.5%
Total Other Income (exp) (122) (1.5%)
Net Profit $269 3.3%
From the Roots Up Company Income Statement For the Quarter Ended December 31, 200X (In Thousands)
zions business resource center 10
The gross profit margin and the net profit margin ratios are two common size ratios to which small business owners should pay particular attention. On a common size income statement, these margins appear as the line items “gross profit” and “net profit.” For the From the Roots Up Company, the common size ratios show the gross profit margin is 4% of sales. This is computed by dividing gross profit by sales (and multiplying by 100 to create a percentage.)
$3,263,000 / $8,158,000 x 100 = 40%
Even small changes of 1% or 2% in the gross profit margin can affect a business severely. After all, if your profit margin drops from 5% of sales to 4%, that means your profits have declined by 20%.
Remember, your goal is to use the information provided by the common size ratios to start asking why changes have occurred, and what you should do in response. For example, if profit margins have declined unexpectedly, you probably will want to closely examine all expenses again, using the common size ratios for expense line items to help you spot significant changes.
Step 2: Compute common size ratios from your income statement.
liquidity ratios Liquidity ratios measure your company’s ability to cover its expenses. The two most common
liquidity ratios are the current ratio and the quick ratio. Both are based on balance sheet items.
Current Ratio
The current ratio is a reflection of financial strength. It is the number of times a company’s current assets exceed its current liabilities, which is an indication of the solvency of the business.
Here is the formula to compute the current ratio:
Current Ratio = Total current assets / Total current liabilities
Using the earlier balance sheet data for the fictional From the Roots Up Company, we can compute the company’s current ratio.
From the Roots Up Company Current Ratio:
$2,463,000 / $773,000 = 3.19
This tells the owners of the From the Roots Up Company that current liabilities are covered by current assets 3.19 times. The current ratio answers the question, “Does the business have enough current assets to meet the payment schedule of current liabilities with a margin of safety?”
Remember, your goal is to use the information provided by the common size ratios to start asking why changes have occurred, and what you should do in response.
how to analyze your business using financial ratios 11
A common rule of thumb is that a “good” current ratio is 2 to 1. Of course, the adequacy of a current ratio will depend on the nature of the business and the character of the current assets and current liabilities. There is usually very little uncertainty about the amount of debts that are due, but there can be considerable doubt about the quality of accounts receivable or the cash value of inventory. That’s why a safety margin is needed.
A current ratio can be improved by increasing current assets or by decreasing current liabilities. Steps to accomplish an improvement include:
• Paying down debt
• Acquiring a long-term loan (payable in more than 1 year’s time)
• Selling a fixed asset
• Putting profits back into the business
A high current ratio may mean cash is not being utilized in an optimal way. For example, the excess cash might be better invested in equipment.
Quick Ratio
The quick ratio is also called the “acid test” ratio. That’s because the quick ratio looks only at a company’s most liquid assets and compares them to current liabilities. The quick ratio tests whether a business can meet its obligations even if adverse conditions occur.
Here is the formula for the quick ratio:
Quick Ratio = (Total Current Assets - Total Inventory) / Total Current Liabilities
Assets considered to be “quick” assets include cash, stocks and bonds, and accounts receivable. In other words, all of the current assets on the balance sheet except inventory.
Using the balance sheet data for the From the Roots Up Company, we can compute the quick ratio for the company.
Quick ratio for the From the Roots Up Company:
($2,463,000 - $1,160,000) / $773,000 = 1.69
In general, quick ratios between 0.5 and 1 are considered satisfactory, as long as the collection of receivables is not expected to slow.
A current ratio can be improved by increasing current assets or by decreasing current liabilities.
zions business resource center 12
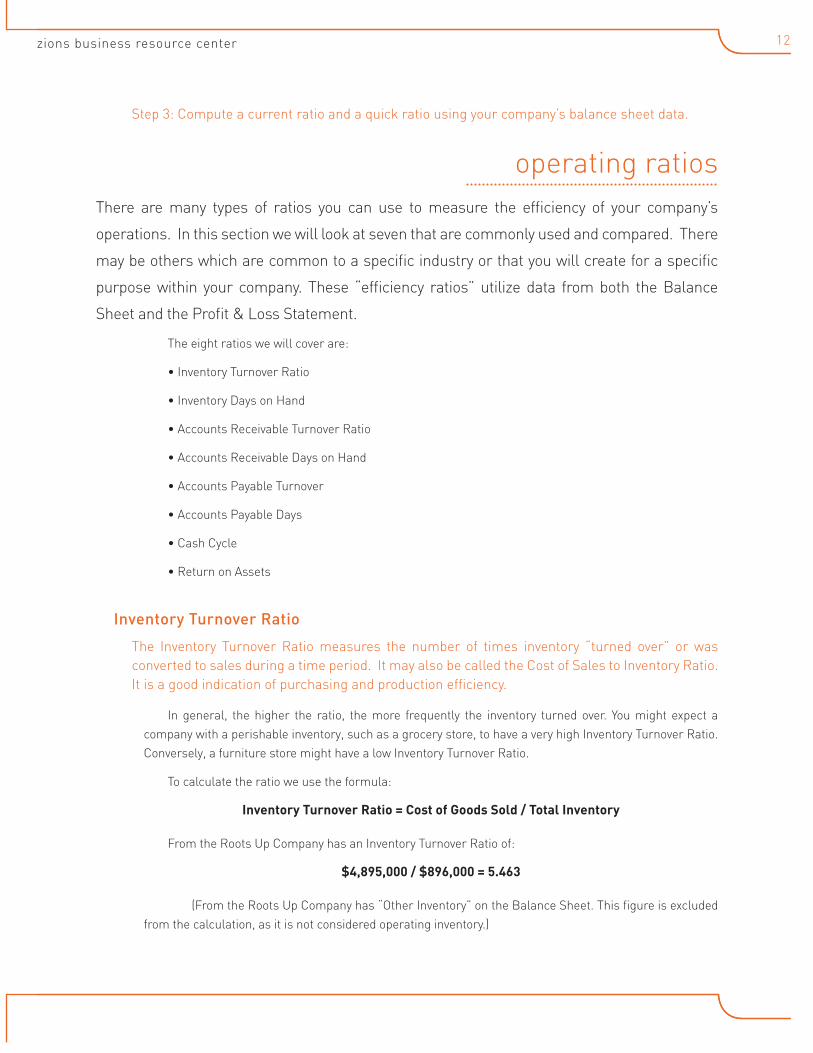
Step 3: Compute a current ratio and a quick ratio using your company’s balance sheet data.
operating ratios There are many types of ratios you can use to measure the efficiency of your company’s
operations. In this section we will look at seven that are commonly used and compared. There
may be others which are common to a specific industry or that you will create for a specific
purpose within your company. These “efficiency ratios” utilize data from both the Balance
Sheet and the Profit & Loss Statement.
The eight ratios we will cover are:
• Inventory Turnover Ratio
• Inventory Days on Hand
• Accounts Receivable Turnover Ratio
• Accounts Receivable Days on Hand
• Accounts Payable Turnover
• Accounts Payable Days
• Cash Cycle
• Return on Assets
Inventory Turnover Ratio
The Inventory Turnover Ratio measures the number of times inventory “turned over” or was converted to sales during a time period. It may also be called the Cost of Sales to Inventory Ratio. It is a good indication of purchasing and production efficiency.
In general, the higher the ratio, the more frequently the inventory turned over. You might expect a company with a perishable inventory, such as a grocery store, to have a very high Inventory Turnover Ratio. Conversely, a furniture store might have a low Inventory Turnover Ratio.
To calculate the ratio we use the formula:
Inventory Turnover Ratio = Cost of Goods Sold / Total Inventory
From the Roots Up Company has an Inventory Turnover Ratio of:
$4,895,000 / $896,000 = 5.463
(From the Roots Up Company has “Other Inventory” on the Balance Sheet. This figure is excluded from the calculation, as it is not considered operating inventory.)
how to analyze your business using financial ratios 13
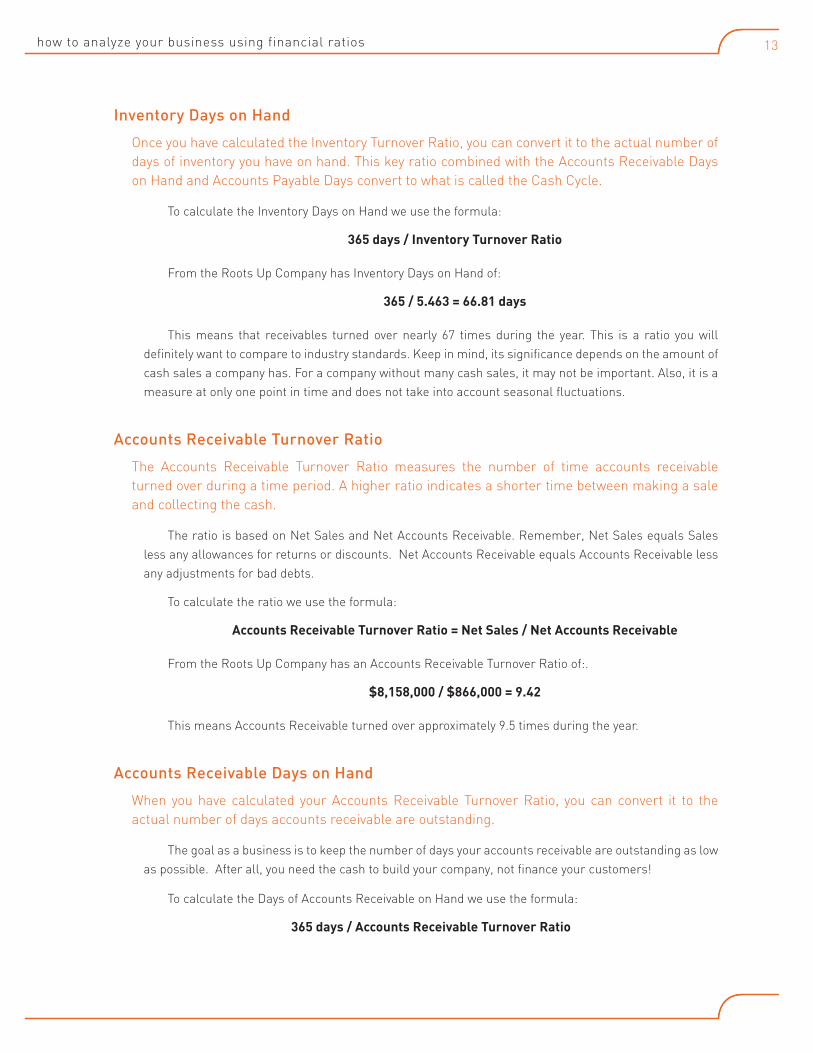
Inventory Days on Hand
Once you have calculated the Inventory Turnover Ratio, you can convert it to the actual number of days of inventory you have on hand. This key ratio combined with the Accounts Receivable Days on Hand and Accounts Payable Days convert to what is called the Cash Cycle.
To calculate the Inventory Days on Hand we use the formula:
365 days / Inventory Turnover Ratio
From the Roots Up Company has Inventory Days on Hand of:
365 / 5.463 = 66.81 days
This means that receivables turned over nearly 67 times during the year. This is a ratio you will definitely want to compare to industry standards. Keep in mind, its significance depends on the amount of cash sales a company has. For a company without many cash sales, it may not be important. Also, it is a measure at only one point in time and does not take into account seasonal fluctuations.
Accounts Receivable Turnover Ratio
The Accounts Receivable Turnover Ratio measures the number of time accounts receivable turned over during a time period. A higher ratio indicates a shorter time between making a sale and collecting the cash.
The ratio is based on Net Sales and Net Accounts Receivable. Remember, Net Sales equals Sales less any allowances for returns or discounts. Net Accounts Receivable equals Accounts Receivable less any adjustments for bad debts.
To calculate the ratio we use the formula:
Accounts Receivable Turnover Ratio = Net Sales / Net Accounts Receivable
From the Roots Up Company has an Accounts Receivable Turnover Ratio of:.
$8,158,000 / $866,000 = 9.42
This means Accounts Receivable turned over approximately 9.5 times during the year.
Accounts Receivable Days on Hand
When you have calculated your Accounts Receivable Turnover Ratio, you can convert it to the actual number of days accounts receivable are outstanding.
The goal as a business is to keep the number of days your accounts receivable are outstanding as low as possible. After all, you need the cash to build your company, not finance your customers!
To calculate the Days of Accounts Receivable on Hand we use the formula:
365 days / Accounts Receivable Turnover Ratio
zions business resource center 14
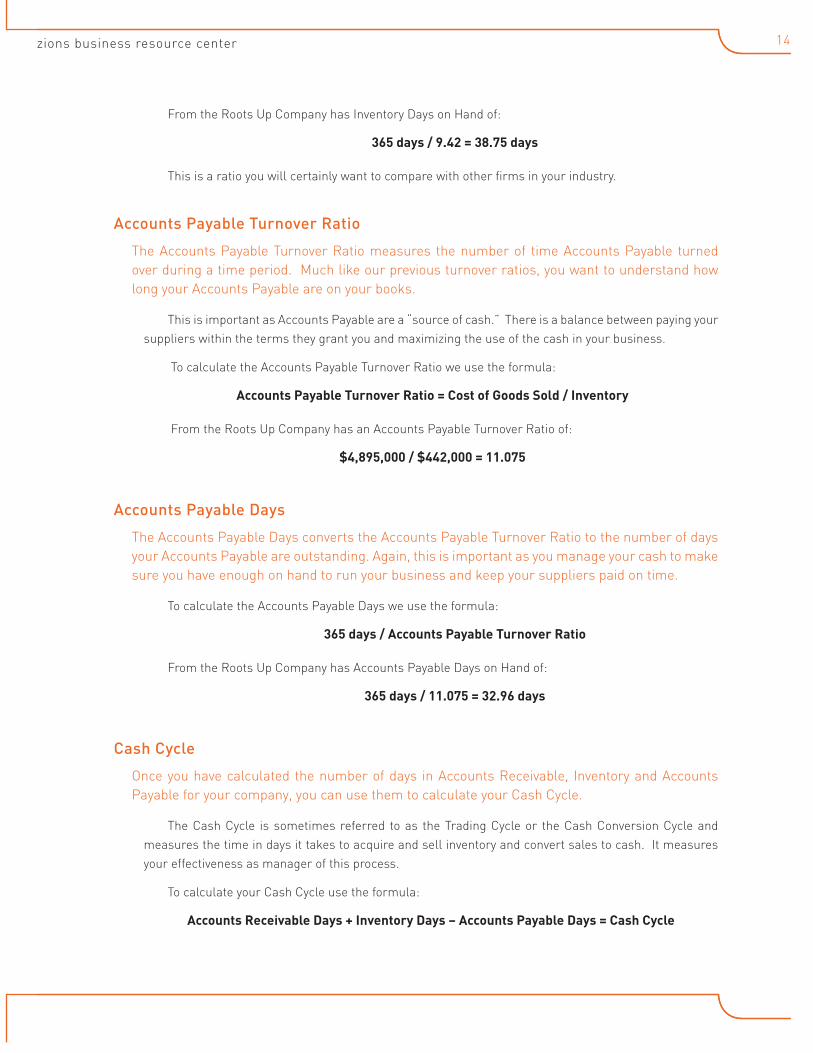
From the Roots Up Company has Inventory Days on Hand of:
365 days / 9.42 = 38.75 days
This is a ratio you will certainly want to compare with other firms in your industry.
Accounts Payable Turnover Ratio
The Accounts Payable Turnover Ratio measures the number of time Accounts Payable turned over during a time period. Much like our previous turnover ratios, you want to understand how long your Accounts Payable are on your books.
This is important as Accounts Payable are a “source of cash.” There is a balance between paying your suppliers within the terms they grant you and maximizing the use of the cash in your business.
To calculate the Accounts Payable Turnover Ratio we use the formula:
Accounts Payable Turnover Ratio = Cost of Goods Sold / Inventory
From the Roots Up Company has an Accounts Payable Turnover Ratio of:
$4,895,000 / $442,000 = 11.075
Accounts Payable Days
The Accounts Payable Days converts the Accounts Payable Turnover Ratio to the number of days your Accounts Payable are outstanding. Again, this is important as you manage your cash to make sure you have enough on hand to run your business and keep your suppliers paid on time.
To calculate the Accounts Payable Days we use the formula:
365 days / Accounts Payable Turnover Ratio
From the Roots Up Company has Accounts Payable Days on Hand of:
365 days / 11.075 = 32.96 days
Cash Cycle
Once you have calculated the number of days in Accounts Receivable, Inventory and Accounts Payable for your company, you can use them to calculate your Cash Cycle.
The Cash Cycle is sometimes referred to as the Trading Cycle or the Cash Conversion Cycle and measures the time in days it takes to acquire and sell inventory and convert sales to cash. It measures your effectiveness as manager of this process.
To calculate your Cash Cycle use the formula:
Accounts Receivable Days + Inventory Days – Accounts Payable Days = Cash Cycle
how to analyze your business using financial ratios 15
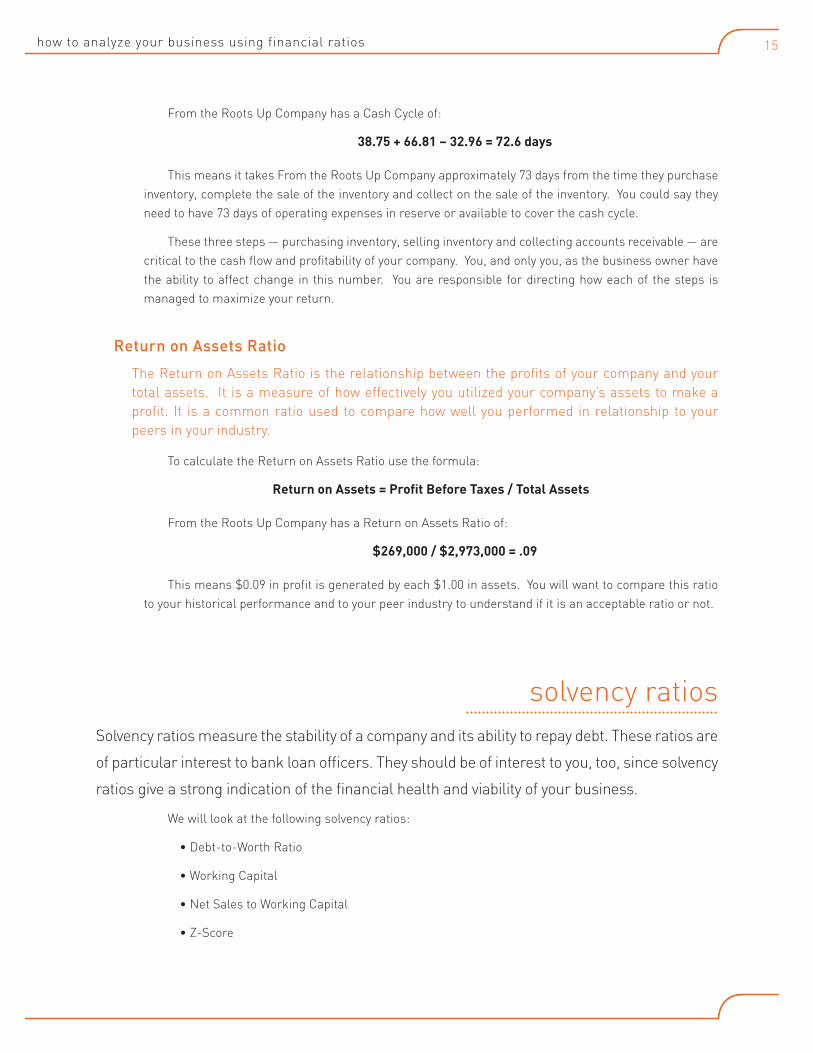
From the Roots Up Company has a Cash Cycle of:
38.75 + 66.81 – 32.96 = 72.6 days
This means it takes From the Roots Up Company approximately 73 days from the time they purchase inventory, complete the sale of the inventory and collect on the sale of the inventory. You could say they need to have 73 days of operating expenses in reserve or available to cover the cash cycle.
These three steps — purchasing inventory, selling inventory and collecting accounts receivable — are critical to the cash flow and profitability of your company. You, and only you, as the business owner have the ability to affect change in this number. You are responsible for directing how each of the steps is managed to maximize your return.
Return on Assets Ratio
The Return on Assets Ratio is the relationship between the profits of your company and your total assets. It is a measure of how effectively you utilized your company’s assets to make a profit. It is a common ratio used to compare how well you performed in relationship to your peers in your industry.
To calculate the Return on Assets Ratio use the formula:
Return on Assets = Profit Before Taxes / Total Assets
From the Roots Up Company has a Return on Assets Ratio of:
$269,000 / $2,973,000 = .09
This means $0.09 in profit is generated by each $1.00 in assets. You will want to compare this ratio to your historical performance and to your peer industry to understand if it is an acceptable ratio or not.
solvency ratios Solvency ratios measure the stability of a company and its ability to repay debt. These ratios are
of particular interest to bank loan officers. They should be of interest to you, too, since solvency
ratios give a strong indication of the financial health and viability of your business.
We will look at the following solvency ratios:
• Debt-to-Worth Ratio
• Working Capital
• Net Sales to Working Capital
• Z-Score
zions business resource center 16
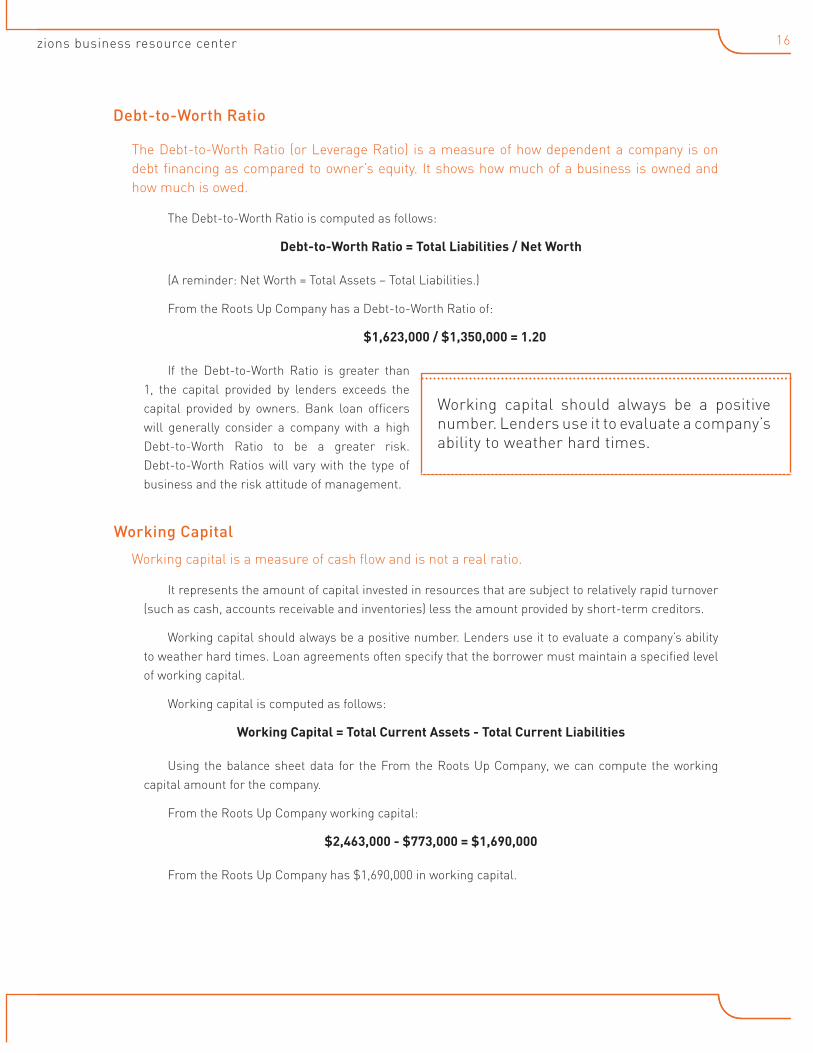
Debt-to-Worth Ratio
The Debt-to-Worth Ratio (or Leverage Ratio) is a measure of how dependent a company is on debt financing as compared to owner’s equity. It shows how much of a business is owned and how much is owed.
The Debt-to-Worth Ratio is computed as follows:
Debt-to-Worth Ratio = Total Liabilities / Net Worth
(A reminder: Net Worth = Total Assets – Total Liabilities.)
From the Roots Up Company has a Debt-to-Worth Ratio of:
$1,623,000 / $1,350,000 = 1.20
If the Debt-to-Worth Ratio is greater than 1, the capital provided by lenders exceeds the capital provided by owners. Bank loan officers will generally consider a company with a high Debt-to-Worth Ratio to be a greater risk. Debt-to-Worth Ratios will vary with the type of business and the risk attitude of management.
Working Capital
Working capital is a measure of cash flow and is not a real ratio.
It represents the amount of capital invested in resources that are subject to relatively rapid turnover (such as cash, accounts receivable and inventories) less the amount provided by short-term creditors.
Working capital should always be a positive number. Lenders use it to evaluate a company’s ability to weather hard times. Loan agreements often specify that the borrower must maintain a specified level of working capital.
Working capital is computed as follows:
Working Capital = Total Current Assets - Total Current Liabilities
Using the balance sheet data for the From the Roots Up Company, we can compute the working capital amount for the company.
From the Roots Up Company working capital:
$2,463,000 - $773,000 = $1,690,000
From the Roots Up Company has $1,690,000 in working capital.
Working capital should always be a positive number. Lenders use it to evaluate a company’s ability to weather hard times.
how to analyze your business using financial ratios 17
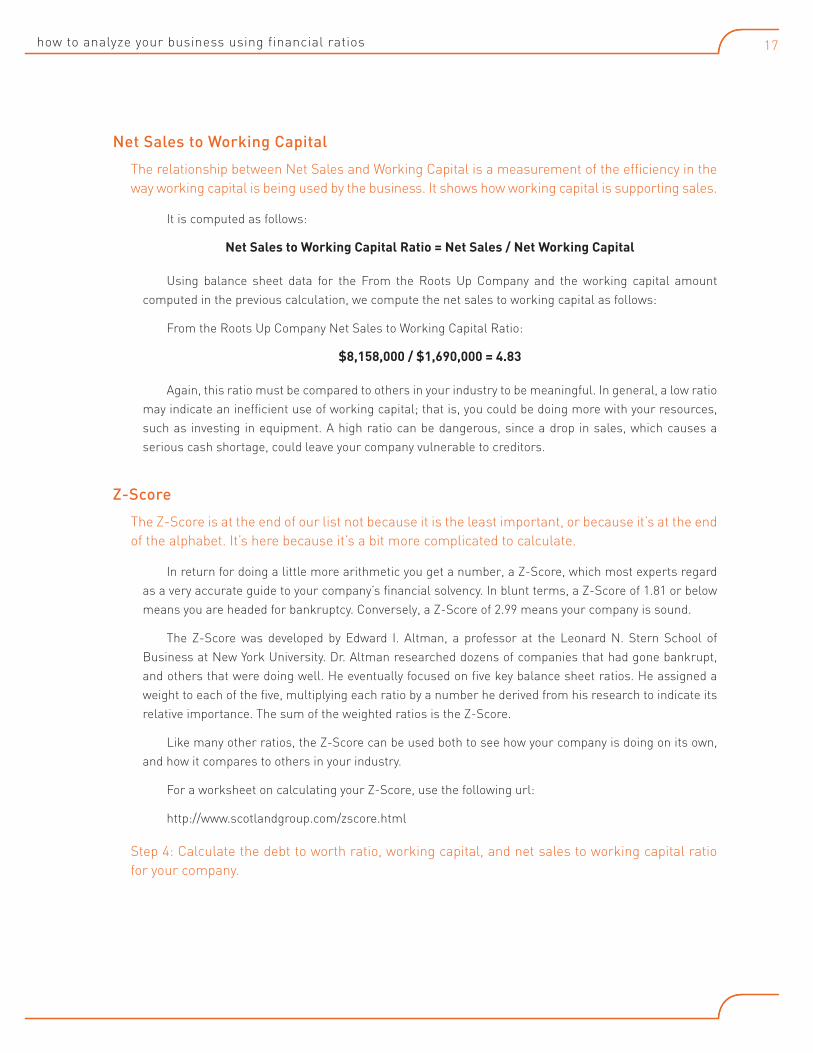
Net Sales to Working Capital
The relationship between Net Sales and Working Capital is a measurement of the efficiency in the way working capital is being used by the business. It shows how working capital is supporting sales.
It is computed as follows:
Net Sales to Working Capital Ratio = Net Sales / Net Working Capital
Using balance sheet data for the From the Roots Up Company and the working capital amount computed in the previous calculation, we compute the net sales to working capital as follows:
From the Roots Up Company Net Sales to Working Capital Ratio:
$8,158,000 / $1,690,000 = 4.83
Again, this ratio must be compared to others in your industry to be meaningful. In general, a low ratio may indicate an inefficient use of working capital; that is, you could be doing more with your resources, such as investing in equipment. A high ratio can be dangerous, since a drop in sales, which causes a serious cash shortage, could leave your company vulnerable to creditors.
Z-Score
The Z-Score is at the end of our list not because it is the least important, or because it’s at the end of the alphabet. It’s here because it’s a bit more complicated to calculate.
In return for doing a little more arithmetic you get a number, a Z-Score, which most experts regard as a very accurate guide to your company’s financial solvency. In blunt terms, a Z-Score of 1.81 or below means you are headed for bankruptcy. Conversely, a Z-Score of 2.99 means your company is sound.
The Z-Score was developed by Edward I. Altman, a professor at the Leonard N. Stern School of Business at New York University. Dr. Altman researched dozens of companies that had gone bankrupt, and others that were doing well. He eventually focused on five key balance sheet ratios. He assigned a weight to each of the five, multiplying each ratio by a number he derived from his research to indicate its relative importance. The sum of the weighted ratios is the Z-Score.
Like many other ratios, the Z-Score can be used both to see how your company is doing on its own, and how it compares to others in your industry.
For a worksheet on calculating your Z-Score, use the following url:
http://www.scotlandgroup.com/zscore.html
Step 4: Calculate the debt to worth ratio, working capital, and net sales to working capital ratio for your company.
zions business resource center 18
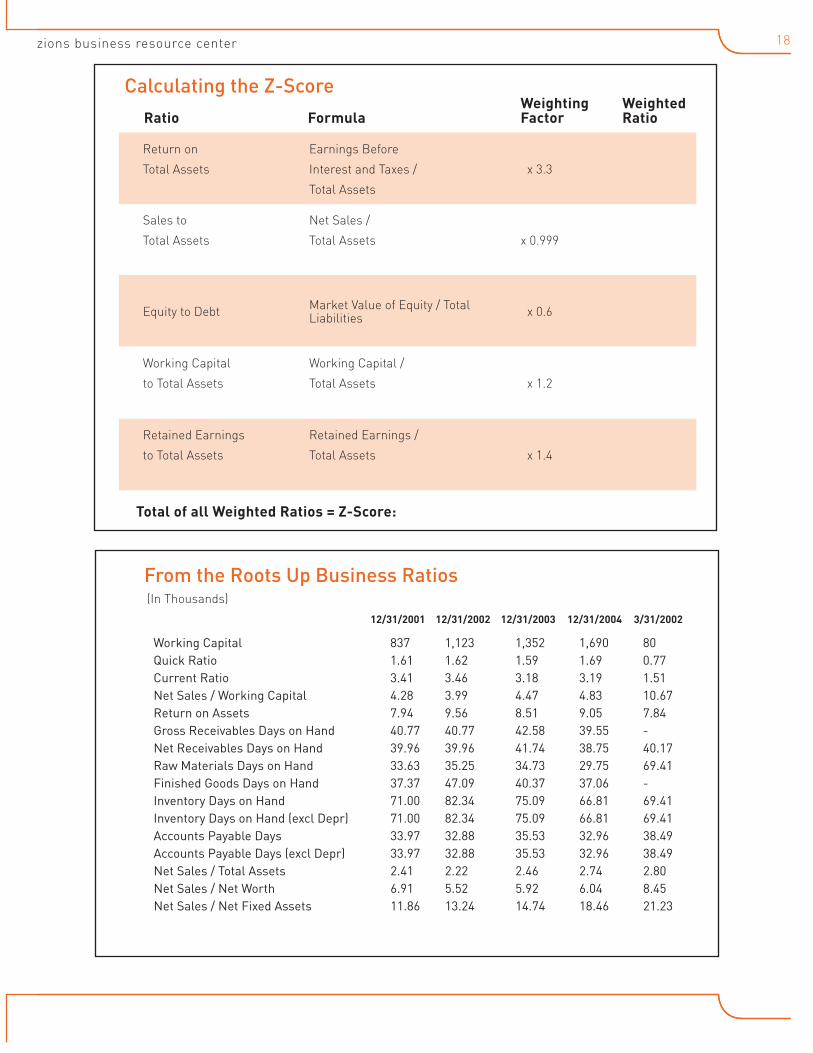
From the Roots Up Business Ratios
Working Capital 837 1,123 1,352 1,690 80 Quick Ratio 1.61 1.62 1.59 1.69 0.77 Current Ratio 3.41 3.46 3.18 3.19 1.51 Net Sales / Working Capital 4.28 3.99 4.47 4.83 10.67 Return on Assets 7.94 9.56 8.51 9.05 7.84 Gross Receivables Days on Hand 40.77 40.77 42.58 39.55 - Net Receivables Days on Hand 39.96 39.96 41.74 38.75 40.17 Raw Materials Days on Hand 33.63 35.25 34.73 29.75 69.41 Finished Goods Days on Hand 37.37 47.09 40.37 37.06 - Inventory Days on Hand 71.00 82.34 75.09 66.81 69.41 Inventory Days on Hand (excl Depr) 71.00 82.34 75.09 66.81 69.41 Accounts Payable Days 33.97 32.88 35.53 32.96 38.49 Accounts Payable Days (excl Depr) 33.97 32.88 35.53 32.96 38.49 Net Sales / Total Assets 2.41 2.22 2.46 2.74 2.80 Net Sales / Net Worth 6.91 5.52 5.92 6.04 8.45 Net Sales / Net Fixed Assets 11.86 13.24 14.74 18.46 21.23
12/31/2001 12/31/2002 12/31/2003 12/31/2004 3/31/2002
Return on
Total Assets
Earnings Before
Interest and Taxes /
Total Assets
x 3.3
Sales to
Total Assets
Net Sales /
Total Assets x 0.999
Equity to Debt Market Value of Equity / Total Liabilities x 0.6
Working Capital
to Total Assets
Working Capital /
Total Assets x 1.2
Retained Earnings
to Total Assets
Retained Earnings /
Total Assets x 1.4
Total of all Weighted Ratios = Z-Score:
Ratio FormulaWeighting Factor
Weighted Ratio
Calculating the Z-Score
(In Thousands)
how to analyze your business using financial ratios 19
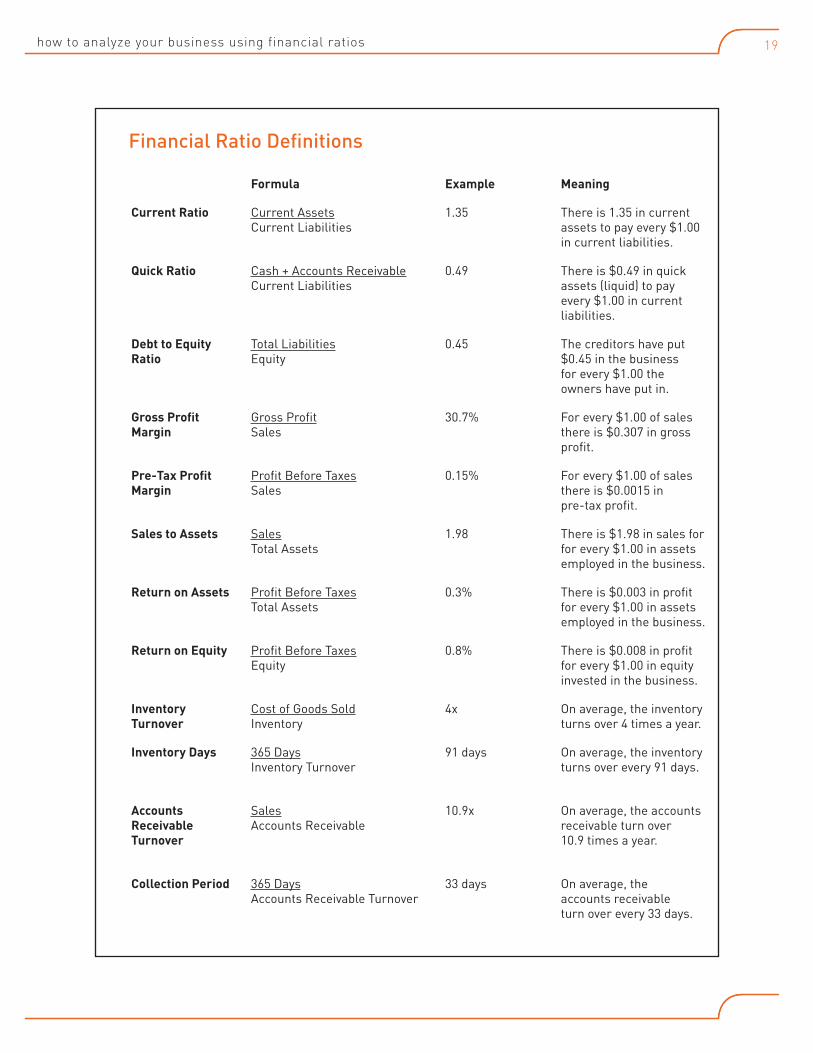
Financial Ratio Definitions
Formula Example Meaning
Current Ratio Current Assets 1.35 There is 1.35 in current Current Liabilities assets to pay every $1.00 in current liabilities.
Quick Ratio Cash + Accounts Receivable 0.49 There is $0.49 in quick Current Liabilities assets (liquid) to pay every $1.00 in current liabilities.
Debt to Equity Total Liabilities 0.45 The creditors have putRatio Equity $0.45 in the business for every $1.00 the owners have put in.
Gross Profit Gross Profit 30.7% For every $1.00 of salesMargin Sales there is $0.307 in gross profit.
Pre-Tax Profit Profit Before Taxes 0.15% For every $1.00 of salesMargin Sales there is $0.0015 in pre-tax profit.
Sales to Assets Sales 1.98 There is $1.98 in sales for Total Assets for every $1.00 in assets employed in the business.
Return on Assets Profit Before Taxes 0.3% There is $0.003 in profit Total Assets for every $1.00 in assets employed in the business.
Return on Equity Profit Before Taxes 0.8% There is $0.008 in profit Equity for every $1.00 in equity invested in the business.
Inventory Cost of Goods Sold 4x On average, the inventoryTurnover Inventory turns over 4 times a year.
Inventory Days 365 Days 91 days On average, the inventory Inventory Turnover turns over every 91 days.
Accounts Sales 10.9x On average, the accountsReceivable Accounts Receivable receivable turn overTurnover 10.9 times a year.
Collection Period 365 Days 33 days On average, the Accounts Receivable Turnover accounts receivable turn over every 33 days.
zions business resource center 20
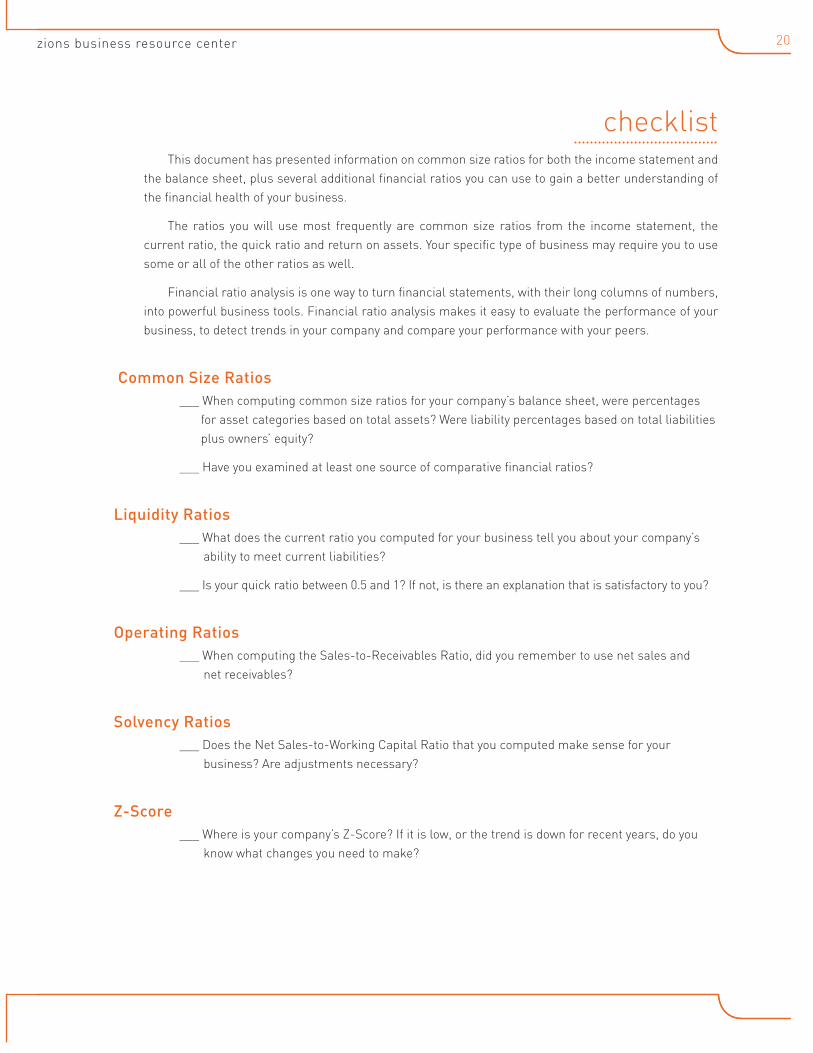
checklistThis document has presented information on common size ratios for both the income statement and
the balance sheet, plus several additional financial ratios you can use to gain a better understanding of the financial health of your business.
The ratios you will use most frequently are common size ratios from the income statement, the current ratio, the quick ratio and return on assets. Your specific type of business may require you to use some or all of the other ratios as well.
Financial ratio analysis is one way to turn financial statements, with their long columns of numbers, into powerful business tools. Financial ratio analysis makes it easy to evaluate the performance of your business, to detect trends in your company and compare your performance with your peers.
Common Size Ratios___ When computing common size ratios for your company’s balance sheet, were percentages for asset categories based on total assets? Were liability percentages based on total liabilities plus owners’ equity?
___ Have you examined at least one source of comparative financial ratios?
Liquidity Ratios___ What does the current ratio you computed for your business tell you about your company’s ability to meet current liabilities?
___ Is your quick ratio between 0.5 and 1? If not, is there an explanation that is satisfactory to you?
Operating Ratios___ When computing the Sales-to-Receivables Ratio, did you remember to use net sales and net receivables?
Solvency Ratios___ Does the Net Sales-to-Working Capital Ratio that you computed make sense for your business? Are adjustments necessary?
Z-Score___ Where is your company’s Z-Score? If it is low, or the trend is down for recent years, do you know what changes you need to make?
how to analyze your business using financial ratios 21
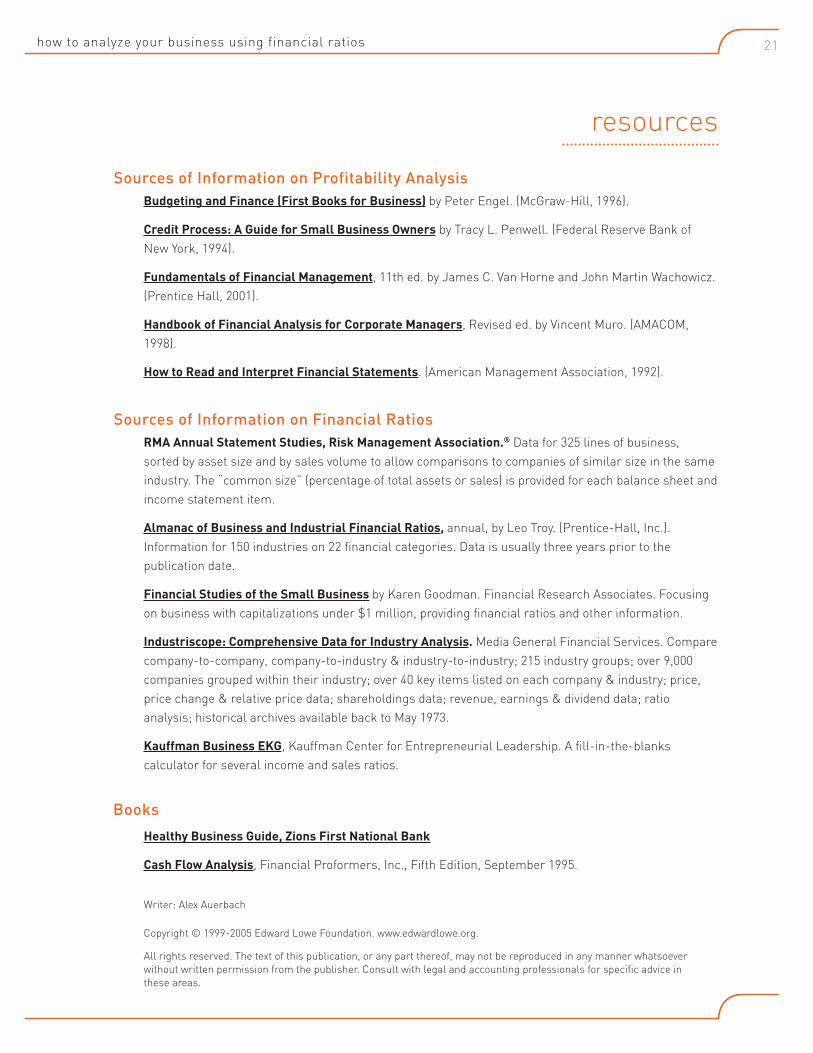
resources
Sources of Information on Profitability AnalysisBudgeting and Finance (First Books for Business) by Peter Engel. (McGraw-Hill, 1996).
Credit Process: A Guide for Small Business Owners by Tracy L. Penwell. (Federal Reserve Bank of New York, 1994).
Fundamentals of Financial Management, 11th ed. by James C. Van Horne and John Martin Wachowicz. (Prentice Hall, 2001).
Handbook of Financial Analysis for Corporate Managers, Revised ed. by Vincent Muro. (AMACOM, 1998).
How to Read and Interpret Financial Statements. (American Management Association, 1992).
Sources of Information on Financial RatiosRMA Annual Statement Studies, Risk Management Association.® Data for 325 lines of business, sorted by asset size and by sales volume to allow comparisons to companies of similar size in the same industry. The “common size” (percentage of total assets or sales) is provided for each balance sheet and income statement item.
Almanac of Business and Industrial Financial Ratios, annual, by Leo Troy. (Prentice-Hall, Inc.). Information for 150 industries on 22 financial categories. Data is usually three years prior to the publication date.
Financial Studies of the Small Business by Karen Goodman. Financial Research Associates. Focusing on business with capitalizations under $1 million, providing financial ratios and other information.
Industriscope: Comprehensive Data for Industry Analysis. Media General Financial Services. Compare company-to-company, company-to-industry & industry-to-industry; 215 industry groups; over 9,000 companies grouped within their industry; over 40 key items listed on each company & industry; price, price change & relative price data; shareholdings data; revenue, earnings & dividend data; ratio analysis; historical archives available back to May 1973.
Kauffman Business EKG, Kauffman Center for Entrepreneurial Leadership. A fill-in-the-blanks calculator for several income and sales ratios.
Books
Healthy Business Guide, Zions First National Bank
Cash Flow Analysis, Financial Proformers, Inc., Fifth Edition, September 1995.
Writer: Alex Auerbach
Copyright © 1999-2005 Edward Lowe Foundation. www.edwardlowe.org.
All rights reserved. The text of this publication, or any part thereof, may not be reproduced in any manner whatsoever without written permission from the publisher. Consult with legal and accounting professionals for specific advice in these areas.
zions business resource center 22
notes
__________________________________________________________________________________________
__________________________________________________________________________________________
__________________________________________________________________________________________
__________________________________________________________________________________________
__________________________________________________________________________________________
__________________________________________________________________________________________
__________________________________________________________________________________________
__________________________________________________________________________________________
__________________________________________________________________________________________
__________________________________________________________________________________________
__________________________________________________________________________________________
__________________________________________________________________________________________
__________________________________________________________________________________________
__________________________________________________________________________________________
__________________________________________________________________________________________
__________________________________________________________________________________________
__________________________________________________________________________________________
__________________________________________________________________________________________
__________________________________________________________________________________________
__________________________________________________________________________________________
__________________________________________________________________________________________
__________________________________________________________________________________________
__________________________________________________________________________________________
__________________________________________________________________________________________
__________________________________________________________________________________________
__________________________________________________________________________________________
__________________________________________________________________________________________
b-6
zionsbank.com®
310 S. Main, MezzanineSalt Lake City, UT 84101
Phone - 801.594.8245www.resources.zionsbank.com
Member FDIC