Embed Size (px)
Citation preview

Americas HeadquartersCisco Systems, Inc.170 West Tasman DriveSan Jose, CA 95134-1706 USAhttp://www.cisco.comTel: 408 526-4000
800 553-NETS (6387)Fax: 408 527-0883
Cisco Wide Area Application Services Monitoring GuideSoftware Version 5.0.1 November 14, 2012
Text Part Number: OL-26583-01

THE SPECIFICATIONS AND INFORMATION REGARDING THE PRODUCTS IN THIS MANUAL ARE SUBJECT TO CHANGE WITHOUT NOTICE. ALL STATEMENTS, INFORMATION, AND RECOMMENDATIONS IN THIS MANUAL ARE BELIEVED TO BE ACCURATE BUT ARE PRESENTED WITHOUT WARRANTY OF ANY KIND, EXPRESS OR IMPLIED. USERS MUST TAKE FULL RESPONSIBILITY FOR THEIR APPLICATION OF ANY PRODUCTS.
THE SOFTWARE LICENSE AND LIMITED WARRANTY FOR THE ACCOMPANYING PRODUCT ARE SET FORTH IN THE INFORMATION PACKET THAT SHIPPED WITH THE PRODUCT AND ARE INCORPORATED HEREIN BY THIS REFERENCE. IF YOU ARE UNABLE TO LOCATE THE SOFTWARE LICENSE OR LIMITED WARRANTY, CONTACT YOUR CISCO REPRESENTATIVE FOR A COPY.
The Cisco implementation of TCP header compression is an adaptation of a program developed by the University of California, Berkeley (UCB) as part of UCB’s public domain version of the UNIX operating system. All rights reserved. Copyright © 1981, Regents of the University of California.
NOTWITHSTANDING ANY OTHER WARRANTY HEREIN, ALL DOCUMENT FILES AND SOFTWARE OF THESE SUPPLIERS ARE PROVIDED “AS IS” WITH ALL FAULTS. CISCO AND THE ABOVE-NAMED SUPPLIERS DISCLAIM ALL WARRANTIES, EXPRESSED OR IMPLIED, INCLUDING, WITHOUT LIMITATION, THOSE OF MERCHANTABILITY, FITNESS FOR A PARTICULAR PURPOSE AND NONINFRINGEMENT OR ARISING FROM A COURSE OF DEALING, USAGE, OR TRADE PRACTICE.
IN NO EVENT SHALL CISCO OR ITS SUPPLIERS BE LIABLE FOR ANY INDIRECT, SPECIAL, CONSEQUENTIAL, OR INCIDENTAL DAMAGES, INCLUDING, WITHOUT LIMITATION, LOST PROFITS OR LOSS OR DAMAGE TO DATA ARISING OUT OF THE USE OR INABILITY TO USE THIS MANUAL, EVEN IF CISCO OR ITS SUPPLIERS HAVE BEEN ADVISED OF THE POSSIBILITY OF SUCH DAMAGES.
Cisco and the Cisco logo are trademarks or registered trademarks of Cisco and/or its affiliates in the U.S. and other countries. To view a list of Cisco trademarks, go to this URL: www.cisco.com/go/trademarks. Third-party trademarks mentioned are the property of their respective owners. The use of the word partner does not imply a partnership relationship between Cisco and any other company. (1110R)Any Internet Protocol (IP) addresses and phone numbers used in this document are not intended to be actual addresses and phone numbers. Any examples, command display output, network topology diagrams, and other figures included in the document are shown for illustrative purposes only. Any use of actual IP addresses or phone numbers in illustrative content is unintentional and coincidental.
Cisco Wide Area Application Services Monitoring Guide © 2010-2012 Cisco Systems, Inc. All rights reserved.
iiiCisco Wide Area Application Services Monitoring Guide
OL-26583-01
C O N T E N T S
Preface vii
Audience vii
Organization viii
Conventions viii
Related Documentation ix
Obtaining Documentation and Submitting a Service Request ix
C H A P T E R 1 Monitoring WAAS Using WAAS Central Manager 1-1
Accessing the Central Manager 1-1
Using the WAAS System Dashboard 1-1
Viewing Alarms 1-2
Viewing Device Information 1-3
Devices Window 1-3
Device Dashboard Window 1-5
Viewing Monitoring Reports 1-6
Viewing Network Reports 1-7
Viewing Network Summary Information 1-7
Viewing Network Topology 1-8
Viewing Optimization Reports 1-9
Viewing TCP Statistics 1-9
Viewing Connection Statistics 1-9
Viewing Connection Trends 1-11
Viewing Acceleration Reports 1-11
Viewing HTTPS Acceleration Statistics 1-12
Viewing AppNav Reports 1-12
Viewing Platform Reports 1-13
Monitoring Logs and System Messages 1-14
Viewing the System Message Log 1-14
Viewing the Audit Trail Log 1-15
Viewing the Device Log 1-15
Viewing System Properties 1-16
Running CLI Commands from the WAAS Central Manager GUI 1-16
show cms info Command 1-17
show wccp status Command Output 1-18
Contents
ivCisco Wide Area Application Services Monitoring Guide
OL-26583-01
show wccp statistics Command Output 1-18
show statistics connection Command Output 1-18
show statistics connection optimized http Command Output 1-19
show statistics dre Command Output 1-20
show statistics tfo Command Output 1-20
show interface GigabitEthernet Command Output 1-21
show ip access-list Command Output 1-21
C H A P T E R 2 Monitoring Traffic Interception 2-1
Verifying WCCPv2 Interception 2-1
show ip wccp IOS Command Output 2-1
show wccp WAAS Command Outputs 2-6
show wccp services Command Output 2-6
show wccp status Command Output 2-6
show wccp routers Command Output 2-6
show wccp statistics Command Output 2-7
Verifying Inline Interception 2-7
show interface inlineGroup Command Output 2-7
show interface InlinePort Command Output 2-7
C H A P T E R 3 Monitoring WAAS Using SNMP 3-1
Information About Supported MIBs 3-1
Downloading Supported MIBs 3-3
Working with SNMP Traps 3-3
Enabling SNMP Traps 3-3
Viewing SNMP Trigger Lists 3-4
Defining New Traps 3-5
Information About Common SNMP MIB OIDS 3-6
cceAlarmCriticalRaised OID 3-6
coldStart OID 3-7
cceAlarmCriticalCleared OID 3-7
cceFailedDiskName OID 3-8
ciscoContentEngineDiskFailed OID 3-8
C H A P T E R 4 Monitoring WAAS Using XML API 4-1
Information About the XML-Based API 4-1
Using the Traffic Acceleration Service 4-2
Using the Events and Status Service 4-2
Contents
vCisco Wide Area Application Services Monitoring Guide
OL-26583-01
Using soapUI to Access the WAAS API Interface 4-3
C H A P T E R 5 Monitoring WAAS Using Cisco Network Analysis Module 5-1
Information About NAM 5-1
Information About NAM Monitoring Functions 5-2
Configuring NAM Monitoring of WAAS Devices 5-3
Configuring Basic WAAS Setup 5-3
Configuring WAAS Monitored Servers 5-4
Configuring WAAS Data Sources in NAM 5-5
NAM Deployment Scenarios 5-6
Monitoring and Analyzing Traffic Using the NAM 5-7
NAM Metrics 5-7
Top Talkers Dashboards 5-8
Traffic Summary 5-8
Top Talkers Details 5-10
Throughput Dashboards 5-10
Network 5-10
Top Applications 5-10
Application 5-11
Performance Analysis Dashboards 5-11
Application 5-11
Conversation Multisegments 5-12

Contents
viCisco Wide Area Application Services Monitoring Guide
OL-26583-01
viiCisco Wide Area Application Services Monitoring Guide
OL-26583-01
Preface
This preface describes the audience, organization, and conventions of the Cisco Wide Area Application Services Monitoring Guide. It also provides information about how to obtain related information.
AudienceThis publication is for experienced system and network administrators who have specific knowledge in the following areas:
• Networking and data communications
• Network security
• Router and switch configuration
viiiCisco Wide Area Application Services Monitoring Guide
OL-26583-01
Preface
OrganizationThis publication is organized as follows:
ConventionsThis document uses the following conventions:
Note Means reader take note. Notes contain helpful suggestions or references to material not covered in the publication.
Caution Means reader be careful. In this situation, you might do something that could result in equipment damage or loss of data.
Chapter Description
Chapter 1, “Monitoring WAAS Using WAAS Central Manager”
Describes how to use WAAS Central Manager to monitor your WAAS devices.
Chapter 2, “Monitoring Traffic Interception”
Describes different methods to monitor traffic interception.
Chapter 3, “Monitoring WAAS Using SNMP”
Describes how to use SNMP to monitor your WAAS devices.
Chapter 4, “Monitoring WAAS Using XML API”
Describes how to use WAAS XML API to monitor your WAAS devices.
Chapter 5, “Monitoring WAAS Using Cisco Network Analysis Module”
Describes how to use Cisco Network Analysis to monitor your WAAS devices.
Item Convention
Commands and keywords boldface font
Variables for which you supply values italic font
Displayed session and system information screen font
Information you enter boldface screen font
Variables you enter italic screen font
Menu items and button names boldface font
Selecting a menu item in paragraphs Option > Network Preferences
Selecting a menu item in tables Option > Network Preferences
ixCisco Wide Area Application Services Monitoring Guide
OL-26583-01
Preface
Related DocumentationFor additional information on the Cisco WAAS software and hardware, see the following documentation:
• Release Note for Cisco Wide Area Application Services
• Cisco Wide Area Application Services Upgrade Guide
• Cisco Wide Area Application Services Command Reference
• Cisco Wide Area Application Services Quick Configuration Guide
• Cisco Wide Area Application Services Configuration Guide
• Cisco Wide Area Application Services API Reference
• Cisco WAAS Troubleshooting Guide for Release 4.1.3 and Later
• Cisco Wide Area Application Services Monitoring Guide (this manual)
• Cisco Wide Area Application Services vWAAS Installation and Configuration Guide
• Cisco WAAS Installation and Configuration Guide for Windows on a Virtual Blade
• Configuring WAAS Express
• Cisco WAAS on Service Modules for Cisco Access Routers
• Cisco SRE Service Module Configuration and Installation Guide
• Configuring Cisco WAAS Network Modules for Cisco Access Routers
• WAAS Enhanced Network Modules
• Regulatory Compliance and Safety Information for the Cisco Wide Area Virtualization Engines
• Cisco Wide Area Virtualization Engine 294 Hardware Installation Guide
• Cisco Wide Area Virtualization Engine 594 and 694 Hardware Installation Guide
• Cisco Wide Area Virtualization Engine 7541, 7571, and 8541 Hardware Installation Guide
• Cisco Wide Area Virtualization Engine 274 and 474 Hardware Installation Guide
• Cisco Wide Area Virtualization Engine 574 Hardware Installation Guide
• Regulatory Compliance and Safety Information for the Cisco Content Networking Product Series
• Cisco Wide Area Application Engine 7341, 7371, and 674 Hardware Installation Guide
• Installing the Cisco WAE Inline Network Adapter
Obtaining Documentation and Submitting a Service RequestFor information about obtaining documentation, submitting a service request, and gathering additional information, see the monthly What’s New in Cisco Product Documentation, which also lists all new and revised Cisco technical documentation, at:
http://www.cisco.com/en/US/docs/general/whatsnew/whatsnew.html
Subscribe to the What’s New in Cisco Product Documentation as a Really Simple Syndication (RSS) feed and set content to be delivered directly to your desktop using a reader application. The RSS feeds are a free service and Cisco currently supports RSS version 2.0.

xCisco Wide Area Application Services Monitoring Guide
OL-26583-01
Preface
C H A P T E R
1-1Cisco Wide Area Application Services Monitoring Guide
OL-26583-01
1Monitoring WAAS Using WAAS Central Manager
This chapter describes how to use WAAS Central Manager to monitor network health, device health, and traffic interception of your WAAS system.
This chapter contains the following sections:
• Accessing the Central Manager, page 1-1
• Using the WAAS System Dashboard, page 1-1
• Viewing Alarms, page 1-2
• Viewing Device Information, page 1-3
• Viewing Monitoring Reports, page 1-6
• Monitoring Logs and System Messages, page 1-14
• Viewing System Properties, page 1-16
• Running CLI Commands from the WAAS Central Manager GUI, page 1-16
For more information about using WAAS Central Manager, see the “Monitoring and Troubleshooting Your WAAS Network” chapter in the Cisco Wide Area Application Services Configuration Guide.
Accessing the Central ManagerFrom a secure web browser, log in to WAAS Central Manager using either its hostname or IP address on port 8443 as follows:
https://CM-Host-Name_or_IP Address:8443
You must have proper username and password credentials to log in to WAAS Central Manager.
You initially open to a view of the WAAS System Dashboard, from which you can monitor your WAAS system. When you choose a device from the Devices menu, you move to the a view of the Device Dashboard, from which you can monitor specific device activity and performance.
Using the WAAS System DashboardThe WAAS Central Manager GUI allows you to view general and detailed information about your WAAS network from the System Dashboard window, which is shown in Figure 1-1.
1-2Cisco Wide Area Application Services Monitoring Guide
OL-26583-01
Chapter 1 Monitoring WAAS Using WAAS Central ManagerViewing Alarms
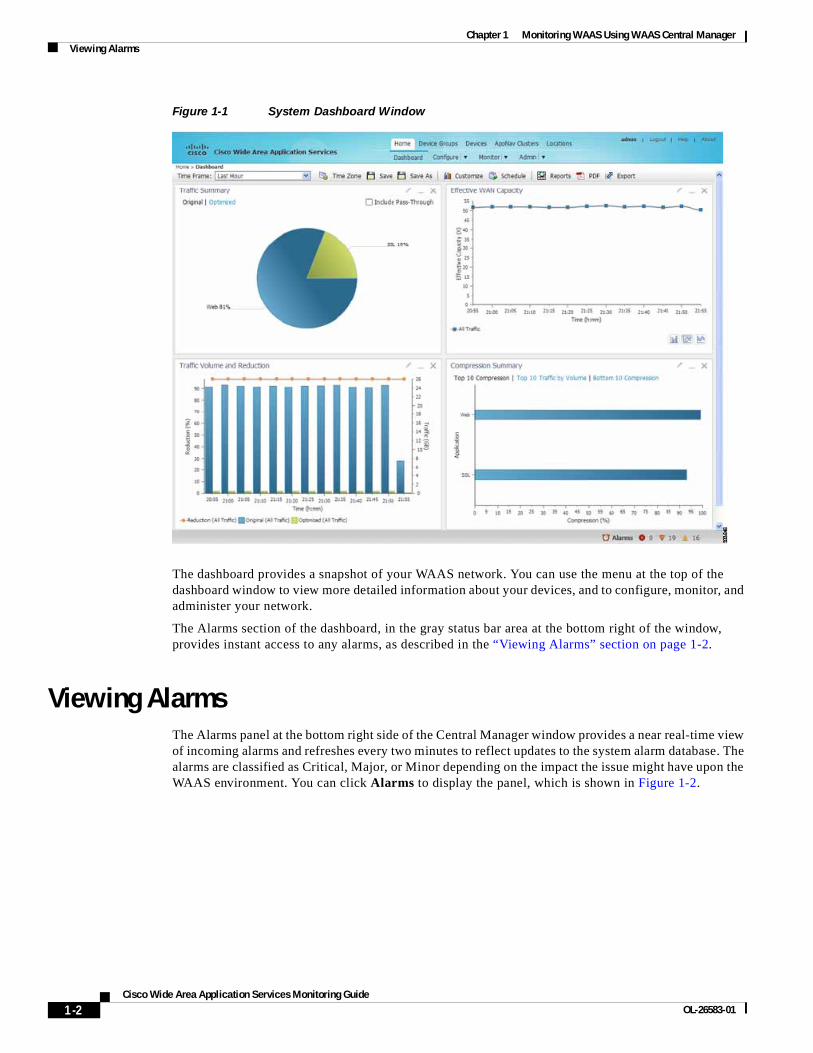
Figure 1-1 System Dashboard Window
The dashboard provides a snapshot of your WAAS network. You can use the menu at the top of the dashboard window to view more detailed information about your devices, and to configure, monitor, and administer your network.
The Alarms section of the dashboard, in the gray status bar area at the bottom right of the window, provides instant access to any alarms, as described in the “Viewing Alarms” section on page 1-2.
Viewing AlarmsThe Alarms panel at the bottom right side of the Central Manager window provides a near real-time view of incoming alarms and refreshes every two minutes to reflect updates to the system alarm database. The alarms are classified as Critical, Major, or Minor depending on the impact the issue might have upon the WAAS environment. You can click Alarms to display the panel, which is shown in Figure 1-2.
1-3Cisco Wide Area Application Services Monitoring Guide
OL-26583-01
Chapter 1 Monitoring WAAS Using WAAS Central ManagerViewing Device Information
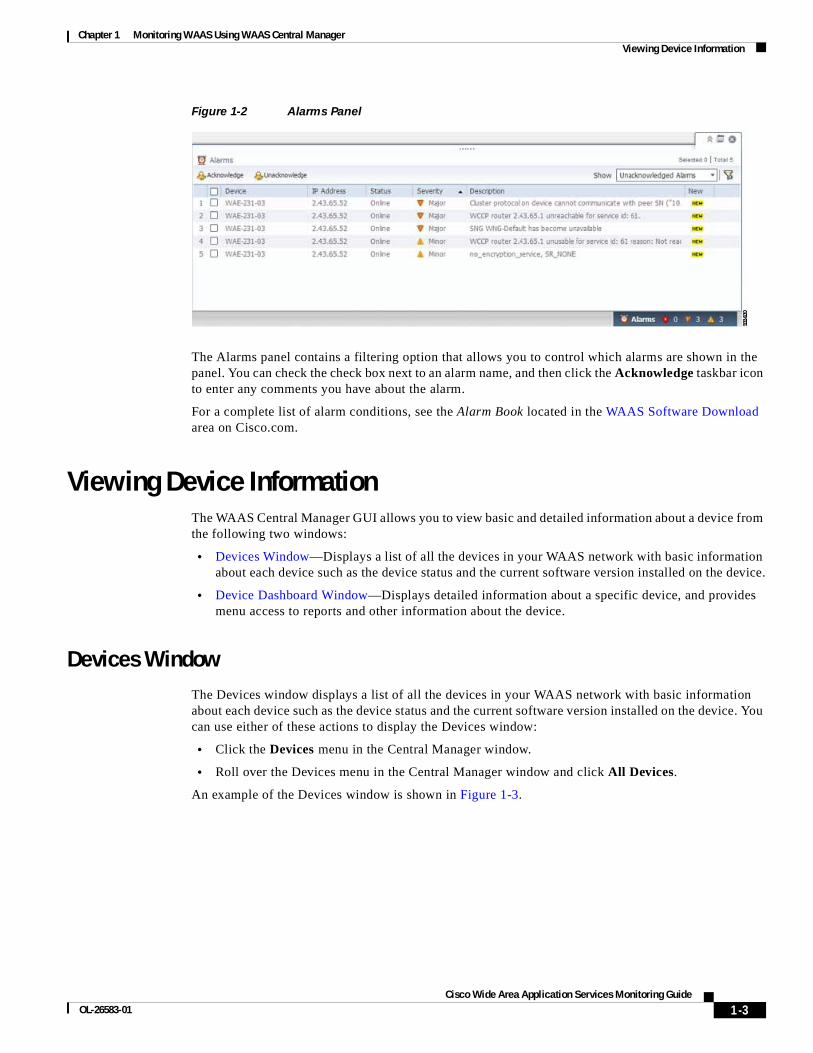
Figure 1-2 Alarms Panel
The Alarms panel contains a filtering option that allows you to control which alarms are shown in the panel. You can check the check box next to an alarm name, and then click the Acknowledge taskbar icon to enter any comments you have about the alarm.
For a complete list of alarm conditions, see the Alarm Book located in the WAAS Software Download area on Cisco.com.
Viewing Device InformationThe WAAS Central Manager GUI allows you to view basic and detailed information about a device from the following two windows:
• Devices Window—Displays a list of all the devices in your WAAS network with basic information about each device such as the device status and the current software version installed on the device.
• Device Dashboard Window—Displays detailed information about a specific device, and provides menu access to reports and other information about the device.
Devices WindowThe Devices window displays a list of all the devices in your WAAS network with basic information about each device such as the device status and the current software version installed on the device. You can use either of these actions to display the Devices window:
• Click the Devices menu in the Central Manager window.
• Roll over the Devices menu in the Central Manager window and click All Devices.
An example of the Devices window is shown in Figure 1-3.
1-4Cisco Wide Area Application Services Monitoring Guide
OL-26583-01
Chapter 1 Monitoring WAAS Using WAAS Central ManagerViewing Device Information
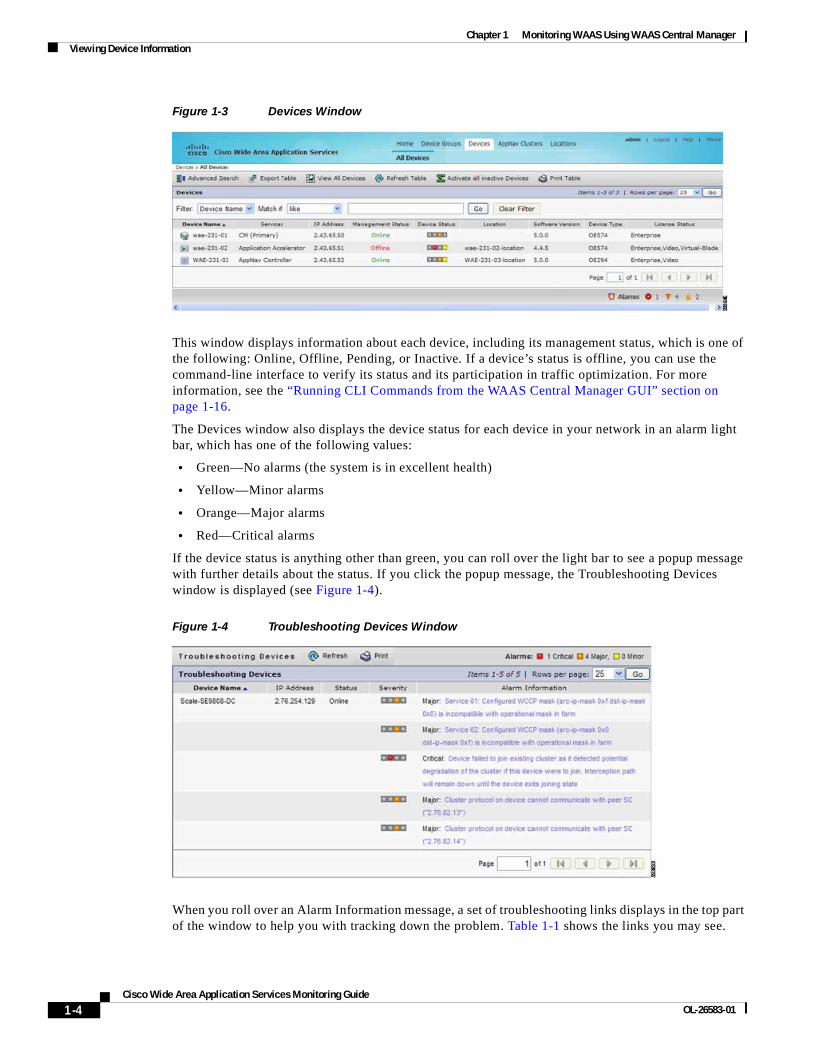
Figure 1-3 Devices Window
This window displays information about each device, including its management status, which is one of the following: Online, Offline, Pending, or Inactive. If a device’s status is offline, you can use the command-line interface to verify its status and its participation in traffic optimization. For more information, see the “Running CLI Commands from the WAAS Central Manager GUI” section on page 1-16.
The Devices window also displays the device status for each device in your network in an alarm light bar, which has one of the following values:
• Green—No alarms (the system is in excellent health)
• Yellow—Minor alarms
• Orange—Major alarms
• Red—Critical alarms
If the device status is anything other than green, you can roll over the light bar to see a popup message with further details about the status. If you click the popup message, the Troubleshooting Devices window is displayed (see Figure 1-4).
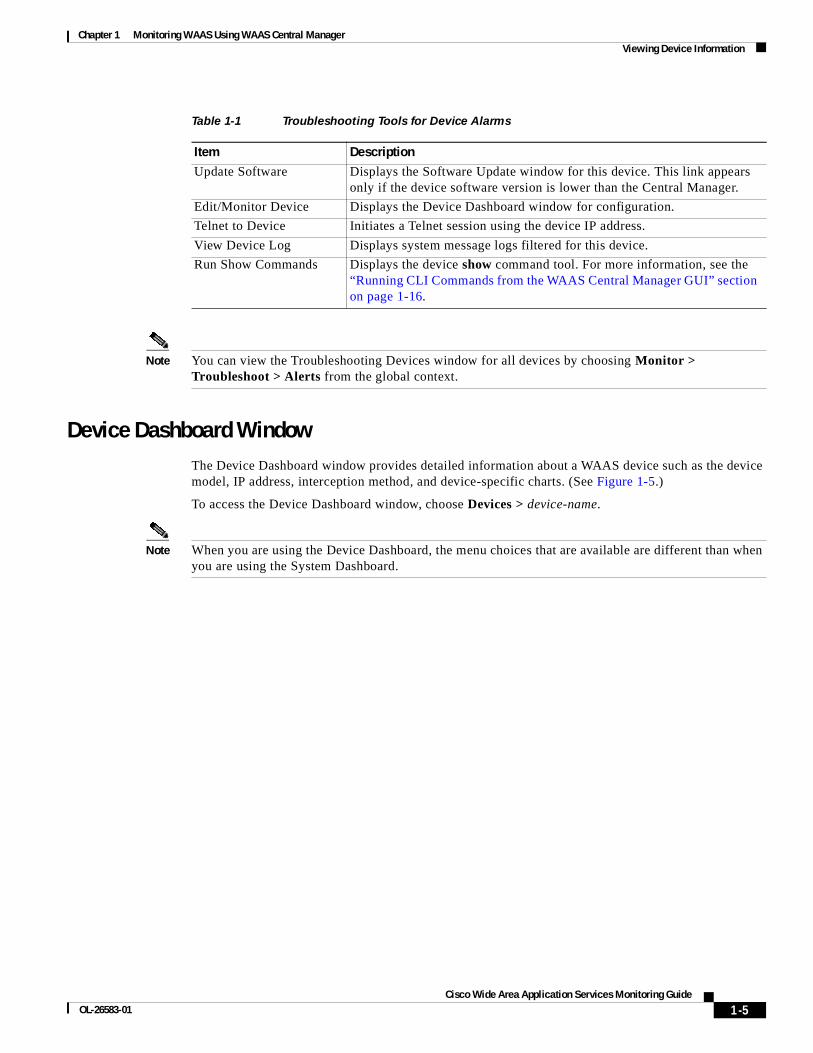
Figure 1-4 Troubleshooting Devices Window
When you roll over an Alarm Information message, a set of troubleshooting links displays in the top part of the window to help you with tracking down the problem. Table 1-1 shows the links you may see.
1-5Cisco Wide Area Application Services Monitoring Guide
OL-26583-01
Chapter 1 Monitoring WAAS Using WAAS Central ManagerViewing Device Information
Note You can view the Troubleshooting Devices window for all devices by choosing Monitor > Troubleshoot > Alerts from the global context.
Device Dashboard WindowThe Device Dashboard window provides detailed information about a WAAS device such as the device model, IP address, interception method, and device-specific charts. (See Figure 1-5.)
To access the Device Dashboard window, choose Devices > device-name.
Note When you are using the Device Dashboard, the menu choices that are available are different than when you are using the System Dashboard.
Table 1-1 Troubleshooting Tools for Device Alarms
Item DescriptionUpdate Software Displays the Software Update window for this device. This link appears
only if the device software version is lower than the Central Manager.
Edit/Monitor Device Displays the Device Dashboard window for configuration.
Telnet to Device Initiates a Telnet session using the device IP address.
View Device Log Displays system message logs filtered for this device.
Run Show Commands Displays the device show command tool. For more information, see the “Running CLI Commands from the WAAS Central Manager GUI” section on page 1-16.
1-6Cisco Wide Area Application Services Monitoring Guide
OL-26583-01
Chapter 1 Monitoring WAAS Using WAAS Central ManagerViewing Monitoring Reports
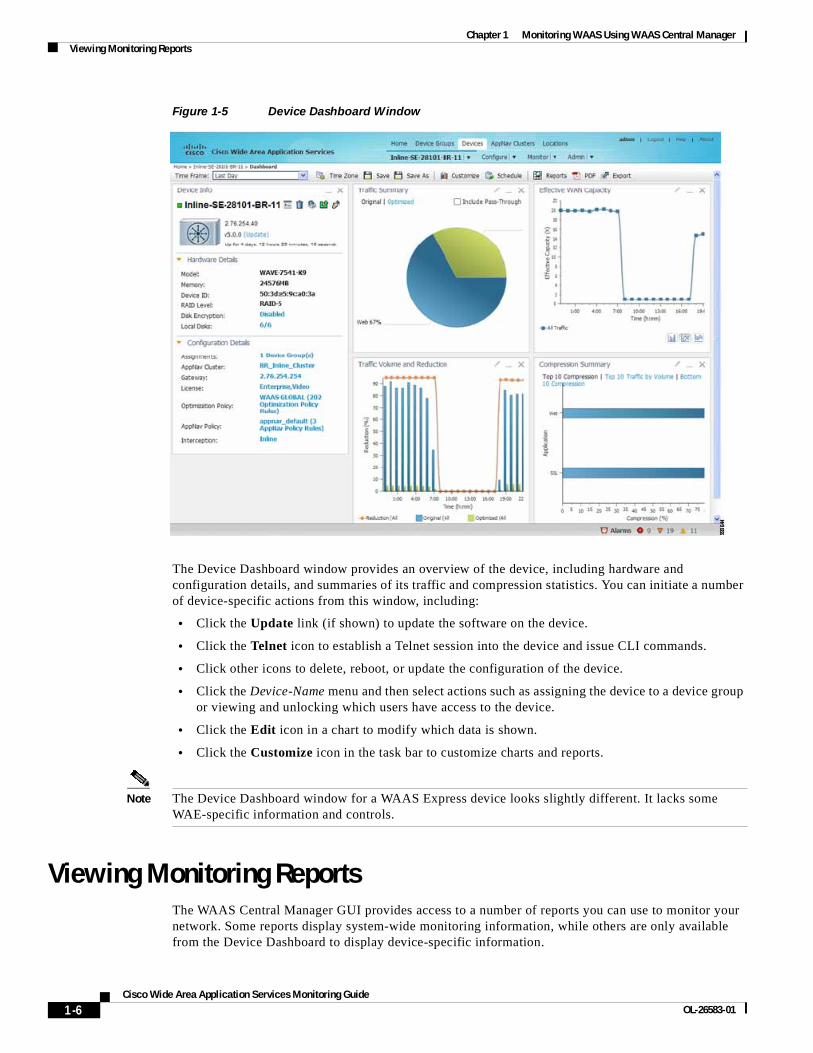
Figure 1-5 Device Dashboard Window
The Device Dashboard window provides an overview of the device, including hardware and configuration details, and summaries of its traffic and compression statistics. You can initiate a number of device-specific actions from this window, including:
• Click the Update link (if shown) to update the software on the device.
• Click the Telnet icon to establish a Telnet session into the device and issue CLI commands.
• Click other icons to delete, reboot, or update the configuration of the device.
• Click the Device-Name menu and then select actions such as assigning the device to a device group or viewing and unlocking which users have access to the device.
• Click the Edit icon in a chart to modify which data is shown.
• Click the Customize icon in the task bar to customize charts and reports.
Note The Device Dashboard window for a WAAS Express device looks slightly different. It lacks some WAE-specific information and controls.
Viewing Monitoring ReportsThe WAAS Central Manager GUI provides access to a number of reports you can use to monitor your network. Some reports display system-wide monitoring information, while others are only available from the Device Dashboard to display device-specific information.
1-7Cisco Wide Area Application Services Monitoring Guide
OL-26583-01
Chapter 1 Monitoring WAAS Using WAAS Central ManagerViewing Monitoring Reports
This section contains the following topics:
• Viewing Network Reports, page 1-7
• Viewing Optimization Reports, page 1-9
• Viewing Acceleration Reports, page 1-11
• Viewing AppNav Reports, page 1-12
• Viewing Platform Reports, page 1-13
For more information about the available monitoring reports, see the “Monitoring and Troubleshooting Your WAAS Network” chapter in the Cisco Wide Area Application Services Configuration Guide.
Viewing Network ReportsYou can monitor overall system information in the WAAS Central Manager GUI with several system-level reports. This section provides examples of these reports:
• Viewing Network Summary Information, page 1-7
• Viewing Network Topology, page 1-8
For more information, see the “Monitoring and Troubleshooting Your WAAS Network” chapter in the Cisco Wide Area Application Services Configuration Guide.
Viewing Network Summary Information
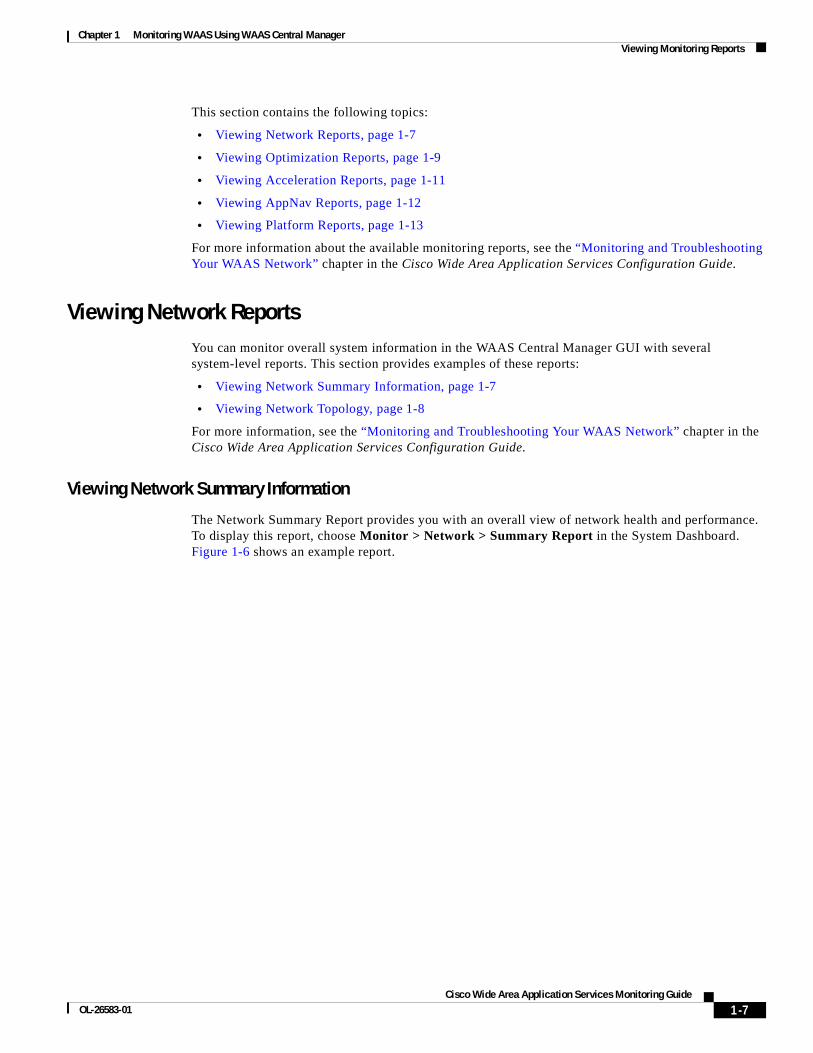
The Network Summary Report provides you with an overall view of network health and performance. To display this report, choose Monitor > Network > Summary Report in the System Dashboard. Figure 1-6 shows an example report.
1-8Cisco Wide Area Application Services Monitoring Guide
OL-26583-01
Chapter 1 Monitoring WAAS Using WAAS Central ManagerViewing Monitoring Reports
Figure 1-6 Network Summary Report
The Network Summary Report includes summary information about traffic, capacity, compression, and network applications.
Viewing Network Topology
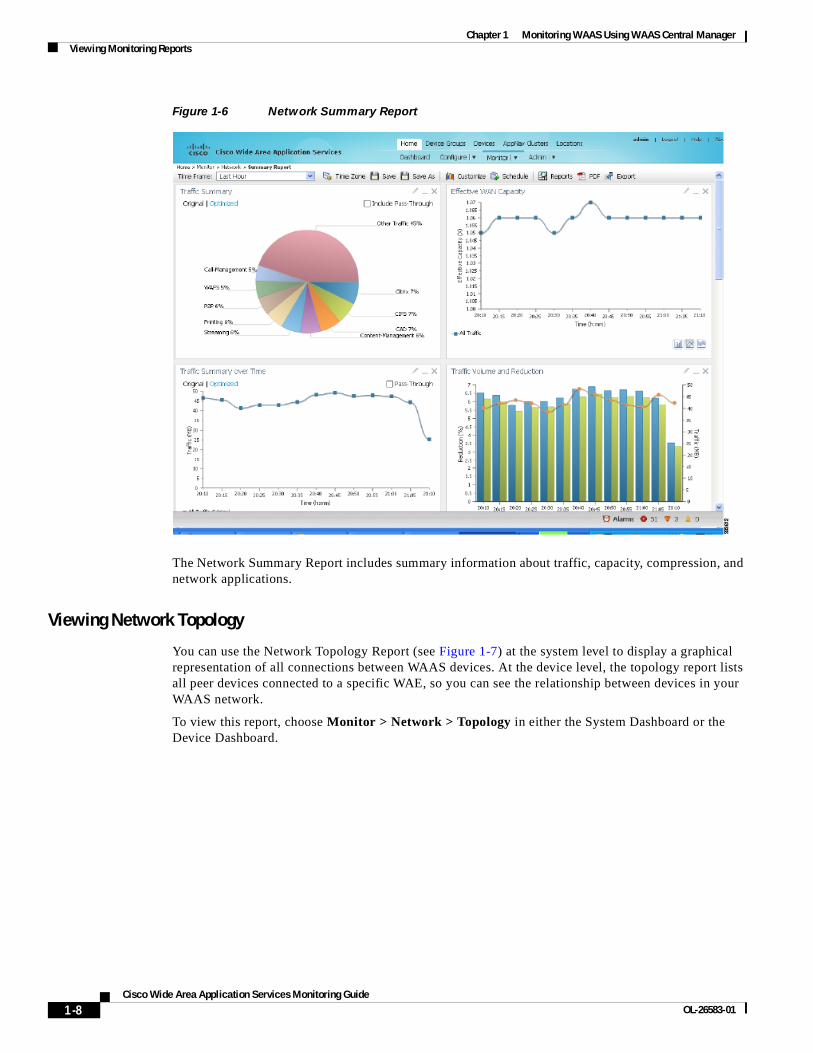
You can use the Network Topology Report (see Figure 1-7) at the system level to display a graphical representation of all connections between WAAS devices. At the device level, the topology report lists all peer devices connected to a specific WAE, so you can see the relationship between devices in your WAAS network.
To view this report, choose Monitor > Network > Topology in either the System Dashboard or the Device Dashboard.
1-9Cisco Wide Area Application Services Monitoring Guide
OL-26583-01
Chapter 1 Monitoring WAAS Using WAAS Central ManagerViewing Monitoring Reports
Figure 1-7 Topology Report
The topology information is important for troubleshooting and for deployment-sizing exercises, especially for large deployments where any site-to-site communication is required.
Viewing Optimization ReportsYou can view connection optimization statistics for your network connections in the Central Manager GUI. This section contains the following topics:
• Viewing TCP Statistics, page 1-9
• Viewing Connection Statistics, page 1-9
• Viewing Connection Trends, page 1-11
For more information about optimization statistics and reports, see the “Monitoring and Troubleshooting Your WAAS Network” chapter in the Cisco Wide Area Application Services Configuration Guide.
Viewing TCP Statistics
You can use the TCP Summary Report to view a summary of TCP optimization statistics for your WAAS system (from the System Dashboard) or for a specific device (from the Device Dashboard). Figure 1-5 on page 1-6 shows an example of the report.
To display this report, choose Monitor > Optimization > TCP Summary Report from either dashboard. The report contains the following optimization charts:
• Traffic Summary
• Effective WAN Capacity
• Traffic Volume and Reduction
• Compression Summary
• Traffic Summary over Time
• Compression Summary over Time
• Network Traffic Summary
Viewing Connection Statistics
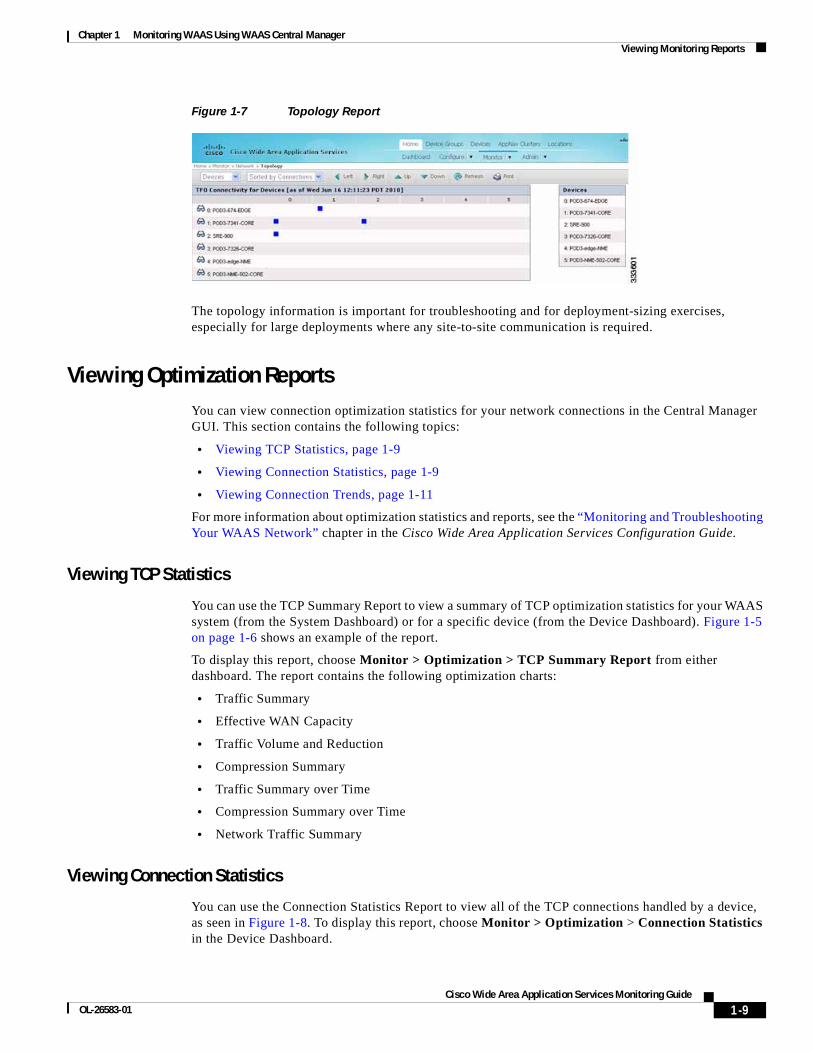
You can use the Connection Statistics Report to view all of the TCP connections handled by a device, as seen in Figure 1-8. To display this report, choose Monitor > Optimization > Connection Statistics in the Device Dashboard.
1-10Cisco Wide Area Application Services Monitoring Guide
OL-26583-01
Chapter 1 Monitoring WAAS Using WAAS Central ManagerViewing Monitoring Reports
Figure 1-8 Connection Statistics Report
The table lists all the active connections served by the selected WAE. The output provides key details about the flow by highlighting type of traffic, peer ID, percent compression, applied policies, and so forth.
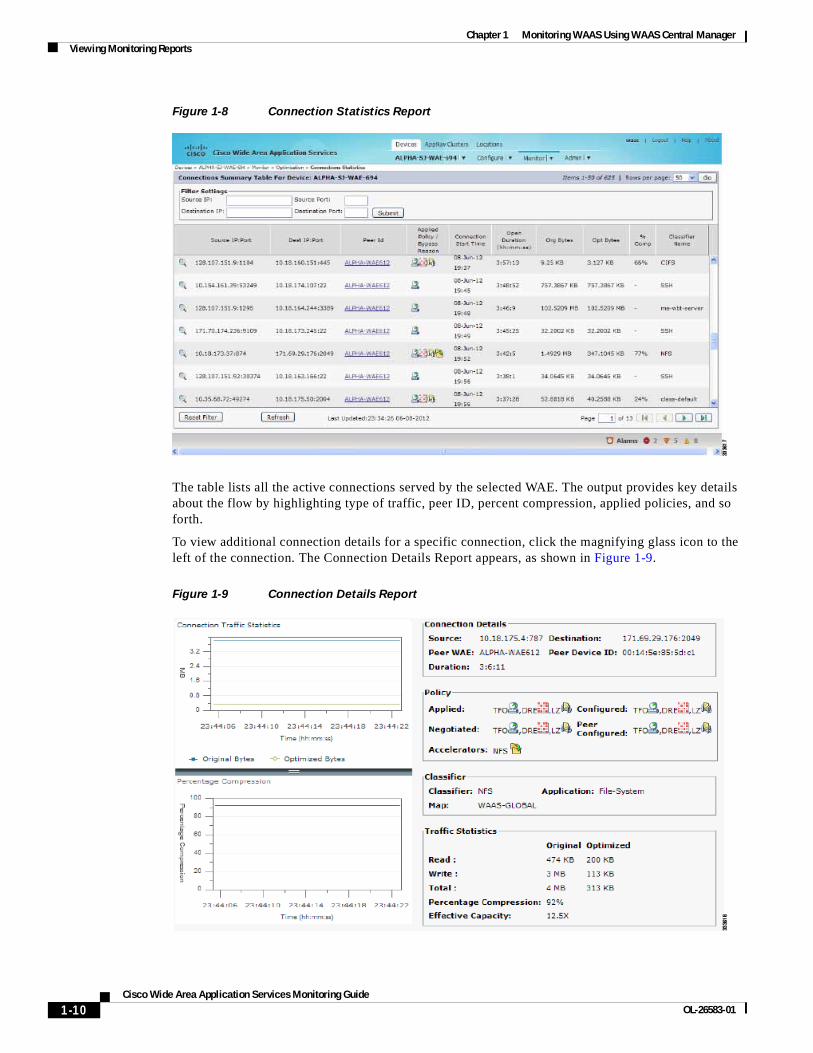
To view additional connection details for a specific connection, click the magnifying glass icon to the left of the connection. The Connection Details Report appears, as shown in Figure 1-9.
Figure 1-9 Connection Details Report
1-11Cisco Wide Area Application Services Monitoring Guide
OL-26583-01
Chapter 1 Monitoring WAAS Using WAAS Central ManagerViewing Monitoring Reports
The Connection Details Report provides connection addresses, port information, policy information, and traffic statistics. The report window also displays graphs that plot real-time traffic statistics; these statistics are refreshed every two seconds.
Viewing Connection Trends
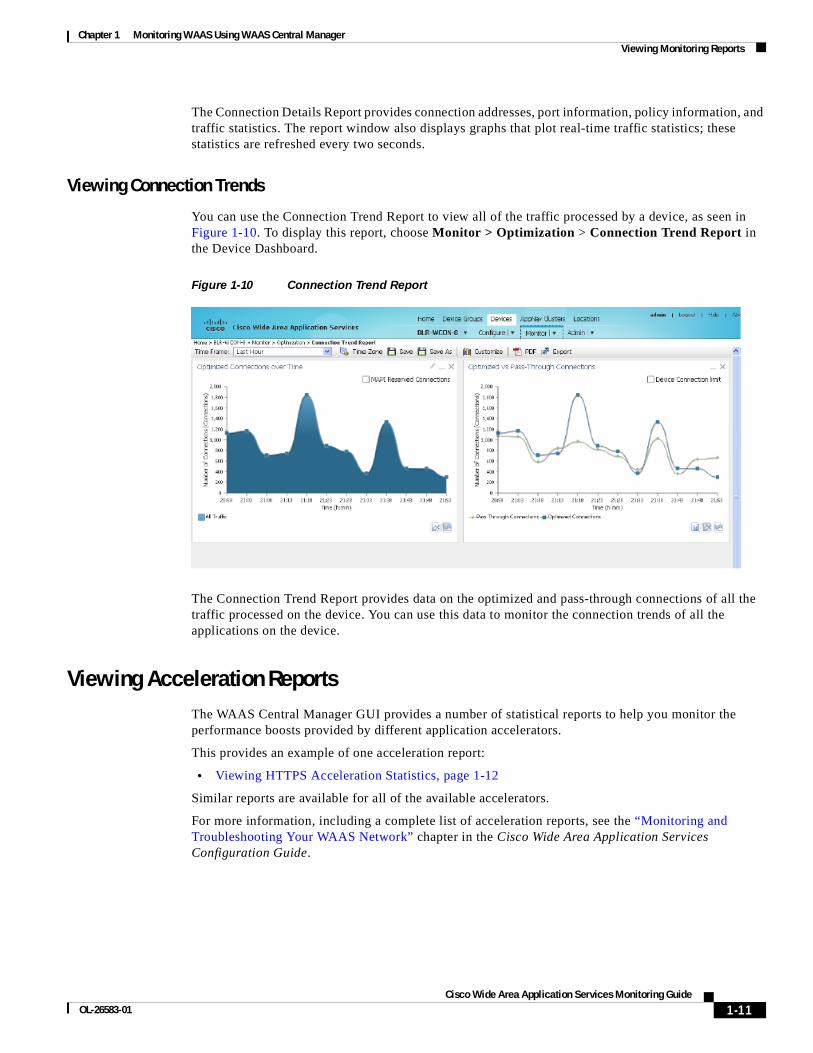
You can use the Connection Trend Report to view all of the traffic processed by a device, as seen in Figure 1-10. To display this report, choose Monitor > Optimization > Connection Trend Report in the Device Dashboard.
Figure 1-10 Connection Trend Report
The Connection Trend Report provides data on the optimized and pass-through connections of all the traffic processed on the device. You can use this data to monitor the connection trends of all the applications on the device.
Viewing Acceleration ReportsThe WAAS Central Manager GUI provides a number of statistical reports to help you monitor the performance boosts provided by different application accelerators.
This provides an example of one acceleration report:
• Viewing HTTPS Acceleration Statistics, page 1-12
Similar reports are available for all of the available accelerators.
For more information, including a complete list of acceleration reports, see the “Monitoring and Troubleshooting Your WAAS Network” chapter in the Cisco Wide Area Application Services Configuration Guide.
1-12Cisco Wide Area Application Services Monitoring Guide
OL-26583-01
Chapter 1 Monitoring WAAS Using WAAS Central ManagerViewing Monitoring Reports
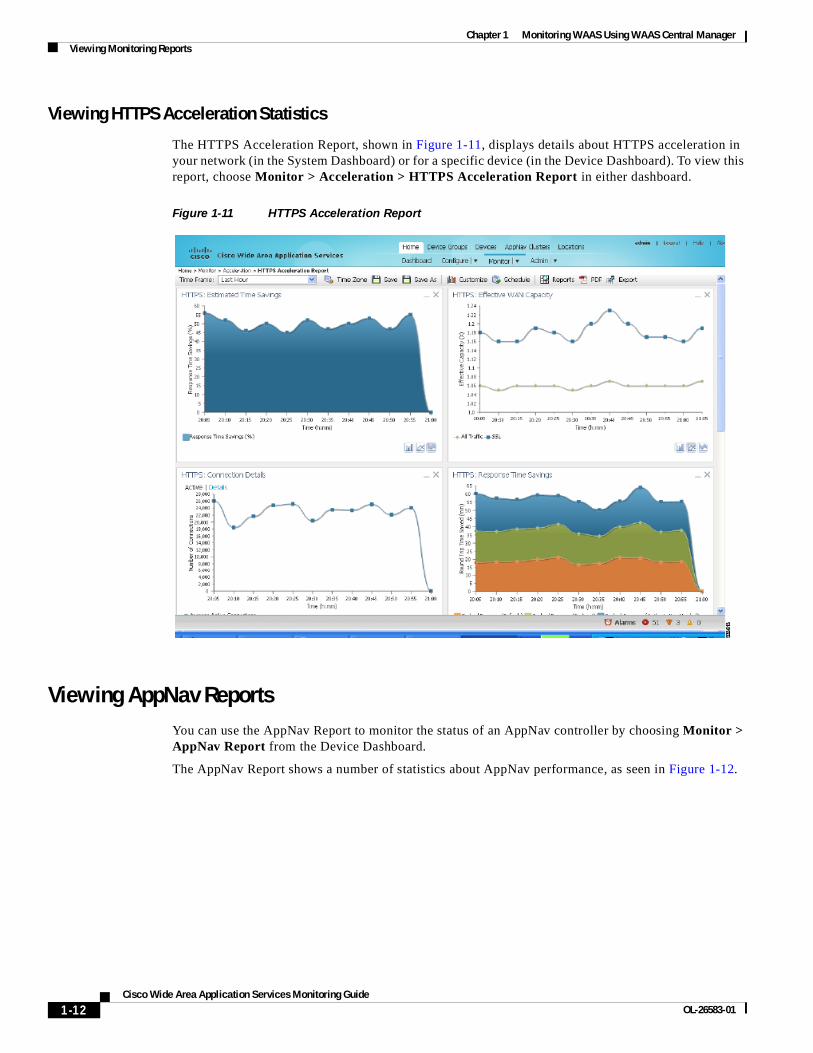
Viewing HTTPS Acceleration Statistics
The HTTPS Acceleration Report, shown in Figure 1-11, displays details about HTTPS acceleration in your network (in the System Dashboard) or for a specific device (in the Device Dashboard). To view this report, choose Monitor > Acceleration > HTTPS Acceleration Report in either dashboard.
Figure 1-11 HTTPS Acceleration Report
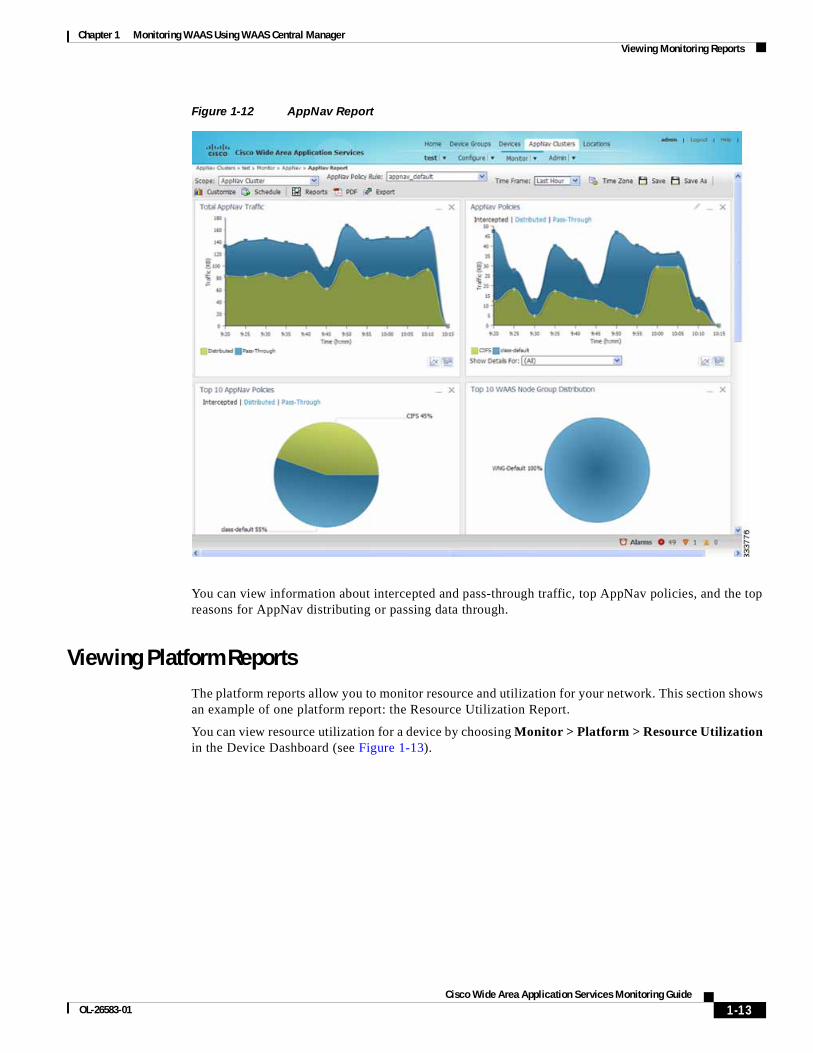
Viewing AppNav ReportsYou can use the AppNav Report to monitor the status of an AppNav controller by choosing Monitor > AppNav Report from the Device Dashboard.
The AppNav Report shows a number of statistics about AppNav performance, as seen in Figure 1-12.
1-13Cisco Wide Area Application Services Monitoring Guide
OL-26583-01
Chapter 1 Monitoring WAAS Using WAAS Central ManagerViewing Monitoring Reports
Figure 1-12 AppNav Report
You can view information about intercepted and pass-through traffic, top AppNav policies, and the top reasons for AppNav distributing or passing data through.
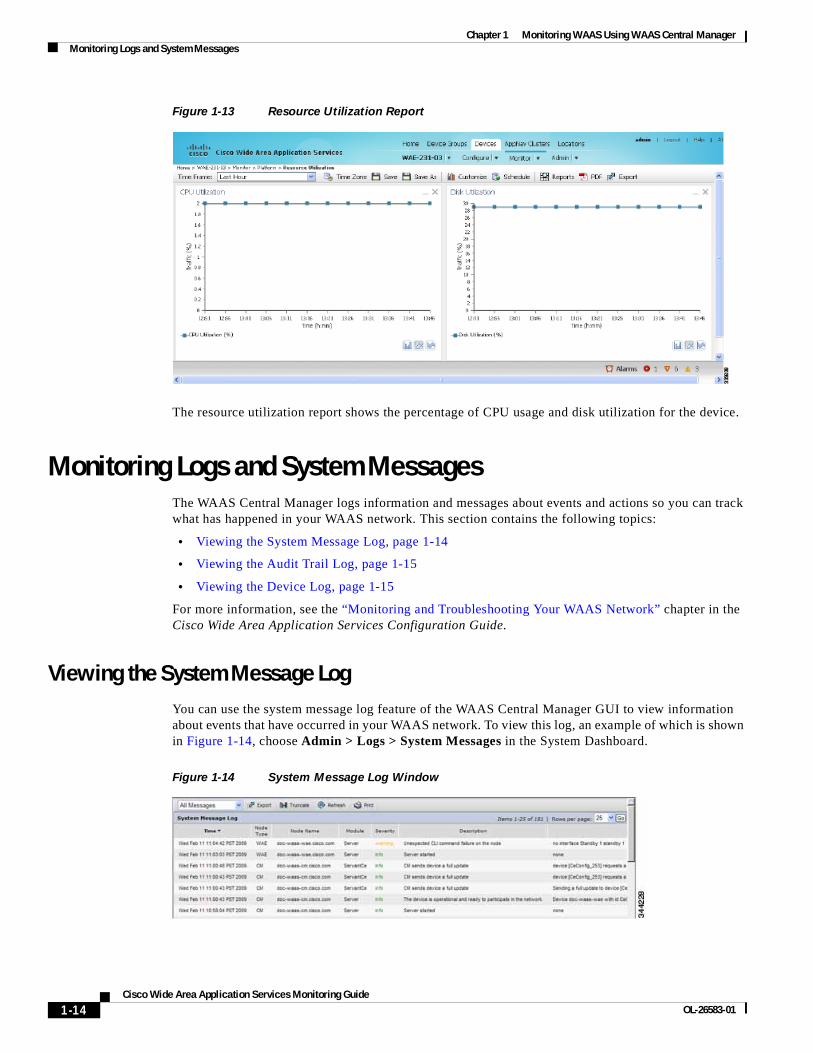
Viewing Platform ReportsThe platform reports allow you to monitor resource and utilization for your network. This section shows an example of one platform report: the Resource Utilization Report.
You can view resource utilization for a device by choosing Monitor > Platform > Resource Utilization in the Device Dashboard (see Figure 1-13).
1-14Cisco Wide Area Application Services Monitoring Guide
OL-26583-01
Chapter 1 Monitoring WAAS Using WAAS Central ManagerMonitoring Logs and System Messages
Figure 1-13 Resource Utilization Report
The resource utilization report shows the percentage of CPU usage and disk utilization for the device.
Monitoring Logs and System MessagesThe WAAS Central Manager logs information and messages about events and actions so you can track what has happened in your WAAS network. This section contains the following topics:
• Viewing the System Message Log, page 1-14
• Viewing the Audit Trail Log, page 1-15
• Viewing the Device Log, page 1-15
For more information, see the “Monitoring and Troubleshooting Your WAAS Network” chapter in the Cisco Wide Area Application Services Configuration Guide.
Viewing the System Message LogYou can use the system message log feature of the WAAS Central Manager GUI to view information about events that have occurred in your WAAS network. To view this log, an example of which is shown in Figure 1-14, choose Admin > Logs > System Messages in the System Dashboard.
Figure 1-14 System Message Log Window
1-15Cisco Wide Area Application Services Monitoring Guide
OL-26583-01
Chapter 1 Monitoring WAAS Using WAAS Central ManagerMonitoring Logs and System Messages
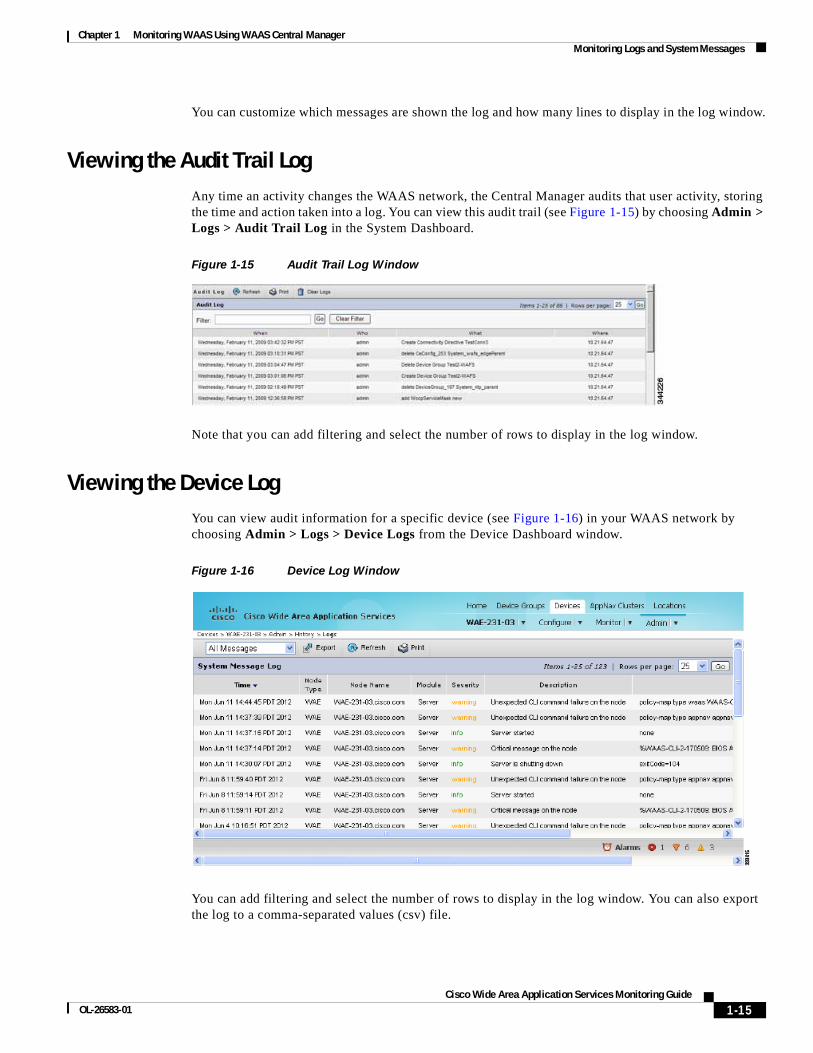
You can customize which messages are shown the log and how many lines to display in the log window.
Viewing the Audit Trail LogAny time an activity changes the WAAS network, the Central Manager audits that user activity, storing the time and action taken into a log. You can view this audit trail (see Figure 1-15) by choosing Admin > Logs > Audit Trail Log in the System Dashboard.
Figure 1-15 Audit Trail Log Window
Note that you can add filtering and select the number of rows to display in the log window.
Viewing the Device LogYou can view audit information for a specific device (see Figure 1-16) in your WAAS network by choosing Admin > Logs > Device Logs from the Device Dashboard window.
Figure 1-16 Device Log Window
You can add filtering and select the number of rows to display in the log window. You can also export the log to a comma-separated values (csv) file.
1-16Cisco Wide Area Application Services Monitoring Guide
OL-26583-01
Chapter 1 Monitoring WAAS Using WAAS Central ManagerViewing System Properties
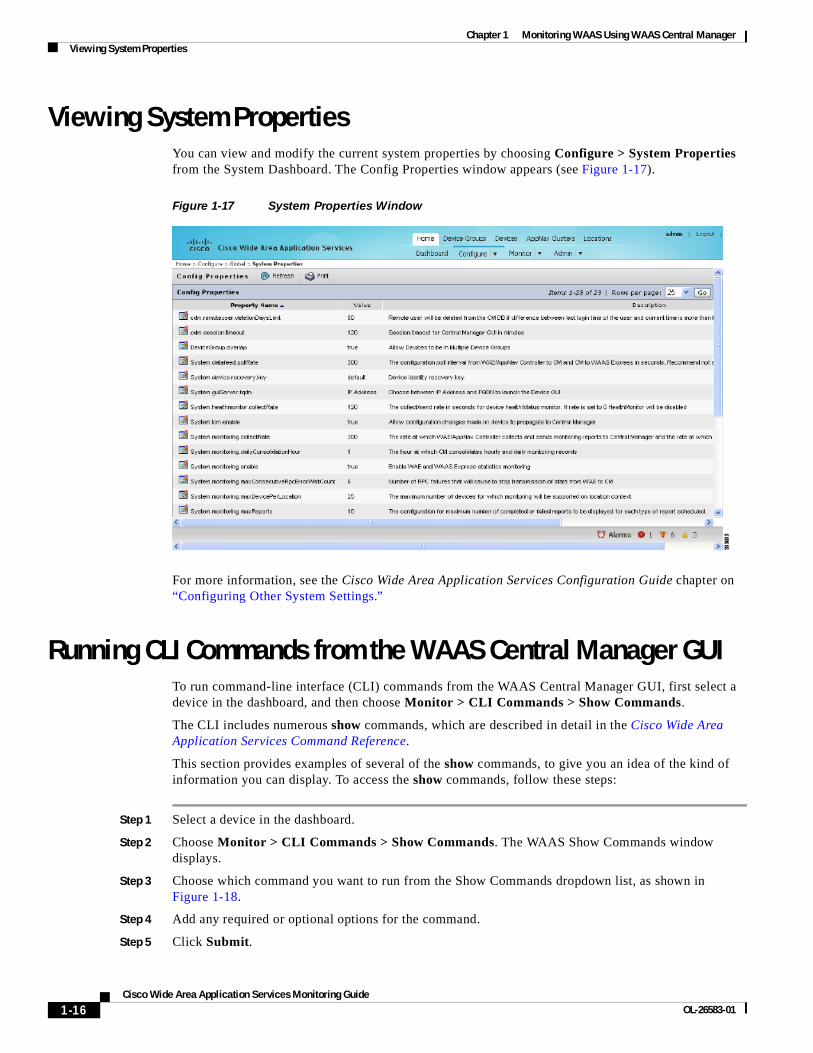
Viewing System PropertiesYou can view and modify the current system properties by choosing Configure > System Properties from the System Dashboard. The Config Properties window appears (see Figure 1-17).
Figure 1-17 System Properties Window
For more information, see the Cisco Wide Area Application Services Configuration Guide chapter on “Configuring Other System Settings.”
Running CLI Commands from the WAAS Central Manager GUITo run command-line interface (CLI) commands from the WAAS Central Manager GUI, first select a device in the dashboard, and then choose Monitor > CLI Commands > Show Commands.
The CLI includes numerous show commands, which are described in detail in the Cisco Wide Area Application Services Command Reference.
This section provides examples of several of the show commands, to give you an idea of the kind of information you can display. To access the show commands, follow these steps:
Step 1 Select a device in the dashboard.
Step 2 Choose Monitor > CLI Commands > Show Commands. The WAAS Show Commands window displays.
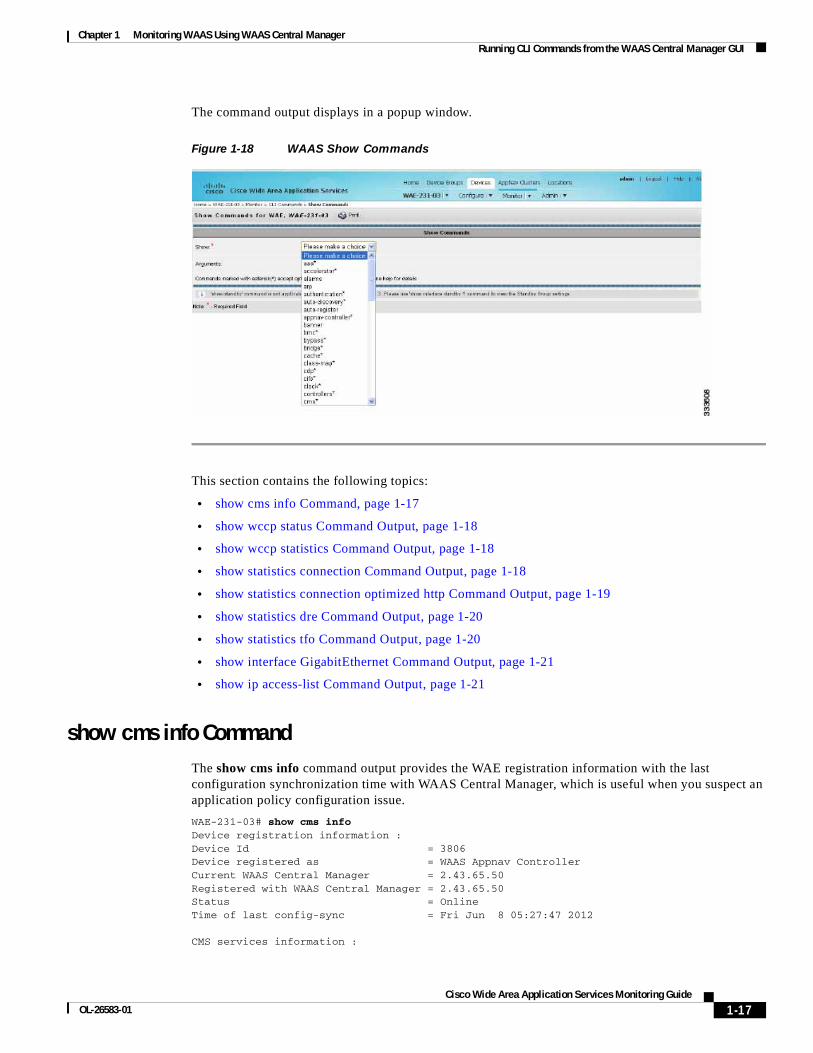
Step 3 Choose which command you want to run from the Show Commands dropdown list, as shown in Figure 1-18.
Step 4 Add any required or optional options for the command.
Step 5 Click Submit.
1-17Cisco Wide Area Application Services Monitoring Guide
OL-26583-01
Chapter 1 Monitoring WAAS Using WAAS Central ManagerRunning CLI Commands from the WAAS Central Manager GUI
The command output displays in a popup window.
Figure 1-18 WAAS Show Commands
This section contains the following topics:
• show cms info Command, page 1-17
• show wccp status Command Output, page 1-18
• show wccp statistics Command Output, page 1-18
• show statistics connection Command Output, page 1-18
• show statistics connection optimized http Command Output, page 1-19
• show statistics dre Command Output, page 1-20
• show statistics tfo Command Output, page 1-20
• show interface GigabitEthernet Command Output, page 1-21
• show ip access-list Command Output, page 1-21
show cms info CommandThe show cms info command output provides the WAE registration information with the last configuration synchronization time with WAAS Central Manager, which is useful when you suspect an application policy configuration issue.
WAE-231-03# show cms infoDevice registration information :Device Id = 3806Device registered as = WAAS Appnav ControllerCurrent WAAS Central Manager = 2.43.65.50Registered with WAAS Central Manager = 2.43.65.50Status = OnlineTime of last config-sync = Fri Jun 8 05:27:47 2012
CMS services information :
1-18Cisco Wide Area Application Services Monitoring Guide
OL-26583-01
Chapter 1 Monitoring WAAS Using WAAS Central ManagerRunning CLI Commands from the WAAS Central Manager GUI
Service cms_ce is running
show wccp status Command OutputThe show wccp status command output displays the current status of WCCP, including which services are enabled on the device.
WAE-231-03# show wccp statusWCCP Interception :Configured State : Enabled
Services Enabled on this WAE: TCP Promiscuous 61 TCP Promiscuous 62
The show wccp command can be used with different options. For more information about using this command, see the Cisco Wide Area Application Services Command Reference.
show wccp statistics Command OutputThe show wccp statistics command output includes three packets received counters, one of which should be incrementing to indicate that the WAE is receiving redirected packets.
WAE-231-03# show wccp statisticsTransparent GRE packets received: 0 <<< Packet received countersTransparent non-GRE packets received: 212389542 <<<Transparent non-GRE non-WCCP packets received: 0 <<<Total packets accepted: 158369766 <<<Invalid packets received: 0Packets received with invalid service: 0Packets received on a disabled service: 0Packets received too small: 0Packets dropped due to zero TTL: 0Packets dropped due to bad buckets: 42Packets dropped due to no redirect address: 0Packets dropped due to loopback redirect: 0Pass-through pkts on non-owned bucket: 0Connections bypassed due to load: 0 <<< Bypass counterPackets sent back to router: 3GRE packets sent to router (not bypass): 0Packets sent to another WAE: 0...
If the device is under heavy load and no new flows can be optimized, the Connections bypassed due to load counter increments. A nonzero value for this counter indicates that the device is under overload or has previously gone into overload and should be further investigated.
show statistics connection Command OutputThe show statistics connection command output displays all connection statistics for a WAAS device.
sjc22-00a-WAE-674# show statistics connection
Current Active Optimized Flows: 7 Current Active Optimized TCP Plus Flows: 2 Current Active Optimized TCP Only Flows: 12
1-19Cisco Wide Area Application Services Monitoring Guide
OL-26583-01
Chapter 1 Monitoring WAAS Using WAAS Central ManagerRunning CLI Commands from the WAAS Central Manager GUI
Current Active Optimized TCP Preposition Flows: 0Current Active Auto-Discovery Flows: 16Current Reserved Flows: 40Current Active Pass-Through Flows: 25Historical Flows: 597
D:DRE,L:LZ,T:TCP Optimization RR:Total Reduction RatioA:AOIM,C:CIFS,E:EPM,G:GENERIC,H:HTTP,I:ICA,M:MAPI,N:NFS,S:SSL,W:WAN SECURE,V:VIDEOX: SMB Signed Connection
ConnID Source IP:Port Dest IP:Port PeerID Accel RR445095 10.34.209.79:54455 199.47.216.147:80 58:8d:09:d1:bc:c1 THDL 87.1%447076 10.34.209.123:50028 171.70.151.151:1344 58:8d:09:d1:bc:c1 TG 00.0%447268 10.34.209.106:56632 171.71.160.68:445 58:8d:09:d1:bc:c1 TCDL 07.9%447293 10.34.209.123:63628 172.25.210.42:22 58:8d:09:d1:bc:c1 T 00.0%447296 10.34.209.106:62564 128.107.191.124:12834 58:8d:09:d1:bc:c1 TG 00.0%447349 10.34.215.74:31787 10.32.176.206:7878 00:21:5e:76:1d:64 TL 04.8%447350 10.34.209.106:64183 128.107.191.124:12834 58:8d:09:d1:bc:c1 TG 00.0%...
The show statistics command can be used with different options. For more information about using this command, see the Cisco Wide Area Application Services Command Reference.
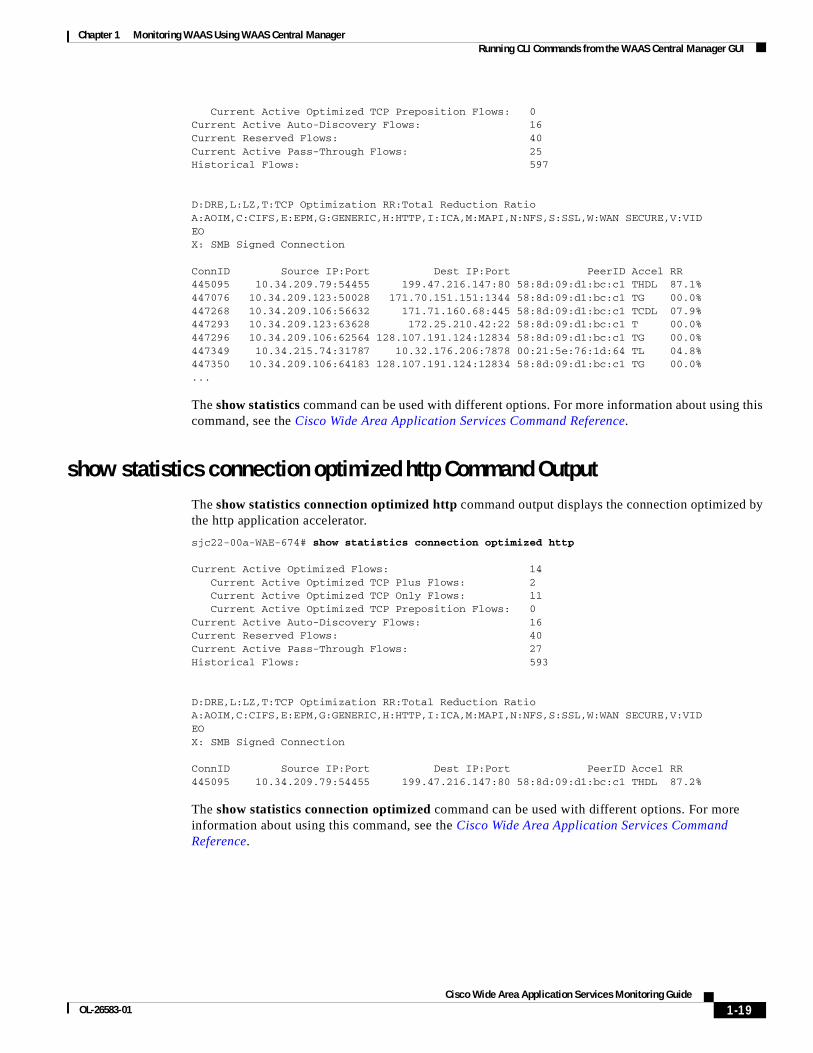
show statistics connection optimized http Command OutputThe show statistics connection optimized http command output displays the connection optimized by the http application accelerator.
sjc22-00a-WAE-674# show statistics connection optimized http
Current Active Optimized Flows: 14 Current Active Optimized TCP Plus Flows: 2 Current Active Optimized TCP Only Flows: 11 Current Active Optimized TCP Preposition Flows: 0Current Active Auto-Discovery Flows: 16Current Reserved Flows: 40Current Active Pass-Through Flows: 27Historical Flows: 593
D:DRE,L:LZ,T:TCP Optimization RR:Total Reduction RatioA:AOIM,C:CIFS,E:EPM,G:GENERIC,H:HTTP,I:ICA,M:MAPI,N:NFS,S:SSL,W:WAN SECURE,V:VIDEOX: SMB Signed Connection
ConnID Source IP:Port Dest IP:Port PeerID Accel RR445095 10.34.209.79:54455 199.47.216.147:80 58:8d:09:d1:bc:c1 THDL 87.2%
The show statistics connection optimized command can be used with different options. For more information about using this command, see the Cisco Wide Area Application Services Command Reference.
1-20Cisco Wide Area Application Services Monitoring Guide
OL-26583-01
Chapter 1 Monitoring WAAS Using WAAS Central ManagerRunning CLI Commands from the WAAS Central Manager GUI
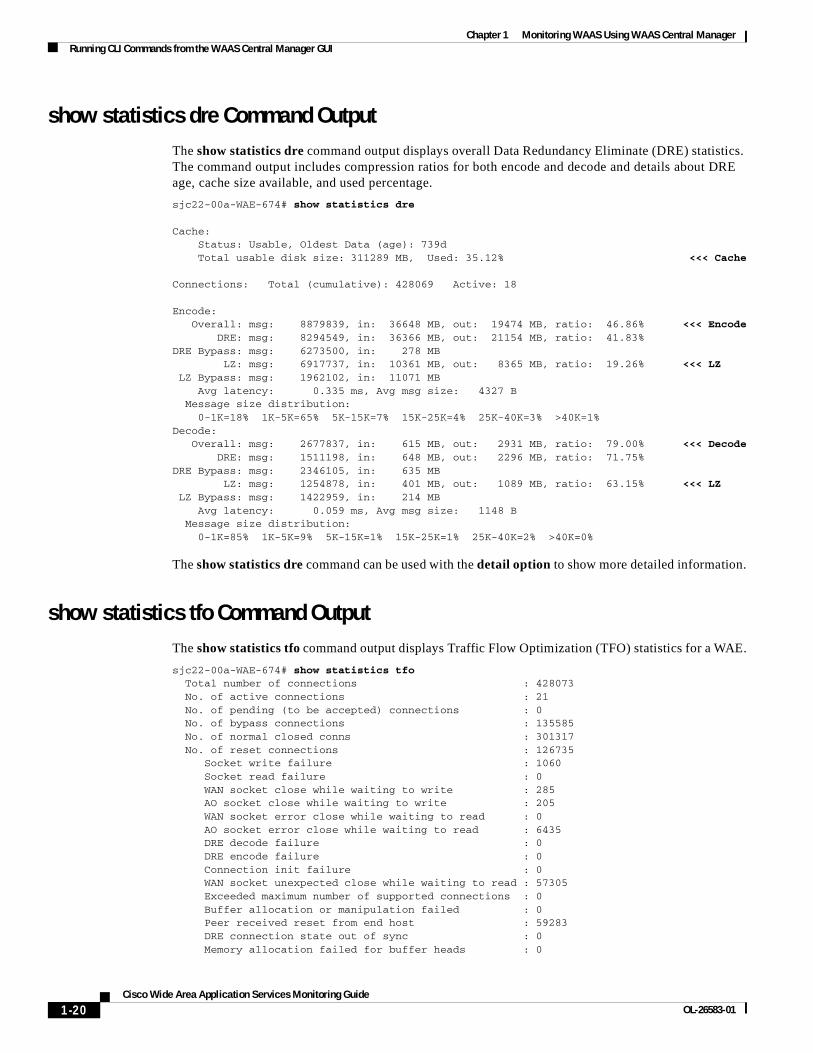
show statistics dre Command OutputThe show statistics dre command output displays overall Data Redundancy Eliminate (DRE) statistics. The command output includes compression ratios for both encode and decode and details about DRE age, cache size available, and used percentage.
sjc22-00a-WAE-674# show statistics dre
Cache: Status: Usable, Oldest Data (age): 739d Total usable disk size: 311289 MB, Used: 35.12% <<< Cache
Connections: Total (cumulative): 428069 Active: 18
Encode: Overall: msg: 8879839, in: 36648 MB, out: 19474 MB, ratio: 46.86% <<< Encode DRE: msg: 8294549, in: 36366 MB, out: 21154 MB, ratio: 41.83%DRE Bypass: msg: 6273500, in: 278 MB LZ: msg: 6917737, in: 10361 MB, out: 8365 MB, ratio: 19.26% <<< LZ LZ Bypass: msg: 1962102, in: 11071 MB Avg latency: 0.335 ms, Avg msg size: 4327 B Message size distribution: 0-1K=18% 1K-5K=65% 5K-15K=7% 15K-25K=4% 25K-40K=3% >40K=1%Decode: Overall: msg: 2677837, in: 615 MB, out: 2931 MB, ratio: 79.00% <<< Decode DRE: msg: 1511198, in: 648 MB, out: 2296 MB, ratio: 71.75%DRE Bypass: msg: 2346105, in: 635 MB LZ: msg: 1254878, in: 401 MB, out: 1089 MB, ratio: 63.15% <<< LZ LZ Bypass: msg: 1422959, in: 214 MB Avg latency: 0.059 ms, Avg msg size: 1148 B Message size distribution: 0-1K=85% 1K-5K=9% 5K-15K=1% 15K-25K=1% 25K-40K=2% >40K=0%
The show statistics dre command can be used with the detail option to show more detailed information.
show statistics tfo Command OutputThe show statistics tfo command output displays Traffic Flow Optimization (TFO) statistics for a WAE.
sjc22-00a-WAE-674# show statistics tfo Total number of connections : 428073 No. of active connections : 21 No. of pending (to be accepted) connections : 0 No. of bypass connections : 135585 No. of normal closed conns : 301317 No. of reset connections : 126735 Socket write failure : 1060 Socket read failure : 0 WAN socket close while waiting to write : 285 AO socket close while waiting to write : 205 WAN socket error close while waiting to read : 0 AO socket error close while waiting to read : 6435 DRE decode failure : 0 DRE encode failure : 0 Connection init failure : 0 WAN socket unexpected close while waiting to read : 57305 Exceeded maximum number of supported connections : 0 Buffer allocation or manipulation failed : 0 Peer received reset from end host : 59283 DRE connection state out of sync : 0 Memory allocation failed for buffer heads : 0
1-21Cisco Wide Area Application Services Monitoring Guide
OL-26583-01
Chapter 1 Monitoring WAAS Using WAAS Central ManagerRunning CLI Commands from the WAAS Central Manager GUI
Unoptimized packet received on optimized side : 2162...
The show statistics tfo command can be used with different options. For more information about using this command, see the Cisco Wide Area Application Services Command Reference.
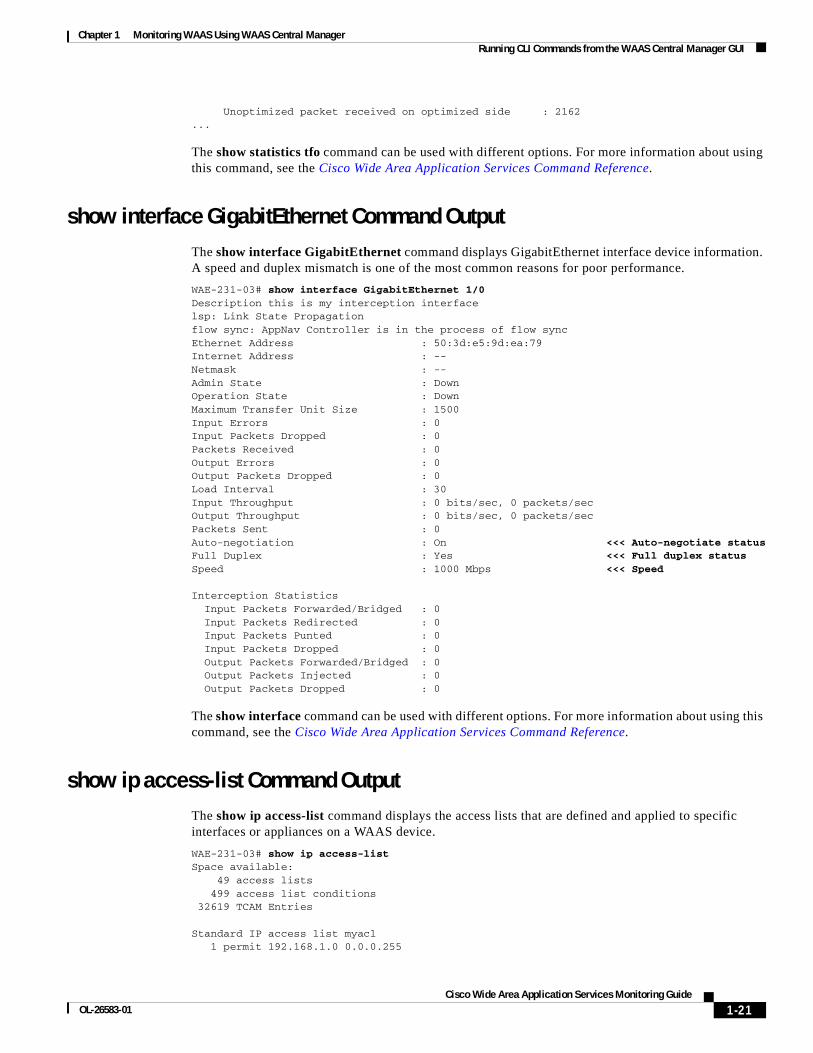
show interface GigabitEthernet Command OutputThe show interface GigabitEthernet command displays GigabitEthernet interface device information. A speed and duplex mismatch is one of the most common reasons for poor performance.
WAE-231-03# show interface GigabitEthernet 1/0Description this is my interception interfacelsp: Link State Propagationflow sync: AppNav Controller is in the process of flow syncEthernet Address : 50:3d:e5:9d:ea:79Internet Address : --Netmask : --Admin State : DownOperation State : DownMaximum Transfer Unit Size : 1500Input Errors : 0Input Packets Dropped : 0Packets Received : 0Output Errors : 0Output Packets Dropped : 0Load Interval : 30Input Throughput : 0 bits/sec, 0 packets/secOutput Throughput : 0 bits/sec, 0 packets/secPackets Sent : 0Auto-negotiation : On <<< Auto-negotiate statusFull Duplex : Yes <<< Full duplex statusSpeed : 1000 Mbps <<< Speed
Interception Statistics Input Packets Forwarded/Bridged : 0 Input Packets Redirected : 0 Input Packets Punted : 0 Input Packets Dropped : 0 Output Packets Forwarded/Bridged : 0 Output Packets Injected : 0 Output Packets Dropped : 0
The show interface command can be used with different options. For more information about using this command, see the Cisco Wide Area Application Services Command Reference.
show ip access-list Command OutputThe show ip access-list command displays the access lists that are defined and applied to specific interfaces or appliances on a WAAS device.
WAE-231-03# show ip access-listSpace available: 49 access lists 499 access list conditions 32619 TCAM Entries
Standard IP access list myacl 1 permit 192.168.1.0 0.0.0.255

1-22Cisco Wide Area Application Services Monitoring Guide
OL-26583-01
Chapter 1 Monitoring WAAS Using WAAS Central ManagerRunning CLI Commands from the WAAS Central Manager GUI
(implicit deny any: 0 matches, SN=0, ANC=0) total invocations: 0 (SN=0, ANC=0) [Legend: SN = Service Node ACL Hits, ANC = AppNav Controller ACL Hits]
Interface access list references: None Configured
Application access list references: No applications registered.
C H A P T E R
2-1Cisco Wide Area Application Services Monitoring Guide
OL-26583-01
2Monitoring Traffic Interception
This chapter describes how to use traffic interception to monitor your WAAS devices and contains the following sections:
• Verifying WCCPv2 Interception, page 2-1
• Verifying Inline Interception, page 2-7
Verifying WCCPv2 InterceptionThis section describes several Cisco IOS and WAAS WCCP commands that are available to verify if WCCP interception is working correctly.
This section contains the following topics:
• show ip wccp IOS Command Output, page 2-1
• show wccp WAAS Command Outputs, page 2-6
show ip wccp IOS Command OutputThe show ip wccp IOS command output provides an WCCP inventory that includes the number of routers, WAEs or service group, packets redirected, and forwarding and return method. This command is most commonly used to verify if WCCP interception is working correctly.
The command syntax is as follows:
show ip wccp [service_group#] [detail]
The following examples show how to use the command both with and without the optional argument and keyword.
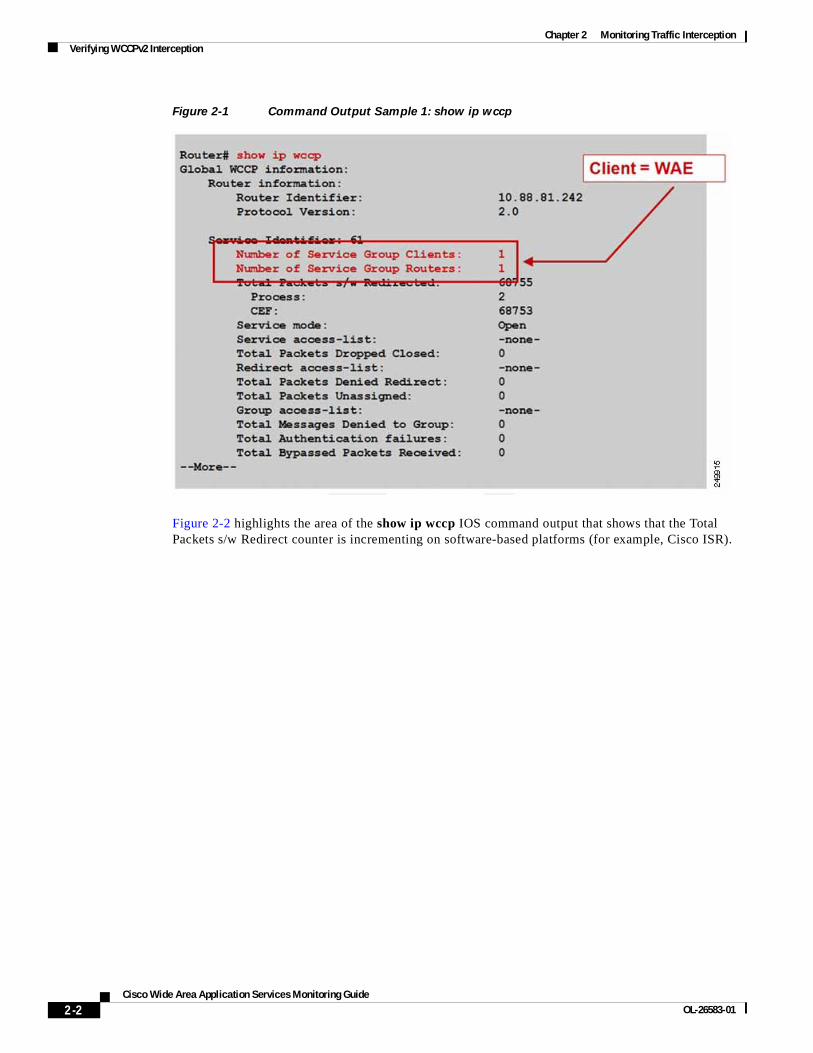
Figure 2-1 highlights the area of the show ip wccp IOS command output that show that there is one intercepting router and one WAE registered to Service Group 61.
2-2Cisco Wide Area Application Services Monitoring Guide
OL-26583-01
Chapter 2 Monitoring Traffic InterceptionVerifying WCCPv2 Interception
Figure 2-1 Command Output Sample 1: show ip wccp
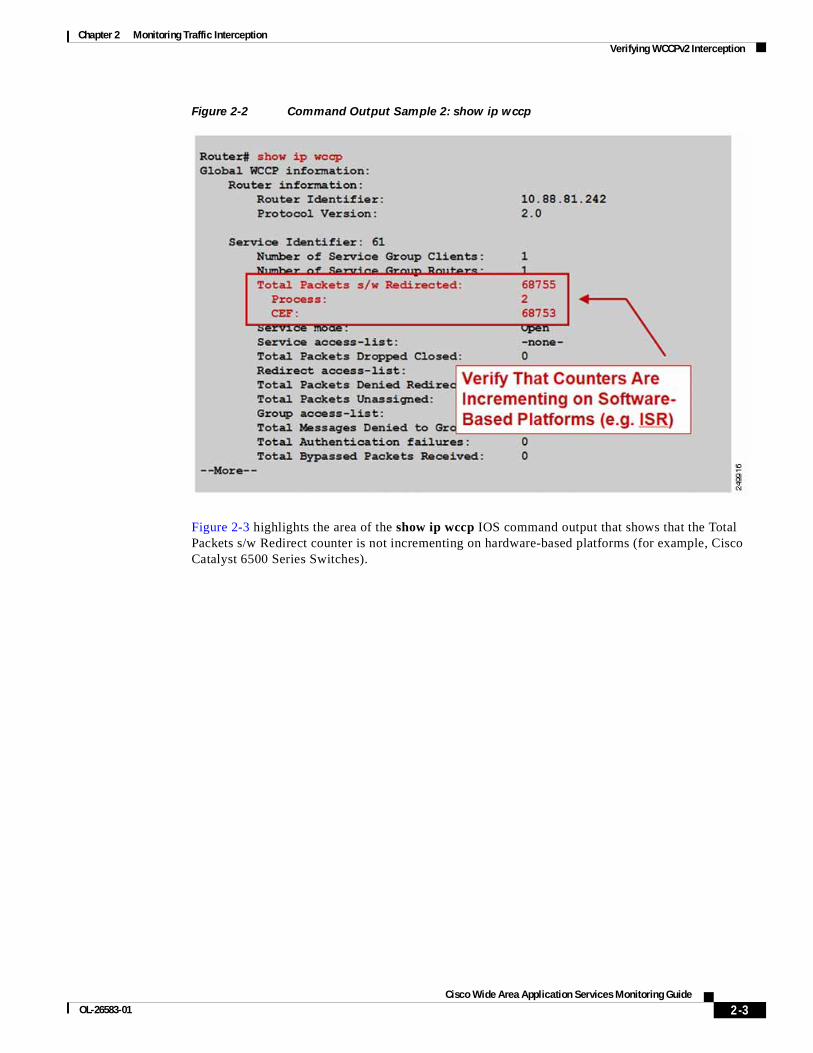
Figure 2-2 highlights the area of the show ip wccp IOS command output that shows that the Total Packets s/w Redirect counter is incrementing on software-based platforms (for example, Cisco ISR).
2-3Cisco Wide Area Application Services Monitoring Guide
OL-26583-01
Chapter 2 Monitoring Traffic InterceptionVerifying WCCPv2 Interception
Figure 2-2 Command Output Sample 2: show ip wccp
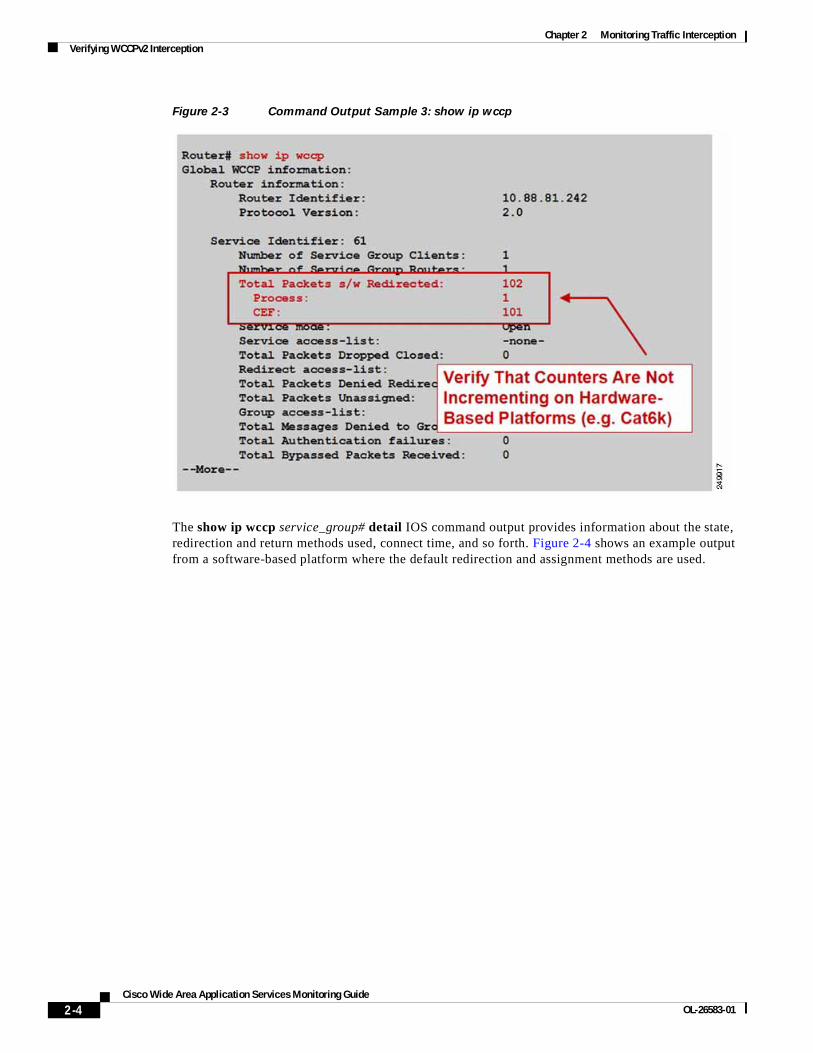
Figure 2-3 highlights the area of the show ip wccp IOS command output that shows that the Total Packets s/w Redirect counter is not incrementing on hardware-based platforms (for example, Cisco Catalyst 6500 Series Switches).
2-4Cisco Wide Area Application Services Monitoring Guide
OL-26583-01
Chapter 2 Monitoring Traffic InterceptionVerifying WCCPv2 Interception
Figure 2-3 Command Output Sample 3: show ip wccp
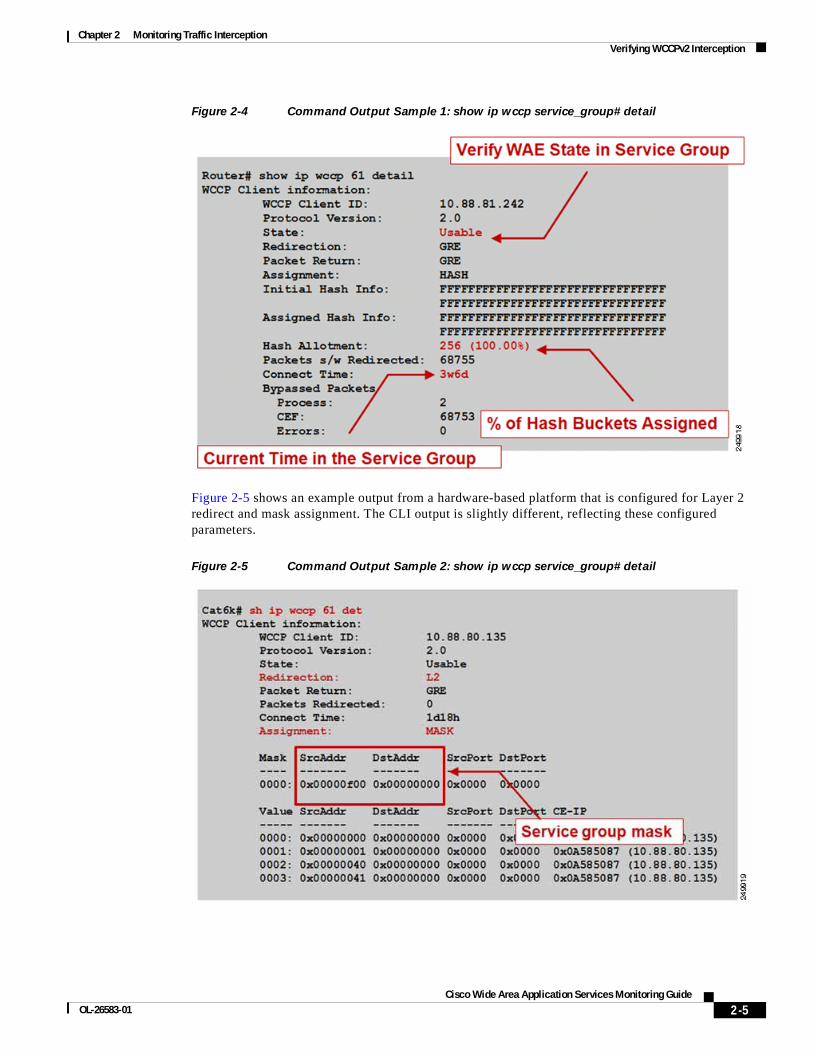
The show ip wccp service_group# detail IOS command output provides information about the state, redirection and return methods used, connect time, and so forth. Figure 2-4 shows an example output from a software-based platform where the default redirection and assignment methods are used.
2-5Cisco Wide Area Application Services Monitoring Guide
OL-26583-01
Chapter 2 Monitoring Traffic InterceptionVerifying WCCPv2 Interception
Figure 2-4 Command Output Sample 1: show ip wccp service_group# detail
Figure 2-5 shows an example output from a hardware-based platform that is configured for Layer 2 redirect and mask assignment. The CLI output is slightly different, reflecting these configured parameters.
Figure 2-5 Command Output Sample 2: show ip wccp service_group# detail
2-6Cisco Wide Area Application Services Monitoring Guide
OL-26583-01
Chapter 2 Monitoring Traffic InterceptionVerifying WCCPv2 Interception
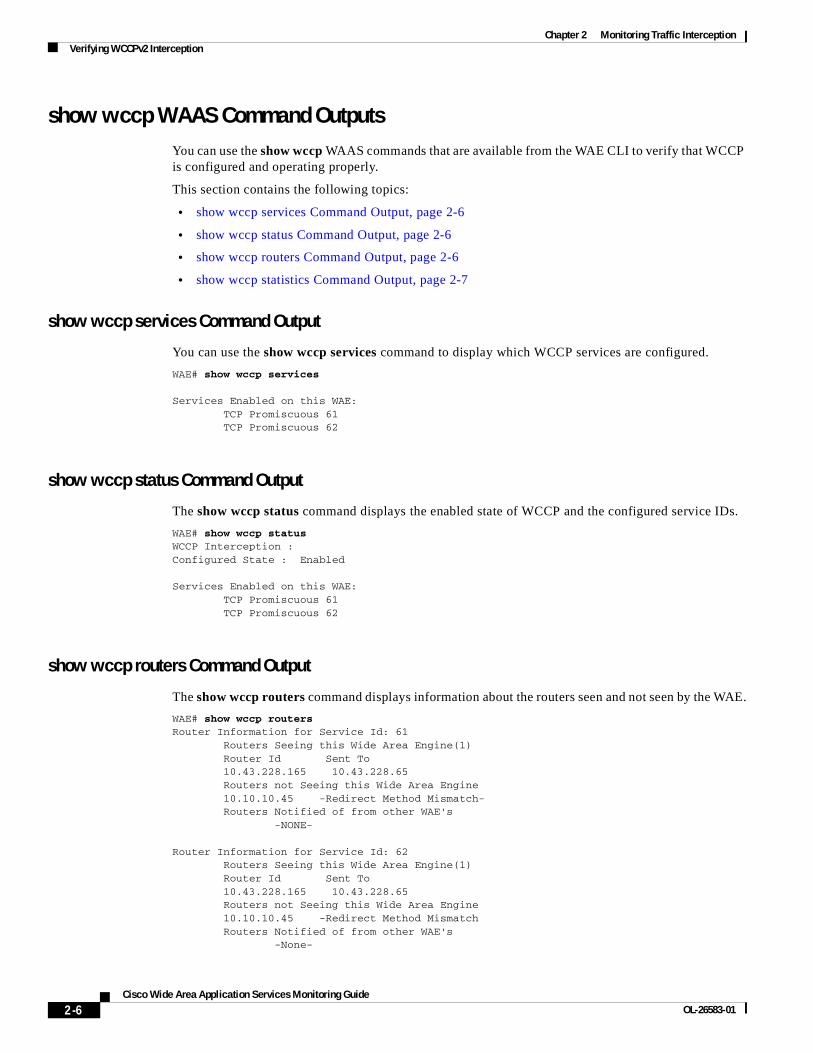
show wccp WAAS Command OutputsYou can use the show wccp WAAS commands that are available from the WAE CLI to verify that WCCP is configured and operating properly.
This section contains the following topics:
• show wccp services Command Output, page 2-6
• show wccp status Command Output, page 2-6
• show wccp routers Command Output, page 2-6
• show wccp statistics Command Output, page 2-7
show wccp services Command Output
You can use the show wccp services command to display which WCCP services are configured.
WAE# show wccp services
Services Enabled on this WAE: TCP Promiscuous 61 TCP Promiscuous 62
show wccp status Command Output
The show wccp status command displays the enabled state of WCCP and the configured service IDs.
WAE# show wccp statusWCCP Interception :Configured State : Enabled
Services Enabled on this WAE: TCP Promiscuous 61 TCP Promiscuous 62
show wccp routers Command Output
The show wccp routers command displays information about the routers seen and not seen by the WAE.
WAE# show wccp routersRouter Information for Service Id: 61 Routers Seeing this Wide Area Engine(1) Router Id Sent To 10.43.228.165 10.43.228.65 Routers not Seeing this Wide Area Engine 10.10.10.45 -Redirect Method Mismatch- Routers Notified of from other WAE's -NONE-
Router Information for Service Id: 62 Routers Seeing this Wide Area Engine(1) Router Id Sent To 10.43.228.165 10.43.228.65 Routers not Seeing this Wide Area Engine 10.10.10.45 -Redirect Method Mismatch Routers Notified of from other WAE's -None-
2-7Cisco Wide Area Application Services Monitoring Guide
OL-26583-01
Chapter 2 Monitoring Traffic InterceptionVerifying Inline Interception
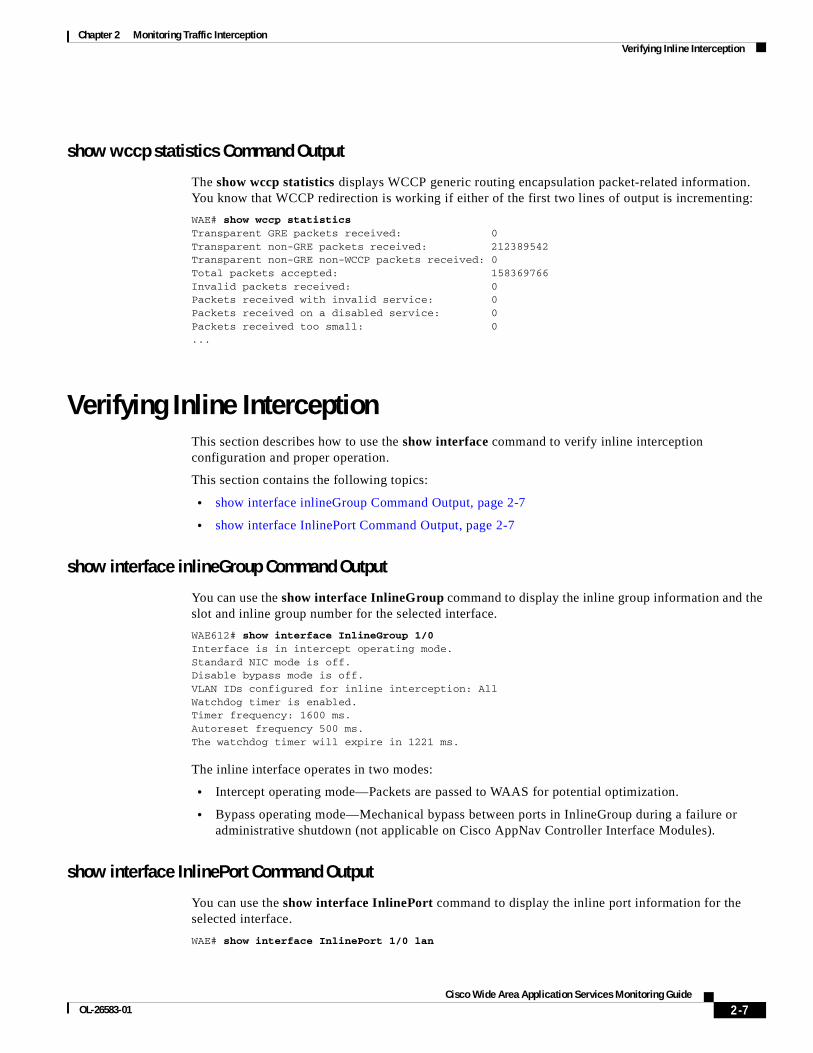
show wccp statistics Command Output
The show wccp statistics displays WCCP generic routing encapsulation packet-related information. You know that WCCP redirection is working if either of the first two lines of output is incrementing:
WAE# show wccp statisticsTransparent GRE packets received: 0Transparent non-GRE packets received: 212389542Transparent non-GRE non-WCCP packets received: 0Total packets accepted: 158369766Invalid packets received: 0Packets received with invalid service: 0Packets received on a disabled service: 0Packets received too small: 0...
Verifying Inline InterceptionThis section describes how to use the show interface command to verify inline interception configuration and proper operation.
This section contains the following topics:
• show interface inlineGroup Command Output, page 2-7
• show interface InlinePort Command Output, page 2-7
show interface inlineGroup Command Output
You can use the show interface InlineGroup command to display the inline group information and the slot and inline group number for the selected interface.
WAE612# show interface InlineGroup 1/0Interface is in intercept operating mode.Standard NIC mode is off.Disable bypass mode is off.VLAN IDs configured for inline interception: AllWatchdog timer is enabled.Timer frequency: 1600 ms.Autoreset frequency 500 ms.The watchdog timer will expire in 1221 ms.
The inline interface operates in two modes:
• Intercept operating mode—Packets are passed to WAAS for potential optimization.
• Bypass operating mode—Mechanical bypass between ports in InlineGroup during a failure or administrative shutdown (not applicable on Cisco AppNav Controller Interface Modules).
show interface InlinePort Command Output
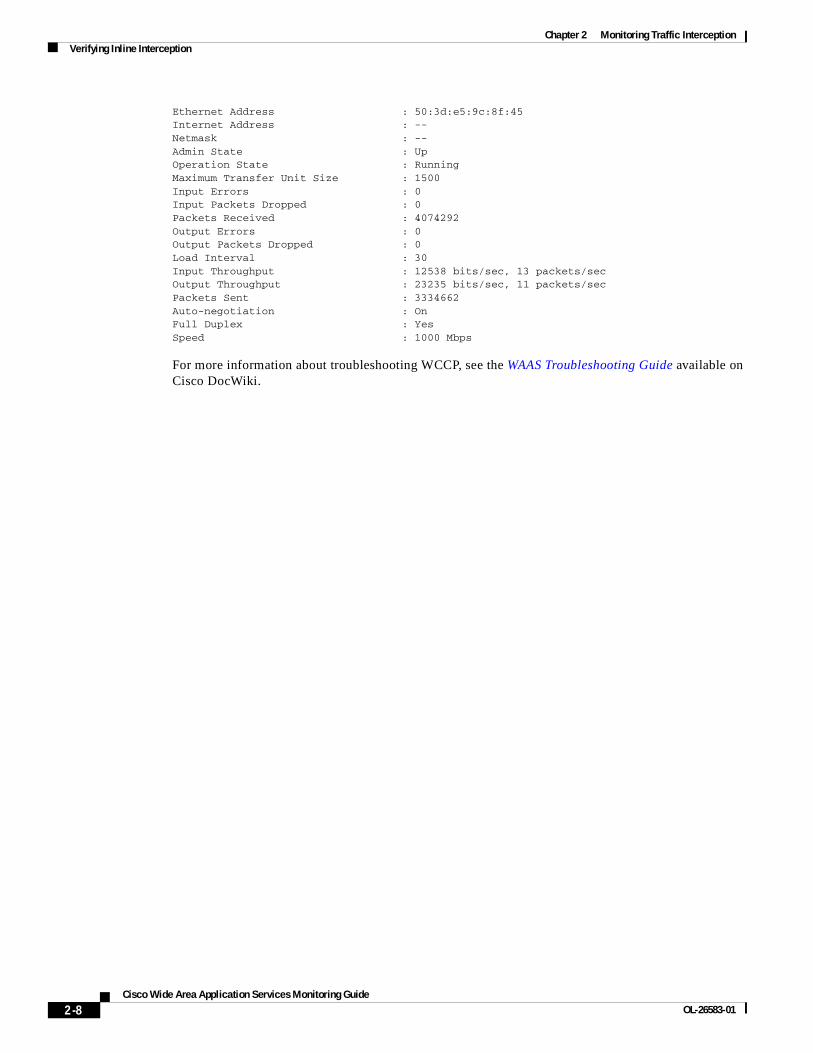
You can use the show interface InlinePort command to display the inline port information for the selected interface.
WAE# show interface InlinePort 1/0 lan
2-8Cisco Wide Area Application Services Monitoring Guide
OL-26583-01
Chapter 2 Monitoring Traffic InterceptionVerifying Inline Interception
Ethernet Address : 50:3d:e5:9c:8f:45Internet Address : --Netmask : --Admin State : UpOperation State : RunningMaximum Transfer Unit Size : 1500Input Errors : 0Input Packets Dropped : 0Packets Received : 4074292Output Errors : 0Output Packets Dropped : 0Load Interval : 30Input Throughput : 12538 bits/sec, 13 packets/secOutput Throughput : 23235 bits/sec, 11 packets/secPackets Sent : 3334662Auto-negotiation : OnFull Duplex : YesSpeed : 1000 Mbps
For more information about troubleshooting WCCP, see the WAAS Troubleshooting Guide available on Cisco DocWiki.
C H A P T E R
3-1Cisco Wide Area Application Services Monitoring Guide
OL-26583-01
3Monitoring WAAS Using SNMP
This chapter describes how to use the Simple Network Management Protocol (SNMP) to monitor your WAAS devices. SNMP is an interoperable standards-based protocol that allows for external monitoring of WAAS devices through an SNMP agent.
For more information about using and configuring SNMP, see the “Configuring SNMP Monitoring” chapter in the Cisco Wide Area Application Services Configuration Guide.
This chapter contains the following sections:
• Information About Supported MIBs, page 3-1
• Downloading Supported MIBs, page 3-3
• Working with SNMP Traps, page 3-3
• Information About Common SNMP MIB OIDS, page 3-6
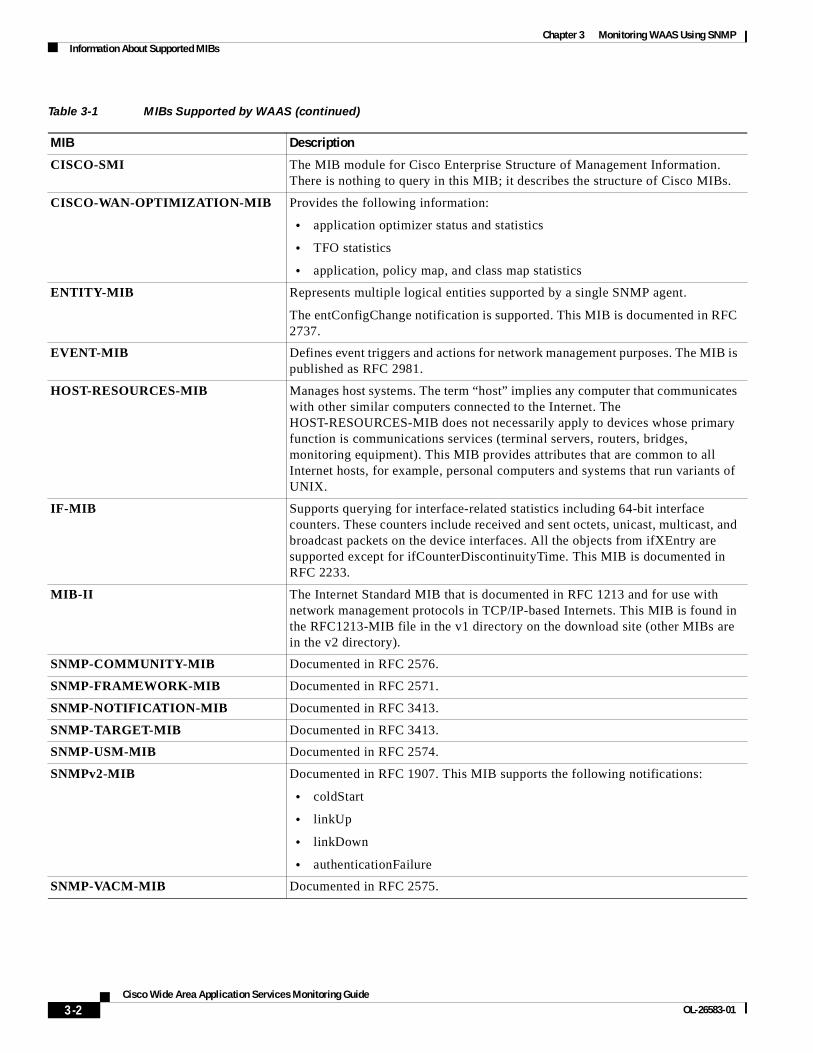
Information About Supported MIBsThis section describes the Cisco-specific MIBs that are supported by WAAS as shown in Table 3-1.
Table 3-1 MIBs Supported by WAAS
MIB Description
CISCO-APPNAV-MIB Provides information about AppNav objects, including WAAS nodes, WAAS node groups, AppNav controllers, and AppNav controller groups.
CISCO-CONTENT-ENGINE-MIB The MIB module for the Cisco WAAS device from Cisco Systems. The following objects from this MIB are supported:
• cceAlarmCriticalCount
• cceAlarmMajorCount
• cceAlarmMinorCount
• cceAlarmHistTableSize
CISCO-ENTITY-ASSET-MIB Monitors the asset information of items in the ENTITY-MIB (RFC 2037) entPhysicalTable. This MIB lists the orderable part number, serial number, hardware revision, manufacturing assembly number and revision, firmware ID and revision (if any) and software ID and revision (if any) of relevant entities listed in ENTITY-MIB entPhysicalTable.
3-2Cisco Wide Area Application Services Monitoring Guide
OL-26583-01
Chapter 3 Monitoring WAAS Using SNMPInformation About Supported MIBs
CISCO-SMI The MIB module for Cisco Enterprise Structure of Management Information. There is nothing to query in this MIB; it describes the structure of Cisco MIBs.
CISCO-WAN-OPTIMIZATION-MIB Provides the following information:
• application optimizer status and statistics
• TFO statistics
• application, policy map, and class map statistics
ENTITY-MIB Represents multiple logical entities supported by a single SNMP agent.
The entConfigChange notification is supported. This MIB is documented in RFC 2737.
EVENT-MIB Defines event triggers and actions for network management purposes. The MIB is published as RFC 2981.
HOST-RESOURCES-MIB Manages host systems. The term “host” implies any computer that communicates with other similar computers connected to the Internet. The HOST-RESOURCES-MIB does not necessarily apply to devices whose primary function is communications services (terminal servers, routers, bridges, monitoring equipment). This MIB provides attributes that are common to all Internet hosts, for example, personal computers and systems that run variants of UNIX.
IF-MIB Supports querying for interface-related statistics including 64-bit interface counters. These counters include received and sent octets, unicast, multicast, and broadcast packets on the device interfaces. All the objects from ifXEntry are supported except for ifCounterDiscontinuityTime. This MIB is documented in RFC 2233.
MIB-II The Internet Standard MIB that is documented in RFC 1213 and for use with network management protocols in TCP/IP-based Internets. This MIB is found in the RFC1213-MIB file in the v1 directory on the download site (other MIBs are in the v2 directory).
SNMP-COMMUNITY-MIB Documented in RFC 2576.
SNMP-FRAMEWORK-MIB Documented in RFC 2571.
SNMP-NOTIFICATION-MIB Documented in RFC 3413.
SNMP-TARGET-MIB Documented in RFC 3413.
SNMP-USM-MIB Documented in RFC 2574.
SNMPv2-MIB Documented in RFC 1907. This MIB supports the following notifications:
• coldStart
• linkUp
• linkDown
• authenticationFailure
SNMP-VACM-MIB Documented in RFC 2575.
Table 3-1 MIBs Supported by WAAS (continued)
MIB Description
3-3Cisco Wide Area Application Services Monitoring Guide
OL-26583-01
Chapter 3 Monitoring WAAS Using SNMPDownloading Supported MIBs
Downloading Supported MIBsAll supported MIB files can be downloaded from the following Cisco FTP locations:
• ftp://ftp.cisco.com/pub/mibs/v2
• ftp://ftp.cisco.com/pub/mibs/v1
The MIB objects that are defined in each MIB are described in the MIB files and are self-explanatory.
Working with SNMP TrapsThis section contains the following topics:
• Enabling SNMP Traps, page 3-3
• Viewing SNMP Trigger Lists, page 3-4
• Defining New Traps, page 3-5
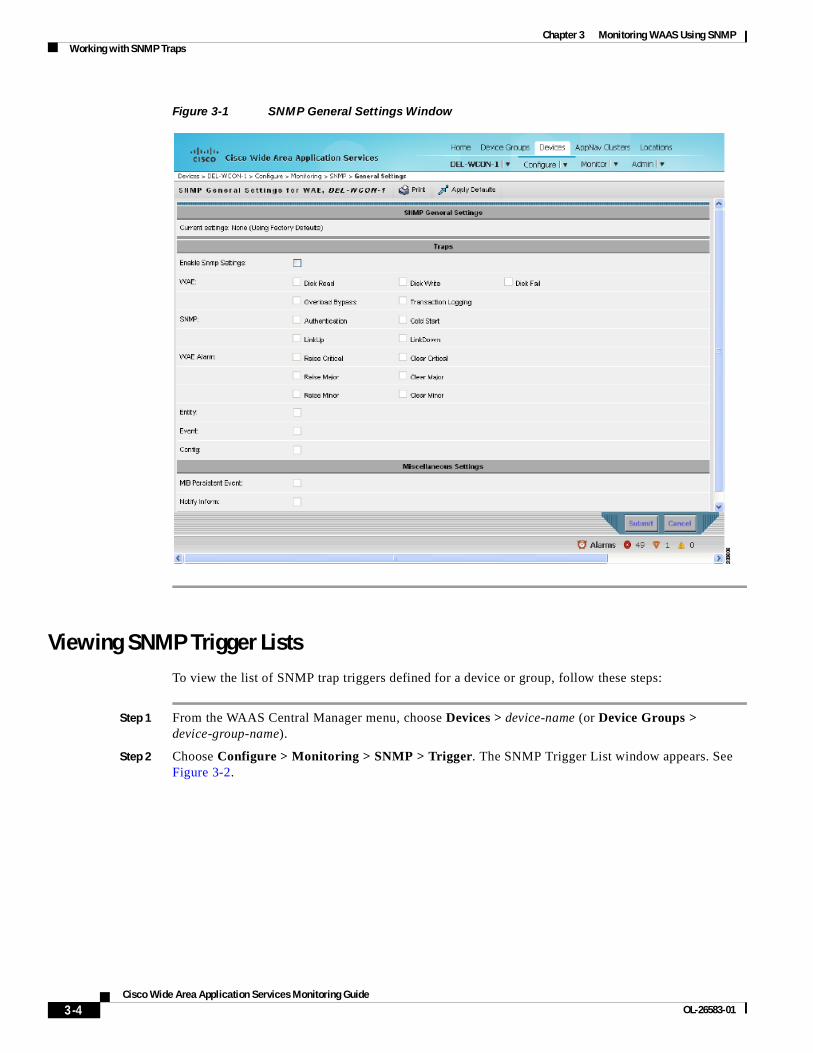
Enabling SNMP TrapsTo send SNMP traps, follow these steps:
Step 1 From the WAAS Central Manager menu, choose Devices > device-name (or Device Groups > device-group-name).
Step 2 Choose Configure > Monitoring > SNMP > General Settings. The SNMP General Settings window appears. See Figure 3-1. The settings window display which traps are enabled for the device or group.
Step 3 Configure the trap settings as desired. For more information, see the “Configuring SNMP Monitoring” chapter in the Cisco Wide Area Application Services Configuration Guide.
3-4Cisco Wide Area Application Services Monitoring Guide
OL-26583-01
Chapter 3 Monitoring WAAS Using SNMPWorking with SNMP Traps
Figure 3-1 SNMP General Settings Window
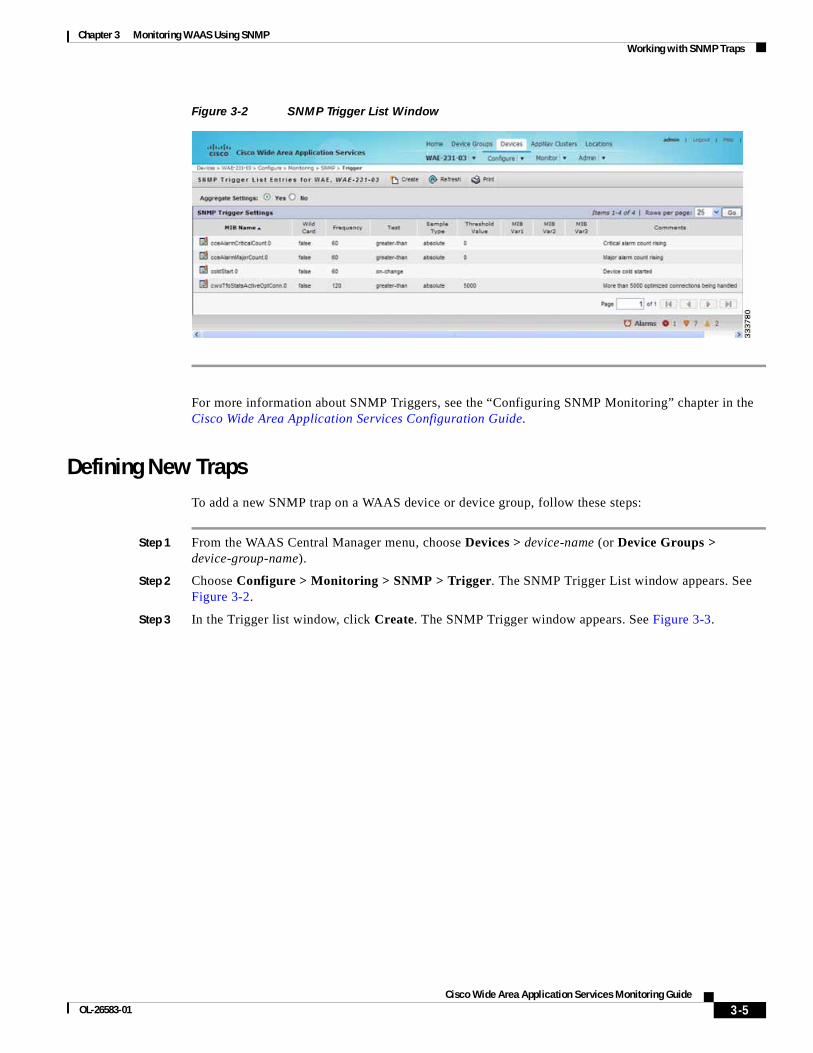
Viewing SNMP Trigger ListsTo view the list of SNMP trap triggers defined for a device or group, follow these steps:
Step 1 From the WAAS Central Manager menu, choose Devices > device-name (or Device Groups > device-group-name).
Step 2 Choose Configure > Monitoring > SNMP > Trigger. The SNMP Trigger List window appears. See Figure 3-2.
3-5Cisco Wide Area Application Services Monitoring Guide
OL-26583-01
Chapter 3 Monitoring WAAS Using SNMPWorking with SNMP Traps
Figure 3-2 SNMP Trigger List Window
For more information about SNMP Triggers, see the “Configuring SNMP Monitoring” chapter in the Cisco Wide Area Application Services Configuration Guide.
Defining New TrapsTo add a new SNMP trap on a WAAS device or device group, follow these steps:
Step 1 From the WAAS Central Manager menu, choose Devices > device-name (or Device Groups > device-group-name).
Step 2 Choose Configure > Monitoring > SNMP > Trigger. The SNMP Trigger List window appears. See Figure 3-2.
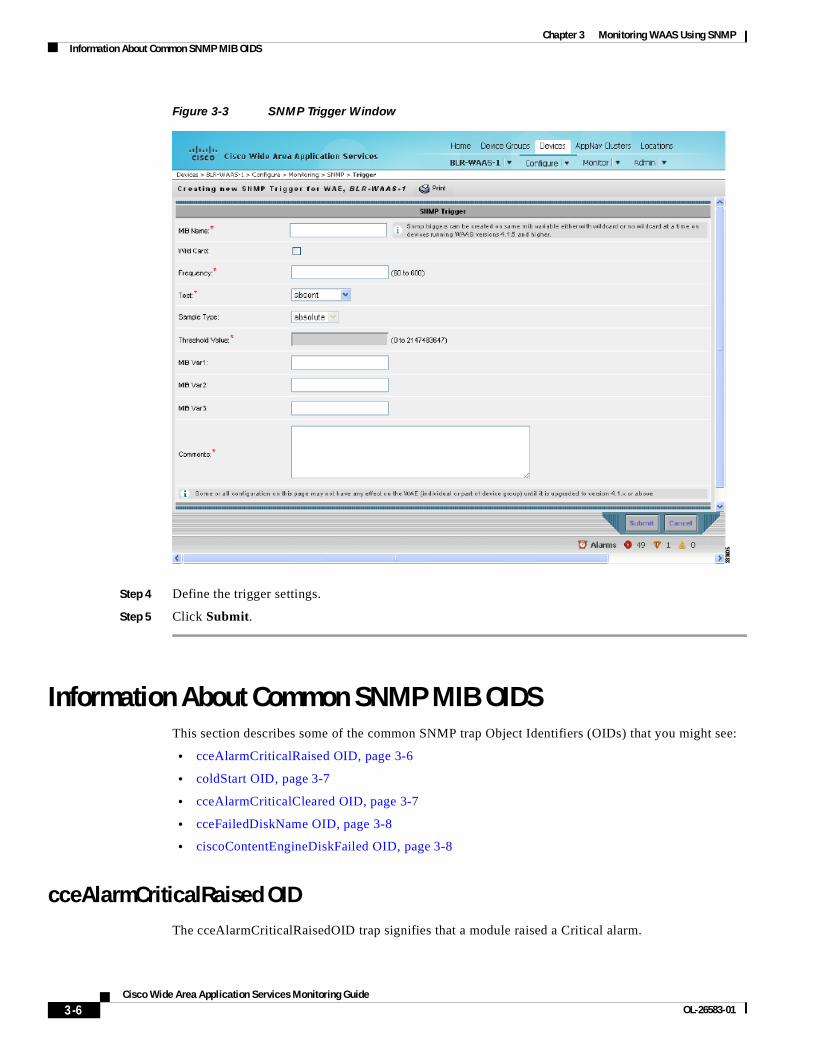
Step 3 In the Trigger list window, click Create. The SNMP Trigger window appears. See Figure 3-3.
3-6Cisco Wide Area Application Services Monitoring Guide
OL-26583-01
Chapter 3 Monitoring WAAS Using SNMPInformation About Common SNMP MIB OIDS
Figure 3-3 SNMP Trigger Window
Step 4 Define the trigger settings.
Step 5 Click Submit.
Information About Common SNMP MIB OIDSThis section describes some of the common SNMP trap Object Identifiers (OIDs) that you might see:
• cceAlarmCriticalRaised OID, page 3-6
• coldStart OID, page 3-7
• cceAlarmCriticalCleared OID, page 3-7
• cceFailedDiskName OID, page 3-8
• ciscoContentEngineDiskFailed OID, page 3-8
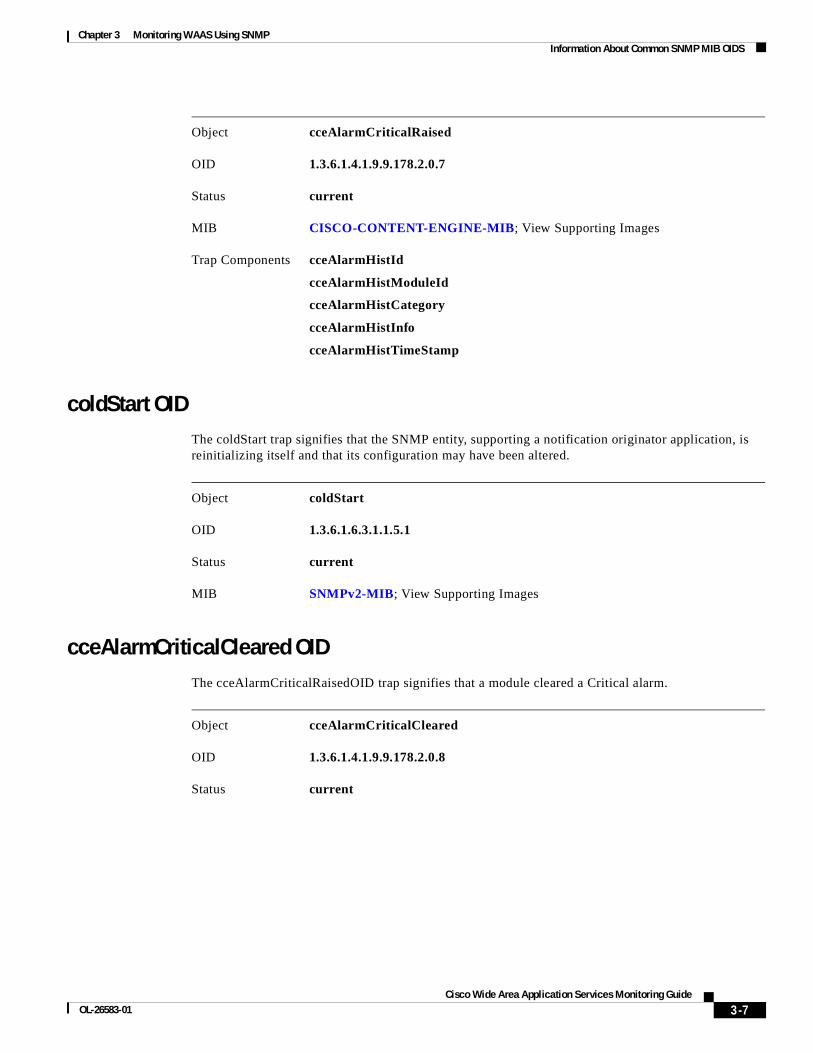
cceAlarmCriticalRaised OIDThe cceAlarmCriticalRaisedOID trap signifies that a module raised a Critical alarm.
3-7Cisco Wide Area Application Services Monitoring Guide
OL-26583-01
Chapter 3 Monitoring WAAS Using SNMPInformation About Common SNMP MIB OIDS
coldStart OIDThe coldStart trap signifies that the SNMP entity, supporting a notification originator application, is reinitializing itself and that its configuration may have been altered.
cceAlarmCriticalCleared OIDThe cceAlarmCriticalRaisedOID trap signifies that a module cleared a Critical alarm.
Object cceAlarmCriticalRaised
OID 1.3.6.1.4.1.9.9.178.2.0.7
Status current
MIB CISCO-CONTENT-ENGINE-MIB; View Supporting Images
Trap Components cceAlarmHistId
cceAlarmHistModuleId
cceAlarmHistCategory
cceAlarmHistInfo
cceAlarmHistTimeStamp
Object coldStart
OID 1.3.6.1.6.3.1.1.5.1
Status current
MIB SNMPv2-MIB; View Supporting Images
Object cceAlarmCriticalCleared
OID 1.3.6.1.4.1.9.9.178.2.0.8
Status current
3-8Cisco Wide Area Application Services Monitoring Guide
OL-26583-01
Chapter 3 Monitoring WAAS Using SNMPInformation About Common SNMP MIB OIDS
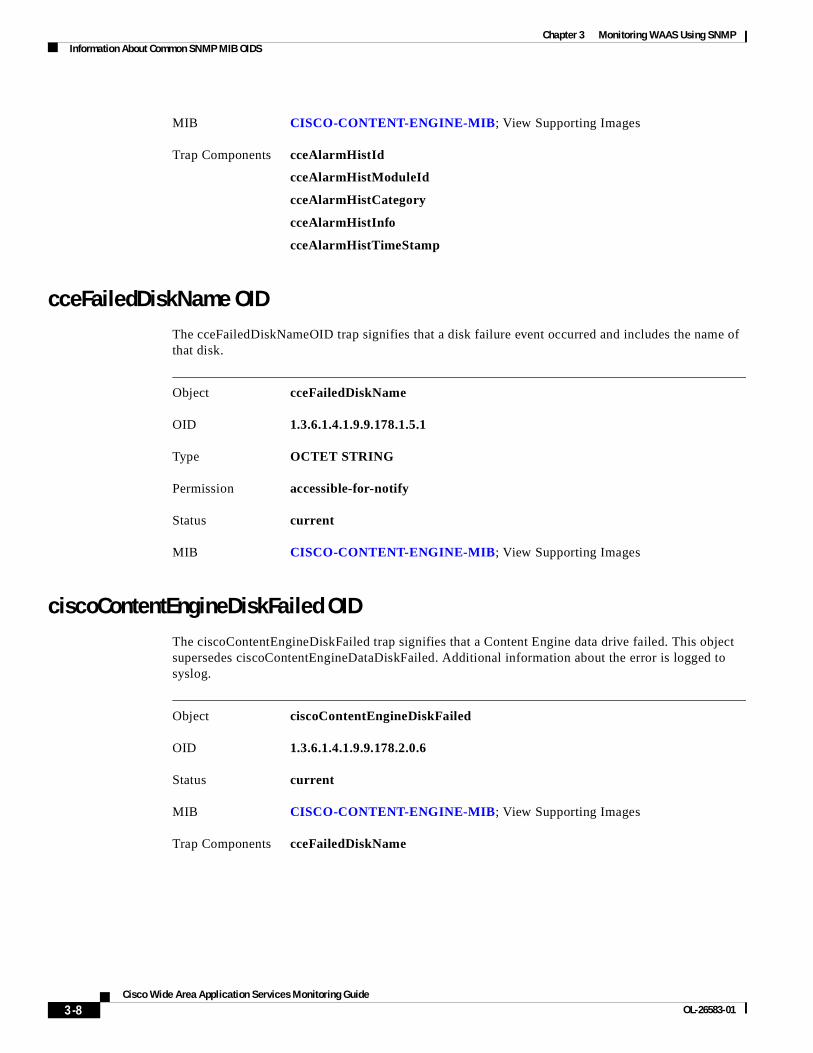
cceFailedDiskName OIDThe cceFailedDiskNameOID trap signifies that a disk failure event occurred and includes the name of that disk.
ciscoContentEngineDiskFailed OIDThe ciscoContentEngineDiskFailed trap signifies that a Content Engine data drive failed. This object supersedes ciscoContentEngineDataDiskFailed. Additional information about the error is logged to syslog.
MIB CISCO-CONTENT-ENGINE-MIB; View Supporting Images
Trap Components cceAlarmHistId
cceAlarmHistModuleId
cceAlarmHistCategory
cceAlarmHistInfo
cceAlarmHistTimeStamp
Object cceFailedDiskName
OID 1.3.6.1.4.1.9.9.178.1.5.1
Type OCTET STRING
Permission accessible-for-notify
Status current
MIB CISCO-CONTENT-ENGINE-MIB; View Supporting Images
Object ciscoContentEngineDiskFailed
OID 1.3.6.1.4.1.9.9.178.2.0.6
Status current
MIB CISCO-CONTENT-ENGINE-MIB; View Supporting Images
Trap Components cceFailedDiskName
C H A P T E R
4-1Cisco Wide Area Application Services Monitoring Guide
OL-26583-01
4Monitoring WAAS Using XML API
This chapter describes how to use the WAAS API to monitor your WAAS devices and how to use soapUI with the WAAS API interface.
This chapter contains the following sections:
• Information About the XML-Based API, page 4-1
• Using the Traffic Acceleration Service, page 4-2
• Using the Events and Status Service, page 4-2
• Using soapUI to Access the WAAS API Interface, page 4-3
Information About the XML-Based APIThe WAAS Central Manager Web Service provides an XML-based API that supports monitoring device status and information, alarms, and statistics. It does not support device configuration.
For more information about the XML API, see the Cisco Wide Area Application Services API Reference.
The following services are offered:
• AppNav Statistics Service (AppNavStats)
• CIFS Statistics Service (CIFSStats)
• Device Configuration Service (DeviceConf)
• Events Service (AlarmStatus)
• HTTP and HTTPS Statistics Service (HttpStats and HttpsStats)
• ICA Statistics Service (ICAStats)
• MAPI Statistics Service (MapiStats)
• NFS Statistics Service (NfsStats)
• SMB Statistics Service (SmbStats)
• SSL Statistics Service (SSLStats)
• Status Service (DeviceStatus)
• Traffic Acceleration Service (TrafficStats)
• Video Streaming Statistics Service (VideoStats)
4-2Cisco Wide Area Application Services Monitoring Guide
OL-26583-01
Chapter 4 Monitoring WAAS Using XML APIUsing the Traffic Acceleration Service
To obtain the WSDL file defined for a particular service in the WAAS Central Manager monitoring API implementation, you submit a URL to the service with a ?wsdl suffix as follows:
https://<host/ip>:8443/ws/service_name?wsdl
To query a service for information, you send an XML-formatted SOAP request to the service at the following URL:
https://<host/ip>:8443/ws/service_name
Using the Traffic Acceleration ServiceYou can retrieve traffic and application statistics for individual WAEs, device groups, and for the WAAS network using the Traffic Acceleration service (TrafficStats Web Service), which performs actions that include the following:
• getAllClassMap—Retrieves all of the monitored class map names.
• getMonitoredApplications—Retrieves a list of all types of applications known in the scope of the system.
• retrieveAppTrafficStats—Retrieves overall traffic statistics collected on either a WAAS device, WAEs within a device group, or all system-wide WAEs. The traffic is further filtered based on the specified application names
• retrieveAverageThroughPutClassStats—Retrieves average throughput counts for a set of class map names.
• retrieveAverageThroughPutStats—Retrieves the average throughput values collected on a device.
• retrieveClassTrafficStats—Retrieves traffic byte counts for the specified class map names.
• retrieveConnection—Retrieves overall connection details for the current time.
• retrieveConnectionTrendClassStats—Retrieves overall connection trend details of applications collected on a device.
• retrieveConnectionTrendStats—Retrieves connection counts for the specified set of class map names.
• retrieveCPUUtilization—Retrieves the CPU utilization information for a specified WAE.
• retrievePeakThroughPutClassStats—Retrieves peak throughput values for the specified set of class map names.
• retrievePeakThroughPutStats—Retrieves the peak throughput values collected on a device.
• retrieveTrafficStats—Retrieves the overall statistics collected on either a WAAS device, WAEs within a device group, or all system-wide WAEs.
Using the Events and Status Service You can retrieve alarm information, device status, and disk status using the Events and Status service (AlarmStatus Web Service), which performs one or more of the following actions:
• getDeviceStatus—Retrieves the device status.
• getDiskEncryptStatus—Retrieves the disk encryption status.
• getDiskInformation—Retrieves information about the disk.
4-3Cisco Wide Area Application Services Monitoring Guide
OL-26583-01
Chapter 4 Monitoring WAAS Using XML APIUsing soapUI to Access the WAAS API Interface
• getDiskStatus—Retrieves the physical disk status.
• getMonitoredAOsByWaeIDs—Retrieves the operational status of application accelerators for a list of device IDs.
• getMonitoredAOs—Retrieves the operational status of application accelerators for either a WAAS device, WAEs within a device group, or all system-wide WAEs.
• retrieveAlarmByName—Retrieves a list of all alarms filtered by the name of the WAE or WAE group, the object type, or the alarm name.
• retrieveAlarmBySeverity—Retrieves a list of all active alarms for the specified WAE or WAE group, further filtered on alarm severity.
• retrieveAllAlarms—Retrieves all alarms.
Using soapUI to Access the WAAS API InterfaceYou can access the WAAS API interface using third-party tools such as soapUI, WebInject, ApacheCXF, and so forth. The soapUI website (http://www.soapui.org/) offers a free software version that you can download and install on a client PC. The procedure in this section describes how to create a project using soapUI after you install and start the software.
Procedure
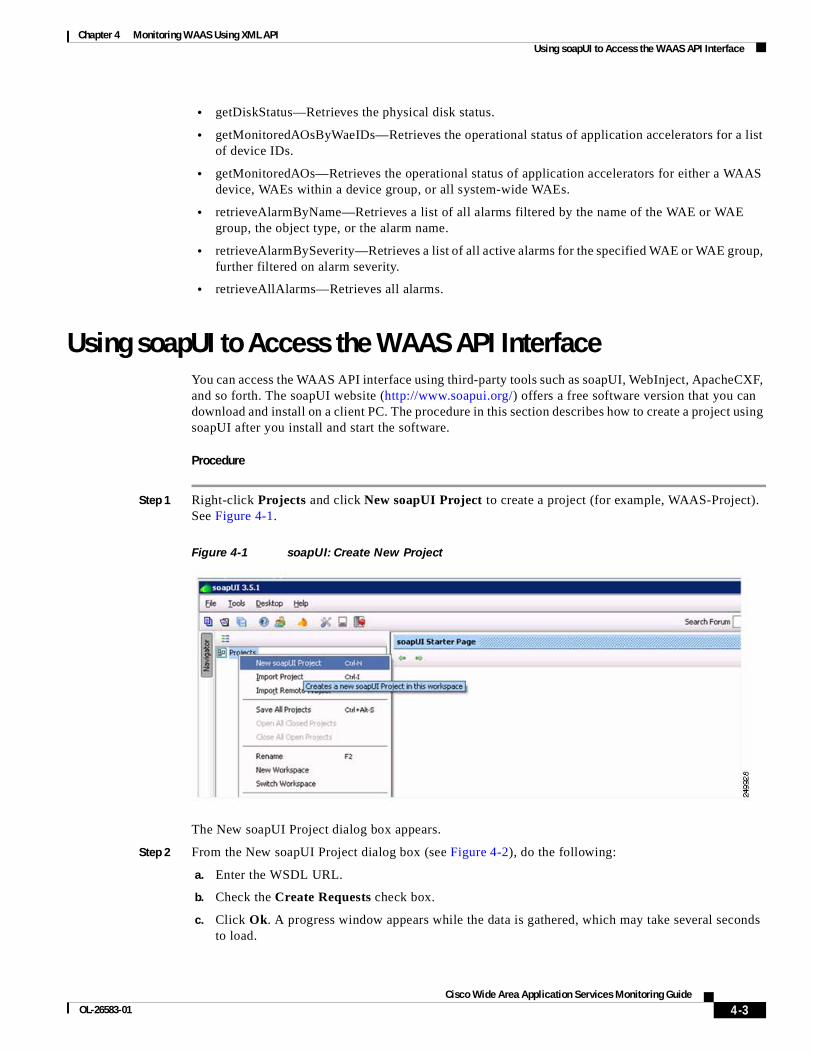
Step 1 Right-click Projects and click New soapUI Project to create a project (for example, WAAS-Project). See Figure 4-1.
Figure 4-1 soapUI: Create New Project
The New soapUI Project dialog box appears.
Step 2 From the New soapUI Project dialog box (see Figure 4-2), do the following:
a. Enter the WSDL URL.
b. Check the Create Requests check box.
c. Click Ok. A progress window appears while the data is gathered, which may take several seconds to load.
4-4Cisco Wide Area Application Services Monitoring Guide
OL-26583-01
Chapter 4 Monitoring WAAS Using XML APIUsing soapUI to Access the WAAS API Interface
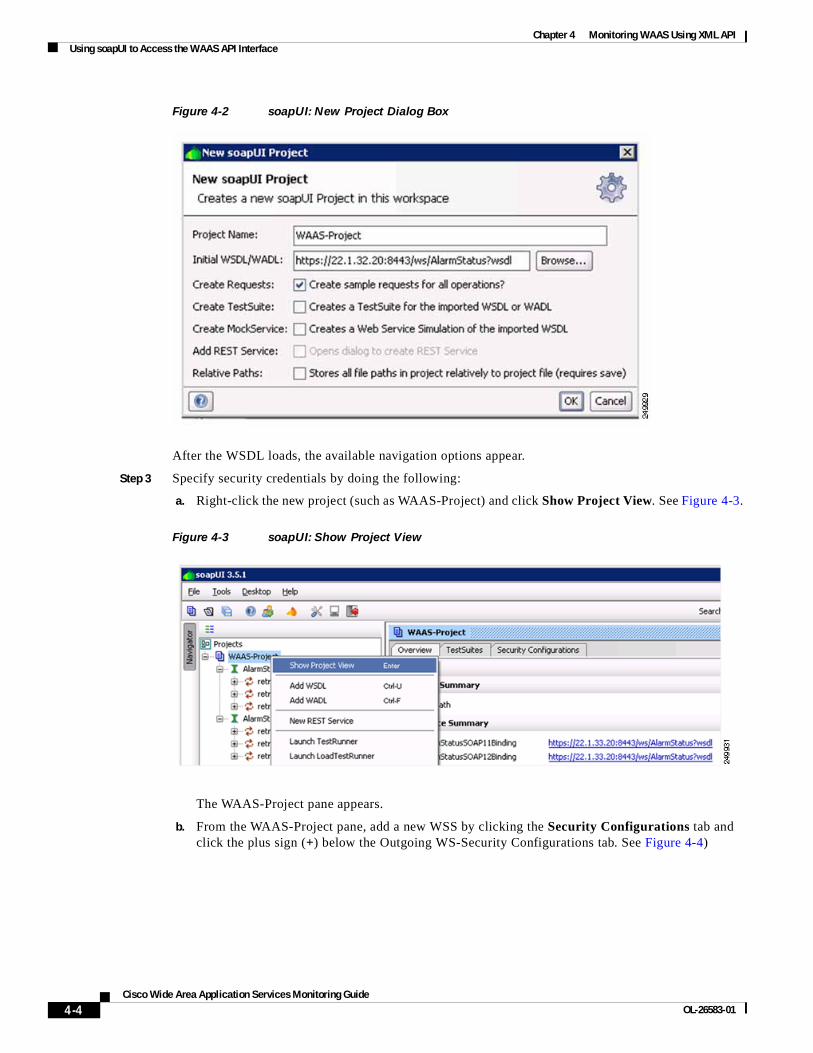
Figure 4-2 soapUI: New Project Dialog Box
After the WSDL loads, the available navigation options appear.
Step 3 Specify security credentials by doing the following:
a. Right-click the new project (such as WAAS-Project) and click Show Project View. See Figure 4-3.
Figure 4-3 soapUI: Show Project View
The WAAS-Project pane appears.
b. From the WAAS-Project pane, add a new WSS by clicking the Security Configurations tab and click the plus sign (+) below the Outgoing WS-Security Configurations tab. See Figure 4-4)
4-5Cisco Wide Area Application Services Monitoring Guide
OL-26583-01
Chapter 4 Monitoring WAAS Using XML APIUsing soapUI to Access the WAAS API Interface
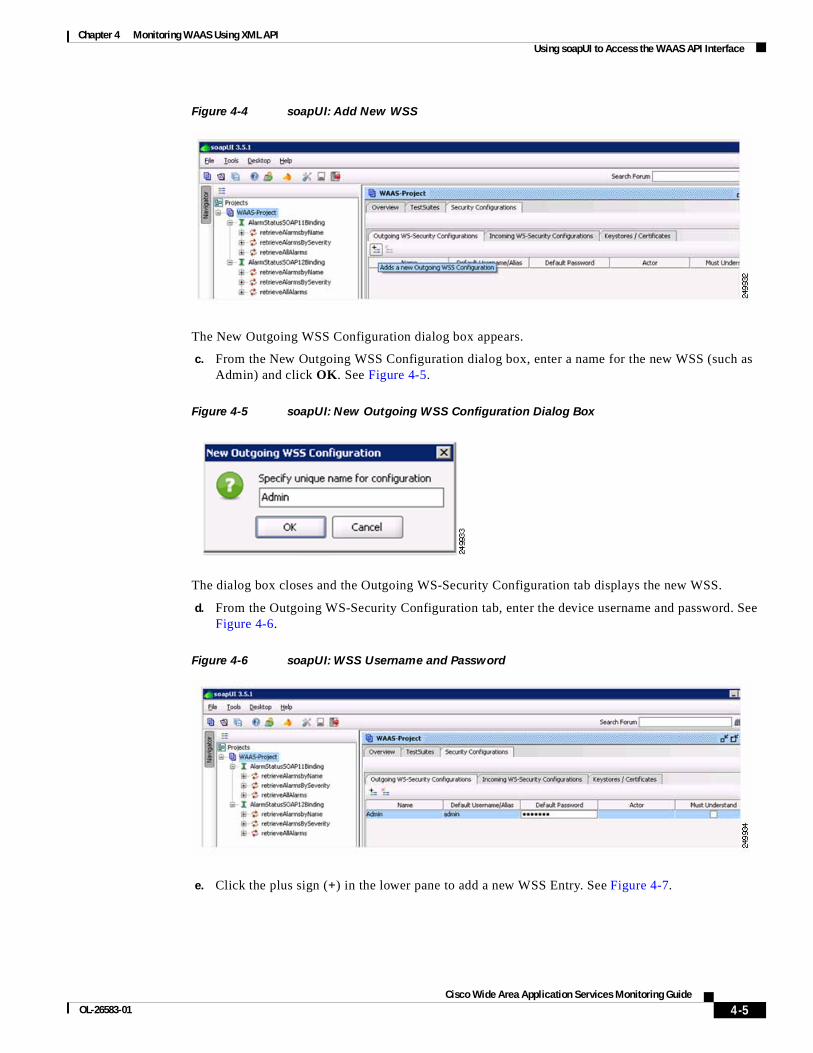
Figure 4-4 soapUI: Add New WSS
The New Outgoing WSS Configuration dialog box appears.
c. From the New Outgoing WSS Configuration dialog box, enter a name for the new WSS (such as Admin) and click OK. See Figure 4-5.
Figure 4-5 soapUI: New Outgoing WSS Configuration Dialog Box
The dialog box closes and the Outgoing WS-Security Configuration tab displays the new WSS.
d. From the Outgoing WS-Security Configuration tab, enter the device username and password. See Figure 4-6.
Figure 4-6 soapUI: WSS Username and Password
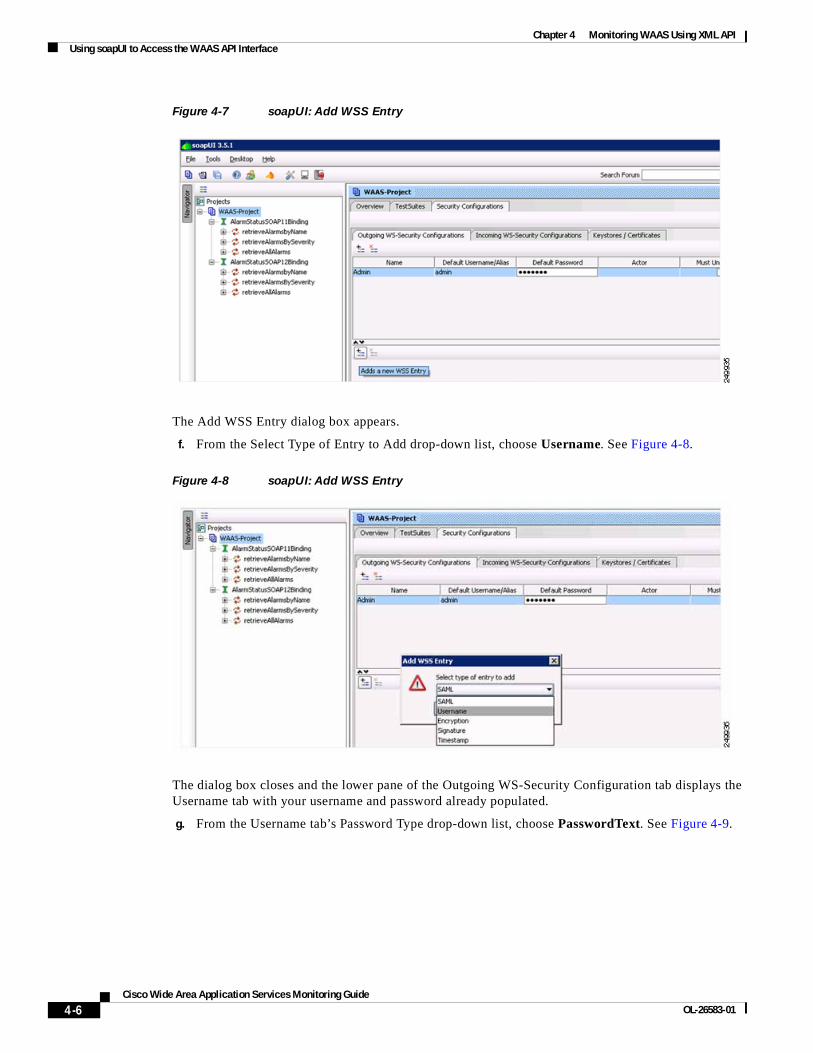
e. Click the plus sign (+) in the lower pane to add a new WSS Entry. See Figure 4-7.
4-6Cisco Wide Area Application Services Monitoring Guide
OL-26583-01
Chapter 4 Monitoring WAAS Using XML APIUsing soapUI to Access the WAAS API Interface
Figure 4-7 soapUI: Add WSS Entry
The Add WSS Entry dialog box appears.
f. From the Select Type of Entry to Add drop-down list, choose Username. See Figure 4-8.
Figure 4-8 soapUI: Add WSS Entry
The dialog box closes and the lower pane of the Outgoing WS-Security Configuration tab displays the Username tab with your username and password already populated.
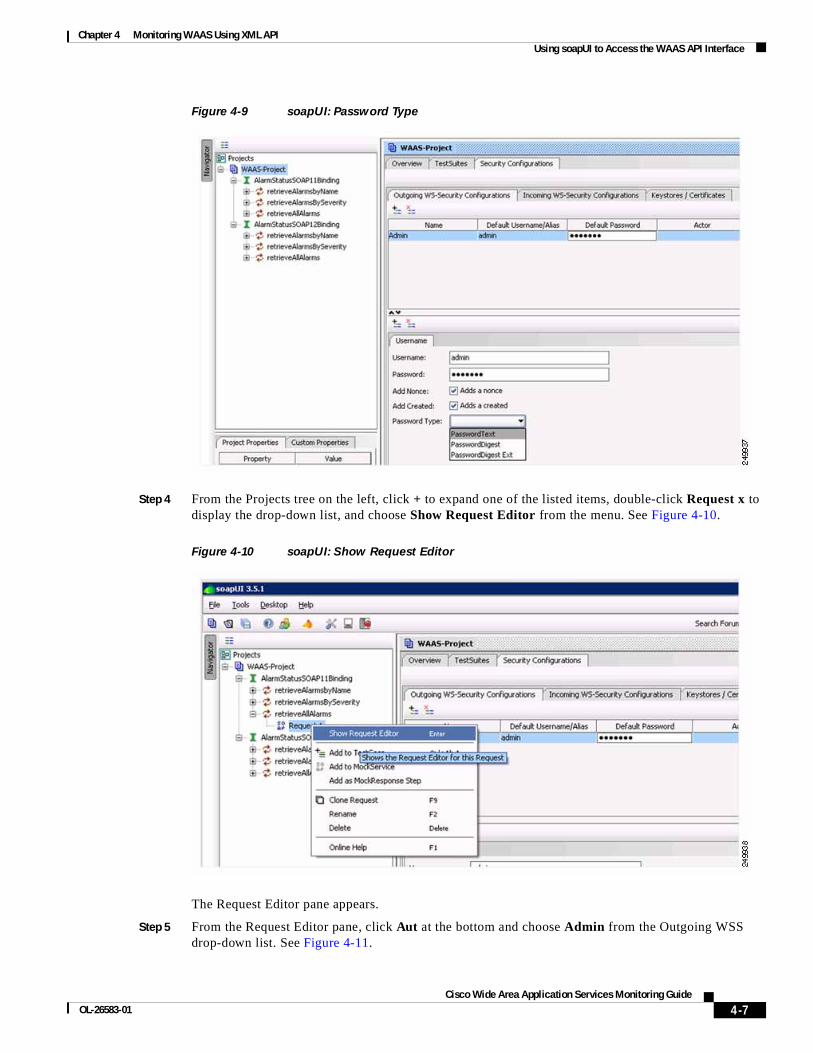
g. From the Username tab’s Password Type drop-down list, choose PasswordText. See Figure 4-9.
4-7Cisco Wide Area Application Services Monitoring Guide
OL-26583-01
Chapter 4 Monitoring WAAS Using XML APIUsing soapUI to Access the WAAS API Interface
Figure 4-9 soapUI: Password Type
Step 4 From the Projects tree on the left, click + to expand one of the listed items, double-click Request x to display the drop-down list, and choose Show Request Editor from the menu. See Figure 4-10.
Figure 4-10 soapUI: Show Request Editor
The Request Editor pane appears.
Step 5 From the Request Editor pane, click Aut at the bottom and choose Admin from the Outgoing WSS drop-down list. See Figure 4-11.
4-8Cisco Wide Area Application Services Monitoring Guide
OL-26583-01
Chapter 4 Monitoring WAAS Using XML APIUsing soapUI to Access the WAAS API Interface
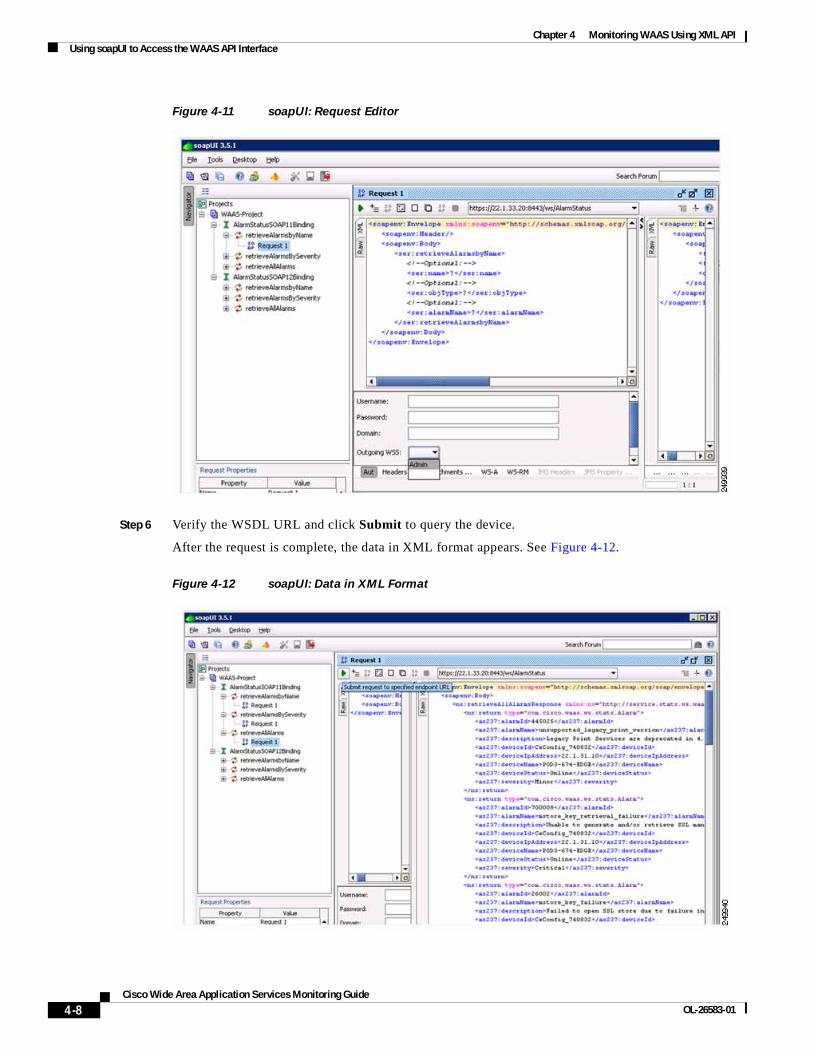
Figure 4-11 soapUI: Request Editor
Step 6 Verify the WSDL URL and click Submit to query the device.
After the request is complete, the data in XML format appears. See Figure 4-12.
Figure 4-12 soapUI: Data in XML Format
4-9Cisco Wide Area Application Services Monitoring Guide
OL-26583-01
Chapter 4 Monitoring WAAS Using XML APIUsing soapUI to Access the WAAS API Interface
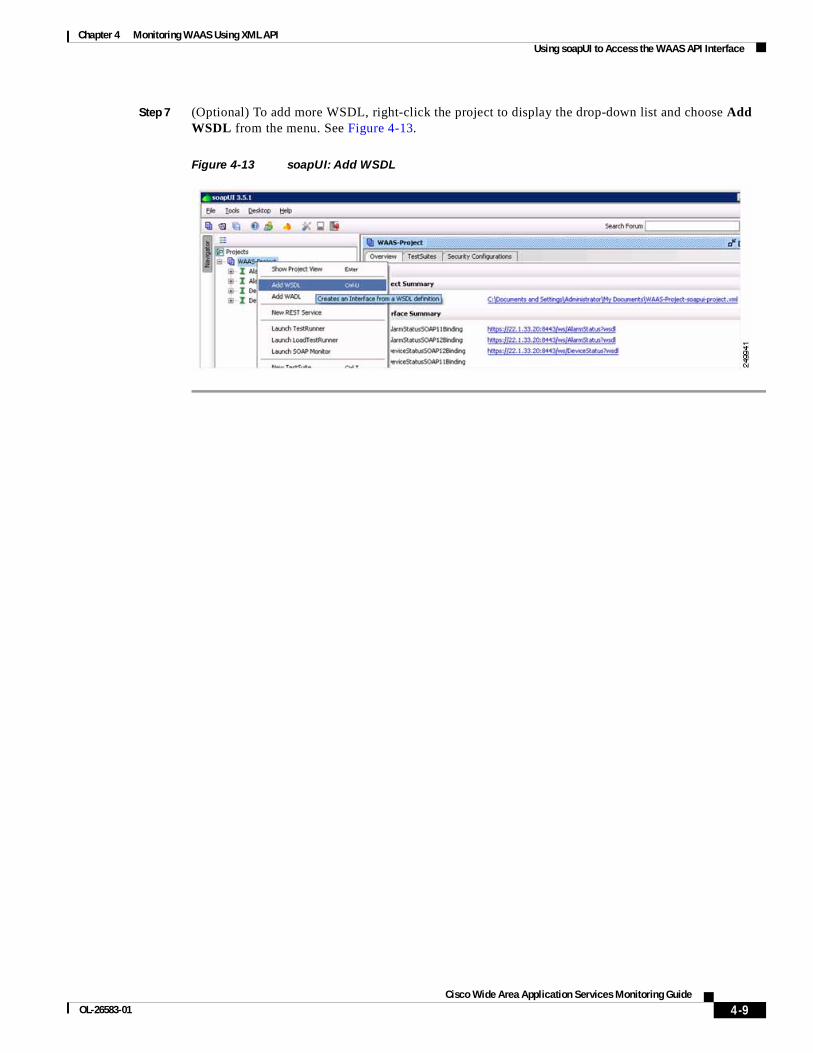
Step 7 (Optional) To add more WSDL, right-click the project to display the drop-down list and choose Add WSDL from the menu. See Figure 4-13.
Figure 4-13 soapUI: Add WSDL

4-10Cisco Wide Area Application Services Monitoring Guide
OL-26583-01
Chapter 4 Monitoring WAAS Using XML APIUsing soapUI to Access the WAAS API Interface
C H A P T E R
5-1Cisco Wide Area Application Services Monitoring Guide
OL-26583-01
5Monitoring WAAS Using Cisco Network Analysis Module
This chapter describes Cisco Network Analysis Module (NAM), which you can use to monitor your WAAS devices.
This chapter contains the following sections:
• Information About NAM, page 5-1
• Configuring NAM Monitoring of WAAS Devices, page 5-3
• NAM Deployment Scenarios, page 5-6
• Monitoring and Analyzing Traffic Using the NAM, page 5-7
Information About NAMNAM monitors network and application response time (ART) by analyzing the exchanges of TCP packets between clients and application servers. The NAM Traffic Analyzer software enables network managers to understand, manage, and improve how applications and services are delivered to end users by combining flow-based and packet-based analysis into one solution.
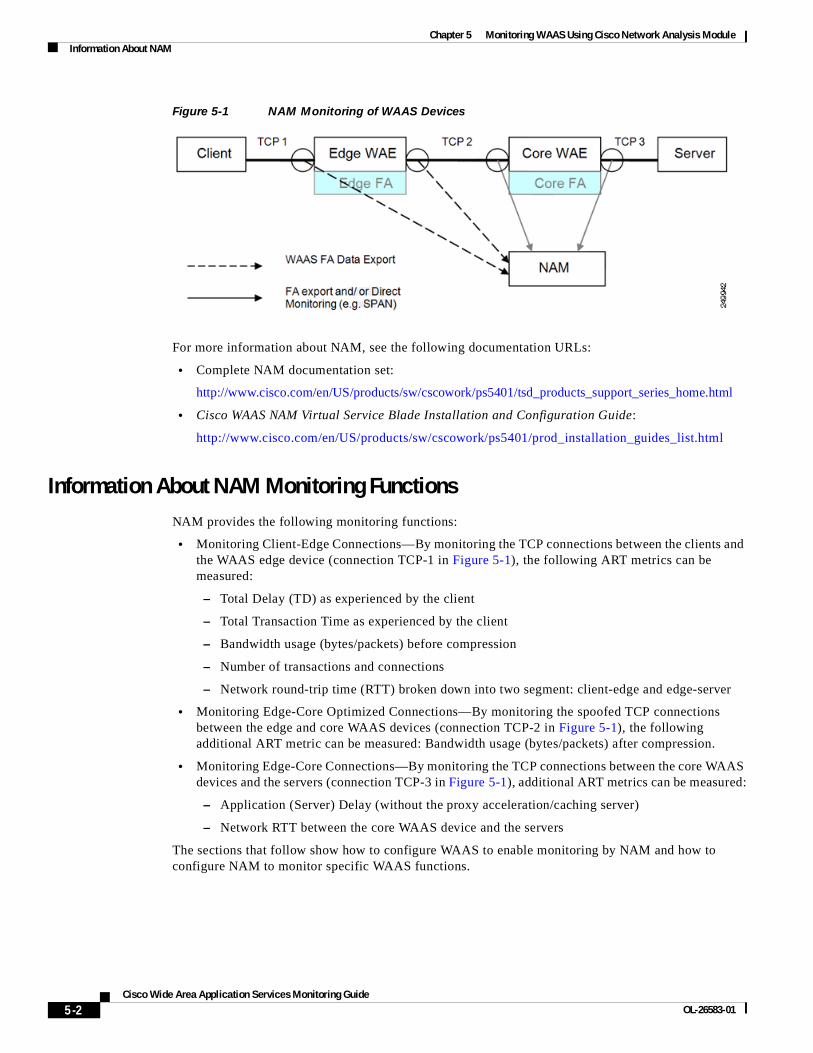
The Cisco NAM includes an embedded, web-based Traffic Analyzer GUI that provides quick access to the configuration menus and presents easy-to-read performance monitoring and analysis on network traffic. A FlowAgent (FA) runs on WAAS devices to collect TCP packet data and send the flow data to NAM for analyzing and reporting. See Figure 5-1.
5-2Cisco Wide Area Application Services Monitoring Guide
OL-26583-01
Chapter 5 Monitoring WAAS Using Cisco Network Analysis ModuleInformation About NAM
Figure 5-1 NAM Monitoring of WAAS Devices
For more information about NAM, see the following documentation URLs:
• Complete NAM documentation set:
http://www.cisco.com/en/US/products/sw/cscowork/ps5401/tsd_products_support_series_home.html
• Cisco WAAS NAM Virtual Service Blade Installation and Configuration Guide:
http://www.cisco.com/en/US/products/sw/cscowork/ps5401/prod_installation_guides_list.html
Information About NAM Monitoring FunctionsNAM provides the following monitoring functions:
• Monitoring Client-Edge Connections—By monitoring the TCP connections between the clients and the WAAS edge device (connection TCP-1 in Figure 5-1), the following ART metrics can be measured:
– Total Delay (TD) as experienced by the client
– Total Transaction Time as experienced by the client
– Bandwidth usage (bytes/packets) before compression
– Number of transactions and connections
– Network round-trip time (RTT) broken down into two segment: client-edge and edge-server
• Monitoring Edge-Core Optimized Connections—By monitoring the spoofed TCP connections between the edge and core WAAS devices (connection TCP-2 in Figure 5-1), the following additional ART metric can be measured: Bandwidth usage (bytes/packets) after compression.
• Monitoring Edge-Core Connections—By monitoring the TCP connections between the core WAAS devices and the servers (connection TCP-3 in Figure 5-1), additional ART metrics can be measured:
– Application (Server) Delay (without the proxy acceleration/caching server)
– Network RTT between the core WAAS device and the servers
The sections that follow show how to configure WAAS to enable monitoring by NAM and how to configure NAM to monitor specific WAAS functions.
5-3Cisco Wide Area Application Services Monitoring Guide
OL-26583-01
Chapter 5 Monitoring WAAS Using Cisco Network Analysis ModuleConfiguring NAM Monitoring of WAAS Devices
Configuring NAM Monitoring of WAAS DevicesThis section contains the following topics:
• Configuring Basic WAAS Setup, page 5-3
• Configuring WAAS Monitored Servers, page 5-4
• Configuring WAAS Data Sources in NAM, page 5-5
Configuring Basic WAAS SetupBefore you can monitor WAAS traffic, you must first set up basic NAM configuration by completing the following tasks:
• Connect to a NAM server by providing the server’s IP address, protocol, and port.
• Establish account credentials.
• Associate a WAAS device group or WAAS Express device group with configured policies.
• Enable Flow Agent.
Follow the steps below to complete basic NAM configuration. Only device group level policy configurations are applicable for NAM.
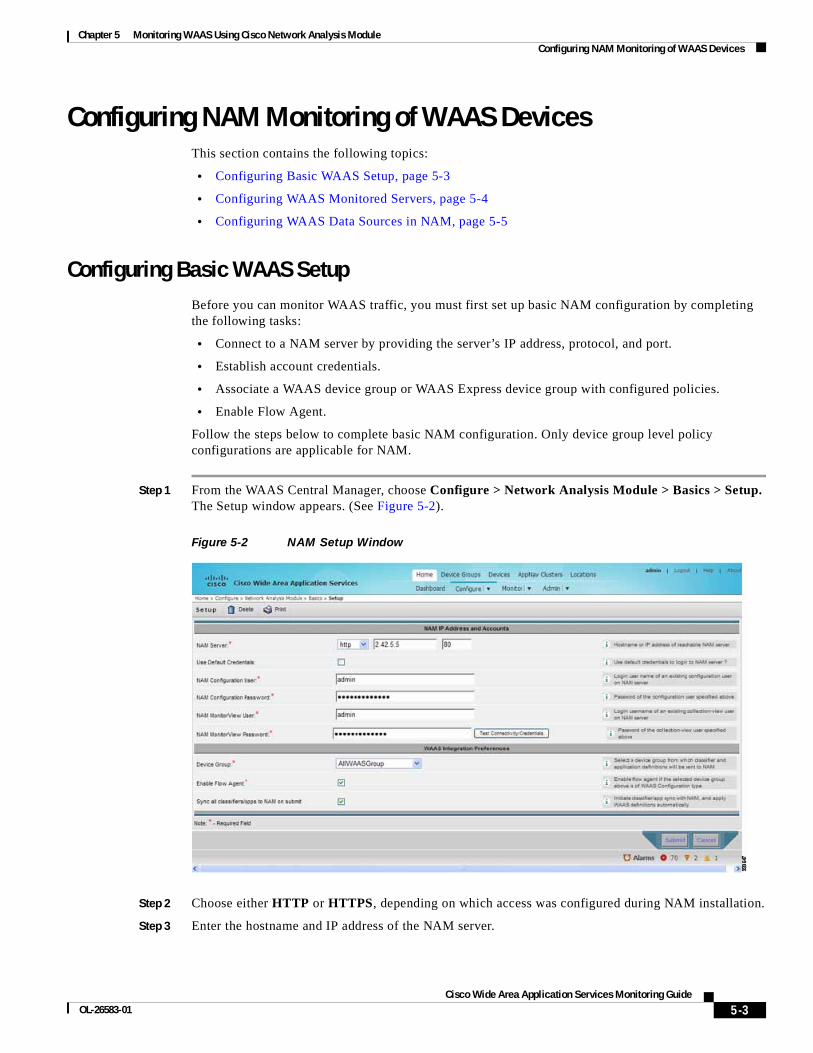
Step 1 From the WAAS Central Manager, choose Configure > Network Analysis Module > Basics > Setup. The Setup window appears. (See Figure 5-2).
Figure 5-2 NAM Setup Window
Step 2 Choose either HTTP or HTTPS, depending on which access was configured during NAM installation.
Step 3 Enter the hostname and IP address of the NAM server.
5-4Cisco Wide Area Application Services Monitoring Guide
OL-26583-01
Chapter 5 Monitoring WAAS Using Cisco Network Analysis ModuleConfiguring NAM Monitoring of WAAS Devices
Step 4 Configure the credentials: use the preconfigured login credentials by selecting the Use Default Credentials option, or configure the credentials manually by filling in the fields with valid values.
Step 5 Configure the WAAS Integration Preferences to configure a WAAS device group to work with the NAM server as follows:
a. Choose the device group from which applications and classifier definitions are pushed to the NAM when performing a synchronization operation.
b. Choose the Enable Flow Agent option to data export.
c. Choose the Sync all classifiers/apps to NAM on submit to initiate synchronization with the NAM.
Step 6 Click Submit.
For additional information about configuring NAM, see the NAM chapter in the Cisco Wide Area Application Services Configuration Guide.
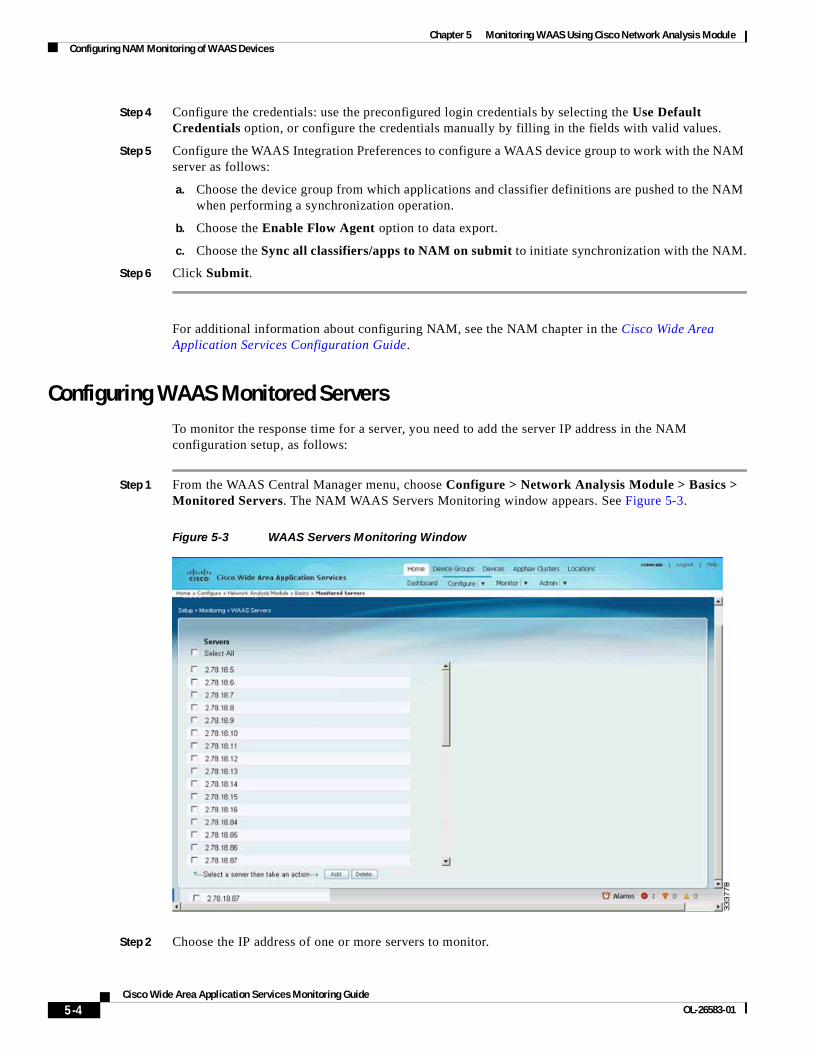
Configuring WAAS Monitored ServersTo monitor the response time for a server, you need to add the server IP address in the NAM configuration setup, as follows:
Step 1 From the WAAS Central Manager menu, choose Configure > Network Analysis Module > Basics > Monitored Servers. The NAM WAAS Servers Monitoring window appears. See Figure 5-3.
Figure 5-3 WAAS Servers Monitoring Window
Step 2 Choose the IP address of one or more servers to monitor.
5-5Cisco Wide Area Application Services Monitoring Guide
OL-26583-01
Chapter 5 Monitoring WAAS Using Cisco Network Analysis ModuleConfiguring NAM Monitoring of WAAS Devices
Step 3 Click Add. The Add WAAS Servers(s) window appears.
Step 4 Click Submit to add the server IP address(es).
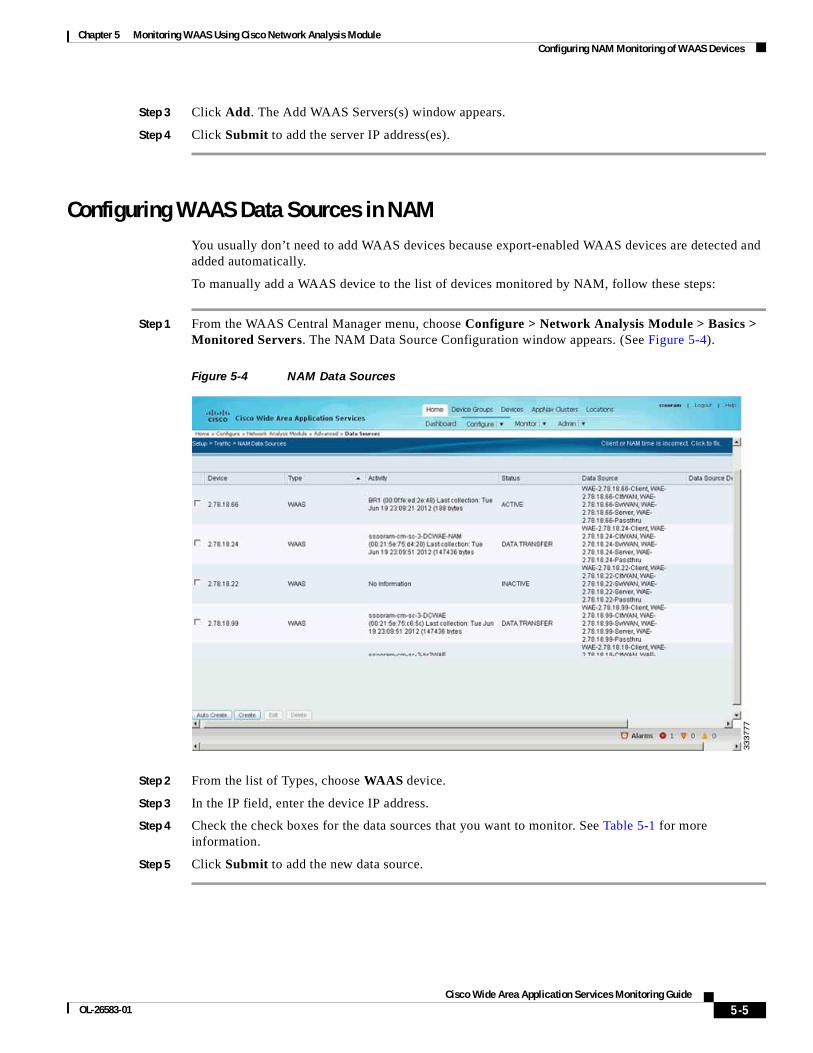
Configuring WAAS Data Sources in NAMYou usually don’t need to add WAAS devices because export-enabled WAAS devices are detected and added automatically.
To manually add a WAAS device to the list of devices monitored by NAM, follow these steps:
Step 1 From the WAAS Central Manager menu, choose Configure > Network Analysis Module > Basics > Monitored Servers. The NAM Data Source Configuration window appears. (See Figure 5-4).
Figure 5-4 NAM Data Sources
Step 2 From the list of Types, choose WAAS device.
Step 3 In the IP field, enter the device IP address.
Step 4 Check the check boxes for the data sources that you want to monitor. See Table 5-1 for more information.
Step 5 Click Submit to add the new data source.
5-6Cisco Wide Area Application Services Monitoring Guide
OL-26583-01
Chapter 5 Monitoring WAAS Using Cisco Network Analysis ModuleNAM Deployment Scenarios
For additional information about configuring and using NAM, see the User Guide for Cisco Network Analysis Module Traffic Analyzer.
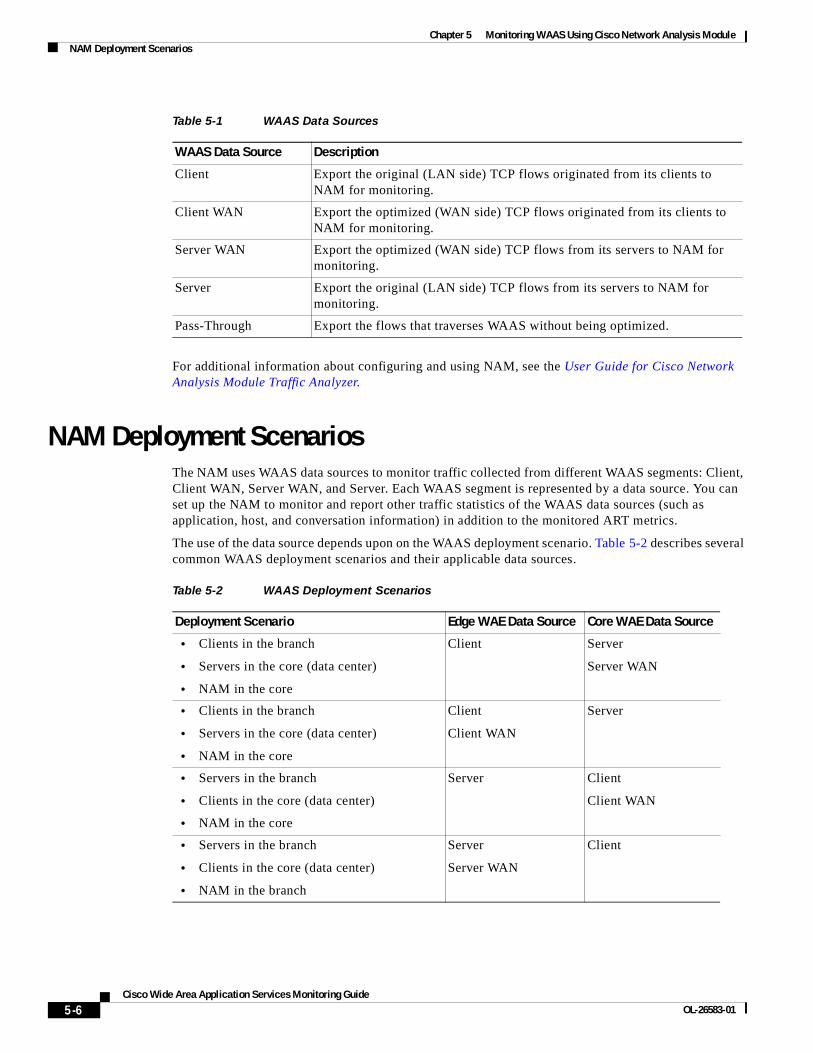
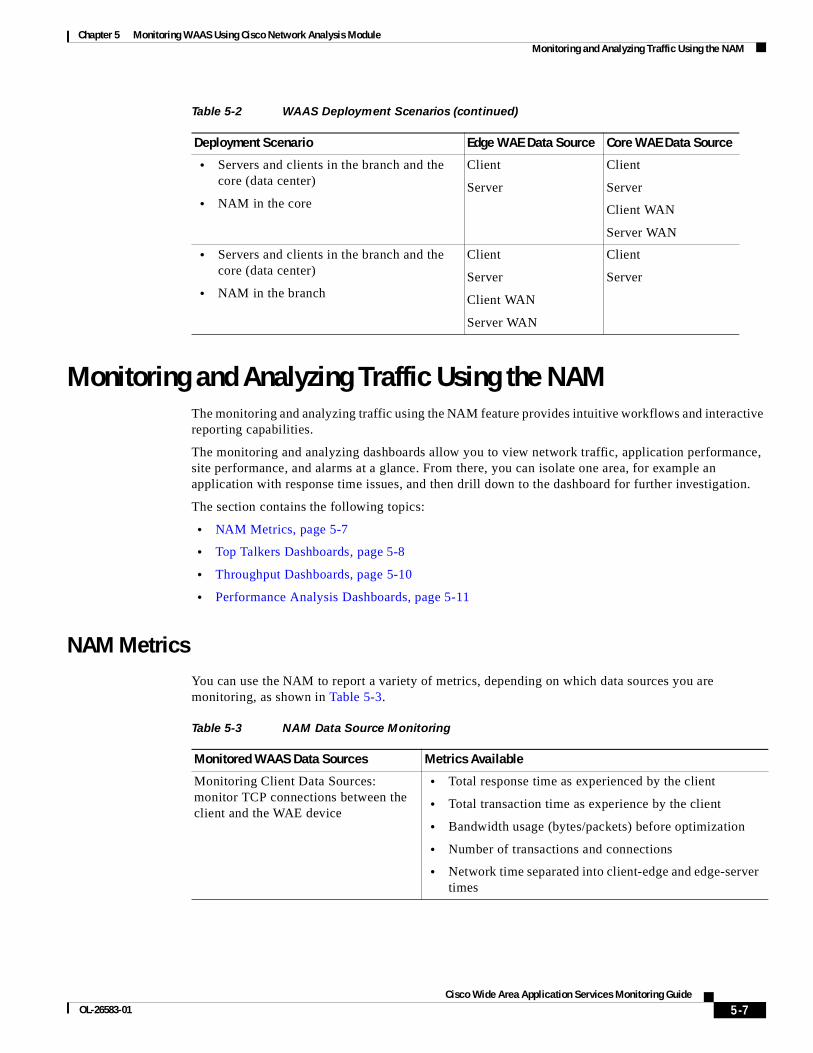
NAM Deployment ScenariosThe NAM uses WAAS data sources to monitor traffic collected from different WAAS segments: Client, Client WAN, Server WAN, and Server. Each WAAS segment is represented by a data source. You can set up the NAM to monitor and report other traffic statistics of the WAAS data sources (such as application, host, and conversation information) in addition to the monitored ART metrics.
The use of the data source depends upon on the WAAS deployment scenario. Table 5-2 describes several common WAAS deployment scenarios and their applicable data sources.
Table 5-1 WAAS Data Sources
WAAS Data Source Description
Client Export the original (LAN side) TCP flows originated from its clients to NAM for monitoring.
Client WAN Export the optimized (WAN side) TCP flows originated from its clients to NAM for monitoring.
Server WAN Export the optimized (WAN side) TCP flows from its servers to NAM for monitoring.
Server Export the original (LAN side) TCP flows from its servers to NAM for monitoring.
Pass-Through Export the flows that traverses WAAS without being optimized.
Table 5-2 WAAS Deployment Scenarios
Deployment Scenario Edge WAE Data Source Core WAE Data Source
• Clients in the branch
• Servers in the core (data center)
• NAM in the core
Client Server
Server WAN
• Clients in the branch
• Servers in the core (data center)
• NAM in the core
Client
Client WAN
Server
• Servers in the branch
• Clients in the core (data center)
• NAM in the core
Server Client
Client WAN
• Servers in the branch
• Clients in the core (data center)
• NAM in the branch
Server
Server WAN
Client
5-7Cisco Wide Area Application Services Monitoring Guide
OL-26583-01
Chapter 5 Monitoring WAAS Using Cisco Network Analysis ModuleMonitoring and Analyzing Traffic Using the NAM
Monitoring and Analyzing Traffic Using the NAMThe monitoring and analyzing traffic using the NAM feature provides intuitive workflows and interactive reporting capabilities.
The monitoring and analyzing dashboards allow you to view network traffic, application performance, site performance, and alarms at a glance. From there, you can isolate one area, for example an application with response time issues, and then drill down to the dashboard for further investigation.
The section contains the following topics:
• NAM Metrics, page 5-7
• Top Talkers Dashboards, page 5-8
• Throughput Dashboards, page 5-10
• Performance Analysis Dashboards, page 5-11
NAM MetricsYou can use the NAM to report a variety of metrics, depending on which data sources you are monitoring, as shown in Table 5-3.
• Servers and clients in the branch and the core (data center)
• NAM in the core
Client
Server
Client
Server
Client WAN
Server WAN
• Servers and clients in the branch and the core (data center)
• NAM in the branch
Client
Server
Client WAN
Server WAN
Client
Server
Table 5-2 WAAS Deployment Scenarios (continued)
Deployment Scenario Edge WAE Data Source Core WAE Data Source
Table 5-3 NAM Data Source Monitoring
Monitored WAAS Data Sources Metrics Available
Monitoring Client Data Sources: monitor TCP connections between the client and the WAE device
• Total response time as experienced by the client
• Total transaction time as experience by the client
• Bandwidth usage (bytes/packets) before optimization
• Number of transactions and connections
• Network time separated into client-edge and edge-server times
5-8Cisco Wide Area Application Services Monitoring Guide
OL-26583-01
Chapter 5 Monitoring WAAS Using Cisco Network Analysis ModuleMonitoring and Analyzing Traffic Using the NAM
You can also configure data sources from the core WAE. You can add the Server, Server-WAN, and Passthrough data sources to monitor application performance analytics as observed from the server LAN, WAN, and the client LAN.
Top Talkers DashboardsThis section includes the following topics:
• Traffic Summary, page 5-8
• Top Talkers Details, page 5-10
Traffic Summary
The Top Talkers Summary dashboard allows you to view the Top N Applications, Top N Application Groups, Top N Hosts (In and Out), IP Distribution by Bytes, Top N DSCP, and Top N VLAN that is being monitored on your network. It provides auto-monitoring of traffic from all WAAS devices. You can view the Traffic Summary Dashboard by going to Monitor > Network Analysis Module > Overview. (See Figure 5-5).
Monitoring WAN Data Sources: Monitor the TCP connections between edge and core WAE devices
• Bandwidth usage (bytes/packets) after optimization
• Network time of the WAN segment
Monitoring Server Data Sources: Monitor TCP connections between core WAE devices and the servers
• Server response time (without proxy acceleration or caching server)
• Network time between the core WAE device and the servers
Table 5-3 NAM Data Source Monitoring (continued)
Monitored WAAS Data Sources Metrics Available
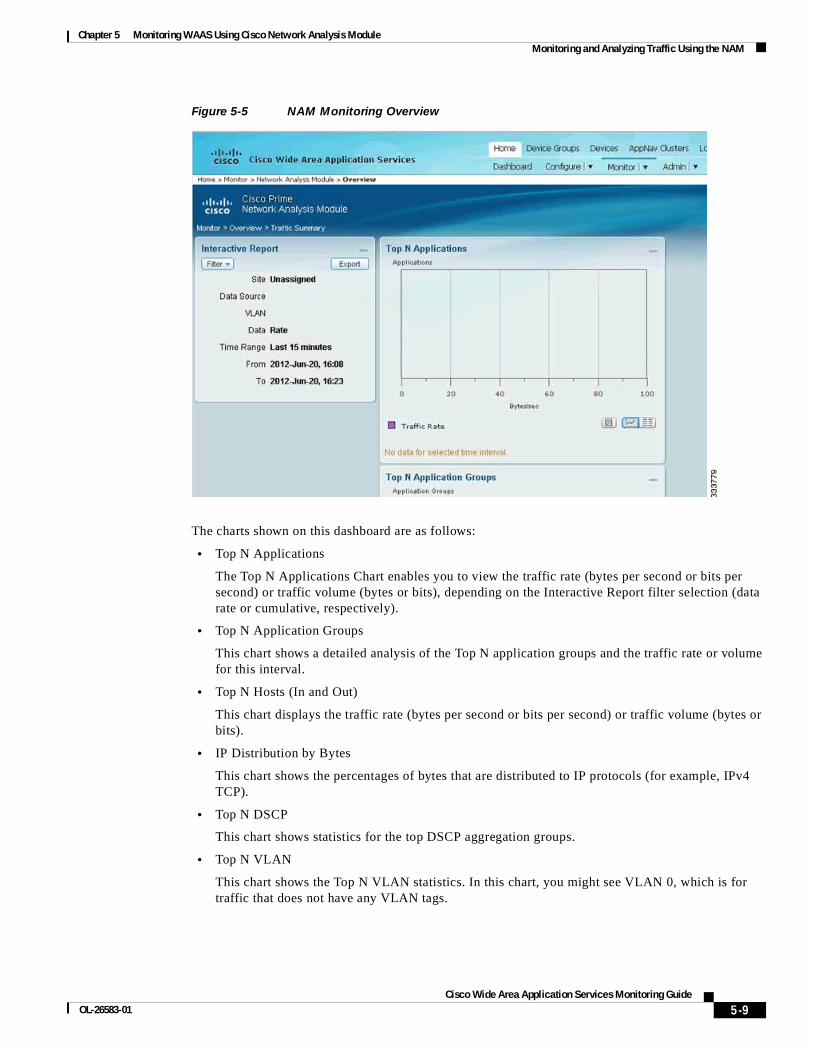
5-9Cisco Wide Area Application Services Monitoring Guide
OL-26583-01
Chapter 5 Monitoring WAAS Using Cisco Network Analysis ModuleMonitoring and Analyzing Traffic Using the NAM
Figure 5-5 NAM Monitoring Overview
The charts shown on this dashboard are as follows:
• Top N Applications
The Top N Applications Chart enables you to view the traffic rate (bytes per second or bits per second) or traffic volume (bytes or bits), depending on the Interactive Report filter selection (data rate or cumulative, respectively).
• Top N Application Groups
This chart shows a detailed analysis of the Top N application groups and the traffic rate or volume for this interval.
• Top N Hosts (In and Out)
This chart displays the traffic rate (bytes per second or bits per second) or traffic volume (bytes or bits).
• IP Distribution by Bytes
This chart shows the percentages of bytes that are distributed to IP protocols (for example, IPv4 TCP).
• Top N DSCP
This chart shows statistics for the top DSCP aggregation groups.
• Top N VLAN
This chart shows the Top N VLAN statistics. In this chart, you might see VLAN 0, which is for traffic that does not have any VLAN tags.
5-10Cisco Wide Area Application Services Monitoring Guide
OL-26583-01
Chapter 5 Monitoring WAAS Using Cisco Network Analysis ModuleMonitoring and Analyzing Traffic Using the NAM
Top Talkers Details
While you are in the process of deploying WAAS devices, you can get data to assist in the WAAS planning and configuration.
When you go to Monitor > Network Analysis Module > Top Talkers Details, you will see the window that assists you in the predeployment process. Use the Interactive Report window to select the traffic you want to analyze for optimization. The window displays the Top Applications, Top Network Links, Top Clients, and Top Servers.
Based on the results, you can then configure the WAAS products to optimize your network.
Throughput DashboardsThis section includes the following topics:
• Network, page 5-10
• Top Applications, page 5-10
• Application, page 5-11
Network
The Network dashboard enables you to view LAN versus WAN throughput for WAAS users both in the incoming and outgoing directions. To view these reports, configure interface groups that comprise WAN and LAN interfaces. The displayed information represents the total data collected since the collection was created or since the NAM was restarted. To view the Network dashboard, go to Monitor > Network Analysis Module > Throughput > Network.
Choose an interface group view from the Interface Selector on the left side of the window to see traffic in the charts. Click the arrow icon to the left of the NDE data source name to display all interfaces groups, and then select an interface group view. If the charts show no data, and you see the message “Interface needs to be selected,” you have not yet chosen an interface group view.
After you choose the interface group view, you see the following charts populated:
• Interface Traffic (Ingress % Utilization and Egress % Utilization)
• Top N Applications—Ingress
• Top N Applications—Egress
• Top N Hosts—Ingress
• Top N Hosts—Egress
• Top N DSCP Aggr—Ingress
• Top N DSCP Aggr—Egress
You can enter the interface speed manually through the Interface capacity table, or the speed can be automatically configured if the SNMP settings for the NDE device are entered in the data source table.
Top Applications
In the Top Applications dashboard, you can view the top applications by the traffic rate over a selected time and for the specified site and/or data source.
5-11Cisco Wide Area Application Services Monitoring Guide
OL-26583-01
Chapter 5 Monitoring WAAS Using Cisco Network Analysis ModuleMonitoring and Analyzing Traffic Using the NAM
Applications Over Time shows you all of the applications that have been running for the time period interval. The color-coded legend shows you what the applications are running.
Application
In the Application Analysis window, you can see the traffic level for a given application over a selected period of time. It is available under the Monitor > Network Analysis Module > Throughput > Application. This window shows you the following:
• A graph of application traffic over time.
• Top hosts that transmit and receive traffc on that application for the selected time period.
• Application Configuration that shows the criteria by which the NAM classifies packets as that application. This criteria is typically a list of TCP and/or UDP ports that identify the application. Some applications are identified by heuristic or other state-based algorithms.
Hosts Detail
On the “Top N Hosts - Traffic In” or “Top N Hosts - Traffic Out” chart, you can choose Hosts Detail to see the All Hosts window and the detailed information about all hosts. The All Hosts window displays the following information:
• Hos—Host address
• Application—Application type
• In Bytes/sec—Number of bytes per second incoming
• In Packets/sec—Number of packets per second incoming
• Out Bytes/sec—Number of bytes per second outgoing
• Out Packets/sec—Number of packets per second outgoing
Performance Analysis DashboardsThis section includes the following topics:
• Application, page 5-11
• Conversation Multisegments, page 5-12
Application
The Application dashboard provides the transaction time performance for an application as well as the original and optimized traffic volume reported by the flow agent. Information about how the transaction time is broken up across client, WAN, and server segments is also provided. For example, if the transaction time is dominated by the server segment time (due to a slow server), WAAS may not be able to improve the performance as much as when it is dominated by the WAN network time. To view the Application performance analysis dashboard, go to Monitor > Network Analysis Module > Performance Analysis > Application.
The charts available on this dashboard are as follows:
• Transaction Time (Client Experience)
• Traffic Volume and Compression Ratio
5-12Cisco Wide Area Application Services Monitoring Guide
OL-26583-01
Chapter 5 Monitoring WAAS Using Cisco Network Analysis ModuleMonitoring and Analyzing Traffic Using the NAM
• Average Concurrent Connections (Optimized vs. Passthru)
• Multi-Segment Network Time (Client LAN - WAN - Server LAN)
Conversation Multisegments
The Conversation Multiple Segments dashboard correlates data from different data sources and allows you to view and compare response time metrics from multiple WAAS segments (data sources). To view the Conversation Multiple Segments dashboard, go to Monitor > Network Analysis Module > Performance Analysis > Conversation Multisegments.
The Response Time Across Multiple Segments window shows the response time metrics of the selected server or client-server pair from applicable data sources.