Embed Size (px)
Citation preview

CISCO SYSTEMS, INC.
FORM 10-Q(Quarterly Report)
Filed 05/21/13 for the Period Ending 04/27/13
Address 170 WEST TASMAN DR
SAN JOSE, CA 95134-1706Telephone 4085264000
CIK 0000858877Symbol CSCO
SIC Code 3576 - Computer Communications EquipmentIndustry Communications Equipment
Sector TechnologyFiscal Year 07/28
http://www.edgar-online.com© Copyright 2013, EDGAR Online, Inc. All Rights Reserved.
Distribution and use of this document restricted under EDGAR Online, Inc. Terms of Use.
UNITED STATES SECURITIES AND EXCHANGE COMMISSION
WASHINGTON, D.C. 20549
FORM 10-Q (Mark one)
For the quarterly period ended April 27, 2013
OR
For the transition period from to
Commission file number 0-18225
CISCO SYSTEMS, INC. (Exact name of Registrant as specified in its charter)
170 West Tasman Drive San Jose, California 95134
(Address of principal executive office and zip code)
(408) 526-4000 (Registrant’s telephone number, including area code)
Indicate by check mark whether the registrant (1) has filed all reports required to be filed by Section 13 or 15(d) of the Securities Exchange Act of 1934 during the preceding 12 months (or for such shorter period that the registrant was required to file such reports), and (2) has been subject to such filing requirements for the past 90 days. YES NO �
Indicate by check mark whether the registrant has submitted electronically and posted on its corporate Web site, if any, every Interactive Data File required to be submitted and posted pursuant to Rule 405 of Regulation S-T (§232.405 of this chapter) during the preceding 12 months (or for such shorter period that the registrant was required to submit and post such files). YES NO �
Indicate by check mark whether the registrant is a large accelerated filer, an accelerated filer, a non-accelerated filer, or a smaller reporting company. See the definitions of “large accelerated filer,” “accelerated filer” and “smaller reporting company” in Rule 12b-2 of the Exchange Act.
Indicate by check mark whether the registrant is a shell company (as defined in Rule 12b-2 of the Exchange Act). YES � NO
Number of shares of the registrant’s common stock outstanding as of May 16, 2013 : 5,344,336,014
QUARTERLY REPORT PURSUANT TO SECTION 13 OR 15(d) OF THE SECURITIES EXCHANGE ACT OF 1934
� TRANSITION REPORT PURSUANT TO SECTION 13 OR 15(d) OF THE SECURITIES EXCHANGE ACT OF 1934
California 77-0059951 (State or other jurisdiction of
incorporation or organization) (I.R.S. Employer
Identification Number)
Large accelerated filer Accelerated filer � Non-accelerated filer � Smaller reporting company �
(Do not check if a smaller reporting company)

Cisco Systems, Inc. FORM 10-Q for the Quarter Ended April 27, 2013
INDEX
2
Page
Part I. Financial Information 3
Item 1. Financial Statements (Unaudited) 3
Consolidated Balance Sheets at April 27, 2013 and July 28, 2012 3
Consolidated Statements of Operations for the Three and Nine Months Ended April 27, 2013 and April 28, 2012 4
Consolidated Statements of Comprehensive Income for the Three and Nine Months Ended April 27, 2013 and April 28, 2012 5
Consolidated Statements of Cash Flows for the Nine Months Ended April 27, 2013 and April 28, 2012 6
Consolidated Statements of Equity for the Nine Months Ended April 27, 2013 and April 28, 2012 7
Notes to Consolidated Financial Statements 8
Item 2. Management's Discussion and Analysis of Financial Condition and Results of Operations 42
Item 3. Quantitative and Qualitative Disclosures About Market Risk 71
Item 4. Controls and Procedures 73
Part II. Other Information 74
Item 1. Legal Proceedings 74
Item 1A. Risk Factors 76
Item 2. Unregistered Sales of Equity Securities and Use of Proceeds 91
Item 3. Defaults Upon Senior Securities 92
Item 4. Mine Safety Disclosures 92
Item 5. Other Information 92
Item 6. Exhibits 92
Signature 93

CISCO SYSTEMS, INC. CONSOLIDATED BALANCE SHEETS
(in millions, except par value) (Unaudited)
See Notes to Consolidated Financial Statements.
PART 1. FINANCIAL INFORMATION
Item 1. Financial Statements (Unaudited)
April 27,
2013 July 28,
2012
ASSETS
Current assets:
Cash and cash equivalents $ 5,122 $ 9,799 Investments 42,266 38,917 Accounts receivable, net of allowance for doubtful accounts of $225 at April 27, 2013 and $207 at July 28, 2012 4,942 4,369 Inventories 1,469 1,663 Financing receivables, net 3,878 3,661 Deferred tax assets 2,377 2,294 Other current assets 1,363 1,230
Total current assets 61,417 61,933 Property and equipment, net 3,330 3,402 Financing receivables, net 3,838 3,585 Goodwill 21,640 16,998 Purchased intangible assets, net 3,408 1,959 Other assets 3,451 3,882
TOTAL ASSETS $ 97,084 $ 91,759
LIABILITIES AND EQUITY
Current liabilities:
Short-term debt $ 3,292 $ 31 Accounts payable 957 859 Income taxes payable — 276 Accrued compensation 3,010 2,928 Deferred revenue 9,055 8,852 Other current liabilities 4,749 4,785
Total current liabilities 21,063 17,731 Long-term debt 12,956 16,297 Income taxes payable 1,503 1,844 Deferred revenue 3,630 4,028 Other long-term liabilities 1,134 558
Total liabilities 40,286 40,458 Commitments and contingencies (Note 12)
Equity:
Cisco shareholders’ equity:
Preferred stock, no par value: 5 shares authorized; none issued and outstanding — — Common stock and additional paid-in capital, $0.001 par value: 20,000 shares authorized; 5,315 and 5,298 shares issued and outstanding at April 27, 2013 and July 28, 2012, respectively 40,431 39,271 Retained earnings 15,668 11,354 Accumulated other comprehensive income 689 661
Total Cisco shareholders’ equity 56,788 51,286 Noncontrolling interests 10 15
Total equity 56,798 51,301
TOTAL LIABILITIES AND EQUITY $ 97,084 $ 91,759

3

CISCO SYSTEMS, INC.
CONSOLIDATED STATEMENTS OF OPERATIONS (in millions, except per-share amounts)
(Unaudited)
See Notes to Consolidated Financial Statements.
4
Three Months Ended Nine Months Ended
April 27,
2013 April 28,
2012 April 27,
2013 April 28,
2012
NET SALES:
Product $ 9,559 $ 9,106 $ 28,293 $ 27,176 Service 2,657 2,482 7,897 7,195
Total net sales 12,216 11,588 36,190 34,371 COST OF SALES:
Product 3,782 3,563 11,387 10,776 Service 923 856 2,710 2,471
Total cost of sales 4,705 4,419 14,097 13,247 GROSS MARGIN 7,511 7,169 22,093 21,124 OPERATING EXPENSES:
Research and development 1,542 1,358 4,425 4,072 Sales and marketing 2,375 2,383 7,178 7,230 General and administrative 530 562 1,674 1,611 Amortization of purchased intangible assets 89 96 329 292 Restructuring and other charges 33 20 105 225
Total operating expenses 4,569 4,419 13,711 13,430 OPERATING INCOME 2,942 2,750 8,382 7,694
Interest income 162 161 483 483 Interest expense (145 ) (151 ) (440 ) (449 )
Other income (loss), net (14 ) 19 (69 ) 45 Interest and other income (loss), net 3 29 (26 ) 79
INCOME BEFORE PROVISION FOR INCOME TAXES 2,945 2,779 8,356 7,773 Provision for income taxes 467 614 643 1,649
NET INCOME $ 2,478 $ 2,165 $ 7,713 $ 6,124
Net income per share:
Basic $ 0.47 $ 0.40 $ 1.45 $ 1.14
Diluted $ 0.46 $ 0.40 $ 1.44 $ 1.13
Shares used in per-share calculation:
Basic 5,329 5,388 5,316 5,383
Diluted 5,387 5,456 5,361 5,418
Cash dividends declared per common share $ 0.17 $ 0.08 $ 0.45 $ 0.20

CISCO SYSTEMS, INC. CONSOLIDATED STATEMENTS OF COMPREHENSIVE INCOME
(in millions) (Unaudited)
See Notes to Consolidated Financial Statements.
5
Three Months Ended Nine Months Ended
April 27,
2013 April 28,
2012 April 27,
2013 April 28,
2012
Net income $ 2,478 $ 2,165 $ 7,713 $ 6,124 Available-for-sale investments:
Change in net unrealized gains, net of tax benefit (expense) of $38 and $(7) for the three and nine months ended April 27, 2013, respectively, and $(67) and $(39) for the corresponding periods of fiscal 2012, respectively (63 ) 98 10 55 Net gains reclassified into earnings, net of tax effects of $2 and $16 for the three and nine months ended April 27, 2013, respectively, and $11 and $27 for the corresponding periods of fiscal 2012, respectively (4 ) (18 ) (30 ) (48 )
(67 ) 80 (20 ) 7 Cash flow hedging instruments:
Change in unrealized gains and losses, net of tax benefit (expense) of $1 and $(1) for the three and nine months ended April 27, 2013, and $0 for both corresponding periods of fiscal 2012 (10 ) 11 58 (83 )
Net (gains) losses reclassified into earnings (4 ) 18 (7 ) 44 (14 ) 29 51 (39 )
Net change in cumulative translation adjustment and other, net of tax benefit (expense) of $1 and $(14) for the three and nine months ended April 27, 2013, respectively, and $0 and $31 for the corresponding periods of fiscal 2012, respectively (128 ) 21 (8 ) (296 )
Other comprehensive income (loss) (209 ) 130 23 (328 )
Comprehensive income 2,269 2,295 7,736 5,796 Comprehensive (income) loss attributable to noncontrolling interests — (2 ) 5 12
Comprehensive income attributable to Cisco Systems, Inc. $ 2,269 $ 2,293 $ 7,741 $ 5,808

CISCO SYSTEMS, INC.
CONSOLIDATED STATEMENTS OF CASH FLOWS (in millions) (Unaudited)
Nine Months Ended
April 27,
2013 April 28,
2012
Cash flows from operating activities:
Net income $ 7,713 $ 6,124 Adjustments to reconcile net income to net cash provided by operating activities:
Depreciation, amortization, and other 1,760 1,816 Share-based compensation expense 880 1,032 Provision for receivables 46 45 Deferred income taxes 48 75 Excess tax benefits from share-based compensation (48 ) (57 )
Net losses (gains) on investments 23 (38 )
Change in operating assets and liabilities, net of effects of acquisitions and divestitures:
Accounts receivable (439 ) 660 Inventories 238 (113 )
Financing receivables (448 ) (762 )
Other assets (41 ) (495 )
Accounts payable 91 34 Income taxes, net (642 ) 151 Accrued compensation (48 ) (451 )
Deferred revenue (169 ) 482 Other liabilities (56 ) (100 )
Net cash provided by operating activities 8,908 8,403
Cash flows from investing activities:
Purchases of investments (23,969 ) (32,690 )
Proceeds from sales of investments 7,279 19,591 Proceeds from maturities of investments 13,234 7,930 Acquisition of property and equipment (843 ) (830 )
Acquisition of businesses, net of cash and cash equivalents acquired (6,371 ) (333 )
Purchases of investments in privately held companies (140 ) (299 )
Return of investments in privately held companies 110 212 Other 47 175
Net cash used in investing activities (10,653 ) (6,244 )
Cash flows from financing activities:
Issuances of common stock 1,193 1,115 Repurchases of common stock - repurchase program (1,554 ) (2,708 )
Shares repurchased for tax withholdings on vesting of restricted stock units (249 ) (160 )
Short-term borrowings, maturities less than 90 days, net (20 ) (505 )
Excess tax benefits from share-based compensation 48 57 Dividends paid (2,392 ) (1,076 )
Other 42 (83 )
Net cash used in financing activities (2,932 ) (3,360 )
Net decrease in cash and cash equivalents (4,677 ) (1,201 )
Cash and cash equivalents, beginning of period 9,799 7,662
Cash and cash equivalents, end of period $ 5,122 $ 6,461
Cash paid for:

See Notes to Consolidated Financial Statements.
6
Interest $ 562 $ 561 Income taxes, net $ 1,236 $ 1,424

CISCO SYSTEMS, INC.
CONSOLIDATED STATEMENTS OF EQUITY (in millions, except per-share amounts)
(Unaudited)
In September 2001, the Company’s Board of Directors authorized a stock repurchase program. As of April 27, 2013 , the Company’s Board of Directors had authorized an aggregate repurchase of up to $82 billion of common stock under this program with no termination date. For additional information regarding stock repurchases, see Note 13 to the Consolidated Financial Statements. The stock repurchases since the inception of this program and the related impacts on Cisco shareholders’ equity are summarized in the following table (in millions):
See Notes to Consolidated Financial Statements.
7
Nine Months Ended April 27, 2013
Shares of Common
Stock
Common Stock and Additional Paid-In Capital
Retained Earnings
Accumulated Other
Comprehensive Income
Total Cisco Shareholders’
Equity
Non-controlling Interests Total Equity
BALANCE AT JULY 28, 2012 5,298 $ 39,271 $ 11,354 $ 661 $ 51,286 $ 15 $ 51,301 Net income 7,713 7,713 7,713 Other comprehensive income (loss) 28 28 (5 ) 23 Issuance of common stock 111 1,193 1,193 1,193 Repurchase of common stock - repurchase program (81 ) (606 ) (1,007 ) (1,613 ) (1,613 )
Shares repurchased for tax withholdings on vesting of restricted stock units (13 ) (249 ) (249 ) (249 )
Cash dividends declared ($0.45 per common share) (2,392 ) (2,392 ) (2,392 )
Tax effects from employee stock incentive plans (120 ) (120 ) (120 )
Share-based compensation expense 880 880 880 Purchase acquisitions and other 62 62 62 BALANCE AT APRIL 27, 2013 5,315 $ 40,431 $ 15,668 $ 689 $ 56,788 $ 10 $ 56,798
Nine Months Ended April 28, 2012
Shares of Common
Stock
Common Stock and Additional Paid-In Capital
Retained Earnings
Accumulated Other
Comprehensive Income
Total Cisco Shareholders’
Equity
Non-controlling Interests Total Equity
BALANCE AT JULY 30, 2011 5,435 $ 38,648 $ 7,284 $ 1,294 $ 47,226 $ 33 $ 47,259 Net income 6,124 6,124 6,124 Other comprehensive loss (316 ) (316 ) (12 ) (328 )
Issuance of common stock 110 1,115 1,115 1,115 Repurchase of common stock - repurchase program (152 ) (1,097 ) (1,463 ) (2,560 ) (2,560 )
Shares repurchased for tax withholdings on vesting of restricted stock units (10 ) (160 ) (160 ) (160 )
Cash dividends declared ($0.20 per common share) (1,076 ) (1,076 ) (1,076 )
Tax effects from employee stock incentive plans (36 ) (36 ) (36 )
Share-based compensation expense 1,032 1,032 1,032 Purchase acquisitions and other 8 8 8 BALANCE AT APRIL 28, 2012 5,383 $ 39,510 $ 10,869 $ 978 $ 51,357 $ 21 $ 51,378
Shares of Common Stock
Common Stock and Additional Paid-
In Capital Retained Earnings Total Cisco
Shareholders’ Equity
Repurchases of common stock under the repurchase program 3,821 $ 17,647 $ 60,099 $ 77,746

CISCO SYSTEMS, INC.
NOTES TO CONSOLIDATED FINANCIAL STATEMENTS (Unaudited)
The fiscal year for Cisco Systems, Inc. (the “Company” or “Cisco”) is the 52 or 53 weeks ending on the last Saturday in July. Fiscal 2013 and fiscal 2012 are each 52-week fiscal years. The Consolidated Financial Statements include the accounts of Cisco and its subsidiaries. All significant intercompany accounts and transactions have been eliminated. The Company conducts business globally and is primarily managed on a geographic basis in the following three geographic segments: the Americas; Europe, Middle East, and Africa (“EMEA”); and Asia Pacific, Japan, and China (“APJC”).
The accompanying financial data as of April 27, 2013 and for the three and nine months ended April 27, 2013 and April 28, 2012 has been prepared by the Company, without audit, pursuant to the rules and regulations of the Securities and Exchange Commission (“SEC”). Certain information and footnote disclosures normally included in financial statements prepared in accordance with generally accepted accounting principles in the United States (“GAAP”) have been condensed or omitted pursuant to such rules and regulations. The July 28, 2012 Consolidated Balance Sheet was derived from audited financial statements, but does not include all disclosures required by accounting principles generally accepted in the United States. However, the Company believes that the disclosures are adequate to make the information presented not misleading. These Consolidated Financial Statements should be read in conjunction with the Consolidated Financial Statements and the notes thereto included in the Company's Annual Report on Form 10-K for the fiscal year ended July 28, 2012.
The Company consolidates its investment in a venture fund managed by SOFTBANK Corp. and its affiliates (“SOFTBANK”) and Insieme Networks, Inc. (“Insieme”) as these are variable interest entities and the Company is the primary beneficiary. The noncontrolling interests attributed to SOFTBANK are presented as a separate component from the Company's equity in the equity section of the Consolidated Balance Sheets. SOFTBANK's share of the earnings in the venture fund and the loss attributable to the noncontrolling interests in Insieme are not presented separately in the Consolidated Statements of Operations as these amounts are not material for any of the fiscal periods presented.
In the opinion of management, all adjustments (which include normal recurring adjustments, except as disclosed herein) necessary to present fairly the statement of financial position as of April 27, 2013 ; the results of operations for the three and nine months ended April 27, 2013 and April 28, 2012 ; and the statements of cash flows and equity for the nine months ended April 27, 2013 and April 28, 2012 , as applicable, have been made. The results of operations for the three and nine months ended April 27, 2013 are not necessarily indicative of the operating results for the full fiscal year or any future periods.
Certain reclassifications have been made to prior period amounts in order to conform to the current period's presentation. The Company has evaluated subsequent events through the date that the financial statements were issued.
In June 2011, the Financial Accounting Standards Board (“FASB”) issued an accounting standard update to provide guidance on increasing the prominence of items reported in other comprehensive income, which eliminated the option to present components of other comprehensive income as part of the statement of equity. The Company adopted this accounting standard in the first quarter of fiscal 2013.
In August 2011, the FASB approved a revised accounting standard update intended to simplify how an entity tests goodwill for impairment. The amendment will allow an entity to first assess qualitative factors to determine whether it is necessary to perform the two-step quantitative goodwill impairment test. An entity no longer will be required to calculate the fair value of a reporting unit unless the entity determines, based on a qualitative assessment, that it is more likely than not that its fair value is less than its carrying amount. This accounting standard update became effective for the Company beginning in the first quarter of fiscal 2013, and its adoption did not have any impact on the Company's Consolidated Financial Statements.
In December 2011, the FASB issued an accounting standard update requiring enhanced disclosures about certain financial instruments and derivative instruments that are offset in the statement of financial position or that are subject to enforceable master netting arrangements or similar agreements. This accounting standard update will be effective for the Company beginning in the first quarter of fiscal 2014, at which time the Company will include the required disclosures.
8
1. Basis of Presentation
2. Recent Accounting Pronouncements
(a) New Accounting Updates Recently Adopted
(b) Recent Accounting Standards or Updates Not Yet Effective

CISCO SYSTEMS, INC.
NOTES TO CONSOLIDATED FINANCIAL STATEMENTS (Continu ed) (Unaudited)
In July 2012, the FASB issued an accounting standard update intended to simplify how an entity tests indefinite-lived intangible assets other than goodwill for impairment by providing entities with an option to perform a qualitative assessment to determine whether further impairment testing is necessary. This accounting standard update will be effective for the Company beginning in the first quarter of fiscal 2014, and early adoption is permitted. The adoption of this accounting standard update is not expected to have a material impact on the Company's Consolidated Financial Statements.
In February 2013, the FASB issued an accounting standard update to require reclassification adjustments from other comprehensive income to be presented either in the financial statements or in the notes to the financial statements. This accounting standard update will be effective for the Company beginning in the first quarter of fiscal 2014, at which time the Company will include the required disclosures.
In March 2013, the FASB issued an accounting standard update requiring an entity to release into net income the entire amount of a cumulative translation adjustment related to its investment in a foreign entity when as a parent it either sells a part or all of its investment in a foreign entity or no longer holds a controlling financial interest in a subsidiary or group of assets within a foreign entity. This accounting standard update will be effective for the Company beginning in the first quarter of fiscal 2015. The Company is currently evaluating the impact of this accounting standard update on its Consolidated Financial Statements.
On July 30, 2012, the Company completed its acquisition of NDS Group Limited (“NDS”), a leading provider of video software and content security solutions that enable service providers and media companies to securely deliver and monetize new video entertainment experiences. The acquisition of NDS is expected to complement and accelerate the delivery of Cisco Videoscape, the Company's comprehensive content delivery platform that enables service providers and media companies to deliver next-generation entertainment experiences. With the NDS acquisition, the Company aims to broaden its opportunities in the service provider market and to expand its reach into emerging markets such as China and India, where NDS has an established customer presence.
Under the terms of the acquisition agreement, the Company paid total cash consideration of approximately $5.0 billion, which included the repayment of $993 million of pre-existing NDS debt to third party creditors at the closing of the acquisition. The following table summarizes the purchase consideration for the NDS acquisition (in millions):
The payment of the total purchase consideration of approximately $5.0 billion shown above, net of cash and cash equivalents acquired, is classified as a use of cash under investing activities in the Consolidated Statements of Cash Flows.
The Company's purchase price allocation for NDS is preliminary and subject to revision as additional information about fair value of assets and liabilities becomes available. Additional information, which existed as of the acquisition date but at that time was unknown to the Company, may become known to the Company during the remainder of the measurement period, a period not to exceed 12 months from the acquisition date. Adjustments in the purchase price allocation may require a recasting of the amounts allocated to goodwill retroactive to the period in which the acquisition occurred.
A summary of the preliminary allocation of the total purchase consideration for NDS is presented as follows (in millions):
9
3. Business Combinations
(a) Acquisition Summary
Fair Value
Cash consideration to seller $ 4,012 Repayment of NDS debt to third party creditors 993
Total purchase consideration $ 5,005
Fair Value
Cash and cash equivalents $ 98 Accounts receivable, net 199 Other tangible assets 268 Goodwill 3,444 Purchased intangible assets 1,746 Deferred tax liabilities, net (378 )
Liabilities assumed (372 )
Total purchase consideration $ 5,005


CISCO SYSTEMS, INC.
NOTES TO CONSOLIDATED FINANCIAL STATEMENTS (Continu ed) (Unaudited)
The Company completed nine additional business combinations during the nine months ended April 27, 2013 . A summary of the allocation of the total purchase consideration is presented as follows (in millions):
The Company acquired privately held Meraki Inc. (“Meraki”) in the second quarter of fiscal 2013. Meraki offers mid-market customers on-premise networking solutions centrally managed from the cloud. With its acquisition of Meraki, the Company intends to address the shift to cloud networking as a key part of the Company's overall strategy to accelerate the adoption of software-based business models that provide new consumption options for customers and revenue opportunities for partners. The Company has included sales from the Meraki acquisition, subsequent to the acquisition date, in its Wireless product category.
The Company acquired privately held Intucell, Ltd. (“Intucell”) in the third quarter of fiscal 2013. Intucell provides advanced self-optimizing network software for mobile carriers. With its acquisition of Intucell, the Company intends to enhance its commitment to global service providers by adding a critical network intelligence layer to manage and optimize spectrum, coverage and capacity, and ultimately the quality of the mobile experience.
The total purchase consideration related to the Company's business combinations completed during the nine months ended April 27, 2013 consisted of cash consideration, repayment of debt, and vested share-based awards assumed. The total in cash and cash equivalents acquired from these business combinations was approximately $151 million .
Total transaction costs related to the Company's business combination activities were $23 million and $9 million for the nine months ended April 27, 2013 and April 28, 2012 , respectively. These transaction costs were expensed as incurred as general and administrative (“G&A”) expenses in the Consolidated Statements of Operations.
The goodwill generated from the Company's business combinations completed during the nine months ended April 27, 2013 is primarily related to expected synergies. The goodwill is generally not deductible for U.S. federal income tax purposes.
The Consolidated Financial Statements include the operating results of each business combination from the date of acquisition. Pro forma results of operations for the acquisitions completed during the nine months ended April 27, 2013 have not been presented because the effects of the acquisitions, individually and in the aggregate, were not material to the Company's financial results.
During the second quarter of fiscal 2013, the Company agreed to sell its Linksys product line to a third party. This transaction closed during the third quarter of fiscal 2013. The financial statement impact of the Company's Linksys product line and the resulting sale were not material for any of the periods presented.
The following table presents the goodwill allocated to the Company's reportable segments as of and during the nine months ended April 27, 2013 (in millions):
In the preceding table, the column entitled “Other” includes a goodwill reduction related to divestiture activity and purchase accounting adjustments.
10
Purchase
Consideration Net Liabilities
Assumed Purchased
Intangible Assets Goodwill
Meraki Inc. $ 974 $ (59 ) $ 289 $ 744 Intucell, Ltd 360 (23 ) 106 277 All others (seven in total) 246 (18 ) 88 176 Total other acquisitions $ 1,580 $ (100 ) $ 483 $ 1,197
(b) Other Acquisition/Divestiture Information
4. Goodwill and Purchased Intangible Assets
(a) Goodwill
Balance at
July 28, 2012 NDS Acquisition Other
Acquisitions Other Balance at
April 27, 2013
Americas $ 11,755 $ 1,230 $ 641 $ (8 ) $ 13,618 EMEA 3,287 1,327 353 5 4,972 APJC 1,956 887 203 4 3,050
Total $ 16,998 $ 3,444 $ 1,197 $ 1 $ 21,640
CISCO SYSTEMS, INC.
NOTES TO CONSOLIDATED FINANCIAL STATEMENTS (Continu ed) (Unaudited)
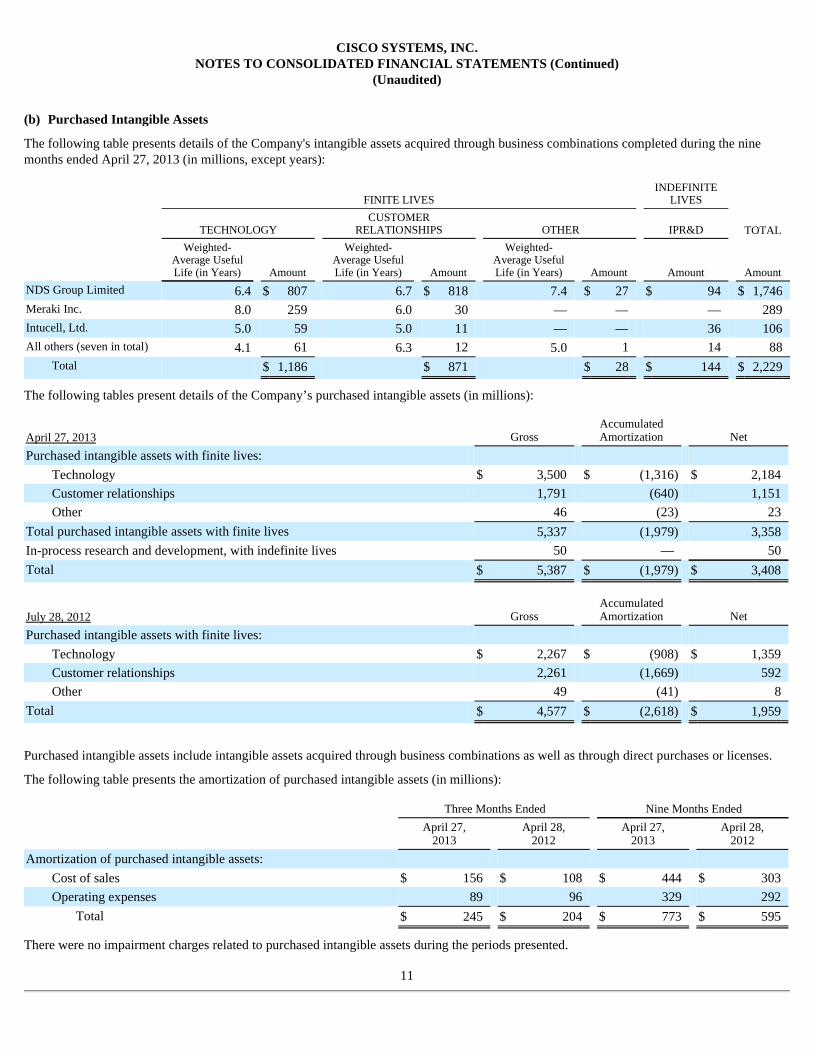
The following table presents details of the Company's intangible assets acquired through business combinations completed during the nine months ended April 27, 2013 (in millions, except years):
The following tables present details of the Company’s purchased intangible assets (in millions):
Purchased intangible assets include intangible assets acquired through business combinations as well as through direct purchases or licenses.
The following table presents the amortization of purchased intangible assets (in millions):
There were no impairment charges related to purchased intangible assets during the periods presented.
11
(b) Purchased Intangible Assets
FINITE LIVES INDEFINITE
LIVES
TOTAL TECHNOLOGY CUSTOMER
RELATIONSHIPS OTHER IPR&D
Weighted-Average Useful Life (in Years) Amount
Weighted-Average Useful Life (in Years) Amount
Weighted-Average Useful Life (in Years) Amount Amount Amount
NDS Group Limited 6.4 $ 807 6.7 $ 818 7.4 $ 27 $ 94 $ 1,746 Meraki Inc. 8.0 259 6.0 30 — — — 289 Intucell, Ltd. 5.0 59 5.0 11 — — 36 106 All others (seven in total) 4.1 61 6.3 12 5.0 1 14 88
Total $ 1,186 $ 871 $ 28 $ 144 $ 2,229
April 27, 2013 Gross Accumulated Amortization Net
Purchased intangible assets with finite lives:
Technology $ 3,500 $ (1,316 ) $ 2,184 Customer relationships 1,791 (640 ) 1,151 Other 46 (23 ) 23
Total purchased intangible assets with finite lives 5,337 (1,979 ) 3,358 In-process research and development, with indefinite lives 50 — 50 Total $ 5,387 $ (1,979 ) $ 3,408
July 28, 2012 Gross Accumulated Amortization Net
Purchased intangible assets with finite lives:
Technology $ 2,267 $ (908 ) $ 1,359 Customer relationships 2,261 (1,669 ) 592 Other 49 (41 ) 8
Total $ 4,577 $ (2,618 ) $ 1,959
Three Months Ended Nine Months Ended
April 27,
2013 April 28,
2012 April 27,
2013 April 28,
2012
Amortization of purchased intangible assets:
Cost of sales $ 156 $ 108 $ 444 $ 303 Operating expenses 89 96 329 292
Total $ 245 $ 204 $ 773 $ 595

CISCO SYSTEMS, INC.
NOTES TO CONSOLIDATED FINANCIAL STATEMENTS (Continu ed) (Unaudited)
The estimated future amortization expense of purchased intangible assets with finite lives as of April 27, 2013 is as follows (in millions):
In fiscal 2011, the Company initiated a number of key targeted actions to address several areas in its business model. These actions were intended to simplify and focus the Company's organization and operating model, align the Company's cost structure given transitions in the marketplace, divest or exit underperforming operations, and deliver value to the Company's shareholders. The Company initiated these actions to align its business based on its five foundational priorities: leadership in its core business (routing, switching, and associated services), which includes comprehensive security and mobility solutions; collaboration; data center virtualization and cloud; video; and architectures for business transformation.
Pursuant to the restructuring that the Company announced in July 2011, the Company has incurred cumulative charges of approximately $1.1 billion (included as part of the charges discussed below). The Company has substantially completed the July 2011 restructuring and does not expect significant remaining charges related to these actions. The following table summarizes the activities related to the restructuring and other charges pursuant to the Company's July 2011 announcement related to the realignment and restructuring of the Company's business as well as certain consumer product lines as announced during April 2011 (in millions):
12
Fiscal Year Amount
2013 (remaining three months) $ 232 2014 862 2015 780 2016 554 2017 399 Thereafter 531
Total $ 3,358
5. Restructuring and Other Charges
Voluntary Early Retirement Program
Employee Severance
Goodwill and Intangible
Assets Other Total
Gross charges in fiscal 2011 $ 453 $ 247 $ 71 $ 28 $ 799 Cash payments (436 ) (13 ) — — (449 )
Non-cash items — — (71 ) (17 ) (88 )
BALANCE AT JULY 30, 2011 $ 17 $ 234 $ — $ 11 $ 262 Gross charges in fiscal 2012 — 299 — 54 353 Change in estimate related to fiscal 2011 charges — (49 ) — — (49 )
Cash payments (17 ) (401 ) — (18 ) (436 )
Non-cash items — — — (20 ) (20 )
BALANCE AT JULY 28, 2012 $ — $ 83 $ — $ 27 $ 110 Charges in fiscal 2013 — 111 — (6 ) 105 Cash payments — (164 ) — (10 ) (174 )
Non-cash items — — — (3 ) (3 )
BALANCE AT APRIL 27, 2013 $ — $ 30 $ — $ 8 $ 38

CISCO SYSTEMS, INC.
NOTES TO CONSOLIDATED FINANCIAL STATEMENTS (Continu ed) (Unaudited)
The following tables provide details of selected balance sheet items (in millions):
13
6. Balance Sheet Details
April 27,
2013 July 28,
2012
Inventories:
Raw materials $ 81 $ 127 Work in process 38 35 Finished goods:
Distributor inventory and deferred cost of sales 679 630 Manufactured finished goods 378 597 Total finished goods 1,057 1,227
Service-related spares 253 213 Demonstration systems 40 61
Total $ 1,469 $ 1,663
Property and equipment, net:
Land, buildings, and building and leasehold improvements $ 4,437 $ 4,363 Computer equipment and related software 1,392 1,469 Production, engineering, and other equipment 5,655 5,364 Operating lease assets (1) 299 300 Furniture and fixtures 497 487
12,280 11,983 Less accumulated depreciation and amortization (1) (8,950 ) (8,581 )
Total $ 3,330 $ 3,402
(1) Accumulated depreciation related to operating lease assets was $185 and $181 as of April 27, 2013 and July 28, 2012, respectively.
Other assets:
Deferred tax assets $ 1,787 $ 2,270 Investments in privately held companies 835 858 Other 829 754
Total $ 3,451 $ 3,882
Deferred revenue:
Service $ 8,705 $ 9,173 Product:
Unrecognized revenue on product shipments and other deferred revenue 3,257 2,975 Cash receipts related to unrecognized revenue from two-tier distributors 723 732 Total product deferred revenue 3,980 3,707
Total $ 12,685 $ 12,880 Reported as:
Current $ 9,055 $ 8,852 Noncurrent 3,630 4,028
Total $ 12,685 $ 12,880


CISCO SYSTEMS, INC.
NOTES TO CONSOLIDATED FINANCIAL STATEMENTS (Continu ed) (Unaudited)
Financing receivables primarily consist of lease receivables, loan receivables, and financed service contracts and other. Lease receivables represent sales-type and direct-financing leases resulting from the sale of the Company's and complementary third-party products and are typically collateralized by a security interest in the underlying assets. Loan receivables represent financing arrangements related to the sale of the Company's products and services, which may include additional funding for other costs associated with network installation and integration of the Company's products and services. Lease receivables consist of arrangements with terms of four years on average, while loan receivables generally have terms of up to three years . The financed service contracts and other category includes financing receivables related to technical support and advanced services, as well as receivables related to financing of certain indirect costs associated with leases. Revenue related to the technical support services is typically deferred and included in deferred service revenue and is recognized ratably over the period during which the related services are to be performed, which typically ranges from one to three years .
A summary of the Company’s financing receivables is presented as follows (in millions):
As of April 27, 2013 and July 28, 2012, the deferred service revenue related to the financed service contracts and other was $1,825 million and $1,838 million , respectively.
Contractual maturities of the gross lease receivables at April 27, 2013 are summarized as follows (in millions):
Actual cash collections may differ from the contractual maturities due to early customer buyouts, refinancings, or defaults.
7. Financing Receivables and Guarantees
(a) Financing Receivables
April 27, 2013 Lease Receivables Loan Receivables Financed Service
Contracts and Other Total Financing
Receivables
Gross $ 3,764 $ 1,671 $ 2,924 $ 8,359 Unearned income (286 ) — — (286 )
Allowance for credit loss (245 ) (93 ) (19 ) (357 )
Total, net $ 3,233 $ 1,578 $ 2,905 $ 7,716 Reported as:
Current $ 1,400 $ 900 $ 1,578 $ 3,878 Noncurrent 1,833 678 1,327 3,838
Total, net $ 3,233 $ 1,578 $ 2,905 $ 7,716
July 28, 2012 Lease Receivables Loan Receivables Financed Service
Contracts and Other Total Financing
Receivables
Gross $ 3,429 $ 1,796 $ 2,651 $ 7,876 Unearned income (250 ) — — (250 )
Allowance for credit loss (247 ) (122 ) (11 ) (380 )
Total, net $ 2,932 $ 1,674 $ 2,640 $ 7,246 Reported as:
Current $ 1,200 $ 968 $ 1,493 $ 3,661 Noncurrent 1,732 706 1,147 3,585
Total, net $ 2,932 $ 1,674 $ 2,640 $ 7,246
Fiscal Year Amount
2013 (remaining three months) $ 516 2014 1,477 2015 957 2016 535 2017 234 Thereafter 45
Total $ 3,764

14

CISCO SYSTEMS, INC.
NOTES TO CONSOLIDATED FINANCIAL STATEMENTS (Continu ed) (Unaudited)
Financing receivables categorized by the Company's internal credit risk rating as of April 27, 2013 and July 28, 2012 are summarized as follows (in millions):
The Company determines the adequacy of its allowance for credit loss by assessing the risks and losses inherent in its financing receivables by portfolio segment. The portfolio segment is based on the types of financing offered by the Company to its customers: lease receivables, loan receivables, and financed service contracts and other.
The Company's internal credit risk ratings of 1 through 4 correspond to investment-grade ratings, while credit risk ratings of 5 and 6 correspond to non-investment grade ratings. Credit risk ratings of 7 and higher correspond to substandard ratings and constitute a relatively small portion of the Company's financing receivables.
In circumstances when collectibility is not deemed reasonably assured, the associated revenue is deferred in accordance with the Company's revenue recognition policies, and the related allowance for credit loss, if any, is included in deferred revenue. The Company also records deferred revenue associated with financing receivables when there are remaining performance obligations, as it does for financed service contracts. Total allowances for credit loss and deferred revenue as of April 27, 2013 and July 28, 2012 were $2,275 million and $2,387 million , respectively, and they were associated with financing receivables (net of unearned income) of $8,073 million and $7,626 million as of their respective period ends. The Company did not modify any financing receivables during the periods presented.
The following tables present the aging analysis of financing receivables as of April 27, 2013 and July 28, 2012 (in millions):
15
(b) Credit Quality of Financing Receivables
INTERNAL CREDIT RISK RATING
April 27, 2013 1 to 4 5 to 6 7 and Higher Total Residual
Value Gross Receivables,
Net of Unearned Income
Lease receivables $ 1,654 $ 1,476 $ 87 $ 3,217 $ 261 $ 3,478 Loan receivables 859 779 33 1,671 — 1,671 Financed service contracts and other 1,620 1,160 144 2,924 — 2,924 Total $ 4,133 $ 3,415 $ 264 $ 7,812 $ 261 $ 8,073
INTERNAL CREDIT RISK RATING
July 28, 2012 1 to 4 5 to 6 7 and Higher Total Residual
Value Gross Receivables,
Net of Unearned Income
Lease receivables $ 1,532 $ 1,342 $ 31 $ 2,905 $ 274 $ 3,179 Loan receivables 831 921 44 1,796 — 1,796 Financed service contracts and other 1,552 1,030 69 2,651 — 2,651 Total $ 3,915 $ 3,293 $ 144 $ 7,352 $ 274 $ 7,626
DAYS PAST DUE (INCLUDES BILLED
AND UNBILLED)
April 27, 2013 31-60 61-90 91+ Total
Past Due Current
Gross Receivables,
Net of Unearned Income
Non-Accrual Financing
Receivables
Impaired Financing
Receivables
Lease receivables $ 119 $ 45 $ 216 $ 380 $ 3,098 $ 3,478 $ 23 $ 17 Loan receivables 26 2 12 40 1,631 1,671 11 11 Financed service contracts and other 79 243 424 746 2,178 2,924 20 10 Total $ 224 $ 290 $ 652 $ 1,166 $ 6,907 $ 8,073 $ 54 $ 38

CISCO SYSTEMS, INC.
NOTES TO CONSOLIDATED FINANCIAL STATEMENTS (Continu ed) (Unaudited)
Past due financing receivables are those that are 31 days or more past due according to their contractual payment terms. The data in the preceding tables are presented by contract, and the aging classification of each contract is based on the oldest outstanding receivable, and therefore past due amounts also include unbilled and current receivables within the same contract. The balances of either unbilled or current financing receivables included in the category of 91 days plus past due for lease receivables, loan receivables, and financed service contracts and other were, respectively, $175 million , $6 million , and $334 million as of April 27, 2013 . The amounts were, respectively, $139 million , $3 million , and $313 million as of July 28, 2012.
As of April 27, 2013 , the Company had financing receivables of $110 million , net of unbilled or current receivables from the same contract, that were in the category for 91 days plus past due but remained on accrual status. Such balance was $109 million as of July 28, 2012. A financing receivable may be placed on nonaccrual status earlier if, in management's opinion, a timely collection of the full principal and interest becomes uncertain.
The allowances for credit loss and the related financing receivables are summarized as follows (in millions):
16
DAYS PAST DUE (INCLUDES BILLED
AND UNBILLED)
July 28, 2012 31-60 61-90 91+ Total
Past Due Current
Gross Receivables,
Net of Unearned Income
Non-Accrual Financing
Receivables
Impaired Financing
Receivables
Lease receivables $ 151 $ 69 $ 173 $ 393 $ 2,786 $ 3,179 $ 23 $ 14 Loan receivables 10 8 11 29 1,767 1,796 4 4 Financed service contracts and other 89 68 392 549 2,102 2,651 18 10 Total $ 250 $ 145 $ 576 $ 971 $ 6,655 $ 7,626 $ 45 $ 28
(c) Allowance for Credit Loss Rollforward
CREDIT LOSS ALLOWANCES
Three Months Ended April 27, 2013 Lease Receivables Loan Receivables Financed Service
Contracts and Other Total
Allowance for credit loss as of January 26, 2013 $ 247 $ 101 $ 13 $ 361 Provisions 30 8 6 44 Write-offs net of recoveries (29 ) (15 ) — (44 )
Foreign exchange and other (3 ) (1 ) — (4 )
Allowance for credit loss as of April 27, 2013 $ 245 $ 93 $ 19 $ 357 Gross receivables as of April 27, 2013, net of unearned income $ 3,478 $ 1,671 $ 2,924 $ 8,073
CREDIT LOSS ALLOWANCES
Nine Months Ended April 27, 2013 Lease Receivables Loan Receivables Financed Service
Contracts and Other Total
Allowance for credit loss as of July 28, 2012 $ 247 $ 122 $ 11 $ 380 Provisions 27 (15 ) 8 20 Write-offs net of recoveries (29 ) (15 ) — (44 )
Foreign exchange and other — 1 — 1 Allowance for credit loss as of April 27, 2013 $ 245 $ 93 $ 19 $ 357 Gross receivables as of April 27, 2013, net of unearned income $ 3,478 $ 1,671 $ 2,924 $ 8,073

CISCO SYSTEMS, INC.
NOTES TO CONSOLIDATED FINANCIAL STATEMENTS (Continu ed) (Unaudited)
The Company assesses the allowance for credit loss related to financing receivables on either an individual or a collective basis. The Company considers various factors in evaluating lease and loan receivables and the earned portion of financed service contracts for possible impairment on an individual basis. These factors include the Company's historical experience, credit quality and age of the receivable balances, and economic conditions that may affect a customer's ability to pay. When the evaluation indicates that it is probable that all amounts due pursuant to the contractual terms of the financing agreement, including scheduled interest payments, are unable to be collected, the financing receivable is considered impaired. All such outstanding amounts, including any accrued interest, will be assessed and fully reserved at the customer level.
Typically, the Company also considers receivables with a risk rating of 8 or higher to be impaired and will include them in the individual assessment for allowance. These balances, as of April 27, 2013 and July 28, 2012, are presented under “(b) Credit Quality of Financing Receivables” above.
The Company evaluates the remainder of its financing receivables portfolio for impairment on a collective basis and records an allowance for credit loss at the portfolio segment level. When evaluating the financing receivables on a collective basis, the Company uses expected default frequency rates published by a major third-party credit-rating agency as well as its own historical loss rate in the event of default, while also systematically giving effect to economic conditions, concentration of risk, and correlation.
In the ordinary course of business, the Company provides financing guarantees for various third-party financing arrangements extended to channel partners and end-user customers. Payments under these financing guarantee arrangements were not material for the periods presented.
Channel Partner Financing Guarantees The Company facilitates arrangements for third-party financing extended to channel partners, consisting of revolving short-term financing, generally with payment terms ranging from 60 to 90 days . These financing arrangements facilitate the working capital requirements of the channel partners, and, in some cases, the Company guarantees a portion of these arrangements. The volume of channel partner financing was $5.8 billion and $5.2 billion for the three months ended April 27, 2013 and April 28, 2012 , respectively. The volume of channel partner financing was $17.2 billion and $15.9 billion for the nine months ended April 27, 2013 and April 28, 2012 , respectively. The balance of the channel partner financing subject to guarantees was $1.4 billion and $1.2 billion as of April 27, 2013 and July 28, 2012, respectively.
17
CREDIT LOSS ALLOWANCES
Three Months Ended April 28, 2012 Lease Receivables Loan Receivables Financed Service
Contracts and Other Total
Allowance for credit loss as of January 28, 2012 $ 250 $ 110 $ 9 $ 369 Provisions 3 7 2 12 Write-offs net of recoveries (1 ) — — (1 )
Foreign exchange and other — 1 — 1 Allowance for credit loss as of April 28, 2012 $ 252 $ 118 $ 11 $ 381 Gross receivables as of April 28, 2012, net of unearned income $ 3,153 $ 1,827 $ 2,628 $ 7,608
CREDIT LOSS ALLOWANCES
Nine Months Ended April 28, 2012 Lease Receivables Loan Receivables Financed Service
Contracts and Other Total
Allowance for credit loss as of July 30, 2011 $ 237 $ 103 $ 27 $ 367 Provisions 23 16 (14 ) 25 Write-offs net of recoveries (1 ) — — (1 )
Foreign exchange and other (7 ) (1 ) (2 ) (10 )
Allowance for credit loss as of April 28, 2012 $ 252 $ 118 $ 11 $ 381 Gross receivables as of April 28, 2012, net of unearned income $ 3,153 $ 1,827 $ 2,628 $ 7,608
(d) Financing Guarantees

CISCO SYSTEMS, INC.
NOTES TO CONSOLIDATED FINANCIAL STATEMENTS (Continu ed) (Unaudited)
End-User Financing Guarantees The Company also provides financing guarantees for third-party financing arrangements extended to end-user customers related to leases and loans, which typically have terms of up to three years. The volume of financing provided by third parties for leases and loans as to which the Company had provided guarantees was $38 million and $99 million for the three months ended April 27, 2013 and April 28, 2012 , respectively, and was $137 million and $194 million for the nine months ended April 27, 2013 and April 28, 2012 , respectively.
Financing Guarantee Summary The aggregate amounts of financing guarantees outstanding at April 27, 2013 and July 28, 2012, representing the total maximum potential future payments under financing arrangements with third parties along with the related deferred revenue, are summarized in the following table (in millions):
The following tables summarize the Company’s available-for-sale investments (in millions):
18
April 27,
2013 July 28,
2012
Maximum potential future payments relating to financing guarantees:
Channel partner $ 391 $ 277 End user 255 232
Total $ 646 $ 509 Deferred revenue associated with financing guarantees:
Channel partner $ (227 ) $ (193 )
End user (223 ) (200 )
Total $ (450 ) $ (393 )
Maximum potential future payments relating to financing guarantees, net of associated deferred revenue $ 196 $ 116
8. Investments
(a) Summary of Available-for-Sale Investments
April 27, 2013 Amortized Cost Gross Unrealized
Gains Gross Unrealized
Losses Fair Value
Fixed income securities:
U.S. government securities $ 28,398 $ 45 $ — $ 28,443 U.S. government agency securities 3,297 12 — 3,309 Non-U.S. government and agency securities 1,007 5 — 1,012 Corporate debt securities 7,325 104 (1 ) 7,428
Total fixed income securities 40,027 166 (1 ) 40,192 Publicly traded equity securities 1,530 548 (4 ) 2,074
Total $ 41,557 $ 714 $ (5 ) $ 42,266
July 28, 2012 Amortized Cost Gross Unrealized
Gains Gross Unrealized
Losses Fair Value
Fixed income securities:
U.S. government securities $ 24,201 $ 41 $ (1 ) $ 24,241 U.S. government agency securities 5,367 21 — 5,388 Non-U.S. government and agency securities 1,629 9 — 1,638 Corporate debt securities 5,959 74 (3 ) 6,030
Total fixed income securities 37,156 145 (4 ) 37,297 Publicly traded equity securities 1,107 524 (11 ) 1,620
Total $ 38,263 $ 669 $ (15 ) $ 38,917

CISCO SYSTEMS, INC.
NOTES TO CONSOLIDATED FINANCIAL STATEMENTS (Continu ed) (Unaudited)
U.S. government agency securities include corporate debt securities that are guaranteed by the Federal Deposit Insurance Corporation, while non-U.S. government and agency securities include agency and corporate debt securities that are guaranteed by non-U.S. governments.
The following table presents the gross realized gains and gross realized losses related to the Company’s available-for-sale investments (in millions):
The following table presents the realized net gains (losses) related to the Company's available-for-sale investments by security type (in millions):
There were no impairment charges on available-for-sale investments for the periods presented.
The following tables present the breakdown of the available-for-sale investments with gross unrealized losses and the duration that those losses had been unrealized at April 27, 2013 and July 28, 2012 (in millions):
19
(b) Gains and Losses on Available-for-Sale Investments
Three Months Ended Nine Months Ended
April 27,
2013 April 28,
2012 April 27,
2013 April 28,
2012
Gross realized gains $ 55 $ 90 $ 175 $ 465 Gross realized losses (49 ) (60 ) (129 ) (389 )
Total $ 6 $ 30 $ 46 $ 76
Three Months Ended Nine Months Ended
April 27,
2013 April 28,
2012 April 27,
2013 April 28,
2012
Net gains (losses) on investments in publicly traded equity securities $ (2 ) $ 15 $ 12 $ 30 Net gains on investments in fixed income securities 8 15 34 46
Total $ 6 $ 30 $ 46 $ 76
UNREALIZED LOSSES
LESS THAN 12 MONTHS UNREALIZED LOSSES
12 MONTHS OR GREATER TOTAL
April 27, 2013 Fair Value
Gross Unrealized
Losses Fair Value
Gross Unrealized
Losses Fair Value
Gross Unrealized
Losses
Fixed income securities:
U.S. government securities $ — $ — $ — $ — $ — $ — Corporate debt securities 602 (1 ) — — 602 (1 )
Total fixed income securities 602 (1 ) — — 602 (1 ) Publicly traded equity securities 61 (4 ) — — 61 (4 )
Total $ 663 $ (5 ) $ — $ — $ 663 $ (5 )
UNREALIZED LOSSES
LESS THAN 12 MONTHS UNREALIZED LOSSES
12 MONTHS OR GREATER TOTAL
July 28, 2012 Fair Value
Gross Unrealized
Losses Fair Value
Gross Unrealized
Losses Fair Value
Gross Unrealized
Losses
Fixed income securities: U.S. government securities $ 5,357 $ (1 ) $ — $ — $ 5,357 $ (1 ) Corporate debt securities 603 (3 ) 14 — 617 (3 )
Total fixed income securities 5,960 (4 ) 14 — 5,974 (4 ) Publicly traded equity securities 167 (8 ) 20 (3 ) 187 (11 )
Total $ 6,127 $ (12 ) $ 34 $ (3 ) $ 6,161 $ (15 )

CISCO SYSTEMS, INC.
NOTES TO CONSOLIDATED FINANCIAL STATEMENTS (Continu ed) (Unaudited)
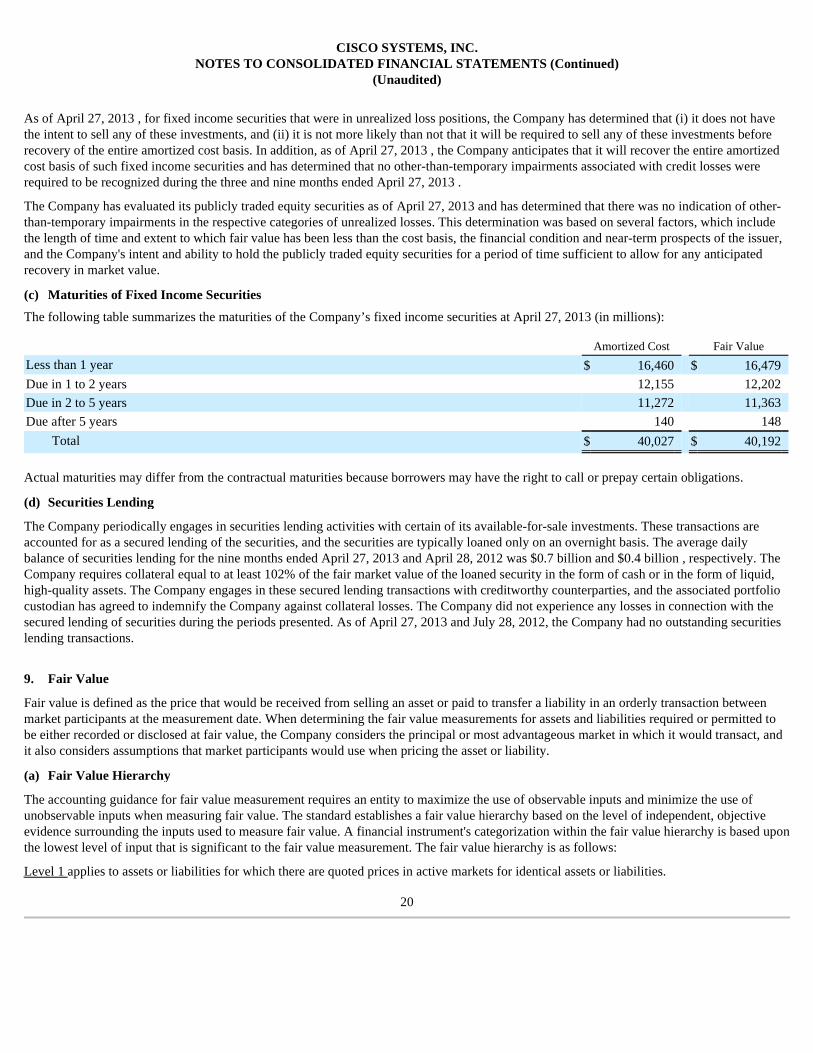
As of April 27, 2013 , for fixed income securities that were in unrealized loss positions, the Company has determined that (i) it does not have the intent to sell any of these investments, and (ii) it is not more likely than not that it will be required to sell any of these investments before recovery of the entire amortized cost basis. In addition, as of April 27, 2013 , the Company anticipates that it will recover the entire amortized cost basis of such fixed income securities and has determined that no other-than-temporary impairments associated with credit losses were required to be recognized during the three and nine months ended April 27, 2013 .
The Company has evaluated its publicly traded equity securities as of April 27, 2013 and has determined that there was no indication of other-than-temporary impairments in the respective categories of unrealized losses. This determination was based on several factors, which include the length of time and extent to which fair value has been less than the cost basis, the financial condition and near-term prospects of the issuer, and the Company's intent and ability to hold the publicly traded equity securities for a period of time sufficient to allow for any anticipated recovery in market value.
The following table summarizes the maturities of the Company’s fixed income securities at April 27, 2013 (in millions):
Actual maturities may differ from the contractual maturities because borrowers may have the right to call or prepay certain obligations.
The Company periodically engages in securities lending activities with certain of its available-for-sale investments. These transactions are accounted for as a secured lending of the securities, and the securities are typically loaned only on an overnight basis. The average daily balance of securities lending for the nine months ended April 27, 2013 and April 28, 2012 was $0.7 billion and $0.4 billion , respectively. The Company requires collateral equal to at least 102% of the fair market value of the loaned security in the form of cash or in the form of liquid, high-quality assets. The Company engages in these secured lending transactions with creditworthy counterparties, and the associated portfolio custodian has agreed to indemnify the Company against collateral losses. The Company did not experience any losses in connection with the secured lending of securities during the periods presented. As of April 27, 2013 and July 28, 2012, the Company had no outstanding securities lending transactions.
Fair value is defined as the price that would be received from selling an asset or paid to transfer a liability in an orderly transaction between market participants at the measurement date. When determining the fair value measurements for assets and liabilities required or permitted to be either recorded or disclosed at fair value, the Company considers the principal or most advantageous market in which it would transact, and it also considers assumptions that market participants would use when pricing the asset or liability.
The accounting guidance for fair value measurement requires an entity to maximize the use of observable inputs and minimize the use of unobservable inputs when measuring fair value. The standard establishes a fair value hierarchy based on the level of independent, objective evidence surrounding the inputs used to measure fair value. A financial instrument's categorization within the fair value hierarchy is based upon the lowest level of input that is significant to the fair value measurement. The fair value hierarchy is as follows:
Level 1 applies to assets or liabilities for which there are quoted prices in active markets for identical assets or liabilities.
20
(c) Maturities of Fixed Income Securities
Amortized Cost Fair Value
Less than 1 year $ 16,460 $ 16,479 Due in 1 to 2 years 12,155 12,202 Due in 2 to 5 years 11,272 11,363 Due after 5 years 140 148
Total $ 40,027 $ 40,192
(d) Securities Lending
9. Fair Value
(a) Fair Value Hierarchy

CISCO SYSTEMS, INC.
NOTES TO CONSOLIDATED FINANCIAL STATEMENTS (Continu ed) (Unaudited)
Level 2 applies to assets or liabilities for which there are inputs other than quoted prices that are observable for the asset or liability such as quoted prices for similar assets or liabilities in active markets; quoted prices for identical assets or liabilities in markets with insufficient volume or infrequent transactions (less active markets); or model-derived valuations in which significant inputs are observable or can be derived principally from, or corroborated by, observable market data.
Level 3 applies to assets or liabilities for which there are unobservable inputs to the valuation methodology that are significant to the measurement of the fair value of the assets or liabilities.
Assets and liabilities measured at fair value on a recurring basis as of April 27, 2013 and July 28, 2012 were as follows (in millions):
Level 2 fixed income securities are priced using quoted market prices for similar instruments or nonbinding market prices that are corroborated by observable market data. The Company uses inputs such as actual trade data, benchmark yields, broker/dealer quotes, and other similar data, which are obtained from quoted market prices, independent pricing vendors, or other sources, to determine the ultimate fair value of these assets and liabilities. The Company uses such pricing data as the primary input to make its assessments and determinations as to the ultimate valuation of its investment portfolio and has not made, during the periods presented, any material adjustments to such inputs. The Company is ultimately responsible for the financial statements and underlying estimates. The Company's derivative instruments are primarily classified as Level 2, as they are not actively traded and are valued using pricing models that use observable market inputs. The Company did not have any transfers between Level 1 and Level 2 fair value measurements during the periods presented.
Level 3 assets include certain derivative instruments, the values of which are determined based on discounted cash flow models using inputs that the Company could not corroborate with market data.
There was no material activity related to assets measured at fair value on a recurring basis using significant unobservable inputs (Level 3) for the nine months ended April 27, 2013 .
21
(b) Assets and Liabilities Measured at Fair Value on a Recurring Basis
APRIL 27, 2013
FAIR VALUE MEASUREMENTS JULY 28, 2012
FAIR VALUE MEASUREMENTS
Level 1 Level 2 Level 3 Total
Balance Level 1 Level 2 Level 3 Total
Balance
Assets
Cash equivalents:
Money market funds $ 3,339 $ — $ — $ 3,339 $ 2,506 $ — $ — $ 2,506 Available-for-sale investments:
U.S. government securities — 28,443 — 28,443 — 24,241 — 24,241 U.S. government agency securities — 3,309 — 3,309 — 5,388 — 5,388 Non-U.S. government and agency securities — 1,012 — 1,012 — 1,638 — 1,638 Corporate debt securities — 7,428 — 7,428 — 6,030 — 6,030 Publicly traded equity securities 2,074 — — 2,074 1,620 — — 1,620
Derivative assets — 234 — 234 — 263 1 264 Total $ 5,413 $ 40,426 $ — $ 45,839 $ 4,126 $ 37,560 $ 1 $ 41,687
Liabilities:
Derivative liabilities $ — $ 94 $ — $ 94 $ — $ 42 $ — $ 42 Total $ — $ 94 $ — $ 94 $ — $ 42 $ — $ 42

CISCO SYSTEMS, INC.
NOTES TO CONSOLIDATED FINANCIAL STATEMENTS (Continu ed) (Unaudited)
The following table presents a reconciliation of all assets measured at fair value on a recurring basis using significant unobservable inputs (Level 3) for the nine months ended April 28, 2012 (in millions):
The Company's asset-backed securities were reclassified from Level 3 to Level 2 at January 28, 2012, the end of the Company's second quarter for fiscal 2012, as circumstances indicated an increase in market activity and related observable market data was available for these financial assets.
The following tables present the Company’s financial instruments and nonfinancial assets that were measured at fair value on a nonrecurring basis during the indicated periods and the related recognized gains and losses for the periods (in millions):
The assets in the preceding tables were measured at fair value due to events or circumstances the Company identified as having significant impact on their fair value during the respective periods. To arrive at the valuation of these assets, the Company considers any significant changes in the financial metrics and economic variables, and also uses third-party valuation reports to assist in the valuation as necessary. These assets were classified as Level 3 assets because the Company used significant unobservable inputs to value them.
The assets held for sale represent primarily land and buildings, as well as other items which met the criteria to be classified as held for sale. The fair value of assets held for sale was measured with the assistance of third-party valuation models which used discounted cash flow techniques as part of their analysis. The fair value measurement was categorized as Level 3 as significant unobservable inputs were used in the valuation report. The impairment charges as a result of the valuations, which represented the difference between the fair value less cost to sell and the carrying amount of the assets held for sale, were included in G&A expenses.
22
Asset-Backed
Securities Derivative Assets Total
Balance at July 30, 2011 $ 121 $ 2 $ 123 Total gains and losses (realized and unrealized):
Included in other income (loss), net 3 — 3 Included in other comprehensive income (loss) (3 ) — (3 )
Sales and maturities (14 ) (1 ) (15 )
Transfer into Level 2 (107 ) — (107 )
Balance at April 28, 2012 $ — $ 1 $ 1
(c) Assets Measured at Fair Value on a Nonrecurring Basis
April 27, 2013
Net Carrying Value as of
End of Period Gains (Losses) for the Three Months Ended
Gains (Losses) for the Nine Months Ended
Assets held for sale $ 72 $ 44 $ 44 Investments in privately held companies $ 66 (5 ) (23 )
Gains on assets no longer held at period end 34 34
Net gains for nonrecurring measurements $ 73 $ 55
April 28, 2012
Net Carrying Value as of
End of Period Losses for the Three
Months Ended Gains (Losses) for the Nine
Months Ended
Assets held for sale $ 52 $ (76 ) $ (192 )
Investments in privately held companies $ 17 (15 ) (17 )
Gains on assets no longer held at period end — 14
Net losses for nonrecurring measurements $ (91 ) $ (195 )

CISCO SYSTEMS, INC.
NOTES TO CONSOLIDATED FINANCIAL STATEMENTS (Continu ed) (Unaudited)
The fair value of the impaired investments was classified as Level 3 because significant unobservable inputs were used in the valuation due to the absence of quoted market prices and inherent lack of liquidity. Significant unobservable inputs, which included financial metrics of comparable private and public companies, financial condition and near-term prospects of the investees, recent financing activities of the investees, and the investees' capital structure as well as other economic variables, reflected the assumptions market participants would use in pricing these assets. The impairment charges, representing the difference between the net book value and the fair value as a result of the evaluation, were recorded to other income (loss), net.
The carrying value of the Company's investments in privately held companies that were accounted for under the cost method was $248 million and $249 million as of April 27, 2013 and July 28, 2012, respectively. It was not practicable to estimate the fair value of this portfolio.
The fair value of the Company's short-term loan receivables and financed service contracts approximates their carrying value due to their short duration. The aggregate carrying value of the Company's long-term loan receivables and financed service contracts and other as of April 27, 2013 and July 28, 2012 was $2.0 billion and $1.9 billion , respectively. The estimated fair value of the Company's long-term loan receivables and financed service contracts and other approximates their carrying value. The Company uses significant unobservable inputs in determining discounted cash flows to estimate the fair value of its long-term loan receivables and financed service contracts, and therefore they are categorized as Level 3.
As of April 27, 2013 , the fair value of the Company's senior notes was $18.4 billion with a carrying amount of $16.2 billion . This compares to a fair value of $18.8 billion and a carrying amount of $16.3 billion as of July 28, 2012. The fair value of the senior notes was determined based on observable market prices in a less active market and was categorized as Level 2 in the fair value hierarchy.
The following table summarizes the Company’s short-term debt (in millions, except percentages):
In fiscal 2011, the Company established a short-term debt financing program of up to $3.0 billion through the issuance of commercial paper notes. The Company uses the proceeds from the issuance of commercial paper notes for general corporate purposes. The Company had no commercial paper notes outstanding as of each of April 27, 2013 and July 28, 2012.
Other notes and borrowings in the preceding table consist of notes and credit facilities established with a number of financial institutions that are available to certain foreign subsidiaries of the Company. These notes and credit facilities are subject to various terms and foreign currency market interest rates pursuant to individual financial arrangements between the financing institution and the applicable foreign subsidiary.
As of April 27, 2013 , the estimated fair value of the short-term debt approximates its carrying value due to the short maturities.
23
(d) Other Fair Value Disclosures
10. Borrowings
(a) Short-Term Debt
April 27, 2013 July 28, 2012
Amount
Weighted-Average Interest
Rate Amount
Weighted-Average Interest
Rate
Current portion of long-term debt $ 3,279 0.64 % $ — —%
Other notes and borrowings 13 9.60 % 31 6.72 %
Total short-term debt $ 3,292 $ 31

CISCO SYSTEMS, INC.
NOTES TO CONSOLIDATED FINANCIAL STATEMENTS (Continu ed) (Unaudited)
The following table summarizes the Company's long-term debt (in millions, except percentages):
To achieve its interest rate risk management objectives, the Company entered into interest rate swaps with an aggregate notional amount of $4.25 billion designated as fair value hedges of certain of its fixed-rate senior notes. In effect, these swaps convert the fixed interest rates of the fixed-rate notes to floating interest rates based on the London InterBank Offered Rate (“LIBOR”). The gains and losses related to changes in the fair value of the interest rate swaps substantially offset changes in the fair value of the hedged portion of the underlying debt that are attributable to the changes in market interest rates. See Note 11 to the Consolidated Financial Statements.
The effective rates for the fixed-rate debt include the interest on the notes, the accretion of the discount, and, if applicable, adjustments related to hedging. Interest is payable semiannually on each class of the senior fixed-rate notes and payable quarterly on the floating-rate notes. Each of the senior fixed-rate notes is redeemable by the Company at any time, subject to a make-whole premium.
The senior notes rank at par with the commercial paper notes that may be issued in the future pursuant to the Company's short-term debt financing program, as discussed above under “(a) Short-Term Debt.” As of April 27, 2013 , the Company was in compliance with all debt covenants.
As of April 27, 2013 , future principal payments for long-term debt, including the current portion, are summarized as follows (in millions):
24
(b) Long-Term Debt
April 27, 2013 July 28, 2012
Amount Effective Rate Amount Effective Rate
Senior Notes:
Floating-rate notes, due 2014 $ 1,250 0.63% $ 1,250 0.81%
1.625% fixed-rate notes, due 2014 2,000 0.65% 2,000 0.84%
2.90% fixed-rate notes, due 2014 500 3.11% 500 3.11%
5.50% fixed-rate notes, due 2016 3,000 3.07% 3,000 3.16%
3.15% fixed-rate notes, due 2017 750 0.85% 750 1.03%
4.95% fixed-rate notes, due 2019 2,000 5.08% 2,000 5.08%
4.45% fixed-rate notes, due 2020 2,500 4.50% 2,500 4.50%
5.90% fixed-rate notes, due 2039 2,000 6.11% 2,000 6.11%
5.50% fixed-rate notes, due 2040 2,000 5.67% 2,000 5.67%
Total 16,000 16,000
Other long-term debt 10 0.19% 10 0.19%
Unaccreted discount (66 ) (70 )
Hedge accounting fair value adjustments 291 357
Total 16,235 16,297
Less: current portion of long-term debt (3,279 ) 0.64% —
Total long-term debt $ 12,956 $ 16,297
Fiscal Year Amount
2013 (remaining three months) $ — 2014 3,260 2015 500 2016 3,000 2017 750 Thereafter 8,500
Total $ 16,010

CISCO SYSTEMS, INC.
NOTES TO CONSOLIDATED FINANCIAL STATEMENTS (Continu ed) (Unaudited)
On February 17, 2012, the Company entered into a credit agreement with certain institutional lenders that provides for a $3.0 billion unsecured revolving credit facility that is scheduled to expire on February 17, 2017 . Any advances under the credit agreement will accrue interest at rates that are equal to, based on certain conditions, either (i) the higher of the Federal Funds rate plus 0.50% , Bank of America's “prime rate” as announced from time to time, or one-month LIBOR plus 1.00% , or (ii) LIBOR plus a margin that is based on the Company's senior debt credit ratings as published by Standard & Poor's Financial Services, LLC and Moody's Investors Service, Inc. The credit agreement requires the Company to comply with certain covenants, including that it maintains an interest coverage ratio as defined in the agreement. As of April 27, 2013 , the Company was in compliance with all such required covenants, and the Company had not borrowed any funds under the credit facility.
The Company may also, upon the agreement of either the then-existing lenders or additional lenders not currently parties to the agreement, increase the commitments under the credit facility by up to an additional $2.0 billion and/or extend the expiration date of the credit facility by up to two additional years, or up to February 17, 2019 .
The Company uses derivative instruments primarily to manage exposures to foreign currency exchange rate, interest rate, and equity price risks. The Company's primary objective in holding derivatives is to reduce the volatility of earnings and cash flows associated with changes in foreign currency exchange rates, interest rates, and equity prices. The Company's derivatives expose it to credit risk to the extent that the counterparties may be unable to meet the terms of the agreement. The Company does, however, seek to mitigate such risks by limiting its counterparties to major financial institutions. In addition, the potential risk of loss with any one counterparty resulting from this type of credit risk is monitored. Management does not expect material losses as a result of defaults by counterparties.
The fair values of the Company's derivative instruments and the line items on the Consolidated Balance Sheets to which they were recorded are summarized as follows (in millions):
25
(c) Credit Facility
11. Derivative Instruments
(a) Summary of Derivative Instruments
DERIVATIVE ASSETS DERIVATIVE LIABILITIES
Balance Sheet Line Item April 27,
2013 July 28,
2012 Balance Sheet Line Item April 27,
2013 July 28,
2012
Derivatives designated as hedging instruments:
Foreign currency derivatives Other current assets $ 17 $ 24 Other current liabilities $ 2 $ 26 Interest rate derivatives Other assets 183 223 Other long-term liabilities — — Equity derivatives Other current assets — — Other current liabilities 87 4 Total 200 247 89 30
Derivatives not designated as hedging instruments:
Foreign currency derivatives Other current assets 34 16 Other current liabilities 5 12 Equity derivatives Other assets — 1 Other long-term liabilities — — Total 34 17 5 12
Total $ 234 $ 264 $ 94 $ 42
CISCO SYSTEMS, INC.
NOTES TO CONSOLIDATED FINANCIAL STATEMENTS (Continu ed) (Unaudited)
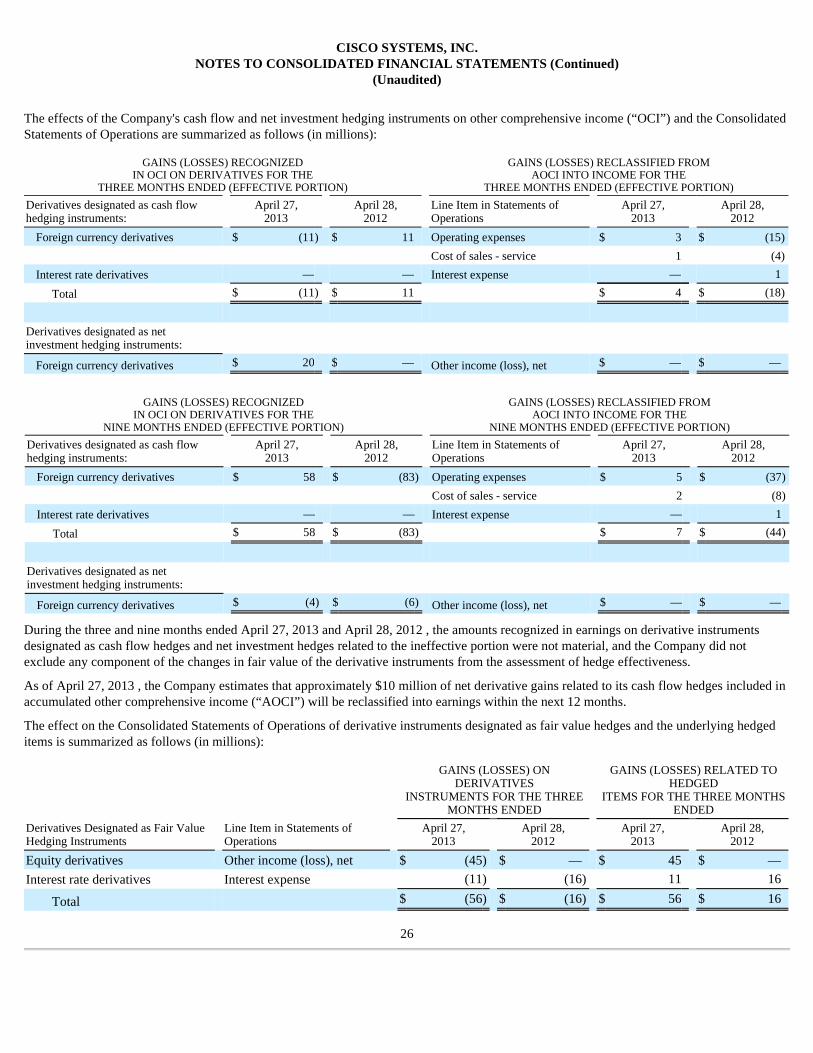
The effects of the Company's cash flow and net investment hedging instruments on other comprehensive income (“OCI”) and the Consolidated Statements of Operations are summarized as follows (in millions):
During the three and nine months ended April 27, 2013 and April 28, 2012 , the amounts recognized in earnings on derivative instruments designated as cash flow hedges and net investment hedges related to the ineffective portion were not material, and the Company did not exclude any component of the changes in fair value of the derivative instruments from the assessment of hedge effectiveness.
As of April 27, 2013 , the Company estimates that approximately $10 million of net derivative gains related to its cash flow hedges included in accumulated other comprehensive income (“AOCI”) will be reclassified into earnings within the next 12 months.
The effect on the Consolidated Statements of Operations of derivative instruments designated as fair value hedges and the underlying hedged items is summarized as follows (in millions):
26
GAINS (LOSSES) RECOGNIZED IN OCI ON DERIVATIVES FOR THE
THREE MONTHS ENDED (EFFECTIVE PORTION)
GAINS (LOSSES) RECLASSIFIED FROM AOCI INTO INCOME FOR THE
THREE MONTHS ENDED (EFFECTIVE PORTION)
Derivatives designated as cash flow hedging instruments:
April 27, 2013
April 28, 2012
Line Item in Statements of Operations
April 27, 2013
April 28, 2012
Foreign currency derivatives $ (11 ) $ 11 Operating expenses $ 3 $ (15 )
Cost of sales - service 1 (4 )
Interest rate derivatives — — Interest expense — 1 Total $ (11 ) $ 11 $ 4 $ (18 )
Derivatives designated as net investment hedging instruments:
Foreign currency derivatives $ 20 $ — Other income (loss), net $ — $ —
GAINS (LOSSES) RECOGNIZED IN OCI ON DERIVATIVES FOR THE
NINE MONTHS ENDED (EFFECTIVE PORTION)
GAINS (LOSSES) RECLASSIFIED FROM AOCI INTO INCOME FOR THE
NINE MONTHS ENDED (EFFECTIVE PORTION)
Derivatives designated as cash flow hedging instruments:
April 27, 2013
April 28, 2012
Line Item in Statements of Operations
April 27, 2013
April 28, 2012
Foreign currency derivatives $ 58 $ (83 ) Operating expenses $ 5 $ (37 )
Cost of sales - service 2 (8 )
Interest rate derivatives — — Interest expense — 1 Total $ 58 $ (83 ) $ 7 $ (44 )
Derivatives designated as net investment hedging instruments:
Foreign currency derivatives $ (4 ) $ (6 ) Other income (loss), net $ — $ —
GAINS (LOSSES) ON DERIVATIVES
INSTRUMENTS FOR THE THREE MONTHS ENDED
GAINS (LOSSES) RELATED TO HEDGED
ITEMS FOR THE THREE MONTHS ENDED
Derivatives Designated as Fair Value Hedging Instruments
Line Item in Statements of Operations
April 27, 2013
April 28, 2012
April 27, 2013
April 28, 2012
Equity derivatives Other income (loss), net $ (45 ) $ — $ 45 $ — Interest rate derivatives Interest expense (11 ) (16 ) 11 16
Total $ (56 ) $ (16 ) $ 56 $ 16
CISCO SYSTEMS, INC.
NOTES TO CONSOLIDATED FINANCIAL STATEMENTS (Continu ed) (Unaudited)
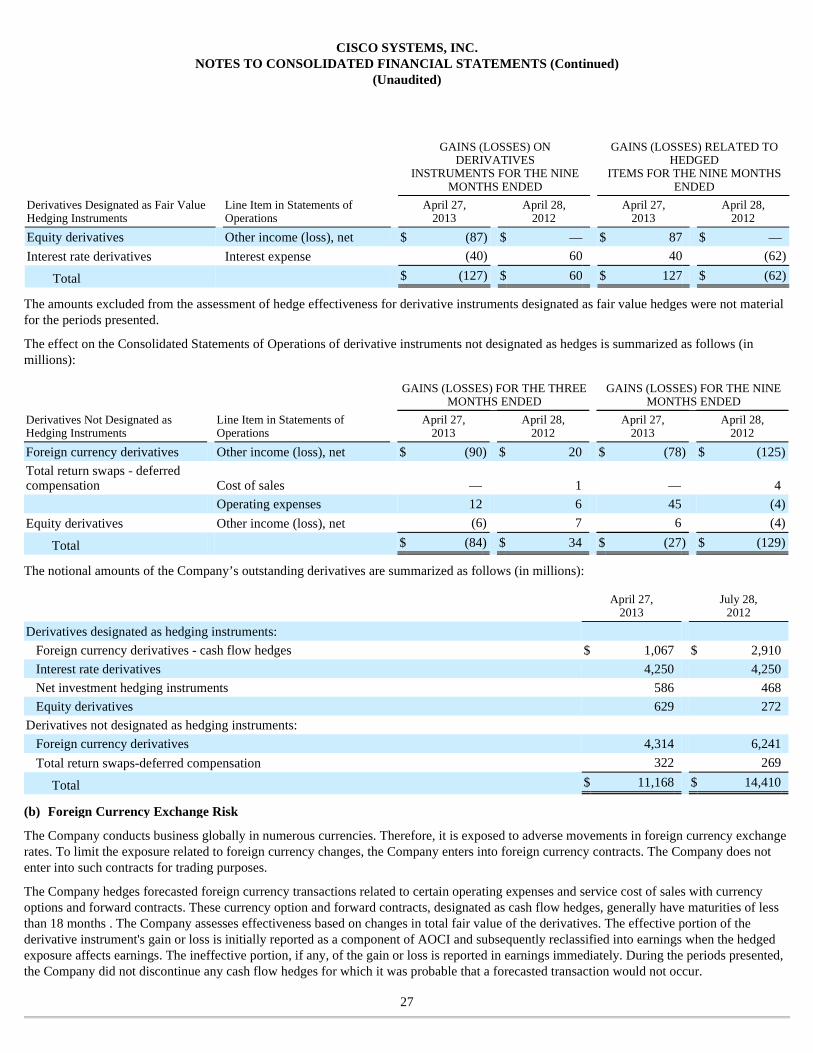
The amounts excluded from the assessment of hedge effectiveness for derivative instruments designated as fair value hedges were not material for the periods presented.
The effect on the Consolidated Statements of Operations of derivative instruments not designated as hedges is summarized as follows (in millions):
The notional amounts of the Company’s outstanding derivatives are summarized as follows (in millions):
The Company conducts business globally in numerous currencies. Therefore, it is exposed to adverse movements in foreign currency exchange rates. To limit the exposure related to foreign currency changes, the Company enters into foreign currency contracts. The Company does not enter into such contracts for trading purposes.
The Company hedges forecasted foreign currency transactions related to certain operating expenses and service cost of sales with currency options and forward contracts. These currency option and forward contracts, designated as cash flow hedges, generally have maturities of less than 18 months . The Company assesses effectiveness based on changes in total fair value of the derivatives. The effective portion of the derivative instrument's gain or loss is initially reported as a component of AOCI and subsequently reclassified into earnings when the hedged exposure affects earnings. The ineffective portion, if any, of the gain or loss is reported in earnings immediately. During the periods presented, the Company did not discontinue any cash flow hedges for which it was probable that a forecasted transaction would not occur.
27
GAINS (LOSSES) ON DERIVATIVES
INSTRUMENTS FOR THE NINE MONTHS ENDED
GAINS (LOSSES) RELATED TO HEDGED
ITEMS FOR THE NINE MONTHS ENDED
Derivatives Designated as Fair Value Hedging Instruments
Line Item in Statements of Operations
April 27, 2013
April 28, 2012
April 27, 2013
April 28, 2012
Equity derivatives Other income (loss), net $ (87 ) $ — $ 87 $ — Interest rate derivatives Interest expense (40 ) 60 40 (62 )
Total $ (127 ) $ 60 $ 127 $ (62 )
GAINS (LOSSES) FOR THE THREE
MONTHS ENDED GAINS (LOSSES) FOR THE NINE
MONTHS ENDED
Derivatives Not Designated as Hedging Instruments
Line Item in Statements of Operations
April 27, 2013
April 28, 2012
April 27, 2013
April 28, 2012
Foreign currency derivatives Other income (loss), net $ (90 ) $ 20 $ (78 ) $ (125 )
Total return swaps - deferred compensation Cost of sales — 1 — 4 Operating expenses 12 6 45 (4 )
Equity derivatives Other income (loss), net (6 ) 7 6 (4 )
Total $ (84 ) $ 34 $ (27 ) $ (129 )
April 27,
2013 July 28,
2012
Derivatives designated as hedging instruments:
Foreign currency derivatives - cash flow hedges $ 1,067 $ 2,910 Interest rate derivatives 4,250 4,250 Net investment hedging instruments 586 468 Equity derivatives 629 272
Derivatives not designated as hedging instruments:
Foreign currency derivatives 4,314 6,241 Total return swaps-deferred compensation 322 269
Total $ 11,168 $ 14,410
(b) Foreign Currency Exchange Risk

CISCO SYSTEMS, INC.
NOTES TO CONSOLIDATED FINANCIAL STATEMENTS (Continu ed) (Unaudited)
The Company enters into foreign exchange forward and option contracts to reduce the short-term effects of foreign currency fluctuations on assets and liabilities such as foreign currency receivables, including long-term customer financings, investments, and payables. These derivatives are not designated as hedging instruments. Gains and losses on the contracts are included in other income (loss), net, and substantially offset foreign exchange gains and losses from the remeasurement of intercompany balances or other current assets, investments, or liabilities denominated in currencies other than the functional currency of the reporting entity.
The Company hedges certain net investments in its foreign operations with forward contracts to reduce the effects of foreign currency fluctuations on the Company's net investment in those foreign subsidiaries. These derivative instruments generally have maturities of up to six months .
Interest Rate Derivatives, Investments The Company's primary objective for holding fixed income securities is to achieve an appropriate investment return consistent with preserving principal and managing risk. To realize these objectives, the Company may utilize interest rate swaps or other derivatives designated as fair value or cash flow hedges. As of April 27, 2013 and July 28, 2012, the Company did not have any outstanding interest rate derivatives related to its fixed income securities.
Interest Rate Derivatives Designated as Fair Value Hedges, Long-Term Debt In fiscal 2011, the Company entered into interest rate swaps designated as fair value hedges related to fixed-rate senior notes that were issued in March 2011 and are due in 2014 and 2017. In fiscal 2010, the Company entered into interest rate swaps designated as fair value hedges for a portion of senior fixed-rate notes that were issued in 2006 and are due in 2016. Under these interest rate swaps, the Company receives fixed-rate interest payments and makes interest payments based on LIBOR plus a fixed number of basis points. The effect of such swaps is to convert the fixed interest rates of the senior fixed-rate notes to floating interest rates based on LIBOR. The gains and losses related to changes in the fair value of the interest rate swaps are included in interest expense and substantially offset changes in the fair value of the hedged portion of the underlying debt that are attributable to the changes in market interest rates. The fair value of the interest rate swaps was reflected in other assets.
The Company may hold equity securities for strategic purposes or to diversify its overall investment portfolio. The publicly traded equity securities in the Company's portfolio are subject to price risk. To manage its exposure to changes in the fair value of certain equity securities, the Company may enter into equity derivatives that are designated as fair value hedges. The changes in the value of the hedging instruments are included in other income (loss), net, and offset the change in the fair value of the underlying hedged investment. In addition, the Company periodically manages the risk of its investment portfolio by entering into equity derivatives that are not designated as accounting hedges. The changes in the fair value of these derivatives are also included in other income (loss), net.
The Company is also exposed to variability in compensation charges related to certain deferred compensation obligations to employees. Although not designated as accounting hedges, the Company utilizes derivatives such as total return swaps to economically hedge this exposure.
Certain derivative instruments are executed under agreements that have provisions requiring the Company and the counterparty to maintain a specified credit rating from certain credit-rating agencies. If the Company's or the counterparty's credit-rating falls below a specified credit rating, either party has the right to request collateral on the derivatives' net liability position. Such provisions did not affect the Company's financial position as of April 27, 2013 and July 28, 2012.
28
(c) Interest Rate Risk
(d) Equity Price Risk
(e) Credit-Risk-Related Contingent Features

CISCO SYSTEMS, INC.
NOTES TO CONSOLIDATED FINANCIAL STATEMENTS (Continu ed) (Unaudited)
The Company leases office space in many U.S. locations. Outside the United States, larger leased sites include sites in Australia, Belgium, China, France, Germany, India, Israel, Italy, Japan, and the United Kingdom . The Company also leases equipment and vehicles. Future minimum lease payments under all noncancelable operating leases with an initial term in excess of one year as of April 27, 2013 are as follows (in millions):
The Company purchases components from a variety of suppliers and uses several contract manufacturers to provide manufacturing services for its products. During the normal course of business, in order to manage manufacturing lead times and help ensure adequate component supply, the Company enters into agreements with contract manufacturers and suppliers that either allow them to procure inventory based upon criteria as defined by the Company or establish the parameters defining the Company's requirements. A significant portion of the Company's reported purchase commitments arising from these agreements consists of firm, noncancelable, and unconditional commitments. In certain instances, these agreements allow the Company the option to cancel, reschedule, and adjust the Company's requirements based on its business needs prior to firm orders being placed. As of April 27, 2013 and July 28, 2012, the Company had total purchase commitments for inventory of $4,215 million and $3,869 million , respectively.
The Company records a liability for firm, noncancelable, and unconditional purchase commitments for quantities in excess of its future demand forecasts consistent with the valuation of the Company's excess and obsolete inventory. As of April 27, 2013 and July 28, 2012, the liability for these purchase commitments was $178 million and $193 million , respectively, and was included in other current liabilities.
In connection with the Company's business combinations and asset purchases, the Company has agreed to pay certain additional amounts contingent upon the achievement of certain agreed-upon technology, development, product, or other milestones or the continued employment with the Company of certain employees of the acquired entities. The Company recognized such compensation expense of $44 million and $12 million during the three months ended April 27, 2013 and April 28, 2012 , respectively, and $79 million and $40 million during the nine months ended April 27, 2013 and April 28, 2012 , respectively. As of April 27, 2013 , the Company estimated that future compensation expense and contingent consideration of up to $1.2 billion may be required to be recognized pursuant to the applicable business combination and asset purchase agreements, which included a maximum potential $863 million in milestone payments related to Insieme as more fully discussed in the subsection entitled “Insieme” within section (d) immediately below.
The Company also has certain funding commitments, primarily related to its investments in privately held companies and venture funds, some of which are based on the achievement of certain agreed-upon milestones, and some of which are required to be funded on demand. The funding commitments were $113 million and $120 million as of April 27, 2013 and July 28, 2012, respectively.
29
12. Commitments and Contingencies
(a) Operating Leases
Fiscal Year Amount
2013 (remaining three months) $ 92 2014 299 2015 240 2016 121 2017 80 Thereafter 224
Total $ 1,056
(b) Purchase Commitments with Contract Manufacturers and Suppliers
(c) Other Commitments
CISCO SYSTEMS, INC.
NOTES TO CONSOLIDATED FINANCIAL STATEMENTS (Continu ed) (Unaudited)
VCE Joint Venture VCE is a joint venture that the Company formed in fiscal 2010 with EMC Corporation (“EMC”), with investments from VMware, Inc. (“VMware”) and Intel Corporation. VCE helps organizations leverage best-in-class technologies and disciplines from Cisco, EMC, and VMware to enable the transformation to cloud computing.
As of April 27, 2013 , the Company's cumulative gross investment in VCE was approximately $464 million , inclusive of accrued interest, and its ownership percentage was approximately 35% .
The Company accounts for its investment in VCE under the equity method, and its portion of VCE's net loss is recognized in other income (loss), net. The Company's consolidated share of VCE's losses, based upon its portion of the overall funding, was approximately 36.8% for each of the three and nine months ended April 27, 2013 and April 28, 2012 . As of April 27, 2013 , the Company had recorded cumulative losses from VCE of $374 million since inception, of which losses of $49 million and $34 million were recorded for the three months ended April 27, 2013 and April 28, 2012 , respectively, and losses of $135 million and $120 million were recorded for the nine months ended April 27, 2013 and April 28, 2012 . The Company's carrying value in VCE as of April 27, 2013 of $90 million is recorded in other assets.
Over the next 12 months, as VCE scales its operations, the Company expects that it will make additional investments in VCE and may incur additional losses proportionate with the Company's share ownership.
From time to time, EMC and Cisco may enter into guarantee agreements on behalf of VCE to indemnify third parties, such as customers, for monetary damages. Such guarantees were not material as of April 27, 2013 .
Insieme In the third quarter of fiscal 2012, the Company made an investment in Insieme, an early stage company focused on research and development in the data center market. As set forth in the agreement between the Company and Insieme, this investment includes $100 million of funding and a license to certain of the Company's technology. In addition, pursuant to a November 2012 amendment to the agreement between the Company and Insieme, the Company agreed to invest an additional $35 million in Insieme upon the satisfaction of certain conditions. As of April 27, 2013 , the Company owned approximately 85% of Insieme as a result of these investments and has consolidated the results of Insieme in its Consolidated Financial Statements.
The net loss attributable to the noncontrolling interests was not presented separately in the Consolidated Statements of Operations due to the amount being immaterial. In connection with this investment, the Company and Insieme have entered into a put/call option agreement that provides the Company with the right to purchase the remaining interests in Insieme. In addition, the noncontrolling interest holders can require the Company to purchase their shares upon the occurrence of certain events. If the Company acquires the remaining interests of Insieme, the noncontrolling interest holders are eligible to receive two milestone payments, which will be determined using agreed-upon formulas based on revenue for certain of Insieme's products. The Company will begin recognizing the amounts due under the milestone payments when it is determined that such payments are probable of being earned, which the Company expects may be in fiscal 2014. When such a determination is made, the milestone payments will then be recorded as compensation expense by the Company based on an estimate of the fair value of the amounts probable of being earned, pursuant to a vesting schedule. Subsequent changes to the fair value of the amounts probable of being earned and the continued vesting will result in adjustments to the recorded compensation expense. The maximum amount that could be recorded as compensation expense by the Company is approximately $863 million . This maximum amount was increased from the previous maximum of $750 million due to a November 2012 amendment to the agreement, as the parties recognized that higher staffing levels may be necessary to perform additional product development. The milestone payments, if earned, are expected to be paid primarily during fiscal 2016 and fiscal 2017.
Other Variable Interest Entities In the ordinary course of business, the Company has investments in other privately held companies and provides financing to certain customers. These other privately held companies and customers may be considered to be variable interest entities. The Company evaluates on an ongoing basis its investments in these other privately held companies and its customer financings and has determined that as of April 27, 2013 there were no other variable interest entities required to be consolidated in the Company's Consolidated Financial Statements.
30
(d) Variable Interest Entities

CISCO SYSTEMS, INC.
NOTES TO CONSOLIDATED FINANCIAL STATEMENTS (Continu ed) (Unaudited)
The following table summarizes the activity related to product warranty liability during the nine months ended April 27, 2013 and April 28, 2012 (in millions):
The Company accrues for warranty costs as part of its cost of sales based on associated material product costs, labor costs for technical support staff, and associated overhead. The Company's products are generally covered by a warranty for periods ranging from 90 days to five years , and for some products the Company provides a limited lifetime warranty.
In the normal course of business, the Company indemnifies other parties, including customers, lessors, and parties to other transactions with the Company, with respect to certain matters. The Company has agreed to hold the other parties harmless against losses arising from a breach of representations or covenants or out of intellectual property infringement or other claims made against certain parties. These agreements may limit the time within which an indemnification claim can be made and the amount of the claim. In addition, the Company has entered into indemnification agreements with its officers and directors, and the Company's Amended and Restated Bylaws contain similar indemnification obligations to the Company's agents. It is not possible to determine the maximum potential amount under these indemnification agreements due to the Company's limited history with prior indemnification claims and the unique facts and circumstances involved in each particular agreement. Historically, payments made by the Company under these agreements have not had a material effect on the Company's operating results, financial position, or cash flows.
The Company also provides financing guarantees, which are generally for various third-party financing arrangements to channel partners and other end-user customers. See Note 7 to the Consolidated Financial Statements. The Company's other guarantee arrangements as of April 27, 2013 and July 28, 2012 that were subject to recognition and disclosure requirements were not material.
Brazilian authorities have investigated the Company's Brazilian subsidiary and certain of its current and former employees, as well as a Brazilian importer of the Company's products, and its affiliates and employees, relating to alleged evasion of import taxes and alleged improper transactions involving the subsidiary and the importer. Brazilian tax authorities have assessed claims against the Company's Brazilian subsidiary based on a theory of joint liability with the Brazilian importer for import taxes, interest, and penalties. In addition to claims asserted by the Brazilian federal tax authorities in prior fiscal years, tax authorities from the Brazilian state of Sao Paulo have asserted similar claims on the same legal basis in prior fiscal years. In the first quarter of fiscal 2013, the Brazilian federal tax authorities asserted an additional claim against the Company's Brazilian subsidiary based on a theory of joint liability with respect to an alleged underpayment of income taxes, social taxes, interest, and penalties by a Brazilian distributor.
The asserted claims by Brazilian federal tax authorities are for calendar years 2003 through 2008, and the asserted claims by the tax authorities from the state of Sao Paulo, are for calendar years 2005 through 2007. The total asserted claims by Brazilian state and federal tax authorities aggregate to approximately $432 million for the alleged evasion of import and other taxes, approximately $1.2 billion for interest, and approximately $1.9 billion for various penalties, all determined using an exchange rate as of April 27, 2013 . The Company has completed a thorough review of the matters and believes the asserted claims against the Company's Brazilian subsidiary are without merit, and the Company is defending the claims vigorously. While the Company believes there is no legal basis for the alleged liability, due to the complexities and uncertainty surrounding the judicial process in Brazil and the nature of the claims asserting joint liability with the importer, the Company is unable to determine the likelihood of an unfavorable outcome against its Brazilian subsidiary and is unable to reasonably estimate a range of loss, if any. The Company does not expect a final judicial determination for several years.
31
(e) Product Warranties and Guarantees
Nine Months Ended
April 27,
2013 April 28,
2012
Balance at beginning of period $ 415 $ 342 Provision for warranties issued 494 474 Payments (478 ) (426 )
Balance at end of period $ 431 $ 390
(f) Legal Proceedings

CISCO SYSTEMS, INC.
NOTES TO CONSOLIDATED FINANCIAL STATEMENTS (Continu ed) (Unaudited)
On March 31, 2011 and April 12, 2011, purported shareholder class action lawsuits were filed in the United States District Court for the Northern District of California against the Company and certain of its officers and directors. The lawsuits were consolidated, and an amended consolidated complaint was filed on December 2, 2011. The consolidated action was purportedly brought on behalf of purchasers of the Company's publicly traded securities between February 3, 2010 and May 11, 2011. Plaintiffs alleged that defendants made false and misleading statements, purported to assert claims for violations of the federal securities laws, and sought unspecified compensatory damages and other relief. On February 12, 2012, the Company filed a motion seeking to dismiss all claims in the amended complaint. On March 29, 2013, the Court granted the Company's motion and dismissed the amended complaint, finding no facts or inferences to support the plaintiffs' allegations. Plaintiffs chose not to file an amended complaint and not to pursue an appeal. The Court dismissed the entire lawsuit with prejudice on April 29, 2013.
Beginning on April 8, 2011, a number of purported shareholder derivative lawsuits were filed in both the United States District Court for the Northern District of California and the California Superior Court for the County of Santa Clara against the Company's Board of Directors and several of its officers. The federal lawsuits have been consolidated in the Northern District of California. Plaintiffs in both the federal and state derivative actions allege that the Board allowed certain officers to make allegedly false and misleading statements. The complaint includes claims for violation of the federal securities laws, breach of fiduciary duties, waste of corporate assets, unjust enrichment, and violations of the California Corporations Code. The complaint seeks compensatory damages, disgorgement, and other relief. In light of the United States District Court's dismissal of the purported shareholder class action noted above, all of the federal and state derivative lawsuits have been voluntarily dismissed.
The Company was subject to patent claims asserted by VirnetX, Inc. on August 11, 2010 in the United States District Court for the Eastern District of Texas. VirnetX alleged that various Cisco products that implement a method for secure communication using virtual private networks infringe certain patents. VirnetX sought monetary damages. The trial on these claims began on March 4, 2013. On March 14, 2013, the jury entered a verdict finding that the Company's accused products do not infringe any of VirnetX's patents asserted in the lawsuit. On April 3, 2013,VirnetX filed a motion seeking a new trial on the issue of infringement, which the Company has opposed. The Court has set a hearing date for VirnetX's motion in June 2013.
The Company was subject to numerous patent, tort, and contract claims asserted by XpertUniverse on March 10, 2009 in the United States District Court for the District of Delaware. Shortly before trial, the Court dismissed on summary judgment all claims initially asserted by XpertUniverse except a claim for infringement of two XpertUniverse patents and a claim for fraud by concealment. XpertUniverse's remaining patent claims alleged that three Cisco products in the field of expertise location software infringed two XpertUniverse patents. XpertUniverse's fraud by concealment claim alleged that the Company did not disclose its decision not to admit XpertUniverse into a partner program. The trial on these remaining claims began on March 11, 2013. On March 22, 2013, the jury entered a verdict finding that two of the Company's products infringed two of XpertUniverse's patents and awarded XpertUniverse damages of less than $35 thousand . The jury also found for XpertUniverse on its fraud by concealment claim and awarded damages of $70 million . The Company believes it has strong arguments to overturn the fraud damage award or to obtain a new trial. On May 6, 2013, the Company filed post-trial motions that are expected to be decided in July or August 2013. If the Court does not grant the Company's post-trial motions, the Company will pursue an appeal. While the ultimate outcome of the case may still result in a loss, the Company does not expect it to be material.
The Company and a service provider customer are subject to patent claims asserted by TiVo, Inc. on June 4, 2012 in the United States District Court for the Eastern District of Texas. TiVo alleges that the Company's digital video recorders deployed by the service provider customer infringe certain of its patents. TiVo seeks monetary damages and injunctive relief. The trial on these claims is scheduled to begin in March 2014. The Company intends to show at trial that its products do not use the technology described in the patents. The Company is seeking permission from the Court to add counterclaims alleging that TiVo's new products infringe several digital video recorder patents owned by the Company.
TiVo previously filed a similar patent lawsuit against the same service provider customer, accusing digital video recorders manufactured by one of the Company's competitors. The outcome of that case, which is now scheduled for trial in June 2013, could have an impact on the timing and outcome of the Company's case. The parties to that case may conduct a mediation prior to the June trial and, if so, the Company expects to participate. The mediation could result in a resolution of the case for the Company and some or all of its service provider customers, which could result in a material charge to the Company. Due to the uncertainty surrounding the litigation process, which involves numerous defendants, the Company is unable to reasonably estimate the ultimate outcome of this litigation at this time.
32
CISCO SYSTEMS, INC.
NOTES TO CONSOLIDATED FINANCIAL STATEMENTS (Continu ed) (Unaudited)
In addition, the Company is subject to legal proceedings, claims, and litigation arising in the ordinary course of business, including intellectual property litigation. While the outcome of these matters is currently not determinable, the Company does not expect that the ultimate costs to resolve these matters will have a material adverse effect on its consolidated financial position, results of operations, or cash flows.
In September 2001, the Company's Board of Directors authorized a stock repurchase program. As of April 27, 2013 , the Company's Board of Directors had authorized an aggregate repurchase of up to $82 billion of common stock under this program, and the remaining authorized repurchase amount was $4.3 billion with no termination date. A summary of the stock repurchase activity under the stock repurchase program, reported based on the trade date, is summarized as follows (in millions, except per-share amounts):
The purchase price for the shares of the Company's stock repurchased is reflected as a reduction to shareholders' equity. The Company is required to allocate the purchase price of the repurchased shares as (i) a reduction to retained earnings and (ii) a reduction of common stock and additional paid-in capital. Issuance of common stock and the tax benefit related to employee stock incentive plans are recorded as an increase to common stock and additional paid-in capital.
During the nine months ended April 27, 2013 , the Company declared and paid cash dividends of $0.45 per common share, or $2.4 billion , on the Company's outstanding common stock. During the nine months ended April 28, 2012 , the Company declared and paid cash dividends of $0.20 per common share, or $1.1 billion , on the Company's outstanding common stock.
Any future dividends will be subject to the approval of the Company's Board of Directors.
For the nine months ended April 27, 2013 and April 28, 2012 , the Company repurchased approximately 13 million and 10 million shares, or $249 million and $160 million , of common stock, respectively, in settlement of employee tax withholding obligations due upon the vesting of restricted stock or stock units.
33
13. Shareholders’ Equity
(a) Stock Repurchase Program
Shares
Repurchased
Weighted- Average Price
per Share Amount
Repurchased
Cumulative balance at July 28, 2012 3,740 $ 20.36 $ 76,133 Repurchase of common stock under the stock repurchase program 81 19.81 1,613 Cumulative balance at April 27, 2013 3,821 $ 20.35 $ 77,746
(b) Cash Dividends on Shares of Common Stock
(c) Other Repurchases of Common Stock

CISCO SYSTEMS, INC.
NOTES TO CONSOLIDATED FINANCIAL STATEMENTS (Continu ed) (Unaudited)
The components of AOCI, net of tax, and the other comprehensive income (loss), excluding noncontrolling interest, for the nine months ended April 27, 2013 and April 28, 2012 are summarized as follows (in millions):
Stock Incentive Plan Program Description As of April 27, 2013 , the Company had five stock incentive plans: the 2005 Stock Incentive Plan (the “2005 Plan”); the 1996 Stock Incentive Plan (the “1996 Plan”); the 1997 Supplemental Stock Incentive Plan (the “Supplemental Plan”); the Cisco Systems, Inc. SA Acquisition Long-Term Incentive Plan (the “SA Acquisition Plan”); and the Cisco Systems, Inc. WebEx Acquisition Long-Term Incentive Plan (the “WebEx Acquisition Plan”). In addition, the Company has, in connection with the acquisitions of various companies, assumed the share-based awards granted under stock incentive plans of the acquired companies or issued share-based awards in replacement thereof. Share-based awards are designed to reward employees for their long-term contributions to the Company and provide incentives for them to remain with the Company. The number and frequency of share-based awards are based on competitive practices, operating results of the Company, government regulations, and other factors. Since the inception of the stock incentive plans, the Company has granted share-based awards to a significant percentage of its employees, and the majority has been granted to employees below the vice president level. The Company's primary stock incentive plans are summarized as follows:
2005 Plan As amended on November 15, 2007, the maximum number of shares issuable under the 2005 Plan over its term is 559 million shares plus the amount of any shares underlying awards outstanding on November 15, 2007 under the 1996 Plan, the SA Acquisition Plan, and the WebEx Acquisition Plan that are forfeited or are terminated for any other reason before being exercised or settled. If any awards granted under the 2005 Plan are forfeited or are terminated for any other reason before being exercised or settled, then the shares underlying the awards will again be available under the 2005 Plan.
Pursuant to an amendment approved by the Company's shareholders on November 12, 2009, the number of shares available for issuance under the 2005 Plan was reduced by 1.5 shares for each share awarded as a stock grant or a stock unit, and any shares underlying awards outstanding under the 1996 Plan, the SA Acquisition Plan, and the WebEx Acquisition Plan that expire unexercised at the end of their maximum terms become available for reissuance under the 2005 Plan. The 2005 Plan permits the granting of stock options, restricted stock, restricted stock units (“RSUs”), the vesting of which may be performance-based or market-based along with the requisite service requirement, and stock appreciation rights to employees (including employee directors and officers), consultants of the Company and its subsidiaries and affiliates, and non-employee directors of the Company. Stock options and stock appreciation rights granted under the 2005 Plan have an exercise price of at least 100% of the fair market value of the underlying stock on the grant date and prior to November 12, 2009 have an expiration date no later than nine years from the grant date. The expiration date for stock options and stock appreciation rights granted subsequent to the amendment approved on November 12, 2009 shall be no later than ten years from the grant date.
34
(d) Accumulated Other Comprehensive Income
Net Unrealized Gains on
Investments
Net Unrealized Gains (Losses)
Cash Flow Hedging
Instruments
Cumulative Translation
Adjustment and Other
Accumulated Other Comprehensive
Income
BALANCE AT JULY 28, 2012 $ 409 $ (53 ) $ 305 $ 661 Other comprehensive income (loss) attributable to Cisco Systems, Inc. (15 ) 51 (8 ) 28 BALANCE AT APRIL 27, 2013 $ 394 $ (2 ) $ 297 $ 689
Net Unrealized Gains on
Investments
Net Unrealized Gains (Losses)
Cash Flow Hedging
Instruments
Cumulative Translation
Adjustment and Other
Accumulated Other Comprehensive
Income
BALANCE AT JULY 30, 2011 $ 487 $ 6 $ 801 $ 1,294 Other comprehensive income (loss) attributable to Cisco Systems, Inc. 19 (39 ) (296 ) (316 )
BALANCE AT APRIL 28, 2012 $ 506 $ (33 ) $ 505 $ 978
14. Employee Benefit Plans
(a) Employee Stock Incentive Plans


CISCO SYSTEMS, INC.
NOTES TO CONSOLIDATED FINANCIAL STATEMENTS (Continu ed) (Unaudited)
The stock options will generally become exercisable for 20% or 25% of the option shares one year from the date of grant and then ratably over the following 48 or 36 months , respectively. Time-based stock grants and time-based RSUs will generally vest with respect to 20% or 25% of the shares or share units covered by the grant on each of the first through fifth or fourth anniversaries of the date of the grant, respectively. Performance-based and market-based RSUs typically vest at the end of the three year requisite service period or earlier if the award recipient meets certain retirement eligibility conditions. The Compensation and Management Development Committee of the Board of Directors has the discretion to use different vesting schedules. Stock appreciation rights may be awarded in combination with stock options or stock grants, and such awards shall provide that the stock appreciation rights will not be exercisable unless the related stock options or stock grants are forfeited. Stock grants may be awarded in combination with non-statutory stock options, and such awards may provide that the stock grants will be forfeited in the event that the related non-statutory stock options are exercised.
1996 Plan The 1996 Plan expired on December 31, 2006, and the Company can no longer make equity awards under the 1996 Plan. The maximum number of shares issuable over the term of the 1996 Plan was 2.5 billion shares. Stock options granted under the 1996 Plan have an exercise price of at least 100% of the fair market value of the underlying stock on the grant date and expire no later than nine years from the grant date. The stock options generally became exercisable for 20% or 25% of the option shares one year from the date of grant and then ratably over the following 48 or 36 months , respectively. Certain other grants utilized a 60 -month ratable vesting schedule. In addition, the Board of Directors, or other committees administering the 1996 Plan, had the discretion to use a different vesting schedule and did so from time to time.
Supplemental Plan The Supplemental Plan expired on December 31, 2007, and the Company can no longer make equity awards under the Supplemental Plan. Officers and members of the Company's Board of Directors were not eligible to participate in the Supplemental Plan. Nine million shares were reserved for issuance under the Supplemental Plan.
Acquisition Plans In connection with the Company's acquisitions of Scientific-Atlanta, Inc. (“Scientific-Atlanta”) and WebEx Communications, Inc. (“WebEx”), the Company adopted the SA Acquisition Plan and the WebEx Acquisition Plan, respectively, each effective upon completion of the applicable acquisition. These plans constitute assumptions, amendments, restatements, and renamings of the 2003 Long-Term Incentive Plan of Scientific-Atlanta and the WebEx Communications, Inc. Amended and Restated 2000 Stock Incentive Plan, respectively. The plans permit the grant of stock options, stock, stock units, and stock appreciation rights to certain employees of the Company and its subsidiaries and affiliates who had been employed by Scientific-Atlanta or its subsidiaries or WebEx or its subsidiaries, as applicable. As a result of the shareholder approval of the amendment and extension of the 2005 Plan, as of November 15, 2007, the Company will no longer make stock option grants or direct share issuances under either the SA Acquisition Plan or the WebEx Acquisition Plan.
The Company has an Employee Stock Purchase Plan, which includes its subplan, the International Employee Stock Purchase Plan (together, the “Purchase Plan”), under which 471.4 million shares of the Company's common stock have been reserved for issuance as of April 27, 2013 . Eligible employees are offered shares through a 24 -month offering period, which consists of four consecutive 6 -month purchase periods. Employees may purchase a limited number of shares of the Company's stock at a discount of up to 15% of the lesser of the market value at the beginning of the offering period or the end of each 6 -month purchase period. The Purchase Plan is scheduled to terminate on January 3, 2020. The Company issued 18 million shares under the Purchase Plan during each of the nine months ended April 27, 2013 and April 28, 2012 . As of April 27, 2013 , 69 million shares were available for issuance under the Purchase Plan.
35
(b) Employee Stock Purchase Plan

CISCO SYSTEMS, INC.
NOTES TO CONSOLIDATED FINANCIAL STATEMENTS (Continu ed) (Unaudited)
Share-based compensation expense consists primarily of expenses for stock options, stock purchase rights, restricted stock, and restricted stock units granted to employees. The following table summarizes share-based compensation expense (in millions):
As of April 27, 2013 , the total compensation cost related to unvested share-based awards not yet recognized was $2.0 billion , which is expected to be recognized over approximately 2.6 years on a weighted-average basis. The income tax benefit for share-based compensation expense was $73 million and $232 million for the three and nine months ended April 27, 2013 , respectively, and $88 million and $271 million for the three and nine months ended April 28, 2012 , respectively.
The Company uses third-party analyses to assist in developing the assumptions used in, as well as calibrating, its lattice-binomial and Black-Scholes models. The Company is responsible for determining the assumptions used in estimating the fair value of its share-based payment awards.
The Company uses the implied volatility for traded options (with contract terms corresponding to the expected life of the employee stock purchase rights) on the Company's stock as the expected volatility assumption required in the Black-Scholes model. The implied volatility is more representative of future stock price trends than historical volatility. The risk-free interest rate assumption is based upon observed interest rates appropriate for the term of the Company's employee stock purchase rights. The dividend yield assumption is based on the history and expectation of dividend payouts at the grant date.
The use of the lattice-binomial model requires extensive actual employee exercise behavior data for the relative probability estimation purpose, and a number of complex assumptions as presented in the preceding table. The estimated kurtosis and skewness are technical measures of the distribution of stock price returns, which affect expected employee stock option exercise behaviors, and are based on the Company's stock price return history as well as consideration of various academic analyses. The expected life of employee stock options is a derived output of the lattice-binomial model, which represents the weighted-average period the stock options are expected to remain outstanding.
A summary of share-based awards available for grant is as follows (in millions):
36
(c) Summary of Share-Based Compensation Expense
Three Months Ended Nine Months Ended
April 27,
2013 April 28,
2012 April 27,
2013 April 28,
2012
Cost of sales - product $ 10 $ 12 $ 31 $ 39 Cost of sales - service 34 39 105 116 Share-based compensation expense in cost of sales 44 51 136 155 Research and development 72 97 228 297 Sales and marketing 118 138 383 429 General and administrative 38 51 136 153 Restructuring and other charges — — (3 ) (2 )
Share-based compensation expense in operating expenses 228 286 744 877
Total share-based compensation expense $ 272 $ 337 $ 880 $ 1,032
(d) Share-Based Awards Available for Grant
Share-Based Awards Available for Grant
BALANCE AT JULY 30, 2011 255 Restricted stock, stock units, and other share-based awards granted (95 )
Share-based awards canceled/forfeited/expired 64 Other (6 )
BALANCE AT JULY 28, 2012 218 Restricted stock, stock units, and other share-based awards granted (84 )
Share-based awards canceled/forfeited/expired 103 Other (3 )
BALANCE AT APRIL 27, 2013 234

CISCO SYSTEMS, INC.
NOTES TO CONSOLIDATED FINANCIAL STATEMENTS (Continu ed) (Unaudited)
As reflected in the preceding table, for each share awarded as restricted stock or subject to a restricted stock unit award under the 2005 Plan, an equivalent of 1.5 shares was deducted from the available share-based award balance. For restricted stock units that were awarded with vesting contingent upon the achievement of future financial performance or market-based metrics, the maximum awards that can be achieved upon full vesting of such awards were reflected in the preceding table.
A summary of the restricted stock and stock unit activity, which includes time-based and performance-based or market-based restricted stock units, is as follows (in millions, except per-share amounts):
The assumptions for the valuation of RSUs are summarized as follows:
(f) Performance-Based Restricted Stock Units
The Company granted approximately 4 million and 2 million performance-based awards (“PRSUs”) for the nine months ended April 27, 2013 and April 28, 2012 , respectively. These PRSUs are contingent on the achievement of the Company's financial performance metrics or its comparative market-based returns. On the date of grant, the Company estimated the fair value of restricted stock units with market-based conditions using a Monte Carlo simulation model. The assumptions used to determine the grant date fair value of restricted stock units with performance metrics conditions are included in the table immediately above.
(g) Stock Option Awards
A summary of the stock option activity is as follows (in millions, except per-share amounts):
37
(e) Restricted Stock and Stock Unit Awards
Restricted Stock/Stock
Units
Weighted-Average Grant Date Fair Value
per Share Aggregated Fair Market Value
UNVESTED BALANCE AT JULY 30, 2011 116 $ 21.50
Granted and assumed 65 17.45
Vested (35 ) 21.94 $ 580 Canceled/forfeited (18 ) 20.38
UNVESTED BALANCE AT JULY 28, 2012 128 19.46
Granted and assumed 58 17.57
Vested (37 ) 20.68 $ 716 Canceled/forfeited (8 ) 18.94
UNVESTED BALANCE AT APRIL 27, 2013 141 $ 18.39
Three Months Ended Nine Months Ended
April 27,
2013 April 28,
2012 April 27,
2013 April 28,
2012
Expected dividend yield 2.7% 1.6% 3.0% 1.4%
Range of risk-free interest rates 0.1% - 0.9% 0.0% - 1.1% 0.0% - 0.9% 0.0% - 1.1%
STOCK OPTIONS OUTSTANDING
Number
Outstanding Weighted-Average
Exercise Price per Share
BALANCE AT JULY 30, 2011 621 $ 21.79 Assumed from acquisitions 1 2.08 Exercised (66 ) 13.51 Canceled/forfeited/expired (36 ) 23.40 BALANCE AT JULY 28, 2012 520 22.68 Assumed from acquisitions 7 0.92 Exercised (57 ) 16.71 Canceled/forfeited/expired (90 ) 21.70 BALANCE AT APRIL 27, 2013 380 $ 23.42


CISCO SYSTEMS, INC.
NOTES TO CONSOLIDATED FINANCIAL STATEMENTS (Continu ed) (Unaudited)
The following table summarizes significant ranges of outstanding and exercisable stock options as of April 27, 2013 (in millions, except years and share prices):
The aggregate intrinsic value in the preceding table represents the total pretax intrinsic value, based on the Company's closing stock price of $20.67 as of April 26, 2013, which would have been received by the option holders had those option holders exercised their stock options as of that date. The total number of in-the-money stock options exercisable as of April 27, 2013 was 136 million . As of July 28, 2012, 512 million outstanding stock options were exercisable and the weighted-average exercise price was $22.65 .
The following table provides details of income taxes (in millions, except percentages):
The effective tax rate for the three and nine months ended April 27, 2013 reflected the Company's recognition of a net tax benefit of approximately $117 million which is due in large part to lapses of the time period for assessment of tax in certain foreign jurisdictions. As discussed below, the effective tax rate for the nine months ended April 27, 2013 also reflected the Company's recognition of tax benefits of approximately $946 million , of which, $794 million related to a tax settlement with the Internal Revenue Service (“IRS”) and $152 million related to the reinstatement of the U.S. federal research and development (“R&D”) tax credit.
In the second quarter of fiscal 2013, the IRS and the Company settled all outstanding items related to the audit of the Company's federal income tax returns for the fiscal years ended July 27, 2002 through July 28, 2007. As a result of the settlement, the Company increased its income tax receivable by $733 million and recognized a net benefit to the provision for income taxes of $794 million , which included a reduction in interest expense of $157 million . During the third quarter of fiscal 2013, the Company received its income tax refund from the IRS. The Company is no longer subject to U.S. federal income tax audit through fiscal 2007.
Also during the second quarter of fiscal 2013, the American Taxpayer Relief Act of 2012 reinstated the U.S. federal R&D tax credit, retroactive to January 1, 2012. As a result, during the nine months ended April 27, 2013, the Company recognized total tax benefits of $152 million , of which $72 million related to fiscal 2012 R&D expenses.
As a result of the IRS tax settlement, the amount of gross unrecognized tax benefits was reduced by approximately $1.0 billion , of which $154 million , which was previously paid by the Company, became certain as a result of completing the audit. As of April 27, 2013 , the total amount of gross unrecognized tax benefits was $1.8 billion , of which, $1.5 billion would affect the effective tax rate if realized. The Company believes it is reasonably possible that certain federal, foreign, and state tax matters may be concluded in the next 12 months. Specific positions that may be resolved include issues involving transfer pricing and various other matters. The Company estimates that it is reasonably possible that the unrecognized tax benefits at April 27, 2013 could be reduced in the next 12 months by approximately $150 million .
38
STOCK OPTIONS OUTSTANDING STOCK OPTIONS EXERCISABLE
Range of Exercise Prices Number
Outstanding
Weighted-Average
Remaining Contractual
Life (in Years)
Weighted-Average
Exercise Price per Share
Aggregate Intrinsic Value
Number Exercisable
Weighted-Average
Exercise Price per Share
Aggregate Intrinsic Value
$ 0.01 – 15.00 9 5.88 $ 4.77 $ 149 6 $ 7.38 $ 70 15.01 – 18.00 60 1.42 17.79 173 60 17.79 173 18.01 – 20.00 68 0.66 19.17 100 67 19.17 101 20.01 – 25.00 121 2.33 22.74 2 121 22.74 2 25.01 – 35.00 122 3.37 30.69 — 121 30.70 —
Total 380 2.31 $ 23.42 $ 424 375 $ 23.66 $ 346
15. Income Taxes
Three Months Ended Nine Months Ended
April 27,
2013 April 28,
2012 April 27,
2013 April 28,
2012
Income before provision for income taxes $ 2,945 $ 2,779 $ 8,356 $ 7,773 Provision for income taxes $ 467 $ 614 $ 643 $ 1,649 Effective tax rate 15.9 % 22.1 % 7.7 % 21.2 %

CISCO SYSTEMS, INC.
NOTES TO CONSOLIDATED FINANCIAL STATEMENTS (Continu ed) (Unaudited)
The Company conducts business globally and is primarily managed on a geographic basis consisting of three segments: the Americas; EMEA; and APJC. The Company's management makes financial decisions and allocates resources based on the information it receives from its internal management system. Sales are attributed to a segment based on the ordering location of the customer. The Company does not allocate research and development, sales and marketing, or general and administrative expenses to its segments in this internal management system because management does not include the information in its measurement of the performance of the operating segments. In addition, the Company does not allocate amortization and impairment of acquisition-related intangible assets, share-based compensation expense, impacts to cost of sales from purchase accounting adjustments to inventory, charges related to asset impairments and restructurings, and certain other charges to the gross margin for each segment because management does not include this information in its measurement of the performance of the operating segments.
Summarized financial information by segment for the three and nine months ended April 27, 2013 and April 28, 2012 , based on the Company's internal management system and as utilized by the Company's Chief Operating Decision Maker (“CODM”), is as follows (in millions):
Net sales in the United States, which is included in the Americas, were $6.1 billion and $5.5 billion for the three months ended April 27, 2013 and April 28, 2012 , respectively, and were $18.3 billion and $16.6 billion for the nine months ended April 27, 2013 and April 28, 2012 , respectively.
The Company designs, manufactures, and sells Internet Protocol (“IP”)-based networking and other products related to the communications and IT industry, and provides services associated with these products and their use. The Company groups its products and technologies into the following categories: Switching, NGN Routing, Service Provider Video, Collaboration, Data Center, Wireless, Security, and Other Products. These products, primarily integrated by Cisco IOS Software, link geographically dispersed local-area networks (“LANs”), metropolitan-area networks (“MANs”), and wide-area networks (“WANs”). The Company has made certain reclassifications to the prior period amounts to conform to the current period's presentation.
39
16. Segment Information and Major Customers
(a) Net Sales and Gross Margin by Segment
Three Months Ended Nine Months Ended
April 27,
2013 April 28,
2012 April 27,
2013 April 28,
2012
Net sales:
Americas $ 7,127 $ 6,466 $ 21,286 $ 19,606 EMEA 3,131 3,160 9,065 9,255 APJC 1,958 1,962 5,839 5,510
Total $ 12,216 $ 11,588 $ 36,190 $ 34,371 Gross margin:
Americas 4,460 4,053 13,341 12,319 EMEA 2,044 2,019 5,850 5,868 APJC 1,197 1,242 3,494 3,342
Segment total 7,701 7,314 22,685 21,529 Unallocated corporate items (190 ) (145 ) (592 ) (405 )
Total $ 7,511 $ 7,169 $ 22,093 $ 21,124
(b) Net Sales for Groups of Similar Products and Services

CISCO SYSTEMS, INC.
NOTES TO CONSOLIDATED FINANCIAL STATEMENTS (Continu ed) (Unaudited)
The following table presents net sales for groups of similar products and services (in millions):
The majority of the Company's assets, excluding cash and cash equivalents and investments, as of April 27, 2013 and July 28, 2012 w ere attributable to its U.S. operations. The Company's total cash and cash equivalents and investments held by various foreign subsidiaries were $39.5 billion and $42.5 billion as of April 27, 2013 and July 28, 2012, respectively, and the remaining $7.9 billion and $6.2 billion at the respective period ends was available in the United States.
Property and equipment information is based on the physical location of the assets. The following table presents property and equipment information for geographic areas (in millions):
40
Three Months Ended Nine Months Ended
April 27,
2013 April 28,
2012 April 27,
2013 April 28,
2012
Net sales:
Switching $ 3,598 $ 3,661 $ 10,938 $ 10,969 NGN Routing 2,140 2,134 6,138 6,296 Service Provider Video 1,299 999 3,667 2,896 Collaboration 1,013 1,022 2,978 3,190 Data Center 515 291 1,480 883 Wireless 523 413 1,529 1,175 Security 327 342 1,001 994 Other 144 244 562 773
Product 9,559 9,106 28,293 27,176 Service 2,657 2,482 7,897 7,195
Total $ 12,216 $ 11,588 $ 36,190 $ 34,371
(c) Additional Segment Information
April 27,
2013 July 28,
2012
Property and equipment, net:
United States $ 2,760 $ 2,842 International 570 560
Total $ 3,330 $ 3,402

CISCO SYSTEMS, INC.
NOTES TO CONSOLIDATED FINANCIAL STATEMENTS (Continu ed) (Unaudited)
The following table presents the calculation of basic and diluted net income per share (in millions, except per-share amounts):
Employee equity share options, unvested shares, and similar equity instruments granted by the Company are treated as potential common shares outstanding in computing diluted earnings per share. Diluted shares outstanding include the dilutive effect of in-the-money options, unvested restricted stock, and restricted stock units. The dilutive effect of such equity awards is calculated based on the average share price for each fiscal period using the treasury stock method. Under the treasury stock method, the amount the employee must pay for exercising stock options, the amount of compensation cost for future service that the Company has not yet recognized, and the amount of tax benefits that would be recorded in additional paid-in capital when the award becomes deductible are collectively assumed to be used to repurchase shares.
41
17. Net Income per Share
Three Months Ended Nine Months Ended
April 27,
2013 April 28,
2012 April 27,
2013 April 28,
2012
Net income $ 2,478 $ 2,165 $ 7,713 $ 6,124
Weighted-average shares - basic 5,329 5,388 5,316 5,383 Effect of dilutive potential common shares 58 68 45 35
Weighted-average shares - diluted 5,387 5,456 5,361 5,418
Net income per share - basic $ 0.47 $ 0.40 $ 1.45 $ 1.14
Net income per share - diluted $ 0.46 $ 0.40 $ 1.44 $ 1.13
Antidilutive employee share-based awards, excluded 245 295 417 538

Forward-Looking Statements
This Quarterly Report on Form 10-Q, including this Management's Discussion and Analysis of Financial Condition and Results of Operations, contains forward-looking statements regarding future events and our future results that are subject to the safe harbors created under the Securities Act of 1933 (the “Securities Act”) and the Securities Exchange Act of 1934 (the “Exchange Act”). All statements other than statements of historical facts are statements that could be deemed forward-looking statements. These statements are based on current expectations, estimates, forecasts, and projections about the industries in which we operate and the beliefs and assumptions of our management. Words such as “expects,” “anticipates,” “targets,” “goals,” “projects,” “intends,” “plans,” “believes,” “seeks,” “estimates,” “continues,” “endeavors,” “strives,” “may,” variations of such words and similar expressions are intended to identify such forward-looking statements. In addition, any statements that refer to projections of our future financial performance, our anticipated growth and trends in our businesses, and other characterizations of future events or circumstances are forward-looking statements. Readers are cautioned that these forward-looking statements are only predictions and are subject to risks, uncertainties, and assumptions that are difficult to predict, including those identified below, under “Part II, Item 1A. Risk Factors,” and elsewhere herein. Therefore, actual results may differ materially and adversely from those expressed in any forward-looking statements. We undertake no obligation to revise or update any forward-looking statements for any reason.
OVERVIEW
We design, manufacture, and sell Internet Protocol (“IP”) based networking and other products related to the communications and information technology (“IT”) industry and provide services associated with these products and their use. We provide a broad line of products for transporting data, voice, and video within buildings, across campuses, and around the world. Our products are designed to transform how people connect, communicate, and collaborate. Our products are utilized at enterprise businesses, public institutions, telecommunications companies and other service providers, commercial businesses, and personal residences.
A summary of our results is as follows (in millions, except percentages and per-share amounts):
42
Item 2. Management’s Discussion and Analysis of Financial Condition and Results of Operations
Three Months Ended Nine Months Ended
April 27,
2013 April 28,
2012 Variance April 27,
2013 April 28,
2012 Variance
Net sales $ 12,216 $ 11,588 5.4 % $ 36,190 $ 34,371 5.3 %
Gross margin percentage 61.5 % 61.9 % (0.4 ) pts 61.0 % 61.5 % (0.5 ) pts
Research and development $ 1,542 $ 1,358 13.5 % $ 4,425 $ 4,072 8.7 %
Sales and marketing $ 2,375 $ 2,383 (0.3 )% $ 7,178 $ 7,230 (0.7 )%
General and administrative $ 530 $ 562 (5.7 )% $ 1,674 $ 1,611 3.9 %
Total R&D, sales and marketing, general and administrative $ 4,447 $ 4,303 3.3 % $ 13,277 $ 12,913 2.8 %
Total as a percentage of revenue 36.4 % 37.1 % (0.7 ) pts 36.7 % 37.6 % (0.9 ) pts
Amortization of purchased intangible assets $ 89 $ 96 (7.3 )% $ 329 $ 292 12.7 %
Restructuring and other charges $ 33 $ 20 65.0 % $ 105 $ 225 (53.3 )%
Operating income as a percentage of revenue 24.1 % 23.7 % 0.4 pts 23.2 % 22.4 % 0.8 pts
Income tax percentage 15.9 % 22.1 % (6.2 ) pts 7.7 % 21.2 % (13.5 ) pts
Net income $ 2,478 $ 2,165 14.5 % $ 7,713 $ 6,124 25.9 %
Net income as a percentage of revenue 20.3 % 18.7 % 1.6 pts 21.3 % 17.8 % 3.5 pts
Earnings per share-diluted $ 0.46 $ 0.40 15.0 % $ 1.44 $ 1.13 27.4 %

Three Months Ended April 27, 2013 Compared with Three Months Ended April 28, 2012
For the third quarter of fiscal 2013, we continued to execute on our plan to deliver profitable growth over the long term by maintaining our focus on operational excellence and portfolio management. Net sales increased 5% , with net product sales increasing 5% and service revenue increasing 7% . The net product sales increase was in large part due to our acquisition of NDS, which was completed at the beginning of fiscal 2013. Total gross margin decreased by 0.4 percentage points. Operating income as a percentage of revenue increased by 0.4 percentage points, primarily as a result of our continuing focus on expense management. Diluted earnings per share increased by 15% from the prior year period, a result of both a 14% increase in net income and a decline in our diluted share count by 69 million shares. Net income for the third quarter of fiscal 2013 benefited from a lower effective tax rate.
For the third quarter of fiscal 2013, as compared with the prior year period, net sales increased by $0.6 billion . The Americas contributed the majority of the increase led by a sales increase in the United States. APJC was flat, while EMEA experienced a slight decline.
For the third quarter of fiscal 2013, as compared with the prior year period, net product sales and service revenue increased by $0.5 billion and $0.2 billion , respectively. The product sales increase was driven by the following: an increase of $0.3 billion from Service Provider Video products driven in large part by the acquisition of NDS at the beginning of fiscal 2013; an increase of $0.2 billion from Data Center products, due to continued strong customer demand, and an increase of $0.1 billion from Wireless products, due to continued demand for these solutions. These net product sales increases, along with the service revenue contribution, reflect, in our view, the success we are experiencing with our technology architectures and our ability to deliver customer solutions, particularly in both the enterprise and service provider data center and cloud environments.
These increases were partially offset by net product sales decreases in our Switching, Security, and Collaboration product categories. In addition, sales in our Other Products category decreased by $0.1 billion due in large part to the sale of our Linksys product line which was completed in the third quarter of fiscal 2013.
In summary, during the third quarter of fiscal 2013, we continued to execute on our plan to deliver profitable growth over the long term. We did so even as we continued to experience the global macroeconomic challenges we have faced in recent quarters including, in particular, weakness in the European economy, global public sector spending, and a conservative approach to IT-related capital spending by customers.
Nine Months Ended April 27, 2013 Compared with Nine Months Ended April 28, 2012
Net sales increased 5% , with net product sales increasing 4% and service revenue increasing 10% . The increase in net product sales was due in large part to our acquisition of NDS. We achieved net sales increases in our Americas and APJC geographic segments, while net sales in our EMEA geographic segment declined. Total gross margin decreased by 0.5 percentage points. As a percentage of revenue, research and development, sales and marketing, and general and administrative expenses collectively declined by 0.9 percentage points primarily due to lower sales and marketing expenses. Operating income as a percentage of revenue increased by 0.8 percentage points, primarily as a result of lower restructuring charges and our continuing focus on expense management.
Diluted earnings per share increased by 27% from the prior year, a result of both a 26% increase in net income and a decline by our diluted share count of 57 million shares. A significant portion of the increase in net income was attributable to total tax benefits of $1.1 billion , primarily related to a tax settlement with the IRS, the reinstatement of the U.S. federal R&D tax credit, and lapses of the time period for assessment of tax in certain foreign jurisdictions.
Strategy and Focus Areas
Our focus continues to be on our five foundational priorities:
We believe that focusing on these priorities best positions us to continue to expand our share of our customers' information technology spending.
43
• Leadership in our core business (routing, switching, and associated services), which includes comprehensive security and mobility solutions
• Collaboration • Data center virtualization and cloud • Video • Architectures for business transformation
We continue to undergo product transitions in our core business, including the introduction of next-generation products with higher price performance and architectural advantages compared with both our prior generation of products and the product offerings of our competitors. We believe that many of these product transitions are gaining momentum based on the strong year-over-year product revenue growth across these next-generation product families. We believe that our strategy and our ability to innovate and execute may enable us to improve our relative competitive position in many of our product areas even in uncertain or difficult business conditions and, therefore, may continue to provide us with long-term growth opportunities. However, we believe that these newly introduced products may continue to negatively impact product gross margins, which we are currently striving to address through various initiatives, including value engineering; effective supply chain management; and delivering greater customer value through offers that include hardware, software, and services.
We continue to seek to capitalize on market transitions, which we believe will continue to come at an increasing pace. Market transitions relating to the network are becoming, in our view, more significant as intelligent networks have moved from being a mere cost center issue-that is, where the focus is on reducing network operating costs and increasing network-related productivity-to becoming, additionally and increasingly, a platform for improved revenue generation as well as driving business agility and strategy execution.
Market transitions for which we are primarily focused include those related to the increased role of virtualization/the cloud, video, collaboration, networked mobility technologies, the transition from Internet Protocol Version 4 to Internet Protocol Version 6, and the Internet of Everything. For example, a market in which a significant market transition is underway is the enterprise data center market, where a transition to virtualization/the cloud is rapidly evolving. There is a continued growing awareness that intelligent networks are becoming the platform for productivity improvement and global competitiveness. We believe that disruption in the enterprise data center market is accelerating, due to changing technology trends such as the increasing adoption of virtualization, the rise in scalable processing, and the advent of cloud computing and cloud-based IT resource deployments and business models. These key terms are defined as follows:
This virtualization and cloud-driven market transition in the enterprise data center market is being brought about through the convergence of networking, computing, storage, and software technologies. We are seeking to take advantage of this market transition through, among other things, our Cisco Unified Computing System platform and Cisco Nexus product families, which are designed to integrate the previously siloed technologies in the enterprise data center with a unified architecture. We are also seeking to capitalize on this market transition through the development of other cloud-based product and service offerings through which we intend to enable customers to develop and deploy their own cloud-based IT solutions, including software-as-a-service (“SaaS”) and other-as-a-service (“XaaS”) solutions.
The competitive landscape in the enterprise data center market is changing. Very large, well-financed, and aggressive competitors are each bringing their own new class of products to address this new market. We expect this competitive market trend to continue. With respect to this market, we believe the network will be the intersection of innovation through an open ecosystem and standards. We expect to see acquisitions, further industry consolidation, and new alliances among companies as they seek to serve the enterprise data center market. As we enter this next market phase, we expect that we will strengthen certain strategic alliances, compete more with certain strategic alliances and partners, and perhaps also encounter new competitors in our attempt to deliver the best solutions for our customers.
We believe that the architectural approach that we have undertaken in the enterprise data center market is adaptable to other markets. An example of a market where we aim to apply this approach is mobility, where growth of IP traffic on handheld devices is driving the need for more robust architectures, equipment and services in order to accommodate not only an increasing number of worldwide mobile device users, but also increased user demand for broadband-quality business network and consumer web applications to be delivered on such devices. A key term in this mobility-centered market transition is “BYOD,” an acronym for “bring your own device,” which in the context of IT usage in companies, universities, and other organizations refers to the growing trend of employees, customers, students, and others associated with such entities to bring and use their own laptop computers, smartphones, tablets or other mobile devices for their work or participation, instead of using equipment provided by the organization.
44
• Virtualization: Refers to the process of creating a virtual, or nonphysical, version of a device or resource, such as a server, storage device, network or an operating system, in such a way that human users as well as other devices and resources are able to interact with the virtual resource as if it were an actual physical resource. For example, one type of virtualization is server or data center virtualization, which consists of aggregating the current siloed data center resources into unified, shared resource pools that can be dynamically delivered to applications on demand, thus enabling the ability to move content and applications between devices and the network.
• The cloud: Refers to an information technology hosting and delivery system in which resources, such as servers or software applications, are no longer tethered to a user's physical infrastructure but instead are delivered to and consumed by the user “on demand” as an Internet-based service, whether singularly or with multiple other users simultaneously.

With regard to this market transition, to help such organizations meet the demands of increasing BYOD usage, our product development strategy involves a comprehensive architectural approach that will allow for, among other things, a unified security policy across the whole organization; a simplified operations and network management structure that understands application performance from a user's perspective, enhances troubleshooting capability and lowers network operating costs; and an uncompromised user experience over the organization's entire wireless and wired network that embraces use of any kind of device. Our mobility-related products and solutions reflect this architectural-based approach.
Other market transitions on which we are focusing particular attention include those related to the convergence of video, collaboration, and networked mobility technologies, which we believe will drive productivity and growth in network loads and which convergence appears to be evolving even more quickly and more significantly than we had previously anticipated. Cisco TelePresence systems are one example of product offerings that have incorporated video, collaboration, and networked mobility technologies, as customers evolve their communications and business models. More generally, we are focused on simplifying and expanding the creation, distribution, and use of end-to-end video solutions for businesses and consumers.
A market transition on which we are focusing is the move toward more programmable, flexible, and virtual networks, sometimes called Software Defined Networking, or SDN. This move to network programmability encompasses technologies such as SDN and is focused on moving from a hardware-centric approach for networking to a virtualized network environment that is designed to enable flexible, application-driven customization of network infrastructures. We believe the successful products and solutions in this market will combine application-specific-integrated-circuits (“ASICs”) with hardware and software elements together to meet customers' total cost of ownership, quality, security, scalability and experience requirements. In our view, there is no single architecture that supports all customer requirements in this area. Our strategy is targeted to address a broad range of specific customer use cases, and we believe we have an effective strategy that also enables us to look to next steps that will follow the initial implementations that are underway.
We have announced our strategy to address this opportunity with the Cisco Open Network Environment, or Cisco ONE, including overlay network technology, application programming interfaces (“APIs”), and network-operation tools called agents and controllers and we have several customers in a trial phase for these solutions. In our view, this evolution is in its very early stages, but we believe we have a differentiated strategy. We intend to continue to drive internal innovation, partner for co-development, and make strategic investments to lead this evolution.
Other Key Financial Measures
The following is a summary of our other key financial measures for the third quarter and first nine months of fiscal 2013 (in millions, except days sales outstanding in accounts receivable (“DSO”) and annualized inventory turns):
45
April 27,
2013 July 28,
2012
Cash and cash equivalents and investments $47,388 $48,716
Deferred revenue $12,685 $12,880
DSO 37 days 34 days
Inventories $1,469 $1,663
Annualized inventory turns 12.4 11.7
Nine Months Ended
April 27,
2013 April 28,
2012
Cash provided by operating activities $8,908 $8,403
Repurchases of common stock - stock repurchase program $1,613 $2,560
Dividends $2,392 $1,076
CRITICAL ACCOUNTING ESTIMATES
The preparation of financial statements and related disclosures in conformity with accounting principles generally accepted in the United States requires us to make judgments, assumptions, and estimates that affect the amounts reported in the Consolidated Financial Statements and accompanying notes. Note 2 to the Consolidated Financial Statements in our Annual Report on Form 10-K for the year ended July 28, 2012, as updated as applicable in Note 2 to the Consolidated Financial Statements herein, describes the significant accounting policies and methods used in the preparation of the Consolidated Financial Statements. The accounting policies described below are significantly affected by critical accounting estimates. Such accounting policies require significant judgments, assumptions, and estimates used in the preparation of the Consolidated Financial Statements, and actual results could differ materially from the amounts reported based on these policies.
Revenue Recognition
Revenue is recognized when all of the following criteria have been met:
In instances where final acceptance of the product, system, or solution is specified by the customer, revenue is deferred until all acceptance criteria have been met. When a sale involves multiple deliverables, such as sales of products that include services, the multiple deliverables are evaluated to determine the unit of accounting, and the entire fee from the arrangement is allocated to each unit of accounting based on the relative selling price. Revenue is recognized when the revenue recognition criteria for each unit of accounting are met.
The amount of product and service revenue recognized in a given period is affected by our judgment as to whether an arrangement includes multiple deliverables and, if so, our valuation of the units of accounting for multiple deliverables. According to the accounting guidance prescribed in Accounting Standards Codification (“ASC”) 605, Revenue Recognition , we use vendor-specific objective evidence of selling price (“VSOE”) for each of those units, when available. We determine VSOE based on our normal pricing and discounting practices for the specific product or service when sold separately. In determining VSOE, we require that a substantial majority of the historical standalone transactions have the selling prices for a product or service fall within a reasonably narrow pricing range, generally evidenced by approximately 80% of such historical standalone transactions falling within plus or minus 15% of the median rates. When VSOE does not exist, we apply the selling price hierarchy to applicable multiple-deliverable arrangements. Under the selling price hierarchy, third-party evidence of selling price (“TPE”) will be considered if VSOE does not exist, and estimated selling price (“ESP”) will be used if neither VSOE nor TPE is available. Generally, we are not able to determine TPE because our go-to-market strategy differs from that of others in our markets, and the extent of our proprietary technology varies among comparable products or services from those of our peers. In determining ESP, we apply significant judgment as we weigh a variety of factors, based on the facts and circumstances of the arrangement. We typically arrive at an ESP for a product or service that is not sold separately by considering company-specific factors such as geographies, competitive landscape, internal costs, profitability objectives, pricing practices used to establish bundled pricing, and existing portfolio pricing and discounting.
Some of our sales arrangements have multiple deliverables containing software and related software support components. Such sales arrangements are subject to the accounting guidance in ASC 985-605, Software-Revenue Recognition .
As our business and offerings evolve over time, our pricing practices may be required to be modified accordingly, which could result in changes in selling prices, including both VSOE and ESP, in subsequent periods. There were no material impacts during the quarter nor do we currently expect a material impact in the next twelve months on our revenue recognition due to any changes in our VSOE, TPE, or ESP.
Revenue deferrals relate to the timing of revenue recognition for specific transactions based on financing arrangements, service, support, and other factors. Financing arrangements may include sales-type, direct-financing, and operating leases, loans, and guarantees of third-party financing. Our deferred revenue for products was $4.0 billion and $3.7 billion as of April 27, 2013 and July 28, 2012, respectively. Technical support services revenue is deferred and recognized ratably over the period during which the services are to be performed, which typically is from one to three years. Advanced services revenue is recognized upon delivery or completion of performance. Our deferred revenue for services was $8.7 billion and $9.2 billion as of April 27, 2013 and July 28, 2012, respectively.
46
• Persuasive evidence of an arrangement exists. Contracts, Internet commerce agreements, and customer purchase orders are generally used to determine the existence of an arrangement.
• Delivery has occurred. Shipping documents and customer acceptance, when applicable, are used to verify delivery.
• The fee is fixed or determinable. We assess whether the fee is fixed or determinable based on the payment terms associated with the transaction and whether the sales price is subject to refund or adjustment.
• Collectibility is reasonably assured. We assess collectibility based primarily on the creditworthiness of the customer as determined by credit checks and analysis, as well as the customer's payment history.
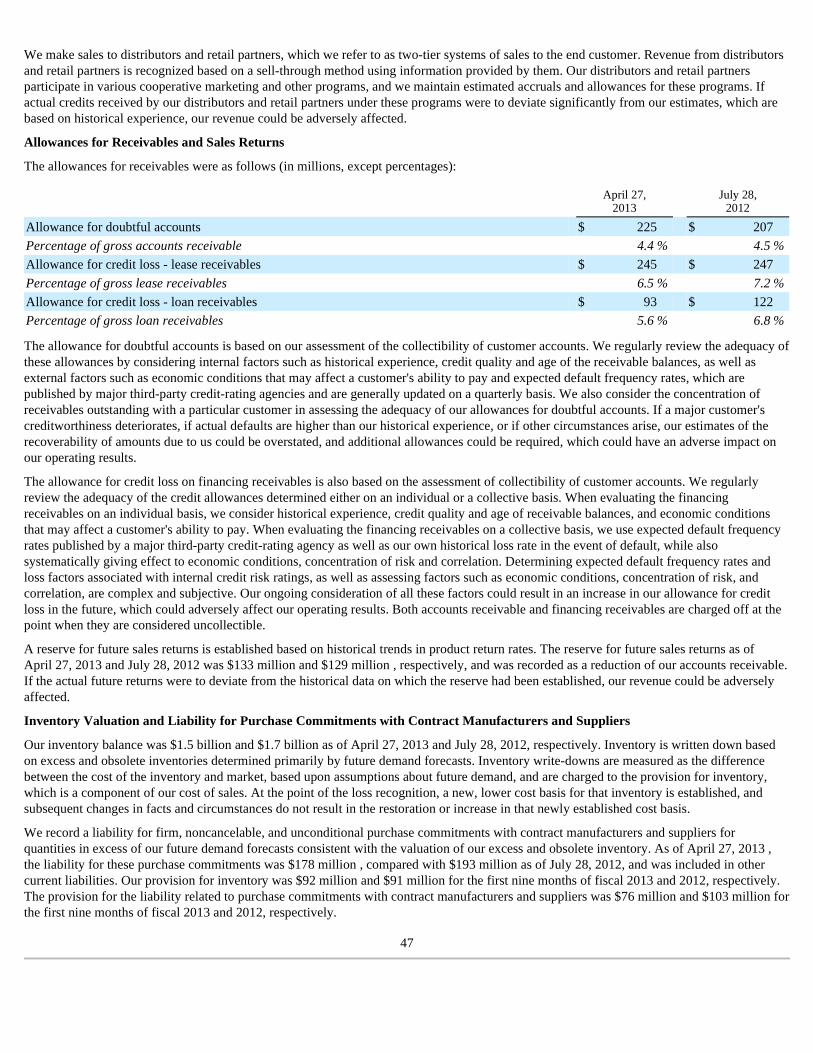
We make sales to distributors and retail partners, which we refer to as two-tier systems of sales to the end customer. Revenue from distributors and retail partners is recognized based on a sell-through method using information provided by them. Our distributors and retail partners participate in various cooperative marketing and other programs, and we maintain estimated accruals and allowances for these programs. If actual credits received by our distributors and retail partners under these programs were to deviate significantly from our estimates, which are based on historical experience, our revenue could be adversely affected.
Allowances for Receivables and Sales Returns
The allowances for receivables were as follows (in millions, except percentages):
The allowance for doubtful accounts is based on our assessment of the collectibility of customer accounts. We regularly review the adequacy of these allowances by considering internal factors such as historical experience, credit quality and age of the receivable balances, as well as external factors such as economic conditions that may affect a customer's ability to pay and expected default frequency rates, which are published by major third-party credit-rating agencies and are generally updated on a quarterly basis. We also consider the concentration of receivables outstanding with a particular customer in assessing the adequacy of our allowances for doubtful accounts. If a major customer's creditworthiness deteriorates, if actual defaults are higher than our historical experience, or if other circumstances arise, our estimates of the recoverability of amounts due to us could be overstated, and additional allowances could be required, which could have an adverse impact on our operating results.
The allowance for credit loss on financing receivables is also based on the assessment of collectibility of customer accounts. We regularly review the adequacy of the credit allowances determined either on an individual or a collective basis. When evaluating the financing receivables on an individual basis, we consider historical experience, credit quality and age of receivable balances, and economic conditions that may affect a customer's ability to pay. When evaluating the financing receivables on a collective basis, we use expected default frequency rates published by a major third-party credit-rating agency as well as our own historical loss rate in the event of default, while also systematically giving effect to economic conditions, concentration of risk and correlation. Determining expected default frequency rates and loss factors associated with internal credit risk ratings, as well as assessing factors such as economic conditions, concentration of risk, and correlation, are complex and subjective. Our ongoing consideration of all these factors could result in an increase in our allowance for credit loss in the future, which could adversely affect our operating results. Both accounts receivable and financing receivables are charged off at the point when they are considered uncollectible.
A reserve for future sales returns is established based on historical trends in product return rates. The reserve for future sales returns as of April 27, 2013 and July 28, 2012 was $133 million and $129 million , respectively, and was recorded as a reduction of our accounts receivable. If the actual future returns were to deviate from the historical data on which the reserve had been established, our revenue could be adversely affected.
Inventory Valuation and Liability for Purchase Commitments with Contract Manufacturers and Suppliers
Our inventory balance was $1.5 billion and $1.7 billion as of April 27, 2013 and July 28, 2012, respectively. Inventory is written down based on excess and obsolete inventories determined primarily by future demand forecasts. Inventory write-downs are measured as the difference between the cost of the inventory and market, based upon assumptions about future demand, and are charged to the provision for inventory, which is a component of our cost of sales. At the point of the loss recognition, a new, lower cost basis for that inventory is established, and subsequent changes in facts and circumstances do not result in the restoration or increase in that newly established cost basis.
We record a liability for firm, noncancelable, and unconditional purchase commitments with contract manufacturers and suppliers for quantities in excess of our future demand forecasts consistent with the valuation of our excess and obsolete inventory. As of April 27, 2013 , the liability for these purchase commitments was $178 million , compared with $193 million as of July 28, 2012, and was included in other current liabilities. Our provision for inventory was $92 million and $91 million for the first nine months of fiscal 2013 and 2012, respectively. The provision for the liability related to purchase commitments with contract manufacturers and suppliers was $76 million and $103 million for the first nine months of fiscal 2013 and 2012, respectively.
47
April 27,
2013 July 28,
2012
Allowance for doubtful accounts $ 225 $ 207 Percentage of gross accounts receivable 4.4 % 4.5 %
Allowance for credit loss - lease receivables $ 245 $ 247 Percentage of gross lease receivables 6.5 % 7.2 %
Allowance for credit loss - loan receivables $ 93 $ 122 Percentage of gross loan receivables 5.6 % 6.8 %

If there were to be a sudden and significant decrease in demand for our products, or if there were a higher incidence of inventory obsolescence because of rapidly changing technology and customer requirements, we could be required to increase our inventory write-downs, and our liability for purchase commitments with contract manufacturers and suppliers, and accordingly our profitability could be adversely affected. We regularly evaluate our exposure for inventory write-downs and the adequacy of our liability for purchase commitments. Inventory and supply chain management remain areas of focus as we balance the need to maintain supply chain flexibility to help ensure competitive lead times with the risk of inventory obsolescence, particularly in light of current macroeconomic uncertainties and conditions and the resulting potential for changes in future demand forecast.
Warranty Costs
The liability for product warranties, included in other current liabilities, was $431 million as of April 27, 2013 , compared with $415 million as of July 28, 2012. See Note 12 to the Consolidated Financial Statements. Our products are generally covered by a warranty for periods ranging from 90 days to five years, and for some products we provide a limited lifetime warranty. We accrue for warranty costs as part of our cost of sales based on associated material costs, technical support labor costs, and associated overhead. Material cost is estimated based primarily upon historical trends in the volume of product returns within the warranty period and the cost to repair or replace the equipment. Technical support labor cost is estimated based primarily upon historical trends in the rate of customer cases and the cost to support the customer cases within the warranty period. Overhead cost is applied based on estimated time to support warranty activities.
The provision for product warranties issued during the first nine months of fiscal 2013 and 2012 was $494 million and $474 million , respectively. The increase in the provision for warranties was primarily due to increased shipment volume of products. If we experience an increase in warranty claims compared with our historical experience, or if the cost of servicing warranty claims is greater than expected, our profitability could be adversely affected.
Share-Based Compensation Expense
Share-based compensation expense is presented as follows (in millions):
Restricted stock units are valued using the market value of our common stock on the date of grant, discounted for the present value of expected dividends. Restricted stock unit awards with market-based conditions are valued using a Monte Carlo simulation. See Note 14 to the Consolidated Financial Statements.
The determination of the fair value of employee stock options and employee stock purchase rights on the date of grant using an option-pricing model is affected by our stock price as well as assumptions regarding a number of highly complex and subjective variables. For employee stock options and employee stock purchase rights, these variables include, but are not limited to, the expected stock price volatility over the term of the awards, the risk-free interest rate, and expected dividends as of the grant date. For employee stock options, we historically have used the implied volatility for two-year traded options on our stock as the expected volatility assumption required in the lattice-binomial model. For employee stock purchase rights, we used the implied volatility for traded options (with lives corresponding to the expected life of the employee stock purchase rights) on our stock. The selection of the implied volatility approach was based upon the availability of actively traded options on our stock and our assessment that implied volatility is more representative of future stock price trends than historical volatility. The valuation of employee stock options is also impacted by kurtosis and skewness, which are technical measures of the distribution of stock price returns and the actual and projected employee stock option exercise behaviors.
Because share-based compensation expense is based on awards ultimately expected to vest, it has been reduced for forfeitures. If factors change and we employ different assumptions in the application of our option-pricing model in future periods or if we experience different forfeiture rates, the compensation expense that is derived may differ significantly from what we have recorded in the current period.
Fair Value Measurements
Our fixed income and publicly traded equity securities, collectively, are reflected in the Consolidated Balance Sheets at a fair value of $42.3 billion as of April 27, 2013 , compared with $38.9 billion as of July 28, 2012. Our fixed income investment portfolio, as of April 27, 2013 , consisted primarily of high-quality investment-grade securities. See Note 8 to the Consolidated Financial Statements.
48
Nine Months Ended
April 27,
2013 April 28,
2012 Variance
Share-based compensation expense $ 880 $ 1,032 $ (152 )

As described more fully in Note 9 to the Consolidated Financial Statements, a valuation hierarchy is based on the level of independent, objective evidence available regarding the value of the investments. It encompasses three classes of investments: Level 1 consists of securities for which there are quoted prices in active markets for identical securities; Level 2 consists of securities for which observable inputs other than Level 1 inputs are used, such as quoted prices for similar securities in active markets or quoted prices for identical securities in less active markets and model-derived valuations for which the variables are derived from, or corroborated by, observable market data; and Level 3 consists of securities for which there are unobservable inputs to the valuation methodology that are significant to the measurement of the fair value.
Our Level 2 securities are valued using quoted market prices for similar instruments or nonbinding market prices that are corroborated by observable market data. We use inputs such as actual trade data, benchmark yields, broker/dealer quotes, and other similar data, which are obtained from independent pricing vendors, quoted market prices, or other sources to determine the ultimate fair value of our assets and liabilities. We use such pricing data as the primary input, to which we have not made any material adjustments during fiscal 2013 and fiscal 2012, to make our assessments and determinations as to the ultimate valuation of our investment portfolio. We are ultimately responsible for the financial statements and underlying estimates.
The inputs and fair value are reviewed for reasonableness, may be further validated by comparison to publicly available information, and could be adjusted based on market indices or other information that management deems material to its estimate of fair value. The assessment of fair value can be difficult and subjective. However, given the relative reliability of the inputs we use to value our investment portfolio, and because substantially all of our valuation inputs are obtained using quoted market prices for similar or identical assets, we do not believe that the nature of estimates and assumptions affected by levels of subjectivity and judgment was material to the valuation of the investment portfolio as of April 27, 2013 . We had no Level 3 investments in our total portfolio as of April 27, 2013 .
Other-than-Temporary Impairments
We recognize an impairment charge when the declines in the fair values of our fixed income or publicly traded equity securities below their cost basis are judged to be other than temporary. The ultimate value realized on these securities, to the extent unhedged, is subject to market price volatility until they are sold.
If the fair value of a debt security is less than its amortized cost, we assess whether the impairment is other than temporary. An impairment is considered other than temporary if (i) we have the intent to sell the security, (ii) it is more likely than not that we will be required to sell the security before recovery of its entire amortized cost basis, or (iii) we do not expect to recover the entire amortized cost of the security. If an impairment is considered other than temporary based on (i) or (ii) described in the prior sentence, the entire difference between the amortized cost and the fair value of the security is recognized in earnings. If an impairment is considered other than temporary based on condition (iii), the amount representing credit loss, defined as the difference between the present value of the cash flows expected to be collected and the amortized cost basis of the debt security, will be recognized in earnings, and the amount relating to all other factors will be recognized in other comprehensive income (“OCI”). In estimating the amount and timing of cash flows expected to be collected, we consider all available information, including past events, current conditions, the remaining payment terms of the security, the financial condition of the issuer, expected defaults, and the value of underlying collateral.
For publicly traded equity securities, we consider various factors in determining whether we should recognize an impairment charge, including the length of time and extent to which the fair value has been less than our cost basis, the financial condition and near-term prospects of the issuer, and our intent and ability to hold the investment for a period of time sufficient to allow for any anticipated recovery in market value.
There were no impairment charges on our investments in publicly traded equity securities and fixed income securities in the first nine months of fiscal 2013 and fiscal 2012. Our ongoing consideration of all the factors described previously could result in additional impairment charges in the future, which could adversely affect our net income.
We also have investments in privately held companies, some of which are in the startup or development stages. As of April 27, 2013 , our investments in privately held companies were $835 million , compared with $858 million as of July 28, 2012, and were included in other assets. See Note 6 to the Consolidated Financial Statements. We monitor these investments for events or circumstances indicative of potential impairment, and we will make appropriate reductions in carrying values if we determine that an impairment charge is required, based primarily on the financial condition and near-term prospects of these companies. These investments are inherently risky because the markets for the technologies or products these companies are developing are typically in the early stages and may never materialize. Our impairment charges on investments in privately held companies were $23 million and $17 million for the first nine months of fiscal 2013 and 2012, respectively.
49

Goodwill and Purchased Intangible Asset Impairments
Our methodology for allocating the purchase price relating to purchase acquisitions is determined through established valuation techniques. Goodwill represents a residual value as of the acquisition date, which in most cases results in measuring goodwill as an excess of the purchase consideration transferred plus the fair value of any noncontrolling interest in the acquired company over the fair value of net assets acquired, including contingent consideration. We perform goodwill impairment tests on an annual basis in the fourth fiscal quarter and between annual tests in certain circumstances for each reporting unit. The assessment of fair value for goodwill and purchased intangible assets is based on factors that market participants would use in an orderly transaction in accordance with the new accounting guidance for the fair value measurement of nonfinancial assets.
The goodwill recorded in the Consolidated Balance Sheets as of April 27, 2013 and July 28, 2012 was $21.6 billion and $17.0 billion , respectively. The increase in goodwill for the first nine months of fiscal 2013 was due in large part to our acquisitions of NDS and Meraki. In response to changes in industry and market conditions, we could be required to strategically realign our resources and consider restructuring, disposing of, or otherwise exiting businesses, which could result in an impairment of goodwill. There was no impairment of goodwill in the first nine months of fiscal 2013 and 2012.
We make judgments about the recoverability of purchased intangible assets with finite lives whenever events or changes in circumstances indicate that an impairment may exist. Recoverability of purchased intangible assets with finite lives is measured by comparing the carrying amount of the asset to the future undiscounted cash flows the asset is expected to generate. We review indefinite-lived intangible assets for impairment annually or whenever events or changes in circumstances indicate the carrying value may not be recoverable. Recoverability of indefinite-lived intangible assets is measured by comparing the carrying amount of the asset to the future discounted cash flows the asset is expected to generate. If the asset is considered to be impaired, the amount of any impairment is measured as the difference between the carrying value and the fair value of the impaired asset. Assumptions and estimates about future values and remaining useful lives of our purchased intangible assets are complex and subjective. They can be affected by a variety of factors, including external factors such as industry and economic trends and internal factors such as changes in our business strategy and our internal forecasts. There were no impairment charges related to purchased intangible assets for the first nine months of fiscal 2013 and 2012. Our ongoing consideration of all the factors described previously could result in additional impairment charges in the future, which could adversely affect our net income.
Income Taxes
We are subject to income taxes in the United States and numerous foreign jurisdictions. Our effective tax rates differ from the statutory rate, primarily due to the tax impact of state taxes, foreign operations, research and development (“R&D”) tax credits, tax audit settlements, nondeductible compensation, international realignments, and transfer pricing adjustments. Our effective tax rate was 15.9% and 22.1% in the third quarter of fiscal 2013 and 2012, respectively. Our effective tax rate was 7.7% and 21.2% for the first nine months of fiscal 2013 and 2012, respectively.
Significant judgment is required in evaluating our uncertain tax positions and determining our provision for income taxes. Although we believe our reserves are reasonable, no assurance can be given that the final tax outcome of these matters will not be different from that which is reflected in our historical income tax provisions and accruals. We adjust these reserves in light of changing facts and circumstances, such as the closing of a tax audit or the refinement of an estimate. To the extent that the final tax outcome of these matters is different than the amounts recorded, such differences will impact the provision for income taxes in the period in which such determination is made. The provision for income taxes includes the impact of reserve provisions and changes to reserves that are considered appropriate, as well as the related net interest and penalties.
Significant judgment is also required in determining any valuation allowance recorded against deferred tax assets. In assessing the need for a valuation allowance, we consider all available evidence, including past operating results, estimates of future taxable income, and the feasibility of tax planning strategies. In the event that we change our determination as to the amount of deferred tax assets that can be realized, we will adjust our valuation allowance with a corresponding impact to the provision for income taxes in the period in which such determination is made.
Our provision for income taxes is subject to volatility and could be adversely impacted by earnings being lower than anticipated in countries that have lower tax rates and higher than anticipated in countries that have higher tax rates; by changes in the valuation of our deferred tax assets and liabilities; by expiration of or lapses in the R&D tax credit laws; by expiration of or lapses in tax incentives; by transfer pricing adjustments, including the effect of acquisitions on our intercompany R&D cost-sharing arrangement and legal structure; by tax effects of nondeductible compensation; by tax costs related to intercompany realignments; by changes in accounting principles; or by changes in tax laws and regulations, including possible U.S. changes to the taxation of earnings of our foreign subsidiaries, the deductibility of expenses attributable to foreign income, or the foreign tax credit rules. Significant judgment is required to determine the recognition and measurement attributes prescribed in the accounting guidance for uncertainty in income taxes. The accounting guidance for uncertainty in income taxes applies to all income tax positions, including the potential recovery of previously paid taxes, which if settled unfavorably could adversely impact our provision for income taxes or additional paid-in capital.
50

Further, as a result of certain of our ongoing employment and capital investment actions and commitments, our income in certain countries is subject to reduced tax rates and in some cases is wholly exempt from tax. Our failure to meet these commitments could adversely impact our provision for income taxes. In addition, we are subject to the continuous examination of our income tax returns by the IRS and other tax authorities. We regularly assess the likelihood of adverse outcomes resulting from these examinations to determine the adequacy of our provision for income taxes. There can be no assurance that the outcomes from these continuous examinations will not have an adverse impact on our operating results and financial condition.
Loss Contingencies
We are subject to the possibility of various losses arising in the ordinary course of business. We consider the likelihood of loss or impairment of an asset or the incurrence of a liability, as well as our ability to reasonably estimate the amount of loss, in determining loss contingencies. An estimated loss contingency is accrued when it is probable that an asset has been impaired or a liability has been incurred and the amount of loss can be reasonably estimated. We regularly evaluate current information available to us to determine whether such accruals should be adjusted and whether new accruals are required.
Third parties, including customers, have in the past and may in the future assert claims or initiate litigation related to exclusive patent, copyright, trademark, and other intellectual property rights to technologies and related standards that are relevant to us. These assertions have increased over time as a result of our growth and the general increase in the pace of patent claims assertions, particularly in the United States. If any infringement or other intellectual property claim made against us by any third party is successful, or if we fail to develop non-infringing technology or license the proprietary rights on commercially reasonable terms and conditions, our business, operating results, and financial condition could be materially and adversely affected.
RESULTS OF OPERATIONS
Net Sales
The following table presents the breakdown of net sales between product and service revenue (in millions, except percentages):
We manage our business primarily on a geographic basis, organized into three geographic segments. Our net sales, which include product and service revenue for each segment, are summarized in the following table (in millions, except percentages):
51
Three Months Ended Nine Months Ended
April 27,
2013 April 28,
2012 Variance in Dollars
Variance in Percent
April 27, 2013
April 28, 2012
Variance in Dollars
Variance in Percent
Net sales:
Product $ 9,559 $ 9,106 $ 453 5.0 % $ 28,293 $ 27,176 $ 1,117 4.1 %
Percentage of net sales 78.2 % 78.6 % 78.2 % 79.1 %
Service 2,657 2,482 175 7.1 % 7,897 7,195 702 9.8 %
Percentage of net sales 21.8 % 21.4 % 21.8 % 20.9 %
Total $ 12,216 $ 11,588 $ 628 5.4 % $ 36,190 $ 34,371 $ 1,819 5.3 %
Three Months Ended Nine Months Ended
April 27,
2013 April 28,
2012 Variance in Dollars
Variance in Percent
April 27, 2013
April 28, 2012
Variance in Dollars
Variance in Percent
Net sales: Americas $ 7,127 $ 6,466 $ 661 10.2 % $ 21,286 $ 19,606 $ 1,680 8.6 %
Percentage of net sales 58.4 % 55.8 % 58.9 % 57.0 % EMEA 3,131 3,160 (29 ) (0.9 )% 9,065 9,255 (190 ) (2.1 )%
Percentage of net sales 25.6 % 27.3 % 25.0 % 27.0 % APJC 1,958 1,962 (4 ) (0.2 )% 5,839 5,510 329 6.0 %
Percentage of net sales 16.0 % 16.9 % 16.1 % 16.0 %
Total $ 12,216 $ 11,588 $ 628 5.4 % $ 36,190 $ 34,371 $ 1,819 5.3 %

Three Months Ended April 27, 2013 Compared with Three Months Ended April 28, 2012
For the third quarter of fiscal 2013, as compared with the third quarter of fiscal 2012, net sales increased by 5% . Net product sales increased by 5% , while service revenue increased by 7% . Net product sales reflected growth in our Americas and APJC geographic segments, while net product sales declined in the EMEA segment. Service revenues increased in our Americas and EMEA geographic segments, while service revenue decreased in our APJC segment.
Nine Months Ended April 27, 2013 Compared with Nine Months Ended April 28, 2012
For the first nine months of fiscal 2013, as compared with the first nine months of fiscal 2012, net sales increased by 5% . Net product sales increased by 4% , while service revenue increased by 10% . The increase in net product sales reflected growth in our Americas and APJC geographic segments, while net product sales declined in the EMEA segment. Service revenues increased across all of our geographic segments.
We conduct business globally in numerous currencies. The direct effect of foreign currency fluctuations on sales has not been material because our sales are primarily denominated in U.S. dollars. However, if the U.S. dollar strengthens relative to other currencies, such strengthening could have an indirect effect on our sales to the extent it raises the cost of our products to non-U.S. customers and thereby reduces demand. A weaker U.S. dollar could have the opposite effect. However, the precise indirect effect of currency fluctuations is difficult to measure or predict because our sales are influenced by many factors in addition to the impact of such currency fluctuations.
In addition to the impact of macroeconomic factors, including a cautious IT spending environment and budget-driven reductions in spending by government entities, net sales by segment in a particular period may be significantly impacted by several factors related to revenue recognition, including the complexity of transactions such as multiple-element arrangements; the mix of financing arrangements provided to our channel partners and customers; and final acceptance of the product, system, or solution, among other factors. In addition, certain customers tend to make large and sporadic purchases, and the net sales related to these transactions may also be affected by the timing of revenue recognition, which in turn would impact the net sales of the relevant segment. As has been the case in certain of our emerging countries from time to time, customers require greater levels of financing arrangements, service, and support, and this may occur in future periods, which may also impact the timing of the recognition of revenue. Net Product Sales by Segment
The following table presents the breakdown of net product sales by segment (in millions, except percentages):
Americas
Three Months Ended April 27, 2013 Compared with Three Months Ended April 28, 2012
Our Americas segment grew by 10% led by net product sales increases in the service provider, commercial, and enterprise markets. The growth in net product sales to the service provider market was due in part to our acquisition of NDS at the beginning of fiscal 2013. We continued to experience a decline in net product sales in the public sector market for the third quarter of fiscal 2013. From a country perspective, net product sales increased by 12% in the United States and 20% in Brazil. Net product sales in Canada and Mexico declined by 10% and 5%, respectively, compared with the corresponding period of fiscal 2012.
52
Three Months Ended Nine Months Ended
April 27,
2013 April 28,
2012 Variance in Dollars
Variance in Percent
April 27, 2013
April 28, 2012
Variance in Dollars
Variance in Percent
Net product sales: Americas $ 5,364 $ 4,889 $ 475 9.7 % $ 16,067 $ 14,919 $ 1,148 7.7 %
Percentage of net product sales 56.1 % 53.7 % 56.8 % 54.9 % EMEA 2,590 2,639 (49 ) (1.9 )% 7,469 7,758 (289 ) (3.7 )%
Percentage of net product sales 27.1 % 29.0 % 26.4 % 28.5 % APJC 1,605 1,578 27 1.7 % 4,757 4,499 258 5.7 %
Percentage of net product sales 16.8 % 17.3 % 16.8 % 16.6 %
Total $ 9,559 $ 9,106 $ 453 5.0 % $ 28,293 $ 27,176 $ 1,117 4.1 %

Nine Months Ended April 27, 2013 Compared with Nine Months Ended April 28, 2012
The increase in net product sales in the Americas segment was led by growth in the service provider, commercial and enterprise markets. The growth in net product sales to the service provider market was due in part to our acquisition of NDS at the beginning of fiscal 2013. We experienced a decline in net product sales to the public sector market for the first nine months of fiscal 2013 due in large part to lower net product sales to the U.S. public sector. From a country perspective, net product sales increased by 10% in both the United States and Brazil, and 4% in Mexico. These increases were partially offset by a net product sales decline of 10% in Canada.
EMEA
Three Months Ended April 27, 2013 Compared with Three Months Ended April 28, 2012
Net product sales in the EMEA segment decreased slightly as the decline in the enterprise market was partially offset by net product sales increases in the commercial and service provider markets, which included sales of NDS products. Net product sales were flat in the public sector market. From a country perspective, net product sales decreased by 12% in the Netherlands, 9% in Russia, 6% in Germany, and 3% in France. Partially offsetting these declines were net product sales increases of 21% in Italy and 4% in the United Kingdom.
Nine Months Ended April 27, 2013 Compared with Nine Months Ended April 28, 2012
The decrease in EMEA net product sales was attributable to declines in the enterprise, public sector and service provider markets. Sales to the commercial market were relatively flat. From a country perspective, net product sales decreased by 17% in the Netherlands, 3% in the United Kingdom, 7% in Germany, 6% France, and 12% in Italy. Partially offsetting these product sales declines was an 8% increase in net product sales in Russia.
APJC
Three Months Ended April 27, 2013 Compared with Three Months Ended April 28, 2012
The increase in net product sales in the APJC segment was led by net product sales growth in the commercial market and, to a lesser degree, in the service provider and public sector markets. The growth in the service provider market was due in large part to our acquisition of NDS. These product sales increases were partially offset by a decrease in net product sales in the enterprise market. From a country perspective, net product sales increased by 27% in India and 1% in Australia, partially offset by net product sales declines of 14% in Japan and 5% in China.
Nine Months Ended April 27, 2013 Compared with Nine Months Ended April 28, 2012
The increase in net product sales was across most of our customer markets in the APJC segment, with growth in the public sector, service provider and commercial markets. The growth in the service provider market was due in large part to our acquisition of NDS. We experienced a net product sales decline in the enterprise market in the APJC segment. From a country perspective, net product sales increased by 35% in India and 12% in Australia, partially offset by net product sales declines of 7% in Japan and 1% in China.
53

Net Product Sales by Groups of Similar Products
In addition to the primary view on a geographic basis, we also prepare financial information related to groups of similar products and customer markets for various purposes. Our product categories consist of the following categories (with subcategories in parentheses): Switching (fixed switching, modular switching, and storage); NGN Routing (high-end routers, mid-range and low-end routers, and other NGN Routing products); Service Provider Video (connected devices, video software and solutions, cable access and NDS); Collaboration (unified communications and Cisco TelePresence); Data Center; Wireless; Security; and Other Products. The Other Products category consists primarily of emerging technology products and other networking products.
The following table presents net sales for groups of similar products (in millions, except percentages):
Certain reclassifications have been made to the prior period amounts to conform to the current period’s presentation.
Switching
Three Months Ended April 27, 2013 Compared with Three Months Ended April 28, 2012
Net product sales in our Switching product category decreased slightly primarily due to the impact of macroeconomic and public sector spending challenges. Sales of modular switches declined by 9%, or $134 million, driven by lower sales of Cisco Catalyst 6500 Series Switches, partially offset by higher sales of Cisco Nexus 7000 Series Switches. The decrease in sales of modular switches was partially offset by a 4%, or $82 million, increase in sales of LAN fixed-configuration switches resulting from higher sales of our various Cisco Nexus Series Switches in this category. Net product sales in the Switching product category were also negatively impacted by an 8% decrease in sales of storage products.
54
Three Months Ended Nine Months Ended
April 27,
2013 April 28,
2012 Variance in Dollars
Variance in Percent
April 27, 2013
April 28, 2012
Variance in Dollars
Variance in Percent
Net product sales: Switching $ 3,598 $ 3,661 $ (63 ) (1.7 )% $ 10,938 $ 10,969 $ (31 ) (0.3 )%
Percentage of net product sales 37.6 % 40.2 % 38.7 % 40.4 %
NGN Routing 2,140 2,134 6 0.3 % 6,138 6,296 (158 ) (2.5 )%
Percentage of net product sales 22.4 % 23.4 % 21.7 % 23.2 % Service Provider Video 1,299 999 300 30.0 % 3,667 2,896 771 26.6 %
Percentage of net product sales 13.6 % 11.0 % 13.0 % 10.7 %
Collaboration 1,013 1,022 (9 ) (0.9 )% 2,978 3,190 (212 ) (6.6 )%
Percentage of net product sales 10.6 % 11.2 % 10.5 % 11.7 % Data Center 515 291 224 77.0 % 1,480 883 597 67.6 %
Percentage of net product sales 5.4 % 3.2 % 5.2 % 3.2 % Wireless 523 413 110 26.6 % 1,529 1,175 354 30.1 %
Percentage of net product sales 5.5 % 4.5 % 5.4 % 4.3 % Security 327 342 (15 ) (4.4 )% 1,001 994 7 0.7 %
Percentage of net product sales 3.4 % 3.8 % 3.5 % 3.7 % Other 144 244 (100 ) (41.0 )% 562 773 (211 ) (27.3 )%
Percentage of net product sales 1.5 % 2.7 % 2.0 % 2.8 %
Total $ 9,559 $ 9,106 $ 453 5.0 % $ 28,293 $ 27,176 $ 1,117 4.1 %
Nine Months Ended April 27, 2013 Compared with Nine Months Ended April 28, 2012
Within the Switching product category, sales of LAN fixed-configuration switches increased by 3%, or $163 million, sales of modular switches decreased by 3% or $119 million, and sales of storage products decreased by 18%, or $75 million. The increase in sales of LAN fixed-configuration switches was primarily due to higher sales of Cisco Nexus Series Switches and fixed switching optics modules, partially offset by sales declines in certain of our Cisco Catalyst product families. Sales of modular switches decreased due to lower sales of Cisco Catalyst 6500 Series Switches partially offset by higher sales in Cisco Nexus 7000 Series Switches and optics modules.
NGN Routing
Three Months Ended April 27, 2013 Compared with Three Months Ended April 28, 2012
Overall, sales in our NGN Routing product category were flat, with increases in sales in our midrange and low-end router products being offset by decreases in sales of our high-end router products and other NGN Routing products. Higher sales in our midrange and low-end router products were driven by the continued adoption of our Integrated Service Routers (“ISR”) platform. Sales in high-end router products decreased by 2%, or $21 million, due to lower sales of Cisco CRS-3 Carrier Routing System products and our legacy high-end router products, partially offset by strong adoption of our Cisco Aggregation Service Routers (“ASR”) products. The decline in sales of other NGN Routing products was due to decreased sales of other routing products.
Nine Months Ended April 27, 2013 Compared with Nine Months Ended April 28, 2012
The decrease in sales of our NGN Routing product category was driven by a 3%, or $111 million, decrease in sales of high-end router products and a 12%, or $64 million, decrease in sales of other NGN Routing products. Within the high-end router products category, we experienced lower sales of our Cisco CRS-3 Carrier Routing System products and our legacy high-end router products. These decreases were partially offset by sales growth in several Cisco ASR products. The decline in sales of other NGN Routing products was due to decreased sales of other routing and optical networking products.
Service Provider Video
Three Months Ended April 27, 2013 Compared with Three Months Ended April 28, 2012
Our Service Provider Video product category grew 30% , or $300 million , primarily due to the acquisition of NDS at the beginning of fiscal 2013, which contributed a substantial majority of the total sales increase.
Nine Months Ended April 27, 2013 Compared with Nine Months Ended April 28, 2012
The increase in sales of Service Provider Video products was in large part due to the acquisition of NDS at the beginning of fiscal 2013, followed by increased sales in connected devices of 11%, or $219 million, and to a lesser degree increased sales in video software and solutions of 11%, or $21 million. The increase in sales of connected devices products was primarily due to increased sales of cable set-top boxes.
Collaboration
Three Months Ended April 27, 2013 Compared with Three Months Ended April 28, 2012 Our Collaboration category continues to shift its focus to recurring revenue streams driven by SaaS offerings. Overall, sales of Collaboration products slightly decreased primarily due to lower sales of Cisco TelePresence products. Partially offsetting this decrease was a slight increase in sales of unified communications products due mainly to higher sales of collaborative web-based offerings.
Nine Months Ended April 27, 2013 Compared with Nine Months Ended April 28, 2012
The sales decrease in our Collaboration product category was primarily due to a decline in sales of Cisco TelePresence Systems and to a lesser degree, a decline in sales of unified communications products. Lower public sector spending in the United States, as well as demand weakness in Europe during the first half of the fiscal year, were significant drivers of the decline in sales of Cisco TelePresence Systems. We also experienced a decline in sales of unified communications products which was due primarily to lower sales of unified communications infrastructure products.
Data Center
Three Months Ended April 27, 2013 Compared with Three Months Ended April 28, 2012 We continue to experience strong growth in our Data Center product category which grew 77% with strong sales growth of our Cisco Unified Computing System products across all geographic segments and customer markets. The increase was due in large part to the momentum we are experiencing with our products across all customer market segments for both data center and cloud environments as current customers increase their data center build-outs, and as new customers purchase products. The growth in our Data Center category was also positively impacted by lower than anticipated sales in the third quarter of fiscal 2012 as certain customers at that time were still evaluating our new server chip technology platform.
55

To the extent our Data Center business grows and achieves further market penetration, we expect that, in comparison to what we have experienced during the initial rapid growth of this portion of our business, the growth rates for our Data Center product sales will experience more normal seasonality consistent with the overall server market.
Nine Months Ended April 27, 2013 Compared with Nine Months Ended April 28, 2012
Sales of Data Center products increased significantly due to increased sales of Cisco Unified Computing System products. The increase was due in large part to similar factors as those affecting the three month period discussed immediately above.
Wireless, Security, and Other
Three Months Ended April 27, 2013 Compared with Three Months Ended April 28, 2012
Sales of Wireless products increased 27% , or $110 million , primarily reflecting the continued customer adoption of and migration to the Cisco Unified Access Network architecture, and also reflecting increased sales of new products in this category as well as sales from our acquisition of Meraki. Sales of our Security products were down 4% , or $15 million , led by a decline in sales of our content security products, partially offset by higher sales in high-end firewall products within our network security product portfolio. We experienced a decrease in sales of Other Products due in large part to the sale of our Linksys product line in the third quarter of fiscal 2013.
Nine Months Ended April 27, 2013 Compared with Nine Months Ended April 28, 2012
Sales of Wireless products increased 30% , or $354 million , due to similar factors as those affecting the three month period discussed above. Sales of security products increased slightly and were driven in part by the relatively recent update of our firewall security product portfolio. We experienced a decrease in sales of Other Products due in large part to lower sales of our former Linksys products.
56

Net Service Sales by Segment
The following table presents the breakdown of service revenue by segment (in millions, except percentages):
Three Months Ended April 27, 2013 Compared with Three Months Ended April 28, 2012
Service revenue increased by 7% , with worldwide technical support services revenue increasing by 5%, and worldwide advanced services, which relate to consulting support services for specific customer network needs, experiencing 14% revenue growth. Technical support service experienced growth in the Americas and EMEA segments. Renewals and technical support service contract initiations associated with product sales provided an installed base of equipment being serviced which, in concert with new service offerings, were the primary factors driving these sales increases. Advanced services revenue also grew in the Americas and EMEA segments driven by solid growth in both transaction and subscription revenues. The decrease in service revenue in the APJC segment was due mainly to the completion of several large, multiyear projects in this segment during the third quarter of fiscal 2012.
Nine Months Ended April 27, 2013 Compared with Nine Months Ended April 28, 2012
Service revenue experienced solid growth across all of our geographic segments for the period. Worldwide technical support services revenue increased by 7%, and worldwide advanced services experienced 19% revenue growth. Technical support services revenue grew across all of our geographic segments. We experienced revenue growth in advanced services across all geographic segments, led by growth in the Americas segment. Advanced services revenue growth was driven by strong growth in both transaction and subscription revenues. Gross Margin
The following table presents the gross margin for products and services (in millions, except percentages):
57
Three Months Ended Nine Months Ended
April 27,
2013 April 28,
2012 Variance in Dollars
Variance in Percent
April 27, 2013
April 28, 2012
Variance in Dollars
Variance in Percent
Net service sales: Americas $ 1,763 $ 1,577 $ 186 11.8 % $ 5,219 $ 4,687 $ 532 11.4 %
Percentage of net service sales 66.3 % 63.5 % 66.1 % 65.1 % EMEA 541 521 20 3.8 % 1,596 1,497 99 6.6 %
Percentage of net service sales 20.4 % 21.0 % 20.2 % 20.8 %
APJC 353 384 (31 ) (8.1 )% 1,082 1,011 71 7.0 %
Percentage of net service sales 13.3 % 15.5 % 13.7 % 14.1 %
Total $ 2,657 $ 2,482 $ 175 7.1 % $ 7,897 $ 7,195 $ 702 9.8 %
Three Months Ended Nine Months Ended
Amount Percentage Amount Percentage
April 27,
2013 April 28,
2012 April 27,
2013 April 28,
2012 April 27,
2013 April 28,
2012 April 27,
2013 April 28,
2012
Gross margin:
Product $ 5,777 $ 5,543 60.4 % 60.9 % $ 16,906 $ 16,400 59.8 % 60.3 %
Service 1,734 1,626 65.3 % 65.5 % 5,187 4,724 65.7 % 65.7 %
Total $ 7,511 $ 7,169 61.5 % 61.9 % $ 22,093 $ 21,124 61.0 % 61.5 %

Product Gross Margin
The following table summarizes the key factors that contributed to the change in product gross margin percentage for the third quarter and first nine months of fiscal 2013 as compared with the corresponding prior year periods:
(1) Beginning in the second quarter of fiscal 2013, we refined our methodology for presenting the items in the preceding table and accordingly certain reclassifications have been made to the nine months ended amounts to conform to the presentation made for the three months-ended amounts.
(2) Productivity includes overall manufacturing-related costs, shipment volume, and other items not categorized elsewhere.
Three Months Ended April 27, 2013 Compared with Three Months Ended April 28, 2012
Product gross margin decreased by 0.5 percentage points for the period. The decrease was primarily due to the impact of higher sales discounts, rebates, and unfavorable product pricing, which were driven by normal market factors and by the geographic mix of net product sales. These factors impacted most of our customer markets and each of our three geographic segments. Additionally, our product gross margin for the third quarter of fiscal 2013 was negatively impacted by the shift in the mix of products sold, primarily as a result of sales increases of our relatively lower margin Cisco Unified Computing System and Service Provider Video products. Further, our recent acquisitions, in particular NDS, resulted in higher amortization expense from purchased intangible assets. These factors were partially offset by productivity improvements. The productivity improvements were in large part due to increased benefits from cost savings particularly in certain of our Switching and NGN Routing categories in which product transitions have been taking place; driven by value engineering efforts, favorable component pricing; and continued operational efficiency in manufacturing operations. Value engineering is the process by which production costs are reduced through component redesign, board configuration, test processes, and transformation processes.
Our future gross margins could be impacted by our product mix and could be adversely affected by further growth in sales of products that have lower gross margins, such as Cisco Unified Computing System and Service Provider Video products. Our gross margins may also be impacted by the geographic mix of our revenue and, as was the case in fiscal 2012 and 2011, may be adversely affected by increased sales discounts, rebates, and product pricing attributable to competitive factors. Additionally, our manufacturing-related costs may be negatively impacted by constraints in our supply chain, which in turn could negatively affect gross margin. If any of the preceding factors that in the past have negatively impacted our gross margins arise in future periods, our gross margins could continue to decline.
Nine Months Ended April 27, 2013 Compared with Nine Months Ended April 28, 2012
Product gross margin decreased by 0.5 percentage points for the period. The decrease was primarily due to the impact of higher sales discounts, rebates, and unfavorable product pricing, which were driven by normal market factors and by the geographic mix of net product sales. These factors impacted most of our customer markets and all of our geographic segments. Additionally, our product gross margin for the first nine months of fiscal 2013 was negatively impacted by the shift in the mix of products sold, primarily as a result of sales increases in our relatively lower margin Cisco Unified Computing System and Service Provider Video products. Further, as discussed above, our acquisition of NDS resulted both in higher amortization expense from purchased intangible assets and costs resulting from a fair value adjustment to inventory acquired as part of the business combination, each of which negatively impacted our product gross margin for the first nine months of fiscal 2013. These factors were partially offset by productivity improvements driven by similar factors as discussed in the three month period immediately above.
58
Product Gross Margin Percentage
Three Months
Ended Nine Months
Ended (1)
Fiscal 2012 60.9 % 60.3 %
Sales discounts, rebates, and product pricing (2.8 )% (2.9 )%
Mix of products sold (1.7 )% (1.0 )%
Amortization of purchased intangible assets (0.4 )% (0.5 )%
Acquisition fair value adjustment to inventory and other — % (0.2 )%
Productivity (2) 4.4 % 4.1 %
Fiscal 2013 60.4 % 59.8 %

Service Gross Margin
Three Months Ended April 27, 2013 Compared with Three Months Ended April 28, 2012
Our service gross margin percentage decreased by 0.2 percentage points for the third quarter of fiscal 2013 period. This decrease was primarily due to increased cost impacts such as headcount-related costs, particularly in advanced services and unfavorable mix. The mix impacts were due to our lower gross margin advanced services business contributing a higher proportion of service revenue for the third quarter of fiscal 2013, as compared with the prior year period. Our service gross margin was also negatively impacted by the completion of several large, multiyear projects during the third quarter of fiscal 2012.
Our service gross margin normally experiences some fluctuations due to various factors such as the timing of contract initiations and renewals, our strategic investments in headcount, and the resources we deploy to support the overall service business. Other factors include the mix of service offerings, as the gross margin from our advanced services is typically lower than the gross margin from technical support services.
Nine Months Ended April 27, 2013 Compared with Nine Months Ended April 28, 2012
Our service gross margin percentage was unchanged compared with the corresponding period in fiscal 2012. Although we experienced higher sales volume led by growth in advanced services and in technical support services, the resulting benefit to gross margin was offset by increased cost impacts such as headcount-related costs, particularly in advanced services; partner delivery costs; and unfavorable mix. The mix impacts were due to our lower gross margin advanced services business contributing a higher proportion of service revenue for the first nine months of fiscal 2013, as compared with the prior year period.
Gross Margin by Segment
The following table presents the total gross margin for each segment (in millions, except percentages):
(1) The unallocated corporate items include the effects of amortization of acquisition-related intangible assets, share-based compensation expense, impact to cost of sales from
purchase accounting adjustments to inventory, and restructuring and other charges. We do not allocate these items to the gross margin for each segment because management does
not include such information in measuring the performance of the operating segments.
Three Months Ended April 27, 2013 Compared with Three Months Ended April 28, 2012
We experienced a gross margin percentage decrease in our Americas and APJC segments, while our EMEA segment experienced a gross margin percentage increase.
The Americas segment experienced a slight decrease in its gross margin percentage due to the impacts from higher sales discounts, rebates and unfavorable pricing; and also due to unfavorable mix impacts. The unfavorable mix impacts were due in large part to higher revenue from our lower margin Data Center products. Partially offsetting these factors were productivity improvements, driven in large part by lower overall manufacturing costs and higher volume.
Our EMEA segment gross margin percentage increased as a result of productivity improvements and a more favorable mix of products sold during the current period, driven in large part by a favorable mix within the Service Provider Video category. Partially offsetting these factors were the impacts from higher sales discounts, rebates and unfavorable pricing.
The gross margin percentage decreased in our APJC segment due to the impact of higher sales discounts, rebates, unfavorable pricing, and unfavorable mix impacts and also due to the decline in our service gross margin. The decline in service gross margin in our APJC segment for the current period was largely due to the completion of several large, multiyear projects during the third quarter of fiscal 2012.
59
Three Months Ended Nine Months Ended
Amount Percentage Amount Percentage
April 27,
2013 April 28,
2012 April 27,
2013 April 28,
2012 April 27,
2013 April 28,
2012 April 27,
2013 April 28,
2012
Gross margin:
Americas $ 4,460 $ 4,053 62.6 % 62.7 % $ 13,341 $ 12,319 62.7 % 62.8 %
EMEA 2,044 2,019 65.3 % 63.9 % 5,850 5,868 64.5 % 63.4 %
APJC 1,197 1,242 61.1 % 63.3 % 3,494 3,342 59.8 % 60.7 %
Segment total 7,701 7,314 63.0 % 63.1 % 22,685 21,529 62.7 % 62.6 %
Unallocated corporate items (1) (190 ) (145 ) (592 ) (405 )
Total $ 7,511 $ 7,169 61.5 % 61.9 % $ 22,093 $ 21,124 61.0 % 61.5 %

The gross margin percentage for a particular segment may fluctuate, and period-to-period changes in such percentages may or may not be indicative of a trend for that segment. Our product and service gross margins may be impacted by economic downturns or uncertain economic conditions as well as our movement into new market opportunities and gross margins could decline if any of the factors that impact our gross margins are adversely affected in future periods.
Nine Months Ended April 27, 2013 Compared with Nine Months Ended April 28, 2012
The Americas segment experienced a slight gross margin percentage decrease due to higher sales discounts, rebates and unfavorable pricing, and also due to an unfavorable mix impact, all partially offset by productivity improvements.
The gross margin percentage increase in our EMEA segment was primarily the result of productivity improvements from lower overall manufacturing costs, a favorable mix of products sold, and higher service gross margin. Partially offsetting these favorable impacts to gross margin were negative impacts from higher sales discounts, rebates and unfavorable pricing.
The APJC segment gross margin percentage decreased as compared with the corresponding period of fiscal 2012, due to the impact of higher sales discounts, rebates and unfavorable pricing, and also due to unfavorable mix impacts. Partially offsetting these factors were productivity improvements, driven in large part by lower overall manufacturing costs and higher volume.
Factors That May Impact Net Sales and Gross Margin
Net product sales may continue to be affected by factors, including global economic downturns and related market uncertainty, that have resulted in cautious IT-related capital spending in our enterprise, service provider, public sector, and commercial markets; changes in the geopolitical environment and global economic conditions; competition, including price-focused competitors from Asia, especially from China; new product introductions; sales cycles and product implementation cycles; changes in the mix of our customers between service provider and enterprise markets; changes in the mix of direct sales and indirect sales; variations in sales channels; and final acceptance criteria of the product, system, or solution as specified by the customer. Sales to the service provider market have been and may be in the future characterized by large and sporadic purchases, especially relating to our router sales and sales of certain products within our collaboration and data center product categories. In addition, service provider customers typically have longer implementation cycles; require a broader range of services, including network design services; and often have acceptance provisions that can lead to a delay in revenue recognition. Certain of our customers in certain emerging countries also tend to make large and sporadic purchases, and the net sales related to these transactions may similarly be affected by the timing of revenue recognition. As we focus on new market opportunities, customers may require greater levels of financing arrangements, service, and support, especially in certain emerging countries, which in turn may result in a delay in the timing of revenue recognition. To improve customer satisfaction, we continue to focus on managing our manufacturing lead-time performance, which may result in corresponding reductions in order backlog. A decline in backlog levels could result in more variability and less predictability in our quarter-to-quarter net sales and operating results.
Net product sales may also be adversely affected by fluctuations in demand for our products, especially with respect to telecommunications service providers and Internet businesses, whether or not driven by any slowdown in capital expenditures in the service provider market; price and product competition in the communications and information technology industry; introduction and market acceptance of new technologies and products; adoption of new networking standards; and financial difficulties experienced by our customers. We may, from time to time, experience manufacturing issues that create a delay in our suppliers' ability to provide specific components, resulting in delayed shipments. To the extent that manufacturing issues and any related component shortages result in delayed shipments in the future, and particularly in periods when we and our suppliers are operating at higher levels of capacity, it is possible that revenue for a quarter could be adversely affected if such matters are not remediated within the same quarter. For additional factors that may impact net product sales, see “Part II, Item 1A. Risk Factors.”
Our distributors and retail partners participate in various cooperative marketing and other programs. Increased sales to our distributors and retail partners generally result in greater difficulty in forecasting the mix of our products and, to a certain degree, the timing of orders from our customers. We recognize revenue for sales to our distributors and retail partners generally based on a sell-through method using information provided by them, and we maintain estimated accruals and allowances for all cooperative marketing and other programs.
60

Product gross margin may be adversely affected in the future by changes in the mix of products sold, including periods of increased growth of some of our lower margin products; introduction of new products, including products with price-performance advantages; our ability to reduce production costs; entry into new markets, including markets with different pricing structures and cost structures, as a result of internal development or through acquisitions; changes in distribution channels; price competition, including competitors from Asia, especially those from China; changes in geographic mix of our product sales; the timing of revenue recognition and revenue deferrals; sales discounts; increases in material or labor costs, including share-based compensation expense; excess inventory and obsolescence charges; warranty costs; changes in shipment volume; loss of cost savings due to changes in component pricing; effects of value engineering; inventory holding charges; and the extent to which we successfully execute on our strategy and operating plans. Additionally, our manufacturing-related costs may be negatively impacted by constraints in our supply chain. Service gross margin may be impacted by various factors such as the change in mix between technical support services and advanced services; the timing of technical support service contract initiations and renewals; share-based compensation expense; and the timing of our strategic investments in headcount and resources to support this business. Research and Development (“R&D”), Sales and Marketing, and General and Administrative (“G&A”) Expenses
R&D, sales and marketing, and G&A expenses are summarized in the following table (in millions, except percentages):
R&D Expenses
The increase in R&D expenses for the third quarter and first nine months of fiscal 2013, as compared with the corresponding periods in fiscal 2012, was primarily due to higher headcount-related expenses attributable in large part to our acquisition of NDS at the beginning of fiscal 2013. Partially offsetting these costs was lower share-based compensation expense.
We continue to invest in R&D in order to bring a broad range of products to market in a timely fashion. If we believe that we are unable to enter a particular market in a timely manner with internally developed products, we may purchase or license technology from other businesses, or we may partner with or acquire businesses as an alternative to internal R&D.
Sales and Marketing Expenses
The decrease in sales and marketing expenses for the third quarter and first nine months of fiscal 2013, as compared with the corresponding periods in fiscal 2012 , was primarily due to lower discretionary spending and lower share-based compensation expense. These items were partially offset by higher headcount-related expense resulting largely from our acquisition of NDS at the beginning of fiscal 2013.
G&A Expenses
G&A expenses decreased for the third quarter of fiscal 2013, as compared with the third quarter of fiscal 2012, primarily due to lower corporate-level expenses, driven by a recovery in the market value of property held for sale. Lower share-based compensation also contributed to the decline in G&A expenses. These items were partially offset by higher headcount-related expense resulting largely from our acquisition of NDS at the beginning of fiscal 2013.
G&A expenses increased in the first nine months of fiscal 2013, as compared with the corresponding period in fiscal 2012, primarily due to increased headcount-related expenses attributable in part to the acquisition of NDS at the beginning of fiscal 2013, and also due to higher corporate-level expenses. Corporate-level expenses, which tended to vary from period to period, included operational infrastructure activities such as real estate actions; IT project implementations, which included investments in our global data center infrastructure; and investments related to operational and financial systems.
61
Three Months Ended Nine Months Ended
April 27,
2013 April 28,
2012 Variance in Dollars
Variance in Percent
April 27, 2013
April 28, 2012
Variance in Dollars
Variance in Percent
Research and development $ 1,542 $ 1,358 $ 184 13.5 % $ 4,425 $ 4,072 $ 353 8.7 %
Percentage of net sales 12.6 % 11.7 % 12.2 % 11.8 %
Sales and marketing 2,375 2,383 (8 ) (0.3 )% 7,178 7,230 (52 ) (0.7 )%
Percentage of net sales 19.4 % 20.6 % 19.8 % 21.0 %
General and administrative 530 562 (32 ) (5.7 )% 1,674 1,611 63 3.9 %
Percentage of net sales 4.3 % 4.8 % 4.6 % 4.7 %
Total $ 4,447 $ 4,303 $ 144 3.3 % $ 13,277 $ 12,913 $ 364 2.8 %
Percentage of net sales 36.4 % 37.1 % 36.7 % 37.6 %

Effect of Foreign Currency
In the third quarter of fiscal 2013, foreign currency fluctuations, net of hedging, decreased the combined R&D, sales and marketing, and G&A expenses by $43 million, or approximately 1.0%, compared with the third quarter of fiscal 2012. In the first nine months of fiscal 2013, foreign currency fluctuations, net of hedging, decreased the combined R&D, sales and marketing, and G&A expenses by $192 million , or approximately 1.5% , compared with the first nine months of fiscal 2012.
Headcount
Our headcount increased by 675 employees in the third quarter of fiscal 2013 and increased by approximately 7,500 employees in the first nine months of fiscal 2013. The increase for the third quarter of fiscal 2013 was attributable to headcount from new acquisitions, as well as strategic hiring primarily in engineering and services, partially offset by the reduction in headcount related to the sale of our Linksys product line. The increase for the first nine months of fiscal 2013 was attributable to these factors as well as the acquisition of NDS at the beginning of fiscal 2013.
Share-Based Compensation Expense
The following table presents share-based compensation expense (in millions):
The year-over-year decrease in share-based compensation expense for the third quarter and first nine months of fiscal 2013, as compared with the corresponding prior year periods, was due primarily to the effect of a decrease in the aggregate value of share-based awards granted in recent periods and stock option awards from prior years becoming fully amortized. See Note 14 to the Consolidated Financial Statements.
Amortization of Purchased Intangible Assets
The following table presents the amortization of purchased intangible assets included in operating expenses (in millions):
The decrease in amortization of purchased intangible assets for the third quarter of fiscal 2013, as compared with the third quarter of fiscal 2012, was due mainly to certain purchased intangible assets having become fully amortized in the beginning of the current period, partially offset by the continuing amortization of purchased intangible assets from our acquisitions of NDS at the beginning of fiscal 2013, and from our other, more recent acquisitions. The increase in the amortization of purchased intangible assets in the first nine months of fiscal 2013, as compared with the corresponding period in fiscal 2012, was due to amortization of purchased intangible assets from our acquisitions of NDS at the beginning of fiscal 2013, and from our other, more recent acquisitions. For additional information regarding purchased intangible assets, see Note 4 to the Consolidated Financial Statements.
62
Three Months Ended Nine Months Ended
April 27,
2013 April 28,
2012 April 27,
2013 April 28,
2012
Cost of sales - product $ 10 $ 12 $ 31 $ 39 Cost of sales - service 34 39 105 116 Share-based compensation expense in cost of sales 44 51 136 155 Research and development 72 97 228 297 Sales and marketing 118 138 383 429 General and administrative 38 51 136 153 Restructuring and other charges — — (3 ) (2 )
Share-based compensation expense in operating expenses 228 286 744 877 Total share-based compensation expense $ 272 $ 337 $ 880 $ 1,032
Three Months Ended Nine Months Ended
April 27,
2013 April 28,
2012 April 27,
2013 April 28,
2012
Amortization of purchased intangible assets included in operating expenses $ 89 $ 96 $ 329 $ 292

The fair value of acquired technology and patents, as well as acquired technology under development, is determined at acquisition date primarily using the income approach, which discounts expected future cash flows to present value. The discount rates used in the present value calculations are typically derived from a weighted-average cost of capital analysis and then adjusted, as appropriate, to reflect risks inherent in the development lifecycle. We consider the pricing model for products related to these acquisitions to be standard within the high-technology communications industry, and the applicable discount rates represent the rates that market participants would use for valuation of such intangible assets.
Restructuring and Other Charges
In the third quarter and first nine months of fiscal 2013, we incurred within operating expenses net restructuring and other charges of approximately $33 million and $105 million , respectively. These charges were related primarily to employee severance charges for employees subject to our workforce reduction that we announced in late fiscal 2011. In the third quarter and first nine months of fiscal 2012, we incurred within operating expenses restructuring and other charges of $20 million and $225 million , respectively. See Note 5 to the Consolidated Financial Statements.
Operating Income
The following table presents our operating income and our operating income as a percentage of revenue (in millions, except percentages):
In the third quarter of fiscal 2013, as compared with the third quarter of fiscal 2012, operating income increased by 7% , and as a percentage of revenue operating income increased by 0.4 percentage points. The increase largely resulted from our continuing focus on expense management which resulted in lower sales and marketing and G&A expenses as a percentage of revenue.
In the first nine months of fiscal 2013, as compared with the first nine months of fiscal 2012, operating income increased by 9% , and as a percentage of revenue operating income increased by 0.8 percentage points. The increase largely resulted from our continuing focus on expense management which resulted in lower sales and marketing and G&A expenses as a percentage of revenue, and from lower restructuring and other charges. Interest and Other Income (Loss), Net
Interest Income (Expense), Net The following table summarizes interest income and interest expense (in millions):
For the third quarter and first nine months of fiscal 2013, interest income remained fairly constant compared with the corresponding periods in fiscal 2012. Increased interest income earned on financing receivables was substantially offset by lower interest income from our portfolio of cash, cash equivalents, and fixed income investments as a result of lower average rates of interest on our portfolio of cash, cash equivalents, and fixed income investments. For the third quarter and first nine months of fiscal 2013, interest expense decreased slightly compared with the corresponding periods in fiscal 2012 due to the favorable impact of interest rate swaps as the three-month LIBOR rate decreased.
63
Three Months Ended Nine Months Ended
April 27,
2013 April 28,
2012 April 27,
2013 April 28,
2012
Operating income $ 2,942 $ 2,750 $ 8,382 $ 7,694 Operating income as a percentage of revenue 24.1 % 23.7 % 23.2 % 22.4 %
Three Months Ended Nine Months Ended
April 27,
2013 April 28,
2012 Variance in Dollars
April 27, 2013
April 28, 2012
Variance in Dollars
Interest income $ 162 $ 161 $ 1 $ 483 $ 483 $ — Interest expense (145 ) (151 ) 6 (440 ) (449 ) 9
Interest income (expense), net $ 17 $ 10 $ 7 $ 43 $ 34 $ 9

Other Income (Loss), Net The components of other income (loss), net, are summarized as follows (in millions):
The decrease in total net gains on available-for-sale investments in the third quarter of fiscal 2013 compared with the third quarter of fiscal 2012 was attributable to losses on publicly traded equity securities and lower gains on fixed income securities in the current period as a result of market conditions and the timing of sales of these securities. The change in net losses on investments in privately held companies was driven primarily by equity method losses in the third quarter of fiscal 2013, due mainly to higher losses from our proportional share of the VCE joint venture. The change in other gains (losses), net for the third quarter of fiscal 2013 as compared with the third quarter of fiscal 2012 was primarily due to foreign exchange impacts partially offset by an increase in donations.
The decrease in total net gains on available-for-sale investments in the first nine months of fiscal 2013 compared with the first nine months of fiscal 2012 was attributable primarily to lower gains on both publicly traded equity securities and fixed income securities in the current period as a result of market conditions and the timing of sales of these securities. The change in net losses on investments in privately held companies was driven primarily by higher equity method losses in the first nine months of fiscal 2013. The change in other gains (losses), net for the first nine months of fiscal 2013 as compared with the first nine months of fiscal 2012 was primarily due to foreign exchange impacts and an increase in donations. Provision for Income Taxes
Our provision for income taxes is subject to volatility and could be adversely impacted by earnings being lower than anticipated in countries that have lower tax rates, higher than anticipated in countries that have higher tax rates, and by expiration of or lapses in tax incentives. Our provision for income taxes does not include provisions for U.S. income taxes and foreign withholding taxes associated with the repatriation of undistributed earnings of certain foreign subsidiaries that we intend to reinvest indefinitely in our foreign subsidiaries. If these earnings were distributed to the United States in the form of dividends or otherwise, or if the shares of the relevant foreign subsidiaries were sold or otherwise transferred, we would be subject to additional U.S. income taxes (subject to an adjustment for foreign tax credits) and foreign withholding taxes. Further, as a result of certain of our ongoing employment and capital investment actions and commitments, our income in certain countries is subject to reduced tax rates and in some cases is wholly exempt from tax. Our failure to meet these commitments could adversely impact our provision for income taxes.
Our provision for income taxes resulted in an effective tax rate of 15.9% for the third quarter of fiscal 2013, as compared with an effective tax rate of 22.1% for the third quarter of fiscal 2012, which resulted in a net 6.2 percentage point decrease in the effective tax rate for the third quarter of fiscal 2013, as compared with the third quarter of fiscal 2012. The decrease in the effective tax rate was due to the net tax benefit of $117 million which is due in large part to lapses of the time period for assessment of tax in certain foreign jurisdictions recorded in the third quarter of fiscal 2013.
Our provision for income taxes resulted in an effective tax rate of 7.7% for the first nine months of fiscal 2013 as compared with 21.2% for the first nine months of fiscal 2012, which resulted in a net 13.5 percentage point decrease for the first nine months of fiscal 2013, as compared with the first nine months of fiscal 2012. The decrease in the effective tax rate was primarily due to the recognition of a net benefit to the provision for income taxes of $794 million related to our settlement with the IRS, a tax benefit of $152 million related to the reinstatement of the U.S. federal R&D tax credit, and a tax benefit of $117 million which is due in large part to lapses of the time period for assessment of tax in certain foreign jurisdictions.
64
Three Months Ended Nine Months Ended
April 27,
2013 April 28,
2012 Variance in Dollars
April 27, 2013
April 28, 2012
Variance in Dollars
Gains (losses) on investments, net:
Publicly traded equity securities $ (2 ) $ 15 $ (17 ) $ 12 $ 30 $ (18 )
Fixed income securities 8 15 (7 ) 34 46 (12 )
Total available-for-sale investments 6 30 (24 ) 46 76 (30 )
Privately held companies (15 ) (3 ) (12 ) (69 ) (38 ) (31 )
Net gains (losses) on investments (9 ) 27 (36 ) (23 ) 38 (61 )
Other gains (losses), net (5 ) (8 ) 3 (46 ) 7 (53 )
Other income (loss), net $ (14 ) $ 19 $ (33 ) $ (69 ) $ 45 $ (114 )

LIQUIDITY AND CAPITAL RESOURCES
The following sections discuss the effects of changes in our balance sheet, contractual obligations, other commitments, and the stock repurchase program on our liquidity and capital resources.
Balance Sheet and Cash Flows
Cash and Cash Equivalents and Investments The following table summarizes our cash and cash equivalents and investments (in millions):
The decrease in cash and cash equivalents and investments in the first nine months of fiscal 2013 was primarily the result of cash paid for acquisitions of $6.4 billion . Other significant uses of cash in the first nine months of fiscal 2013 included cash dividends paid of $2.4 billion , the repurchase of common stock of $1.8 billion , and capital expenditures of $0.8 billion . Partially offsetting these cash outflows were cash provided by operating activities of $8.9 billion , an increase from $8.4 billion provided for the first nine months of fiscal 2012, and issuance of common stock of $1.2 billion .
The increase in cash provided by operating activities in the first nine months of fiscal 2013 compared with the corresponding period in fiscal 2012 was primarily the result of an increase in net income.
Our total in cash and cash equivalents and investments held by various foreign subsidiaries was $39.5 billion and $42.5 billion as of April 27, 2013 and July 28, 2012, respectively. Under current tax laws and regulations, if cash and cash equivalents and investments held outside the United States were distributed to the United States in the form of dividends or otherwise, we would be subject to additional U.S. income taxes (subject to an adjustment for foreign tax credits) and foreign withholding taxes. The balance available in the United States as of April 27, 2013 and July 28, 2012 was $7.9 billion and $6.2 billion , respectively.
We maintain an investment portfolio of various holdings, types, and maturities. We classify our investments as short-term investments based on their nature and their availability for use in current operations. We believe the overall credit quality of our portfolio is strong, with our cash equivalents and our fixed income investment portfolio consisting primarily of high-quality investment-grade securities. We believe that our strong cash and cash equivalents and investments position allows us to use our cash resources for strategic investments to gain access to new technologies, for acquisitions, for customer financing activities, for working capital needs, and for the repurchase of shares of common stock and payment of dividends.
We expect that cash provided by operating activities may fluctuate in future periods as a result of a number of factors, including fluctuations in our operating results, the rate at which products are shipped during the quarter (which we refer to as shipment linearity), the timing and collection of accounts receivable and financing receivables, inventory and supply chain management, deferred revenue, excess tax benefits resulting from share-based compensation, and the timing and amount of tax and other payments. For additional discussion, see “Part II, Item 1A. Risk Factors” in this report.
Accounts Receivable, Net The following table summarizes our accounts receivable, net (in millions), and DSO:
Our accounts receivable net, as of April 27, 2013 increased by approximately 13% compared with the end of fiscal 2012. Our DSO as of April 27, 2013 was 3 days higher compared with the end of fiscal 2012. The increase in DSO during the third quarter of fiscal 2013 was primarily due to the timing of product shipments, in which a greater proportion of the shipments was made in the latter part of the third quarter of fiscal 2013, compared with the fourth quarter of fiscal 2012.
65
April 27,
2013 July 28,
2012 Increase
(Decrease)
Cash and cash equivalents $ 5,122 $ 9,799 $ (4,677 )
Fixed income securities 40,192 37,297 2,895 Publicly traded equity securities 2,074 1,620 454
Total $ 47,388 $ 48,716 $ (1,328 )
April 27,
2013 July 28,
2012 Increase
(Decrease)
Accounts receivable, net $ 4,942 $ 4,369 $ 573 DSO 37 34 3
Inventory Supply Chain The following table summarizes our inventories and purchase commitments with contract manufacturers and suppliers (in millions, except annualized inventory turns):
Inventories as of April 27, 2013 decreased by 12% from our balance at the end of fiscal 2012, and for the same period purchase commitments with contract manufacturers and suppliers increased by approximately 9% . On a combined basis, inventories and purchase commitments with contract manufacturers and suppliers increased by 3% compared with the end of fiscal 2012.
The inventory decrease was due mainly to lower levels of manufactured finished goods, which was due in part to inventory sold as part of the sale of our Linksys product line. The increase in purchase commitments with contract manufacturers and suppliers as of the end of the third quarter of fiscal 2013, as compared with the end of fiscal 2012, was attributable to our effort to secure supply to meet forecasted demand.
We purchase components from a variety of suppliers and use several contract manufacturers to provide manufacturing services for our products. During the normal course of business, in order to manage manufacturing lead times and help ensure adequate component supply, we enter into agreements with contract manufacturers and suppliers that allow them to procure inventory based upon criteria as defined by us or that establish the parameters defining our requirements and our commitment to securing manufacturing capacity. A significant portion of our reported purchase commitments arising from these agreements are firm, noncancelable, and unconditional commitments. In certain instances, these agreements allow us the option to cancel, reschedule, and adjust our requirements based on our business needs prior to firm orders being placed. Our purchase commitments are for short-term product manufacturing requirements as well as for commitments to suppliers to secure manufacturing capacity.
We record a liability, included in other current liabilities, for firm, noncancelable, and unconditional purchase commitments for quantities in excess of our future demand forecasts consistent with the valuation of our excess and obsolete inventory. The purchase commitments for inventory are expected to be primarily fulfilled within one year.
Inventory and supply chain management remain areas of focus as we balance the need to maintain supply chain flexibility to help ensure competitive lead times with the risk of inventory obsolescence because of rapidly changing technology and customer requirements. We believe the amount of our inventory and purchase commitments is appropriate for our revenue levels.
Financing Receivables and Guarantees We measure our net balance sheet exposure position related to our financing receivables and financing guarantees by reducing the total of gross financing receivables and financing guarantees by the associated allowances for credit loss and deferred revenue. As of April 27, 2013 , our net balance sheet exposure position related to financing receivables and financing guarantees was as follows (in millions):
66
April 27,
2013 July 28,
2012 Increase
(Decrease)
Inventories $ 1,469 $ 1,663 $ (194 )
Annualized inventory turns 12.4 11.7 0.7 Purchase commitments with contract manufacturers and suppliers $ 4,215 $ 3,869 $ 346
FINANCING RECEIVABLES FINANCING GUARANTEES TOTAL
April 27, 2013 Lease
Receivables Loan
Receivables
Financed Service
Contracts and Other Total
Channel Partner
End-User Customers Total
Gross amount less unearned income $ 3,478 $ 1,671 $ 2,924 $ 8,073 $ 391 $ 255 $ 646 $ 8,719 Allowance for credit loss (245 ) (93 ) (19 ) (357 ) — — — (357 )
Deferred revenue (49 ) (44 ) (1,825 ) (1,918 ) (227 ) (223 ) (450 ) (2,368 )
Net balance sheet exposure $ 3,184 $ 1,534 $ 1,080 $ 5,798 $ 164 $ 32 $ 196 $ 5,994
Financing Receivables Gross financing receivables less unearned income increased by 6% compared with the end of fiscal 2012. The change was primarily due to a 9% increase in lease receivables and a 10% increase in financed service contracts and other, partially reduced by a 7% decline in loan receivables. We provide financing to certain end-user customers and channel partners to enable sales of our products, services, and networking solutions. These financing arrangements include leases, financed service contracts, and loans. Arrangements related to leases are generally collateralized by a security interest in the underlying assets. Lease receivables include sales-type and direct-financing leases. We also provide certain qualified customers financing for long-term service contracts, which primarily relate to technical support services and advanced services. Our loan financing arrangements may include not only financing the acquisition of our products and services but also providing additional funds for other costs associated with network installation and integration of our products and services. We expect to continue to expand the use of our financing programs in the near term.
Financing Guarantees In the normal course of business, third parties may provide financing arrangements to our customers and channel partners under financing programs. The financing arrangements to customers provided by third parties are related to leases and loans and typically have terms of up to three years. In some cases, we provide guarantees to third parties for these lease and loan arrangements. The financing arrangements to channel partners consist of revolving short-term financing provided by third parties, generally with payment terms ranging from 60 to 90 days. In certain instances, these financing arrangements result in a transfer of our receivables to the third party. The receivables are de-recognized upon transfer, as these transfers qualify as true sales, and we receive payments for the receivables from the third party based on our standard payment terms. These financing arrangements facilitate the working capital requirements of the channel partners, and in some cases, we guarantee a portion of these arrangements. We could be called upon to make payments under these guarantees in the event of nonpayment by the channel partners or end-user customers. Historically, our payments under these arrangements have been immaterial. Where we provide a guarantee, we defer the revenue associated with the channel partner and end-user financing arrangement in accordance with revenue recognition policies, or we record a liability for the fair value of the guarantees. In either case, the deferred revenue is recognized as revenue when the guarantee is removed.
Deferred Revenue Related to Financing Receivables and Guarantees The majority of the deferred revenue in the preceding table is related to financed service contracts. The majority of the revenue related to financed service contracts, which primarily relates to technical support services, is deferred as the revenue related to financed service contracts is recognized ratably over the period during which the related services are to be performed. A portion of the revenue related to lease and loan receivables is also deferred and included in deferred product revenue based on revenue recognition criteria not currently having been met.
Borrowings
Senior Notes The following table summarizes the principal amount of our senior notes (in millions):
Interest is payable semiannually on each class of the senior fixed-rate notes, each of which is redeemable by us at any time, subject to a make-whole premium. Interest is payable quarterly on the floating-rate notes. We were in compliance with all debt covenants as of April 27, 2013 .
Commercial Paper In fiscal 2011 we established a short-term debt financing program of up to $3.0 billion through the issuance of commercial paper notes. As of April 27, 2013 and July 28, 2012, we had no commercial paper notes outstanding under this program.
67
April 27,
2013 July 28,
2012
Senior notes:
Floating-rate notes, due 2014 $ 1,250 $ 1,250 1.625% fixed-rate notes, due 2014 2,000 2,000 2.90% fixed-rate notes, due 2014 500 500 5.50% fixed-rate notes, due 2016 3,000 3,000 3.15% fixed-rate notes, due 2017 750 750 4.95% fixed-rate notes, due 2019 2,000 2,000 4.45% fixed-rate notes, due 2020 2,500 2,500 5.90% fixed-rate notes, due 2039 2,000 2,000 5.50% fixed-rate notes, due 2040 2,000 2,000
Total $ 16,000 $ 16,000
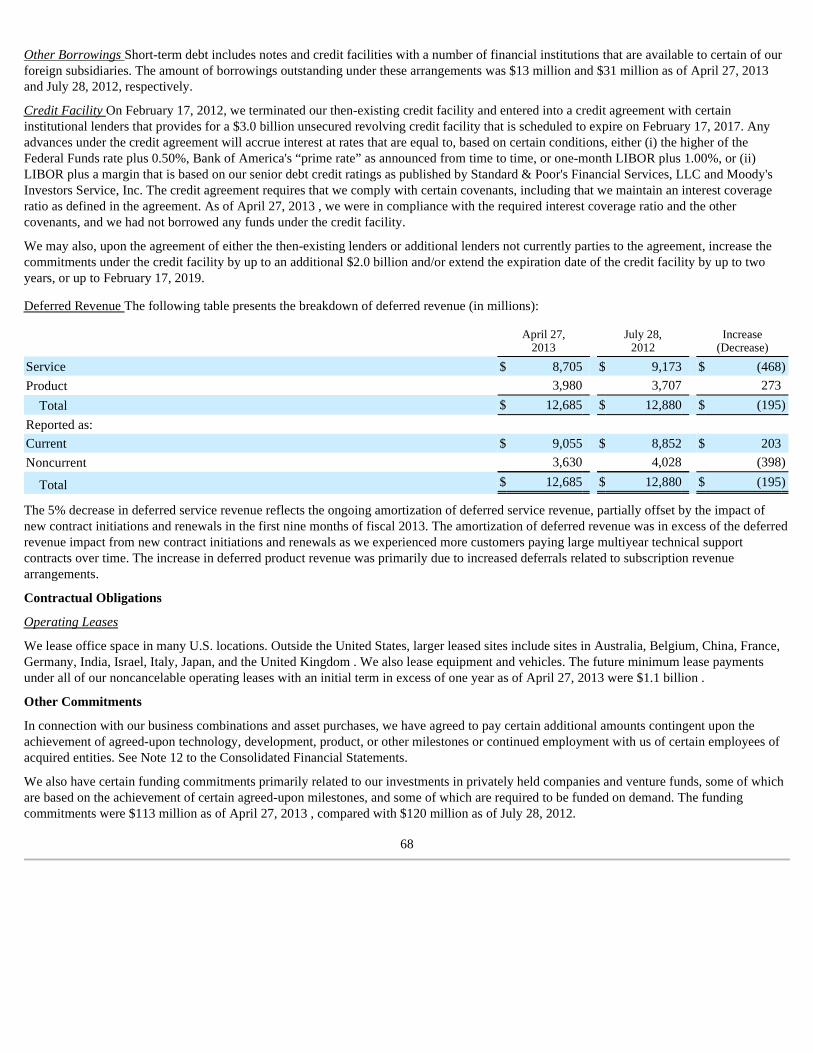
Other Borrowings Short-term debt includes notes and credit facilities with a number of financial institutions that are available to certain of our foreign subsidiaries. The amount of borrowings outstanding under these arrangements was $13 million and $31 million as of April 27, 2013 and July 28, 2012, respectively.
Credit Facility On February 17, 2012, we terminated our then-existing credit facility and entered into a credit agreement with certain institutional lenders that provides for a $3.0 billion unsecured revolving credit facility that is scheduled to expire on February 17, 2017. Any advances under the credit agreement will accrue interest at rates that are equal to, based on certain conditions, either (i) the higher of the Federal Funds rate plus 0.50%, Bank of America's “prime rate” as announced from time to time, or one-month LIBOR plus 1.00%, or (ii) LIBOR plus a margin that is based on our senior debt credit ratings as published by Standard & Poor's Financial Services, LLC and Moody's Investors Service, Inc. The credit agreement requires that we comply with certain covenants, including that we maintain an interest coverage ratio as defined in the agreement. As of April 27, 2013 , we were in compliance with the required interest coverage ratio and the other covenants, and we had not borrowed any funds under the credit facility.
We may also, upon the agreement of either the then-existing lenders or additional lenders not currently parties to the agreement, increase the commitments under the credit facility by up to an additional $2.0 billion and/or extend the expiration date of the credit facility by up to two years, or up to February 17, 2019.
Deferred Revenue The following table presents the breakdown of deferred revenue (in millions):
The 5% decrease in deferred service revenue reflects the ongoing amortization of deferred service revenue, partially offset by the impact of new contract initiations and renewals in the first nine months of fiscal 2013. The amortization of deferred revenue was in excess of the deferred revenue impact from new contract initiations and renewals as we experienced more customers paying large multiyear technical support contracts over time. The increase in deferred product revenue was primarily due to increased deferrals related to subscription revenue arrangements.
Contractual Obligations
Operating Leases
We lease office space in many U.S. locations. Outside the United States, larger leased sites include sites in Australia, Belgium, China, France, Germany, India, Israel, Italy, Japan, and the United Kingdom . We also lease equipment and vehicles. The future minimum lease payments under all of our noncancelable operating leases with an initial term in excess of one year as of April 27, 2013 were $1.1 billion .
Other Commitments
In connection with our business combinations and asset purchases, we have agreed to pay certain additional amounts contingent upon the achievement of agreed-upon technology, development, product, or other milestones or continued employment with us of certain employees of acquired entities. See Note 12 to the Consolidated Financial Statements.
We also have certain funding commitments primarily related to our investments in privately held companies and venture funds, some of which are based on the achievement of certain agreed-upon milestones, and some of which are required to be funded on demand. The funding commitments were $113 million as of April 27, 2013 , compared with $120 million as of July 28, 2012.
68
April 27,
2013 July 28,
2012 Increase
(Decrease)
Service $ 8,705 $ 9,173 $ (468 )
Product 3,980 3,707 273 Total $ 12,685 $ 12,880 $ (195 )
Reported as:
Current $ 9,055 $ 8,852 $ 203 Noncurrent 3,630 4,028 (398 )
Total $ 12,685 $ 12,880 $ (195 )
Insieme Networks, Inc. (“ Insieme” ) In the third quarter of fiscal 2012, we made an investment in Insieme, an early stage company focused on research and development in the data center market. As set forth in the agreement between Cisco and Insieme, this investment includes $100 million of funding and a license to certain of our technology. In addition, pursuant to a November 2012 amendment to the agreement between Cisco and Insieme, we agreed to invest an additional $35 million in Insieme upon the satisfaction of certain conditions. As of April 27, 2013 , we owned approximately 85% of Insieme as a result of these investments and have consolidated the results of Insieme in our Consolidated Financial Statements.
In connection with this investment, we have entered into a put/call option agreement that provides us with the right to purchase the remaining interests in Insieme. In addition, the noncontrolling interest holders can require us to purchase their shares upon the occurrence of certain events. If we acquire the remaining interests of Insieme, the noncontrolling interest holders are eligible to receive two milestone payments, which will be determined using agreed-upon formulas based on revenue for certain of Insieme's products. We will begin recognizing the amounts due under the milestone payments when it is determined that such payments are probable of being earned, which we expect may be in fiscal 2014. When such a determination is made, the milestone payments will then be recorded as compensation expense by us based on an estimate of the fair value of the amounts probable of being earned, pursuant to a vesting schedule. Subsequent changes to the fair value of the amounts probable of being earned and the continued vesting will result in adjustments to the recorded compensation expense. The maximum amount that could be recorded as compensation expense by us is approximately $863 million . This amount was increased from up to a previous maximum of $750 million, as a result of the November 2012 amendment, as the parties recognized that higher staffing levels may be necessary to perform additional product development. The milestone payments, if earned, are expected to be paid primarily during fiscal 2016 and fiscal 2017.
Off-Balance Sheet Arrangements
We consider our investments in unconsolidated variable interest entities to be off-balance sheet arrangements. In the ordinary course of business, we have investments in privately held companies and provide financing to certain customers. These privately held companies and customers may be considered to be variable interest entities. We evaluate on an ongoing basis our investments in these privately held companies and customer financings, and we have determined that as of April 27, 2013 there were no material unconsolidated variable interest entities.
VCE is a joint venture that we formed in fiscal 2010 with EMC Corporation (“EMC”), with investments from VMware, Inc. (“VMware”) and Intel Corporation. VCE helps organizations leverage best-in-class technologies and disciplines from Cisco, EMC, and VMware to enable the transformation to cloud computing. As of April 27, 2013 , our cumulative gross investment in VCE was approximately $464 million , inclusive of accrued interest, and our ownership percentage was approximately 35% . We account for our investment in VCE under the equity method, and our portion of VCE's net loss is recognized in other income (loss), net. As of April 27, 2013 , we have recorded cumulative losses since inception from VCE of $374 million . Our carrying value in VCE as of April 27, 2013 was $90 million . Over the next 12 months, as VCE scales its operations, we expect that we will make additional investments in VCE and may incur additional losses proportionate with our share ownership.
From time to time, EMC and Cisco may enter into guarantee agreements on behalf of VCE to indemnify third parties, such as customers, for monetary damages. Such guarantees were not material as of April 27, 2013 .
On an ongoing basis, we reassess our investments in privately held companies and customer financings to determine if they are variable interest entities and if we would be regarded as the primary beneficiary pursuant to the applicable accounting guidance. As a result of this ongoing assessment, we may be required to make additional disclosures or consolidate these entities. Because we may not control these entities, we may not have the ability to influence these events.
We provide financing guarantees, which are generally for various third-party financing arrangements extended to our channel partners and end-user customers. We could be called upon to make payments under these guarantees in the event of nonpayment by the channel partners or end-user customers. See the previous discussion of these financing guarantees under “Financing Receivables and Guarantees.”
Securities Lending
We periodically engage in securities lending activities with certain of our available-for-sale investments. These transactions are accounted for as a secured lending of the securities, and the securities are typically loaned only on an overnight basis. The average daily balance of securities lending for the nine months ended April 27, 2013 and April 28, 2012 was $0.7 billion and $0.4 billion , respectively. We require collateral equal to at least 102% of the fair market value of the loaned security and that the collateral be in the form of cash or liquid, high-quality assets. We engage in these secured lending transactions with creditworthy counterparties, and the associated portfolio custodian has agreed to indemnify us against collateral losses. As of April 27, 2013 and July 28, 2012, we had no outstanding securities lending transactions. We believe these arrangements do not present a material risk or impact to our liquidity requirements.
69
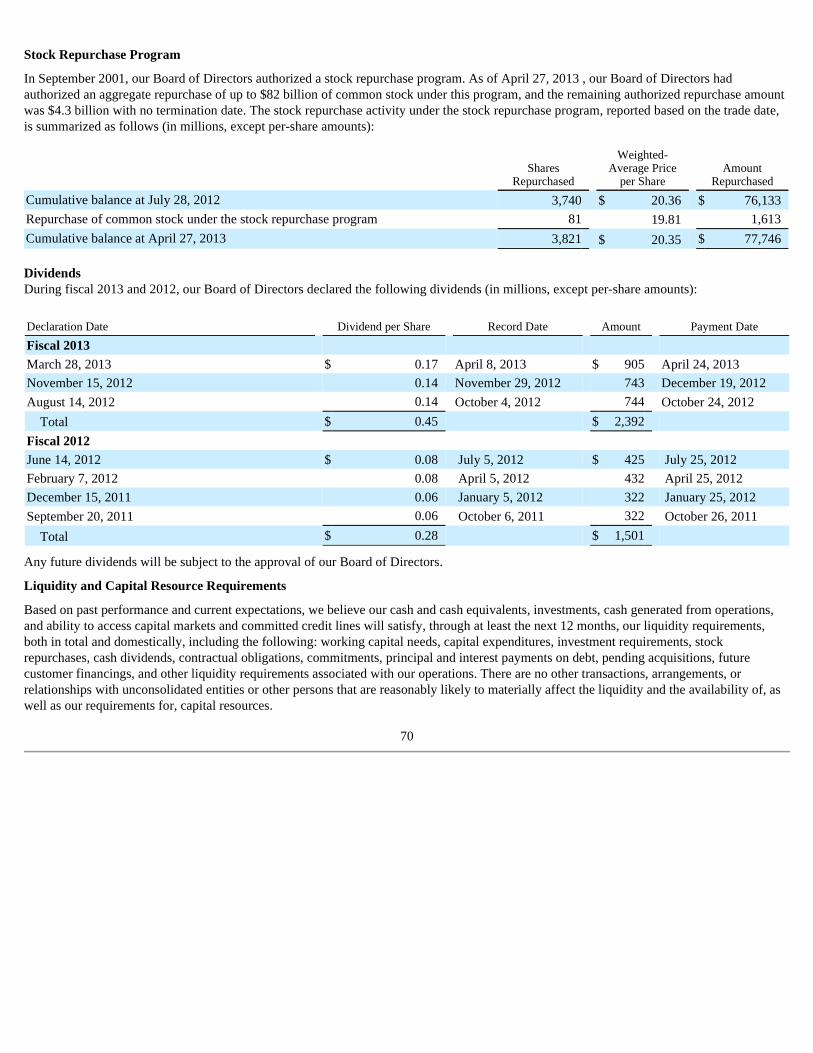
Stock Repurchase Program
In September 2001, our Board of Directors authorized a stock repurchase program. As of April 27, 2013 , our Board of Directors had authorized an aggregate repurchase of up to $82 billion of common stock under this program, and the remaining authorized repurchase amount was $4.3 billion with no termination date. The stock repurchase activity under the stock repurchase program, reported based on the trade date, is summarized as follows (in millions, except per-share amounts):
Dividends During fiscal 2013 and 2012, our Board of Directors declared the following dividends (in millions, except per-share amounts):
Any future dividends will be subject to the approval of our Board of Directors.
Liquidity and Capital Resource Requirements
Based on past performance and current expectations, we believe our cash and cash equivalents, investments, cash generated from operations, and ability to access capital markets and committed credit lines will satisfy, through at least the next 12 months, our liquidity requirements, both in total and domestically, including the following: working capital needs, capital expenditures, investment requirements, stock repurchases, cash dividends, contractual obligations, commitments, principal and interest payments on debt, pending acquisitions, future customer financings, and other liquidity requirements associated with our operations. There are no other transactions, arrangements, or relationships with unconsolidated entities or other persons that are reasonably likely to materially affect the liquidity and the availability of, as well as our requirements for, capital resources.
70
Shares
Repurchased
Weighted-Average Price
per Share Amount
Repurchased
Cumulative balance at July 28, 2012 3,740 $ 20.36 $ 76,133 Repurchase of common stock under the stock repurchase program 81 19.81 1,613 Cumulative balance at April 27, 2013 3,821 $ 20.35 $ 77,746
Declaration Date Dividend per Share Record Date Amount Payment Date
Fiscal 2013
March 28, 2013 $ 0.17 April 8, 2013 $ 905 April 24, 2013
November 15, 2012 0.14 November 29, 2012 743 December 19, 2012
August 14, 2012 0.14 October 4, 2012 744 October 24, 2012
Total $ 0.45 $ 2,392
Fiscal 2012
June 14, 2012 $ 0.08 July 5, 2012 $ 425 July 25, 2012
February 7, 2012 0.08 April 5, 2012 432 April 25, 2012
December 15, 2011 0.06 January 5, 2012 322 January 25, 2012
September 20, 2011 0.06 October 6, 2011 322 October 26, 2011
Total $ 0.28 $ 1,501

Our financial position is exposed to a variety of risks, including interest rate risk, equity price risk, and foreign currency exchange risk.
Interest Rate Risk
Fixed Income Securities We maintain an investment portfolio of various holdings, types, and maturities. Our primary objective for holding fixed income securities is to achieve an appropriate investment return consistent with preserving principal and managing risk. At any time, a sharp rise in market interest rates could have a material adverse impact on the fair value of our fixed income investment portfolio. Conversely, declines in interest rates, including the impact from lower credit spreads, could have a material adverse impact on interest income for our investment portfolio. We may utilize derivative instruments designated as hedging instruments to achieve our investment objectives. We had no outstanding hedging instruments for our fixed income securities as of April 27, 2013 . Our fixed income investments are held for purposes other than trading. Our fixed income investments were not leveraged as of April 27, 2013 . We monitor our interest rate and credit risks, including our credit exposures to specific rating categories and to individual issuers. As of April 27, 2013 , approximately 79% of our fixed income securities balance consisted of U.S. government and U.S. government agency securities. We believe the overall credit quality of our portfolio is strong.
Debt As of April 27, 2013 , we had $16.0 billion in principal amount of senior notes outstanding, which consisted of $1.25 billion floating-rate notes and $14.75 billion fixed-rate notes. The carrying amount of such senior notes was $16.2 billion , and the related fair value was $18.4 billion , which fair value is based on market prices. As of April 27, 2013 , a hypothetical 50 basis points increase or decrease in market interest rates would change the fair value of the fixed-rate debt, excluding the $4.25 billion of hedged debt, by a decrease of $0.5 billion or an increase of $0.6 billion, respectively. However, this hypothetical change in interest rates would not impact the interest expense on the fixed-rate debt, which is not hedged.
Equity Price Risk
The fair value of our equity investments in publicly traded companies is subject to market price volatility. We may hold equity securities for strategic purposes or to diversify our overall investment portfolio. Our equity portfolio consists of securities with characteristics that most closely match the Standard & Poor's 500 Index or NASDAQ Composite Index. These equity securities are held for purposes other than trading. To manage our exposure to changes in the fair value of certain equity securities, we may enter into equity derivatives designated as hedging instruments.
Publicly Traded Equity Securities The following tables present the hypothetical fair values of publicly traded equity securities as a result of selected potential decreases and increases in the price of each equity security in the portfolio, excluding hedged equity securities, if any. Potential fluctuations in the price of each equity security in the portfolio of plus or minus 10%, 20%, and 30% were selected based on potential near-term changes in those security prices. The hypothetical fair values as of April 27, 2013 and July 28, 2012 are as follows (in millions):
There were no impairment charges on our investments in publicly traded equity securities for the periods presented.
71
Item 3. Quantitative and Qualitative Disclosures About Market Risk
VALUATION OF SECURITIES
GIVEN AN X% DECREASE IN
EACH STOCK’S PRICE FAIR VALUE
AS OF APRIL 27, 2013
VALUATION OF SECURITIES
GIVEN AN X% INCREASE IN
EACH STOCK’S PRICE
(30)% (20)% (10)% 10% 20% 30%
Publicly traded equity securities $908 $1,038 $1,167 $1,297 $1,427 $1,556 $1,686
VALUATION OF SECURITIES
GIVEN AN X% DECREASE IN
EACH STOCK’S PRICE FAIR VALUE
AS OF JULY 28, 2012
VALUATION OF SECURITIES
GIVEN AN X% INCREASE IN
EACH STOCK’S PRICE
(30)% (20)% (10)% 10% 20% 30%
Publicly traded equity securities $944 $1,078 $1,213 $1,348 $1,483 $1,618 $1,752

Investments in Privately Held Companies We have also invested in privately held companies. These investments are recorded in other assets in our Consolidated Balance Sheets and are accounted for using primarily either the cost or the equity method. As of April 27, 2013 , the total carrying amount of our investments in privately held companies was $835 million , compared with $858 million at July 28, 2012. Some of the privately held companies in which we invested are in the startup or development stages. These investments are inherently risky because the markets for the technologies or products these companies are developing are typically in the early stages and may never materialize. We could lose our entire investment in these companies. Our evaluation of investments in privately held companies is based on the fundamentals of the businesses invested in, including, among other factors, the nature of their technologies and potential for financial return. Our impairment charges on investments in privately held companies were $5 million and $15 million for the third quarters of fiscal 2013 and fiscal 2012, respectively, and were $23 million and $17 million during the first nine months of fiscal 2013 and fiscal 2012, respectively.
Foreign Currency Exchange Risk
Our foreign exchange forward and option contracts outstanding as of April 27, 2013 and July 28, 2012 are summarized in U.S. dollar equivalents as follows (in millions):
We conduct business globally in numerous currencies. The direct effect of foreign currency fluctuations on sales has not been material because our sales are primarily denominated in U.S. dollars. However, if the U.S. dollar strengthens relative to other currencies, such strengthening could have an indirect effect on our sales to the extent it raises the cost of our products to non-U.S. customers and thereby reduces demand. A weaker U.S. dollar could have the opposite effect. However, the precise indirect effect of currency fluctuations is difficult to measure or predict because our sales are influenced by many factors in addition to the impact of such currency fluctuations.
Approximately 70% of our operating expenses are U.S.-dollar denominated. In the first nine months of fiscal 2013, foreign currency fluctuations, net of hedging, decreased the combined R&D, sales and marketing, and G&A expenses by $192 million , or approximately 1.5% compared with the first nine months of fiscal 2012. To reduce variability in operating expenses and service cost of sales caused by non-U.S.-dollar denominated operating expenses and costs, we hedge certain forecasted foreign currency transactions with currency options and forward contracts. These hedging programs are not designed to provide foreign currency protection over long time horizons. In designing a specific hedging approach, we consider several factors, including offsetting exposures, significance of exposures, costs associated with entering into a particular hedge instrument, and potential effectiveness of the hedge. The gains and losses on foreign exchange contracts mitigate the effect of currency movements on our operating expenses and service cost of sales.
We also enter into foreign exchange forward and option contracts to reduce the short-term effects of foreign currency fluctuations on receivables, investments, and payables that are denominated in currencies other than the functional currencies of the entities. The market risks associated with these foreign currency receivables, investments, and payables relate primarily to variances from our forecasted foreign currency transactions and balances. Our forward and option contracts generally have the following maturities:
We do not enter into foreign exchange forward or option contracts for trading purposes.
72
April 27, 2013 July 28, 2012
Notional Amount Fair Value Notional Amount Fair Value
Forward contracts:
Purchased $ 2,968 $ 4 $ 3,336 $ (10 )
Sold $ 1,489 $ 29 $ 1,566 $ 5 Option contracts:
Purchased $ 768 $ 13 $ 2,478 $ 31 Sold $ 742 $ (1 ) $ 2,239 $ (25 )
Maturities
Forward and option contracts - forecasted transactions related to operating expenses and service cost of sales Up to 18 months
Forward contracts - current assets and liabilities Up to 3 months
Forward contracts - net investments in foreign subsidiaries Up to 6 months
Forward contracts - long-term customer financings Up to 2 years
Forward contracts - investments Up to 2 years

Evaluation of disclosure controls and procedures . Based on our management's evaluation (with the participation of our principal executive officer and principal financial officer), as of the end of the period covered by this report, our principal executive officer and principal financial officer have concluded that our disclosure controls and procedures (as defined in Rules 13a-15(e) and 15d-15(e) under the Securities Exchange Act of 1934, as amended, (the “Exchange Act”)) are effective to ensure that information required to be disclosed by us in reports that we file or submit under the Exchange Act is recorded, processed, summarized and reported within the time periods specified in Securities and Exchange Commission rules and forms and is accumulated and communicated to our management, including our principal executive officer and principal financial officer, as appropriate to allow timely decisions regarding required disclosure.
Changes in internal control over financial reporting. There was no change in our internal control over financial reporting (as defined in Rules 13a-15(f) and 15d-15(f) under the Exchange Act) during our third quarter of fiscal 2013 that has materially affected, or is reasonably likely to materially affect, our internal control over financial reporting.
73
Item 4. Controls and Procedures

Brazilian authorities have investigated our Brazilian subsidiary and certain of its current and former employees, as well as a Brazilian importer of our products, and its affiliates and employees, relating to alleged evasion of import taxes and alleged improper transactions involving the subsidiary and the importer. Brazilian tax authorities have assessed claims against our Brazilian subsidiary based on a theory of joint liability with the Brazilian importer for import taxes, interest, and penalties. In addition to claims asserted by the Brazilian federal tax authorities in prior fiscal years, tax authorities from the Brazilian state of Sao Paulo have asserted similar claims on the same legal basis in prior fiscal years. In the first quarter of fiscal 2013, the Brazilian federal tax authorities asserted an additional claim against our Brazilian subsidiary based on a theory of joint liability with respect to an alleged underpayment of income taxes, social taxes, interest, and penalties by a Brazilian distributor.
The asserted claims by Brazilian federal tax authorities are for calendar years 2003 through 2008, and the asserted claims by the tax authorities from the state of Sao Paulo are for calendar years 2005 through 2007. The total asserted claims by Brazilian state and federal tax authorities aggregate to approximately $432 million for the alleged evasion of import and other taxes, approximately $1.2 billion for interest, and approximately $1.9 billion for various penalties, all determined using an exchange rate as of April 27, 2013 . We have completed a thorough review of the matters and believe the asserted claims against our Brazilian subsidiary are without merit, and we are defending the claims vigorously. While we believe there is no legal basis for the alleged liability, due to the complexities and uncertainty surrounding the judicial process in Brazil and the nature of the claims asserting joint liability with the importer, we are unable to determine the likelihood of an unfavorable outcome against our Brazilian subsidiary and are unable to reasonably estimate a range of loss, if any. We do not expect a final judicial determination for several years.
On March 31, 2011 and April 12, 2011, purported shareholder class action lawsuits were filed in the United States District Court for the Northern District of California against Cisco and certain of its officers and directors. The lawsuits were consolidated, and an amended consolidated complaint was filed on December 2, 2011. The consolidated action was purportedly brought on behalf of purchasers of Cisco's publicly traded securities between February 3, 2010 and May 11, 2011. Plaintiffs alleged that defendants made false and misleading statements, purported to assert claims for violations of the federal securities laws, and sought unspecified compensatory damages and other relief. On February 12, 2012, we filed a motion seeking to dismiss all claims in the amended complaint. On March 29, 2013, the Court granted our motion and dismissed the amended complaint, finding no facts or inferences to support the plaintiffs' allegations. Plaintiffs chose not to file an amended complaint and not to pursue an appeal. The Court dismissed the entire lawsuit with prejudice on April 29, 2013.
Beginning on April 8, 2011, a number of purported shareholder derivative lawsuits were filed in both the United States District Court for the Northern District of California and the California Superior Court for the County of Santa Clara against our Board of Directors and several of our officers. The federal lawsuits have been consolidated in the Northern District of California. Plaintiffs in both the federal and state derivative actions allege that the Board allowed certain officers to make allegedly false and misleading statements. The complaint includes claims for violation of the federal securities laws, breach of fiduciary duties, waste of corporate assets, unjust enrichment, and violations of the California Corporations Code. The complaint seeks compensatory damages, disgorgement, and other relief. In light of the United States District Court's dismissal of the purported shareholder class action noted above, all of the federal and state derivative lawsuits have been voluntarily dismissed.
We were subject to patent claims asserted by VirnetX, Inc. on August 11, 2010 in the United States District Court for the Eastern District of Texas. VirnetX alleged that various of our products that implement a method for secure communication using virtual private networks infringe certain patents. VirnetX sought monetary damages. The trial on these claims began on March 4, 2013. On March 14, 2013, the jury entered a verdict finding that our accused products do not infringe any of VirnetX's patents asserted in the lawsuit. On April 3, 2013, VirnetX filed a motion seeking a new trial on the issue of infringement, which we have opposed. The Court has set a hearing date for VirnetX's motion in June 2013.
We were subject to numerous patent, tort, and contract claims asserted by XpertUniverse on March 10, 2009 in the United States District Court for the District of Delaware. Shortly before trial, the Court dismissed on summary judgment all claims initially asserted by XpertUniverse except a claim for infringement of two XpertUniverse patents and a claim for fraud by concealment. XpertUniverse's remaining patent claims alleged that three Cisco products in the field of expertise location software infringed two XpertUniverse patents. XpertUniverse's fraud by concealment claim alleged that we did not disclose our decision not to admit XpertUniverse into a partner program. The trial on these remaining claims began on March 11, 2013. On March 22, 2013, the jury entered a verdict finding that two of our products infringed two of XpertUniverse's patents and awarded XpertUniverse damages of less than $35 thousand . The jury also found for XpertUniverse on its fraud by concealment claim and awarded damages of $70 million . We believe we have strong arguments to overturn the fraud damage award or to obtain a new trial. On May 6, 2013, we filed post-trial motions that are expected to be decided in July or August 2013. If the Court does not grant our post-trial motions, we will pursue an appeal. While the ultimate outcome of the case may still result in a loss, we do not expect it to be material.
74
PART II. OTHER INFORMATION
Item 1. Legal Proceedings

Cisco and a service provider customer are subject to patent claims asserted by TiVo, Inc. on June 4, 2012 in the United States District Court for the Eastern District of Texas. TiVo alleges that our digital video recorders deployed by the service provider customer infringe certain of its patents. TiVo seeks monetary damages and injunctive relief. The trial on these claims is scheduled to begin in March 2014. We intend to show at trial that our products do not use the technology described in the patents. We are seeking permission from the Court to add counterclaims alleging that TiVo's new products infringe several digital video recorder patents owned by us.
TiVo previously filed a similar patent lawsuit against the same service provider customer, accusing digital video recorders manufactured by one of our competitors. The outcome of that case, which is now scheduled for trial in June 2013, could have an impact on the timing and outcome of our case. The parties to that case may conduct a mediation prior to the June trial and, if so, we expect to participate. The mediation could result in a resolution of the case for us and some or all of our service provider customers, which could result in a material charge to us. Due to the uncertainty surrounding the litigation process, which involves numerous defendants, we are unable to reasonably estimate the ultimate outcome of this litigation at this time.
In addition, we are subject to legal proceedings, claims, and litigation arising in the ordinary course of business, including intellectual property litigation. While the outcome of these matters is currently not determinable, we do not expect that the ultimate costs to resolve these matters will have a material adverse effect on our consolidated financial position, results of operations, or cash flows. For additional information regarding intellectual property litigation, see “Part II, Item 1A. Risk Factors-We may be found to infringe on intellectual property rights of others” herein.
75

Set forth below and elsewhere in this report and in other documents we file with the SEC are descriptions of the risks and uncertainties that could cause our actual results to differ materially from the results contemplated by the forward-looking statements contained in this report. The descriptions below include any material changes to and supersede the description of the risk factors affecting our business previously disclosed in “Part I, Item 1A. Risk Factors” of our Annual Report on Form 10-K for the fiscal year ended July 28, 2012.
OUR OPERATING RESULTS MAY FLUCTUATE IN FUTURE PERIO DS, WHICH MAY ADVERSELY AFFECT OUR STOCK PRICE
Our operating results have been in the past, and will continue to be, subject to quarterly and annual fluctuations as a result of numerous factors, some of which may contribute to more pronounced fluctuations in an uncertain global economic environment. These factors include:
76
Item 1A. Risk Factors
•
Fluctuations in demand for our products and services, especially with respect to telecommunications service providers and Internet businesses, in part due to changes in the global economic environment
•
Changes in sales and implementation cycles for our products and reduced visibility into our customers' spending plans and associated revenue
• Our ability to maintain appropriate inventory levels and purchase commitments
•
Price and product competition in the communications and networking industries, which can change rapidly due to technological innovation and different business models from various geographic regions
• The overall movement toward industry consolidation among both our competitors and our customers
•
The introduction and market acceptance of new technologies and products and our success in new and evolving markets, including in our newer product categories such as data center and collaboration and in emerging technologies, as well as the adoption of new standards
• Variations in sales channels, product costs, or mix of products sold
• The timing, size, and mix of orders from customers
• Manufacturing and customer lead times
• Fluctuations in our gross margins, and the factors that contribute to such fluctuations, as described below
•
The ability of our customers, channel partners, contract manufacturers and suppliers to obtain financing or to fund capital expenditures, especially during a period of global credit market disruption or in the event of customer, channel partner, contract manufacturer or supplier financial problems
• Share-based compensation expense
•
Actual events, circumstances, outcomes, and amounts differing from judgments, assumptions, and estimates used in determining the values of certain assets (including the amounts of related valuation allowances), liabilities, and other items reflected in our Consolidated Financial Statements
•
How well we execute on our strategy and operating plans and the impact of changes in our business model that could result in significant restructuring charges
• Our ability to achieve targeted cost reductions
• Benefits anticipated from our investments in engineering, sales and manufacturing activities
• Changes in tax laws, tax regulations and/or accounting rules

As a consequence, operating results for a particular future period are difficult to predict, and, therefore, prior results are not necessarily indicative of results to be expected in future periods. Any of the foregoing factors, or any other factors discussed elsewhere herein, could have a material adverse effect on our business, results of operations, and financial condition that could adversely affect our stock price.
OUR OPERATING RESULTS MAY BE ADVERSELY AFFECTED BY UNFAVORABLE ECONOMIC AND MARKET CONDITIONS AND THE UNCERTAIN GEOPOLITICAL ENVIRONME NT
Challenging economic conditions worldwide have from time to time contributed, and may continue to contribute, to slowdowns in the communications and networking industries at large, as well as in specific segments and markets in which we operate, resulting in:
Instability in the global credit markets, including the continuing European economic and financial turmoil related to sovereign debt issues in certain countries, the impact of uncertainty regarding the U.S. federal budget including the effect of the recent sequestration, the instability in the geopolitical environment in many parts of the world and other disruptions, such as changes in energy costs, may continue to put pressure on global economic conditions. The world has recently experienced a global macroeconomic downturn, and if global economic and market conditions, or economic conditions in key markets, remain uncertain or deteriorate further, we may experience material impacts on our business, operating results, and financial condition.
Our operating results in one or more segments may also be affected by uncertain or changing economic conditions particularly germane to that segment or to particular customer markets within that segment. For example, during fiscal 2011 we experienced a decrease in spending by our public sector customers in almost every developed market around the world, and we continue to see decreases in spending within certain categories of our public sector customer market.
WE HAVE BEEN INVESTING IN PRIORITIES, INCLUDING OUR FOUNDATIONAL PRIORITIES, AND IF THE RETURN ON THESE INVESTMENTS IS LOWER OR DEVELOPS MORE SLOWLY THAN WE EXPECT, OUR OPERATING RESULTS MAY BE HARMED
We have been realigning and are dedicating resources to focus on certain priorities, such as leadership in our core routing, switching and services, including security and mobility solutions; collaboration; data center virtualization and cloud; video; and architectures for business transformation. However, the return on our investments in such priorities may be lower, or may develop more slowly, than we expect. If we do not achieve the benefits anticipated from these investments (including if our selection of areas for investment does not play out as we expect), or if the achievement of these benefits is delayed, our operating results may be adversely affected.
OUR REVENUE FOR A PARTICULAR PERIOD IS DIFFICULT TO PREDICT, AND A SHORTFALL IN REVENUE MAY HARM OUR OPERATING RESULTS
As a result of a variety of factors discussed in this report, our revenue for a particular quarter is difficult to predict, especially in light of the recent global economic downturn and related market uncertainty. Our net sales may grow at a slower rate than in past periods or may decline, which for example occurred in fiscal 2009. Our ability to meet financial expectations could also be adversely affected if the nonlinear sales pattern seen in some of our past quarters recurs in future periods. We have experienced periods of time during which shipments have exceeded net bookings or manufacturing issues have delayed shipments, leading to nonlinearity in shipping patterns. In addition to making it difficult to predict revenue for a particular period, nonlinearity in shipping can increase costs, because irregular shipment patterns result in periods of underutilized capacity and periods in which overtime expenses may be incurred, as well as in potential additional inventory management-related costs. In addition, to the extent that manufacturing issues and any related component shortages result in delayed shipments in the future, and particularly
77
•
Reduced demand for our products as a result of continued constraints on IT-related capital spending by our customers, particularly service providers, and other customer markets as well
•
Increased price competition for our products, not only from our competitors but also as a consequence of customers disposing of unutilized products
• Risk of excess and obsolete inventories
• Risk of supply constraints
• Risk of excess facilities and manufacturing capacity
• Higher overhead costs as a percentage of revenue and higher interest expense
in periods in which our contract manufacturers are operating at higher levels of capacity, it is possible that revenue for a quarter could be adversely affected if such matters occur and are not remediated within the same quarter.
The timing of large orders can also have a significant effect on our business and operating results from quarter to quarter, primarily in the United States and in emerging countries. From time to time, we receive large orders that have a significant effect on our operating results in the period in which the order is recognized as revenue. The timing of such orders is difficult to predict, and the timing of revenue recognition from such orders may affect period to period changes in net sales. As a result, our operating results could vary materially from quarter to quarter based on the receipt of such orders and their ultimate recognition as revenue.
Inventory management remains an area of focus. We experienced longer than normal lead times on several of our products in fiscal 2010. This was attributable in part to increasing demand driven by the improvement in our overall markets, and similar to what has happened in the industry, the longer than normal lead time extensions also stemmed from supplier constraints based upon their labor and other actions taken during the global economic downturn. Additionally, the earthquake and tsunami in Japan during the third quarter of fiscal 2011 and the flooding in Thailand in the first quarter of fiscal 2012 resulted in industry wide component supply constraints. Longer manufacturing lead times in the past have caused some customers to place the same order multiple times within our various sales channels and to cancel the duplicative orders upon receipt of the product, or to place orders with other vendors with shorter manufacturing lead times. Such multiple ordering (along with other factors) or risk of order cancellation may cause difficulty in predicting our sales and, as a result, could impair our ability to manage parts inventory effectively. In addition, our efforts to improve manufacturing lead-time performance may result in corresponding reductions in order backlog. A decline in backlog levels could result in more variability and less predictability in our quarter-to-quarter net sales and operating results. In addition, when facing component supply-related challenges, we have increased our efforts in procuring components in order to meet customer expectations which in turn contribute to an increase in purchase commitments. Increases in our purchase commitments to shorten lead times could also lead to excess and obsolete inventory charges if the demand for our products is less than our expectations.
We plan our operating expense levels based primarily on forecasted revenue levels. These expenses and the impact of long-term commitments are relatively fixed in the short term. A shortfall in revenue could lead to operating results being below expectations because we may not be able to quickly reduce these fixed expenses in response to short-term business changes.
Any of the above factors could have a material adverse impact on our operations and financial results.
WE EXPECT GROSS MARGIN TO VARY OVER TIME, AND OUR L EVEL OF PRODUCT GROSS MARGIN MAY NOT BE SUSTAINABLE
Our level of product gross margins declined in fiscal 2011 and to a lesser extent in fiscal 2012 and may continue to decline and be adversely affected by numerous factors, including:
78
• Changes in customer, geographic, or product mix, including mix of configurations within each product group
• Introduction of new products, including products with price-performance advantages
• Our ability to reduce production costs
•
Entry into new markets or growth in lower margin markets, including markets with different pricing and cost structures, through acquisitions or internal development
• Sales discounts
•
Increases in material, labor or other manufacturing-related costs, which could be significant especially during periods of supply constraints
• Excess inventory and inventory holding charges
• Obsolescence charges
• Changes in shipment volume
• The timing of revenue recognition and revenue deferrals
•
Increased cost, loss of cost savings or dilution of savings due to changes in component pricing or charges incurred due to inventory holding periods if parts ordering does not correctly anticipate product demand or if the financial health of either contract manufacturers or suppliers deteriorates

Changes in service gross margin may result from various factors such as changes in the mix between technical support services and advanced services, as well as the timing of technical support service contract initiations and renewals and the addition of personnel and other resources to support higher levels of service business in future periods.
SALES TO THE SERVICE PROVIDER MARKET ARE ESPECIALLY VOLATILE, AND WEAKNESS IN SALES ORDERS FROM THIS INDUSTRY MAY HARM OUR OPERATING RESULTS A ND FINANCIAL CONDITION
Sales to the service provider market have been characterized by large and sporadic purchases, especially relating to our router sales and sales of certain products in our newer product categories such as Data Center, Collaboration, and Service Provider Video, in addition to longer sales cycles. In the past, we have experienced significant weakness in sales to service providers over certain extended periods of time as market conditions have fluctuated. Sales activity in this industry depends upon the stage of completion of expanding network infrastructures; the availability of funding; and the extent to which service providers are affected by regulatory, economic, and business conditions in the country of operations. Weakness in orders from this industry, including as a result of any slowdown in capital expenditures by service providers (which may be more prevalent during a global economic downturn or periods of economic uncertainty), could have a material adverse effect on our business, operating results, and financial condition. For example, during fiscal 2009, we experienced a slowdown in service provider capital expenditures globally, and in fiscal 2011 we experienced a slowdown in certain segments of this market, including in capital expenditures by some service provider customers and in sales of our traditional cable set-top boxes in our then United States and Canada segment. Such slowdowns may continue or recur in future periods. Orders from this industry could decline for many reasons other than the competitiveness of our products and services within their respective markets. For example, in the past, many of our service provider customers have been materially and adversely affected by slowdowns in the general economy, by overcapacity, by changes in the service provider market, by regulatory developments, and by constraints on capital availability, resulting in business failures and substantial reductions in spending and expansion plans. These conditions have materially harmed our business and operating results in the past, and some of these or other conditions in the service provider market could affect our business and operating results in any future period. Finally, service provider customers typically have longer implementation cycles; require a broader range of services, including design services; demand that vendors take on a larger share of risks; often require acceptance provisions, which can lead to a delay in revenue recognition; and expect financing from vendors. All these factors can add further risk to business conducted with service providers.
DISRUPTION OF OR CHANGES IN OUR DISTRIBUTION MODEL COULD HARM OUR SALES AND MARGINS
If we fail to manage distribution of our products and services properly, or if our distributors' financial condition or operations weaken, our revenue and gross margins could be adversely affected.
A substantial portion of our products and services is sold through our channel partners, and the remainder is sold through direct sales. Our channel partners include systems integrators, service providers, other resellers, and distributors. Systems integrators and service providers typically sell directly to end users and often provide system installation, technical support, professional services, and other support services in addition to network equipment sales. Systems integrators also typically integrate our products into an overall solution, and a number of service providers are also systems integrators. Distributors stock inventory and typically sell to systems integrators, service providers, and other resellers. We refer to sales through distributors as our two-tier system of sales to the end customer. Revenue from distributors is generally recognized based on a sell-through method using information provided by them. These distributors are generally given business terms that allow them to return a portion of inventory, receive credits for changes in selling prices, and participate in various cooperative marketing programs. If sales through indirect channels increase, this may lead to greater difficulty in forecasting the mix of our products and, to a degree, the timing of orders from our customers.
79
• Lower than expected benefits from value engineering
• Increased price competition, including competitors from Asia, especially from China
• Changes in distribution channels
• Increased warranty costs
• Increased amortization of purchased intangible assets, especially from acquisitions
• How well we execute on our strategy and operating plans

Historically, we have seen fluctuations in our gross margins based on changes in the balance of our distribution channels. Although variability to date has not been significant, there can be no assurance that changes in the balance of our distribution model in future periods would not have an adverse effect on our gross margins and profitability.
Some factors could result in disruption of or changes in our distribution model, which could harm our sales and margins, including the following:
In addition, we depend on our channel partners globally to comply with applicable regulatory requirements. To the extent that they fail to do so, that could have a material adverse effect on our business, operating results, and financial condition.
THE MARKETS IN WHICH WE COMPETE ARE INTENSELY COMPE TITIVE, WHICH COULD ADVERSELY AFFECT OUR ACHIEVEMENT OF REVENUE GROWTH
The markets in which we compete are characterized by rapid change, converging technologies, and a migration to networking and communications solutions that offer relative advantages. These market factors represent a competitive threat to us. We compete with numerous vendors in each product category. The overall number of our competitors providing niche product solutions may increase. Also, the identity and composition of competitors may change as we increase our activity in newer product categories such as data center and collaboration and in our priorities. As we continue to expand globally, we may see new competition in different geographic regions. In particular, we have experienced price-focused competition from competitors in Asia, especially from China, and we anticipate this will continue.
Our competitors include Alcatel-Lucent; Arista Networks, Inc.; ARRIS Group, Inc.; Aruba Networks, Inc.; Avaya Inc.; Brocade Communications Systems, Inc.; Check Point Software Technologies Ltd.; Citrix Systems, Inc.; Dell Inc.; LM Ericsson Telephone Company; Extreme Networks, Inc.; F5 Networks, Inc.; Fortinet, Inc.; Hewlett-Packard Company; Huawei Technologies Co., Ltd.; International Business Machines Corporation; Juniper Networks, Inc.; LogMeIn, Inc.; Meru Networks, Inc.; Microsoft Corporation; Motorola Solutions, Inc.; Palo Alto Networks, Inc.; Polycom, Inc.; Riverbed Technology, Inc.; Symantec Corporation and VMware, Inc. ; among others.
Some of these companies compete across many of our product lines, while others are primarily focused in a specific product area. Barriers to entry are relatively low, and new ventures to create products that do or could compete with our products are regularly formed. In addition, some of our competitors may have greater resources, including technical and engineering resources, than we do. As we expand into new markets, we will face competition not only from our existing competitors but also from other competitors, including existing companies with strong technological, marketing, and sales positions in those markets. We also sometimes face competition from resellers and distributors of our products. Companies with whom we have strategic alliances in some areas may be competitors in other areas, and in our view this trend may increase.
For example, the enterprise data center is undergoing a fundamental transformation arising from the convergence of technologies, including computing, networking, storage, and software, that previously were siloed. Due to several factors, including the availability of highly scalable and general purpose microprocessors, application-specific integrated circuits offering advanced services, standards based protocols, cloud computing and virtualization, the convergence of technologies within the enterprise data center is spanning multiple, previously independent, technology segments. Also, some of our current and potential competitors for enterprise data center business have made acquisitions, or announced new strategic alliances, designed to position them to provide end-to-end technology solutions for the enterprise data center. As a result of all of these developments, we face greater competition in the development and sale of enterprise data center technologies, including competition from entities that are among our long-term strategic alliance partners. Companies that are strategic alliance partners in some areas of our business may acquire or form alliances with our competitors, thereby reducing their business with us.
80
•
We compete with some of our channel partners, including through our direct sales, which may lead these channel partners to use other suppliers that do not directly sell their own products or otherwise compete with them
• Some of our channel partners may demand that we absorb a greater share of the risks that their customers may ask them to bear
•
Some of our channel partners may have insufficient financial resources and may not be able to withstand changes and challenges in business conditions
• Revenue from indirect sales could suffer if our distributors' financial condition or operations weaken

The principal competitive factors in the markets in which we presently compete and may compete in the future include:
We also face competition from customers to which we license or supply technology and suppliers from which we transfer technology. The inherent nature of networking requires interoperability. As such, we must cooperate and at the same time compete with many companies. Any inability to effectively manage these complicated relationships with customers, suppliers, and strategic alliance partners could have a material adverse effect on our business, operating results, and financial condition and accordingly affect our chances of success.
OUR INVENTORY MANAGEMENT RELATING TO OUR SALES TO O UR TWO-TIER DISTRIBUTION CHANNEL IS COMPLEX, AND EXCESS INVENTORY MAY HARM OUR GROSS MA RGINS
We must manage our inventory relating to sales to our distributors effectively, because inventory held by them could affect our results of operations. Our distributors may increase orders during periods of product shortages, cancel orders if their inventory is too high, or delay orders in anticipation of new products. They also may adjust their orders in response to the supply of our products and the products of our competitors that are available to them, and in response to seasonal fluctuations in end-user demand. Revenue to our distributors generally is recognized based on a sell-through method using information provided by them, and they are generally given business terms that allow them to return a portion of inventory, receive credits for changes in selling price, and participate in various cooperative marketing programs. Inventory management remains an area of focus as we balance the need to maintain strategic inventory levels to ensure competitive lead times against the risk of inventory obsolescence because of rapidly changing technology and customer requirements. When facing component supply-related challenges, we have increased our efforts in procuring components in order to meet customer expectations. If we ultimately determine that we have excess inventory, we may have to reduce our prices and write down inventory, which in turn could result in lower gross margins.
SUPPLY CHAIN ISSUES, INCLUDING FINANCIAL PROBLEMS O F CONTRACT MANUFACTURERS OR COMPONENT SUPPLIERS, OR A SHORTAGE OF ADEQUATE COMPONENT SUPPLY OR MANUFACTURING CAPACITY THAT INCREASED OUR COSTS OR CAUSED A DELAY IN OUR ABILIT Y TO FULFILL ORDERS, COULD HAVE AN ADVERSE IMPACT ON OUR BUSINESS AND OPERATING RESULTS, AND OUR FAILURE TO ESTIMATE CUSTOMER DEMAND PROPERLY MAY RESULT IN EXCESS OR OBSOLETE COMPONENT SUPPLY, WHICH COULD ADVERSELY AFFECT OUR GROSS MARGINS
The fact that we do not own or operate the bulk of our manufacturing facilities and that we are reliant on our extended supply chain could have an adverse impact on the supply of our products and on our business and operating results:
81
• The ability to provide a broad range of networking and communications products and services
• Product performance
• Price
• The ability to introduce new products, including products with price-performance advantages
• The ability to reduce production costs
• The ability to provide value-added features such as security, reliability, and investment protection
• Conformance to standards
• Market presence
• The ability to provide financing
• Disruptive technology shifts and new business models
• Any financial problems of either contract manufacturers or component suppliers could either limit supply or increase costs
•
Reservation of manufacturing capacity at our contract manufacturers by other companies, inside or outside of our industry, could either limit supply or increase costs

A reduction or interruption in supply; a significant increase in the price of one or more components; a failure to adequately authorize procurement of inventory by our contract manufacturers; a failure to appropriately cancel, reschedule, or adjust our requirements based on our business needs; or a decrease in demand for our products could materially adversely affect our business, operating results, and financial condition and could materially damage customer relationships. Furthermore, as a result of binding price or purchase commitments with suppliers, we may be obligated to purchase components at prices that are higher than those available in the current market. In the event that we become committed to purchase components at prices in excess of the current market price when the components are actually used, our gross margins could decrease. We experienced longer than normal lead times on several of our products in fiscal 2010. The earthquake and tsunami in Japan during the third quarter of fiscal 2011 and the flooding in Thailand in the first quarter of fiscal 2012 resulted in industry-wide component supply constraints. Although we have generally secured additional supply or taken other mitigation actions when significant disruptions have occurred, if similar situations occur in the future, they could have a material adverse effect on our business, results of operations, and financial condition. See the risk factor above entitled “Our revenue for a particular period is difficult to predict, and a shortfall in revenue may harm our operating results.”
Our growth and ability to meet customer demands depend in part on our ability to obtain timely deliveries of parts from our suppliers and contract manufacturers. We have experienced component shortages in the past, including shortages caused by manufacturing process issues, that have affected our operations. We may in the future experience a shortage of certain component parts as a result of our own manufacturing issues, manufacturing issues at our suppliers or contract manufacturers, capacity problems experienced by our suppliers or contract manufacturers, or strong demand in the industry for those parts. A return to growth in the economy is likely to create greater pressures on us and our suppliers to accurately project overall component demand and component demands within specific product categories and to establish optimal component levels and manufacturing capacity, especially for labor-intensive components, components for which we purchase a substantial portion of the supply, or re-ramping manufacturing capacity for highly complex products. For example, during fiscal 2010, we experienced longer than normal lead times on several of our products. This was attributable in part to increasing demand driven by the improvement in our overall markets, and similar to what is happening in the industry, the longer than normal lead time extensions also stemmed from supplier constraints based upon their labor and other actions taken during the global economic downturn. If shortages or delays persist or worsen, the price of these components may increase, or the components may not be available at all, and we may also encounter shortages if we do not accurately anticipate our needs. We may not be able to secure enough components at reasonable prices or of acceptable quality to build new products in a timely manner in the quantities or configurations needed. Accordingly, our revenue and gross margins could suffer until other sources can be developed. Our operating results would also be adversely affected if, anticipating greater demand than actually develops, we commit to the purchase of more components than we need, which is more likely to occur in a period of demand uncertainties such as we are currently experiencing. There can be no assurance that we will not encounter these problems in the future. Although in many cases we use standard parts and components for our products, certain components are presently available only from a single source or limited sources, and a global economic downturn and related market uncertainty could negatively impact the availability of components from one or more of these sources, especially during times such as we have recently seen when there are supplier constraints based on labor and other actions taken during economic downturns. We may not be able to diversify sources in a timely manner, which could harm our ability to deliver products to customers and seriously impact present and future sales.
We believe that we may be faced with the following challenges in the future:
Manufacturing capacity and component supply constraints could continue to be significant issues for us. We purchase components from a variety of suppliers and use several contract manufacturers to provide manufacturing services for our products. During the normal course of business, in order to improve manufacturing lead-time performance and to help ensure adequate component supply, we enter into agreements with contract manufacturers and suppliers that either allow them to procure inventory based upon criteria as defined by us or that establish the parameters defining our requirements. In certain instances, these agreements allow us the option to cancel, reschedule, and adjust our requirements based on our business needs prior to firm orders being placed. When facing component supply-related challenges, we have increased our efforts in procuring components in order to meet customer expectations which in turn contribute to an increase in purchase commitments. For example, the earthquake in Japan during the third quarter of fiscal 2011 resulted in industry wide component supply constraints,
82
•
New markets in which we participate may grow quickly, which may make it difficult to quickly obtain significant component capacity
•
As we acquire companies and new technologies, we may be dependent, at least initially, on unfamiliar supply chains or relatively small supply partners
•
We face competition for certain components that are supply-constrained, from existing competitors, and companies in other markets

and an increase in our purchase commitments which was attributable to us securing supply components as we made commitments to secure our near term supply needs. Increases in our purchase commitments to shorten lead times could also lead to excess and obsolete inventory charges if the demand for our products is less than our expectations. If we fail to anticipate customer demand properly, an oversupply of parts could result in excess or obsolete components that could adversely affect our gross margins. For additional information regarding our purchase commitments with contract manufacturers and suppliers, see Note 12 to the Consolidated Financial Statements contained in this report.
WE DEPEND UPON THE DEVELOPMENT OF NEW PRODUCTS AND ENHANCEMENTS TO EXISTING PRODUCTS, AND IF WE FAIL TO PREDICT AND RESPOND TO EMERGING TECHNOLO GICAL TRENDS AND CUSTOMERS' CHANGING NEEDS, OUR OPERATING RESULTS AND MARKET SHARE MAY S UFFER
The markets for our products are characterized by rapidly changing technology, evolving industry standards, new product introductions, and evolving methods of building and operating networks. Our operating results depend on our ability to develop and introduce new products into existing and emerging markets and to reduce the production costs of existing products. We believe the industry is evolving to enable personal and business process collaboration enabled by networked technologies. As such, many of our strategic initiatives and investments are aimed at meeting the requirements that a network capable of multiple-party, collaborative interaction would demand, and the investments we have made and our architectural approach are designed to enable the increased use of the network as the platform for all forms of communications and IT. For example, in fiscal 2009 we launched our Cisco Unified Computing System, our next-generation enterprise data center platform architected to unite computing, network, storage access, and virtualization resources in a single system, which is designed to address the fundamental transformation occurring in the enterprise data center. Cisco Unified Computing System is one of several priorities on which we are focusing resources. Another example of a market transition we are focusing on is the move towards more programmable, flexible and virtual networks. In our view, this evolution is in its very early stages, and we believe the successful products and solutions in this market will combine ASICs, hardware, and software elements together.
The process of developing new technology, including technology related to more programmable, flexible and virtual networks, is complex and uncertain, and if we fail to accurately predict customers' changing needs and emerging technological trends our business could be harmed. We must commit significant resources, including the investments we have been making in our priorities to developing new products before knowing whether our investments will result in products the market will accept. In particular, if our model of the evolution of networking to collaborative systems does not emerge as we believe it will, or if the industry does not evolve as we believe it will, or if our strategy for addressing this evolution is not successful, many of our strategic initiatives and investments may be of no or limited value. For example, if we do not introduce products related to network programmability, such as software-defined-networking products, in a timely fashion, or if product offerings in this market that ultimately succeed are based on technology, or an approach to technology, that differs from ours, our business could be harmed. Furthermore, we may not execute successfully on our vision because of challenges with regard to product planning and timing, technical hurdles that we fail to overcome in a timely fashion, or a lack of appropriate resources. This could result in competitors, some of which may also be our strategic alliance partners, providing those solutions before we do and loss of market share, net sales, and earnings. The success of new products depends on several factors, including proper new product definition, component costs, timely completion and introduction of these products, differentiation of new products from those of our competitors, and market acceptance of these products. There can be no assurance that we will successfully identify new product opportunities, develop and bring new products to market in a timely manner, or achieve market acceptance of our products or that products and technologies developed by others will not render our products or technologies obsolete or noncompetitive. The products and technologies in our newer product categories such as Data Center and Collaboration as well as those in our Other Products category that we identify as “emerging technologies” may not prove to have the market success we anticipate, and we may not successfully identify and invest in other emerging or new products.
CHANGES IN INDUSTRY STRUCTURE AND MARKET CONDITIONS COULD LEAD TO CHARGES RELATED TO DISCONTINUANCES OF CERTAIN OF OUR PRODUCTS OR BUSINESSES AND ASSET IMPAIRMENTS
In response to changes in industry and market conditions, we may be required to strategically realign our resources and consider restructuring, disposing of, or otherwise exiting businesses. Any decision to limit investment in or dispose of or otherwise exit businesses may result in the recording of special charges, such as inventory and technology-related write-offs, workforce reduction costs, charges relating to consolidation of excess facilities, or claims from third parties who were resellers or users of discontinued products. Our estimates with respect to the useful life or ultimate recoverability of our carrying basis of assets, including purchased intangible assets, could change as a result of such assessments and decisions. Although in certain instances our supply agreements allow us the option to cancel, reschedule, and adjust our requirements based on our business needs prior to firm orders being placed, our loss contingencies may include liabilities for contracts that we cannot cancel with contract manufacturers and suppliers. Further, our estimates relating to the liabilities for excess facilities are affected by changes in real estate market conditions. Additionally, we are required to perform goodwill impairment tests on an annual basis and between annual tests in certain circumstances, and future goodwill impairment tests may result in a charge to earnings.
83

In fiscal 2012 we largely completed a process commenced in fiscal 2011 to lower our operating costs and to simplify our operating model and concentrate our focus on selected foundational priorities. We have incurred significant restructuring charges as a result of these activities. The changes to our business model may be disruptive, and the revised model that we adopt may not be more efficient or effective than the aspects of our business model that are being revised. At the same time, we believe the effect of these changes has provided a one-time productivity benefit that is not likely to be achieved on a regular basis. Our restructuring activities, including any related charges and the impact of the related headcount reductions, could have a material adverse effect on our business, operating results, and financial condition.
OVER THE LONG TERM WE INTEND TO INVEST IN ENGINEERI NG, SALES, SERVICE, MARKETING AND MANUFACTURING ACTIVITIES, AND THESE INVESTMENTS MAY ACHIEVE DELAYED, OR LOWER THAN EXPECTED, BENEFITS WHICH COULD HARM OUR OPERATING RESULTS
While we intend to focus on managing our costs and expenses, over the long term, we also intend to invest in personnel and other resources related to our engineering, sales, service, marketing and manufacturing functions as we focus on our foundational priorities, such as leadership in our core routing, switching and services, including security and mobility solutions; collaboration; data center virtualization and cloud; video; and architectures for business transformation. We are likely to recognize the costs associated with these investments earlier than some of the anticipated benefits, and the return on these investments may be lower, or may develop more slowly, than we expect. If we do not achieve the benefits anticipated from these investments, or if the achievement of these benefits is delayed, our operating results may be adversely affected.
OUR BUSINESS SUBSTANTIALLY DEPENDS UPON THE CONTINUED GROWTH OF THE INTERNET AND INTERNET-BASED SYSTEMS
A substantial portion of our business and revenue depends on growth and evolution of the Internet, including the continued development of the Internet, and on the deployment of our products by customers who depend on such continued growth and evolution. To the extent that an economic slowdown or economic uncertainty and related reduction in capital spending adversely affect spending on Internet infrastructure we could experience material harm to our business, operating results, and financial condition.
Because of the rapid introduction of new products and changing customer requirements related to matters such as cost-effectiveness and security, we believe that there could be performance problems with Internet communications in the future, which could receive a high degree of publicity and visibility. Because we are a large supplier of networking products, our business, operating results, and financial condition may be materially adversely affected, regardless of whether or not these problems are due to the performance of our own products. Such an event could also result in a material adverse effect on the market price of our common stock independent of direct effects on our business.
WE HAVE MADE AND EXPECT TO CONTINUE TO MAKE ACQUISI TIONS THAT COULD DISRUPT OUR OPERATIONS AND HARM OUR OPERATING RESULTS
Our growth depends upon market growth, our ability to enhance our existing products, and our ability to introduce new products on a timely basis. We intend to continue to address the need to develop new products and enhance existing products through acquisitions of other companies, product lines, technologies, and personnel. Acquisitions involve numerous risks, including the following:
84
•
Difficulties in integrating the operations, systems, technologies, products, and personnel of the acquired companies, particularly companies with large and widespread operations and/or complex products, such as Scientific-Atlanta, WebEx, Starent, Tandberg and NDS Group Limited
•
Diversion of management's attention from normal daily operations of the business and the challenges of managing larger and more widespread operations resulting from acquisitions
• Potential difficulties in completing projects associated with in-process research and development intangibles
•
Difficulties in entering markets in which we have no or limited direct prior experience and where competitors in such markets have stronger market positions
• Initial dependence on unfamiliar supply chains or relatively small supply partners
• Insufficient revenue to offset increased expenses associated with acquisitions
•
The potential loss of key employees, customers, distributors, vendors and other business partners of the companies we acquire following and continuing after announcement of acquisition plans

Acquisitions may also cause us to:
Mergers and acquisitions of high-technology companies are inherently risky and subject to many factors outside of our control, and no assurance can be given that our previous or future acquisitions will be successful and will not materially adversely affect our business, operating results, or financial condition. Failure to manage and successfully integrate acquisitions could materially harm our business and operating results. Prior acquisitions have resulted in a wide range of outcomes, from successful introduction of new products and technologies to a failure to do so. Even when an acquired company has already developed and marketed products, there can be no assurance that product enhancements will be made in a timely fashion or that pre-acquisition due diligence will have identified all possible issues that might arise with respect to such products.
From time to time, we have made acquisitions that resulted in charges in an individual quarter. These charges may occur in any particular quarter, resulting in variability in our quarterly earnings. In addition, our effective tax rate for future periods is uncertain and could be impacted by mergers and acquisitions. Risks related to new product development also apply to acquisitions. Please see the risk factors above, including the risk factor entitled “We depend upon the development of new products and enhancements to existing products, and if we fail to predict and respond to emerging technological trends and customers' changing needs, our operating results and market share may suffer” for additional information.
ENTRANCE INTO NEW OR DEVELOPING MARKETS EXPOSES US TO ADDITIONAL COMPETITION AND WILL LIKELY INCREASE DEMANDS ON OUR SERVICE AND SUPPORT OPERATIONS
As we focus on new market opportunities-for example, storage; wireless; security; transporting data, voice, and video traffic across the same network; and other areas within our newer products categories such as data center and collaboration, emerging technologies, and our priorities-we will increasingly compete with large telecommunications equipment suppliers as well as startup companies. Several of our competitors may have greater resources, including technical and engineering resources, than we do. Additionally, as customers in these markets complete infrastructure deployments, they may require greater levels of service, support, and financing than we have provided in the past, especially in emerging countries. Demand for these types of service, support, or financing contracts may increase in the future. There can be no assurance that we can provide products, service, support, and financing to effectively compete for these market opportunities.
Further, provision of greater levels of services, support and financing by us may result in a delay in the timing of revenue recognition. In addition, entry into other markets has subjected and will subject us to additional risks, particularly to those markets, including the effects of general market conditions and reduced consumer confidence.
INDUSTRY CONSOLIDATION MAY LEAD TO INCREASED COMPET ITION AND MAY HARM OUR OPERATING RESULTS
There has been a trend toward industry consolidation in our markets for several years. We expect this trend to continue as companies attempt to strengthen or hold their market positions in an evolving industry and as companies are acquired or are unable to continue operations. For example, some of our current and potential competitors for enterprise data center business have made acquisitions, or announced new strategic alliances, designed to position them with the ability to provide end-to-end
85
• Issue common stock that would dilute our current shareholders' percentage ownership
•
Use a substantial portion of our cash resources, or incur debt, as we did in fiscal 2006 when we issued and sold $6.5 billion in senior unsecured notes to fund our acquisition of Scientific-Atlanta
•
Significantly increase our interest expense, leverage and debt service requirements if we incur additional debt to pay for an acquisition
• Assume liabilities
•
Record goodwill and nonamortizable intangible assets that are subject to impairment testing on a regular basis and potential periodic impairment charges
• Incur amortization expenses related to certain intangible assets
•
Incur tax expenses related to the effect of acquisitions on our intercompany research and development (“R&D”) cost sharing arrangement and legal structure
• Incur large and immediate write-offs and restructuring and other related expenses
• Become subject to intellectual property or other litigation

technology solutions for the enterprise data center. Companies that are strategic alliance partners in some areas of our business may acquire or form alliances with our competitors, thereby reducing their business with us. We believe that industry consolidation may result in stronger competitors that are better able to compete as sole-source vendors for customers. This could lead to more variability in our operating results and could have a material adverse effect on our business, operating results, and financial condition. Furthermore, particularly in the service provider market, rapid consolidation will lead to fewer customers, with the effect that loss of a major customer could have a material impact on results not anticipated in a customer marketplace composed of more numerous participants.
PRODUCT QUALITY PROBLEMS COULD LEAD TO REDUCED REVE NUE, GROSS MARGINS, AND NET INCOME
We produce highly complex products that incorporate leading-edge technology, including both hardware and software. Software typically contains bugs that can unexpectedly interfere with expected operations. There can be no assurance that our preshipment testing programs will be adequate to detect all defects, either ones in individual products or ones that could affect numerous shipments, which might interfere with customer satisfaction, reduce sales opportunities, or affect gross margins. From time to time, we have had to replace certain components and provide remediation in response to the discovery of defects or bugs in products that we had shipped. There can be no assurance that such remediation, depending on the product involved, would not have a material impact. An inability to cure a product defect could result in the failure of a product line, temporary or permanent withdrawal from a product or market, damage to our reputation, inventory costs, or product reengineering expenses, any of which could have a material impact on our revenue, margins, and net income.
DUE TO THE GLOBAL NATURE OF OUR OPERATIONS, POLITIC AL OR ECONOMIC CHANGES OR OTHER FACTORS IN A SPECIFIC COUNTRY OR REGION COULD HARM OUR OPERATI NG RESULTS AND FINANCIAL CONDITION
We conduct significant sales and customer support operations in countries around the world and also depend on non-U.S. operations of our contract manufacturers, component suppliers and distribution partners. Although sales in several of our emerging countries decreased during the recent global economic downturn, several of our emerging countries generally have been relatively fast growing, and we have announced plans to expand our commitments and expectations in certain of those countries. As such, our growth depends in part on our increasing sales into emerging countries. Our future results could be materially adversely affected by a variety of political, economic or other factors relating to our operations inside and outside the United States, including impacts from the U.S. federal budget including the effect of the recent sequestration, the global macroeconomic environment and continuing challenges in Europe, whose macroeconomic condition could deteriorate further, any or all of which could have a material adverse effect on our operating results and financial condition, including, among others, the following:
WE ARE EXPOSED TO THE CREDIT RISK OF SOME OF OUR CU STOMERS AND TO CREDIT EXPOSURES IN WEAKENED MARKETS, WHICH COULD RESULT IN MATERIAL LOSSES
Most of our sales are on an open credit basis, with typical payment terms of 30 days in the United States and, because of local customs or conditions, longer in some markets outside the United States. We monitor individual customer payment capability in granting such open credit arrangements, seek to limit such open credit to amounts we believe the customers can pay, and
86
•
The worldwide impact of the recent global economic downturn and related market uncertainty, including the ongoing European economic and financial turmoil related to sovereign debt issues in certain countries
• Foreign currency exchange rates
• Political or social unrest
•
Economic instability or weakness or natural disasters in a specific country or region; environmental and trade protection measures and other legal and regulatory requirements, some of which may affect our ability to import our products, to export our products from, or sell our products in various countries
• Political considerations that affect service provider and government spending patterns
• Health or similar issues, such as a pandemic or epidemic
• Difficulties in staffing and managing international operations
• Adverse tax consequences, including imposition of withholding or other taxes on payments by subsidiaries
maintain reserves we believe are adequate to cover exposure for doubtful accounts. Beyond our open credit arrangements, we have also experienced demands for customer financing and facilitation of leasing arrangements. We expect demand for customer financing to continue, and recently we have been experiencing an increase in this demand as the credit markets have been impacted by the recent global economic downturn and related market uncertainty, including increased demand from customers in certain emerging countries. We believe customer financing is a competitive factor in obtaining business, particularly in serving customers involved in significant infrastructure projects. Our loan financing arrangements may include not only financing the acquisition of our products and services but also providing additional funds for other costs associated with network installation and integration of our products and services.
Our exposure to the credit risks relating to our financing activities described above may increase if our customers are adversely affected by a global economic downturn or periods of economic uncertainty. Although we have programs in place that are designed to monitor and mitigate the associated risk, including monitoring of particular risks in certain geographic areas, there can be no assurance that such programs will be effective in reducing our credit risks.
In the past, there have been significant bankruptcies among customers both on open credit and with loan or lease financing arrangements, particularly among Internet businesses and service providers, causing us to incur economic or financial losses. There can be no assurance that additional losses will not be incurred. Although these losses have not been material to date, future losses, if incurred, could harm our business and have a material adverse effect on our operating results and financial condition. A portion of our sales is derived through our distributors. These distributors are generally given business terms that allow them to return a portion of inventory, receive credits for changes in selling prices, and participate in various cooperative marketing programs. We maintain estimated accruals and allowances for such business terms. However, distributors tend to have more limited financial resources than other resellers and end-user customers and therefore represent potential sources of increased credit risk, because they may be more likely to lack the reserve resources to meet payment obligations. Additionally, to the degree that turmoil in the credit markets makes it more difficult for some customers to obtain financing, those customers' ability to pay could be adversely impacted, which in turn could have a material adverse impact on our business, operating results, and financial condition.
WE ARE EXPOSED TO FLUCTUATIONS IN CURRENCY EXCHANGE RATES THAT COULD NEGATIVELY IMPACT OUR FINANCIAL RESULTS AND CASH FLOWS
Because a significant portion of our business is conducted outside the United States, we face exposure to adverse movements in foreign currency exchange rates. These exposures may change over time as business practices evolve, and they could have a material adverse impact on our financial results and cash flows. Historically, our primary exposures have related to nondollar-denominated sales in Japan, Canada, and Australia and certain nondollar-denominated operating expenses and service cost of sales in Europe, Latin America, and Asia, where we sell primarily in U.S. dollars. Additionally, we have exposures to emerging market currencies, which can have extreme currency volatility. An increase in the value of the dollar could increase the real cost to our customers of our products in those markets outside the United States where we sell in dollars, and a weakened dollar could increase the cost of local operating expenses and procurement of raw materials to the extent that we must purchase components in foreign currencies.
Currently, we enter into foreign exchange forward contracts and options to reduce the short-term impact of foreign currency fluctuations on certain foreign currency receivables, investments, and payables. In addition, we periodically hedge anticipated foreign currency cash flows. Our attempts to hedge against these risks may not be successful, resulting in an adverse impact on our net income.
OUR PROPRIETARY RIGHTS MAY PROVE DIFFICULT TO ENFOR CE
We generally rely on patents, copyrights, trademarks, and trade secret laws to establish and maintain proprietary rights in our technology and products. Although we have been issued numerous patents and other patent applications are currently pending, there can be no assurance that any of these patents or other proprietary rights will not be challenged, invalidated, or circumvented or that our rights will, in fact, provide competitive advantages to us. Furthermore, many key aspects of networking technology are governed by industrywide standards, which are usable by all market entrants. In addition, there can be no assurance that patents will be issued from pending applications or that claims allowed on any patents will be sufficiently broad to protect our technology. In addition, the laws of some foreign countries may not protect our proprietary rights to the same extent as do the laws of the United States. The outcome of any actions taken in these foreign countries may be different than if such actions were determined under the laws of the United States. Although we are not dependent on any individual patents or group of patents for particular segments of the business for which we compete, if we are unable to protect our proprietary rights to the totality of the features (including aspects of products protected other than by patent rights) in a market, we may find ourselves at a competitive disadvantage to others who need not incur the substantial expense, time, and effort required to create innovative products that have enabled us to be successful.
87

WE MAY BE FOUND TO INFRINGE ON INTELLECTUAL PROPERT Y RIGHTS OF OTHERS
Third parties, including customers, have in the past and may in the future assert claims or initiate litigation related to exclusive patent, copyright, trademark, and other intellectual property rights to technologies and related standards that are relevant to us. These assertions have increased over time as a result of our growth and the general increase in the pace of patent claims assertions, particularly in the United States. Because of the existence of a large number of patents in the networking field, the secrecy of some pending patents, and the rapid rate of issuance of new patents, it is not economically practical or even possible to determine in advance whether a product or any of its components infringes or will infringe on the patent rights of others. The asserted claims and/or initiated litigation can include claims against us or our manufacturers, suppliers, or customers, alleging infringement of their proprietary rights with respect to our existing or future products or components of those products. Regardless of the merit of these claims, they can be time-consuming, result in costly litigation and diversion of technical and management personnel, or require us to develop a non-infringing technology or enter into license agreements. Where claims are made by customers, resistance even to unmeritorious claims could damage customer relationships. There can be no assurance that licenses will be available on acceptable terms and conditions, if at all, or that our indemnification by our suppliers will be adequate to cover our costs if a claim were brought directly against us or our customers. Furthermore, because of the potential for high court awards that are not necessarily predictable, it is not unusual to find even arguably unmeritorious claims settled for significant amounts. If any infringement or other intellectual property claim made against us by any third party is successful, if we are required to indemnify a customer with respect to a claim against the customer, or if we fail to develop non-infringing technology or license the proprietary rights on commercially reasonable terms and conditions, our business, operating results, and financial condition could be materially and adversely affected.
Our exposure to risks associated with the use of intellectual property may be increased as a result of acquisitions, as we have a lower level of visibility into the development process with respect to such technology or the care taken to safeguard against infringement risks. Further, in the past, third parties have made infringement and similar claims after we have acquired technology that had not been asserted prior to our acquisition.
WE RELY ON THE AVAILABILITY OF THIRD-PARTY LICENSES
Many of our products are designed to include software or other intellectual property licensed from third parties. It may be necessary in the future to seek or renew licenses relating to various aspects of these products. There can be no assurance that the necessary licenses would be available on acceptable terms, if at all. The inability to obtain certain licenses or other rights or to obtain such licenses or rights on favorable terms, or the need to engage in litigation regarding these matters, could have a material adverse effect on our business, operating results, and financial condition. Moreover, the inclusion in our products of software or other intellectual property licensed from third parties on a nonexclusive basis could limit our ability to protect our proprietary rights in our products.
OUR OPERATING RESULTS AND FUTURE PROSPECTS COULD BE MATERIALLY HARMED BY UNCERTAINTIES OF REGULATION OF THE INTERNET
Currently, few laws or regulations apply directly to access or commerce on the Internet. We could be materially adversely affected by regulation of the Internet and Internet commerce in any country where we operate. Such regulations could include matters such as voice over the Internet or using IP, encryption technology, sales taxes on Internet product sales, and access charges for Internet service providers. The adoption of regulation of the Internet and Internet commerce could decrease demand for our products and, at the same time, increase the cost of selling our products, which could have a material adverse effect on our business, operating results, and financial condition.
CHANGES IN TELECOMMUNICATIONS REGULATION AND TARIFF S COULD HARM OUR PROSPECTS AND FUTURE SALES
Changes in telecommunications requirements, or regulatory requirements in other industries in which we operate, in the United States or other countries could affect the sales of our products. In particular, we believe that there may be future changes in U.S. telecommunications regulations that could slow the expansion of the service providers' network infrastructures and materially adversely affect our business, operating results, and financial condition.
Future changes in tariffs by regulatory agencies or application of tariff requirements to currently untariffed services could affect the sales of our products for certain classes of customers. Additionally, in the United States, our products must comply with various requirements and regulations of the Federal Communications Commission and other regulatory authorities. In countries outside of the United States, our products must meet various requirements of local telecommunications and other industry authorities. Changes in tariffs or failure by us to obtain timely approval of products could have a material adverse effect on our business, operating results, and financial condition.
88

FAILURE TO RETAIN AND RECRUIT KEY PERSONNEL WOULD H ARM OUR ABILITY TO MEET KEY OBJECTIVES
Our success has always depended in large part on our ability to attract and retain highly skilled technical, managerial, sales, and marketing personnel. Competition for these personnel is intense, especially in the Silicon Valley area of Northern California. Stock incentive plans are designed to reward employees for their long-term contributions and provide incentives for them to remain with us. Volatility or lack of positive performance in our stock price or equity incentive awards, or changes to our overall compensation program, including our stock incentive program, resulting from the management of share dilution and share-based compensation expense or otherwise, may also adversely affect our ability to retain key employees. As a result of one or more of these factors, we may increase our hiring in geographic areas outside the United States, which could subject us to additional geopolitical and exchange rate risk. The loss of services of any of our key personnel; the inability to retain and attract qualified personnel in the future; or delays in hiring required personnel, particularly engineering and sales personnel, could make it difficult to meet key objectives, such as timely and effective product introductions. In addition, companies in our industry whose employees accept positions with competitors frequently claim that competitors have engaged in improper hiring practices. We have received these claims in the past and may receive additional claims to this effect in the future.
ADVERSE RESOLUTION OF LITIGATION OR GOVERNMENTAL IN VESTIGATIONS MAY HARM OUR OPERATING RESULTS OR FINANCIAL CONDITION
We are a party to lawsuits in the normal course of our business. Litigation can be expensive, lengthy, and disruptive to normal business operations. Moreover, the results of complex legal proceedings are difficult to predict. For example, Brazilian authorities have investigated our Brazilian subsidiary and certain of its current and former employees, as well as a Brazilian importer of our products, and its affiliates and employees, relating to alleged evasion of import taxes and alleged improper transactions involving the subsidiary and the importer. Brazilian tax authorities have assessed claims against our Brazilian subsidiary based on a theory of joint liability with the Brazilian importer for import taxes, interest, and penalties. In the first quarter of fiscal 2013, the Brazilian federal tax authorities asserted an additional claim against our Brazilian subsidiary based on a theory of joint liability with respect to an alleged underpayment of income taxes, social taxes, interest, and penalties by a Brazilian distributor. The asserted claims by Brazilian federal tax authorities are for calendar years 2003 through 2008 and the related asserted claims by the tax authorities from the state of Sao Paulo are for calendar years 2005 through 2007. The total asserted claims by Brazilian state and federal tax authorities aggregate to approximately $432 million for the alleged evasion of import and other taxes, approximately $1.2 billion for interest, and approximately $1.9 billion for various penalties, all determined using an exchange rate as of April 27, 2013. We have completed a thorough review of the matters and believe the asserted claims against our Brazilian subsidiary are without merit, and we are defending the claims vigorously. While we believe there is no legal basis for the alleged liability, due to the complexities and uncertainty surrounding the judicial process in Brazil and the nature of the claims asserting joint liability with the importer, we are unable to determine the likelihood of an unfavorable outcome against our Brazilian subsidiary and are unable to reasonably estimate a range of loss, if any. We do not expect a final judicial determination for several years. An unfavorable resolution of lawsuits or governmental investigations could have a material adverse effect on our business, operating results, or financial condition. For additional information regarding certain of the matters in which we are involved, see Item 1, “Legal Proceedings,” contained in Part II of this report.
CHANGES IN OUR PROVISION FOR INCOME TAXES OR ADVERS E OUTCOMES RESULTING FROM EXAMINATION OF OUR INCOME TAX RETURNS COULD ADVERSELY AFFECT OUR R ESULTS
Our provision for income taxes is subject to volatility and could be adversely affected by earnings being lower than anticipated in countries that have lower tax rates and higher than anticipated in countries that have higher tax rates; by changes in the valuation of our deferred tax assets and liabilities; by expiration of or lapses in the R&D tax credit laws; by expiration of or lapses in tax incentives; by transfer pricing adjustments, including the effect of acquisitions on our intercompany R&D cost sharing arrangement and legal structure; by tax effects of nondeductible compensation; by tax costs related to intercompany realignments; by changes in accounting principles; or by changes in tax laws and regulations, including possible U.S. changes to the taxation of earnings of our foreign subsidiaries, the deductibility of expenses attributable to foreign income, or the foreign tax credit rules. Significant judgment is required to determine the recognition and measurement attribute prescribed in the accounting guidance for uncertainty in income taxes. The accounting guidance for uncertainty in income taxes applies to all income tax positions, including the potential recovery of previously paid taxes, which if settled unfavorably could adversely impact our provision for income taxes or additional paid-in capital. Further, as a result of certain of our ongoing employment and capital investment actions and commitments, our income in certain countries is subject to reduced tax rates and in some cases is wholly exempt from tax. Our failure to meet these commitments could adversely impact our provision for income taxes. In addition, we are subject to the continuous examination of our income tax returns by the Internal Revenue Service and other tax authorities. We regularly assess the likelihood of adverse outcomes resulting from these examinations to determine the adequacy of our provision for income taxes. There can be no assurance that the outcomes from these continuous examinations will not have an adverse effect on our operating results and financial condition.
89

OUR BUSINESS AND OPERATIONS ARE ESPECIALLY SUBJECT TO THE RISKS OF EARTHQUAKES, FLOODS, AND OTHER NATURAL CATASTROPHIC EVENTS
Our corporate headquarters, including certain of our research and development operations are located in the Silicon Valley area of Northern California, a region known for seismic activity. Additionally, a certain number of our facilities are located near rivers that have experienced flooding in the past. Also certain of our suppliers and logistics centers are located in regions that have or may be affected by recent earthquake, tsunami and flooding activity which has and could continue to disrupt the flow of components and delivery of products. A significant natural disaster, such as an earthquake, a hurricane, volcano, or a flood, could have a material adverse impact on our business, operating results, and financial condition.
MAN- MADE PROBLEMS SUCH AS COMPUTER VIRUSES OR TERRORISM MAY DISRUPT OUR OPERATIONS AND HARM OUR OPERATING RESULTS
Despite our implementation of network security measures our servers are vulnerable to computer viruses, break-ins, and similar disruptions from unauthorized tampering with our computer systems. Any such event could have a material adverse effect on our business, operating results, and financial condition. Efforts to limit the ability of malicious third parties to disrupt the operations of the Internet or undermine our own security efforts may meet with resistance. In addition, the continued threat of terrorism and heightened security and military action in response to this threat, or any future acts of terrorism, may cause further disruptions to the economies of the United States and other countries and create further uncertainties or otherwise materially harm our business, operating results, and financial condition. Likewise, events such as widespread blackouts could have similar negative impacts. To the extent that such disruptions or uncertainties result in delays or cancellations of customer orders or the manufacture or shipment of our products, our business, operating results, and financial condition could be materially and adversely affected.
WE ARE EXPOSED TO FLUCTUATIONS IN THE MARKET VALUES OF OUR PORTFOLIO INVESTMENTS AND IN INTEREST RATES; IMPAIRMENT OF OUR INVESTMENTS COULD HARM OUR EARNINGS
We maintain an investment portfolio of various holdings, types, and maturities. These securities are generally classified as available-for-sale and, consequently, are recorded on our Consolidated Balance Sheets at fair value with unrealized gains or losses reported as a component of accumulated other comprehensive income, net of tax. Our portfolio includes fixed income securities and equity investments in publicly traded companies, the values of which are subject to market price volatility to the extent unhedged. If such investments suffer market price declines, as we experienced with some of our investments during fiscal 2009, we may recognize in earnings the decline in the fair value of our investments below their cost basis when the decline is judged to be other than temporary. For information regarding the sensitivity of and risks associated with the market value of portfolio investments and interest rates, refer to the section titled “Quantitative and Qualitative Disclosures About Market Risk.” Our investments in private companies are subject to risk of loss of investment capital. These investments are inherently risky because the markets for the technologies or products they have under development are typically in the early stages and may never materialize. We could lose our entire investment in these companies.
IF WE DO NOT SUCCESSFULLY MANAGE OUR STRATEGIC ALLI ANCES, WE MAY NOT REALIZE THE EXPECTED BENEFITS FROM SUCH ALLIANCES AND WE MAY EXPERIENCE INCREASED COMPETITION OR DELAYS IN PRODUCT DEVELOPMENT
We have several strategic alliances with large and complex organizations and other companies with which we work to offer complementary products and services and have established a joint venture to market services associated with our Cisco Unified Computing System products. These arrangements are generally limited to specific projects, the goal of which is generally to facilitate product compatibility and adoption of industry standards. There can be no assurance we will realize the expected benefits from these strategic alliances or from the joint venture. If successful, these relationships may be mutually beneficial and result in industry growth. However, alliances carry an element of risk because, in most cases, we must compete in some business areas with a company with which we have a strategic alliance and, at the same time, cooperate with that company in other business areas. Also, if these companies fail to perform or if these relationships fail to materialize as expected, we could suffer delays in product development or other operational difficulties. Joint ventures can be difficult to manage, given the potentially different interests of joint venture partners.
OUR STOCK PRICE MAY BE VOLATILE
Historically, our common stock has experienced substantial price volatility, particularly as a result of variations between our actual financial results and the published expectations of analysts and as a result of announcements by our competitors and us. Furthermore, speculation in the press or investment community about our strategic position, financial condition, results of operations, business, security of our products, or significant transactions can cause changes in our stock price. In addition, the stock market has experienced extreme price and volume fluctuations that have affected the market price of many technology companies, in particular, and that have often been unrelated to the operating performance of these companies. These factors, as well as general economic and political conditions and the announcement of proposed and completed acquisitions or other
90
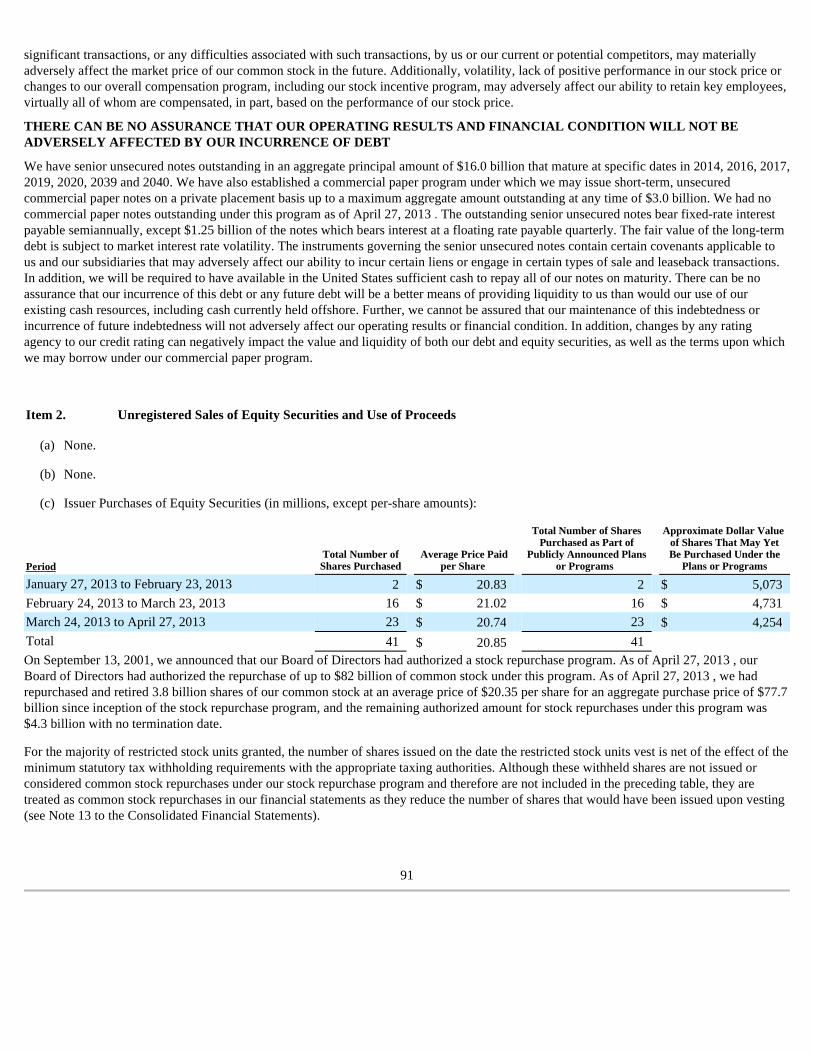
significant transactions, or any difficulties associated with such transactions, by us or our current or potential competitors, may materially adversely affect the market price of our common stock in the future. Additionally, volatility, lack of positive performance in our stock price or changes to our overall compensation program, including our stock incentive program, may adversely affect our ability to retain key employees, virtually all of whom are compensated, in part, based on the performance of our stock price.
THERE CAN BE NO ASSURANCE THAT OUR OPERATING RESULT S AND FINANCIAL CONDITION WILL NOT BE ADVERSELY AFFECTED BY OUR INCURRENCE OF DEBT
We have senior unsecured notes outstanding in an aggregate principal amount of $16.0 billion that mature at specific dates in 2014, 2016, 2017, 2019, 2020, 2039 and 2040. We have also established a commercial paper program under which we may issue short-term, unsecured commercial paper notes on a private placement basis up to a maximum aggregate amount outstanding at any time of $3.0 billion. We had no commercial paper notes outstanding under this program as of April 27, 2013 . The outstanding senior unsecured notes bear fixed-rate interest payable semiannually, except $1.25 billion of the notes which bears interest at a floating rate payable quarterly. The fair value of the long-term debt is subject to market interest rate volatility. The instruments governing the senior unsecured notes contain certain covenants applicable to us and our subsidiaries that may adversely affect our ability to incur certain liens or engage in certain types of sale and leaseback transactions. In addition, we will be required to have available in the United States sufficient cash to repay all of our notes on maturity. There can be no assurance that our incurrence of this debt or any future debt will be a better means of providing liquidity to us than would our use of our existing cash resources, including cash currently held offshore. Further, we cannot be assured that our maintenance of this indebtedness or incurrence of future indebtedness will not adversely affect our operating results or financial condition. In addition, changes by any rating agency to our credit rating can negatively impact the value and liquidity of both our debt and equity securities, as well as the terms upon which we may borrow under our commercial paper program.
On September 13, 2001, we announced that our Board of Directors had authorized a stock repurchase program. As of April 27, 2013 , our Board of Directors had authorized the repurchase of up to $82 billion of common stock under this program. As of April 27, 2013 , we had repurchased and retired 3.8 billion shares of our common stock at an average price of $20.35 per share for an aggregate purchase price of $77.7 billion since inception of the stock repurchase program, and the remaining authorized amount for stock repurchases under this program was $4.3 billion with no termination date.
For the majority of restricted stock units granted, the number of shares issued on the date the restricted stock units vest is net of the effect of the minimum statutory tax withholding requirements with the appropriate taxing authorities. Although these withheld shares are not issued or considered common stock repurchases under our stock repurchase program and therefore are not included in the preceding table, they are treated as common stock repurchases in our financial statements as they reduce the number of shares that would have been issued upon vesting (see Note 13 to the Consolidated Financial Statements).
91
Item 2. Unregistered Sales of Equity Securities and Use of Proceeds
(a) None.
(b) None.
(c) Issuer Purchases of Equity Securities (in millions, except per-share amounts):
Period Total Number of Shares Purchased
Average Price Paid per Share
Total Number of Shares Purchased as Part of
Publicly Announced Plans or Programs
Approximate Dollar Value of Shares That May Yet Be Purchased Under the
Plans or Programs
January 27, 2013 to February 23, 2013 2 $ 20.83 2 $ 5,073 February 24, 2013 to March 23, 2013 16 $ 21.02 16 $ 4,731 March 24, 2013 to April 27, 2013 23 $ 20.74 23 $ 4,254 Total 41 $ 20.85 41

The following documents are filed as Exhibits to this report:
92
Item 3. Defaults Upon Senior Securities None.
Item 4. Mine Safety Disclosures Not Applicable.
Item 5. Other Information
None.
Item 6. Exhibits
31.1 Rule 13a-14(a)/15d-14(a) Certification of Principal Executive Officer
31.2 Rule 13a-14(a)/15d-14(a) Certification of Principal Financial Officer
32.1 Section 1350 Certification of Principal Executive Officer
32.2 Section 1350 Certification of Principal Financial Officer
101.INS XBRL Instance Document
101.SCH XBRL Taxonomy Extension Schema Document
101.CAL XBRL Taxonomy Extension Calculation Linkbase Document
101.DEF XBRL Taxonomy Extension Definition Linkbase Document
101.LAB XBRL Taxonomy Extension Label Linkbase Document
101.PRE XBRL Taxonomy Extension Presentation Linkbase Document
Pursuant to the requirements of the Securities Exchange Act of 1934, the registrant has duly caused this report to be signed on its behalf by the undersigned thereunto duly authorized.
93
Cisco Systems, Inc.
Date: May 20, 2013 By /s/ Frank A. Calderoni
Frank A. Calderoni Executive Vice President and Chief Financial Officer (Principal Financial Officer and duly authorized signatory)

EXHIBIT INDEX
94
31.1 Rule 13a-14(a)/15d-14(a) Certification of Principal Executive Officer
31.2 Rule 13a-14(a)/15d-14(a) Certification of Principal Financial Officer
32.1 Section 1350 Certification of Principal Executive Officer
32.2 Section 1350 Certification of Principal Financial Officer
101.INS XBRL Instance Document
101.SCH XBRL Taxonomy Extension Schema Document
101.CAL XBRL Taxonomy Extension Calculation Linkbase Document
101.DEF XBRL Taxonomy Extension Definition Linkbase Document
101.LAB XBRL Taxonomy Extension Label Linkbase Document
101.PRE XBRL Taxonomy Extension Presentation Linkbase Document

Exhibit 31.1
CERTIFICATION OF PRINCIPAL EXECUTIVE OFFICER PURSUA NT TO EXCHANGE ACT RULE 13a-14(a)/15d-14(a) AS ADOPTED PURSUANT TO SECTION 302 OF THE SARBANES-OXLEY ACT OF 2002
I, John T. Chambers, certify that:
1. I have reviewed this quarterly report on Form 10-Q of Cisco Systems, Inc.;
2. Based on my knowledge, this report does not contain any untrue statement of a material fact or omit to state a material fact necessary to make the statements made, in light of the circumstances under which such statements were made, not misleading with respect to the period covered by this report;
3. Based on my knowledge, the financial statements, and other financial information included in this report, fairly present in all material respects the financial condition, results of operations and cash flows of the registrant as of, and for, the periods presented in this report;
4. The registrant’s other certifying officer(s) and I are responsible for establishing and maintaining disclosure controls and procedures (as defined in Exchange Act Rules 13a-15(e) and 15d-15(e)) and internal control over financial reporting (as defined in Exchange Act Rules 13a-15(f) and 15d-15(f)) for the registrant and have:
(a) Designed such disclosure controls and procedures, or caused such disclosure controls and procedures to be designed under our supervision, to ensure that material information relating to the registrant, including its consolidated subsidiaries, is made known to us by others within those entities, particularly during the period in which this report is being prepared;
(b) Designed such internal control over financial reporting, or caused such internal control over financial reporting to be designed under our supervision, to provide reasonable assurance regarding the reliability of financial reporting and the preparation of financial statements for external purposes in accordance with generally accepted accounting principles;
(c) Evaluated the effectiveness of the registrant’s disclosure controls and procedures and presented in this report our conclusions about the effectiveness of the disclosure controls and procedures, as of the end of the period covered by this report based on such evaluation; and
(d) Disclosed in this report any change in the registrant’s internal control over financial reporting that occurred during the registrant’s most recent fiscal quarter (the registrant’s fourth fiscal quarter in the case of an annual report) that has materially affected, or is reasonably likely to materially affect, the registrant’s internal control over financial reporting; and
5. The registrant’s other certifying officer(s) and I have disclosed, based on our most recent evaluation of internal control over financial reporting, to the registrant’s auditors and the audit committee of the registrant’s board of directors (or persons performing the equivalent functions):
(a) All significant deficiencies and material weaknesses in the design or operation of internal control over financial reporting which are reasonably likely to adversely affect the registrant’s ability to record, process, summarize and report financial information; and
(b) Any fraud, whether or not material, that involves management or other employees who have a significant role in the registrant’s internal control over financial reporting.
Date: May 20, 2013
/s/ John T. Chambers
John T. Chambers Chairman and Chief Executive Officer (Principal Executive Officer)

Exhibit 31.2
CERTIFICATION OF PRINCIPAL FINANCIAL OFFICER PURSUA NT TO EXCHANGE ACT RULE 13a-14(a)/15d-14(a) AS ADOPTED PURSUANT TO SECTION 302 OF THE SARBANES-OXLEY ACT OF 2002
I, Frank A. Calderoni, certify that:
1. I have reviewed this quarterly report on Form 10-Q of Cisco Systems, Inc.;
2. Based on my knowledge, this report does not contain any untrue statement of a material fact or omit to state a material fact necessary to make the statements made, in light of the circumstances under which such statements were made, not misleading with respect to the period covered by this report;
3. Based on my knowledge, the financial statements, and other financial information included in this report, fairly present in all material respects the financial condition, results of operations and cash flows of the registrant as of, and for, the periods presented in this report;
4. The registrant’s other certifying officer(s) and I are responsible for establishing and maintaining disclosure controls and procedures (as defined in Exchange Act Rules 13a-15(e) and 15d-15(e)) and internal control over financial reporting (as defined in Exchange Act Rules 13a-15(f) and 15d-15(f)) for the registrant and have:
(a) Designed such disclosure controls and procedures, or caused such disclosure controls and procedures to be designed under our supervision, to ensure that material information relating to the registrant, including its consolidated subsidiaries, is made known to us by others within those entities, particularly during the period in which this report is being prepared;
(b) Designed such internal control over financial reporting, or caused such internal control over financial reporting to be designed under our supervision, to provide reasonable assurance regarding the reliability of financial reporting and the preparation of financial statements for external purposes in accordance with generally accepted accounting principles;
(c) Evaluated the effectiveness of the registrant’s disclosure controls and procedures and presented in this report our conclusions about the effectiveness of the disclosure controls and procedures, as of the end of the period covered by this report based on such evaluation; and
(d) Disclosed in this report any change in the registrant’s internal control over financial reporting that occurred during the registrant’s most recent fiscal quarter (the registrant’s fourth fiscal quarter in the case of an annual report) that has materially affected, or is reasonably likely to materially affect, the registrant’s internal control over financial reporting; and
5. The registrant’s other certifying officer(s) and I have disclosed, based on our most recent evaluation of internal control over financial reporting, to the registrant’s auditors and the audit committee of the registrant’s board of directors (or persons performing the equivalent functions):
(a) All significant deficiencies and material weaknesses in the design or operation of internal control over financial reporting which are reasonably likely to adversely affect the registrant’s ability to record, process, summarize and report financial information; and
(b) Any fraud, whether or not material, that involves management or other employees who have a significant role in the registrant’s internal control over financial reporting.
Date: May 20, 2013
/s/ Frank A. Calderoni
Frank A. Calderoni
Executive Vice President and Chief Financial Officer (Principal Financial Officer)
Exhibit 32.1
CERTIFICATION OF PRINCIPAL EXECUTIVE OFFICER PURSUA NT TO 18 U.S.C. SECTION 1350 AS ADOPTED PURSUANT TO SECTION 906 OF THE SARBANES-OXLEY ACT OF 2002
I, John T. Chambers, do hereby certify, pursuant to 18 U.S.C. Section 1350, as adopted pursuant to Section 906 of the Sarbanes-Oxley Act of 2002, that, to my knowledge:
Date: May 20, 2013
• the Quarterly Report on Form 10-Q of the Company for the quarter ended April 27, 2013 , as filed with the Securities and Exchange Commission (the “Report”), fully complies with the requirements of Section 13(a) or 15(d) of the Securities Exchange Act of 1934; and
• the information contained in the Report fairly presents, in all material respects, the financial condition and results of operations of the Company.
/s/ John T. Chambers
John T. Chambers
Chairman and Chief Executive Officer
(Principal Executive Officer)

Exhibit 32.2
CERTIFICATION OF PRINCIPAL FINANCIAL OFFICER PURSUA NT TO 18 U.S.C. SECTION 1350 AS ADOPTED PURSUANT TO SECTION 906 OF THE SARBANES-OXLEY ACT OF 2002
I, Frank A. Calderoni, do hereby certify, pursuant to 18 U.S.C. Section 1350, as adopted pursuant to Section 906 of the Sarbanes-Oxley Act of 2002, that, to my knowledge:
Date: May 20, 2013
• the Quarterly Report on Form 10-Q of the Company for the quarter ended April 27, 2013 , as filed with the Securities and Exchange Commission (the “Report”), fully complies with the requirements of Section 13(a) or 15(d) of the Securities Exchange Act of 1934; and
• the information contained in the Report fairly presents, in all material respects, the financial condition and results of operations of the Company.
/s/ Frank A. Calderoni
Frank A. Calderoni
Executive Vice President and Chief Financial Officer
(Principal Financial Officer)