Embed Size (px)
Citation preview
CIRCUIT BREAKER MONITORING APPLICATION
USING WIRELESS COMMUNICATION
A Thesis
by
NITIN VED
Submitted to the Office of Graduate Studies ofTexas A&M University
in partial fulfillment of the requirements for the degree of
MASTER OF SCIENCE
December 2005
Major Subject: Electrical Engineering

CIRCUIT BREAKER MONITORING APPLICATION
USING WIRELESS COMMUNICATION
A Thesis
by
NITIN VED
Submitted to the Office of Graduate Studies ofTexas A&M University
in partial fulfillment of the requirements for the degree of
MASTER OF SCIENCE
Approved by:
Chair of Committee, Mladen KezunovicCommittee Members, Ali Abur
B. Don RussellWilliam Lively
Head of Department, Chanan Singh
December 2005
Major Subject: Electrical Engineering

iii
ABSTRACT
Circuit Breaker Monitoring Application
Using Wireless Communication. (December 2005)
Nitin Ved, B.Tech., Indian Institute of Technology, Bombay
Chair of Advisory Committee: Dr. Mladen Kezunovic
Circuit breakers are used in the power system to break or make current flow
through power apparatus. Reliable operation of circuit breakers is critical to the well-
being of the power system and can be achieved by regular inspection and maintenance.
A low-cost automated circuit breaker monitoring system is developed to monitor
circuit breaker control signals. An interface is designed on top of which different local
and system-wide applications can be developed which utilize the data recorded by
the system. Some of the possible applications are proposed. Lab and field evaluation
of the designed system is performed and results are presented.

iv
To My Parents and Asawari

v
ACKNOWLEDGMENTS
I would like to thank my advisor and committee chair, Dr. Kezunovic and my
committee members, Dr. Abur, Dr. Russell and Dr. Lively for their guidance and
support during the course of this research.
Also, thanks to my friends and colleagues and the department faculty and staff
for making my time at Texas A&M University a great learning experience. Special
thanks to Predrag Teodorovic, Zarko Djekic, Maja Knezev and CenterPoint Energy
Staff members Don Sevcik, John Lucey and Ed Koch for their advice and contributions
to the development of the Circuit Breaker Monitoring System.
Finally, thanks to my mother, father and fiancee for their love and encouragement
during tough times and patience while I took my time to explore this opportunity.
vi
TABLE OF CONTENTS
CHAPTER Page
I INTRODUCTION . . . . . . . . . . . . . . . . . . . . . . . . . . 1
A. Background . . . . . . . . . . . . . . . . . . . . . . . . . . 1
B. Problem definition . . . . . . . . . . . . . . . . . . . . . . 5
C. Existing solution . . . . . . . . . . . . . . . . . . . . . . . 6
D. Proposed solution . . . . . . . . . . . . . . . . . . . . . . . 7
E. Conclusion . . . . . . . . . . . . . . . . . . . . . . . . . . . 8
II CIRCUIT BREAKER THEORY . . . . . . . . . . . . . . . . . . 9
A. Definition of a circuit breaker . . . . . . . . . . . . . . . . 9
B. Functions of circuit breakers . . . . . . . . . . . . . . . . . 9
C. Classification of circuit breakers . . . . . . . . . . . . . . . 11
D. Circuit breaker control circuit . . . . . . . . . . . . . . . . 11
E. Conclusion . . . . . . . . . . . . . . . . . . . . . . . . . . . 18
III MONITORING REQUIREMENTS . . . . . . . . . . . . . . . . 19
A. Introduction . . . . . . . . . . . . . . . . . . . . . . . . . . 19
B. Data acquisition requirements . . . . . . . . . . . . . . . . 19
C. Data storage and analysis requirements . . . . . . . . . . . 25
D. Conclusions . . . . . . . . . . . . . . . . . . . . . . . . . . 26
IV SYSTEM ARCHITECTURE . . . . . . . . . . . . . . . . . . . . 27
A. Introduction . . . . . . . . . . . . . . . . . . . . . . . . . . 27
B. Hardware architecture . . . . . . . . . . . . . . . . . . . . 27
C. Software architecture . . . . . . . . . . . . . . . . . . . . . 33
D. Conclusions . . . . . . . . . . . . . . . . . . . . . . . . . . 39
V SYSTEM IMPLEMENTATION . . . . . . . . . . . . . . . . . . 41
A. Introduction . . . . . . . . . . . . . . . . . . . . . . . . . . 41
B. Hardware . . . . . . . . . . . . . . . . . . . . . . . . . . . 42
C. Software . . . . . . . . . . . . . . . . . . . . . . . . . . . . 46
D. Conclusion . . . . . . . . . . . . . . . . . . . . . . . . . . . 60
VI SYSTEM EVALUATION . . . . . . . . . . . . . . . . . . . . . . 61

vii
CHAPTER Page
A. Introduction . . . . . . . . . . . . . . . . . . . . . . . . . . 61
B. Laboratory testing . . . . . . . . . . . . . . . . . . . . . . 61
C. Field testing . . . . . . . . . . . . . . . . . . . . . . . . . . 64
D. Conclusion . . . . . . . . . . . . . . . . . . . . . . . . . . . 68
VII APPLICATIONS . . . . . . . . . . . . . . . . . . . . . . . . . . 69
A. Introduction . . . . . . . . . . . . . . . . . . . . . . . . . . 69
B. Use of local data . . . . . . . . . . . . . . . . . . . . . . . 70
C. Use of system-wide data . . . . . . . . . . . . . . . . . . . 74
D. Conclusions . . . . . . . . . . . . . . . . . . . . . . . . . . 75
VIII CONCLUSION . . . . . . . . . . . . . . . . . . . . . . . . . . . 76
A. Summary of work . . . . . . . . . . . . . . . . . . . . . . . 76
B. Contribution . . . . . . . . . . . . . . . . . . . . . . . . . . 77
C. Future work . . . . . . . . . . . . . . . . . . . . . . . . . . 78
REFERENCES . . . . . . . . . . . . . . . . . . . . . . . . . . . . . . . . . . . 80
APPENDIX A . . . . . . . . . . . . . . . . . . . . . . . . . . . . . . . . . . . 84
VITA . . . . . . . . . . . . . . . . . . . . . . . . . . . . . . . . . . . . . . . . 89

viii
LIST OF TABLES
TABLE Page
I Circuit breaker maintenance intervals . . . . . . . . . . . . . . . . . 3
II Usage statistics for maintenance methods . . . . . . . . . . . . . . 4
III Data acquisition systems available in market. Source: Refs. [9]-[14] . . . . . . . . . . . . . . . . . . . . . . . . . . . . . . . . . . . . 7
IV Types of transmission line faults . . . . . . . . . . . . . . . . . . . 10
V Classification of circuit breakers . . . . . . . . . . . . . . . . . . . . 12
VI Elements of circuit breaker control circuit . . . . . . . . . . . . . . 13
VII Performance indicators . . . . . . . . . . . . . . . . . . . . . . . . . 14
VIII Circuit breaker control circuit signals . . . . . . . . . . . . . . . . . 20
IX Criteria for selection of wireless technology . . . . . . . . . . . . . . 24
X Criteria for selection of storage technology . . . . . . . . . . . . . . 25
XI Slave software functions . . . . . . . . . . . . . . . . . . . . . . . . 47
XII Master side view of communication codes . . . . . . . . . . . . . . 50
XIII Windows forms designed in master unit software . . . . . . . . . . 55
XIV Configurable signal parameters . . . . . . . . . . . . . . . . . . . . 55
XV Remotely configurable slave unit parameters . . . . . . . . . . . . . 56
XVI GPS synchronization timestamps . . . . . . . . . . . . . . . . . . . 58
XVII Field evaluation of monitoring system . . . . . . . . . . . . . . . . 67
XVIII Methods implemented by the communication class . . . . . . . . . 84

ix
LIST OF FIGURES
FIGURE Page
1 Single line AC connections of protective relay and circuit breaker . 11
2 Circuit breaker control circuit . . . . . . . . . . . . . . . . . . . . . 13
3 Trip and close waveforms for circuit breaker control circuit . . . . . 16
4 Signal conditioning and galvanic isolation . . . . . . . . . . . . . . 22
5 Analog to digital conversion . . . . . . . . . . . . . . . . . . . . . . 23
6 Architecture of monitoring system . . . . . . . . . . . . . . . . . . 28
7 Block diagram of monitoring system hardware . . . . . . . . . . . . 29
8 Block diagram of data acquisition system . . . . . . . . . . . . . . 29
9 Architecture of signal conditioning module . . . . . . . . . . . . . . 30
10 Functional block diagram of master unit . . . . . . . . . . . . . . . 32
11 Architecture of slave unit software . . . . . . . . . . . . . . . . . . 35
12 Architecture of master unit software . . . . . . . . . . . . . . . . . 37
13 Schematic diagram of signal conditioning circuit . . . . . . . . . . . 43
14 Flow diagram of slave unit software . . . . . . . . . . . . . . . . . . 48
15 Command message structure . . . . . . . . . . . . . . . . . . . . . 51
16 Data packet structure . . . . . . . . . . . . . . . . . . . . . . . . . 52
17 Data transfer algorithms . . . . . . . . . . . . . . . . . . . . . . . . 53
18 Representation of GPS algorithm . . . . . . . . . . . . . . . . . . . 57
19 Header file generated by CBMS . . . . . . . . . . . . . . . . . . . . 59

x
FIGURE Page
20 Trip event, a contact and close event reference signals . . . . . . . 63
21 Trip event, a contact and close event signals recorded by CBM unit 63
22 Breaker wiring panel . . . . . . . . . . . . . . . . . . . . . . . . . . 64
23 The slave unit set up near the breaker . . . . . . . . . . . . . . . . 65
24 Close event record . . . . . . . . . . . . . . . . . . . . . . . . . . . 66
25 Phase currents measured during close event . . . . . . . . . . . . . 66
26 COMTRADE file for trip recording . . . . . . . . . . . . . . . . . . 67
27 Trip event, a contact and close event signals recorded by CBM unit 71
28 Analysis report from CBMA application . . . . . . . . . . . . . . . 72
29 Main application form showing slave units present in the system . . 85
30 Form for changing configuration of CBM slave device . . . . . . . . 86
31 Form for changing signal names and type . . . . . . . . . . . . . . 87
32 Form for displaying records . . . . . . . . . . . . . . . . . . . . . . 88

1
CHAPTER I
INTRODUCTION
A. Background
A power system performs the function of generating electric power and making it
available at the location where it is required. It is made up of three parts - generation,
transmission and distribution scattered over a large geographical region. The power
system consists of different electrical and electromechanical apparatus which work
together to maintain a continuous supply of power to the consumer. The circuit
breaker is one such apparatus whose functioning is critical to the maintenance of
constant supply of power. As its name suggests, it is used to make or break the
flow of power. It is used to configure the system so as to control the load flow and
disconnect the power system from any faulted parts.
Once installed the breaker has a life-time of 20-40 years during which its state
changes very infrequently. A breaker has no intelligence of its own. It is operated
by power system protection relays which detect faults on the system and identify
the appropriate breakers to be opened in order to isolate the faults and allow the
system to function. Also, a breaker may be operated through a manual command
from power system operators. Sometimes the breaker may not open or close on
command, allowing the fault to exist for a longer duration than the system can
sustain while functioning normally. Misoperation of breakers can lead to undesired
changes in system functioning that result into the system going in an abnormal state.
In abnormal state the power apparatus may have to function beyond its ratings and
is likely to get damaged. The consequences of abnormal functioning range from
The journal model is IEEE Transactions on Power Systems.

2
temporary interruption of service in local areas to complete system breakdown. This
may cost anywhere from mild inconvenience to loss of millions of dollars. Blackout
events in the recent years have demonstrated well the need of having a reliable power
system [1]. The circuit breaker forms a critical part of the protection system as well as
the Supervisory Control and Data Acquisition system (SCADA) Its operation must
be reliable, secure and fast. In order to ensure these features frequent inspection
and maintenance must be performed on breakers to detect and repair or replace
deteriorating breakers.
Maintenance methods
Power companies employ different maintenance strategies to ensure reliability of
equipment operation [2]. Maintenance methods for High-Voltage Circuit Breakers
can be broadly classified into 3 groups - Time Based Maintenance (TBM), Condition
Based Maintenance (CBM) and Reliability Centered Maintenance (RCM) [3].
Time based maintenance
This is one of the most frequently used maintenance strategies by the power in-
dustry. The maintenance intervals are selected on the basis of long-time experi-
ence. Table I shows the most frequent maintenance intervals for breakers as re-
ported by the IEEE/PES task force of the reliability, risk and probability applications
subcommittee[2]. It is observed that a maintenance cycle may extend to periods as
long as over a year and an unnoticed error will leave the system vulnerable to failure.
Also, in this strategy, the breaker is replaced at a fixed interval known as breaker
lifetime or at failure, whichever occurs first. This maintenance strategy is risky as it
can lead to damage of other equipment and loss of power supply.

3
Table I. Circuit breaker maintenance intervals
Maintenance type Interval DurationMinor maintenance 1 yr 1 dayMinor overhaul 5 yr 3 daysMajor overhaul 8-10 yr 2 weeks
Condition based maintenance
In this strategy the condition of the circuit breaker is assessed to determine the time of
maintenance. The status of the breaker is usually determined by manual inspection
using assessment tools. During inspection the breaker is temporarily disconnected
from the system by providing an alternate path for current. It is then made to operate
forcibly and different quantities are recorded using portable test units. The acquired
signal set is compared with the prerecorded reference set by personnel. Inferences on
the breakers state are made based on this comparison. The data collected is used to
predict the deterioration of the breaker and determine the time of next maintenance.
This process is known as off-line monitoring as the breaker has to be taken off-
line to perform the inspection. Off-line monitoring has two main drawbacks. First,
the process is not very objective and may lead to inconsistency in conclusions and
subsequent actions, due to difference in human judgement. Second, the inspection
intervals are reported to vary widely, ranging from 5 weeks to 1 year and are also
different for different tasks. The most frequent interval of inspection reported is 1
month. A large power system may have thousands of breakers and to inspect most
of them so frequently proves to be an expensive affair.
Another method used to predict the state of the breaker uses a monitoring device
attached to the breaker. Different physical and electrical quantities of the circuit
breaker are measured and analyzed to detect anomalies in behavior. The analysis may
be manual as in the previous strategy or may be automated using technologies such as

4
expert systems or neural networks. This is known as online monitoring as the breaker
is in service while it is being monitored. This methods allows the utility to perform
just-in-time maintenance. In this strategy a maintenance team is kept on standby
at all times. As soon as abnormality is reported the team is dispatched to perform
maintenance. This method has low personnel costs, as frequent manual inspection is
no longer required. However there are considerable equipment and installation costs.
A large power system may have thousands of breakers causing equipment costs to
outweigh the benefits achieved in terms of reliability and hence automated online
monitoring has not found wide-scale acceptance.
Reliability centered maintenance
In this strategy maintenance requirements are established using probabilistic models
and failure consequences and cost considerations. The procedure is complex and
requires experience and judgement. It may be a long time before enough data is
collected to create models that give accurate results. The failure rate of the breaker
is calculated and maintenance intervals are scheduled accordingly.
A recent CIGRE survey [4] on the present and future maintenance practices by
utility companies from different countries found the usage statistics to be as shown
in Table II. The results of the survey indicate that utility companies are inclined
towards using more of condition based and reliability centered maintenance. These
methods when combined with automated monitoring offer increased breaker life at
Table II. Usage statistics for maintenance methods
Maintenance type Current usage Future usageTime Based Maintenance 41% 24%Condition Based Maintenance 38% 47%Reliability Centered Maintenance 15% 24%Other 6% 5%
5
lower maintenance costs by optimizing the maintenance procedures. The use of con-
dition monitoring for breakers is evaluated on basis of the value added by the moni-
toring system against the cost of the installed equipment and the increased life-time
of breaker. This thesis explores circuit breaker condition monitoring as a solution to
improve reliability of breaker operation.
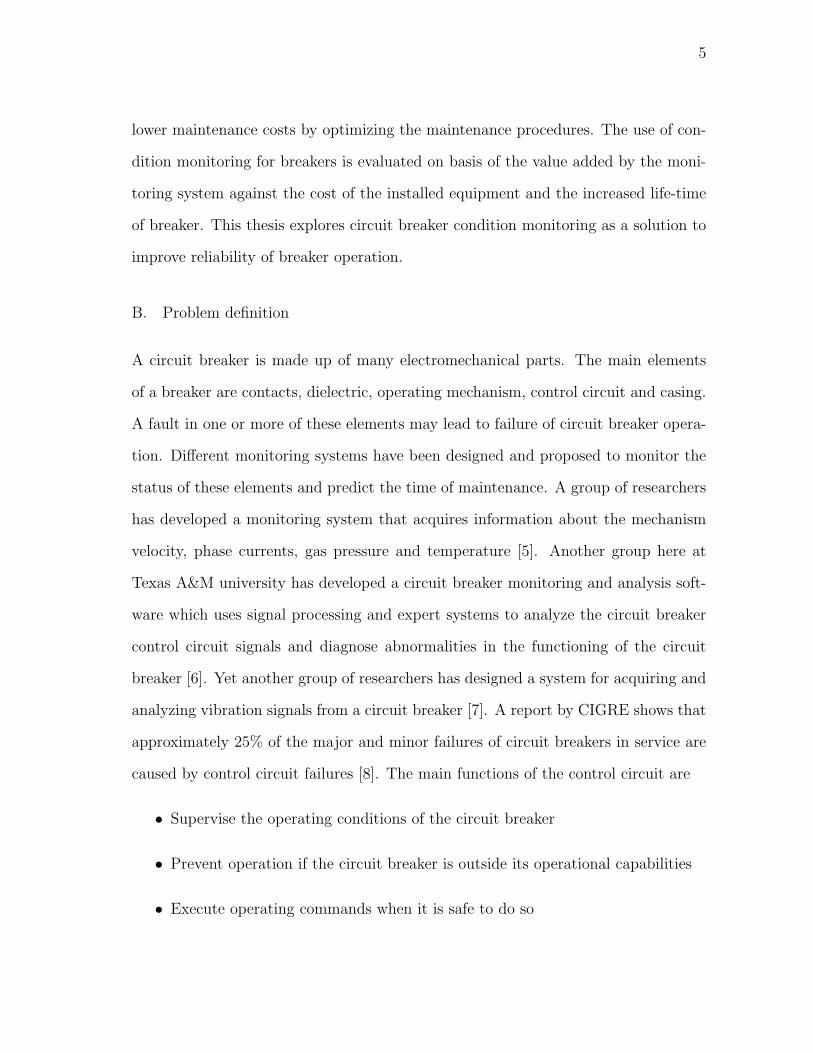
B. Problem definition
A circuit breaker is made up of many electromechanical parts. The main elements
of a breaker are contacts, dielectric, operating mechanism, control circuit and casing.
A fault in one or more of these elements may lead to failure of circuit breaker opera-
tion. Different monitoring systems have been designed and proposed to monitor the
status of these elements and predict the time of maintenance. A group of researchers
has developed a monitoring system that acquires information about the mechanism
velocity, phase currents, gas pressure and temperature [5]. Another group here at
Texas A&M university has developed a circuit breaker monitoring and analysis soft-
ware which uses signal processing and expert systems to analyze the circuit breaker
control circuit signals and diagnose abnormalities in the functioning of the circuit
breaker [6]. Yet another group of researchers has designed a system for acquiring and
analyzing vibration signals from a circuit breaker [7]. A report by CIGRE shows that
approximately 25% of the major and minor failures of circuit breakers in service are
caused by control circuit failures [8]. The main functions of the control circuit are
• Supervise the operating conditions of the circuit breaker
• Prevent operation if the circuit breaker is outside its operational capabilities
• Execute operating commands when it is safe to do so

6
Signals recorded from the control circuit can provide information about these func-
tions and enable diagnosis of control circuit health.
Currently available monitoring systems are expensive and do not fully justify the
cost of installing them. This thesis focuses on designing a solution to monitor the
control circuit of a circuit breaker and gather data which can then be analyzed to
predict maintenance time. The design of a monitoring system involves
• Determining the quantities to be measured
• Defining the functional requirements of the monitoring system
• Designing the architecture of the monitoring system
• Evaluating a prototype of the designed circuit breaker monitor
The designed system must cater specifically to measurement of the control circuit
signals. The next section describes some of the existing monitoring solutions and
their drawbacks.
C. Existing solution
Some of the data acquisition systems currently available in the market are listed
in Table III. The systems listed do not cater specifically to measuring quantities
from the control circuit. As a result they do not record enough information to make
accurate diagnosis of control circuit faults. Most of the systems listed in Table III
do not have sufficient number of channels to monitor all quantities required by the
artificial intelligence tools to make good decisions about the status of the breaker.
Some that have channels do not have the interfaces to take input signals of the voltage
or current levels found in the circuit breaker control circuit. Some also require an
invasive installation procedure thus increasing installation costs. Data collected from

7
Table III. Data acquisition systems available in market. Source: Refs. [9]-[14]
Product Company No. of Bits per GPS Sampling Online WirelessName Name channels sample Rate Transfer
BCM 200 Qualitrolcorp
10 10 No 2kHz Yes No
CBT 400 Qualitrolcorp
10 12 No 10kHz No No
SICAM AI16 Siemens 16 12 No 1kHz Yes No
Optimizer+ INCON No 1.9kHz Yes No
TDR9000 Doble 3-24 No 10kHz No
CBWatch-2 Areva 10 No 5kHz Yes No
circuit breakers all over the system can be combined to make deductions about the
system configuration that help the network operators in increasing reliability. This
application requires the data collected to be synchronized in time. Most systems do
not have any option for time-synchronization of recorded data. With thousands to
breakers to be monitored these limitations serve as a deterrent to the adaptation of
online monitoring strategy on a large scale.
D. Proposed solution
Online monitoring of circuit breaker control circuit can be used to optimize the extent
and timing of specific maintenance activities to be performed. The Circuit Breaker
Monitor (CBM) proposed has the following features
• Low cost: The cost of CBM per breaker is less than $500
• Tailored interface: The input interface of the monitoring system is tailored to
monitoring of circuit breaker related electrical quantities.

8
• Synchronized recording: The CBM synchronizes recorded data to a global time
standard enabling system-wide applications to use the recorded data.
• Ease of installation: The circuit breaker monitoring system can be installed at
a substation within minutes by one or two personnel. The system just need to
be plugged into the signals and power to be usable.
• Cost of installation: Apart from the minimal labor cost no other cost is associ-
ated with equipment installation.
• Ease of use and maintenance: A simple graphical user interface allows the user
to control the system and monitor the breaker.
• Data interface: The system provides centralized storage with a data interface
upon which multiple applications can be built, thereby increasing utility of the
system.
E. Conclusion
This chapter described the problem that the designed Circuit Breaker Monitor aims
to solve. Maintenance methods currently in use by utility companies were discussed.
The current status of solution was described and some of the existing research was
discussed. A brief summary of the requirements for the proposed solution was pre-
sented.

9
CHAPTER II
CIRCUIT BREAKER THEORY
A. Definition of a circuit breaker
The ANSI/IEEE standard for definitions for power switchgear [15] defines a circuit
breaker as “A mechanical switching device, capable of making, carrying, and breaking
currents under normal circuit conditions and also, making and carrying for a specified
time and breaking currents under specified abnormal circuit conditions such as those
of short circuit.” Circuit breakers are electromechanical devices made up of a number
of components that work together to open and close the circuit on command. The
main function of opening or closing the circuit is achieved by separating or joining
a pair of contacts that are well insulated from the outside. The contacts serve as
the connection point for the wires that enter and leave the breaker. The rest of the
mechanism exists to facilitate the separation and joining procedures and to monitor
them.
B. Functions of circuit breakers
Load flow control
During the normal operation of the power system, the power demand continuously
keeps varying. The demand may become high in one area while becoming low in
other. In order to generate and distribute power efficiently, power transmission from
one region to other must be controlled. The circuit breakers are used to connect and
disconnect transmission lines thus controlling flow of power in a certain direction.
The flow of power can also be controlled by changing the magnitude and phase of the
voltage. Circuit breakers are used to switch in and out devices like shunt reactors

10
which are capable of changing the flow of power.
System protection
A huge system dispersed over a wide geographical area like a power system is vul-
nerable to faults. Circuit breakers are commanded to open during faults in order to
protect the system equipment. Table IV lists the types of fault that can occur on
a power system with overhead lines [16]. The breaker corresponding to the line on
which fault occurs must open rapidly on fault in order to protect the system. Circuit
breakers are incapable of detecting faults on their own. They are controlled by signals
from other equipment like protection relays, SCADA, reclosers, etc. which are capa-
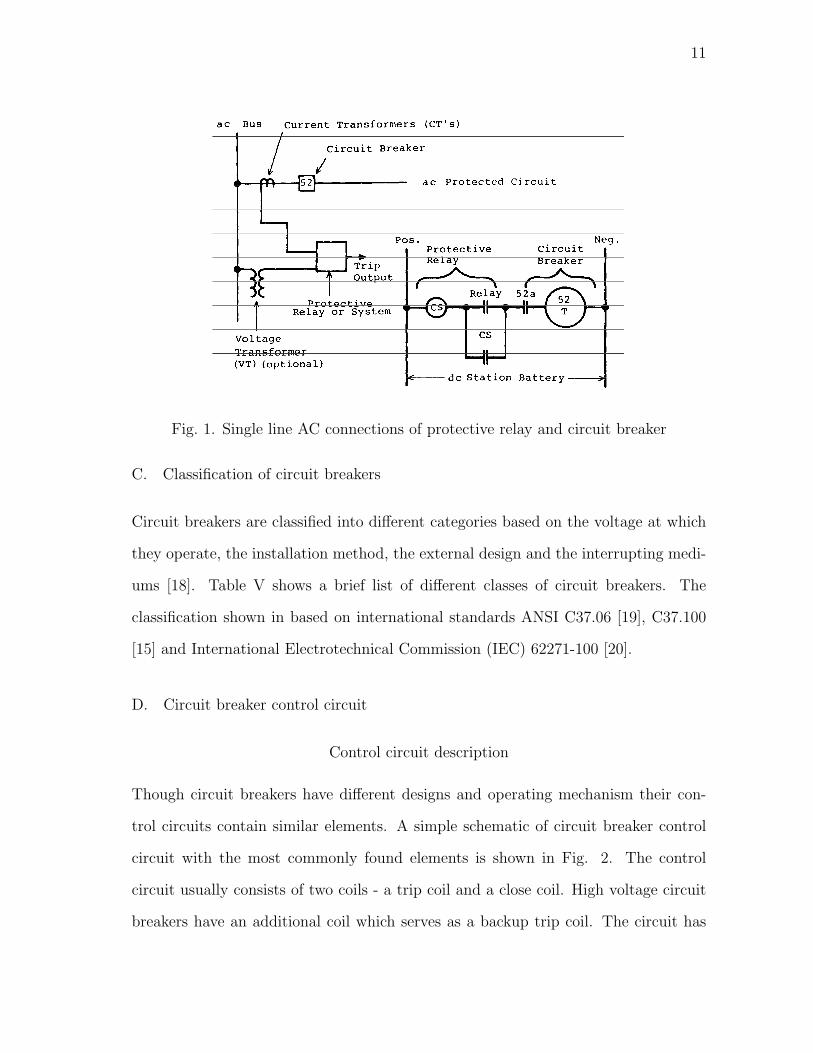
ble of detecting faults. A typical connection of circuit breaker and relay on a single ac
line is shown in Fig. 1 [16]. The number 52 stands for the circuit breaker according
to ANSI/IEEE device numbering system [17]. Upon a trip(open) signal from relay
or SCADA, the circuit breaker must open very rapidly and break the current in the
circuit. Today, network voltages are as high as 1000kV and the circuit breaker must
be able to break current at these voltages within milliseconds. This is one of the most
arduous functions performed by the circuit breaker.
Table IV. Types of transmission line faults
Fault type Occurrence ratesingle phase to ground 70-80%phase to phase to ground 10-17%phase to phase 8-10%three phase 2-3%
11
Fig. 1. Single line AC connections of protective relay and circuit breaker
C. Classification of circuit breakers
Circuit breakers are classified into different categories based on the voltage at which
they operate, the installation method, the external design and the interrupting medi-
ums [18]. Table V shows a brief list of different classes of circuit breakers. The
classification shown in based on international standards ANSI C37.06 [19], C37.100
[15] and International Electrotechnical Commission (IEC) 62271-100 [20].
D. Circuit breaker control circuit
Control circuit description
Though circuit breakers have different designs and operating mechanism their con-
trol circuits contain similar elements. A simple schematic of circuit breaker control
circuit with the most commonly found elements is shown in Fig. 2. The control
circuit usually consists of two coils - a trip coil and a close coil. High voltage circuit
breakers have an additional coil which serves as a backup trip coil. The circuit has

12
Table V. Classification of circuit breakers
Classification Type Descriptionbased onOperation voltage Low voltage Rated for usage up to 1000 Volts
High voltage Rated for usage above 1000 VoltsInstallation Indoor Designed for use only inside buildings or
weather resistant enclosuresOutdoor Designed for use outside buildings
External design Dead tank The vessel surrounding and containing theinterrupters and insulating medium is atground potential
Live tank The vessel housing the interrupters is at apotential above ground
Interrupting medium Air-magnetic Air is the interrupting medium and the arcchute includes a magnetic blow-out coil
Air/Gas blast Air/Gas is blasted over the arc through anozzle at high speeds (supersonic)
Oil Napthenic base petroleum oils form the in-terrupting medium
SF6 SF6 a chemically stable, non-corrosive,non-flammable gas is used as the inter-rupting medium
Vacuum Vacuum breakers are used because of theexceptional dielectric characteristics anddiffusion capabilities of vacuum
two inputs that control its function - Trip initiate and Close initiate. A high trip
initiate signal results into a trip operation and a high close initiate signal results into
a close operation. These signals are usually generated by the protection and control
equipment like relay, SCADA, recloser etc. The control circuit is powered by a 130V
DC source, usually a battery in the substation control house, called the supply volt-
age. All elements of the circuit are connected between the positive and the negative
terminals of the supply voltage.Another voltage source called the Yard DC is used
by most breakers to power the closing motor that charges the close coils (CC). The
elements of the control circuit are described in Table VI [21].

13
Fig. 2. Circuit breaker control circuit
Table VI. Elements of circuit breaker control circuit
Element Definition52a This symbol represents and electrical switch in the breaker. It operates
when the breaker mechanism changes state. It opens when the breakeropens and closes when the breaker closes. It is also called “a contact”
52b This symbol represents and electrical switch in the breaker. It operateswhen the breaker mechanism changes state. It opens when the breakercloses and closes when the breaker opens. It is also called “b contact”
TC TC stands for “Trip Coil”. The trip coil contains a plunger mechanismfor opening the breaker. Its primary function is to open the breakerwhen energized
CC CC stands for “Close Coil”. It is constructed similar to the trip coil. Itsprimary function is to open the breaker when energized
X coil This is an auxiliary X relay that initiates the breaker close sequence.It represents a coil with a plunger mechanism for opening and closingcontacts. When it operates, it changes the state of all contacts with 52Xdesignation. Conversely, when it stops operating, all the contacts with52X designation revert to their de-energized state
Y coil This is an auxiliary Y relay that operates as an anti-pump mechanism toallow only one close operation for a single close initiate. It also changesthe state of all contacts with 52Y designation
52Xa This is a 52X contact which changes state when the 52X coil operatesand enables the close coil to energize.
52Ya, 52Yb These are 52Y contacts which change state when the 52Y coil operatesand disables the closing sequence.

14
Relationship of signals to breaker health
The recorded signals from circuit breaker control circuit that provide information
about the state of circuit breaker are known as “Performance indicators” [22]. The
performance indicators for close and open operation are different are listed in Table
VII. The trip and close initiate signals originate from the control house. A transition
in these signals indicates the start of circuit breaker operation. Loss of these signals
indicate a problem with the execution of relay sequence.
The control DC voltage provides power supply to the control circuit. A loss of
this signal will impede breaker operation and indicates a problem with substation
batteries which form the power source. The yard DC voltage provides power supply
to the motor and heater as shown by M and H in Fig. 2. Usually the original source
for yard DC is the same as control DC.
The 52a and 52b contact signals represent the voltage across auxiliary switches
that specify the open or close status of the circuit breaker. The time difference
between the transition of these two signals is inversely proportional to the velocity of
CB operation. A deformation of these signals may indicate a dirty contact, a binding
mechanism or a slow breaker.
The trip and close coil currents control the operating mechanism of the breaker.
Table VII. Performance indicators
Open operation Close operationTrip Initiate Close InitiateControl DC Voltage Control DC VoltageYard DC Voltage Yard DC Voltagea Contact (52a) a Contact (52a)b Contact (52b) b Contact (52b)Trip Coil Current Close Coil CurrentPhase Currents Phase Currents
X CoilY Coil

15
The movement of the operating mechanism is reflected in the current signals through
the electromagnetic effect. When monitored these signals provide information about
the operating mechanism.
The phase currents are not measured from the control circuit but they indicate
the exact moment when the breaker makes or breaks the current and are used to
check the consistency of other signals recorded from the control circuit.
The X and Y coil signals prevent multiple close attempts in one close operation.
Loss of these signals indicates a fault in the control circuit. The circuit breaker
monitor should be designed to monitor these signals and store them for analysis to
determine the health of the CB.
Control circuit operation
Breaker open operation
The circuit breaker is opened by separating the contacts and thus breaking the flow
of current through them. In order to perform this function the control circuit has
to go through a sequence of actions. The signals expected at different points in the
control circuit during a trip event are shown in Fig. 3(a) [21]. Only seven signals
that show a change in magnitude are displayed. The signals are ideal i.e. there is no
instrumentation noise nor actual disturbances. It can be seen that upon trip initiate
the trip coil current goes high. This initiates the plunger mechanism. When the
breaker has opened completely this current comes back to zero and so do the phase
currents since they cannot flow through an open circuit.
Fig. 3(a) shows different time instances labeled when transitions occur in the
control circuit. It is assumed that before the open operation, the breaker is in closed
position and functioning normally. At time T0 the trip signal is asserted high by the

16
(a) Trip event and opening of breaker (b) Close event and closing of breaker
Fig. 3. Trip and close waveforms for circuit breaker control circuit
protection or control system. As the breaker is closed, so is contact 52a shown in Fig.
2, and the trip signal flows down to the trip coil (TC) and energizes it. The trip coil
current ramps up and reaches its maximum value at time T1. The breaker opening
mechanism operates when the current has reached 70% of its maximum value. The
operation of the breaker mechanism opens the 52a contact and the a contact signal
makes a transition to zero at time T2. When the 52a contact opens, the trip coil is
disconnected from the asserted trip initiate and its current starts going down at T3.
The main interrupting contacts have separated by time T4 and the phase currents go
to zero as the line is open circuited. By time T5 the trip coil current has ramped
down to zero. As the breaker mechanism fully opens at time T6, the b contact closes
and its voltage goes to zero. The breaker is now open and remains in this state till a
close initiate is received.

17
Breaker close operation
The circuit breaker is closed by bringing the main interrupting contacts back together.
This operation starts when the close initiate signal is received from the protection
relays, reclosers or SCADA. The signals expected during a close operation are shown
in Fig. 3(b) [21]. It can be seen that 9 signals undergo transition during a close
operation. Different time instances when transitions occur are labeled in the figure.
The breaker is assumed to be in open state initially. At time C0, the close initiate
signal is asserted. The close signal propagates to the 52Yb contact which is in closed
position as the Y coil is deenergized. The signal thus propagates further to the X
coil, shown as 52X in Fig.2. The X coil is activated and the X coil signal makes a
transition to high. The operation of X coil causes the 52X contact to close. Upon
closing of 52X contact, a path is established from positive terminal of control DC
source to the close coil. The close coil is energized and the close coil current starts
increasing at point C1. At point C2, the close current reaches its maximum value and
the close operation is initiated.
As the breaker close operation proceeds, all 52b contacts are opened and all 52a
contacts are closed. This can be seen in Fig. 3(b) as the b contact and a contact
make transitions at times C3 and C4 respectively. When the 52a contact closes, it
activates the 52Y coil and 52Ya and 52Yb contacts change state at time C5. The
52Yb contact opens thereby deenergizing the close coil and close coil current begins
to ramp down at C6. The main interrupting contacts have established connection by
time C7 and phase currents start flowing at this point. At time C8 the close current
has completely ramped down to zero. The opening of 52Yb contact also disconnects
the 52X coil from positive DC voltage and deactivates it. The X coil signal makes a
transition to zero at time C9.
18
The Y coil that was initialized at C5when the 52a contacts closed at C4, stays
energized as long as the close signal is high, preventing a reclosing of the breaker when
the close signal is high. To close the breaker again, the close initiate signal must be
reasserted by taking it low and then bringing it to high voltage again. The Y coil is
also called “Anti-pump coil” as it allows only one close operation per close initiate
signal. The transition order described in the above sections is just a typical case and
the actual order may be different for different breakers under normal operation.
In summary, one can establish the fact that the breaker opened correctly on not
by looking at the timing sequences and the signal levels.
E. Conclusion
This chapter presented the definition of circuit breaker and its main functions. It
described the different classifications of circuit breakers based on industrial standards.
It discussed the control circuit of the circuit breaker and its electrical characteristics.
The close and open operation of the breaker were described in terms of the control
circuit signal transitions. Relationship between breaker health and sequence of control
circuit signal changes was discussed.

19
CHAPTER III
MONITORING REQUIREMENTS
A. Introduction
The first step in designing a solution is to define the functional requirements of the
system. The monitoring system requirements were generated after consulting with
industry members and are based on the circuit breakers and other equipment already
in use by Center Point Energy. The two main functions which the circuit breaker
monitoring system should be designed to perform are
• Data acquisition: The input signals must be captured and converted to digital
form for analysis and storage.
• Analysis and storage: The data gathered by acquisition units at breaker must
be collected at a central location, preprocessed and stored for further analysis.
The requirements for these two functions are different and independent of each other
in case of a modular implementation. This chapter describes the function require-
ments of the monitoring system and tries to explain the logic behind the choices
made.
B. Data acquisition requirements
Electrical characteristics of input
The data acquisition unit must acquire signals from the circuit breaker control circuit
discussed in section D of Chapter II. The electrical characteristics of the signals to
be monitored are listed in Table VIII. The signals can be classified into three groups

20
Table VIII. Circuit breaker control circuit signals
Signal Name Analog(A)/ Nominal FunctionStatus(S) Range
VOLTAGESControl Voltage A 125V± 15V Provides Pos/Neg voltage for
contactsLight Wire A 125V± 15V ON/OFF IndicatorAux. Contact B A 125V± 15V Establishes connection from
Light to NegYard DC A 125V± 15V Runs CB motorAux. Contact A A 125V± 15V Indicates breaker status
CURRENTSClose Coil Current A < 10 Used to physically close the CBTrip 1 Coil Current A <10A Used to physically open the CBTrip 2 Coil Current A <10A Used to physically open the CBPhase A Current A 5A Indicates breaker statusPhase B Current A 5A Indicates breaker statusPhase C Current A 5A Indicates breaker status
EVENTSClose Initiate S 125V± 15V Initiates a close operationTrip Initiate S 125V± 15V Initiates a trip operationX Coil S 125V± 15V Closes all 52X contacts, Estab-
lishes a path from POS to 52CCY Coil S 125V± 15V Opens all 52Y contacts, Inter-
rupts 52CC and X coil currents
1. Voltage signals: These signals consist of voltage measurements at different
points in the control circuit. The nominal range of voltage signals is 125±15V.
These signals need to be recorded as analog signals and then converted to digital
form.
2. Current signals: These measure the currents through sub-circuits of the control
circuit. The nominal range of current signals is 10A. These signals can be
recorded as voltage signals taken across the shunts in the control circuit. Current
signals are also measured from the current transformers set up on the three
phases of transmission line entering the breaker. The phase current signals are
in the range of 5A during normal operation of power system. These signals can

21
be tapped as voltage signals across shunts connected on the secondary of the
CTs. These signals also need to be converted to digital form for storage and
analysis.
3. Event signals: These signals are status signals i.e. their high or low status indi-
cates the state of the circuit breaker operation. The signals can be in two voltage
states [0V, 125V]. Though the signals are only status signals, small variations
in their voltage levels contain important information about the functioning of
circuit breaker. The signals must thus be recorded as analog signals to capture
even the small variations.
Input processing
Signal conditioning
The input signals discussed above must be scaled appropriately for converting them
into digital form for processing and storage. Most analog to digital conversion circuits
require the input signals to be in the ±10V or ±5V range. A signal conditioning
circuit must scale the signals listed in Table VIII to be in the range required by the
A/D converter.
Galvanic isolation
The digital equipment works at low voltages and is sensitive enough to be damaged
by the voltages higher than 20V. Faults in the system may cause input voltages to
fluctuate resulting in damage to the monitoring equipment. The digital equipment
should therefore be galvanically isolated from the analog input signals. Fig. 4 shows
the required functionality of signal conditioning and galvanic isolation graphically.

22
Voltage levels in
range [-130,130]V
Voltage levels in
range [-5,5]V
Voltage levels in
range [-1,1]V
Galvanic isolation and
signal conditioning
Voltage levels in
range [-130,130]V
Voltage levels in
range [-5,5]V
Voltage levels in
range [-1,1]V
Galvanic isolation and
signal conditioning
Voltage levels in
range [-5,5]V
Voltage levels in
range [-1,1]V
Galvanic isolation and
signal conditioning
Fig. 4. Signal conditioning and galvanic isolation
A/D conversion
The analog signals must be converted to digital form with a resolution high enough
to allow for accurate analysis. It is observed that a resolution of 12 bits for the ±5V
range is sufficient for required analysis accuracy. The analog signals are sampled and
discretized at different time instances for conversion to digital form. The sampling
rate provided by the A/D converter must be high enough to allow for accurate re-
construction of signals for analysis. It was determined that a sampling rate of up
to 10kHz was sufficient for most applications. Fig. 5 shows the process of analog to
digital conversion. All signals must be sampled synchronously and then converted to
digital form. The signals listed in Table VIII vary from breaker to breaker and hence
the input conversion circuitry must have enough number of channels to monitor all
required signals.
Synchronization
The data recorded at different circuit breakers in the substation must be synchronized
in time in order for the analysis software to draw conclusions about the functioning of

23
Synchronous
sample and hold
Analog to digital
conversion
0
0.37
2.3
15.6
37.8
70.9
125.7
.
.
0
4.3
12.6
33.8
70.9
110.9
112.5
.
.
Analog inputs Analog samples Digital outputs
Fig. 5. Analog to digital conversion
the system. For example, in a breaker and half configuration, two lines are protected
by 3 breakers and two breakers must be opened to disconnect a faulty line from rest
of the substation. Unless the data recorded from these to breakers in synchronized in
time, accurate deductions about the abnormalities in line opening cannot be made.
Time synchronized data may also be used for different applications which analyze
the working of the entire power system. Data must therefore be synchronized to a
universal time system. A GPS time system is ideal for this purpose. The records
obtained must be time-stamped with GPS time. Most applications can work with
data sampled at less than 10KHz. The maximum synchronization required is there-
fore 1/10Khz = 100 microseconds. The GPS hardware and the algorithm used for
synchronization should be able to provide an accuracy of at least 100µs.
Data transmission
The data recorded at the circuit breakers must be transmitted to the central storage
location. The cost for wired vs. wireless transmission of data were investigated.

24
The wireless transmission solution was found to be more cost effective and easy to
implement [23]. If the data acquisition system was to be set up at each breaker of
the entire power system, it would be very expensive to lay out the wires to connect
the units to a central location in the substation.
The wireless transmission system chosen should enable data transfer from mul-
tiple points to the central storage system. The bandwidth required for real time data
transfer of 15 signals, sampled at 2KHz is determined as 576 Kbps. Different wireless
technologies viz. FDMA, TDMA, Spread spectrum, CDMA etc. were investigated.
The criteria for selecting the wireless technology are shown in Table IX. The only
technology that fits the requirements is spread spectrum wireless technology.
System control
The user should be able to control CBM operation and configure it for optimum
performance. The CBM should have a user interface which allows the user to set
different data acquisition parameters like sampling frequency, recording duration,
number of channels to be recorded. The user should be able to select channels which
provide information about trip and close events. User should be able to start and
stop the CBM system as required. User should also be able to receive notifications
when events have occurred and data is being recorded.
Table IX. Criteria for selection of wireless technology
Property Desired value
Data rate 600Kbps
Distance 250m (avg)
Points of communication 15
Power milliWatt range

25
C. Data storage and analysis requirements
Storage
The data is collected and stored in digital form. Storage of data from all breakers
over the substation requires that the digital storage media must have sufficient storage
space. A record for an event for an event that lasts for the duration of 1 second is
approximately 200kB in size when the sampling is performed at 5kHz. Assuming
12 breakers providing one record every hour, the storage size required to store one
month of data will be 12 breakers x 24 hours x 30 days x 200kB = 172800kB ≈ 1.65
GB. Month long data may be maintained on the main storage while old records are
compressed and archived on secondary media. The criteria for selection of a storage
medium are listed in Table X. There are different format in which digital data can
be stored on storage media. The acquisition software must be able to store data in
a format that can be recognized by most applications that will use the data. The
COMTRADE file format is an industry wide standard and should be used for data in
the storage [24]. A database of the stored files may be maintained for ease of retrieval
and use by applications.
Table X. Criteria for selection of storage technology
Parameter Primary storage Secondary storage
Storage space 2GB 24-240GB
Access time µs range few minutes
Reliability High High
Access type Random required Sequential is ok

26
Analysis reports
The analysis application must be able to take input data in digital format and process
it. It should implement a method to keep track of incoming data and its storage
location. It should be able to access the data on command from user and process
it fast. It should allow the user to perform analysis operations through an interface
and present analysis results through the same interface. The analysis operations to
be performed include - detection of events and signal processing of recorded data to
check for abnormalities. The application must generate reports which inform the user
of these abnormalities. The analysis application should be able to inform the user of
events that occur on the system through a graphical interface. The analysis software
should be able to display the data acquired an stored as waveforms on demand. It
should also enable the user to view a log of events that have occurred in the substation
in past.
D. Conclusions
This chapter identifies the requirements for the CBM design. The requirements are
generated based on the functions that the CBM needs to perform. These requirements
form the basis of the design for the solution discussed in Chapter V. The architecture
of the hardware and software designed for the monitoring system is discussed in the
next chapter.

27
CHAPTER IV
SYSTEM ARCHITECTURE
A. Introduction
This chapter describes the over-all architecture of the circuit breaker monitoring sys-
tem. The system design is modular in nature to allow for re-usability of hardware
and software blocks. The requirements described in previous chapter specify that the
data acquisition unit must be mounted on the breaker. One data acquisition unit
and processing unit is required for each breaker. In order to reduce the total cost of
the system a master-slave architecture is proposed which keeps the data acquisition
hardware at the breaker, called the slave, to the bare minimum and combines the
processing for all breakers into one processor unit, called the master.
In the master-slave architecture, the slave units are set up at each breaker in
the switchyard and are hardwired to acquire the signal data. The master unit is set
up at the control house to gather the data collected by all slave units and process
it. Fig. 6 shows the architecture of the CBM system within a substation. The
system is designed to allow for as many slaves as there are circuit breakers in the
substation. The slave systems can be controlled from the control house using the
interface provided by the master system.
B. Hardware architecture
The hardware is designed to provide an inexpensive solution for monitoring data accu-
rately. It consists of slave systems mounted near the circuit breakers in weather proof
enclosures. The master unit is placed inside the control house which has controlled
environment for continuous operation of master unit within normal parameters. The

28
Breaker 1 Breaker 2 Breaker 3
Slave 1 Slave 2 Slave 3 Bus #1 Bus #2
Line #2 Line #1
Switchyard
Control house
Master
Substation
Fig. 6. Architecture of monitoring system
units communicate to each other using wireless communication.Fig. 7 shows the over-
all block diagram of the hardware design.
Slave unit architecture
A low cost solution for monitoring makes it imperative that the slave units that
perform data acquisition at each breaker be stripped down to the bare essentials.
Thus the slave unit is designed only to acquire data signals and transmit them to the
master unit without performing any resource intensive processing on the signals. The
slave unit consists of 4 important components - signal conditioning, analog to digital
conversion, processing and wireless transmission. Fig. 8 shows the block diagram of
the slave system.
1. Signal conditioning module: The signal conditioning and isolation module pro-
vides appropriate voltage levels for data acquisition. The signals of the circuit

29
Signal conditioning and galvanic
isolation
Data acquisition
COMTRADE files
Wireless receiver
Wireless transmitter
Circuit breaker
Wireless data
transfer
Master
Fig. 7. Block diagram of monitoring system hardware
Circuit
Breaker
Circuit Breaker Monitor
Signal
Conditioning
Boards
A/D
Converter
Micro-
processor
Wireless
Transmitter
Fig. 8. Block diagram of data acquisition system
breaker control circuit are at two voltage levels. The status signals are at 130V
DC where as the shunt signals which monitor currents are in the ±1V range.
The signal conditioning module scales the input signals to be in the [-5, +5]V
range as required at the input of the A/D converter module. The architecture
of the signal conditioning module is so designed that the high or low voltage
input signals are first reduced or amplified in magnitude. The circuit provides
selectable gain modules to achieve this. The signals are then passed through an
isolation block. The signals at the output of the isolation block cannot exceed

30
Filter Amplifier Isolator
ISO122P
Variable
gain
Amp To ADC
Live
Neutral
Input +
-
Fig. 9. Architecture of signal conditioning module
±15V irrespective of the input signal values. After isolation the signals are
passed through a adjustable gain module, which allows fine tuning of the gain
to get the desired overall gain for each signal. Fig. 9 shows the architecture of
signal conditioning board .
2. Analog to digital conversion module: The A/D module takes the input signal
in [-5, +5] volt range and converts it to a digital signal. The module should
provides a resolution of minimum 12 bits for the voltage range. The sampling
is performed synchronously for all channels. The sampling rate can be set by
the user within the available range of the hardware. The module is connected
to the processor and transfers data to it and receives control commands from
it.
3. Microprocessor: The signal output from the A/D module acts as the input for
microprocessor module. The microprocessor formats and temporarily stores the
recorded data in its storage area. It controls the data acquisition according to
the user specified parameters. The microprocessor is also connected to the wire-
less communication module. It receives command messages from the master unit
through the wireless communication module and transmits recorded data back
to the master through the same module. It also receives GPS synchronization
signals from the master unit and synchronizes the recording accordingly.

31
4. Wireless Transceiver : A wireless modem employing Frequency Hopping Spread
Spectrum technology is used to transmit the collected data to the master unit in
the control house. Frequency hopping spread spectrum technology is chosen be-
cause the transmission range required in a substation can only be achieved using
this wireless technology. The modem works in a point-to-multipoint mode. In
this mode, the slave units communicate with the master unit and vice versa but
there is no communication between the slaves. In this mode the slave to master
data link is usually strong, ensuring reliability of data transfer. The wireless
module acts as one of the multipoint nodes and communicates with the master
unit. The communication is controlled by the microprocessor which programs
the wireless transceiver for asynchronous transmission so that messages can be
sent and received as and when event happen.
All four components of the slave architecture are integrated to work together and
their functioning is controlled by the software operating on the processor.
Master unit architecture
Only one master unit is installed per substation. The master unit gathers data
from all slave units through wireless communication and must be designed to have
a bandwidth high enough to sustain data transfer without any loss. The system is
designed in a modular fashion so that if one module fails it can be replaced by another
module providing a similar interface without changing other modules. Fig. 10 shows
the functional block diagram of the master unit. The system consists of four main
components.
1. Wireless transceiver: The transceiver is identical to that used in the slave mod-
ule and uses Frequency Hopping Spread Spectrum technology for wireless com-

32
Processor
Secondary
storage
Wireless
transceiver
GPS
receiver
Network
(Internet)
Fig. 10. Functional block diagram of master unit
munication. It works in the point-to-multipoint mode and acts as the master
node. It is connected to the processor module which controls the communication
protocols.
2. Processor: The master unit has a processor module to process incoming data
and control the functioning of the data acquisition system. The processor is
connected to two devices. One device is a wireless transceiver which allows it
to communicate with the slave units and acquire the data recorded by them.
Another device is a GPS receiver which provides it with accurate time signals.
The processor may also be connected to a network, like internet to allow oper-
ators to remotely control the monitoring system and gather data at a central
location. The processor executes a graphical user interface locally which allows
the user to set and control the system. For this purpose, it has an operating

33
system, graphical display device and an input device attached to it.
3. Storage: The system has two types of storage. The primary storage as defined
in Chapter III is internal to the processor module. It enables rapid access to
the data required by applications executed on the processor. The secondary
storage system as shown in Fig. 10 is external to the processor module. It may
be connected or disconnected from the processor module as required. Data is
periodically transferred from primary storage to the secondary storage device
for archival.
4. GPS receiver: A GPS receiver is used to receive GPS clock signals from GPS
satellites. The receiver is connected to the processor unit. The clock signal is
received by the processor and its clock is synchronized to the GPS signal by the
control software. The signal is used to also synchronize all the slave units using
a network time synchronization algorithm described in Chapter V.
The integrated master system is controlled by the software described in the next
section.
C. Software architecture
The circuit breaker monitoring system is event driven i.e. the signals are recorded
when an event occurs and recording parameters are changed on user command. The
software is designed to identify events and then perform the desired actions. The
software chosen for both systems depends on the ability of the processors to execute
it and also the cost of the compiler and base operating system.

34
Slave unit software
The slave unit software should performs the following functions
• Control data acquisition parameters of the A/D converter namely sampling
frequency, input range and record duration.
• Detect events and record data for specified duration in memory.
• Transmit data to master unit.
• Receive commands from master unit and execute them on slave unit.
The software is broken down into modules for ease of programming and testing.
The modules integrate together to form the complete system software. Fig. 11 shows
the architecture of the slave unit software.
A/D conversion module
This module controls the A/D conversion of the input signals collected from circuit
breaker control circuit. It sets the frequency of sampling the signals and the scaling
factors for the digital signals. It must trigger the command execution module when-
ever new data is available. Upon order from the command execution module, it must
transfer converted data directly to the data storage module. This routine is executed
maximum number of times by the slave unit processor.
Data storage module
The data storage module takes data from A/D conversion module and stores it in
available memory locations in the processors secondary memory (flash memory). This
is done to reduce cost of the slave processor as primary memory (RAM) is expensive.
Only a minimum of primary RAM as required by the operating system and software

35
Command
execution module
A/D conversion
module
Communication
module
Configuration
module
GPS
synchronization
module
Data storage
module
Fig. 11. Architecture of slave unit software
is used. 2MB of memory is sufficient for a basic operating system and slave unit
software. The storage module must ask for memory resources from the processor
and upon allocation of resources transfer data to the appropriate memory locations.
Memory resource should be enough to store data from at least 5 events recorded at
5kHz. When no memory resources are available it must stop the data acquisition
process and notify master unit of lack of memory.
Communication module
This module runs the communication protocol between the slave and master unit.
Whenever a command is received from the master unit, processing is stopped and

36
control goes to the communication module. All commands received from the master
unit are parsed and then control is handed back to the command execution mod-
ule with command information. This module also provides the command execution
module with an interface to transfer data to and from the master unit.
Configuration module
This module initializes the data acquisition hardware and makes it ready to record
data. It sets all the required hardware parameters. It also re-configures the hardware
whenever a configuration change request is received from the master unit.
GPS synchronization module
The GPS synchronization module uses a network synchronization algorithm to syn-
chronize the slave units time with the master unit. It can send and receive time
stamps to and from the master to accomplish this goal. It periodically requests the
master unit for accurate time stamps and then using the algorithm synchronizes the
slave unit clock with the master unit clock.
Command execution module
The command execution module is the brain of the system. It prioritizes the tasks
that a slave unit must perform. Since the slave unit does not have a pre-emptible
processor, two threads cannot run simultaneously. When the A/D conversion routine
is working, the GPS routines must be put on hold. The command execution module
is responsible for controlling the flow of the slave system algorithm. It must detect
events when they happen and activate the appropriate routine to perform required
action.

37
Master unit software
The master unit software performs the following functions
1. Allows user to control the slave unit
2. Gathers data from all slave units and stores it
3. Detects events and allows the user to view waveforms and event logs
4. Provides an easily accessible data interface for other applications
The master units software is also event driven like the slave unit software. It handles
two types of events - those generated by the user and those generated by the slave
unit. Events generated by the user include configuring or restarting the slave unit and
viewing the acquired data. Those generated by the slave unit include data transfer,
configuration transfer and GPS synchronization. Fig.12 shows the different modules
of the master unit software that handle these events.
Configuration
module
Communication protocol layer
Data
acquisition
GPS
synchronization Slave
detection
Analysis
software
Event display
software
Data storage
module
Fig. 12. Architecture of master unit software

38
Communication protocol layer
This layer handles all the communication between the master and slave unit. All
modules that need to talk to the slave unit can do so through the communication layer.
It implements a communication protocol which can be understood by its counterpart
on the slave unit. The configuration, data acquisition, slave detection and GPS
synchronization modules execute all their communication requirements through this
layer. The layer should provide with an interface which is independent of other
master unit software algorithms so that the communication protocol doesn’t have to
be changed even if the master unit software application changes.
Configuration module
This module allows the user to view the configuration of the slave unit. It displays the
slave unit parameters on the graphical user interface and allows the user to change
them. When some parameters are changed, the configuration module commands the
slave unit to change these parameters using the communication layer to transfer the
new configuration.
Data acquisition module
Whenever an event happens on the slave unit, it sends a message to the master unit
that it is ready to transmit data. The communication protocol layer upon receiving
such a message activates the data acquisition module. It works with the communica-
tion layer to receive all the data recorded by the slave unit and stores it in a standard
format in the local storage medium through the data storage module. When data
transfer is complete it notifies the user of the new event and allows him to view the
data received through the event display software. If certain specific events have oc-

39
curred that require analysis, it triggers the analysis softwares available through the
analysis software module.
GPS synchronization module
This module controls the synchronization of the master unit to the GPS clock. It
also responds to the slave units requests for synchronization and send accurate time
data to it. The module receives GPS signal from the GPS receiver attached to the
processor and interprets it to get the accurate time. It then sets the master unit clock
to that time. It gets periodic requests from the slave unit for time signals and sends
time signals accordingly through the communication layer.
Slave detection module
When a system is started the slave detection module probes each slave unit set up
in the substation, using the communication layer, to detect if its is working or not.
Inactive devices are flagged as erroneous and an error alarm is displayed to the user.
The user can also execute the detection process when the system is functioning to get
the status of all slave units in the system.
D. Conclusions
This chapter described the architecture of the Circuit Breaker Monitoring System.
A master-slave architecture is proposed which will keep the cost of the system per
breaker to a minimum. The different components of the slave and master hardware
are described and their interconnection details are presented. The software require-
ments for the slave and master system are defined and their component modules are
described in detail. The design described in this chapter is generic in nature. The

40
next chapter describes a specific implementation of the design.

41
CHAPTER V
SYSTEM IMPLEMENTATION
A. Introduction
The previous chapter described the generic architecture of the system that can satisfy
the functional requirements of the circuit breaker monitoring system. This chapter
describes the implementation of a working prototype to meet the constraints specified
in previous chapters. The development of the Circuit Breaker Monitoring System is an
ongoing process at the Electric Power and Power Engineering(EPPE) labs in Texas
A&M university. The implementation of first prototype of the monitoring system
and the design of the software intended for the second prototype is described in this
chapter. The implementation of second prototype is underway at the time of writing
of this report.
The implementation can be broadly classified into two categories for ease of de-
scription. One category is hardware which describes all the electronics that went into
the system and another is software which describes the control instructions written
to make the hardware perform the desired task. The hardware design is very similar
in both the first and second prototype, the only difference being that the second pro-
totype uses low cost components offering almost the same functionality as the first
prototype. This chapter describes the hardware designed for the first prototype.
The software designed for the first prototype is a very rudimentary one. It only
provides a command line interface to execute data accusation functions. No interface
is available to change the configuration of the device or to view the acquired data.
The first version of software was developed with the intention to test the working of
the prototype in the field and then to make the required modifications in the second

42
version to meet the functional requirements. This chapter describes the design of
second version of the software with the modifications incorporated.
B. Hardware
The system hardware can be divided into slave unit hardware and master unit hard-
ware. These two sets of hardware are physically separate from each other. They
however depend on each other to perform the data acquisition and hence must use
consistent technology. The next two sections describe the slave and the master unit
hardware.
Slave unit hardware
The slave unit hardware consists of 5 modules integrated together, signal conditioning
module, processor, flash storage, wireless transceiver and power supply.
Signal conditioning module
The signal condition module is designed with discrete components mounted on a
PCB to provide filtering, isolation and appropriate gain for the input signals. The
schematic of the signal conditioning circuit is shown in Fig. 13. The schematic
displays the circuit used for one channel. The circuit is replicated as many times on
the PCB as the number of required channels.
The circuit can be divided into three parts according to the function each per-
forms. First part is integrated circuit U1 with external resistors, capacitors and
inductors. Inductors L1 and L2, and capacitors C1 and C2 are used to perform noise
filtering. Integrated circuit U1 is operational amplifier which, with external resistors
serves as an instrumentation amplifier. Its purpose is to perform signal conditioning.

43
U1
U3
A
U2
U3
B
Fig
.13
.:Sch
emat
icdia
gram
ofsi
gnal
condit
ionin
gci
rcuit

44
The circuit is designed so that it can provide two different levels of gains for
voltage signals and current signals. Values of the resistors R8, R9, R10 and R11 are
calculated for the desired gain. The gain can be set to low or high by connecting
or disconnecting the jumpers W1 and W2 respectively. The low gain is required for
high voltage signals where as high gain is required for shunt signals. The gain is set
to 0.015 for high voltage signals and 2 for the low voltage shunt signals.
The second part is IC U2 the isolation amplifier ISO122P manufactured by Texas
Instruments which provides galvanic isolation between the input signal and circuit
output. The ISO122p IC works by internally generating a high frequency signal to
modulate the input signal. The signal is demodulated at the output to generated the
original signal waveform.
The third part is IC U3 combined with discrete components. It performs output
filtering and provides additional gain so that output signal has voltage level of 5V
if input signal is 130V. The IC consists of two operational amplifiers. Amplifier one
provides a finely adjustable gain from 2.5X to 3X allowing the user to adjust level of
the output signal. The other operational amplifier with external components (resistors
and capacitors) forms a 2-pole low-pass filter with cut-off frequency at approximately
1.8 kHz. Potentiometer V R1 allows for fine adjustment of output signal in the range
of 5V, while V R2 is there to allow elimination of DC offset.
Processor and storage
A 80486 architecture based processor running a ROM-DOS operating system is used
as the main processing device. A 32Mb flash memory chip installed on the processor
board serves as the storage device for the recorded data. The processor has a 50 pin
bus for communicating with the A/D board. The processor also has two serial ports,
one of which is used for communication with the master unit.

45
Wireless transceiver
A wireless transceiver manufactured by FreeWave technologies is connected to the
serial port of the processor. It communicates with the master transceiver unit using
Frequency Hopping Spread Spectrum technology. The transceiver is set to operate as
a slave in the point-to-multipoint mode of operation. The data rate is set at 115,200
Bps.
Master unit hardware
The master unit hardware must be able perform data analysis, data storage, wireless
transmission and reception and GPS synchronization. The master unit hardware is
made up of 3 components.
1. Processor and storage: A laptop or a PC is used as the processing and storage
device. The laptop used has a Windows 2000 operating system. Any updated
version of the operating system would serve the function of processing and
storage. It has a hard disk which is used for storage of data records. The
minimum free space required on the hard disk is 1.65GB if a month’s data is to
be stored. The laptop has a Intel P3 processor, which meets all the processing
requirements. The laptop has serial ports for connecting serial transceiver and
GPS receiver.
2. Wireless transceiver: The same model of transceiver (model# DGRO9RFS
manufactured by FreeWave Technologies, Inc) is used by the master unit as
that used by the slave unit. The transceiver is connected to the comm port of
the laptop and data transfer takes place through the serial interface provided
by the operating system.

46
3. GPS receiver: A GPS receiver manufactured by Meinberg, model number GPS161AHS
is used to obtain GPS signals from the satellite in order to synchronize the CB
monitoring system with the GPS clock. The receiver has an antenna that needs
to be mounted so as to have a direct visibility of less than 8· above horizon.
The terminal unit of the GPS clock is connected to the laptop through a serial
interface. The clock signal is received by the laptop and the software uses it to
synchronize the system clock.
C. Software
Slave unit software
The slave unit software is implemented in Borland C++. The functions can be
classified into two categories
1. Hardware dependent functions: These functions depend on the hardware for
achieving the desired goal. The Hardware initialization function, A/D interrupt
and memory storage function belong to this category.
2. Hardware independent functions: These functions are independent of the hard-
ware and the code can be reused even if the processor changes as long as it can
be compiled on the new processor.
Table XI lists the functions developed, their category and what they do. The
A/D interrupt function and the serial communication interrupt functions make the
software event driven. Whenever an A/D conversion takes place the ADInterrupt()
interrupt function fetches the converted digital values from the ADC and stores them
in a cyclic buffer in the processor’s main memory. The EventCheck() function checks
if a trip or close event has occurred based on the values of the trip and close initiate

47
signals. If an event has occurred the DataRecord() function starts recording the data
from cyclic into flash memory. The cyclic buffer also contains data from prior to the
moment when the event occurred. This data provides insight about the conditions
prior to the events and is also recorded into flash memory with the post event data.
The MemTransfer() function is used to transfer data to and from the flash memory.
When a record has been stored, the slave asks the master to accept data file and upon
acknowledgement sends the data file.
Whenever the system is not recording, the serial port interrupt is enabled and any
commands received from Master unit are executed. Fig. 14 shows the flow diagram
of the slave system software.
Table XI. Slave software functions
Name Hardware dependent FunctionHardwareInit() Yes Initializes the hardware according to
the parameters in config fileADInterrupt() Yes Fetches data from ADC buffer upon
completion of conversionSerInterrupt() No Runs interrupt routine when data is
received on serial portCheckEvent() No Checks if an event has occurredRecordData() Yes Records data if an event is detectedSendData() No Communicates with master unit
and sends recorded data through se-rial port
SendConfig() No Communicates with master unitand sends system configurationthrough serial port
ChangeConfig() No Receives configuration from master,stores it in a file and initializes thehardware according to new configu-ration
RestartSystem() Yes Restarts the system on receivingcommand from master unit
Synchronize() Yes Synchronizes the slave system clockto the master system clock

48
Initialize
hardware
Event detected ?
Configuration
change requested
by master?
A/D conversion
interrupt
Serial
communication
interrupt
Record data
Yes
No
Request master
for data transfer
Request accepted ?
Send data, config
and header files
to master
Yes
Set new
configuration
Yes
Restart requested
by master?
No
Restart system
Yes
START
No
GPS
synchronization
requested ?
START
Synchronize
slave unit
Yes
No
No
Fig. 14. Flow diagram of slave unit software
Communication protocol
The communication protocol forms the link between the master and slave unit soft-
wares. A class named CommRS232() is designed to implement the communication
protocol between the master and slave unit. The class implements methods that
facilitate communication over serial port. Its main functions are
• Relay commands from master to slave

49
• Transfer data and configuration information from slave to master
• Transfer new configuration information from master to slave
The class has methods that implement the communication protocol and provides
interfaces which allow other classes or functions to access the communication facilities.
This object oriented approach allows ease of development and software maintenance.
Thus, even if the slave or master unit software algorithms change the communication
protocol class doesn’t have to be changed. The next few paragraphs describe the
details of the communication protocol. The methods and interfaces provided by the
class implementing the protocol are listed in Table XVIII in Appendix A.
The wireless system designed works in a point-to-multipoint mode. In this mode
the master sends out the same message to all the slave units and the message is
not acknowledged by the slaves. However when slaves send a message to the master
the message is acknowledged by the master. The return link is thus the strong one.
This protocol is implemented internally by the wireless devices used for communica-
tion.The communication protocol used by the wireless transceivers is proprietary and
thus varies with the company designing the modems. The communication protocol
implemented in the software is designed so as to work with any proprietary protocol
as long as the proprietary protocol satisfies data transfer requirements.
The protocol designed for Master-slave communication enables each slave unit to
identify if the message is meant for it. Each slave is assigned an ID which is one byte
long. The range of IDs is from 0 to 255. The ID 0 is reserved to mean “all slaves”
and the ID 1 is reserved for the Master unit. Thus there can be a maximum of 254
slaves per master. The intended message is also similarly coded into a 1 byte code,
known as command code. The can be a maximum of 256 command codes. Table XII
lists the command codes used for different commands.

50
Table XII. Master side view of communication codes
Command Code Sent Result of execution(Hex) /Received
CONFIGURATION COMMANDSSend config 11 Sent Master unit requests configuration information
from slaveReceived config 12 Sent Master unit confirms receipt and exits config file
transfer algorithmChange config 13 Sent Master unit commands slave to change configu-
rationReady to receiveconfig
14 Received Master unit starts transfer of config file
Changed config 15 Received Master unit reports that configuration has beenchanged and exits config change algorithm
DATA TRANSFER COMMANDSReady to senddata
21 Received Master unit detects that data is available andstarts data transfer algorithm
Ready to AcceptData
22 Sent Data transfer algorithm sends request to slaveto start data transfer
Packet acknowl-edge
23 Sent Master recipes a data packet and stores it inbuffer
Data transfercomplete
24 Received Master exits binary data transfer algorithm
Sending config file 25 Received Master starts config file reception algorithmConfig file re-ceived
26 Sent Master exits config file reception algorithm
Sending header 27 Received Master starts header file reception algorithmHeader file re-ceived
28 Sent Master exits header file reception algorithm
GPS SYNCHRONIZATION COMMANDSBegin GPS Sync 31 Sent Master activates GPS synchronization algo-
rithmT1 32 Received Master receives time signal and stamps it with
current time (T2)T3 33 Sent Master transmits time signal to slave with cur-
rent time stamp (T3) and waits for T1 or synccomplete
Sync complete 34 Received Master exits GPS synchronization algorithmMISCELLANEOUS COMMANDS
Restart 51 Sent Master sends this command to slave to restartslave unit

51
00110100 00011001
CodeId
Command message Intended
recipient/s
Command
to be
executed
Byte 1 Byte 2
Fig. 15. Command message structure
The ID byte and the command code are combined to form a 2 byte message as
shown in Fig. 15. If all slaves are to execute the same command, the ID byte is
set to zero. The configuration commands shown in Table XII allow the master unit
to communicate with the slave unit in order to perform user specified configuration
tasks and some automated configurations tasks. The commands are used to request
current configuration from a slave, acknowledge receipt of configuration, send new
configuration to a slave and acknowledge change of configuration. The data transfer
commands are used to detect that slave is ready to send data, receive data, config and
header files from slave and acknowledge the receipt of data. The GPS synchronization
commands are used by the GPS synchronization algorithm described later in this
chapter. Other commands like restart allow the user to control slave operation.
Data transfer
The command codes are meant only to contain messages for operations that the slave
has to perform. A similar but slightly different method is applied for transfer of data
between the master and slave units. The data is divided into packets the maximum
size of which is chosen based on the wireless transmission bandwidth and can be
configured through the user interface. Each packet is made up of two parts. The

52
Id
2E A1 FF 12 3F 21 EA
Packet
number
Number
of bytes
01001000110101………………
Data
1 Byte 2 Bytes 4 Bytes N bytes
Fig. 16. Data packet structure
first part consists of packet information and the second part consists of data. Fig. 16
shows the structure of the transmitted packet. The data contained in the packet is in
binary format but is represented in Hexadecimal base in the figure for convenience.
The first byte is the slave id. The next two bytes represent the packet number in
unsigned int format. There can be a maximum of 32768 packets before the number
again goes to zero. The next four bytes specify the number of bytes ’N’ contained
in this packet. The information is in unsigned long int format. Thus the maximum
number of bytes can be 232-1. The next N bytes contain the data bytes from the
record. The data bytes are 2 byte integers in two’s complement format.
When the slave unit completes recording of an event, it requests the master to
accept data. The master unit activates the data reception software and sends and
acknowledge to the slave unit. The slave unit then starts transfer of data packets. The
master unit receives the packet and checks if it contains the specified amount of data.
If the packet size is correct, the master unit confirms reception of the package with
an acknowledge signal. If the slave does not receive an acknowledge message from
master after a certain time period, it repeats the data packet. When all data packets
have been sent and acknowledged, the slave unit sends a “Data transfer complete”
signal to the master unit and the master unit data transfer algorithm completes and
transfers control to the configuration file transfer algorithm. Fig 17 shows the flow
diagram of the data transfer algorithms on the slave and master unit.
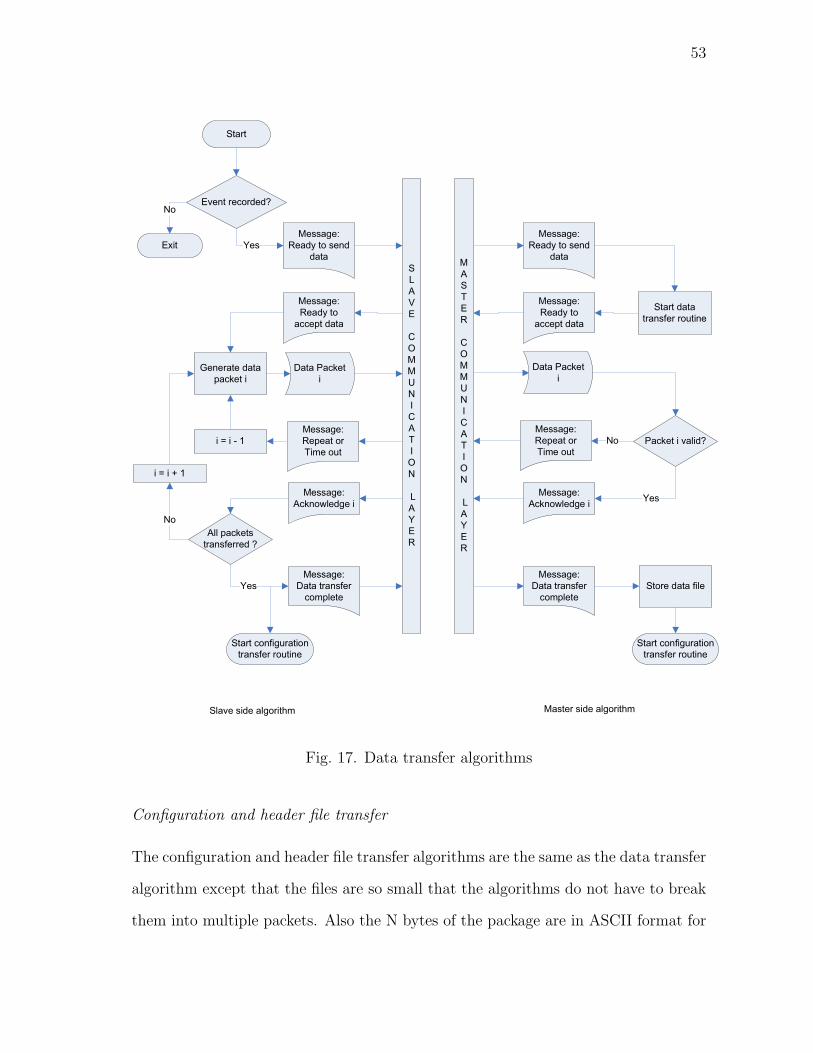
53
S
L
A
V
E
C
O
M
M
U
N
I
C
A
T
I
O
N
L
A
Y
E
R
M
A
S
T
E
R
C
O
M
M
U
N
I
C
A
T
I
O
N
L
A
Y
E
R
Event recorded?
Start
Yes
Data Packet
i
Message:
Ready to send
data
Message:
Ready to
accept data
Generate data
packet i
Message:
Acknowledge i
i = i + 1
No
i = i - 1
All packets
transferred ?
Message:
Data transfer
complete
Yes
Exit
No
Start configuration
transfer routine
Start data
transfer routine
Message:
Ready to send
data
Message:
Ready to
accept data
Data Packet
i
Packet i valid?
Message:
Repeat or
Time out
Message:
Repeat or
Time out
No
Message:
Acknowledge iYes
Message:
Data transfer
complete
Store data file
Start configuration
transfer routine
Slave side algorithm Master side algorithm
Fig. 17. Data transfer algorithms
Configuration and header file transfer
The configuration and header file transfer algorithms are the same as the data transfer
algorithm except that the files are so small that the algorithms do not have to break
them into multiple packets. Also the N bytes of the package are in ASCII format for
54
ease of conversion to text format files.
Master unit software
The main functions of the master unit software are
1. Communication with the slaves
2. Graphical user interface for control
3. GPS synchronization
4. Data analysis and storage
The master unit software is an event driven software and also uses a graphical user
interface to allow the user to control the monitoring system. It is developed in Visual
C# which allows for easy development of both these features.
Graphical user interface
The graphical user interface enables the user to control the monitoring system through
different form interfaces like buttons, textboxes etc. displayed on the windows GUI.
Detailed description of GUI usage is given in Appendix A. Table XIII lists the
different GUI form interfaces developed and their functions. Table XIV shows the
parameters that can be configured for signals. The slave unit parameters that can be
changed remotely through the device configuration form (Fig. on p.86 in Appendix
A) are listed in Table XV. The interface also allows the user to enter the signal details
and the software scaling factors which are used to identify the signals in COMTRADE
configuration files.

55
Table XIII. Windows forms designed in master unit software
Form name FunctionMain window Displays the slave units present in the local system, provides user
with a context menu to perform different operations like configu-ration, synchronization etc. on a device or group of devices
Configurationform
Displays the configuration of selected slave unit and allows theuser to modify it
Signal informa-tion form
Displays the channel number, signal name and type for all signalsacquired by the slave unit and allows the user to change them
Add device form Allows the user to set configuration for a new device, uses thesame template as the configuration form
Record log win-dow
Displays the logs of the events recorded (Time, Data and Eventtype) on the selected breakers. Allows the user to select a partic-ular log entry and view the details of the record
Waveform displaywindow
Displays the details of the selected record. It displays the channelnumber, name, record time and the recorded waveform graphically.
Table XIV. Configurable signal parameters
Parameter Significance Range of values
Channel number The hardware channel number on which the sig-nal will be recorded
Numeric (<maxchannels)
Signal name Name of the recorded signal Alphanumeric
Signal type Type of signal High voltage/Low voltage
Trigger Whether this signal triggers recording or not Yes/No
Threshold The value of signal above which recording is trig-gered
Unsigned float <130

56
Table XV. Remotely configurable slave unit parameters
Parameter Significance Range of values
Device Id Used to identify the slave device and to commu-nicate with particular slave unit
Numeric (non-repeatable)
Device Name Name of slave device for filing Alphanumeric(25char max, nowhite spaces)
Breaker Number or name of breaker on which device isset up
Alphanumeric(25char max)
Location Location of device (substation name, area name) Alphanumeric
Analog channels Number of analog recording channels used inslave unit
Numeric
Digital channels Number of digital recording channels used inslave unit
Numeric
Line frequency Frequency of power line 50 or 60Hz
Sampling rate Sampling rate used by ADC of slave unit positive float(Hz)
Record duration The duration for which slave unit must recordsignals when an event occurs
Numeric(seconds)
Data type The format in which data is stored in the slaveunit memory and master unit storage device
Binary or ASCII
GPS synchronization
The algorithm used to synchronize the slave unit to master unit is similar to the
Simple Network Time Protocol (SNTP) [25]. The algorithm implemented does not
work on the TCP or UDP protocol but uses the logic of the SNTP algorithm. Fig.
18 shows a simple representation of one cycle of the algorithm.

57
Master time line
Slave time line T1
T2 T3
T4
θ = ½{(T2 – T1) + (T3 – T4)}
Fig. 18. Representation of GPS algorithm
The steps in the GPS synchronization algorithm are as follows
1. Upon synchronization request by master, stamps current local time (T1) on a
time request packet and sends to master.
2. Upon receipt of this packet, master unit stamps reception master-time (T2) and
returns it to slave immediately upon stamping current time (T3).
3. Upon receipt the slave processor computes round-trip delay d and local clock
offset t as
d = (T4 - T1) - (T3 - T2)
t = ((T2 - T1) + (T3 - T4)) / 2
where T4 is the local receipt time. Table XVI summarizes the timestamps used
in the algorithm.
4. The clock time is updated to be current time + t.
5. To get a good estimate the steps above are repeated 5 times or till t is less than
100µs.

58
Table XVI. GPS synchronization timestamps
Timestamp Name ID When Generated
Originate Timestamp T1 Time request sent by slave
Receive Timestamp T2 Time request received by master
Transmit Timestamp T3 Time reply sent by master
Destination Timestamp T4 Time reply received by slave
Data analysis and storage
The master unit receives data from all slave units in the system. The data storage al-
gorithm stores the data on the hard drive in COMTRADE format files. COMTRADE
format specifies 3 files for each data record [24].
1. Header file: The header file is an optional ASCII text file created by the origina-
tor of the COMTRADE data. The information contained in the header file may
however be very useful for applications that use the recorded data to analyze
the state of circuit breaker. The header file format is ASCII. It contains infor-
mation about the location of breaker, the trigger for recording, record length,
fault duration, comment and data format. The comment field can be used to
pass information to the applications about the type of breaker. Fig. 19 shows
one of the header files recorded by the designed prototype. The header file has
an extension .HDR.
2. Config file: The configuration file is an ASCII text file that provides the in-
formation necessary for a human or a computer program to read and interpret
the data values in the associated data files. The configuration file is in a pre-
defined, standardized format so that a computer program does not have to
be customized for each configuration file. The configuration file contains the

59
Location : Breaker F290 at ObrienMachine name : CB01Record Number : 001Trigger : Status on channel 1 ’Trip Event’Trip time : 23:20:28.632 Sun 26 Jun 2005 (176)Events occurred: 001Record length : 180.0 cyclesFault duration : 15 msComment : THW-,20B0,WH,R3,1234567,(NONE)Data format : binary
Fig. 19. Header file generated by CBMS
following information.
(a) Station name, identification of the recording device, and COMTRADE
Standard revision year;
(b) Number and type of channels;
(c) Channel names, units, and conversion factors;
(d) Line frequency;
(e) Sample rate(s) and number of samples at each rate;
(f) Date and time of first data point;
(g) Date and time of trigger point;
(h) Data file type; and
(i) Time Stamp Multiplication Factor.
Configuration files have .CFG extension. A sample config file is displayed in
Fig. on p.67 in Chapter VI.
3. Data file: The data file contains the data values that are scaled representations
of the sampled event. The data must conform exactly to the format defined in
the configuration file so that the data can be read by a computer program. The

60
data file type (ft) field defined in the configuration file specifies the file type.
For binary data files ft is set to binary. For ASCII data files ft is set to ASCII.
The data file contains the sample number, time stamp, and data values of each
channel for each sample in the file. All data in data files are in integer format.
The circuit breaker monitoring system uses the binary format for data files as it
occupies almost one-third as much space as an ASCII file. The data files have
a .DAT extension.
To identify the records, the files are named using the IEEE file naming convention
[26]. The graphical user interface allows the user to view a log of the records stored
on the system. By selecting a particular log the user can view the signal waveforms.
Whenever an event is recorded the data analysis algorithm detects if its a trip
or a close event and notifies the user of the occurrence of the event. A dynamic
link library (dll) file is designed which holds variables that specify if an event has
happened and the type of event. This file can be used by applications that want to
be notified whenever an event occurs.
D. Conclusion
This chapter described the implementation of a prototype Circuit Breaker Monitoring
System. The hardware required and its integration details were described for both
the slave and the master unit. The software developed to perform the data acquisi-
tion function on the slave unit was discussed. The development of the software for
master unit, which co-ordinates the data acquisition among slaves and makes the
data accessible to other applications was discussed. The next chapter describes the
evaluation of this prototype design.

61
CHAPTER VI
SYSTEM EVALUATION
A. Introduction
Any system developed must be evaluated for the desired performance. The two main
testing procedures followed in the testing of circuit breaker monitoring system are
• Laboratory testing or Controlled testing
• Field testing
Laboratory testing is done in a controlled environment in modular fashion i.e. all
modules are tested for their functionality. Field testing is done in field environment
with all factors present that can affect the performance of the system. Laboratory
testing is more thorough while field testing is more strenuous. This chapter describes
in detail the procedures used to evaluate the system in laboratory and field environ-
ments.
B. Laboratory testing
Laboratory testing involves individual module testing and integrated system testing.
Individual module testing
The functionality of each module of the CBM system is tested after its design. The
signal conditioning boards were tested for both high-voltage and low-voltage signals.
Any DC offset in the output waveforms was removed and the gains were calibrated
to scale the output signals in the ±5 volt range. The A/D conversion module was
tested with different types of signals - sinusoids, square waves, DC and scaled trip

62
reference signals. The accuracy of conversion was tested and the appropriate scaling
factor was determined. The processor module and the associated software was tested
by repeatedly triggering the recordings using artificial trip signals. The performance
was monitored and it was observed that recordings were made accurately for all
triggers that were applied. The wireless system was tested in lab environment with
300 meters distance between the two units. The test message transmissions were sent
and received accurately.
The processor system on the master side was tested in co-ordination with the
slave side processor. Artificial triggers were applied to the slave unit and the master
was turned on to receive records. It was observed that records were stored on the
master side for each trigger applied to the slave system.
Integrated system testing
The circuit breaker monitoring system was evaluated in the laboratory using signals
recorded previously in the field. The AVO test set equipment was used to replay
the waveforms using Relay Assistant software [27]. The test setup at Texas A&M
university laboratory can play back only three high voltage channels so the testing
is done 3 channels at a time. Fig. 20 shows the waveforms replayed by the test
equipment to the CB monitoring system. It can be seen that the waveforms are part
of a reference trip record. The working of the slave unit software is observed on the
monitor connected to the slave unit. This information is used for debugging the data
acquisition software. The signals are captured and transmitted to the master unit.
The data collected on the master unit is then plotted and the waveforms are compared
to those at the input. Fig. 21 shows the waveforms of the recorded signals. It can
be seen that the time scale of the signals input to CBM and the signals recorded by
CBM is different. This is because duration of recorded signals is 1 sec and includes

63
about 200ms of pre-event data.
Fig. 20. Trip event, a contact and close event reference signals
-200
20406080
100120
-50
0
50
100
150
-10-5
0
5
1015
0 200 400 600 800 1000Time (ms)
Fig. 21. Trip event, a contact and close event signals recorded by CBM unit
Comparison of the two figures indicates that some noise is introduced during
recording. This is due the combined effect of the test equipment and the power
converters used for powering the signal conditioning unit.

64
Fig. 22. Breaker wiring panel
C. Field testing
The circuit breaker monitor was tested in a field setup at one of the local utility
company’s substations. The slave unit was set up at a breaker which operates on a
345kV line. The slave unit hardware was made weather-proof by sealing the metallic
box with a sealant. The temperatures at the test site can go as high as 150·F. The
electronic components used in the design were chosen so as to meet the required
temperature specifications. Fig. 22 shows the breaker panel from which signal wires
were drawn. Fig. 23 shows the slave unit installed at the breaker.Installation was non-
invasive, the time required was less than one hour and required only two personnel.

65
Fig. 23. The slave unit set up near the breaker
The unit was energized by AC power drawn from the breaker AC line.
The breaker is located at an approximate distance of 150m from the control
house. The master unit wireless transceiver was packed in a weather proof box and
installed outside the control house so as to have a line of site between the two trans-
ceivers. The master unit transceiver is connected to the laptop through a RS232
cable onto the serial port. The master side software is installed on the laptop and
initialized to start reception.
Fig. 24 shows the waveforms of the Close initiate, B contact and A contact
signals recorded by the monitoring system during a close event. Fig. 25 shows how
the phase currents change on a close event. The figure has the same time scale as
Fig. 24. By comparing the ideal signal waveforms shown in Fig. 3(b) to those shown
in Fig. 24 it can be concluded that the Circuit Breaker Monitoring System records
the signals effectively.

66
Fig. 24. Close event record
Fig. 25. Phase currents measured during close event

67
Table XVII. Field evaluation of monitoring system
Parameter Significance Observed valueTransmission range Distance between master and slave trans-
ceivers. Communication must functioneven at this distance
300m
Transmission time Time required to transmit 1 second of cap-tured data at 5700kHz
6 min
Installation time Time required to install the CBM on abreaker
<1 hr
Installation cost Cost of field installation Labor cost + mini-mal wiring (<$15)
CBM1 at Obrien,199915,15A,0D1,Trip Event,,,V,0.003967,0.0,0,-32768,327672,Bkr close - A,,,V,0.003967,0.0,0,-32768,327673,Bkr open - B,,,V,0.003967,0.0,0,-32768,327674,X coil,,,V,0.003967,0.0,0,-32768,327675,Spare 1,,,V,0.000031,0.0,0,-32768,327676,Spare 2,,,V,0.000031,0.0,0,-32768,327677,Close Current,,,V,0.000031,0.0,0,-32768,327678,A phase current,,,V,0.000031,0.0,0,-32768,327679,Close Event,,,V,0.003967,0.0,0,-32768,3276710,Supply DC,,,V,0.003967,0.0,0,-32768,3276711,Y coil,,,V,0.003967,0.0,0,-32768,3276712,Spare 3,,,V,0.000031,0.0,0,-32768,3276713,Trip Current 1,,,V,0.000031,0.0,0,-32768,3276714,B phase current,,,V,0.000031,0.0,0,-32768,3276715,C phase current,,,V,0.000031,0.0,0,-32768,327676015760.37,576028/06/2005,11:58:42.81631028/06/2005,11:58:43.166064BINARY1.0000
Fig. 26. COMTRADE file for trip recording
Table XVII shows the parameters used for evaluation of the field system and
their observed values. The COMTRADE config file for the recorded trip signals is
listed in Fig.26.

68
D. Conclusion
This chapter discusses the evaluation of a prototype of the circuit breaker monitoring
system in laboratory and field conditions. System testing in laboratory by replaying
previously recorded signals is described. Field testing performed in a substation is
described and the recorded results are compared.

69
CHAPTER VII
APPLICATIONS
A. Introduction
The chapters so far have described the design, implementation and evaluation of the
circuit breaker monitoring system. This chapter describes the applications that can
be interfaced with the developed monitoring system. These applications will use
the data recorded by the circuit breaker monitoring system and use it to preform
different types of analysis activities. According to the IEEE Guide for the Selection
of Monitoring for Circuit Breakers [28] monitored data can be used to
• Determine the condition of a specific circuit breaker
• Determine the condition of the circuit breaker support and control functions
and facilities
• Optimize maintenance activity
• Develop an understanding of the condition of a larger population of circuit
breakers in similar circumstances by examining a representative sample of the
population
• Improve circuit breaker utilization
• Reduce circuit breaker failure rates
• Add to the circuit breaker body of knowledge available to determine the cause
of failures after the fact
• Improve economics of equipment operation

70
The data recorded by Circuit Breaker Monitoring System can be used in software
applications which make the uses described above a cost-effective means of increasing
system reliability. This chapter describes the applications that can be developed to
make effective use of local and system-wide data and the potential benefits they would
have.
B. Use of local data
Local data is defined as the data collected and processed at a substation level. The
data is sent to the control house where it is processed and stored. If an application
makes use of only data from this particular substation to derive information about
the breakers in the substation, then it is said to be a local data oriented application.
Such an application has low processing and storage requirements and is readily im-
plementable in a distributed environment. Some of the local applications that can be
designed to work with CBM recorded data are described below.
Local data applications
Automated circuit breaker analysis
The circuit breaker monitoring system can allow personnel to do away with the current
maintenance system in which personnel go to the breaker physically and record signals
using portable recorders. This will save the utility a lot of personnel hours. An
automated monitoring and analysis system developed by a group of researchers at
Texas A&M University was used as a test application [6]. The automation software
consists of a signal processing module and an expert system module. The two modules
process the voltage and current signals recorded by the circuit breaker monitoring
system, diagnose and report any abnormalities that are discovered. The analysis

71
-200
20406080
100120
-50
0
50
100
150
-10-5
0
5
1015
0 200 400 600 800 1000Time (ms)
Fig. 27. Trip event, a contact and close event signals recorded by CBM unit
software was interfaced with the monitoring system through a file repository that
uses COMTRADE format files for data storage. Pre-recorded waveforms were played
back to the monitoring system. The monitoring system triggered the analysis software
upon receiving the recorded data and it performed the analysis and reported the
results. The results reported by the analysis application, for the waveforms shown in
Fig. 27 (same as Fig. 21 replicated here for convenience), are shown in Figure 28.
Automated warning alarm system
This application is designed as a supplement to the primary alarm system thus in-
creasing its reliability. The application uses standard algorithms or expert systems
to identify events on the breaker. Depending on how critical the event is, it generates
different alarms that alert the maintenance system and the operators. This alarm
system is specially effective when certain abnormalities are observed in the circuit
breaker control circuit signals but the breaker continues to work normally. In such
cases the unnoticed abnormalities may become cause for failure. If the application
can identify signal abnormalities by regularly monitoring these signals and generate

72
maintenance alarms on detecting them, then equipment failure rates and downtime
can be considerably reduced.
050623,155835542,-5D,SRB1,P930,HLP,GE,FK-69-7500,10077937,OREPORT ON EXPERT SYSTEM CB RECORDS AUTOMATED ANALYSISCopyright: Texas A&M University, 2001, 2002Customized for: CenterPoint Energy***********************************************************************DFR record file name: 050623,155835542,-5D,SRB1,P930,HLP,GE,FK-69-7500,10077937,Open.datCreation date: 23 Jun 2005Creation time: 15:58:35.542Station ID: SRB1Device ID: P930Company name: HLPBrkr manufacturer: GEBrkr type: FK-69-7500SAP ID: 10077937Comment: T-------------Expert System Log--------------The record indicates an opening operation!R11: Yard voltage unstable!Excessive dip unrelated to close/trip coil activity!R17: ’A’ contact bouncing!R18: ’A’ contact premature!R24: ’B’ contact premature!R27: Trip coil current flat!R42: Phase A Current did not drop!R45: Phase B Current did not drop!R48: Phase C Current did not drop!R68: Velocity decreased!R72_a: Sequence A-B violated!------Maintenance & Repair Information------Check substation battery, charging system, and control cables.Check auxiliary assembly, contacts, and linkage.Check trip circuit and harness connections.Check Phase currents connections. There may be a bad interrupter.This breaker is slow. The auxiliary alignment needs to be checked.
Fig. 28. Analysis report from CBMA application

73
Predictive maintenance alarm system
The predictive maintenance alarm system application is an enhanced version of the
warning system. The warning system is an online application which raises alarms
only when abnormalities occur. However, sometimes it may be too late to act on
the abnormality alarm before the breakdown occurs. The predictive maintenance
application would combine the information extracted from recorded data with main-
tenance history of the breaker to provide better information about the state of the
breaker and remaining life time of breaker. This would enable utilities to perform
just-in-time maintenance. The recorded data can be processed by this application to
extract the following information.
• Precise breaker operation history
• Time delays observed in operation
• Signal parameters that indicate the “well-being” of different breaker components
The application would take the following information from maintenance personnel
through a graphical user interface, accessible securely over the internet or intranet.
• Date and time of maintenance
• Type of maintenance
• Details of parts replaced or repaired
• Personnel time spent on maintenance
• Cost of maintenance
The application would have a database of parts containing information about the
effective lifetime of parts and the effect of part replacement on the lifetime of breaker.

74
Using an expert system and probabilistic reliability models, various deductions could
be made by combining the maintenance information with breaker operation informa-
tion. Some of the possible inferences that can be generated are
• The remaining life-time of breaker
• Time interval before next maintenance
• Overall cost associated with breaker over its life-time
The inferences derived by this software can enable utilities to increase the life of power
apparatus and make better decisions about equipment maintenance and purchase.
Also, whenever abnormalities are detected by the software, just-in-time maintenance
can be performed by personnel. This will enable them to reduce costs while improving
reliability of service.
C. Use of system-wide data
If the recorded data from all substations in a power system is combined together to
make some deductions, then the application is known as a system wide application.
System-wide applications can help increase reliability of operation and reduce costs.
Increasing reliability
In a typical power system a lot of data is recorded and monitored. The recorded data
is critical for the day to day operation of the system. It is essential that this data be
reliable. The circuit breaker data can provide information about the status of a circuit
breaker, whether it is open or close. This data if collected all over the power system
can provide information about the topology of the power system. The topology
information is also obtained by other means which are more direct like SCADA.

75
However, the redundant topology information from circuit breakers can be used to
verify the consistency of directly measured topology information thereby increasing
robustness of data and reducing operation errors. Some applications that can use
CBM data recorded at the substation level to improve power system operation and
control are described in [29],[30] and [31].
Reducing costs
The predictive maintenance alarm system described in the previous section when
implemented over the entire power system can help reduce costs in numerous ways.
If the number of maintenances to be performed during one month period over the
complete power system or a particular region of the system is known before hand, the
maintenance staff can be hired accordingly by the power company. This will enable
the utility to maintain the breakers as needed with minimal staff. Reliable operation
of well-maintained breakers will help a utility have continuity of service or minimal
interruption even during faults by re-routing power, thus reducing costs incurred due
to loss of service.
D. Conclusions
This chapter described the different applications that can be interfaced to the circuit
breaker monitoring system. The results from integration of Circuit Breaker Mon-
itoring and Analysis application with the monitoring system were discussed. New
applications that can utilize the data recorded by CBMS were described. The dif-
ference between local and system wide applications was discussed and some possible
applications were listed. The applications described can help reduce the costs of oper-
ation and maintenance for utilities and also help prolong the life of power equipment.

76
CHAPTER VIII
CONCLUSION
A. Summary of work
Circuit breakers form a critical component of the power system and require regular
inspection and maintenance to ensure reliability of operation. The current mainte-
nance method used involves personnel going physically to the breaker. They record
the control circuit signals by operating the breaker and make a diagnosis based on
the comparison between recorded signals and reference signals. Some companies have
started using automated monitoring of circuit breakers but it is yet to receive wide
acceptance. Researchers have come up with methods to analyze the recorded signals
and draw conclusions about breaker status. However high cost of implementation
compared to the functionality that the automated systems provide is a deterrent to
their large scale use. Low cost monitoring and automated analysis systems that cater
specifically to circuit breaker monitoring are not available in the market.
A low-cost monitoring system designed specifically to work with circuit breaker
control signals was implemented and evaluated. The system can monitor up to 15
circuit breaker signals. A master-slave architecture was defined for the system which
reduces implementation cost per breaker by using a single processor to perform func-
tions common to all data acquisition units. The slave unit acquires the signals from
the circuit breaker control circuit and converts them to digital form. The signals are
then transmitted wirelessly to master unit. The choice to transmit data wirelessly
was made to reduce installation costs and increase ease of installation.
The master unit receives the data and stores it in digital form. The data is
processed and stored in COMTRADE format files which can be used by a multitude

77
of applications. The master unit has a graphical user interface which allows the user
to configure and control the functioning of the system. The master unit also allows
the user to view recorded data graphically.
The system was designed so that the recorded data may be combined with other
data from the power system. For this reason the monitoring system is synchronized
to GPS time and all recordings are accurately time-stamped. The system uses only
one GPS signal received at the master to keep the GPS receiver costs to a minimum.
The signal is propagated to the slaves through the wireless system and the entire
system is synchronized.
A prototype of the monitoring system was evaluated in the field at a substation
in Houston belonging to a local utility company. The results obtained were very
promising. A fully integrated solution has been designed and a prototype is under
development.
B. Contribution
Any new technology is evaluated on the basis of the advancement it has achieved in
existing technology and reduction in overall cost. The main benefits of the circuit
breaker monitoring system designed are
• Automatic monitoring: The system provides an automated monitoring and
event logging solution. This eliminates the need for personnel to go physically
to the breaker for inspection.
• Low-cost: The system provides a low cost solution for continuous monitoring
of circuit breakers. With the per breaker cost less than $500 the monitoring
system can be implemented on large scale, thereby automating the inspection
processing and reducing costs further.
78
• Ease of installation: The system is easy to install and requires only a few minutes
of set up time per breaker.
• Ease of use: The system provides a graphical user interface to view recorded
data and event logs. The system can be configured and controlled from the
master unit set up in the control house. If a virtual network connection is
present the system can even be controlled remotely over the internet.
• Standard interface: The system provides data in COMTRADE format file for
use by any analysis application. It provides an interface that can trigger analysis
applications when an event occurs.
It is also expected that this research and development effort has contributed the
following to the area of power systems engineering:
• The requirements and functional specifications for design of a monitoring system
• The architecture of master-slave type monitoring system
• Description of implementation and evaluation of an automatic circuit breaker
monitoring system
• Ideas for developing applications that will utilize the recorded data
C. Future work
Future work involving automation of circuit breaker monitoring may include the fol-
lowing:
• Development of a real time monitoring system which transmits recorded infor-
mation at high data rates. If the data is available for viewing within millisec-

79
onds the information can be used by operators to make better decisions while
performing control operations on the breaker.
• Integration of data collected by circuit breaker monitors installed all over the
power system and making it accessible centrally for system-wide applications.
• Design and development of local and system-wide applications which combine
circuit breaker data with other power system data to draw inferences about
maintenance and system operation and increase the robustness of data, thereby
increasing the overall system reliability.

80
REFERENCES
[1] U.S.-Canada Power System Outage Task Force, “Final report on the
August 14, 2003 blackout in the United States and Canada: Causes
and recommendations,” accessed on April 2004. [Online]. Available:
https://reports.energy.gov/BlackoutFinal-Web.pdf
[2] J. Endrenyi, S. Aboresheid, R. N. Allan, G. J. Anders, S. Asgarpoor et al.,
“The present status of maintenance strategies and the impact of maintenance on
reliability,” IEEE Transactions on Power Systems, vol. 16, no. 4, pp. 638–646,
November 2001.
[3] A. Bosma and R. Thomas, “Condition monitoring and maintenance strategies for
high-voltage circuit breakers,” in IEE 6th International Conference on Advances
in Power System Control, Operation and Management (APSCOM-2003), vol. 1,
Hong Kong, Nov. 11–14, 2003, pp. 191–196.
[4] CIGRE Working Group A3.12, “Failure survey on circuit breaker control sys-
tems: Summary report,” Electra, vol. N-216, Oct. 2004.
[5] W. Liu, H. Liu, J. Wang, and D. Fang, “An on-line working condition mon-
itoring and fault alarm system for high voltage circuit breakers,” in IEE 2nd
International Conference on Advances in Power System Control, Operation and
Management (APSCOM-93), vol. 2, Hong Kong, Dec. 7–10, 1993, pp. 695–699.
[6] M. Kezunovic, C. Nail, Z. Ren, D. R. Sevcik, S. Lucey, W. E. Cook, and E. A.
Koch, “Automated circuit breaker monitoring and analysis,” IEEE PES Summer
Meeting, pp. 559–564, July 2002.

81
[7] H. K. Høidalen, M. Runde, O. Haugland, G. Ottesen, and M. Ohlen, “Continuous
monitoring of circuit breakers using vibration analysis,” in Eleventh International
Symposium on High Voltage Engineering, vol. 1, London, Aug. 23–27, 1999, pp.
102–106.
[8] “Final report on results of second international enquiry into circuit breaker reli-
ability,” Paris, France: CIGRE Brochure 83.
[9] BCM 200: Breaker condition monitor. Qualitrol Corporation. Ac-
cessed on Aug. 2005. [Online]. Available: http://www.qualitrolcorp.com/
docs/BCM 200 Brochure.pdf
[10] CBT 400: Circuit breaker test system. Qualitrol Corporation. Ac-
cessed on Aug. 2005. [Online]. Available: http://www.qualitrolcorp.com/
docs/CBT 400 Brochure.pdf
[11] SICAM analog input AI16. Siemens Power Trasnmission and Distribution
(PTD). Accessed on Aug. 2005. [Online]. Available: https://www.energy-
portal.siemens.com
[12] Optimizer+. Incon Inc. Accessed on Aug. 2005. [Online]. Available:
http://www.intelcon.com/products/prs/pdf/op1.pdf
[13] TDR9000 Circuit Breaker Test System. Doble Engineering. Accessed on Aug.
2005. [Online]. Available: http://www.doble.com/products/TDRSpecs.htm
[14] CBWatch-2. Areva T&D. Accessed on Aug. 2005. [Online]. Available:
http://www.areva-td.com
[15] Definition for power switchgear, IEEE Std. C37.100, 1981.

82
[16] J. L. Blackburn, Protective Relaying : Principles and Applications. New York:
Marcel Dekker Inc., 1998, pp. 16–17.
[17] Electrical power system device function numbers and contact designations, IEEE
Std. C72.2, 1996.
[18] R. D. Garzon, High Voltage Circuit Breakers, 2nd ed. New York: Marcel Dekker
Inc., 2002.
[19] Preferred ratings and related capabilities for ac high voltage circuit breakers rated
on a symmetrical current basis, ANSI Std. C37.06, 1979.
[20] High-voltage alternating-current circuit-breakers, International Electrotechnical
Commission (IEC) Std. 62 271-100, 2001.
[21] C. Nail, “Automated circuit breaker analysis,” Master’s thesis, Texas A&M Uni-
versity, College Station, Texas, Aug 2002.
[22] Z. Ren, “Wavelet based analysis of circuit breaker operation,” Master’s thesis,
Texas A&M University, College Station, Texas, May 2003.
[23] P. Gopalan and M. Todorovic, “Evaluation of enabling technologies for auto-
mated circuit breaker monitoring,” Dept. of Elec. Engr., Texas A&M University,”
Research Report, March 2000.
[24] Common Format for Transient Data Exchange (COMTRADE) for Power Sys-
tems, IEEE Std. C37.111, 1999.
[25] D. L. Mills, “Simple Network Time Protocol (SNTP) version 4 for IPv4, IPv6 and
OSI,” University of Delaware,” Network Working Group Report RFC-XXXX,
Aug. 2003.

83
[26] J. W. Ingleson et al., “File naming convention for time sequence data,” presented
at the Fault Disturbance Analysis Conference. Atlanta, Georgia: Final Report
of IEEE Power System Relaying Committee Working Group H8, 2001.
[27] PC-Based Simulator for Relay Testing, Test Laboratories International, Inc.,
2002, ver. 1.2.
[28] Guide for the Selection of Monitoring for Circuit Breakers, IEEE Guide C37.10.1,
2001.
[29] S. Jakovljevic, “Data collection and processing for substation integration en-
hancement,” Master’s thesis, Texas A&M University, College Station, Texas,
May 2003.
[30] M. Kezunovic and G. Latisko, “Automated monitoring functions for improved
power system operation and control,” presented at the IEEE PES Summer Meet-
ing, San Francisco, USA, June 2005.
[31] M. Kezunovic, T. Djokic, and T. Kostic, “Robust topology determination based
on additional substation data from IEDs,” presented at PowerTech 05, St. Pe-
tersburg, Russia, June 2005.

84
APPENDIX A
SOFTWARE DESIGN DESCRIPTION
Communication protocol implementation
The communication protocol is implemented in the master unit software by the class
CommRS232. Table XVIII shows the names and functions of the methods imple-
mented by this class.
Table XVIII. Methods implemented by the communication class
Method Name Parameter List FunctionSendMesg char SlaveId, string
commandTakes the slave id and command stringand transmits the 2 byte command mes-sage to the slave unit
OnSerialPortEvent Object sender, Seri-alDataReceivedEven-tArgs e
Overrides the default data receivedmethod of the serial port object andparses the incoming messages and acti-vates the appropriate routines
ParseMesg string Message Takes the message string as input and out-puts the byte code for the message
OnDataTransfer void Handles the transfer of data packets fromthe slave unit
SaveData byte[ ] data Saves the data packets received into a fileon storage device
SendConfig string configdata Creates the configuration data packet andtransmits it
OnReceiveConfig Object sender, Seri-alDataReceivedEven-tArgs e
Receives the config and header files trans-mitted by slave

85
Fig. 29. Main application form showing slave units present in the system
Graphical user interface description
The master unit software provides a graphical user interface for the user to control and
configure the system. This section provides the details about the different interfaces
and how to use them. Fig. 29 shows the Main window of the master unit software.
This windows lists the slave units present in the system. The user can access a
context menu shown in the figure by selecting one of the slave units and then using
the right click button of the pointing device. The context menu allows the user to
view records from the particular slave unit, restart the slave unit, configure the unit
and remove the unit. It also allows the user to add a new unit to the system and
enter its configuration. Any of these options can be chosen by using the left click
button of the pointing device when the option is highlighted. The buttons like Check

86
Fig. 30. Form for changing configuration of CBM slave device
device status, Synchronize all and Restart all button perform the respective actions
on all slave units. The Quit button quits the master unit software application.
Fig. 30 shows the configuration form designed to allow the user to change the
configuration of a slave device. The Event Log button when pressed generates a
new form on the screen which displays the list of records belonging to the particular
slave unit which is being configured. The details buttons for the Analog and Digital
channels display the signal details as shown in Fig. 31. A particular record saved by
the master unit can be viewed by selecting it from the event log list. Fig. 32 shows
the window that displays the waveforms of the recorded signals.

87
Fig. 31. Form for changing signal names and type

88
Fig
.32
.:For
mfo
rdis
pla
yin
gre
cord
s

89
VITA
Nitin Ved
32/A Deep Apts, Pande Lay Out,
Nagpur - 440025, India
Educational Background
Nitin Ved received his Bachelor of Technology degree in electrical engineering
from Indian Institute of Technology, Bombay, India in 2003. He earned his Master
of Science degree in electrical engineering from Texas A&M University in December
2005.