Embed Size (px)
Citation preview
CINNAMINSON TOWNSHIP PUBLIC SCHOOLS
Summary of 2012 Achievements in Testing BOARD PRESENTATION
CINNAMINSON SCHOOL DISTRICT2012 Summary of Achievements
How does education in New Jersey compare to other states?
Education in New Jersey ranks close to the top in national achievement as measured by the 2011 NAEP, the National Assessment of Educational Progress. NJ ranks 2nd in the nation in reading in grades 4 and 8, 3rd in 8th grade math, and 4th in 4th grade math.
New Jersey DataBank National Rankings in Education:
New Jersey is No.1 in Graduation Rate - New Jersey’s high school graduation rate remains the highest in the nation according to the Diplomas Count 2011 report.2nd in Education for Children - New Jersey ranked 2nd place behind Massachusetts in Education according to the national KIDSCOUNT Data Book.3rd in Science and Engineering Readiness - New Jersey got the 3rd highest score on the Science and Engineering Readiness index (SERI) that measures how well K-12 schools are preparing their students for science and engineering careers.2nd Smartest State - According to Education Week’s annual education report card 2010-2011, NJ score came in second on the K-12 Achievement Index. Massachusetts is the top-achieving state, followed closely by New Jersey and Maryland.

What are the test results for Cinnaminson this year?
While scores remain steady in most areas, there are some notable changes in 2012
• a 2 year upswing in Math 8. • a 2 year upswing in Math 6. • a 1 year upswing in LAL 5 following a 2 year decline. • a decline in both Math and LAL in grade 7, consistent with state scores• a significant upswing in SAT scores of over 20 points in each of the 3 content areas, well ahead of state and national scores.
Also, Cinnaminson has the highest graduation rate (96.7%) in Burlington County, moving from 9th place in 2011 to 1st place in 2012. Upcoming 2013 test questions will reflect the Common Core State Standards (CCSS) in preparation for the next generation assessments under development by the Partnership for Assessment of Readiness for College and Careers (PARCC) which will be administered in spring, 2015. State tests are required by No Child Left Behind, but they are different in every state. What do the questions look like on NJ state tests? Neither teachers nor administrators are permitted to see the actual test questions. Samples follow.

NJ ASK – 4th Grade Math
14. Brian has 4 notebooks: one for math, one for science, one for language arts, and one for social studies. He is going to take two notebooks home tonight.
How many different pairs of notebooks could Brian take home?
A. 2B. 4C. 6D. 8The correct answer is C.
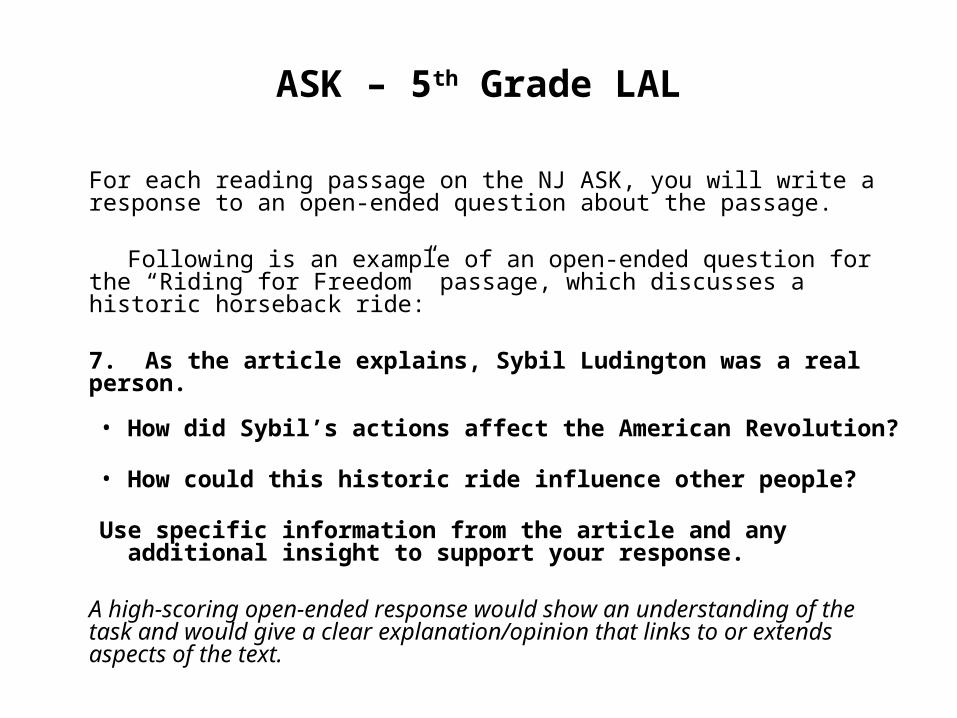
ASK – 5th Grade LAL
For each reading passage on the NJ ASK, you will write a response to an open-ended question about the passage.
Following is an example of an open-ended question for the “Riding for Freedom” passage, which discusses a historic horseback ride:
7. As the article explains, Sybil Ludington was a real person.
• How did Sybil’s actions affect the American Revolution?
• How could this historic ride influence other people?
Use specific information from the article and any additional insight to support your response.
A high-scoring open-ended response would show an understanding of the task and would give a clear explanation/opinion that links to or extends aspects of the text.
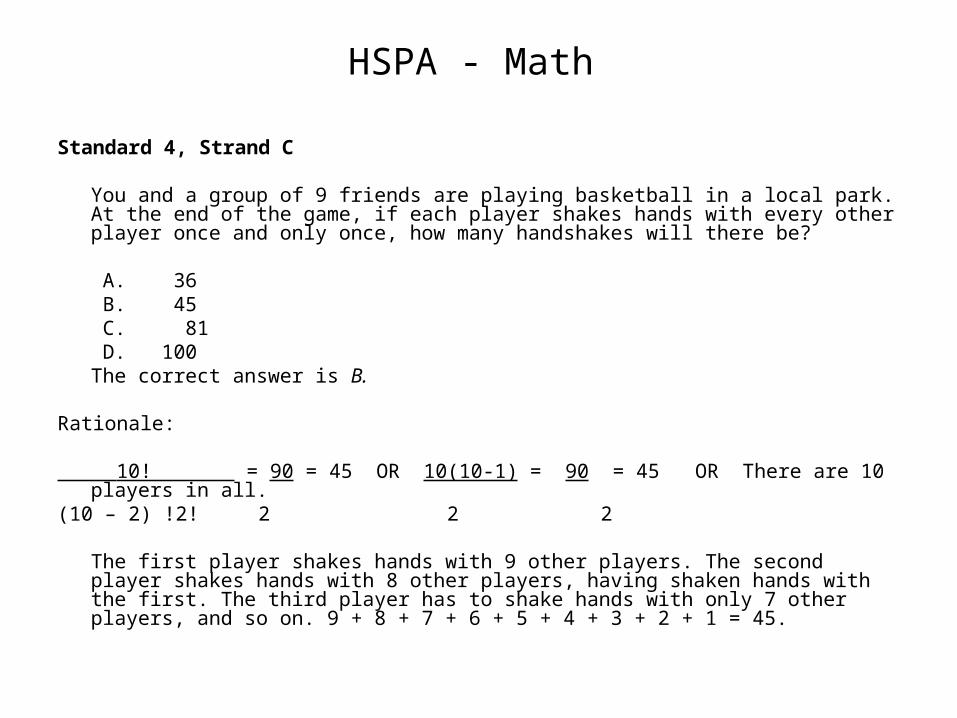
HSPA - Math
Standard 4, Strand C
You and a group of 9 friends are playing basketball in a local park. At the end of the game, if each player shakes hands with every other player once and only once, how many handshakes will there be?
A. 36 B. 45 C. 81 D. 100
The correct answer is B.
Rationale:
10! = 90 = 45 OR 10(10-1) = 90 = 45 OR There are 10 players in all.(10 – 2) !2! 2 2 2
The first player shakes hands with 9 other players. The second player shakes hands with 8 other players, having shaken hands with the first. The third player has to shake hands with only 7 other players, and so on. 9 + 8 + 7 + 6 + 5 + 4 + 3 + 2 + 1 = 45.

PERFORMANCE ASSESSMENT TASK High School Biology
Fueling ChangeCropCorp is a new corporation with the mission of developing new biofuels1. You havebeen hired as a consultant to manage its newly acquired farm. You must decide whichcrop will most efficiently transform sunlight into a product that can be used to make abiofuel. You want to choose a crop that will make the most efficient use of space andresources (land, fertilizer, money).
The farm you are planning for is located in central New Jersey, where the soil is a mixof sand, clay, and organic material with some stone and gravel. The land is flat with a2-acre pond and 100 acres of forest that can be used for logging. One acre of land isapproximately the size of a football field.
All alternative fuel decisions have environmental and economic costs that must beconsidered. CropCorp would like you to recommend which crop, corn or switchgrass2,should be planted on the new farm.
1 biofuels – any fuels that are obtained from a renewable biological resource2 switchgrass – native prairie grass that can be grown in abundance in the United States
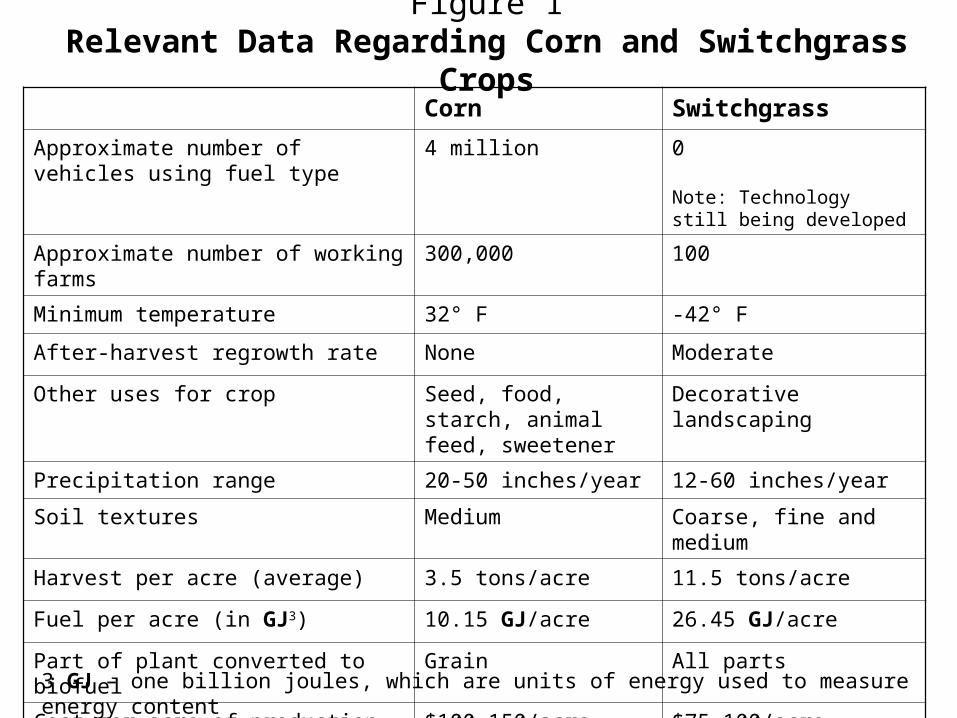
Figure 1Relevant Data Regarding Corn and Switchgrass Crops
Corn Switchgrass
Approximate number of vehicles using fuel type
4 million 0 Note: Technology still being developed
Approximate number of working farms 300,000 100
Minimum temperature 32° F -42° F
After-harvest regrowth rate None Moderate
Other uses for crop Seed, food, starch, animal feed, sweetener
Decorative landscaping
Precipitation range 20-50 inches/year 12-60 inches/year
Soil textures Medium Coarse, fine and medium
Harvest per acre (average) 3.5 tons/acre 11.5 tons/acre
Fuel per acre (in GJ3) 10.15 GJ/acre 26.45 GJ/acre
Part of plant converted to biofuel Grain All parts
Cost per acre of production $100-150/acre $75-100/acre
3 GJ – one billion joules, which are units of energy used to measure energy content

Your Task:
1) Review the data about corn and switchgrass provided in Figure 1.
2) Determine which ONE crop you think would be the better crop for the farm,considering all factors provided in Figure 1.
3) Write a persuasive argument to the president of the corporation, detailing yourdecision and justifying your ONE crop choice using data fromFigure 1. Be sure to include all of the following elements:
• Which crop you have chosen and why.
• Cite evidence and data from Figure 1 to support your recommendation.
• Address potential environmental and economic consequences of yourrecommendation.
Please write your response in paragraph form.

4 POINTS 3 POINTS 2 POINTS 1 POINTSelects and thoroughly
explains crop choice
with no misconceptions.
Uses extensive data
from table to support
decision.
Shows strong evidence
of weighing multiple
environmental and
economic
consequences.
All arguments are
strongly based on
scientific evidence
and/or principles.
Selects and explains
crop choice with no
misconceptions.
Uses some data from
table to support
decision.
Shows some evidence
of weighing multiple
environmental and
economic
consequences.
Most arguments are
based on scientific
evidence and/or
principles.
Selects and explains
crop choice with
minor misconceptions.
Uses data from table
to support decision.
Some arguments are
based on scientific
evidence and/or
principles.
Selects but does
not explain crop
choice.
Does not use data
from table to
support decision.
Few to no
arguments are
based on scientific
evidence and/or
principles.
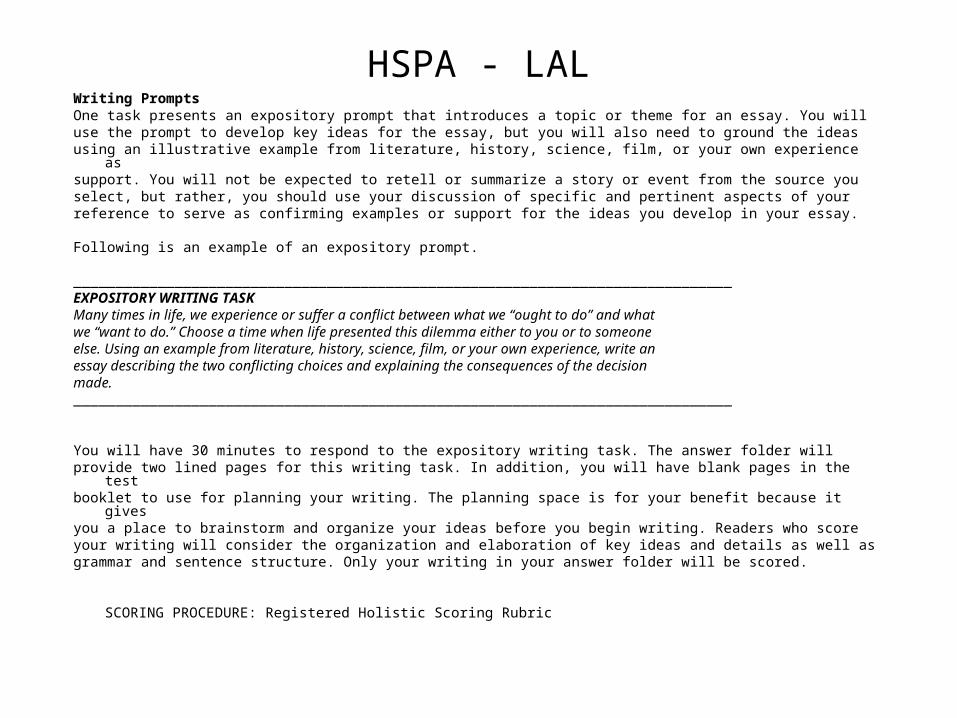
HSPA - LALWriting PromptsOne task presents an expository prompt that introduces a topic or theme for an essay. You willuse the prompt to develop key ideas for the essay, but you will also need to ground the ideasusing an illustrative example from literature, history, science, film, or your own experience assupport. You will not be expected to retell or summarize a story or event from the source youselect, but rather, you should use your discussion of specific and pertinent aspects of yourreference to serve as confirming examples or support for the ideas you develop in your essay.
Following is an example of an expository prompt.
______________________________________________________________________________EXPOSITORY WRITING TASKMany times in life, we experience or suffer a conflict between what we “ought to do” and whatwe “want to do.” Choose a time when life presented this dilemma either to you or to someoneelse. Using an example from literature, history, science, film, or your own experience, write anessay describing the two conflicting choices and explaining the consequences of the decisionmade.______________________________________________________________________________
You will have 30 minutes to respond to the expository writing task. The answer folder willprovide two lined pages for this writing task. In addition, you will have blank pages in the testbooklet to use for planning your writing. The planning space is for your benefit because it givesyou a place to brainstorm and organize your ideas before you begin writing. Readers who scoreyour writing will consider the organization and elaboration of key ideas and details as well asgrammar and sentence structure. Only your writing in your answer folder will be scored.
SCORING PROCEDURE: Registered Holistic Scoring Rubric
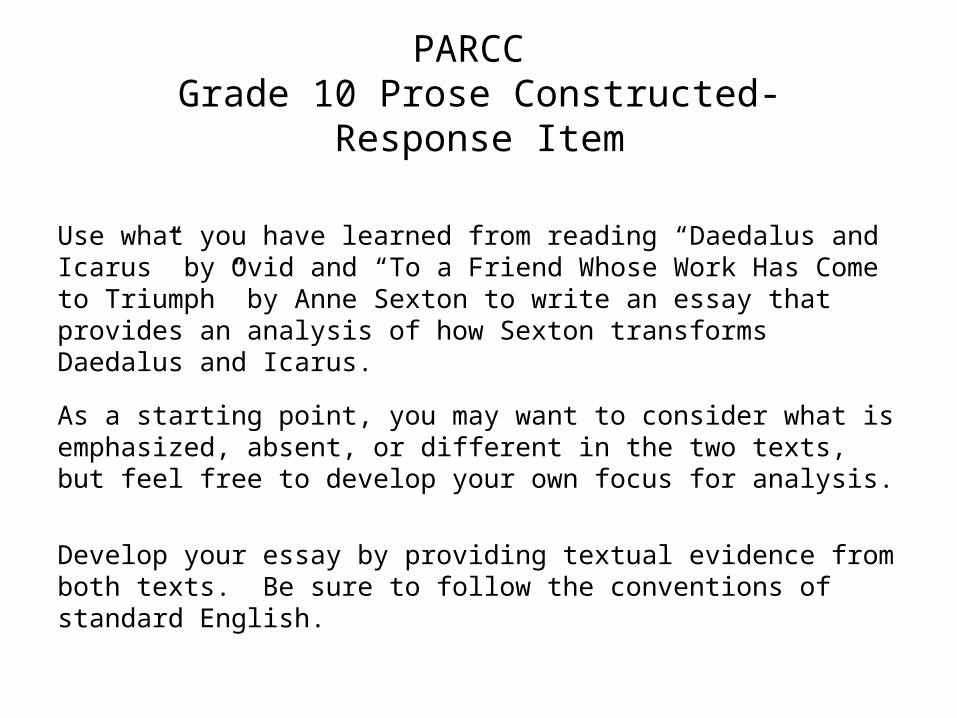
Use what you have learned from reading “Daedalus and Icarus” by Ovid and “To a Friend Whose Work Has Come to Triumph” by Anne Sexton to write an essay that provides an analysis of how Sexton transforms Daedalus and Icarus.
As a starting point, you may want to consider what is emphasized, absent, or different in the two texts, but feel free to develop your own focus for analysis.
Develop your essay by providing textual evidence from both texts. Be sure to follow the conventions of standard English.
PARCC Grade 10 Prose Constructed-Response Item

0
20
40
60
80
100
Grade 3 88.5 89.9 89.8 82.3 91.7
2012 2011 2010 **2009 2008
5 YEAR TREND: NJ ASK 3 – MATH
Percentage of Total Population Passing
** Test was redesigned for 2009 administration
0
20
40
60
80
100
Grade 3Language Arts
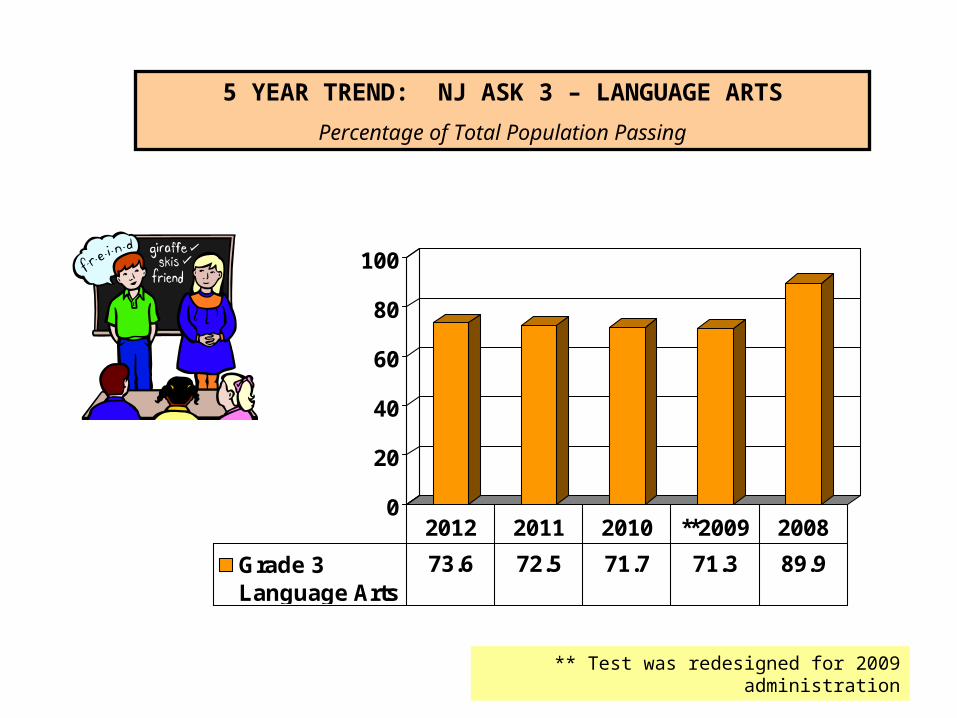
73.6 72.5 71.7 71.3 89.9
2012 2011 2010 **2009 2008
5 YEAR TREND: NJ ASK 3 – LANGUAGE ARTS
Percentage of Total Population Passing
** Test was redesigned for 2009 administration
0
20
40
60
80
100
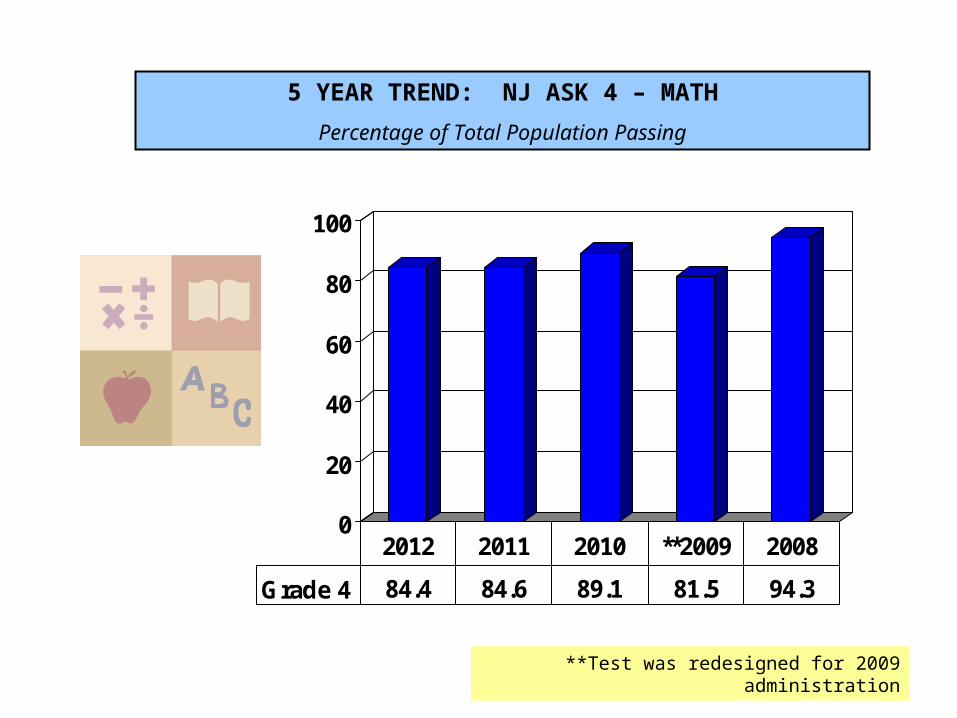
Grade 4 84.4 84.6 89.1 81.5 94.3
2012 2011 2010 **2009 2008
5 YEAR TREND: NJ ASK 4 – MATH
Percentage of Total Population Passing
**Test was redesigned for 2009 administration

0
20
40
60
80
100
GRADE 4 74.7 74.6 63.7 72.7 89.1
2012 2011 2010 **2009 2008
5 YEAR TREND: NJ ASK 4 – LANGUAGE ARTS
Percentage of Total Population Passing
**Test was redesigned for 2009 administration

0
20
40
60
80
100
Grade 5 91.4 91.8 86.7 85.6 91.9
2012 2011 2010 2009 **2008
5 YEAR TREND: NJ ASK 5 – MATH
Percentage of Total Population Passing
**Test was redesigned for 2008 administration
0
20
40
60
80
100
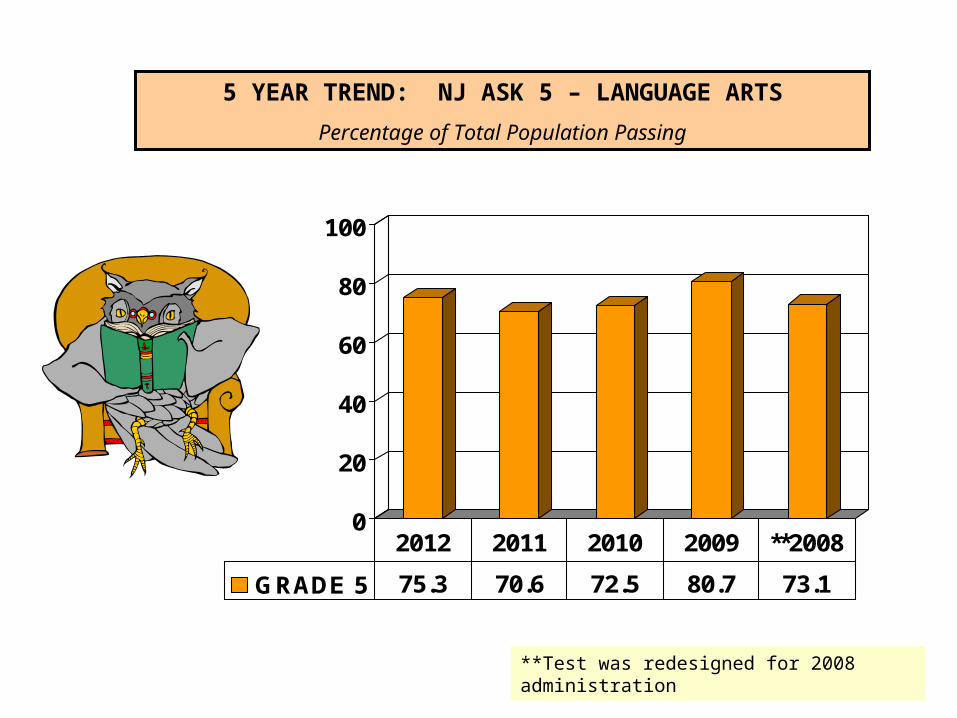
GRADE 5 75.3 70.6 72.5 80.7 73.1
2012 2011 2010 2009 **2008
5 YEAR TREND: NJ ASK 5 – LANGUAGE ARTS
Percentage of Total Population Passing
**Test was redesigned for 2008 administration

0.0
20.0
40.0
60.0
80.0
100.0
District 88.5 89.9 84.4 84.6 91.4 91.8
DFG 84.0 84.3 82.3 83.7 87 84.7
State 78.4 78.9 77.4 79.3 83.2 80.6
Grade 3 2012
Grade 3 2011
Grade 4 2012
Grade 4 2011
Grade 5 2012
Grade 5 2011
ASK 3 – 5 COMPARISON TO DFG AND STATE
2011 AND 2010
Percentage of total population scoring proficient and advanced proficient
ASK 3-5 MATH
COMPARISON TO DFG AND STATE:
2012 AND 2011
Percentage of total population scoring proficient and advanced proficient
0.0
20.0
40.0
60.0
80.0
100.0
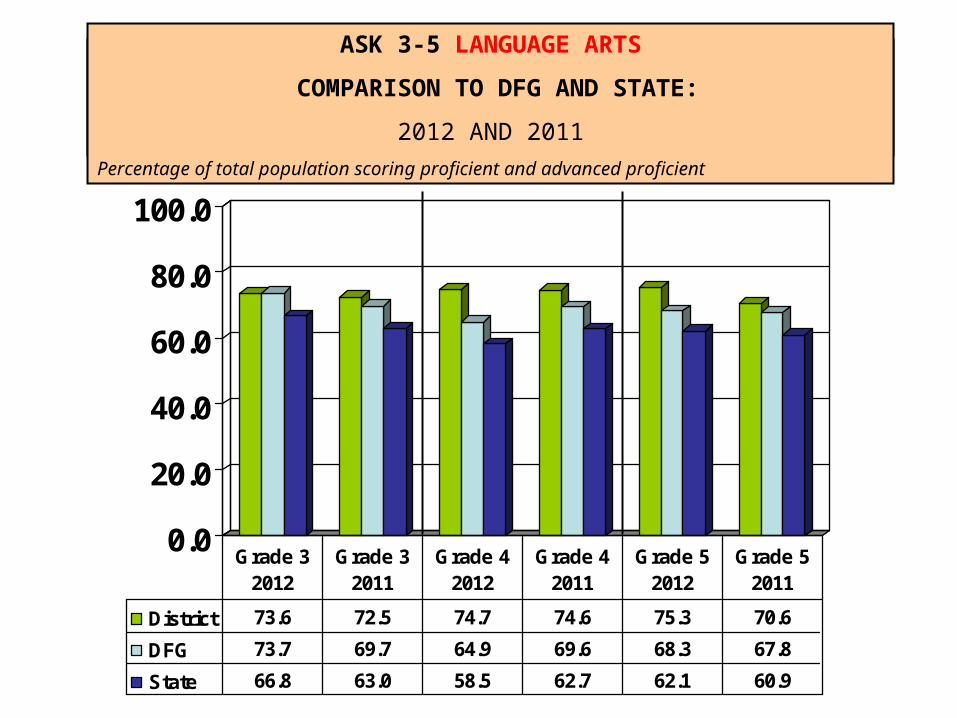
District 73.6 72.5 74.7 74.6 75.3 70.6
DFG 73.7 69.7 64.9 69.6 68.3 67.8
State 66.8 63.0 58.5 62.7 62.1 60.9
Grade 3 2012
Grade 3 2011
Grade 4 2012
Grade 4 2011
Grade 5 2012
Grade 5 2011
ASK 3 – 5 COMPARISON TO DFG AND STATE
2011 AND 2010
Percentage of total population scoring proficient and advanced proficient
ASK 3-5 LANGUAGE ARTS
COMPARISON TO DFG AND STATE:
2012 AND 2011
Percentage of total population scoring proficient and advanced proficient

0
20
40
60
80
100
Grade 6 82.9 79.9 73.7 83.3 73.3
2012 2011 2010 2009 **2008
5 YEAR TREND: NJ ASK 6 – MATH
Percentage of Total Population Passing
**Test was redesigned for 2008 administration
0
20
40
60
80
100
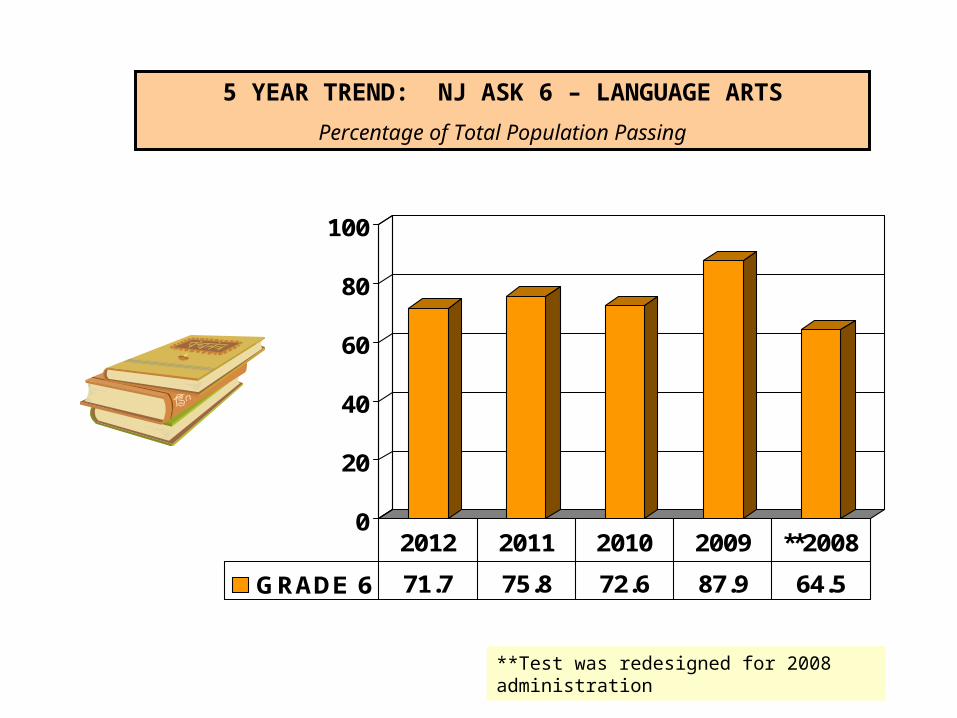
GRADE 6 71.7 75.8 72.6 87.9 64.5
2012 2011 2010 2009 **2008
5 YEAR TREND: NJ ASK 6 – LANGUAGE ARTS
Percentage of Total Population Passing
**Test was redesigned for 2008 administration
0.0
20.0
40.0
60.0
80.0
100.0
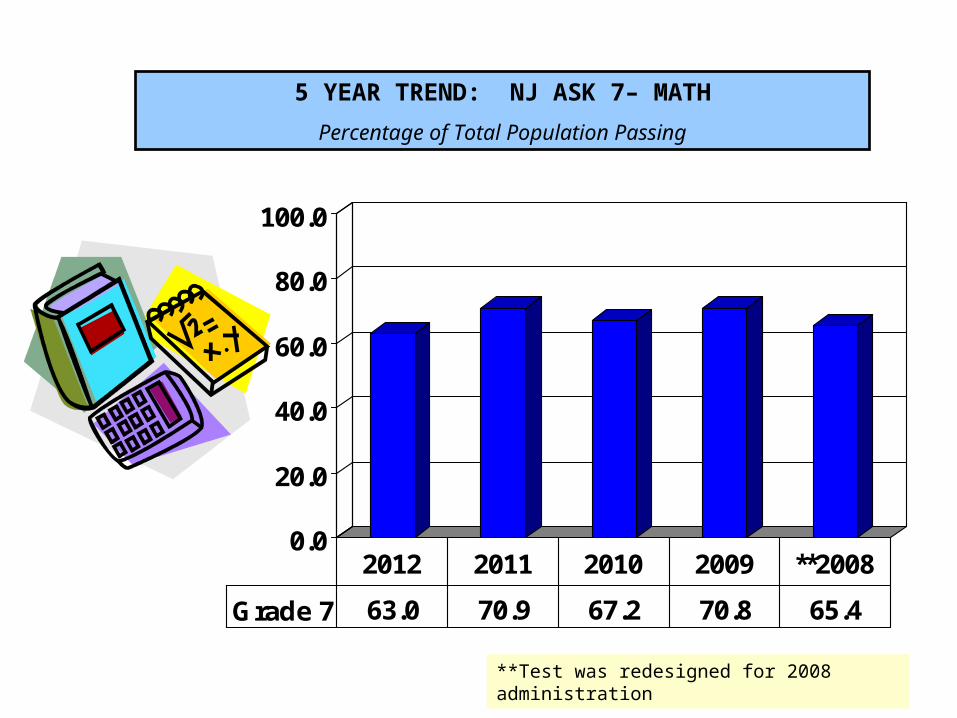
Grade 7 63.0 70.9 67.2 70.8 65.4
2012 2011 2010 2009 **2008
5 YEAR TREND: NJ ASK 7– MATH
Percentage of Total Population Passing
**Test was redesigned for 2008 administration

0
20
40
60
80
100
GRADE 7 74.5 82.0 83.6 84.0 74.7
2012 2011 2010 2009 **2008
5 YEAR TREND: NJ ASK 7 – LANGUAGE ARTS
Percentage of Total Population Passing
**Test was redesigned for 2008 administration
0
20
40
60
80
100
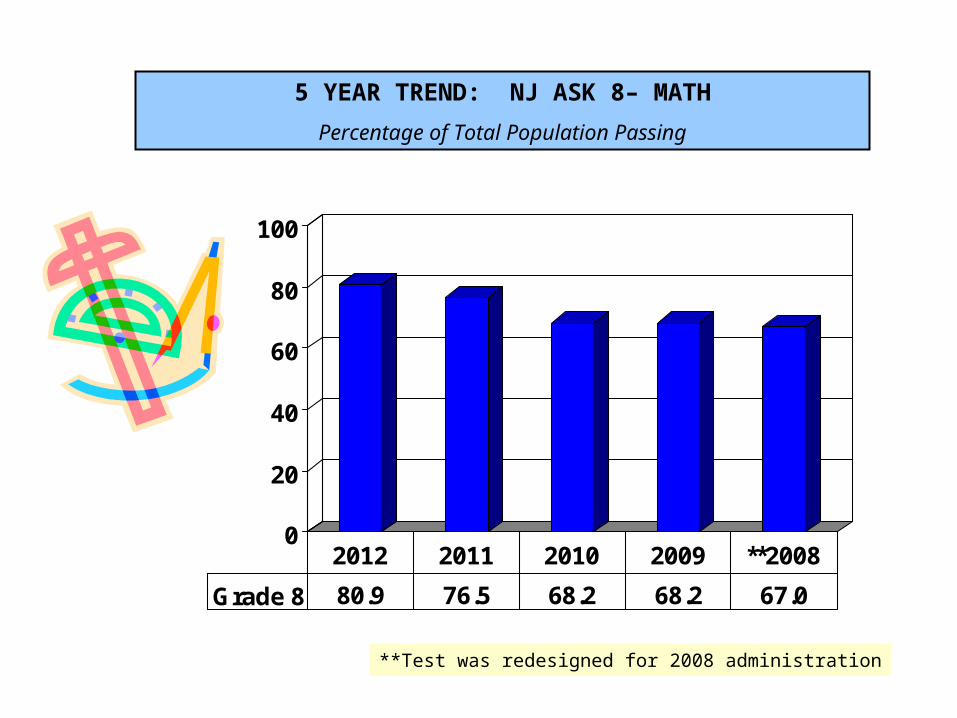
Grade 8 80.9 76.5 68.2 68.2 67.0
2012 2011 2010 2009 **2008
5 YEAR TREND: NJ ASK 8– MATH
Percentage of Total Population Passing
**Test was redesigned for 2008 administration

0
20
40
60
80
100
GRADE 8 93.6 91.3 92.4 84.9 90.4
2012 2011 2010 2009 **2008
5 YEAR TREND: NJ ASK 8 – LANGUAGE ARTS
Percentage of Total Population Passing
**Test was redesigned for 2008 administration
0
20
40
60
80
100
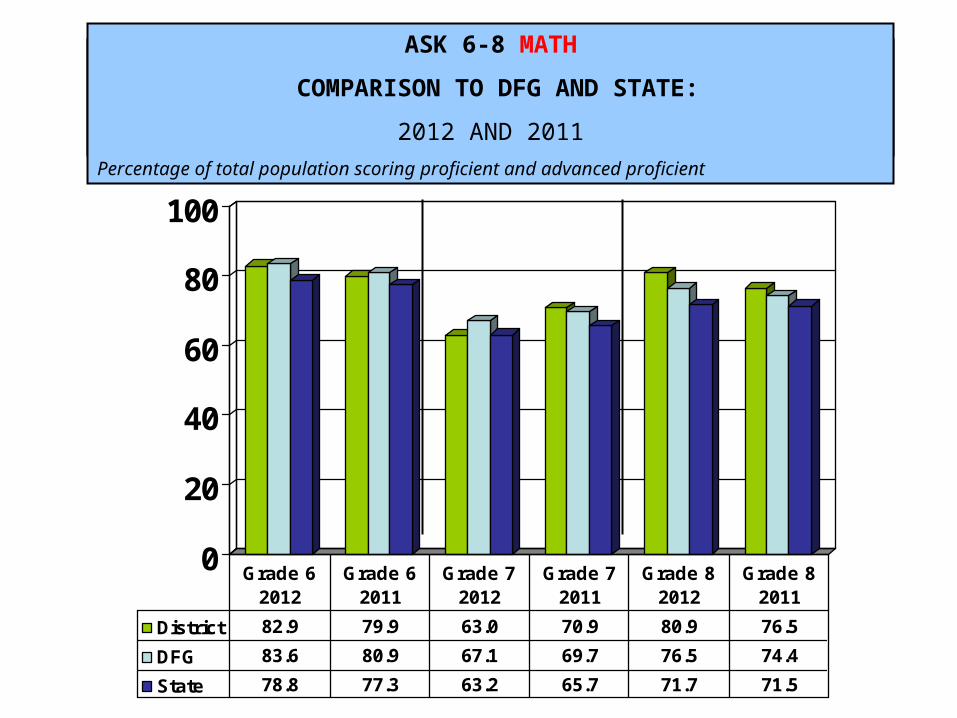
District 82.9 79.9 63.0 70.9 80.9 76.5
DFG 83.6 80.9 67.1 69.7 76.5 74.4
State 78.8 77.3 63.2 65.7 71.7 71.5
Grade 6 2012
Grade 6 2011
Grade 7 2012
Grade 7 2011
Grade 8 2012
Grade 8 2011
ASK 3 – 5 COMPARISON TO DFG AND STATE
2011 AND 2010
Percentage of total population scoring proficient and advanced proficient
ASK 6-8 MATH
COMPARISON TO DFG AND STATE:
2012 AND 2011
Percentage of total population scoring proficient and advanced proficient
0
20
40
60
80
100
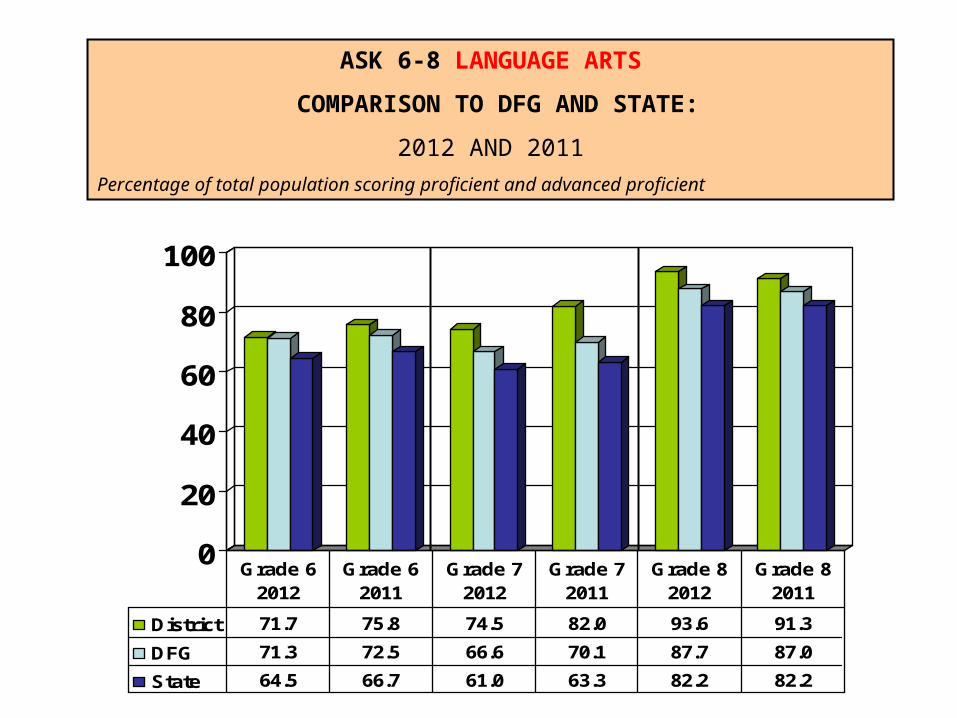
District 71.7 75.8 74.5 82.0 93.6 91.3
DFG 71.3 72.5 66.6 70.1 87.7 87.0
State 64.5 66.7 61.0 63.3 82.2 82.2
Grade 6 2012
Grade 6 2011
Grade 7 2012
Grade 7 2011
Grade 8 2012
Grade 8 2011
ASK 6-8 LANGUAGE ARTS
COMPARISON TO DFG AND STATE:
2012 AND 2011
Percentage of total population scoring proficient and advanced proficient

0.0
20.0
40.0
60.0
80.0
100.0
District 81.0 79.2 76.9 81.6 83.6
DFG 82.4 78.7 77.1 81.6 80.3
State 79.3 75.2 74.1 72.7 83.6
2012 2011 2010 2009 2008
HSPA – 5 YEAR TREND (2008 – 2012)
MATHBased on Total Population Scoring Proficient and Advanced Proficient for First Time Test Takers
0
20
40
60
80
100
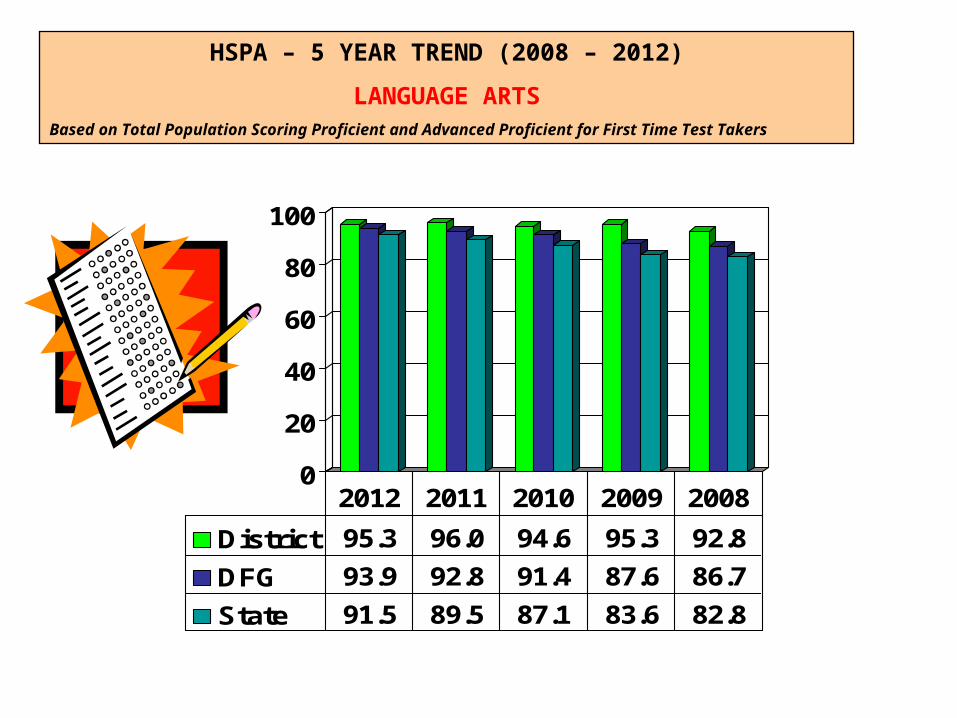
District 95.3 96.0 94.6 95.3 92.8
DFG 93.9 92.8 91.4 87.6 86.7
State 91.5 89.5 87.1 83.6 82.8
2012 2011 2010 2009 2008
HSPA – 5 YEAR TREND (2008 – 2012)
LANGUAGE ARTSBased on Total Population Scoring Proficient and Advanced Proficient for First Time Test Takers

Biology End Of Course, Proficient and above
Perf
orm
ance
Div
isio
nN
ew Je
rsey
Dep
artm
ent o
f Edu
catio
n
3 4 5 6 7 8 11Sp Ed 2012# students
74.2 31
73.3 30
76.7 33
50.0 35
19.2 26
34.6 30
51.3 41
Sp Ed 2011 # students
66.7 33
67.9 32
69.0 32
42.3 26
18.5 29
33.3 31
40.9
Econ Dis 2012# students
65.7 35
75.0 20
73.3 15
40.0 21
42.9 21
75.0 17
N/A
Econ Dis 2011 # students
93.0 14
50.0 12
68.8 17
54.5 22
61.1 18
50.0 22
N/A
African American 2012 # students
61.5 13
61.5 13
73.3 15
57.1 15
23.8 21
83.3 18
N/A
African American 2011# students
66.7 13
56.2 16
92.3 14
42.9 21
57.9 19
35.7 14
N/A
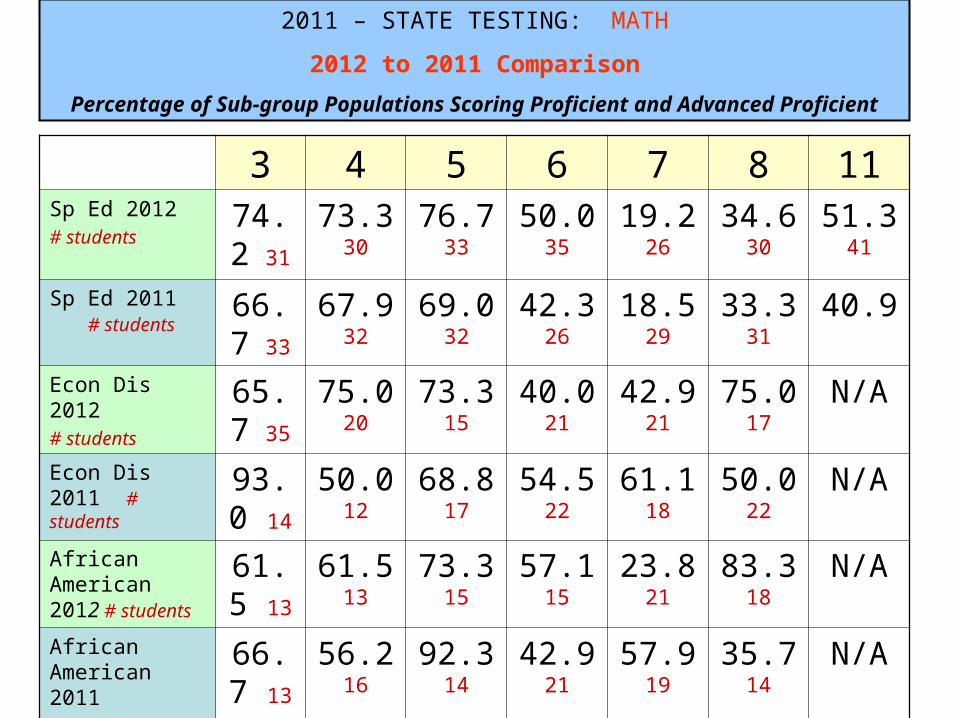
2011 – STATE TESTING: MATH
2012 to 2011 Comparison
Percentage of Sub-group Populations Scoring Proficient and Advanced Proficient
Grade 3 4 5 6 7 8 11
Sp Ed 2012# students
41.9 31
46.7 30
33.3 33
36.7 35
19.2 26
65.4 30
82.5 41
Sp Ed 2011 # students
40.0 33
28.632
44.832
26.926
44.429
60.031
81.847
Econ Dis 2012# students
45.7 35
60.0 20
46.7 15
35.0 21
57.1 21
93.7 17
N/A
Econ Dis 2011 # students
57.1
14
33.312
43.817
63.622
55.618
72.722
N/A
African American 2012 # students
53.8 13
53.8 13
40.0 15
50.0 15
57.1 21
100.0 18
N/A
African American 2011# students
46.213
31.2 16
53.814
52.421
78.919
50.014
N/A
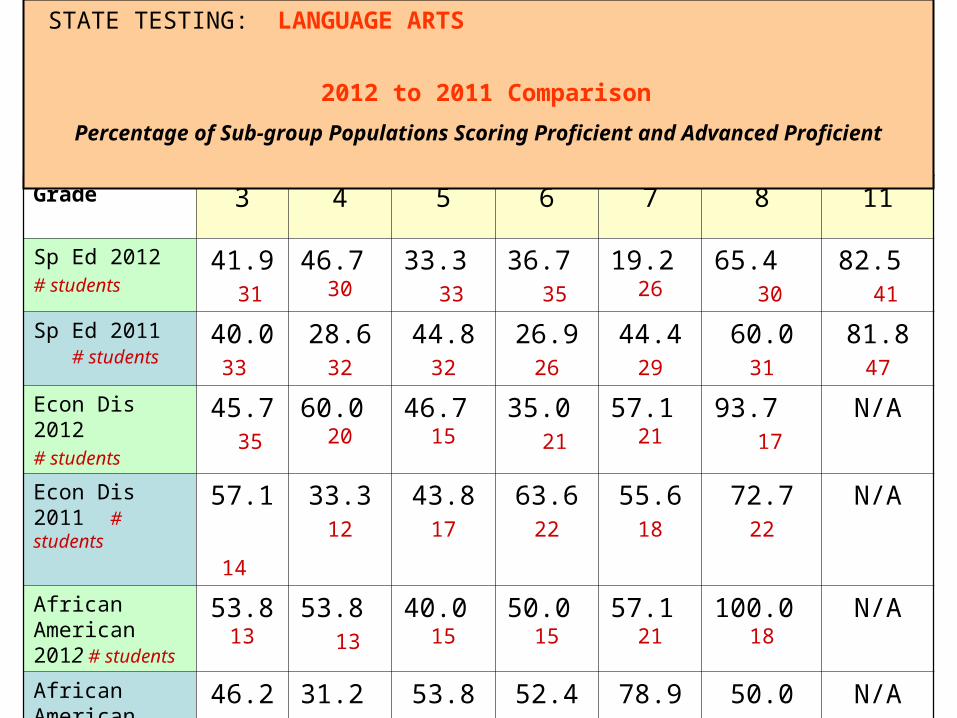
STATE TESTING: LANGUAGE ARTS
2012 to 2011 Comparison
Percentage of Sub-group Populations Scoring Proficient and Advanced Proficient
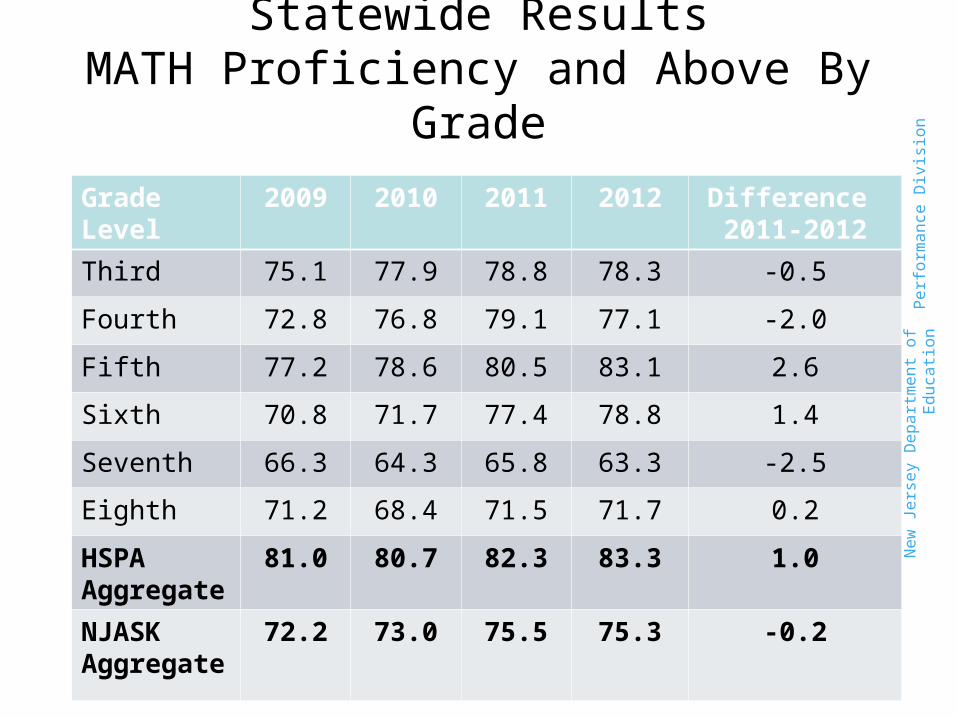
Statewide ResultsMATH Proficiency and Above By Grade
Grade Level
2009 2010 2011 2012 Difference 2011-2012
Third 75.1 77.9 78.8 78.3 -0.5
Fourth 72.8 76.8 79.1 77.1 -2.0
Fifth 77.2 78.6 80.5 83.1 2.6
Sixth 70.8 71.7 77.4 78.8 1.4
Seventh 66.3 64.3 65.8 63.3 -2.5
Eighth 71.2 68.4 71.5 71.7 0.2
HSPA Aggregate
81.0 80.7 82.3 83.3 1.0
NJASK Aggregate
72.2 73.0 75.5 75.3 -0.2
Perf
orm
ance
Div
isio
nN
ew Je
rsey
Dep
artm
ent o
f Edu
catio
n
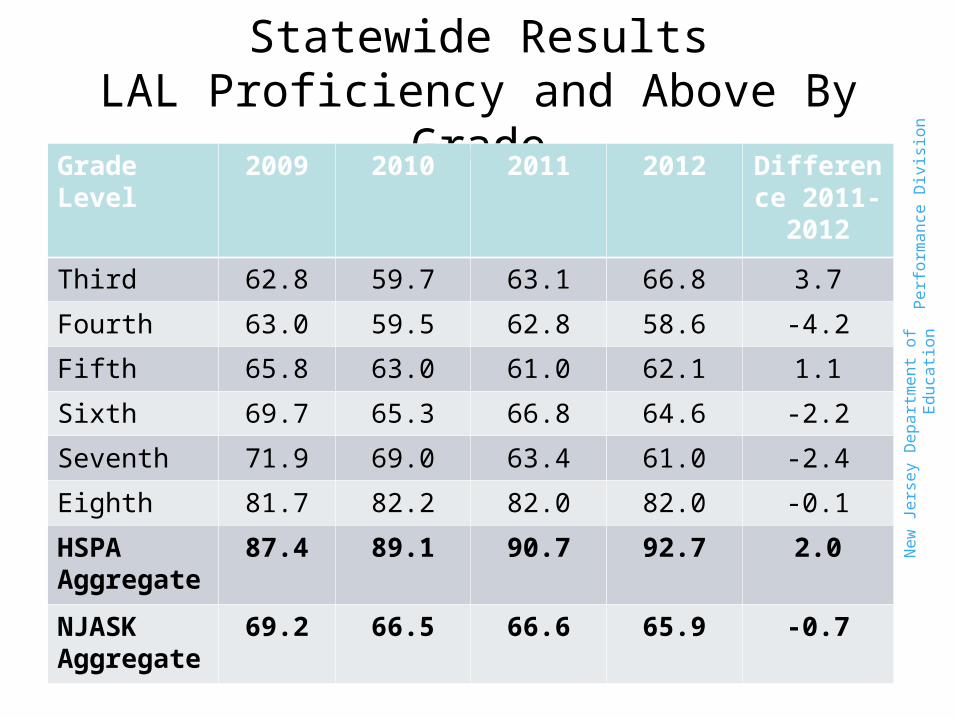
Statewide ResultsLAL Proficiency and Above By Grade
Grade Level
2009 2010 2011 2012 Difference 2011-2012
Third 62.8 59.7 63.1 66.8 3.7
Fourth 63.0 59.5 62.8 58.6 -4.2
Fifth 65.8 63.0 61.0 62.1 1.1
Sixth 69.7 65.3 66.8 64.6 -2.2
Seventh 71.9 69.0 63.4 61.0 -2.4
Eighth 81.7 82.2 82.0 82.0 -0.1
HSPA Aggregate
87.4 89.1 90.7 92.7 2.0
NJASK Aggregate
69.2 66.5 66.6 65.9 -0.7
Perf
orm
ance
Div
isio
nN
ew Je
rsey
Dep
artm
ent o
f Edu
catio
n

SAT 5 YEAR TREND:
YearNumber of students
DIST TOTAL
VERBAL
STATE TOTAL
VERBAL
NATL TOTAL
VERBAL
DIST TOTAL MATH
STATE TOTAL MATH
NATL TOTAL MATH
DIST TOTAL
WRITING
STATE TOTAL
WRITING
NATL TOTAL
WRITING
2008
212515 495 502 527 513 515 527 496 494
2009
218509 496 501 518 513 515 510 493 493
2010
239510 495 501 513 514 516 499 497 492
2011
186492 495 497 502 516 514 484 497 489
2012
201513 495 496 523 517 514 510 499 488
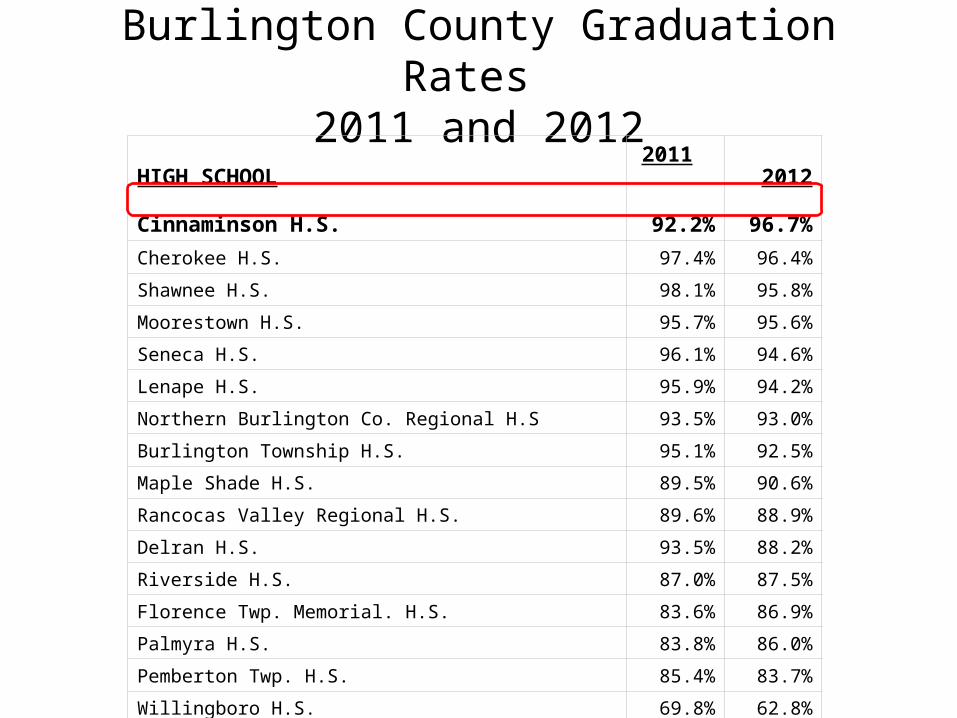
Burlington County Graduation Rates 2011 and 2012
HIGH SCHOOL
Cinnaminson H.S.
2011
92.2%
2012
96.7%
Cherokee H.S. 97.4% 96.4%
Shawnee H.S. 98.1% 95.8%
Moorestown H.S. 95.7% 95.6%
Seneca H.S. 96.1% 94.6%
Lenape H.S. 95.9% 94.2%
Northern Burlington Co. Regional H.S 93.5% 93.0%
Burlington Township H.S. 95.1% 92.5%
Maple Shade H.S. 89.5% 90.6%
Rancocas Valley Regional H.S. 89.6% 88.9%
Delran H.S. 93.5% 88.2%
Riverside H.S. 87.0% 87.5%
Florence Twp. Memorial. H.S. 83.6% 86.9%
Palmyra H.S. 83.8% 86.0%
Pemberton Twp. H.S. 85.4% 83.7%
Willingboro H.S. 69.8% 62.8%
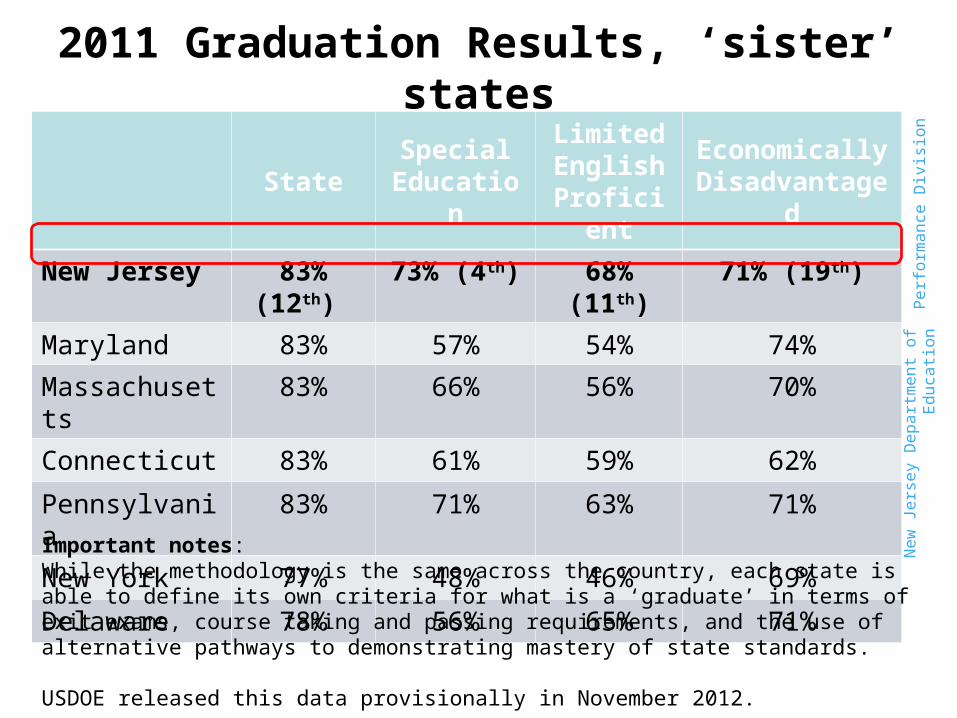
2011 Graduation Results, ‘sister’ states
StateSpecial
Education
Limited English
Proficient
Economically Disadvantaged
New Jersey 83% (12th) 73% (4th) 68% (11th) 71% (19th)
Maryland 83% 57% 54% 74%
Massachusetts 83% 66% 56% 70%
Connecticut 83% 61% 59% 62%
Pennsylvania 83% 71% 63% 71%
New York 77% 48% 46% 69%
Delaware 78% 56% 65% 71%
Perf
orm
ance
Div
isio
n
Important notes:While the methodology is the same across the country, each state is able to define its own criteria for what is a ‘graduate’ in terms of exit exams, course taking and passing requirements, and the use of alternative pathways to demonstrating mastery of state standards.
USDOE released this data provisionally in November 2012.
New
Jers
ey D
epar
tmen
t of E
duca
tion

2011 Graduation Results, ‘sister’ states
African American
Hispanic Asian White
New Jersey 69% (24th) 73% (15th) 93% (2nd) 90% (3rd)
Maryland 76% 72% 93% 89%
Massachusetts 71% 62% 88% 89%
Connecticut 71% 64% 92% 89%
Pennsylvania 65% 65% 88% 88%
New York 64% 63% 86% 86%
Delaware 73% 71% 90% 82%
Perf
orm
ance
Div
isio
n
Important note:Results show that we outrank all of our sister states in every category except for “African American” & “Economically Disadvantaged”
New
Jers
ey D
epar
tmen
t of E
duca
tion