Embed Size (px)
Citation preview
DIAN KUSUMA
Page 1 of 15 Paper in Microeconomics for Public Policy
UNIVERSITAS INDONESIA
Cigarette Tax in Indonesia: Who’s paying? A Microeconomics Analysis
Dian Kusuma
JAKARTA, MAY 2010
DIAN KUSUMA
Page 2 of 15 Paper in Microeconomics for Public Policy
1. INTRODUCTION
1.1. Background
Indonesian government increased the tax on cigarette through the Ministry of Finance
regulation No.181/PMK.011/2009 since January 1st 2010, There are four groups that were
increased i.e. machine-rolled kretek (SKM) I in average IDR.20, SKM II IDR 20, machine-
rolled white cigarettes (SPM) I IDR 35, SPM II IDR 28, hand-rolled kretek (SKT) I IDR 15,
SKT II IDR 15, SKT III IDR 25.1,2 As a nature of public policy, there have been lots of pros
and cons even before the policy was enacted.
Researchers from Demography Institute at University of Indonesia asserts their support on
the policy; reasoning that their simulation concludes that the increased cigarette tax to double
will have a positive impact on the economy.3 They referred to the institute’s research in 2001
showing that a 10% increase of cigarette tax would increase the cigarette price by 4.9% and
increase government revenue by 6.7% despite its decreasing the cigarette consumption by
3%.4 In addition, the head of Indonesia Medical Association also supports the policy. He
mentioned out of the current revenue of IDR 60 trillion per year from cigarette tax, the
government could be utilized to increase the relatively lacking national health budget.5
On the other side of the equation are those who disagree and demand the government to
discard the regulation. Among them is the Indonesian Society Forum of Cigarette Industry
(Forum Masyarakat Industry Rokok Indonesia) who utters that the cigarette tax increase is
too high and is unfair for small scale cigarette companies.6
Before the enactment of the increase, it was predicted that the cigarette price would increase
by 15% in average. However, an officer at Directorate of Customs and Tax mentioned that
the increase of IDR 15 to IDR 45 per stick would only increase the price to about IDR 540
per pack (of 12 sticks) or to about IDR 720 per pack (of 16 sticks).7 In fact, based on our
small survey, the price increases by about 5% - 8% (about IDR 500 – IDR 1,000 per pack).
Given the nature of public policy with its pros and cons, this paper aims to shed light on who
are worse off and better off by the implementation of the policy. Employing the basic
microeconomics analysis, it hopes to benefit the readers in understanding the increased
cigarette tax policy.
DIAN KUSUMA
Page 3 of 15 Paper in Microeconomics for Public Policy
1.2 Problem Statement
The policy of increased cigarette excise tax has produced reactions –both support and against
–from various stakeholders. Given the nature of public policy with its pros and cons, this
paper aims to shed light on who (consumer, producer, or government) are worse off and
better off by the implementation of the increased cigarette tax policy. The study seeks to answer
the problem “who really gain or lose from the increased cigarette tax policy?”
1.3 Objective
This paper aims to shed light on who really gains or loses from the increased cigarette tax
policy. Specifically its objective includes:
1. Explore the price elasticity of demand of cigarette consumption in Indonesia
2. Analyze the changes in consumer surplus and producer surplus from the
implementation of cigarette tax policy in Indonesia.
DIAN KUSUMA
Page 4 of 15 Paper in Microeconomics for Public Policy
2. LITERATURE REVIEW
2.1 Cigarette Tax
McCarten and Stotsky (1995) and Warner et.al (1995) in World Bank Economics of Tobacco
Toolkit mention there are at least three purposes or reasons for imposing a tax on tobacco
products. Firstly, cigarette taxes are very efficient at raising revenue. Typically there is a huge
consumer market paying cigarette taxes because they cannot either quit smoking (due to
addiction) or they are not price sensitive to lower or higher prices. Secondly, cigarette taxes
are to correct for externalities. A cigarette tax supports to pay the external costs of cigarette
consumption i.e. smoking related diseases to smokers or non-smokers, and the costs to treat
such diseases (negative externalities). Thirdly, cigarette taxes discourage use of the product
since cigarette is considered a no-merit, addictive, and destructive product. It is arguably not
productive for the greater economy. Therefore, it is justified to discourage cigarette
consumption especially among the poor, the young and new tobacco users.8
Indonesia applies excise tax for cigarette. An excise tax is a tax on selected products/goods
produced for sale within one country, or imported and sold in that country. The tax is customarily
collected from the producer or at the point of final sale to the consumer. It can be either: (1)
specific excise tax i.e. a set amount per stick or per pack (e.g. IDR 20 per stick regardless of
price); (2) ad valorem excise tax: a percentage of the value of the product, as measured by the
manufacturer/producer price at which the product is sold to the retailer/distributor (e.g., 50
percent of the producer’s price)8
Indonesian government increased the tax on cigarette through the Ministry of Finance
regulation No.181/PMK.011/2009 since January 1st 2010. There are four groups of cigarette
that were increased i.e. machine-rolled kretek (SKM) I in average IDR.20, SKM II IDR 20,
machine-rolled white cigarettes (SPM) I IDR 35, SPM II IDR 28, hand-rolled kretek (SKT) I
IDR 15, SKT II IDR 15, SKT III IDR 25.1,2 By definition, these taxes are specific excise tax.
2.2 Microeconomics Analysis
Economics consists of two main branches: microeconomics and macroeconomics.
Microeconomics studies the behavior of individual economic units which include consumers,
workers, investors, land owners, business firms (basically any entity that plays a role in our
economy). Moreover, microeconomics clarifies how and why these units make economic
decisions i.e. it explains how consumers decide to purchase and how their choices are
DIAN KUSUMA
Page 5 of 15 Paper in Microeconomics for Public Policy
affected by changing prices and incomes. On the contrary, macroeconomics deals with
aggregate economic quantities, such as the level and growth rate of national output, interest
rates, unemployment, and inflation.9
One important tool in microeconomics is the analysis of competitive markets. Here,
microeconomics is able to evaluate the gains and losses from the government policies,
particularly with respect to consumer and producer surplus.
Pindyck et al (2005) explains that consumer surplus is the total benefit or value that
consumers receive beyond what they pay for the good. And because consumer surplus
measure the total net benefit to consumers, we can measure the gain or loss to consumers
from a government intervention by measuring the resulting change in consumer surplus.
Similarly, producer surplus is the analogous measure for producers. Some producers are
producing units at a cost just equal to the market price. Other units, however, could be
produced for less than the market price and would still be produced and sold even if the
market price were lower. Producers, therefore, enjoy a benefit – a surplus – from selling those
units.9
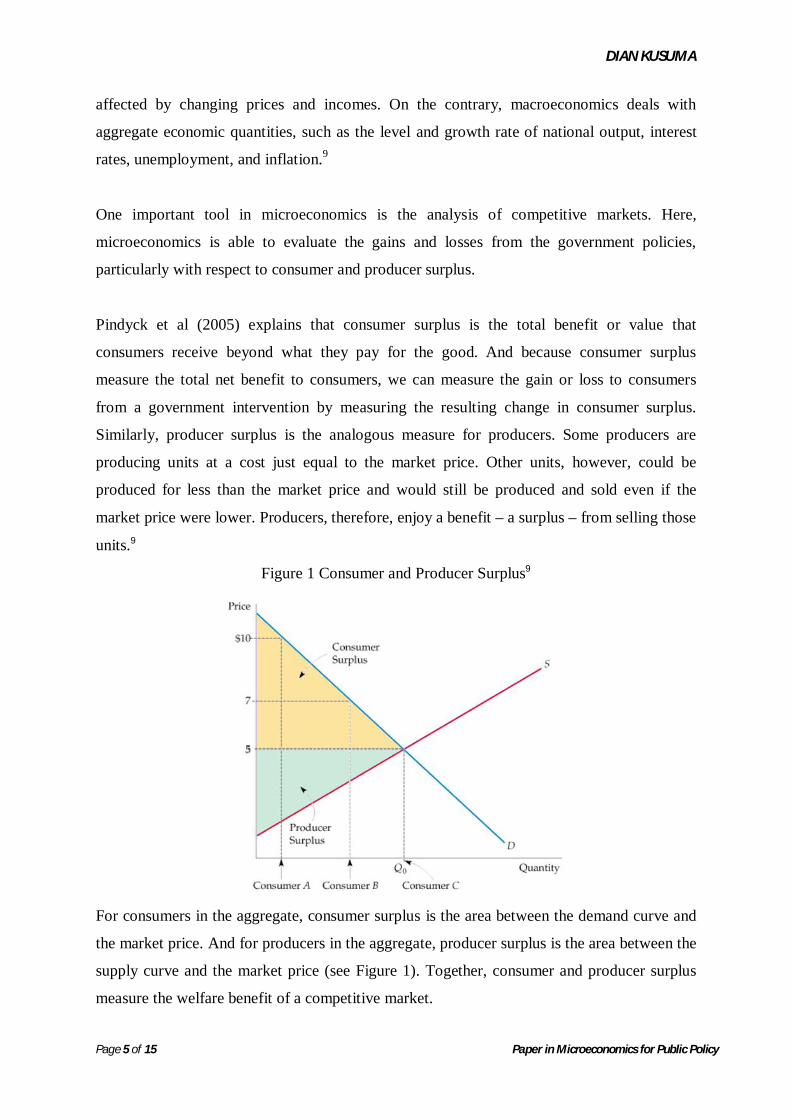
Figure 1 Consumer and Producer Surplus9
For consumers in the aggregate, consumer surplus is the area between the demand curve and
the market price. And for producers in the aggregate, producer surplus is the area between the
supply curve and the market price (see Figure 1). Together, consumer and producer surplus
measure the welfare benefit of a competitive market.
DIAN KUSUMA
Page 6 of 15 Paper in Microeconomics for Public Policy
2.3 Competitive Market
In this paper, we consider the market for cigarette is competitive. Therefore, we employ the
analysis of competitive market. We argue that the market for cigarette is closer to the perfect
competition market (or perfectly competitive market). Market for cigarette satisfies most of
the characteristics of perfect competition (as a benchmark).
Pindyck (2005) mentions that there are three basic assumptions of perfect competition
market: (1) price taking, (2) product homogeneity, and (3) free entry and exit.9
Firstly, there have to be many sellers as well as buyers in perfect competition. Therefore, no
party (seller or buyer) will have the ability to influence market price on their own. So, no
party is a price setter. Secondly, the products have to be homogenous. This is when the
products of all of the firms in a market are perfectly substitutable with one another. In other
word, the cross elasticity is infinite. Thirdly, there must be free entry and free exit in the
market. Free entry (exit) means that there are no special costs that make it difficult for a new
firm either to enter an industry and produce, or to exit if it cannot make a profit. As a result,
buyers can easily switch from one supplier to another, and suppliers can easily enter or exit a
market.9 Additionally, there is one more assumption to the perfect competition: perfect
information. This means that in the market, buyers and sellers are all aware on what the price
should be.
2.4 Price Elasticity of Demand
Elasticity is an important feature within microeconomics analysis. Elasticity measures the
sensitivity of one variable to another. Specifically, it tells us the percentage change that will
occur in one variable in response to a 1-percent increase in another variable.9 By this
definition, the concept of elasticity could basically be applied to so many variables. Here in
this paper we are using the price elasticity of demand that is the percentage change in
quantity demanded of a good resulting from 1-percent increase in its price.
There is no reason to expect elasticities of demand to be constant. The elasticity of demand in
one year (when certain price and quantity demanded) is likely to be different from another
year (when different price and quantity demanded). Nevertheless, we often find it useful to
work with the isoelastic demand curve, in which the price elasticity of demand (or other
elasticity) is constant. When written in its log-linear form, the isoelastic demand curve
DIAN KUSUMA
Page 7 of 15 Paper in Microeconomics for Public Policy
appears in logistic function i.e. log(Q) = a – b log(P) where a and b are the constants. The
appeal of the log-linear demand relationship is that the slope of the line –b is the price
elasticity of demand.9 This paper uses this approach in estimating the price elasticity of
demand for cigarette. The estimate is obtained from a time-series econometrics research by
Djutaharta et al (2005).10
However, even though we estimate the price elasticity of cigarette demand from the log
function, we employ the simple linear function for the supply and demand analysis in this
paper. We use P = a – bQd for demand function and P = a + bQs for the supply function.
2.5 The impact of a tax
In analyzing the impact of a tax, we utilizing the analysis of competitive market as we
consider that the cigarette market (in Indonesia) is competitive. Therefore we employ the
perfectly competitive market as a benchmark. This is important because it is realized that
each type of market has a different ways in analysis such market intervention (e.g. tax and
subsidy).9
As mentioned earlier (Section 2.2.), consumer surplus is the area between the demand curve
and the market price and producer surplus is the area between the supply curve and the
market price. When taxes are imposed, changes are applied. These changes on the consumer
surplus and producer surplus are attributed to several factors. One most important factor is
the price elasticity of demand and price elasticity of supply. The burden of the tax is split
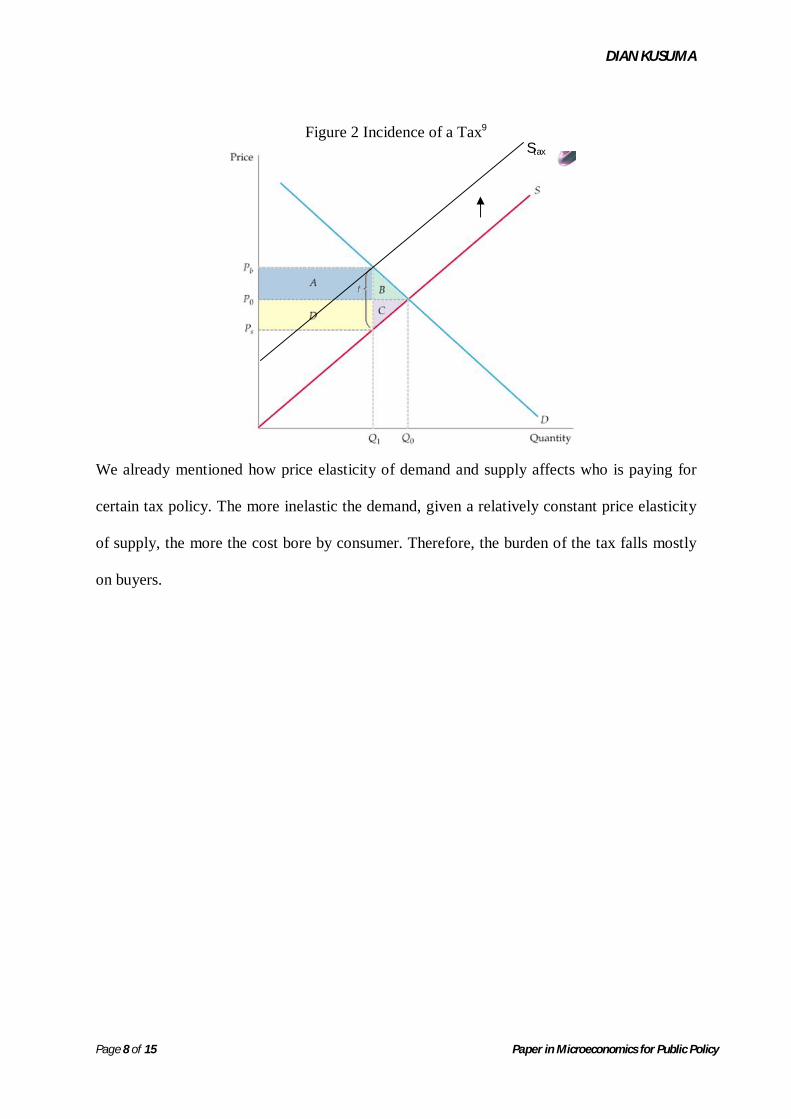
evenly between buyers and sellers if the elasticity is relatively similar (see Figure 2).
Figure 2 explains the incidence of a specific tax (i.e. tax per unit). P0 is the price before the
new tax policy imposed and Q0 is the quantity demanded. Imposing a new tax means adding
certain amount of money per unit to the supply equation. This will make the supply curve
shift to the left. However, since the specific tax only adds up to the constant, it does not
change the slope of supply curve. The shift of supply curve increases the price to Pb that is the
price paid by buyers while Ps is the price that sellers receive. The quantity demanded
decreases to Q1. Here the burden of the tax is split evenly between buyers and sellers. Buyers
lose A+B, sellers lose D+C, and the government earns A+D in revenue. The deadweight loss
is B+C.9
DIAN KUSUMA
Page 8 of 15 Paper in Microeconomics for Public Policy
Figure 2 Incidence of a Tax9
We already mentioned how price elasticity of demand and supply affects who is paying for
certain tax policy. The more inelastic the demand, given a relatively constant price elasticity
of supply, the more the cost bore by consumer. Therefore, the burden of the tax falls mostly
on buyers.
Stax
DIAN KUSUMA
Page 9 of 15 Paper in Microeconomics for Public Policy
3. DATA AND METHODOLOGY
3.1 Data
Data on the specific excise tax of cigarette are obtained from the Ministry of Finance
regulation No.181/PMK.011/2009.1
Data on price elasticity of demand are needed to see the slope of the demand curve of
cigarette consumption. We realize that data on price elasticity of cigarette supply will also
very beneficial to analyze the policy more accurately. However, we limit the analysis (or
simulation) only to price elasticity of demand due to unavailability of data of price elasticity
of supply. Future research may simulate utilizing both elasticities.
3.2 Methodology
There are several concept of microeconomics discussed in this paper. They include elasticity,
competitive market, and impact of tax. This paper employs a microeconomics analysis,
particularly utilizing supply and demand curve analysis. We aim to find the consumer surplus
and producer surplus as an impact of cigarette tax policy currently enacted in Indonesia. By
employing the analysis, we hope to find out who is really paying for the tax (consumers or
producers). This will shed light among many pros and cons (critics) on the policy.
Furthermore, we use the analysis of competitive market as we consider that the cigarette
market (in Indonesia) is competitive. Therefore we employ the perfectly competitive market
as a benchmark. This is important because it is realized that each type of market has a
different ways in analysis such market intervention (e.g. tax and subsidy).9
3.3 Study Limitation
We limit our analysis to basic microeconomics analysis. Here, we only show who pay more
or who bear the cost of the tax. More advanced analysis could start with finding the real
demand function as well as supply function of cigarette in Indonesia. By having the exact
functions, then the exact quantity demanded/supplied, price, consumer/producer surplus, and
government revenue could easily be generated.
DIAN KUSUMA
Page 10 of 15 Paper in Microeconomics for Public Policy
4. RESULT AND DISCUSSION
4.1 Competitive Market of Cigarette
In order to fully understand and analyze the impact of tax and who is paying for it, one needs
to determine the nature of the market in the first place. Here we consider that the market for
cigarette, here is the case of Indonesia, is competitive. Therefore, we are able to continue
utilizing the supply and demand analysis within the competitive market (using perfectly
competitive market as the benchmark). Here we present argument for this consideration.
As we mentioned earlier (Section 2.3), there are four characteristics of perfectly competitive
market: (1) nobody is price setter (many buyers and sellers), (2) product homogeneity, (3)
free entry and exit; (4) asymmetric information (i.e. about price).
Firstly, there have to be many sellers as well as buyers in the market. Therefore, no party
(seller or buyer) will have the ability to influence market price on their own. The Indonesia
cigarette market satisfies this characteristic. To date, there are more than 2,500 cigarette
companies in the country; most of them are in Central Java and East Java. One could argue
that ‘many sellers’ is relative and does not really determine whether or not a market is
competitive if there is one company can be price setter. However, we argue that even though
there are few cigarette companies that are relatively much bigger (therefore more power),
there are no single company who could set the price or act as a price setter.
Secondly, the products have to be homogenous. This is when the products of all of the firms
in a market are perfectly substitutable with one another. In this regard, Indonesian cigarette
market also satisfies this characteristic. We have mentioned before that there are more than
2,500 cigarette companies in the country. These companies produce different brand but still
homogenous. The government classifies nine groups of cigarette traded in Indonesia based on
Minister of Finance regulation No.181/PMK.011/2009. Among the groups, there are several
groups that are most popular i.e. machine-rolled kretek (SKM), machine-rolled white
cigarettes (SPM), hand-rolled kretek (SKT). The products of these cigarettes are substitutable
for one another; therefore the homogenous characteristic is satisfied.
Thirdly, there must be free entry and free exit in the market. Buyers can easily switch from
one supplier to another, and suppliers can easily enter or exit a market. Indonesian cigarette
DIAN KUSUMA
Page 11 of 15 Paper in Microeconomics for Public Policy
market also satisfies this characteristic. There is no regulation whatsoever that limits the entry
and exit of the cigarette market in Indonesia.
Lastly, the Indonesian cigarette market also satisfies the characteristics of perfect
information. This means that in the market, buyers and sellers are all aware on what the price
should be. In Indonesia, all prices are referred to the Minister of Finance regulation
No.181/PMK.011/20. This way, the information the price of particular kind of cigarette are
openly available.
4.2 Price Elasticity of Demand for Cigarette
There are only few studies on cigarette demand in Indonesia. Among the most prominent is
the study conducted by Djutaharta et al (2005) from the Demographic Institute, Faculty of
Economics University of Indonesia. They studied used annual data for the period from 1970 to
2001 to estimate a long-term cigarette demand function, and monthly data for the period from
January 1996 to June 2001 to estimate a short-term cigarette demand function. Using annual
data, it estimated the real price elasticity of cigarette demand as –0.345. Using monthly data
cigarette demand estimation, it estimated the price elasticity of demand is –0.315, slightly
smaller than for the annual data.
This inelastic nature of cigarette demand is consistent across South East Asia region.
Guindon et al (2003) provides the summary of several researches on price elasticity of
cigarette demand in the region. Despite employing various methods of estimation and
models, the price elasticity of cigarette demand across the region is relatively similar. In Sri
Lanka, the price elasticity of demand found to be -0.53, in Thailand -0.39, in Nepal -0.42, and
in Myanmar -0.34.11
This paper will employ the data on the price elasticity of cigarette demand from Djutaharta et
al (2005) for the slope of demand function curve in order to conduct the supply and demand
analysis. As mentioned above, the study estimated two price elasticity of demand i.e. -0.345
and -0.315. Here we used the latter because it utilized relatively newer data (1996-2001). The
other reason is also because the longer the time the elasticity tends to be more elastic.
DIAN KUSUMA
Page 12 of 15 Paper in Microeconomics for Public Policy
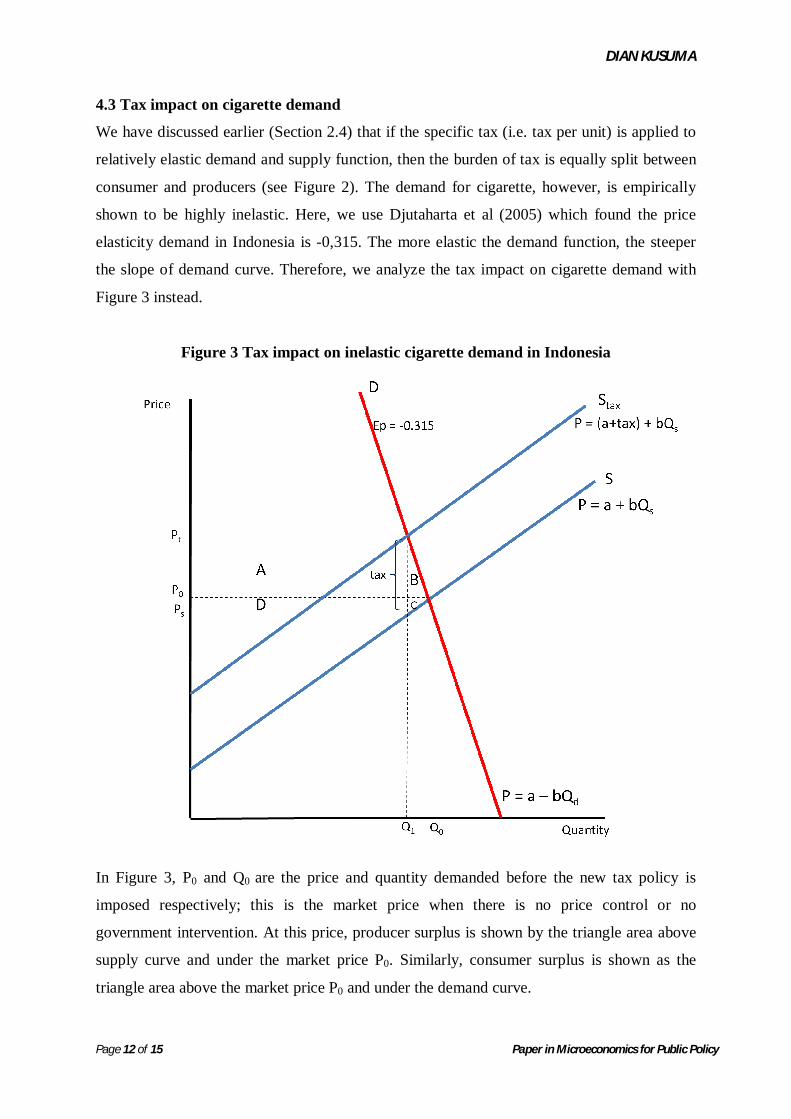
4.3 Tax impact on cigarette demand
We have discussed earlier (Section 2.4) that if the specific tax (i.e. tax per unit) is applied to
relatively elastic demand and supply function, then the burden of tax is equally split between
consumer and producers (see Figure 2). The demand for cigarette, however, is empirically
shown to be highly inelastic. Here, we use Djutaharta et al (2005) which found the price
elasticity demand in Indonesia is -0,315. The more elastic the demand function, the steeper
the slope of demand curve. Therefore, we analyze the tax impact on cigarette demand with
Figure 3 instead.
Figure 3 Tax impact on inelastic cigarette demand in Indonesia
In Figure 3, P0 and Q0 are the price and quantity demanded before the new tax policy is
imposed respectively; this is the market price when there is no price control or no
government intervention. At this price, producer surplus is shown by the triangle area above
supply curve and under the market price P0. Similarly, consumer surplus is shown as the
triangle area above the market price P0 and under the demand curve.
DIAN KUSUMA
Page 13 of 15 Paper in Microeconomics for Public Policy
When there is a specific tax (i.e. tax per unit) imposed to producer (supply), producer adds
the tax as an additional cost. Therefore, the tax shifts the supply curve to the left (Stax). The
new supply function, P = (a+tax) + bQs, shows that the shift does not change slope of the
function. It only adds up to the intercept (a). This shift results in a new market price Pt. In our
case, this is the increase of cigarette price. In fact, based on our small survey, the price
increases by about 5% - 8% (about IDR 500 – IDR 1,000 per pack) in average.
Furthermore, the price increase results in the decrease in quantity demanded to Q1. Figure 3
also provides the price elasticity of demand Ep=-0.315 which shows that the cigarette
demand is highly inelastic. Given this inelastic nature, the relatively high price increase (from
P0 to Pt) will only result in a slight decrease in the consumption (from Q0 to Q1). This should
provide an answer to the anxiety that the increased tax will worsen the cigarette industry i.e.
that the current tax increase will not decrease cigarette consumption that much to the level
that will worsen the industry. We realize that this only an inaccurate conjecture based only on
the graph. The more accurate estimate on how much the consumption will decrease, given
certain level of price increase, could be easily estimated if both demand and supply function
are known. This is either conducting a survey of willingness to pay or an econometrics
analysis of some relevant variables.
The main purpose of this paper is to understand who is paying for the tax. Figure 3 apparently
shows that with inelastic slope of demand curve, consumer suffers for more tax burden. Here,
we witness that the consumer loss is more than triple than that of producer. Consumer tax
burden is A, and producer tax burden is D. Area of A+B is the consumer surplus loss as an
impact of the increasing price due to specific tax. Similarly, area of D+C is the producer
surplus loss as an impact of the policy. Lastly, the area of B+C is what is known as dead
weight loss i.e. net loss of total (consumer plus producer) surplus.
The result of our analysis i.e. that consumer suffers more on the burden of excise cigarette tax
confirms the basic nature of excise tax. McCarten and Stotsky (1995) in Yurekli (2003)
mentions that an excise tax can be imposed on products and services if they have one or more of
the four characteristics, among them two are relevant here: (1) Demand is price-inelastic.
Revenue is therefore increased regardless of the rate of consumption; (2) Consumption lacks
“merit” (i.e., a person’s lack of control over him/herself is increased) or causes negative
DIAN KUSUMA
Page 14 of 15 Paper in Microeconomics for Public Policy
externalities. In our case, even though the tax is given to producer of cigarette, the aim is also
basically to decrease the consumption of cigarette. 8
In the above analysis, we find that consumer suffers more impact due to the increasing excise
tax of cigarette. It is apparent that the government gains cigarette tax revenue, but even
though the tax is directed to producers, the analysis shows that consumer is really the one
who loses from the increased cigarette tax policy. In other words, with respect to the tax
burden, the consumer is paying the most.
5. CONCLUSION
There are several concept of microeconomics discussed in this paper. They include elasticity,
competitive market, and impact of tax.
We find that the price elasticity of demand of cigarette consumption in Indonesia is very
inelastic i.e. -0.315 which is taken from an econometrics estimate. This inelastic nature of
cigarette demand is consistent across South East Asia region. In Sri Lanka, the price elasticity
of demand found to be -0.53, in Thailand -0.39, in Nepal -0.42, and in Myanmar -0.34.
We analyze the changes in consumer surplus and producer surplus from the implementation
of cigarette tax policy in Indonesia. The supply and demand analysis shows that utilizing the
price elasticity of demand of -0.315, we find that the consumer surplus loss is much higher
than the producer surplus loss. This implies that consumer suffers more impact due to the
increasing excise tax of cigarette. It is apparent that the government gains cigarette tax
revenue, but even though the tax is directed to producers, the analysis shows that consumer is
really the one who loses from the increased cigarette tax policy. Our microeconomics
analysis shows that with respect to the tax burden, the consumer is paying the most.
DIAN KUSUMA
Page 15 of 15 Paper in Microeconomics for Public Policy
References:
1 Ministry of Finance 2009 Regulation No.181/PMK.011/2009 Jakarta 2 Kompas 2009 Pemerintah Putuskan Kenaikan Cukai Rokok 18 November 2009 online at http://bisniskeuangan.kompas.com/read/2009/11/18/17205653/pemerintah.putuskan.kenaikan.cukai.rokok accessed on 11 May 2010 3 Kompas 2008 Kenaikan Cukai Rokok Memperkuat Perekonomian 17 November 2008 online at http://nasional.kompas.com/read/2008/11/17/21421482/kenaikan.cukai.rokok.memperkuat.perekonomian accessed on 11 May 2010 4 Kompas 2009 Kenaikan Cukai Rokok Akan Menambah Pemasukan Negara 22 July 2009 online at http://bisniskeuangan.kompas.com/read/2009/07/22/11343644/Kenaikan.Cukai.Rokok.Akan.Menambah.Pemasukan.Negara accessed on 11 May 2010 5 Kompas 2010 Cukai Rokok untuk Anggaran Kesehatan 22 Januari 2010 online at http://kesehatan.kompas.com/read/2010/01/22/0838175/Cukai.Rokok.untuk.Anggaran.Kesehatan accessed on 11 May 2010 6 Kompas 2010 Kenaikan Cukai Rokok Diprotes: Pabrik Rokok Kecil Akan Gulung Tikar 23 Februari 2010 http://cetak.kompas.com/read/xml/2010/02/23/16201056/Kenaikan.Cukai.Rokok.Diprotes accessed on 11 May 2010 7 Kompas 2010 Cukai Naik Cuma Pengaruhi Harga Rokok "Gopek" 17 Februari 2010 online at http://bisniskeuangan.kompas.com/read/2010/02/17/1152459/Cukai.Naik.Cuma.Pengaruhi.Harga.Rokok..Gopek accessed on 11 May 2010 8 Yurekli A. 2003 Design and Administration Design and Administer Tobacco Taxes. World Bank Economics of Tobacco Toolkit Washington DC 9 Pindyck RS, Rubinfeld DL 2005 Microeconomics 6t ed. Pearson Prentice Hall New Jersey 10 Djutaharta T, Surya HV, Pasay NHA, Hendratno, Adioetomo SM 2005 Aggregate Analysis of the Impact of Cigarette Tax Rate Increases on Tobacco Consumption and Government Revenue: The Case of Indonesia. HNP Discussion Paper. Economics of Tobacco Control Paper No.25. World Bank and World Health Organization 11 Guindon GE, Perucic AM, Boisclair D Higher Tobacco 2003 Prices and Taxes in South-East Asia. An Effective Tool to Reduce Tobacco Use, Save Lives and Generate Revenue. HNP Discussion Paper, Economics of Tobacco Control Paper No.11. World Bank and World Health Organization.