Embed Size (px)
Citation preview
CI Investment ConsultingNeal Kerr, Senior Vice-President
Alfred Lam, Vice-President & Portfolio ManagerYoonjai Shin, Director
Agenda
• Industry trends, CI’s multi-manager excellence• Advantages of CI’s managed solutions• Challenges in the markets and how to navigate
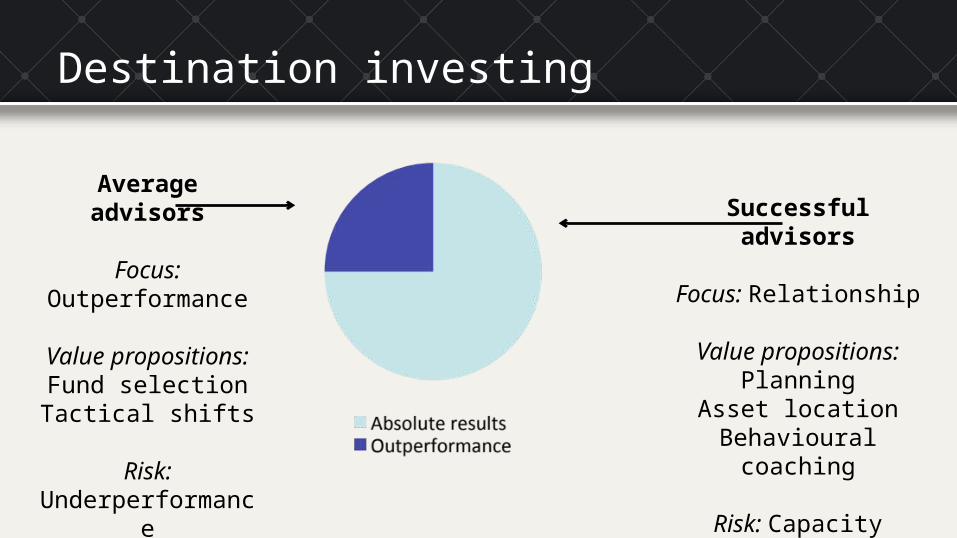
Destination investing
Average advisors
Focus:Outperformance
Value propositions:Fund selectionTactical shifts
Risk:Underperformance
Successful advisors
Focus: Relationship
Value propositions:Planning
Asset locationBehavioural coaching
Risk: Capacity
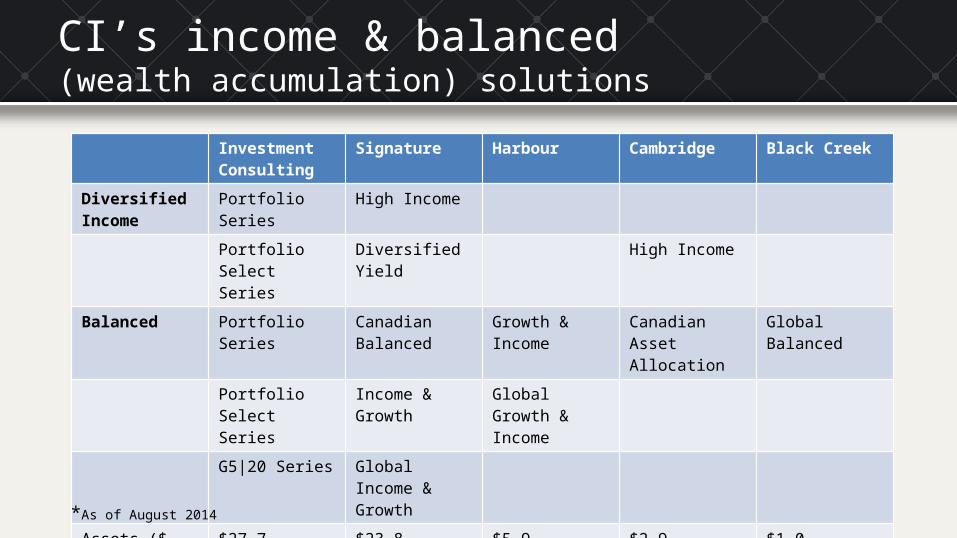
CI’s income & balanced (wealth accumulation) solutions
Investment Consulting
Signature Harbour Cambridge Black Creek
DiversifiedIncome
Portfolio Series High Income
Portfolio Select Series
Diversified Yield High Income
Balanced Portfolio Series Canadian Balanced
Growth & Income Canadian Asset Allocation
Global Balanced
Portfolio Select Series
Income & Growth Global Growth & Income
G5|20 Series Global Income & Growth
Assets ($ billion)*(Total = $61.3)
$27.7 $23.8 $5.9 $2.9 $1.0
*As of August 2014
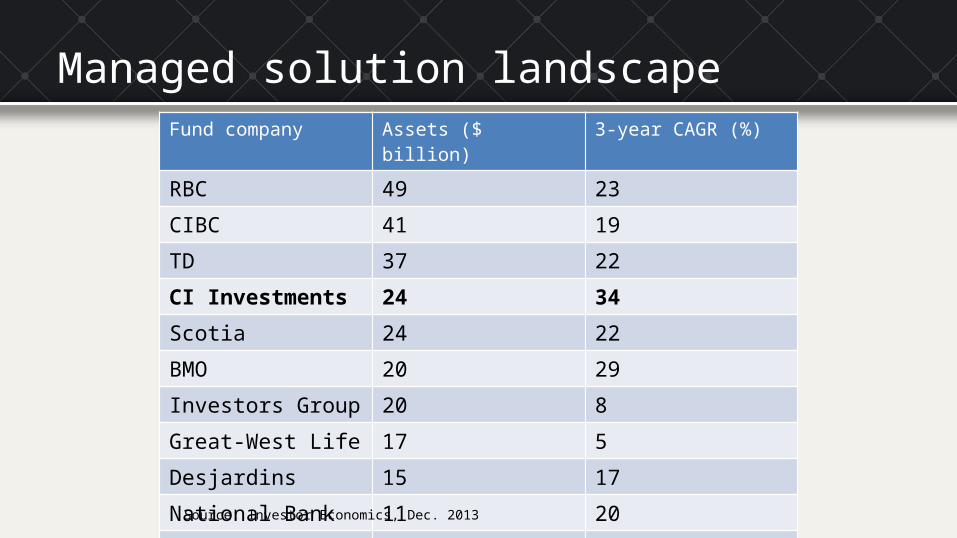
Managed solution landscapeFund company Assets ($ billion) 3-year CAGR (%)
RBC 49 23CIBC 41 19TD 37 22CI Investments 24 34Scotia 24 22BMO 20 29Investors Group 20 8Great-West Life 17 5Desjardins 15 17National Bank 11 20Top 10 258 (77%) 20
Source: Investor Economics, Dec. 2013
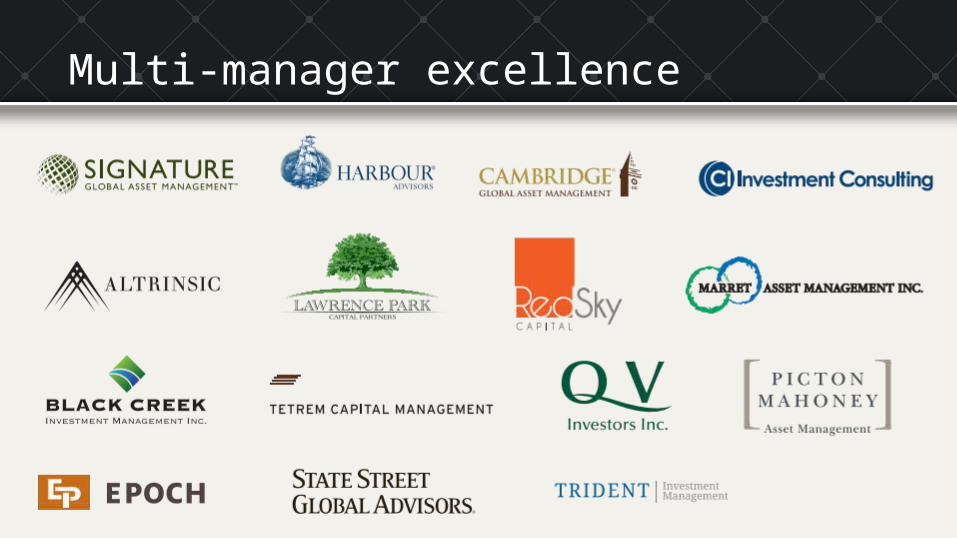
Multi-manager excellence
CI Investment Consulting
“We create investment solutions for investors and build
relationships with advisors.” – CI Investment Consulting

What do we manage?
$28 billion in assets under management
CI Investment Consulting
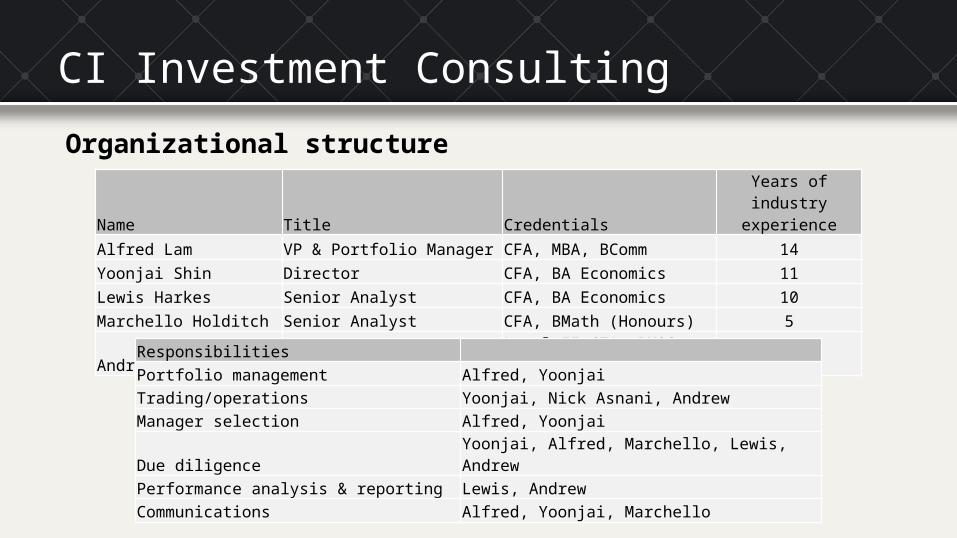
Name Title CredentialsYears of industry
experience
Alfred Lam VP & Portfolio Manager CFA, MBA, BComm 14Yoonjai Shin Director CFA, BA Economics 11Lewis Harkes Senior Analyst CFA, BA Economics 10Marchello Holditch Senior Analyst CFA, BMath (Honours) 5Andrew Ashworth Analyst Level II CFA, BMOS Finance 4
ResponsibilitiesPortfolio management Alfred, YoonjaiTrading/operations Yoonjai, Nick Asnani, AndrewManager selection Alfred, YoonjaiDue diligence Yoonjai, Alfred, Marchello, Lewis, AndrewPerformance analysis & reporting Lewis, AndrewCommunications Alfred, Yoonjai, Marchello
Organizational structure
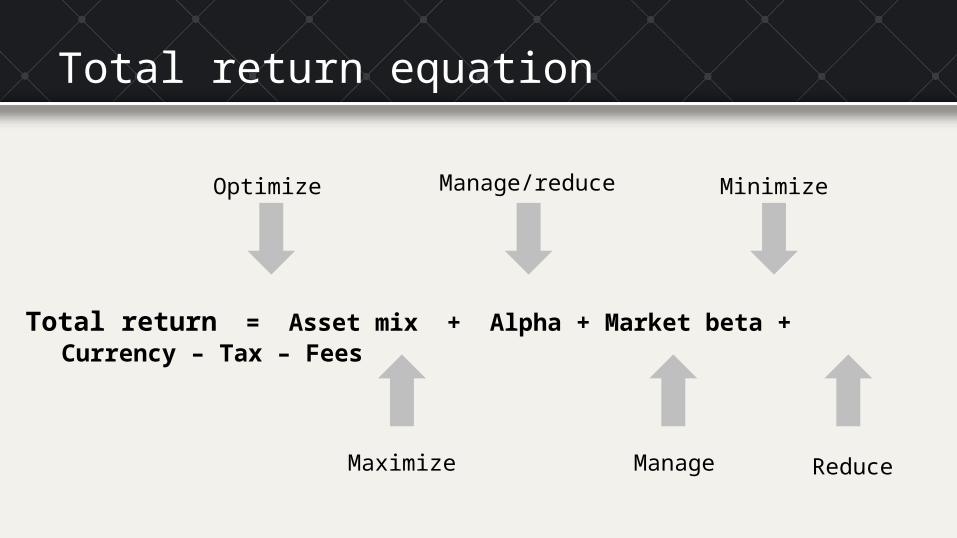
Total return = Asset mix + Alpha + Market beta + Currency – Tax – Fees
Optimize
Maximize Manage
Manage/reduce Minimize
Reduce
Total return equation
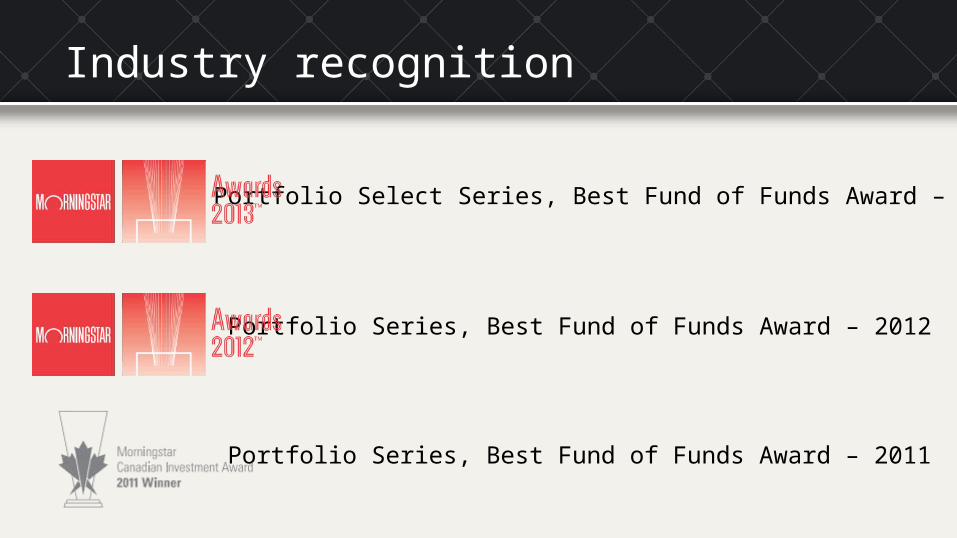
Portfolio Series, Best Fund of Funds Award – 2011
Portfolio Series, Best Fund of Funds Award – 2012
Portfolio Select Series, Best Fund of Funds Award – 2013
Industry recognition
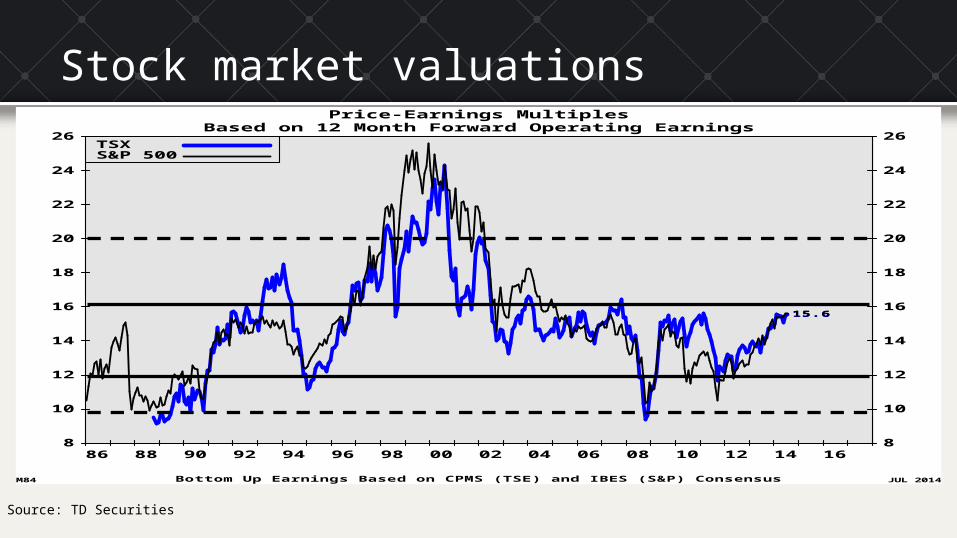
Stock market valuations
Source: TD Securities
Price-Earnings MultiplesBased on 12 Month Forward Operating Earnings
Bottom Up Earnings Based on CPMS (TSE) and IBES (S&P) ConsensusM84 JUL 2014
26 26
24 24
22 22
20 20
18 18
16 16
14 14
12 12
10 10
8 886 88 90 92 94 96 98 00 02 04 06 08 10 12 14 16
TSXS&P 500
15.615.6
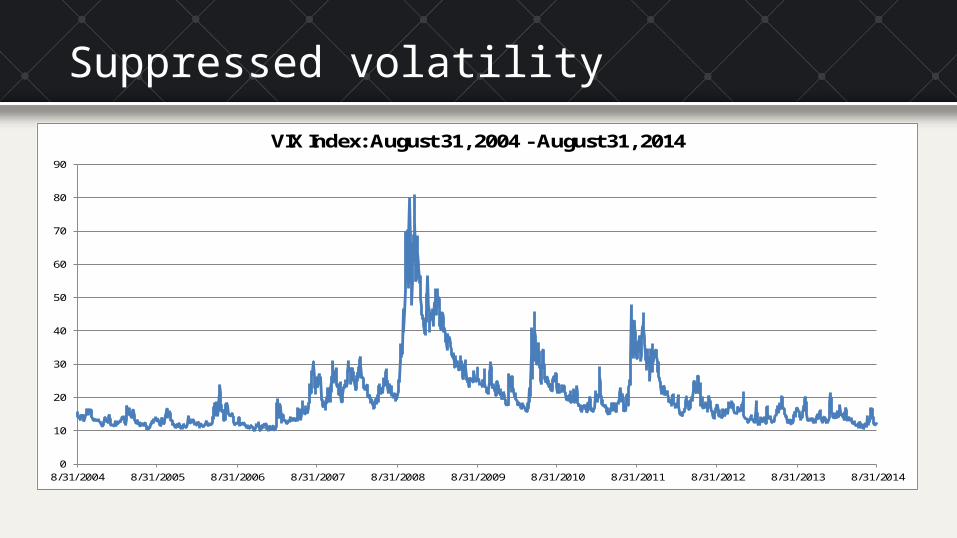
Suppressed volatility
0
10
20
30
40
50
60
70
80
90
8/31/2004 8/31/2005 8/31/2006 8/31/2007 8/31/2008 8/31/2009 8/31/2010 8/31/2011 8/31/2012 8/31/2013 8/31/2014
VIX Index: August 31, 2004 - August 31, 2014
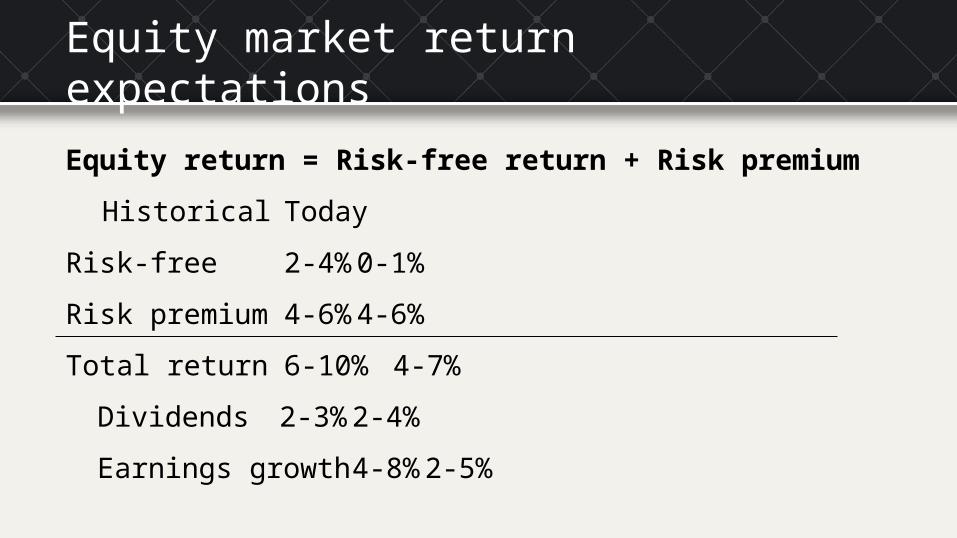
Equity market return expectations
Equity return = Risk-free return + Risk premium
Historical Today
Risk-free 2-4% 0-1%
Risk premium 4-6% 4-6%
Total return 6-10% 4-7%
Dividends 2-3% 2-4%
Earnings growth 4-8% 2-5%
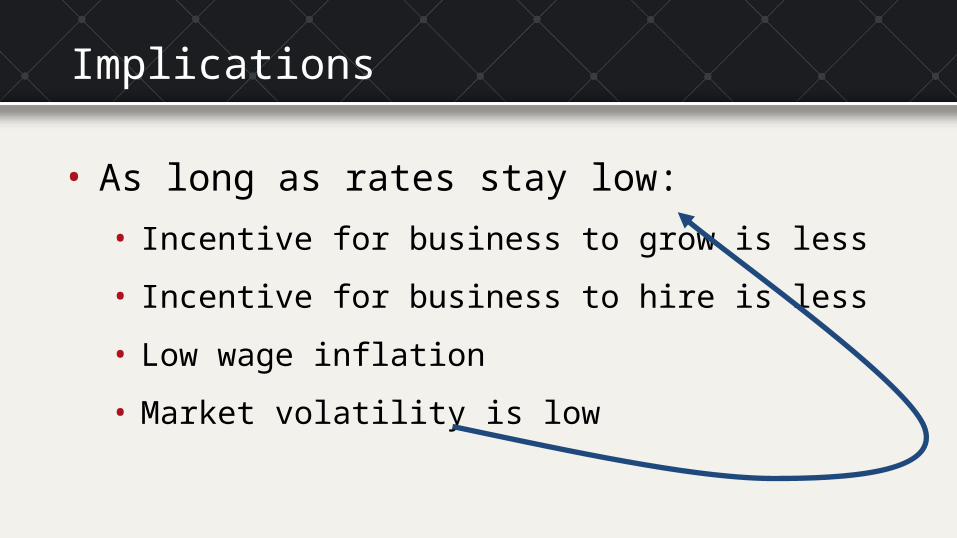
Implications
• As long as rates stay low:
• Incentive for business to grow is less
• Incentive for business to hire is less
• Low wage inflation
• Market volatility is low
When will interest rates change?
• Two years later?!
• When household and sovereign debts return to normal
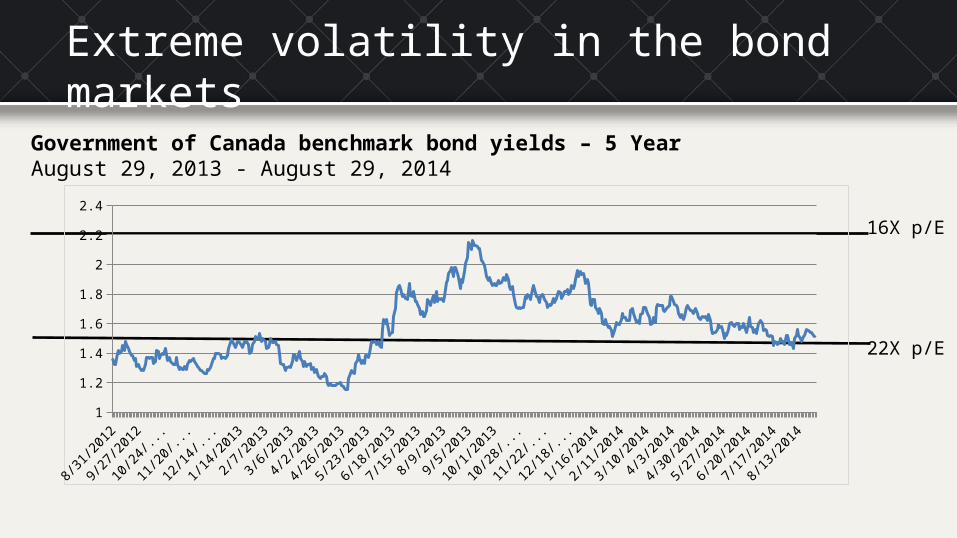
Extreme volatility in the bond markets
16X p/E
22X p/E
Government of Canada benchmark bond yields – 5 YearAugust 29, 2013 - August 29, 2014
8/31/2
012
9/19/2
012
10/8/2
012
10/27/2
012
11/15/2
012
12/4/2
012
12/23/2
012
1/11/2
013
1/30/2
013
2/18/2
013
3/9/2
013
3/28/2
013
4/16/2
013
5/5/2
013
5/24/2
013
6/12/2
013
7/1/2
013
7/20/2
013
8/8/2
013
8/27/2
013
9/15/2
013
10/4/2
013
10/23/2
013
11/11/2
013
11/30/2
013
12/19/2
013
1/7/2
014
1/26/2
014
2/14/2
014
3/5/2
014
3/24/2
014
4/12/2
014
5/1/2
014
5/20/2
014
6/8/2
014
6/27/2
014
7/16/2
014
8/4/2
014
8/23/2
0141
1.2
1.4
1.6
1.8
2
2.2
2.4
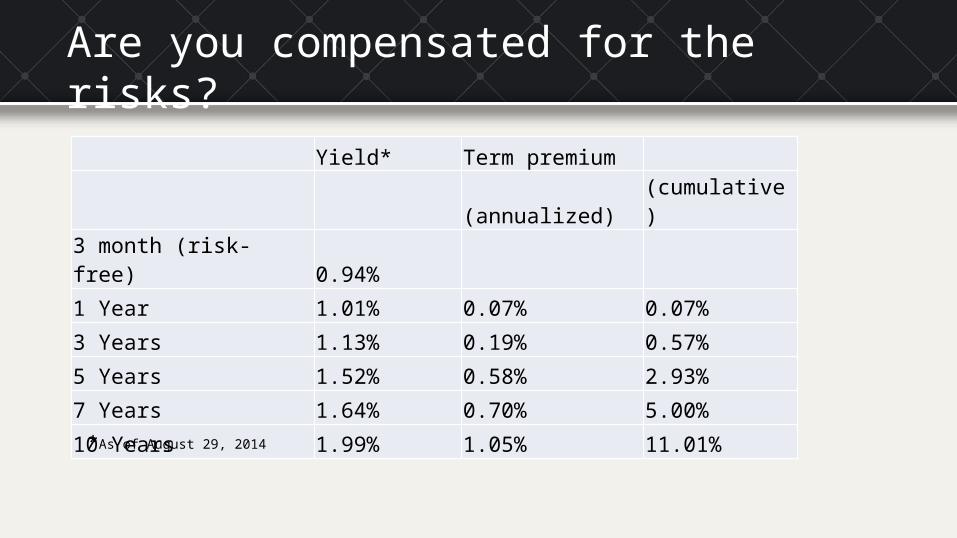
Are you compensated for the risks?
Yield* Term premium
(annualized) (cumulative)
3 month (risk-free) 0.94%
1 Year 1.01% 0.07% 0.07%
3 Years 1.13% 0.19% 0.57%
5 Years 1.52% 0.58% 2.93%
7 Years 1.64% 0.70% 5.00%
10 Years 1.99% 1.05% 11.01%
*As of August 29, 2014
Source: CI Investments
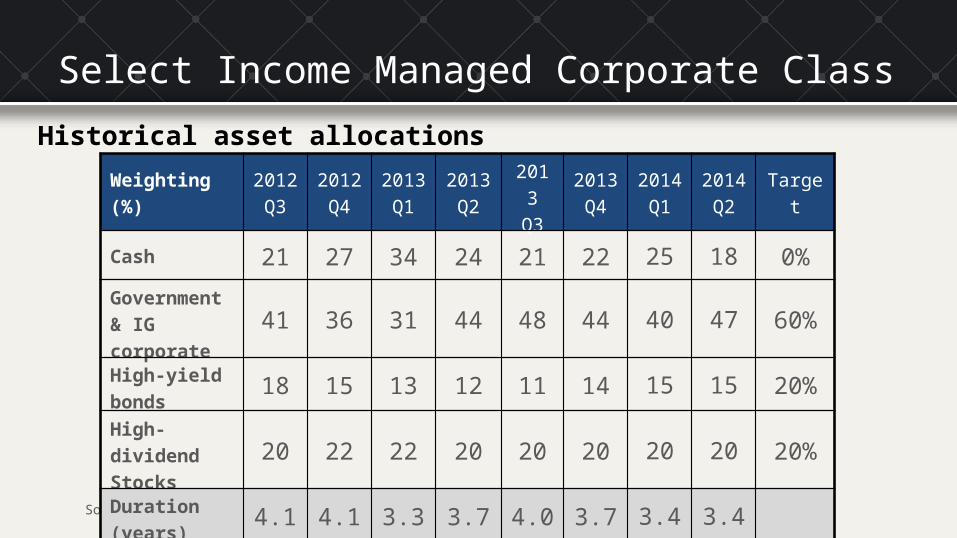
Weighting (%) 2012Q3
2012Q4
2013Q1
2013Q2
2013Q3
2013Q4
2014Q1
2014Q2 Target
Cash 21 27 34 24 21 22 25 18 0%
Government & IG corporate 41 36 31 44 48 44 40 47 60%
High-yield bonds 18 15 13 12 11 14 15 15 20%
High-dividend Stocks 20 22 22 20 20 20 20 20 20%
Duration (years) 4.1 4.1 3.3 3.7 4.0 3.7 3.4 3.4
Historical asset allocations
Select Income Managed Corporate Class
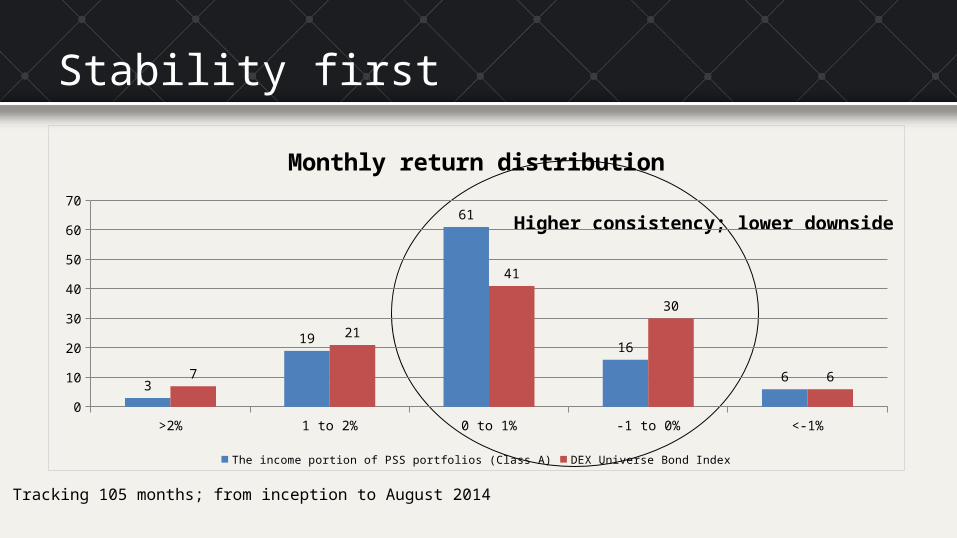
Tracking 105 months; from inception to August 2014
Higher consistency; lower downside
Stability first
>2% 1 to 2% 0 to 1% -1 to 0% <-1%0
10
20
30
40
50
60
70
3
19
61
16
67
21
41
30
6
Monthly return distribution
The income portion of PSS portfolios (Class A) DEX Universe Bond Index
Recap of capital market outlook
• Record government and household debt levels put a lid on
interest rates
• Low interest rates lead to sub-par growth
• Equity volatility is suppressed
• Bond volatility is unusually high with unusually low expected
returns
Positioning
• Income allocation to drive alpha
• Safety is not limited to cash and government bonds
• Take advantage of low equity market volatility
• Watch whether growth driven by P/E or earnings
• Watching emerging market bonds and stocks
Commissions, trailing commissions, management fees and expenses may be associated with mutual fund investments. Please read the prospectus before investing. Mutual funds are not guaranteed, their values change frequently and past performance may not be repeated. ®CI Investments, the CI Investments design, Cambridge, Harbour Advisors, and Harbour Funds are registered trademarks of CI Investments Inc. ™Portfolio Select Series, Portfolio Series, Signature Funds, G5|20 Series, and the G5|20 Series design are trademarks of CI Investments Inc.Morningstar Awards © Morningstar Inc. All Rights Reserved.
This communication is published by CI as a general source of information and is not intended to provide personal legal, accounting, investment or tax advice. Facts and data provided by CI and other sources are believed to be reliable when posted; however, CI cannot guarantee that they are accurate or complete or that they will be current at all times. CI and its affiliates will not be responsible in any manner for direct, indirect, special or consequential damages howsoever caused, arising out of the use of this presentation.
Thank youFOR ADVISOR USE ONLY – NOT FOR DISTRIBUTION TO CLIENTS