Embed Size (px)
Citation preview

1
Copyright ©2010 by the Board of Trustees of the Leland Stanford Junior University and Stanford Technology Ventures Program (STVP). This document may be
reproduced for educational purposes only.
Chuck Eesley and Ravi Belani

2
Wrap-up Lew Cirne, Wily Data on Founding Teams Intro to Venture Finance Ravi Belani

3
Team effectiveness Which OAP team(s) you’d invest your $1m
in? Mentor presentations – before session 16
(5/18) Ann Miura-Ko and Dan Dorosin will lead
5/18 class (I’ll be in London.) OEP – 15 mins, 8 slides, due before
session 17 (presentations session 17-18) Session 20 – OEP written analysis, 1500
words

4
Founder and CEO of New Relic, Inc. Founder and CEO/CTO of Wily Technologies Board Member Pano Logic Entrepreneur-in-Residence, Benchmark
Capital Senior Software Engineer at Apple Coding since the Commodore Vic 20 (3583
bytes of RAM)

5

6
Events, conditions and founder characteristics precipitating a replacement
Search process involved Founder’s negotiations with the Board over
candidate characteristics Importance of culture Whether the founder should remain with
the company and in what role after succession
How involved the founder (and top management) should be in the search process

7
7
Employees (%) M&A or IPO (%)
Idea assets (outside of Biotech/chem)
4.5 16.6
Contracting Exp. w/o VC 11.9 159
Contr. Exp. present, adding idea assets
8.2 87.8%
Idea assets present, adding contracting
14.9 20x
Interaction effects for idea assets in weak appropriation environments are strongest for firms with the highest likelihood of having an exit (Hoetker 2007; Norton et al., 2004). It is weakest for those at very low or very high probabilities.
The interaction effect for idea assets and contracting experience is strongest for those at a moderate likelihood for an exit event.

8

9

10

#15: Chi-Hua Chien Kleiner Perkins www.kpcb.com
#14: Ravi Belani DFJ
www.dfj.com
#16: Ann Miura-Ko Floodgate
www.floodgate.com
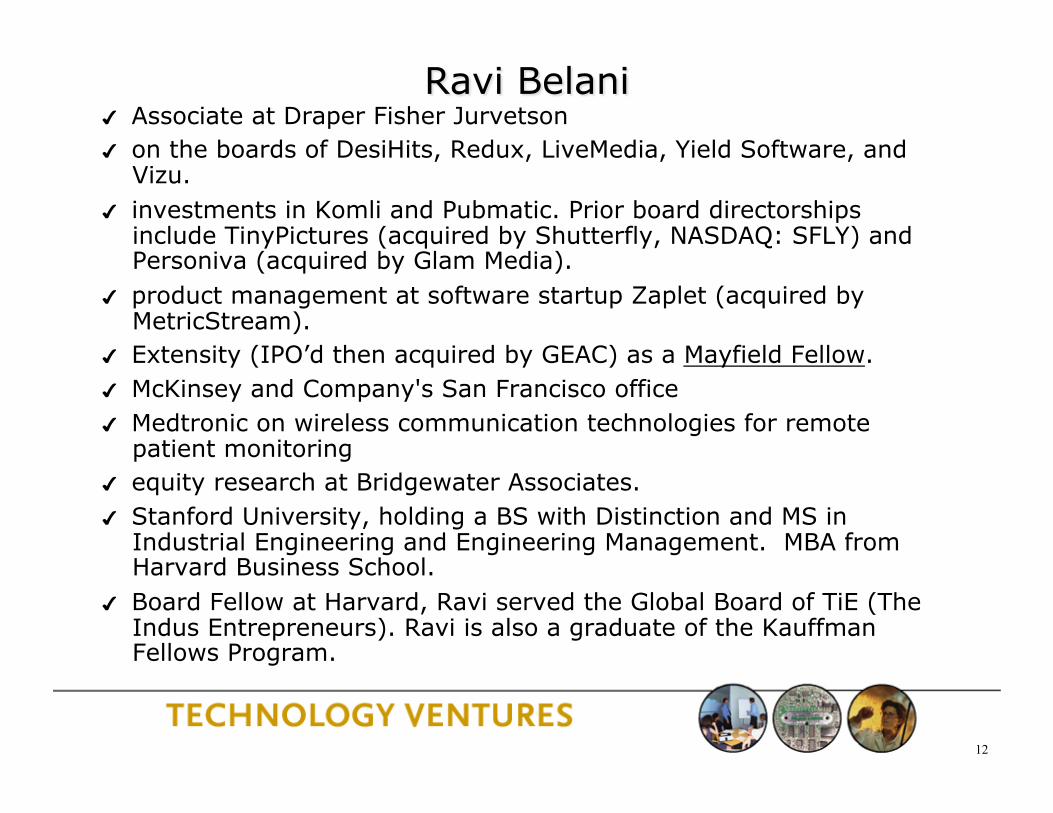
12
Associate at Draper Fisher Jurvetson on the boards of DesiHits, Redux, LiveMedia, Yield Software, and
Vizu. investments in Komli and Pubmatic. Prior board directorships
include TinyPictures (acquired by Shutterfly, NASDAQ: SFLY) and Personiva (acquired by Glam Media).
product management at software startup Zaplet (acquired by MetricStream).
Extensity (IPO’d then acquired by GEAC) as a Mayfield Fellow. McKinsey and Company's San Francisco office Medtronic on wireless communication technologies for remote
patient monitoring equity research at Bridgewater Associates. Stanford University, holding a BS with Distinction and MS in
Industrial Engineering and Engineering Management. MBA from Harvard Business School.
Board Fellow at Harvard, Ravi served the Global Board of TiE (The Indus Entrepreneurs). Ravi is also a graduate of the Kauffman Fellows Program.

13
Part II. Given the nature of the business and the objectives of the founders, what capital resources are needed to build the venture?
Part I. What is the purpose of a business plan?

14


16
• Executive Summary
• Market Analysis
• Vision and Concept (including Technology)
• Competitive Positioning and Marketing
• Business Model
• Organization
• Financial Projections
• Ownership
Focus of these 2+
weeks

A. Amount of Cash Needed and Purpose
B. Sources of Capital
C. Deal Structure

18
#1 How much money is needed for this “round” or “stage” of financing?
Typical Financing Stages (or Rounds):
Seed Early Mezzanine Late (e.g., IPO)

19
Team Risk
Technology Risk Capital Risk
Market Risk


Idea Business Plan
Prototype Beta
Sales Profitability
Decreasing Risk
$ 100K
$ 1M
$ 10M
Dec
reas
ing
Ret
urn
Venture Capital Banks
Angels FFF Gov’t
IPO Strategic Partners
Reference: Tom Stephenson, Verge
22
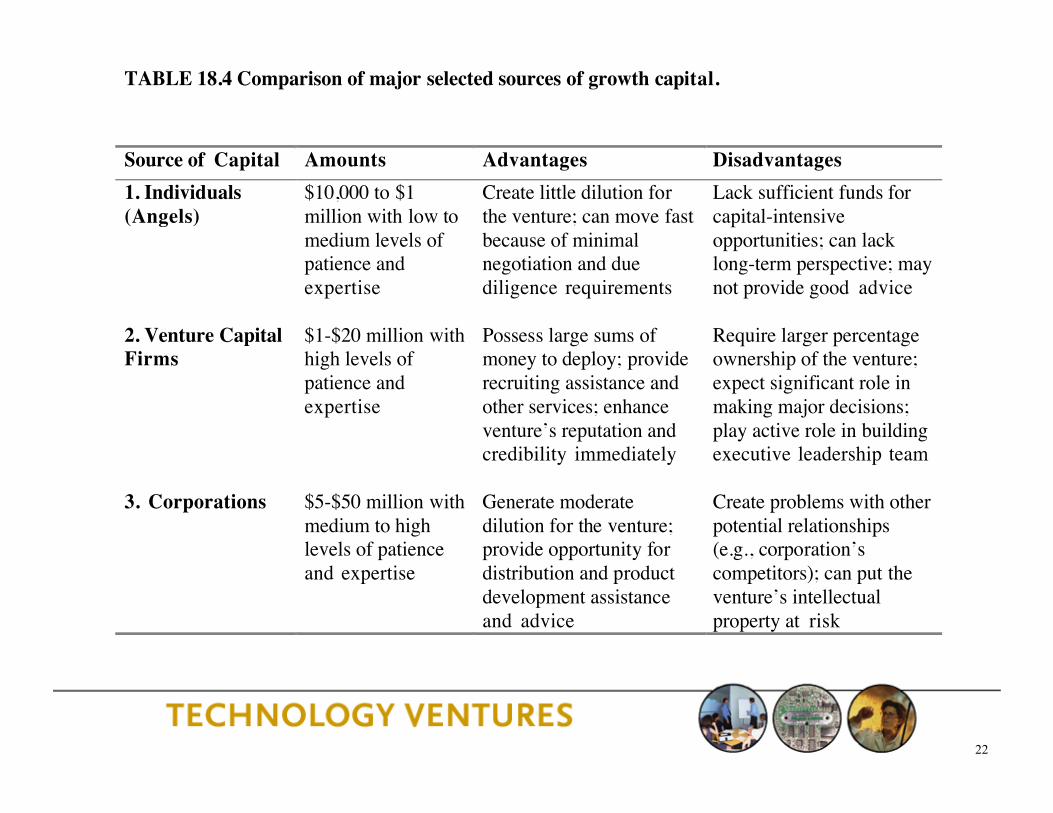
TABLE 18.4 Comparison of major selected sources of growth capital.
Source of Capital Amounts Advantages Disadvantages 1. Individuals (Angels)
$10,000 to $1 million with low to medium levels of patience and expertise
Create little dilution for the venture; can move fast because of minimal negotiation and due diligence requirements
Lack sufficient funds for capital-intensive opportunities; can lack long-term perspective; may not provide good advice
2. Venture Capital Firms
$1-$20 million with high levels of patience and expertise
Possess large sums of money to deploy; provide recruiting assistance and other services; enhance venture’s reputation and credibility immediately
Require larger percentage ownership of the venture; expect significant role in making major decisions; play active role in building executive leadership team
3. Corporations $5-$50 million with medium to high levels of patience and expertise
Generate moderate dilution for the venture; provide opportunity for distribution and product development assistance and advice
Create problems with other potential relationships (e.g., corporation’s competitors); can put the venture’s intellectual property at risk

VENTURE CAPITALISTS (Finding and Funding
Entrepreneurial Companies)
ENTREPRENEURS (Starting and Building
Companies)
INSTITUTIONAL INVESTORS (Limited Partners – e.g.
University Endowments, Pension Funds)
Source: Andy Rachleff
“Liquid” stock Preferred stock
$ $

24
• GDP: about $12.5 trillion annually
• Hedge funds: $1 trillion over 3 years
• Mutual funds: $136 billion in 2005
• Buyout funds: $86 billion in 2005
• Venture capital? $25 billion in 2005… just 0.2% of GDP.
Source: BLS website, Investment Company Institute, Thomson Financial, NVCA


26
2006 US Deal Stats – $25.8bn invested – 2,454 deals – $10.5m per deal
By Sector – 57% IT – 26% HC
By Geography – Bay Area 33% – CA 47% – New England 11%
Players – 600 Active Firms – 8,000 professionals
Huge Growth in Asset Class (LP commitments)
– 1980 $2.1 bn – 1990 $3.4 bn – 1999 $106 bn – 2005 ~$20 bn
Internationalization Ongoing
– India, China, EU, Israel

27
“I call my invention ‘The Wheel,’ but so far I’ve been unable to attract any venture capital.” • Source: Forbes Magazine, June 2004

US Model International Model (e.g., Europe)
People company founders and builders consultants and bankers
Stage seed early (A Round), but not seed
Provide “value added” “just money”
Style hands on hands off
Objective create very large companies
create medium sized companies
Philosophy maximize upside minimize downside
Returns target a small number of
big winners – home run investing
believe returns can be earned across a portfolio
Reference: Mowbray Capital, London

29
1. What percentage of the company do the investors receive for their cash?
2. What special terms and conditions are necessary to compensate them for the risk?

30
• Roma’s hot startup requires $10 million in order to form its business. She expects to earn $5 million in its fifth year.
• Randy’s VC firm has reviewed the company's business plan and believes that he is entitled to a 50% annual return on his investment. Hint: how many “times” must his firm’s money grow in 5 years?
• Publicly traded companies in this category and industry trade at an average of 30 times earnings (PE ratio). There is no material difference between these companies and Roma’s startup.
• What portion of the company should Randy’s VC firm receive today? Hint: what is future value of that investment?
1. Value of VC Investment in Year 5 = $10 m*(1+50%)^5 = $76m
2. StartUp’s Value in Year 5 = $5 m*(P/E of 30) = $150m
3. VC Firm’s Share Today = Step 1/Step 2 = $76 m/$150m = ~ 50%
4. “Post-Money” Value Today = $10 m / 50% = $ 20 m

31
Time I II III IV V
33 1/3 %
33 1/3 %
33 1/3 %
1mm shares for each founder
Σ=3mm shares @ $0.001 ea.
Value=$3k
Note: not to scale
20 %
20 %
20 %20 %
20 %
+1mm shares each for CEO & employees
Σ= 5mm shares @ $0.01
each
Value=$50k
10 %10 %
10 %
10 %10 %
50 %
+5mm shares for first VC
firm
Σ=10mm shares @ $1.00
each
Value=$10mm
Use of $: R&D
Post-money value = $10mm
Pre-money value = ?

32
33 1/3 %
33 1/3 %
33 1/3 %
20 %
20 %
20 %20 %
20 %
10 %10 %
10 %
10 %10 %
50 %
Time I II III IV V
1mm shares for each founder
Σ=3mm shares @ $0.001 ea.
Value=$3k
1mm shares each for CEO & employees
Σ= 5mm shares @ $0.01
each
Value=$50k
5mm shares for first VC
firm
Σ=10mm shares @ $1.00
each
Value=$10mm
Use of $: R&D
5 %5 %
5 %
5 %
5 %
25 %
25 % 25 %
+5mm shares for sale to public in
IPO
Σ = 20mm shares @ $15.00
each
Value=$300mm
Use of $: Operations
6 2/3 %6 2/3 %
6 2/3 %
6 2/3 %
6 2/3 %
33 1/3 %
33 1/3 %
+5mm shares for second round VCs
Σ=15mm shares @ $5
each
Value=$75mm
Use of $: Mktg. Note: not to scale

33
Market Capitalization
Net Income: $10 M
P/E 30
$300 M
Share Price: $15
# Shares: 20 M
$300 M
Sales: $100 M
PPS: 3
$300 M

34

35
Management Fees (typically 2-2.5% of AUM) – Charge a management fee to cover the costs of
managing the committed capital.
Carried Interest (typically 20-25%) – "Carried interest" is the term used to denote the profit
split of proceeds to the general partner.
Example $100m fund – 4x return and 2 and 20% – $2m per year in management fee – (($100m x 4) - $100m) * 20% = $60m in carried
interest
36
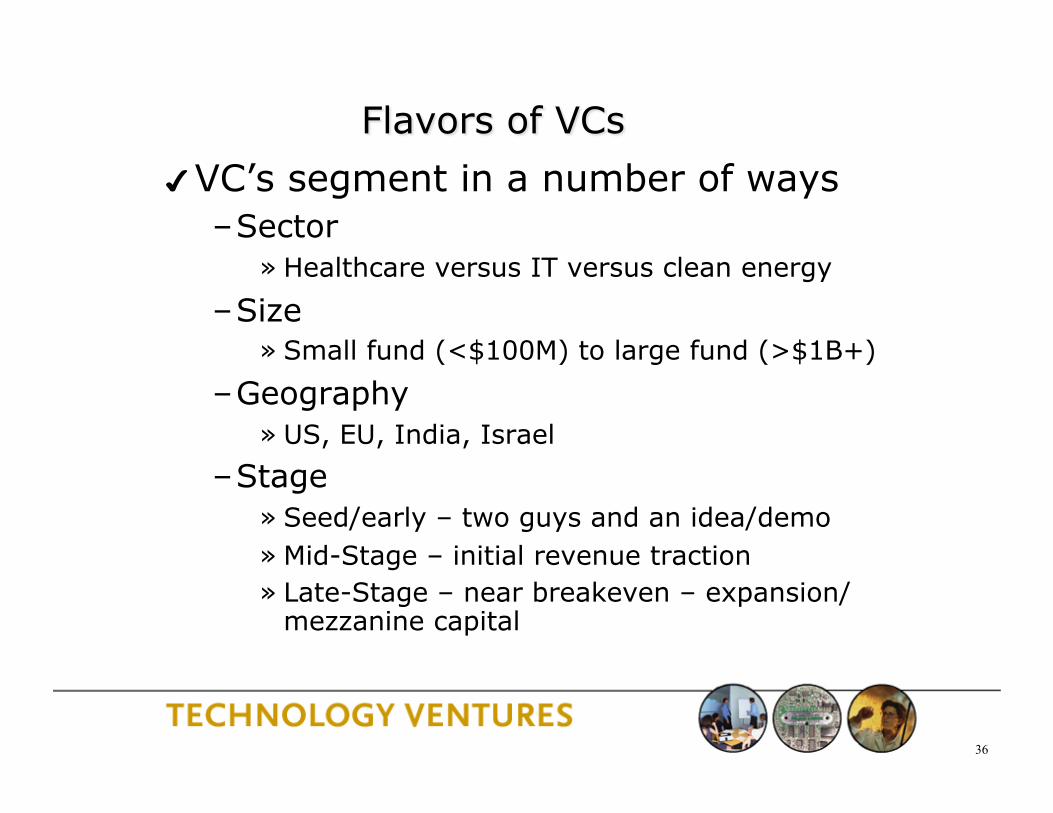
VC’s segment in a number of ways – Sector
» Healthcare versus IT versus clean energy
– Size » Small fund (<$100M) to large fund (>$1B+)
– Geography » US, EU, India, Israel
– Stage » Seed/early – two guys and an idea/demo » Mid-Stage – initial revenue traction » Late-Stage – near breakeven – expansion/
mezzanine capital

37
General Partners – 6-8 active deals at a
time
Principals/Associate – Drive deal flow, deal
process, and portfolio company development
Finance, Marketing, and HR Staff
Decision Making – Typically unanimous – Individual partners
champion deals to group
– Deal team diligences prospect and builds investment case
– Partnership acts as a check and balance to ensure careful decision making

38
This depends on stage – let’s focus on early stage since that is what we do. – Team
» Domain expertise with core technical strength and knowledge of given market opportunity
» History of collaboration and success » A willingness to allow VC’s to help build the team
– Market » Emerging and fast growing market » Bad markets make for bad companies
– Business model » How will you make money, how will you sell
– Technology » Defensible technology/IP that can be protected to form
competitive barriers over time

39
Be committed…. Hire a great Valley lawyer Figure out what stage and sector you are Identify 4-5 firms that focus on this stage Identify which partner you think is most relevant Get an introduction to that partner Prepare a 1-2 page overview to send him/her Prepare a 10-15 slide presentation to give in a
30-45 minute timeframe if they ask you to present Only goal of the first meeting is to get a second
meeting.

40
What we do Who we are How we plan to make money What we are asking for (how much money) Demo Secret Sauce/Technology Market Analysis Competitive Assessment Go to Market Business Model/Financials/Targeted
Milestones
Your Pitch: 10 Slides
The audience most know in first minute what you do or they will tune out

41
Pat your head – Spec out 1.0 and focus on a customer need – Narrow the focus to broaden the appeal
Rub your tummy – Paint a picture and product roadmap that is a
company not a feature

42
12-16 week process – First meeting to close – 1st mtg diligence
partner meeting TS negotiation close
Prepare Investor Package – Presentation – Financial Plan – Personal references – Customer references – Market references – Cap Table – Market research – Product documentation – Competitive Analysis
Investors will seek: – 20-50% of the company – Valuation function of
targeted raise, ownership, and stage,
– Preferred Equity securities, with key terms:
» BoD seat » Liquidation Preference » Anti-dilution Protection » Participation » Pro Rata rights » Protective Provisions » Vesting terms for
founders and employees

43
Is the idea sufficiently baked? – Optimal time is 6 months of iteration
Pick your co-founders very carefully Test fit with VC
– Personality, values, knowledge of market
Optimize for best deal not best price Consider the downstream effects of the
financing – High-post moneys can by Pyrrhic victories if
company misfires – Angel financing can be a mixed blessing – be
careful
44
Investing is a people business, and getting a meeting is all about “who you know”
Best way to approach a VC is some form of introduction – If you don’t know a VC, find someone
who knows you who does and get them to introduce you
– Entrepreneur, professor, attorney… – Sending a plan to [email protected]
is a waste of time

45
Don’t take rejection personally, the odds are against you.
Every VC is “interested” – force them to do work to test their level of interest.
Don’t waste time trying to change the mind of someone who says “no”.
Don’t shop to multiple partners in a firm if the first rejects you.
Don’t ignore the junior partners – they can really help.
There are lots of VC firms, focus on a firm that has some connection to you.

46
Source: Venture Economics/NVCA

47
*Source: Venture Source

48
% o
f To
tal V
C Ro
unds
27%
58%
11%
23%
13%
26%
57%
13%
61%
3%
10%
4%
Source: Dow Jones VentureOne/Ernst &Young
5%

49 Source: Dow Jones VentureOne/Ernst &Young

50 50
1. Brief Historical background
2. Economics of VC
3. Drivers of VC investment (from entrepreneur’s POV)
4. Concluding remarks
Proposed Outline

51
In 1946, MIT President Karl Taylor Compton conceived of the idea of high tech venture capital with Georges Doriot from HBS founded the first venture capital firm – American Research and Development (ARD).
Most successful investment Digital Equipment Corporation - invested $70k in 1959 which by 1968 was worth $37 mn!
The 1979 ERISA act allowed pension funds to invest in PE.
VC is 3% of R&D but accounts for about 8% of industrial innovations between 1983-1992 (Kortum and Lerner 2000)
History

52 52
1. Historical background
2. Economics of VC
3. Drivers of VC investment (from entrepreneur’s POV)
4. Concluding remarks
Proposed Outline

53
VC revenue averages $5 million per VC-backed company
Founding team averages $9 million per VC-backed company (most from small probability of great success)
Economically rational founding team would sell at time of VC funding for $900,000 to avoid the undiversified risk.
Entrep. Exit value (millions)
0 to 1 1 to 10
10 to 50
50 to 100
100 to 200
200 to 500
500 to 1000
1000 and up
Percent of Co’s.
67 20 9 2.4 1.3 0.5 0.1 0.03
Splitting the Pie

54
1.) Human Capital
Sequence # of fund Start-‐up experience (early stage) (Zarutskie)
2.) Focus (Lerner et al. ) Industry / stage
3.) Organization (Wasserman 2007; Schoar and Lerner)
Partner to $$ ratio Partner to non-‐partner ratio
4.) Less growth across funds
5.) Public market (experienced VCs react quicker)
Drivers of VC Returns
Overall (VC, not PE): Returns are highly skewed (a few rock stars make $$$)
Returns are highly correlated with general stock market
Risk-adjusted returns are not different from Dow Jones 5000
(Hall and Woodward 2007)

55 55
The Micro-‐economics of VC Information asymmetry drives VC industry choice and stagings: Time between rounds gets shorter when:
• Assets are more specific and intangible • Greater growth opportunities (Gompers, 1995)
Principal-agent theory describes VC contracts, but more complex than theory predicts: • Contracts allow VCs to separately allocate cash flow rights, board rights, voting rights, liquidation rights, and other control rights • Dependent on stage and size of investment, uncertainty, performance, contingencies, etc. (Kaplan and Strömberg, 2000)
VC characteristics: • Prior VC experience improves the # of IPO/Acquisitons. • Performance doubles when the VC has prior VC experience and experience managing a start-up • For seed stage: MBA hurts performance (unless it’s an Ivy MBA then no difference) Overall an Ivy degree doesn’t help • Science & Engineering degrees help performance
Individual VC characteristics matter more in seed stage funds than for later stage funds. (Zarutskie 2007)

56 56
1. Historical background
2. Economics of VC
3. Drivers of VC investment (from entrepreneur’s POV)
4. Concluding remarks
Proposed Outline

57
1.) Work history (Burton, et al. 2002; Higgins and Gulati 1996)
2.) Social network (Shane and Stuart 2002 – 134 MIT spin-‐offs)
3.) Timing
Public markets
Persistence (~9-‐12 months to raise VC)
4.) Partnerships/Endorsements -‐ (Shane and Cable 2002 – 50 MIT spin-‐offs, 202 seed-‐stage investors
5.) Firm strategy – innovation, time frame to exit
6.) No. of cofounders, Prior IPO, same industry start-‐up, US citizen (Eesley, 2,100 MIT alumni start-‐ups)
Assuming geography and industry sector that VCs invest in (Sorenson and Stuart 2001)
Assuming fit with VC growth model (Fluck, Zsuzsanna, Douglas Holtz-‐Eakin, and Harvey S. Rosen, 1998)
Drivers of Obtaining VC

58

59 59
Message to Entrepreneurs: – Selecting Your Financial Partners
Seek True Value Added Operating Experience Rolodex/Network Awesome Portfolio (in your space) Cool Limiteds (in your space) Entrepreneurs “pay” in terms of lower valuations for affiliating with higher status VC firms (Hsu, 2004)
Keep Realistic Expectations Time to Market Revenue growth Valuations

Ravi Belani DFJ
www.dfj.com
![RAVI COLTRANE: QUARTET – Contract Rider: Quartet: Ravi ...P... · RAVI COLTRANE: QUARTET – Contract Rider: [Current: May 2012] Quartet: Ravi Coltrane (Saxophone) + Guitar, Bass,](https://img.pdfslide.us/doc/110x75/5ab9fb537f8b9a28468eab6a/ravi-coltrane-quartet-contract-rider-quartet-ravi-pravi-coltrane.jpg)