Embed Size (px)
Citation preview
CHRONIC MYELOID LEUKEMIA (CML) Managing the Long and the Short of It
Jeffrey H Lipton PhD MD
Princess Margaret Cancer Centre
Professor of Medicine
University of Toronto
CAGPO Annual Conference
St. John’s, NFLD
October 24, 2014
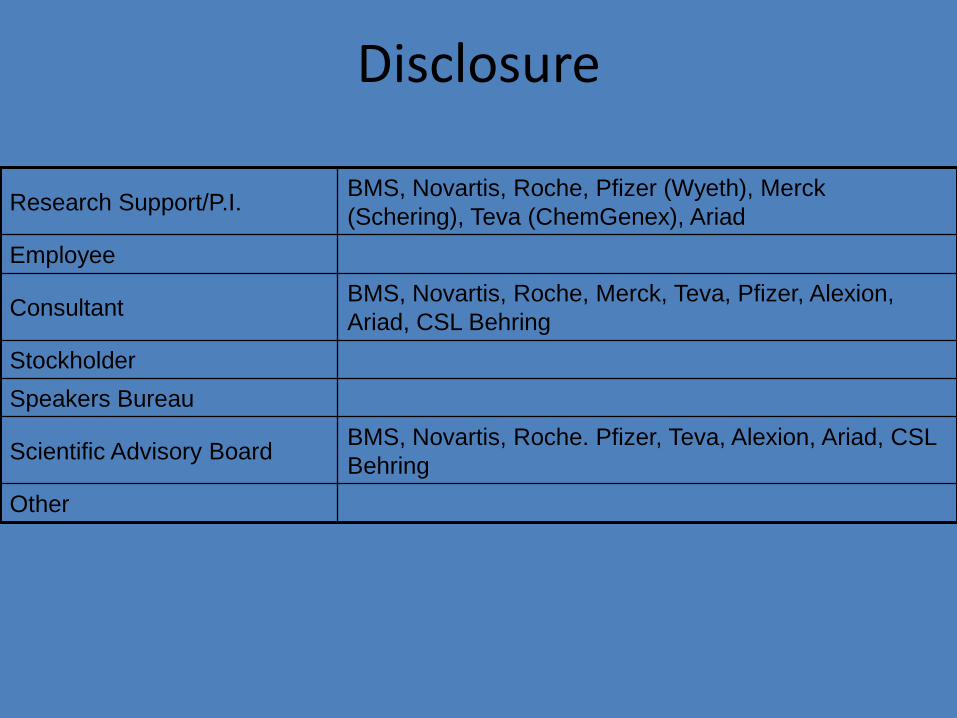
Disclosure
Research Support/P.I. BMS, Novartis, Roche, Pfizer (Wyeth), Merck
(Schering), Teva (ChemGenex), Ariad
Employee
Consultant BMS, Novartis, Roche, Merck, Teva, Pfizer, Alexion,
Ariad, CSL Behring
Stockholder
Speakers Bureau
Scientific Advisory Board BMS, Novartis, Roche. Pfizer, Teva, Alexion, Ariad, CSL
Behring
Other
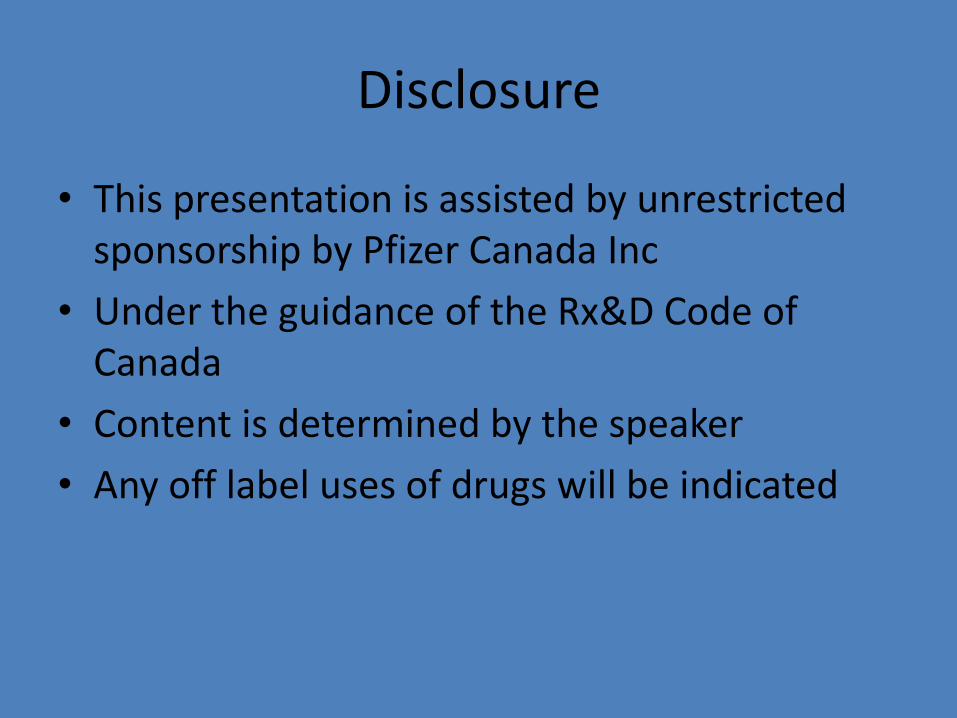
Disclosure
• This presentation is assisted by unrestricted sponsorship by Pfizer Canada Inc
• Under the guidance of the Rx&D Code of Canada
• Content is determined by the speaker
• Any off label uses of drugs will be indicated
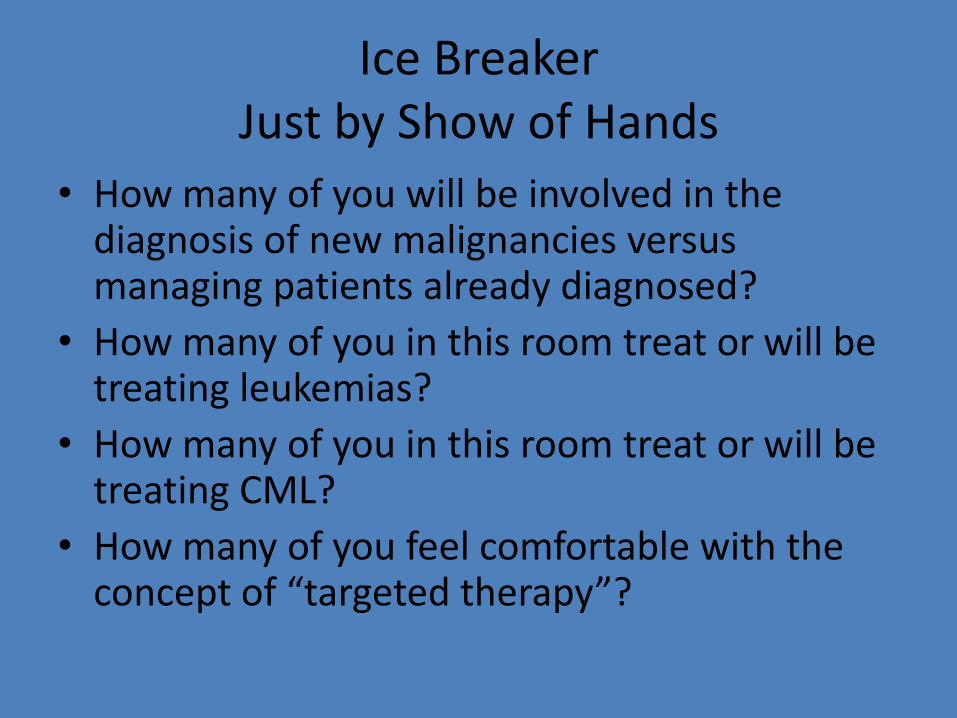
Ice Breaker Just by Show of Hands
• How many of you will be involved in the diagnosis of new malignancies versus managing patients already diagnosed?
• How many of you in this room treat or will be treating leukemias?
• How many of you in this room treat or will be treating CML?
• How many of you feel comfortable with the concept of “targeted therapy”?
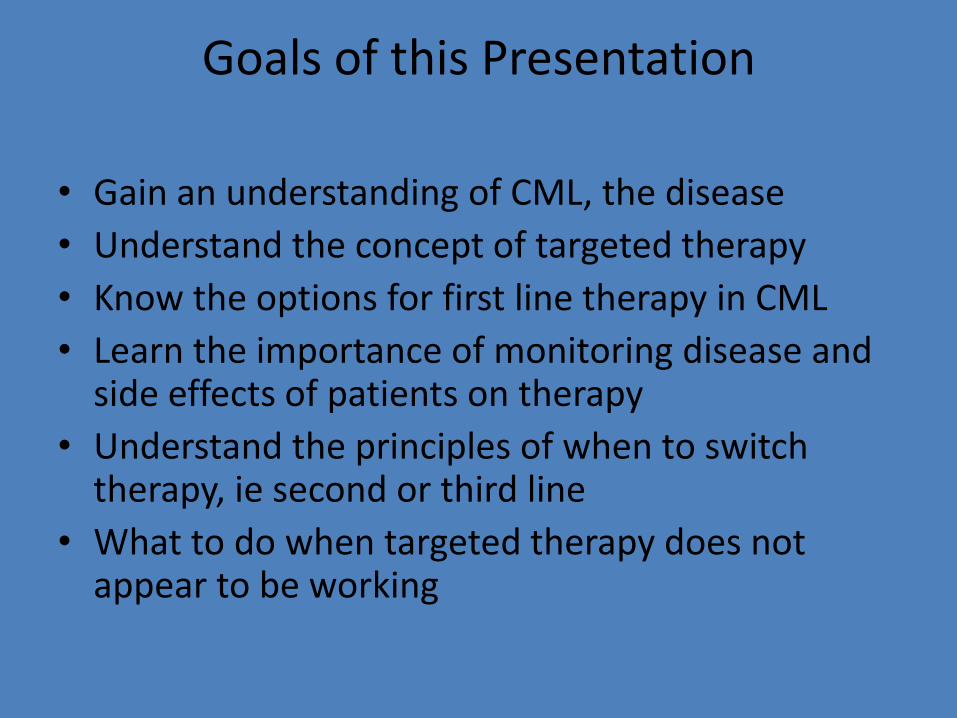
Goals of this Presentation
• Gain an understanding of CML, the disease
• Understand the concept of targeted therapy
• Know the options for first line therapy in CML
• Learn the importance of monitoring disease and side effects of patients on therapy
• Understand the principles of when to switch therapy, ie second or third line
• What to do when targeted therapy does not appear to be working

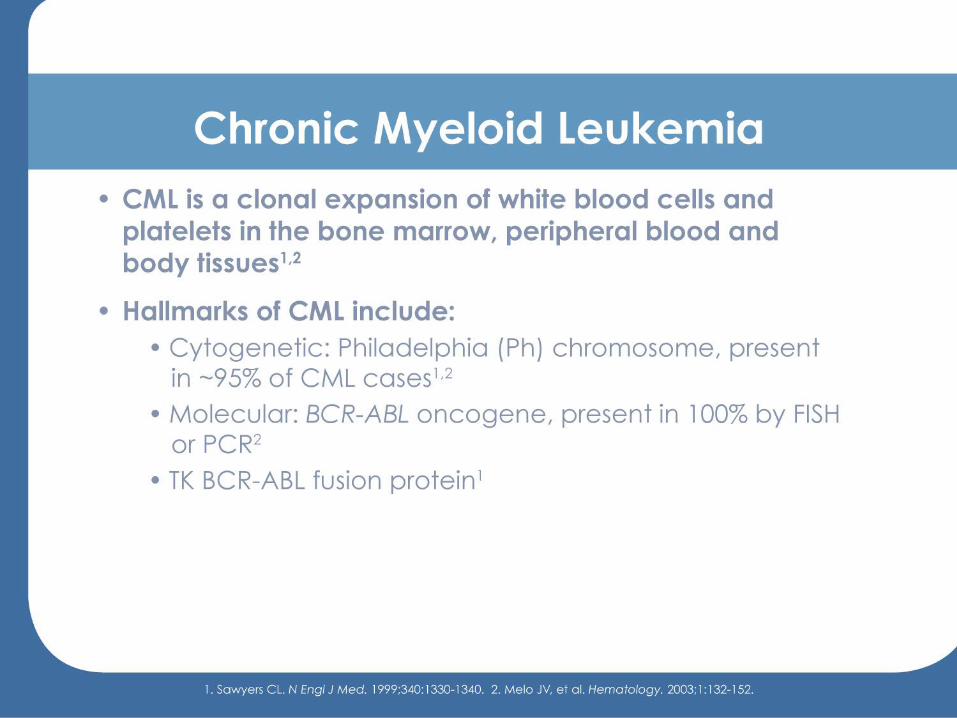
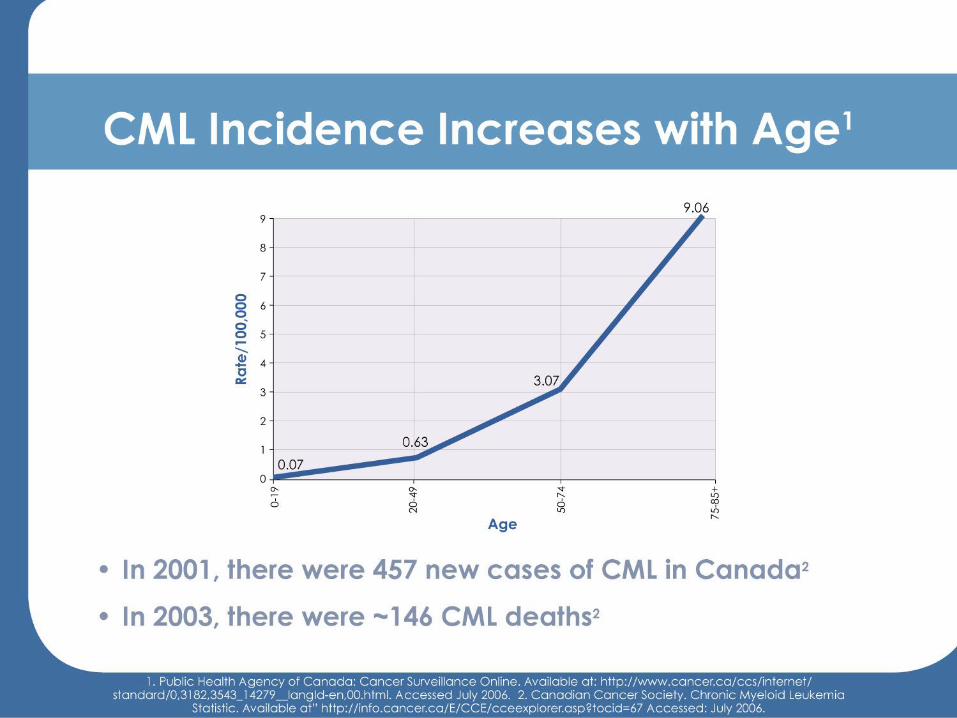
What is chronic myeloid leukemia? Biology and Epidemiology
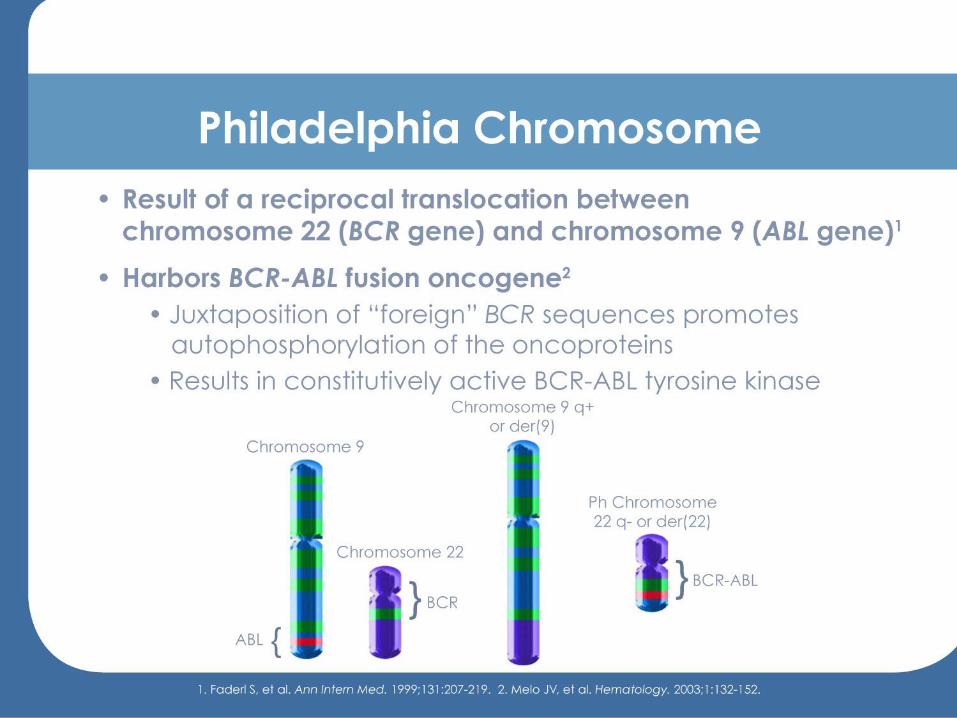
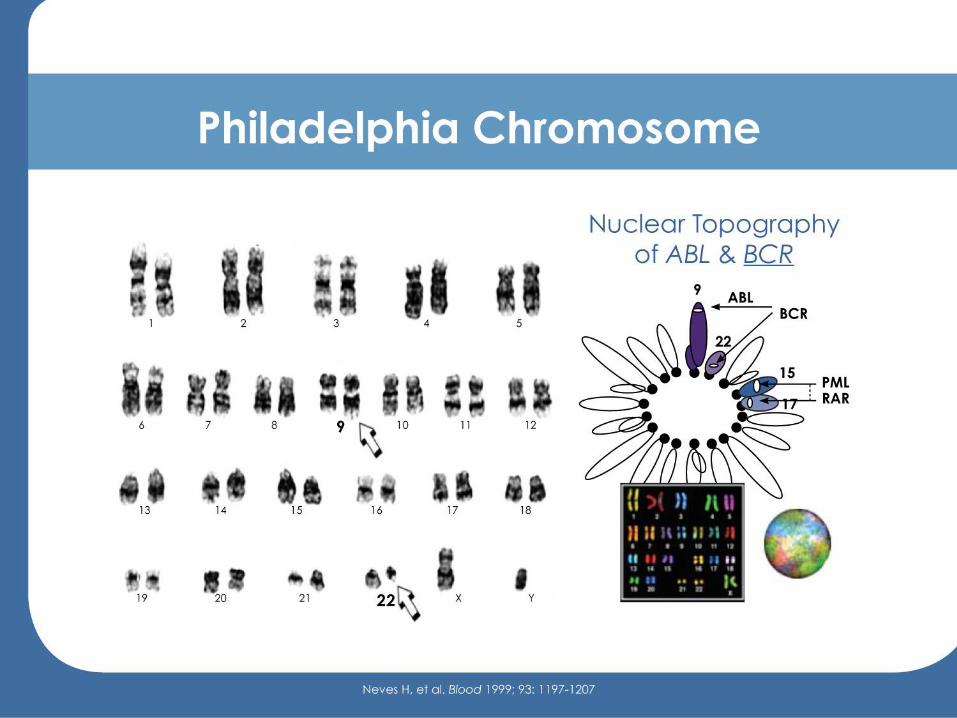
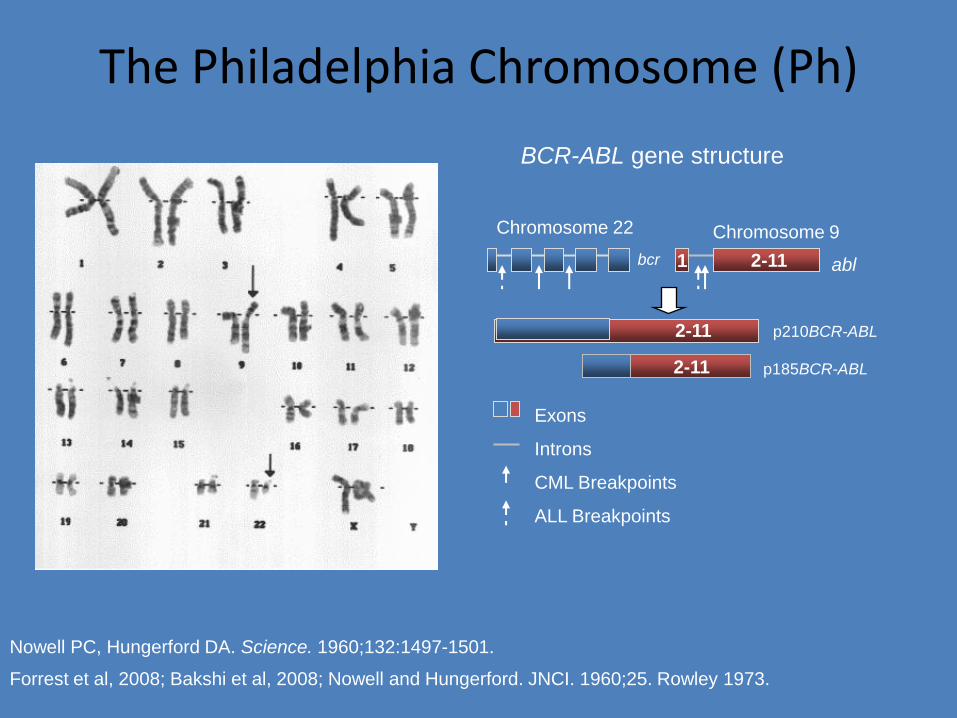
The Philadelphia Chromosome (Ph)
1
p210BCR-ABL
p185BCR-ABL 2-11
2-11
Chromosome 9
bcr
Chromosome 22
abl
2-11
Exons
Introns
CML Breakpoints
ALL Breakpoints
BCR-ABL gene structure
Nowell PC, Hungerford DA. Science. 1960;132:1497-1501.
Forrest et al, 2008; Bakshi et al, 2008; Nowell and Hungerford. JNCI. 1960;25. Rowley 1973.
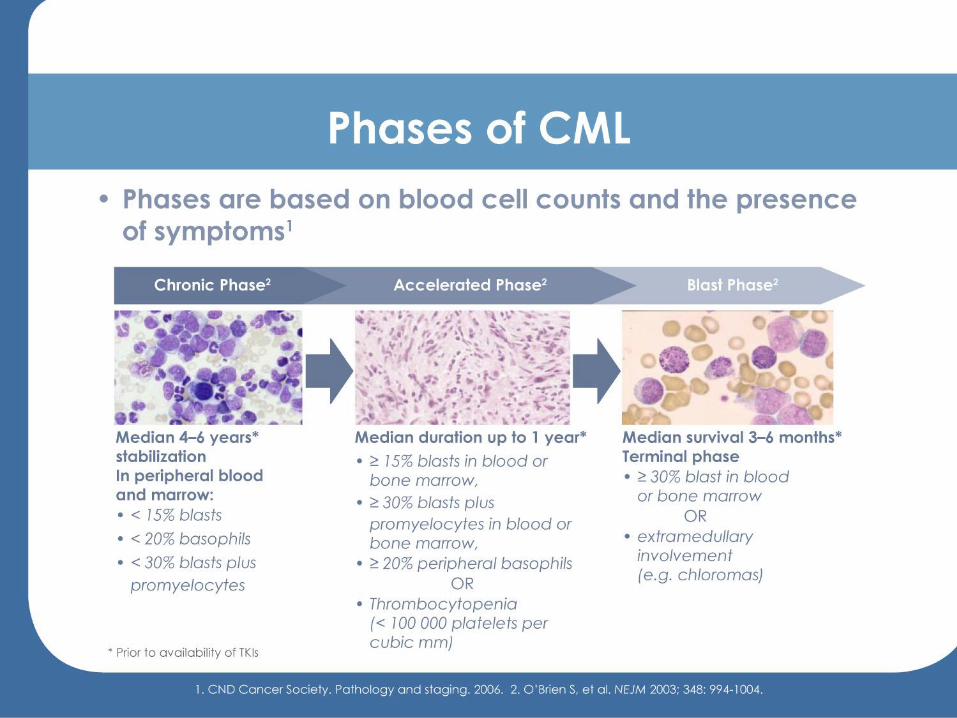
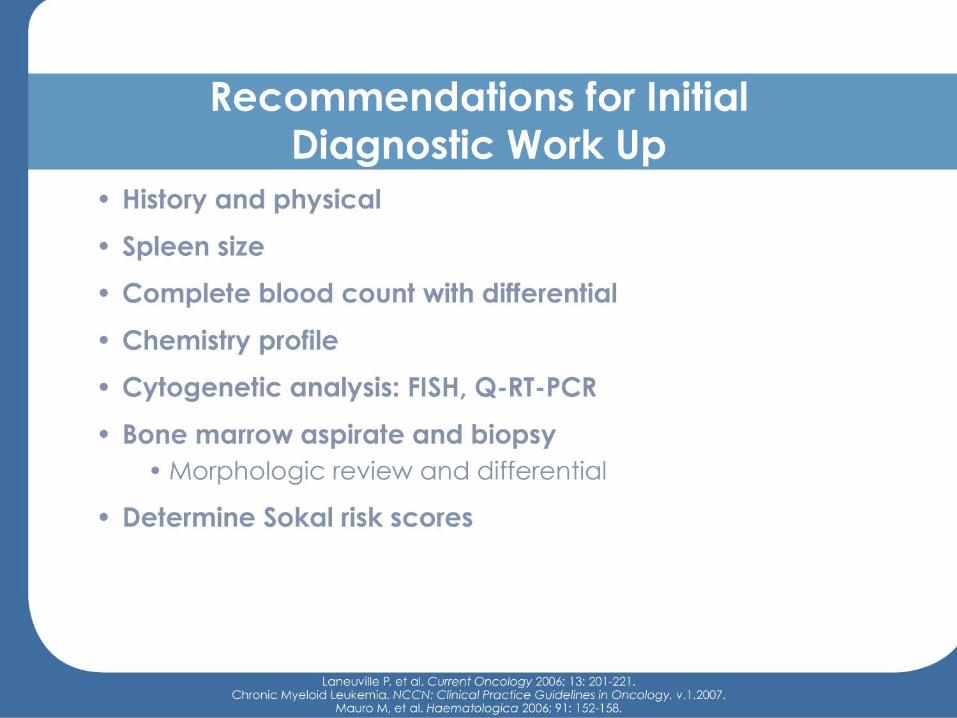
Diagnosis of CML

Choosing a Treatment Path
Pre History or what we did in the days before
targeted therapy
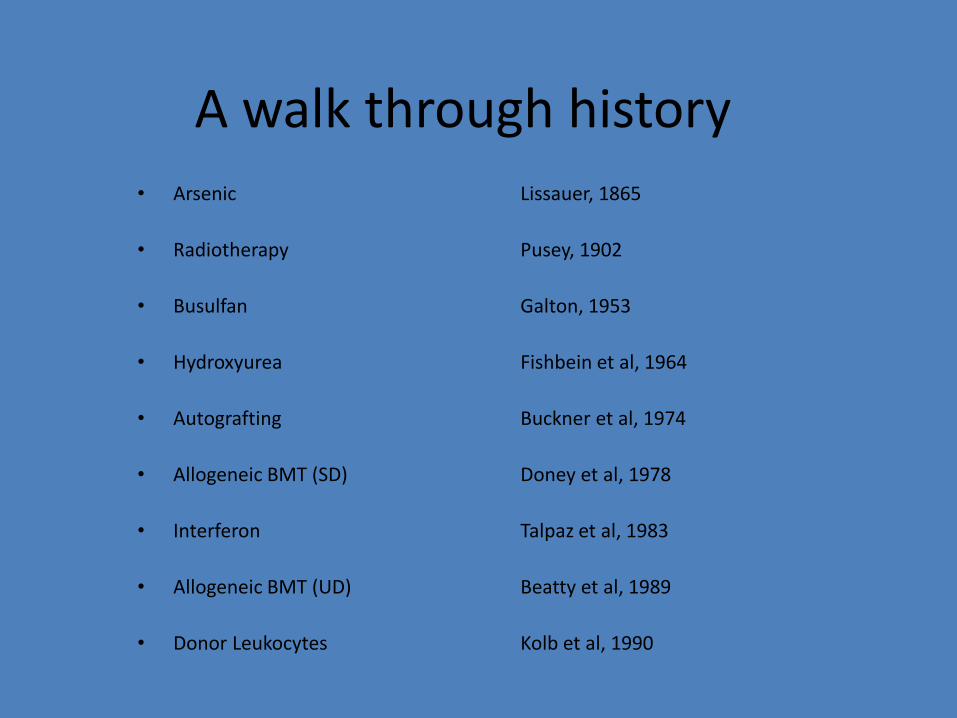
A walk through history • Arsenic Lissauer, 1865
• Radiotherapy Pusey, 1902
• Busulfan Galton, 1953
• Hydroxyurea Fishbein et al, 1964
• Autografting Buckner et al, 1974
• Allogeneic BMT (SD) Doney et al, 1978
• Interferon Talpaz et al, 1983
• Allogeneic BMT (UD) Beatty et al, 1989
• Donor Leukocytes Kolb et al, 1990
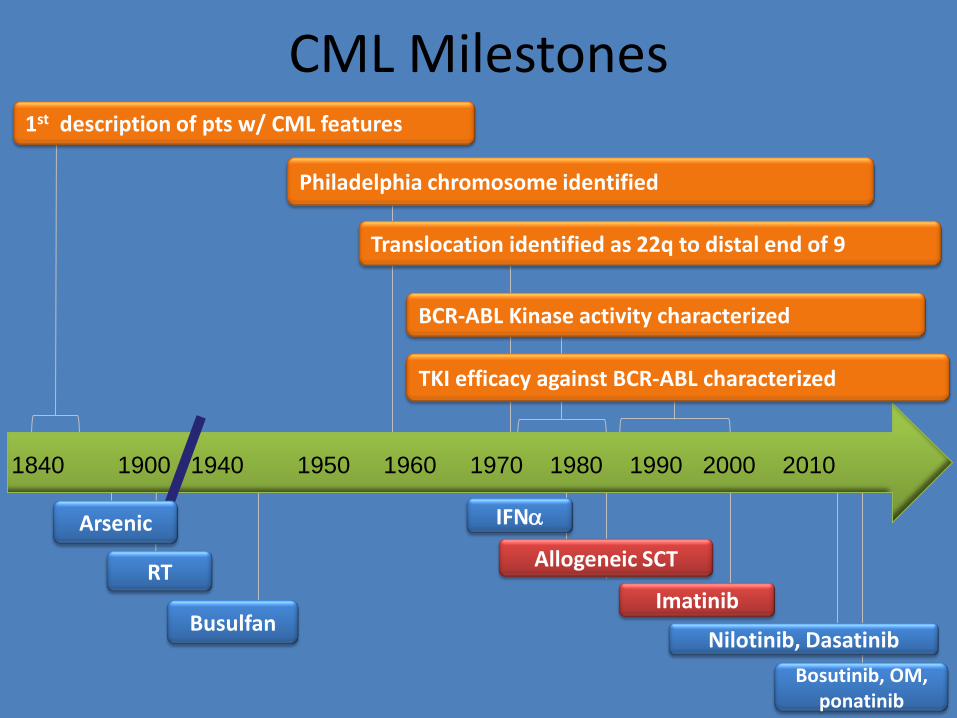
CML Milestones
22
1st description of pts w/ CML features
Philadelphia chromosome identified
Translocation identified as 22q to distal end of 9
RT
IFNa
Busulfan
TKI efficacy against BCR-ABL characterized
Allogeneic SCT
Imatinib
Nilotinib, Dasatinib
Bosutinib, OM, ponatinib
1840 1900 1940 1950 1960 1970 1980 1990 2000 2010
Arsenic
BCR-ABL Kinase activity characterized
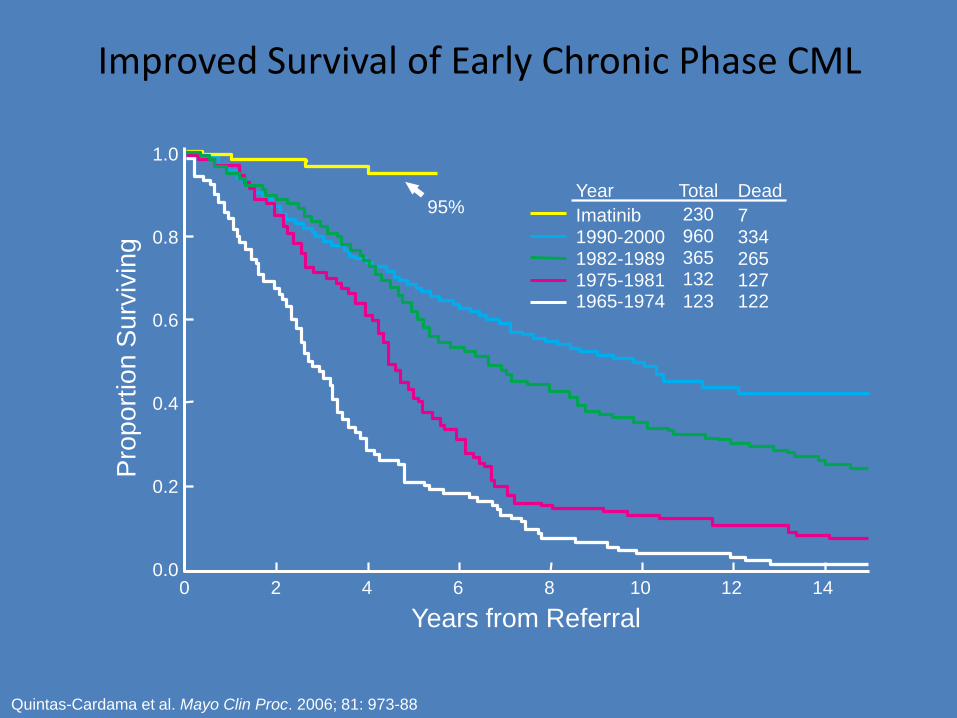
Quintas-Cardama et al. Mayo Clin Proc. 2006; 81: 973-88
Y ears from Referral
Pro
po
rtio
n S
urv
ivin
g
1.0
0.8
0.6
0.4
0.2
0.0 0 2 4 6 8 10 12 14
95% Y ear T otal Dead
Imatinib 230 7 1990-2000 960 334 1982-1989 365 265 1975-1981 132 127 1965-1974 123 122
Improved Survival of Early Chronic Phase CML
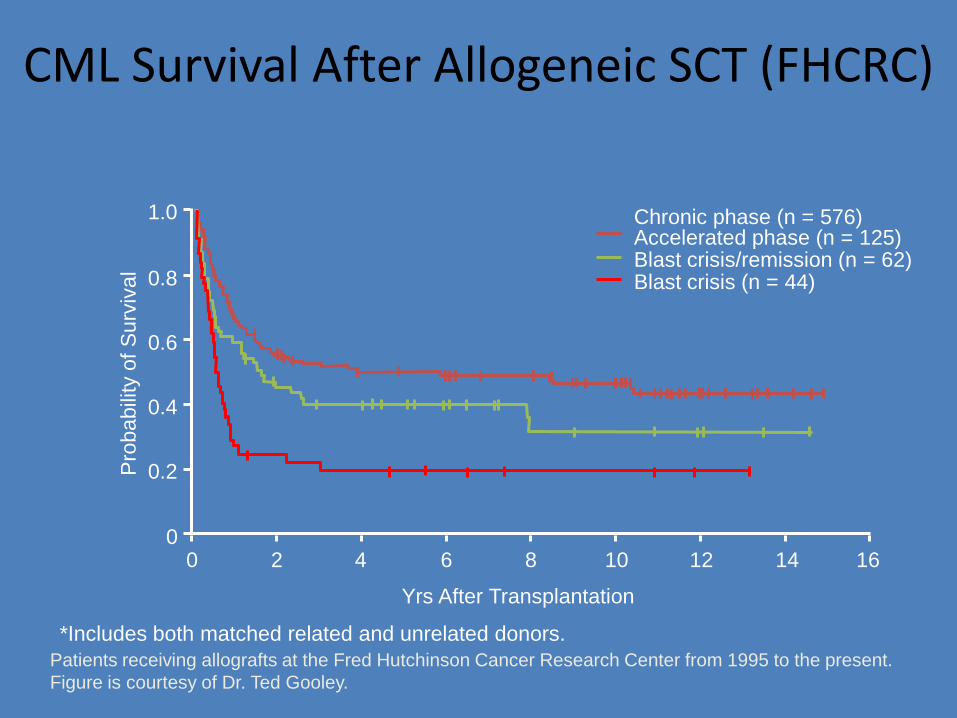
CML Survival After Allogeneic SCT (FHCRC)
*Includes both matched related and unrelated donors.
Patients receiving allografts at the Fred Hutchinson Cancer Research Center from 1995 to the present.
Figure is courtesy of Dr. Ted Gooley.
1.0
0.8
0.6
0.4
0.2
0
Pro
ba
bili
ty o
f S
urv
iva
l
0 2 4 6 8 10 12 14 16
Yrs After Transplantation
Chronic phase (n = 576) Accelerated phase (n = 125) Blast crisis/remission (n = 62) Blast crisis (n = 44)
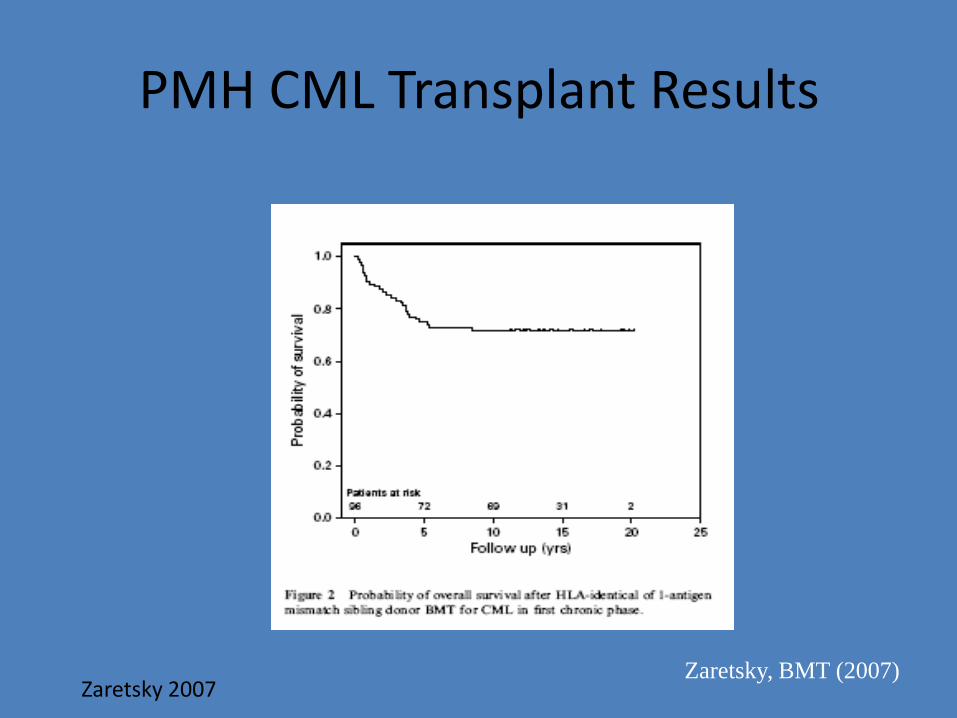
PMH CML Transplant Results
Zaretsky, BMT (2007) Zaretsky 2007
What is Targeted Therapy? Just the facts ma’am…
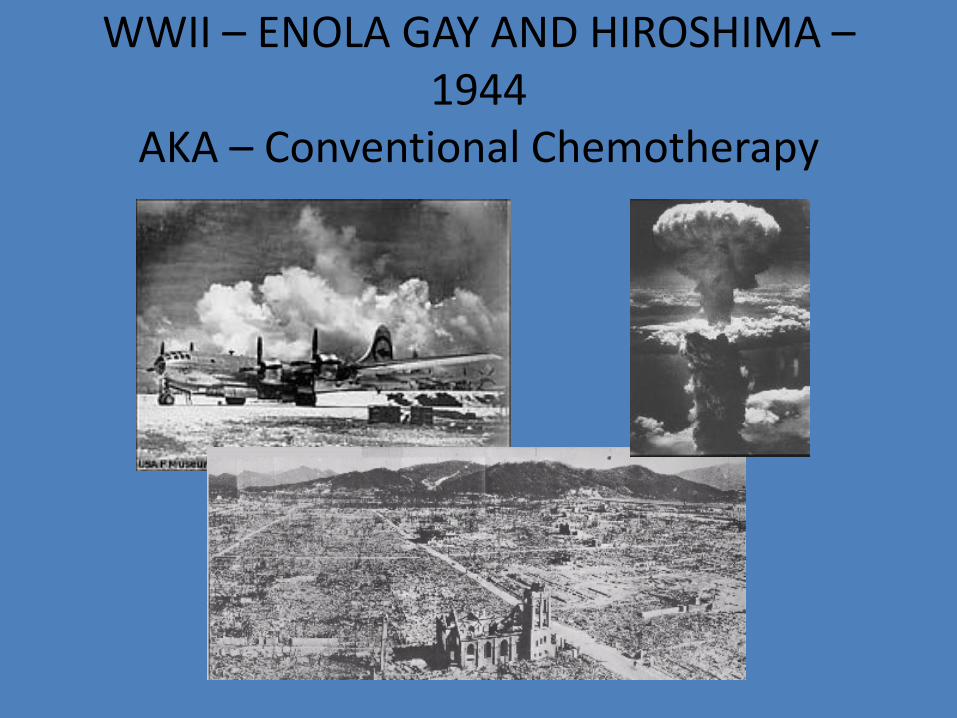
WWII – ENOLA GAY AND HIROSHIMA – 1944
AKA – Conventional Chemotherapy
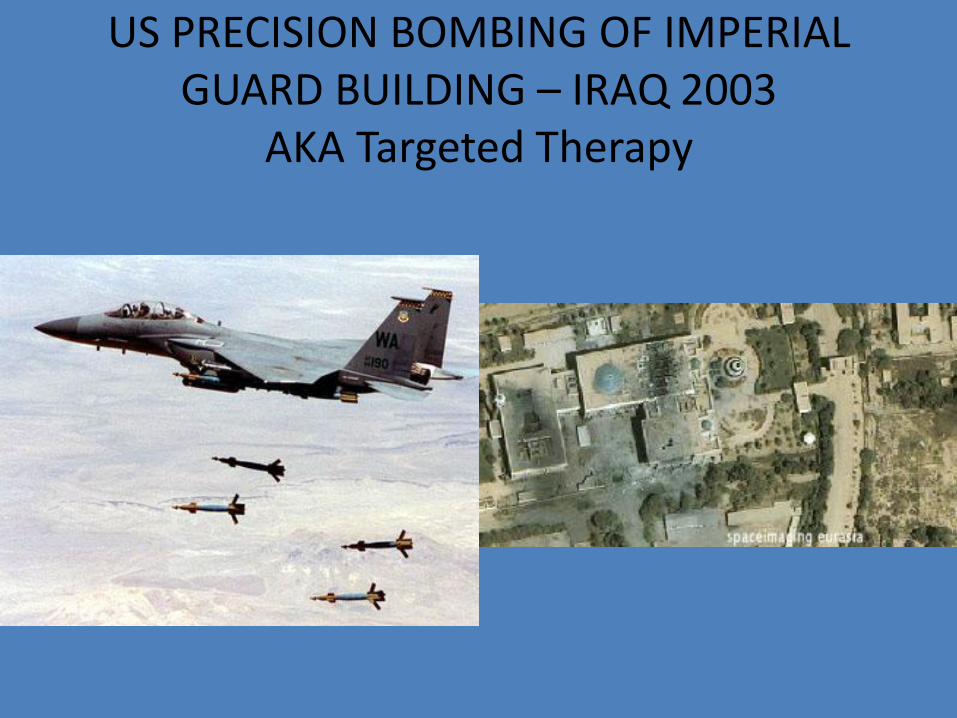
US PRECISION BOMBING OF IMPERIAL GUARD BUILDING – IRAQ 2003
AKA Targeted Therapy
Therapy of Newly Diagnosed Patients with CML
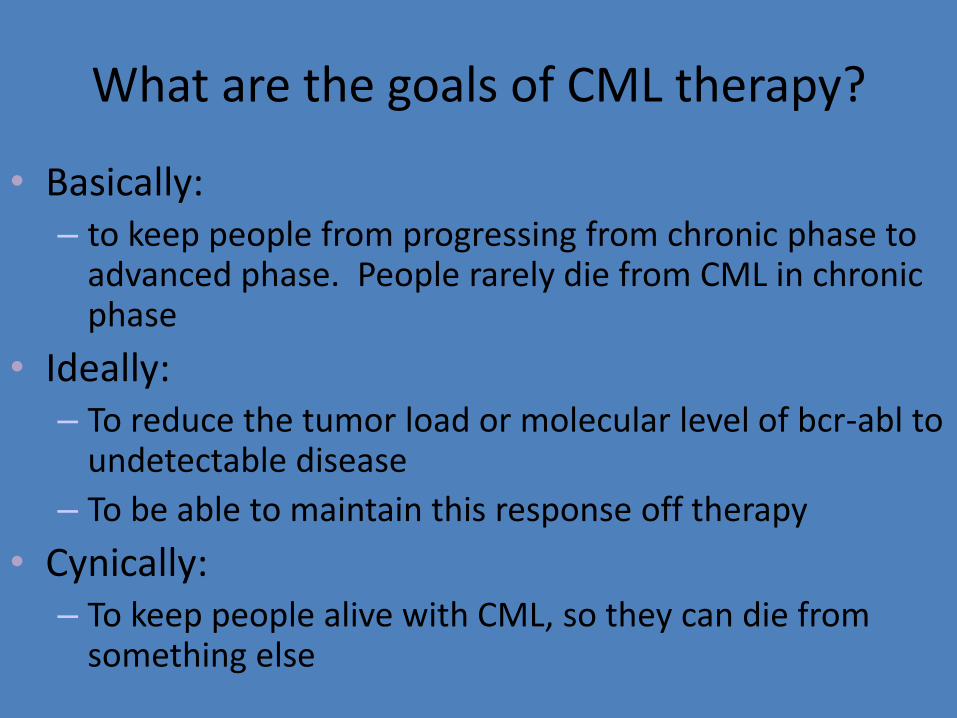
What are the goals of CML therapy?
• Basically: – to keep people from progressing from chronic phase to
advanced phase. People rarely die from CML in chronic phase
• Ideally: – To reduce the tumor load or molecular level of bcr-abl to
undetectable disease
– To be able to maintain this response off therapy
• Cynically: – To keep people alive with CML, so they can die from
something else
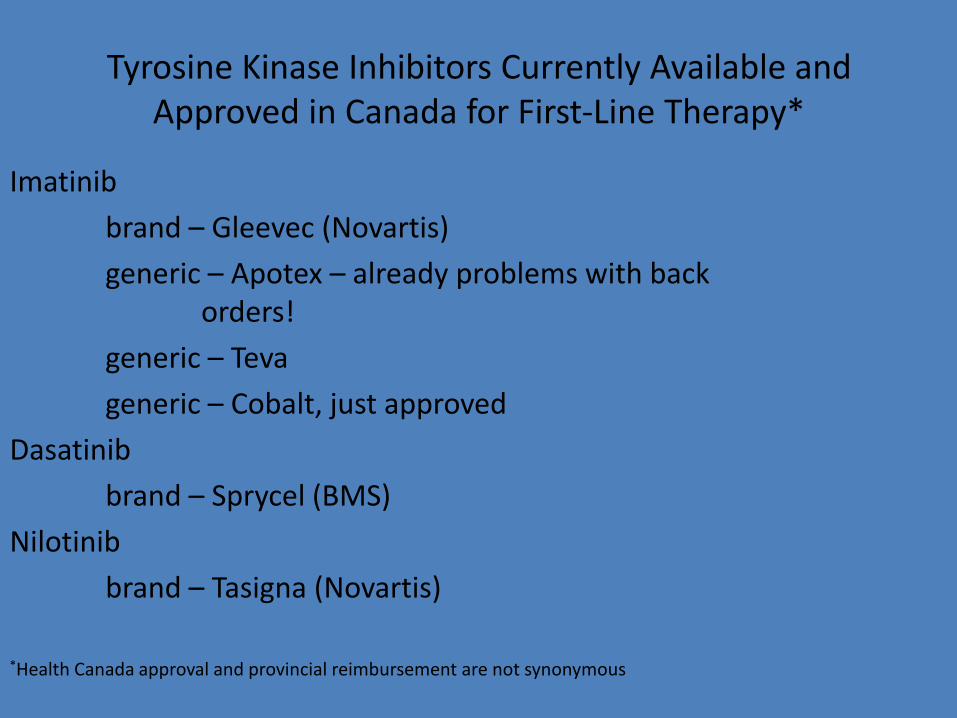
Tyrosine Kinase Inhibitors Currently Available and Approved in Canada for First-Line Therapy*
Imatinib
brand – Gleevec (Novartis)
generic – Apotex – already problems with back orders!
generic – Teva
generic – Cobalt, just approved
Dasatinib
brand – Sprycel (BMS)
Nilotinib
brand – Tasigna (Novartis)
*Health Canada approval and provincial reimbursement are not synonymous
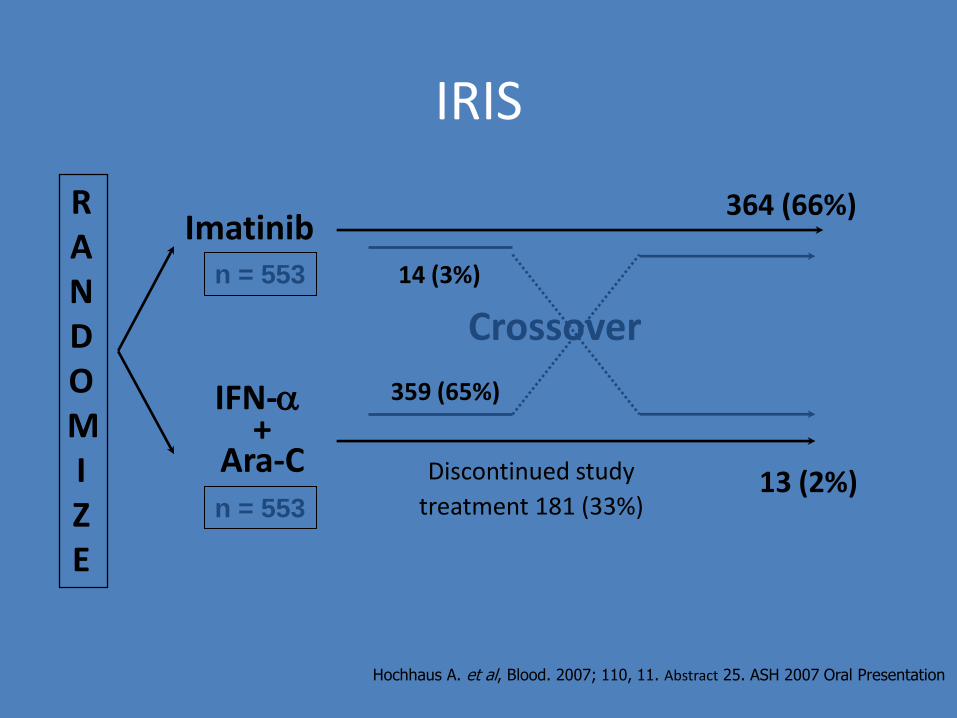
IRIS
IFN-a +
Ara-C
Imatinib
Crossover
n = 553
n = 553 13 (2%)
364 (66%)
14 (3%)
359 (65%)
Discontinued study
treatment 181 (33%)
RANDOMI Z E
Hochhaus A. et al, Blood. 2007; 110, 11. Abstract 25. ASH 2007 Oral Presentation
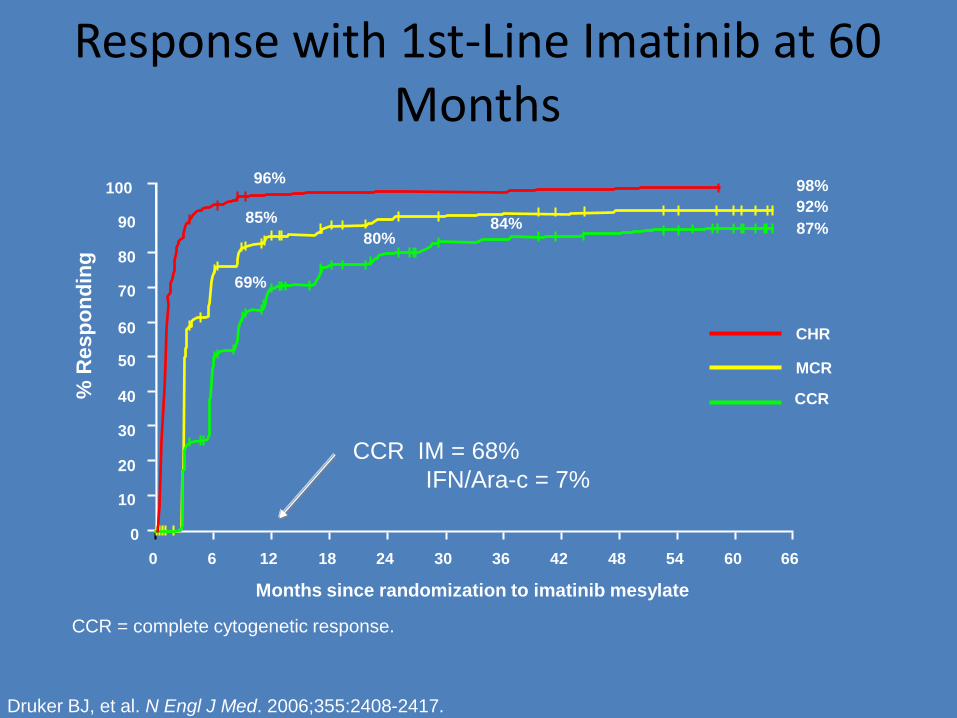
Response with 1st-Line Imatinib at 60 Months
Months since randomization to imatinib mesylate
% R
esp
on
din
g
98%
92%
87% 80%
84%
0
10
20
30
40
50
60
70
80
90
100
0 6 12 18 24 30 36 42 48 54 60 66
MCR
CCR
CHR
96%
85%
69%
CCR = complete cytogenetic response.
Druker BJ, et al. N Engl J Med. 2006;355:2408-2417.
CCR IM = 68%
IFN/Ara-c = 7%
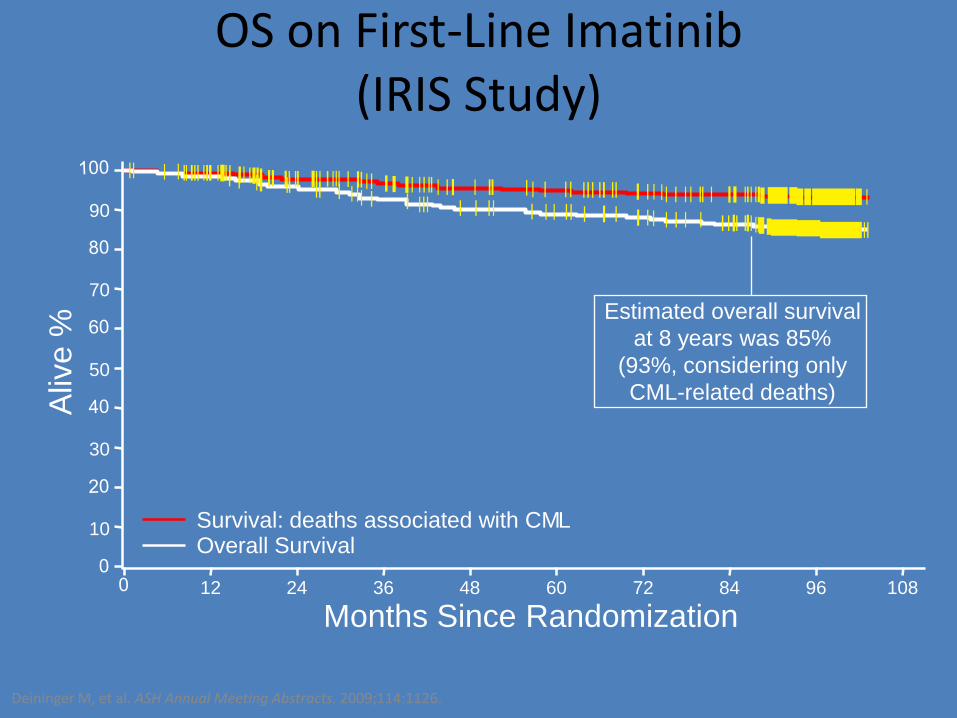
OS on First-Line Imatinib (IRIS Study)
Deininger M, et al. ASH Annual Meeting Abstracts. 2009;114:1126.
Months Since Randomization
Aliv
e %
12 24 36 48 60 72 84
Survival: deaths associated with CM L Overall Survival
96 108
10
30
50
70
90
Estimated overall survival
at 8 years was 85%
(93%, considering only
CML-related deaths)
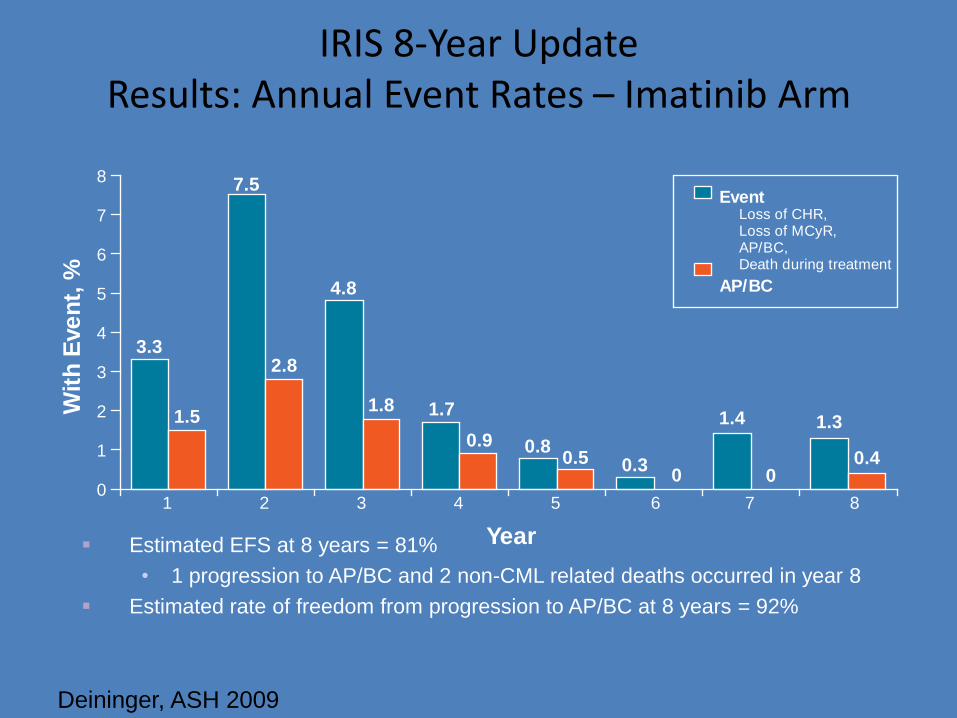
IRIS 8-Year Update Results: Annual Event Rates – Imatinib Arm
Estimated EFS at 8 years = 81%
• 1 progression to AP/BC and 2 non-CML related deaths occurred in year 8
Estimated rate of freedom from progression to AP/BC at 8 years = 92%
Wit
hE
ve
nt,
%
3.3
7.5
4.8
1.7
0.80.3
1.4 1.31.5
2.8
1.8
0.90.5
0 00.4
0
1
2
3
4
5
6
7
8
1 2 3 4 5 6 7 8
Year
EventLoss of CHR,Loss of MCyR,AP/BC,Death during treatment
AP/BC
Deininger, ASH 2009
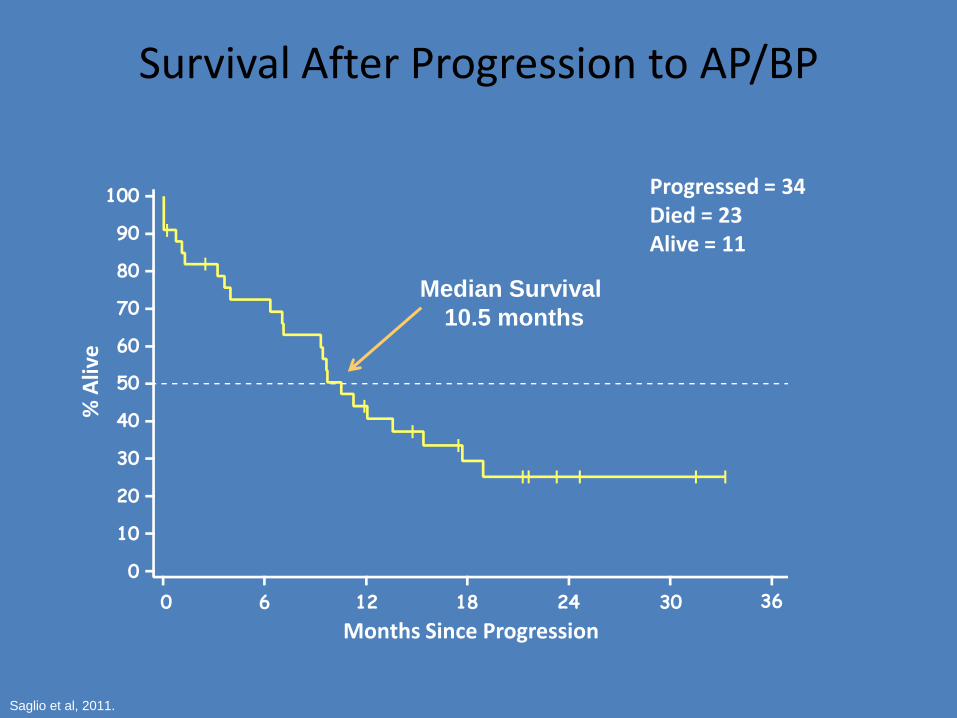
Survival After Progression to AP/BP %
Aliv
e
Months Since Progression
100
90
80
70
60
50
40
30
20
10
0
0 6 12 18 24 30 36
Median Survival
10.5 months
Progressed = 34 Died = 23 Alive = 11
Saglio et al, 2011.
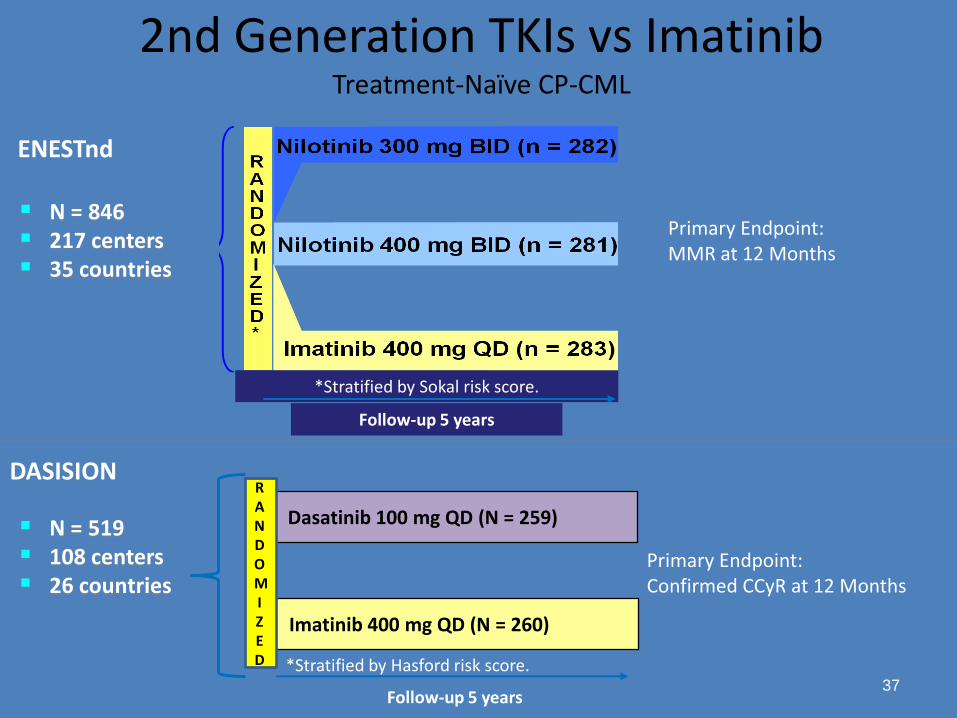
2nd Generation TKIs vs Imatinib Treatment-Naïve CP-CML
37
Primary Endpoint: MMR at 12 Months
ENESTnd
Follow-up 5 years
Imatinib 400 mg QD (N = 260)
Dasatinib 100 mg QD (N = 259) N = 519 108 centers 26 countries
*Stratified by Hasford risk score.
Primary Endpoint: Confirmed CCyR at 12 Months
DASISION RANDOMIZED
N = 846 217 centers 35 countries
*Stratified by Sokal risk score.
Follow-up 5 years
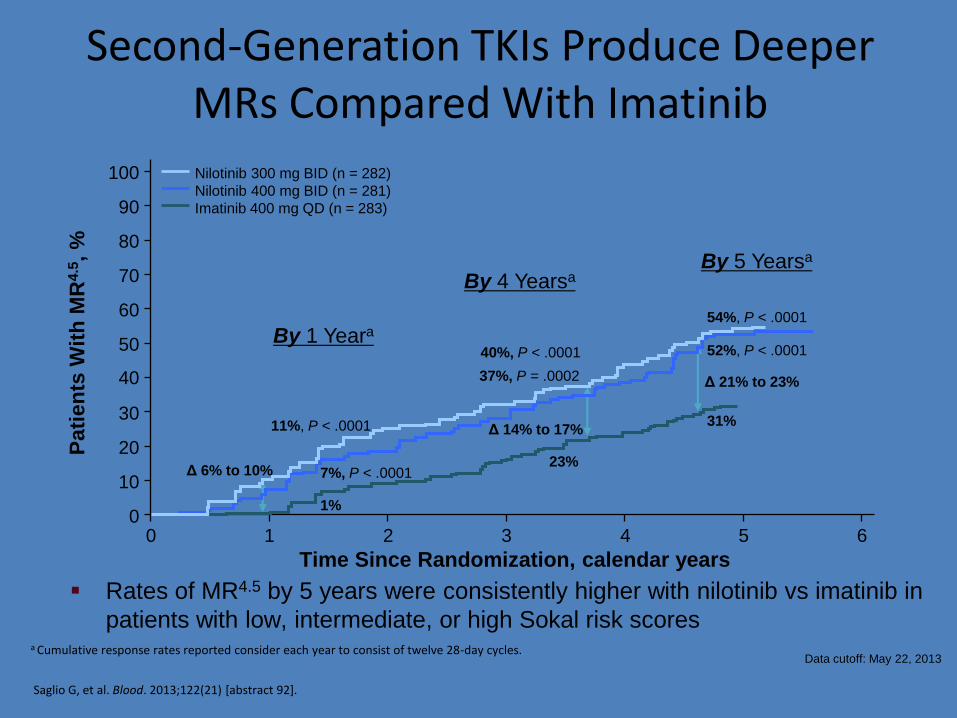
Rates of MR4.5 by 5 years were consistently higher with nilotinib vs imatinib in
patients with low, intermediate, or high Sokal risk scores
Second-Generation TKIs Produce Deeper MRs Compared With Imatinib
Data cutoff: May 22, 2013
By 5 Yearsa
11%, P < .0001
7%, P < .0001
1%
Δ 6% to 10%
31%
52%, P < .0001
54%, P < .0001
Δ 21% to 23%
By 4 Yearsa
40%, P < .0001
37%, P = .0002
23%
Δ 14% to 17%
100
0 2 6
90
80
70
60
50
40
30
20
10
0
Pati
en
ts W
ith
MR
4.5
, %
Time Since Randomization, calendar years 3 1
Nilotinib 300 mg BID (n = 282)
Nilotinib 400 mg BID (n = 281)
Imatinib 400 mg QD (n = 283)
4 5
By 1 Yeara
Saglio G, et al. Blood. 2013;122(21) [abstract 92].
a Cumulative response rates reported consider each year to consist of twelve 28-day cycles.
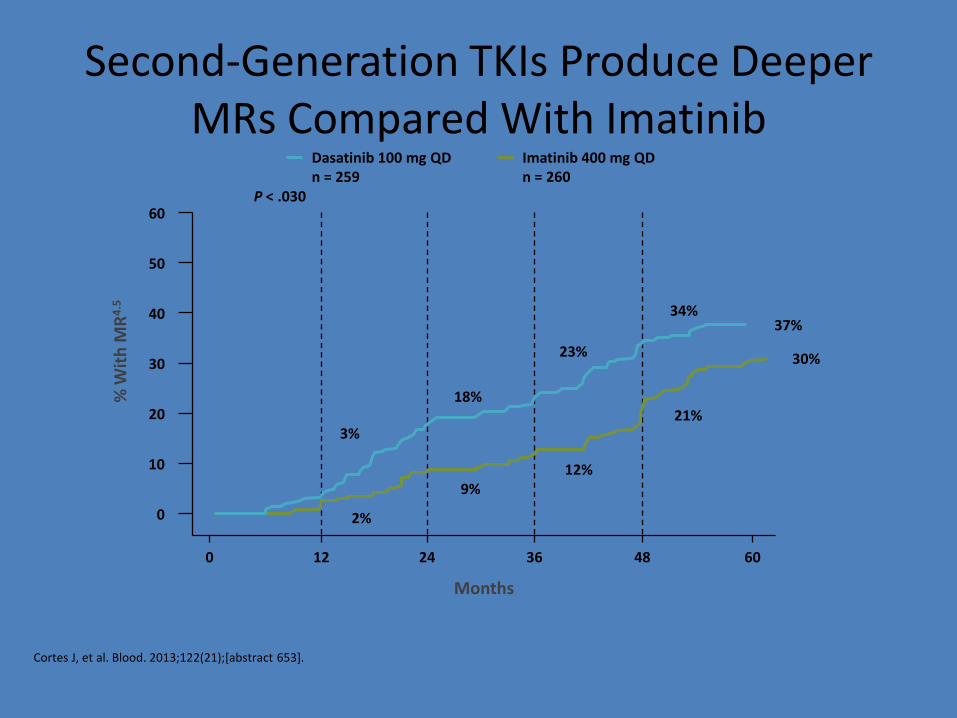
Second-Generation TKIs Produce Deeper MRs Compared With Imatinib
60
50
40
30
20
0
0 12 24 36 48 60
12%
21%
37%
P < .030
Months
% W
ith
MR
4.5
10
34%
3%
9%
2%
18%
23% 30%
Dasatinib 100 mg QD n = 259
Imatinib 400 mg QD n = 260
Cortes J, et al. Blood. 2013;122(21);[abstract 653].
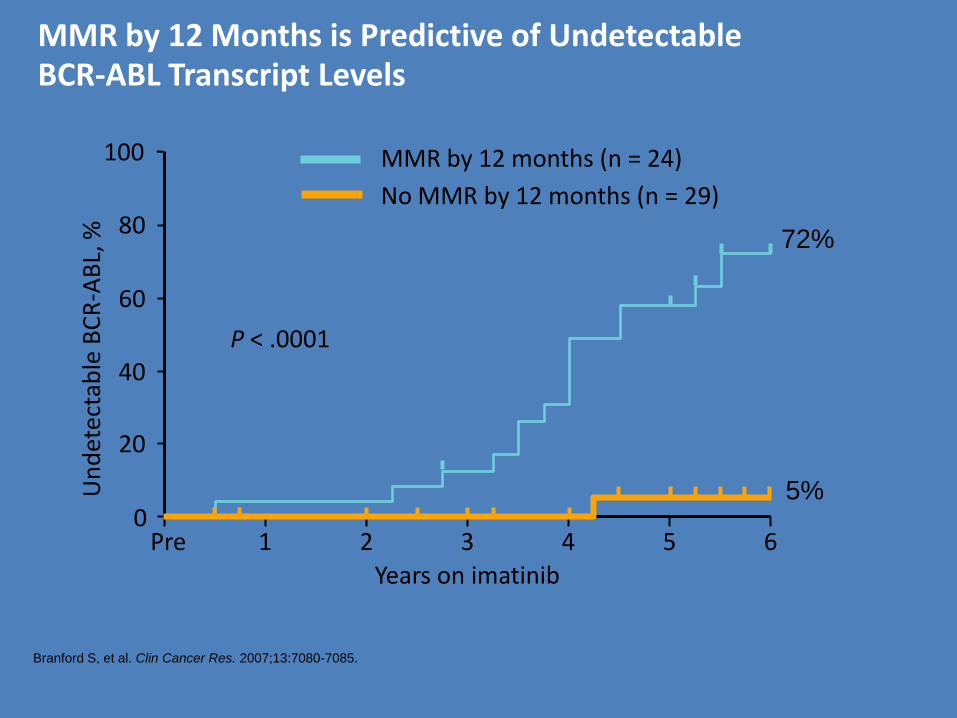
Branford S, et al. Clin Cancer Res. 2007;13:7080-7085.
Un
det
ecta
ble
BC
R-A
BL,
%
60
80
100
20
40
0
P < .0001
72%
1 2 3 4 5 6
Years on imatinib
5%
MMR by 12 months (n = 24)
No MMR by 12 months (n = 29)
Pre
MMR by 12 Months is Predictive of Undetectable BCR-ABL Transcript Levels
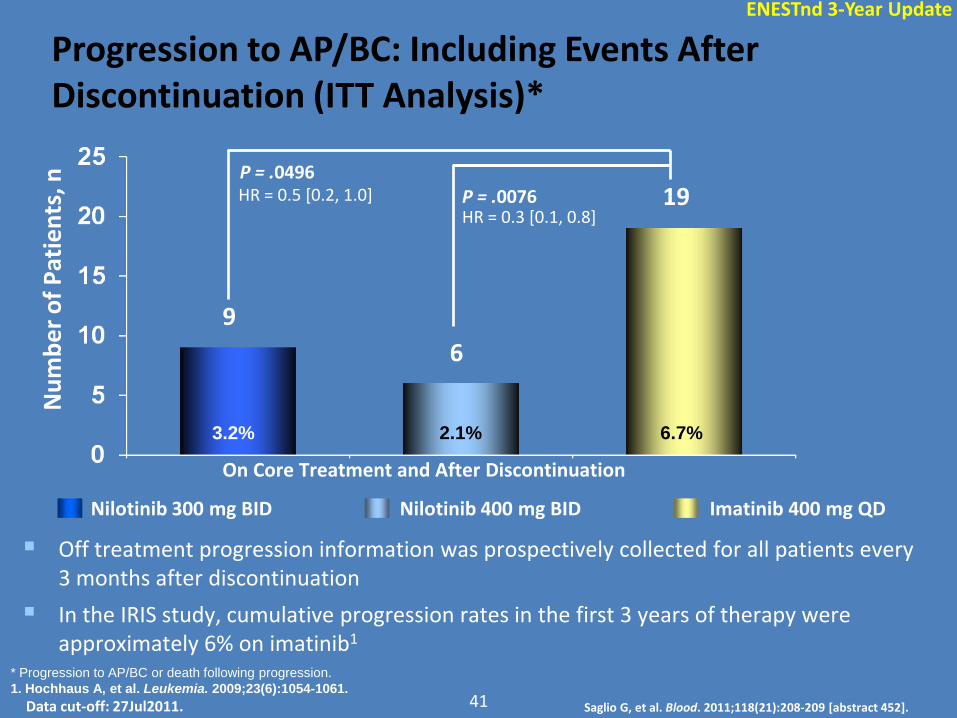
Progression to AP/BC: Including Events After Discontinuation (ITT Analysis)*
Nu
mb
er
of
Pat
ien
ts, n
On Core Treatment and After Discontinuation
Nilotinib 300 mg BID Nilotinib 400 mg BID Imatinib 400 mg QD
9
6
19 P = .0496
P = .0076
41
Off treatment progression information was prospectively collected for all patients every 3 months after discontinuation
In the IRIS study, cumulative progression rates in the first 3 years of therapy were approximately 6% on imatinib1
HR = 0.5 [0.2, 1.0] HR = 0.3 [0.1, 0.8]
3.2% 2.1% 6.7%
* Progression to AP/BC or death following progression.
1. Hochhaus A, et al. Leukemia. 2009;23(6):1054-1061.
Data cut-off: 27Jul2011.
ENESTnd 3-Year Update
Saglio G, et al. Blood. 2011;118(21):208-209 [abstract 452].
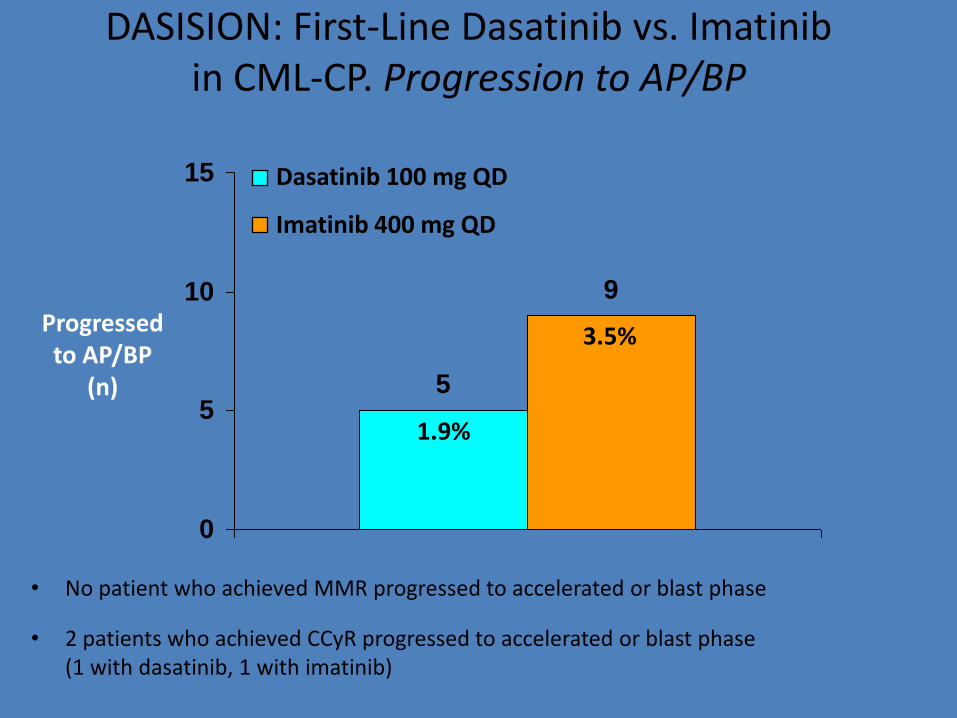
DASISION: First-Line Dasatinib vs. Imatinib in CML-CP. Progression to AP/BP
• No patient who achieved MMR progressed to accelerated or blast phase
• 2 patients who achieved CCyR progressed to accelerated or blast phase (1 with dasatinib, 1 with imatinib)
5
9
0
5
10
15
Progressed to AP/BP
(n)
3.5%
1.9%
Dasatinib 100 mg QD
Imatinib 400 mg QD
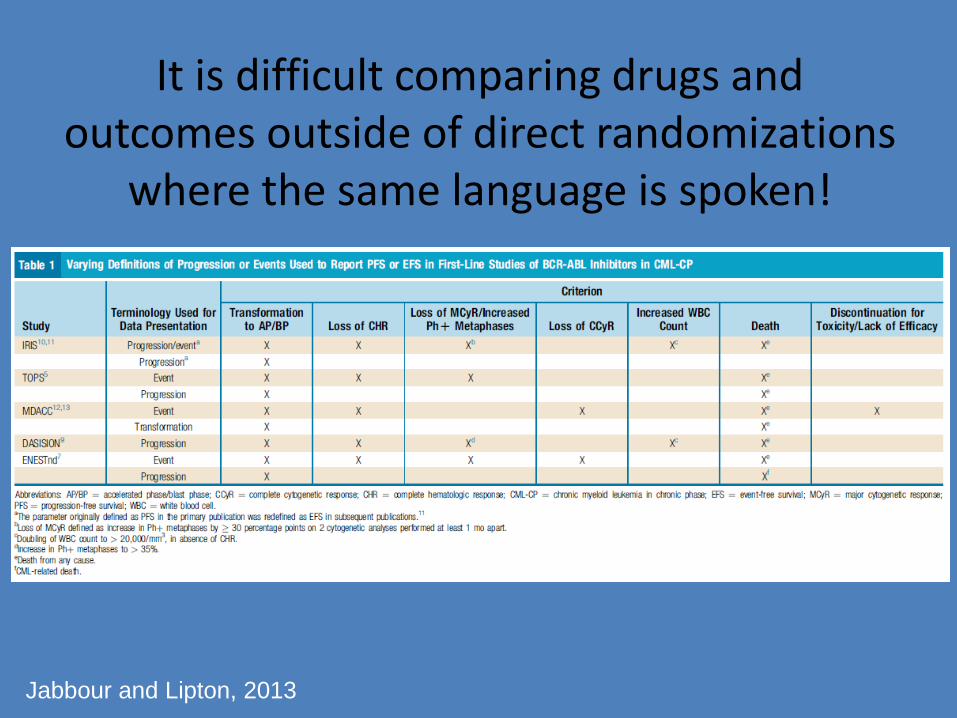
It is difficult comparing drugs and outcomes outside of direct randomizations
where the same language is spoken!
Jabbour and Lipton, 2013
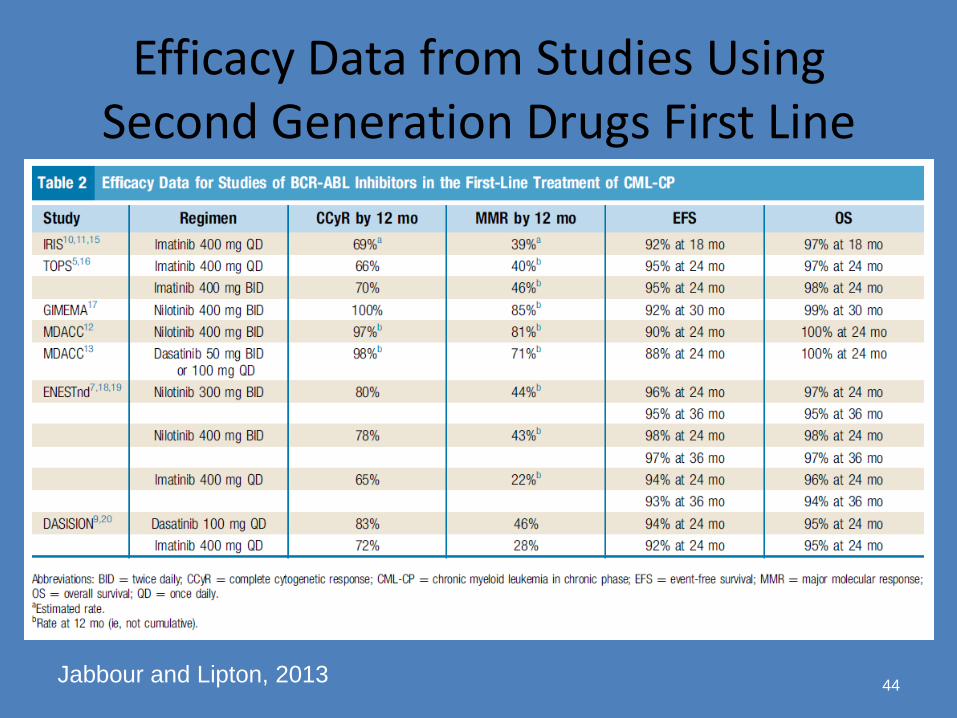
Efficacy Data from Studies Using Second Generation Drugs First Line
44 Jabbour and Lipton, 2013
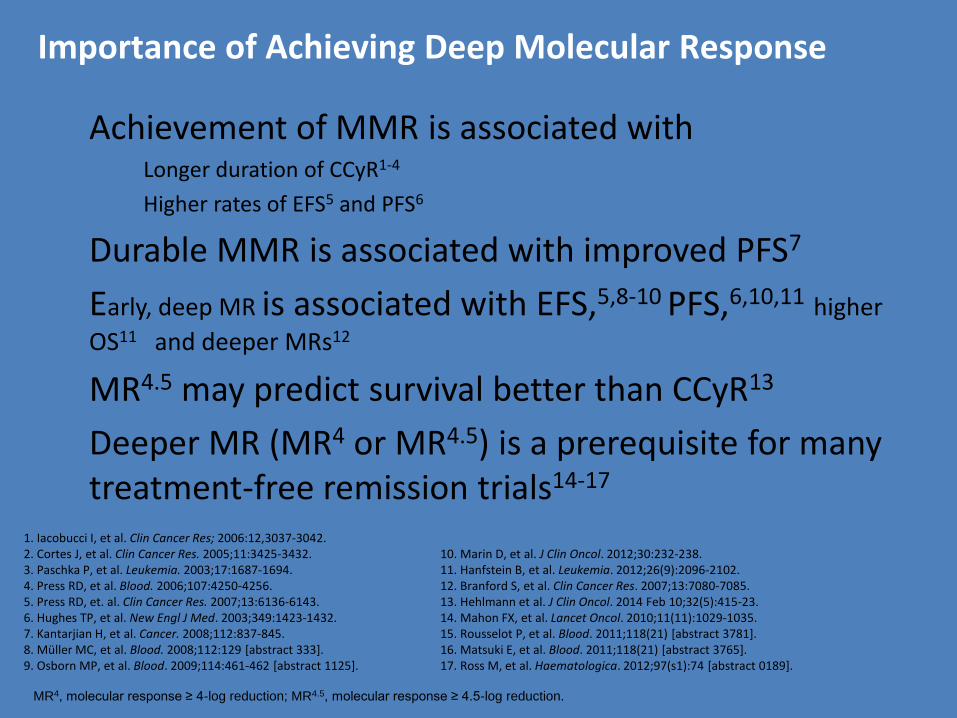
Achievement of MMR is associated with – Longer duration of CCyR1-4
– Higher rates of EFS5 and PFS6
Durable MMR is associated with improved PFS7
Early, deep MR is associated with EFS,5,8-10 PFS,6,10,11 higher
OS11 and deeper MRs12
MR4.5 may predict survival better than CCyR13
Deeper MR (MR4 or MR4.5) is a prerequisite for many treatment-free remission trials14-17
MR4, molecular response ≥ 4-log reduction; MR4.5, molecular response ≥ 4.5-log reduction.
1. Iacobucci I, et al. Clin Cancer Res; 2006:12,3037-3042. 2. Cortes J, et al. Clin Cancer Res. 2005;11:3425-3432. 3. Paschka P, et al. Leukemia. 2003;17:1687-1694. 4. Press RD, et al. Blood. 2006;107:4250-4256. 5. Press RD, et. al. Clin Cancer Res. 2007;13:6136-6143. 6. Hughes TP, et al. New Engl J Med. 2003;349:1423-1432. 7. Kantarjian H, et al. Cancer. 2008;112:837-845. 8. Müller MC, et al. Blood. 2008;112:129 [abstract 333]. 9. Osborn MP, et al. Blood. 2009;114:461-462 [abstract 1125].
10. Marin D, et al. J Clin Oncol. 2012;30:232-238. 11. Hanfstein B, et al. Leukemia. 2012;26(9):2096-2102. 12. Branford S, et al. Clin Cancer Res. 2007;13:7080-7085. 13. Hehlmann et al. J Clin Oncol. 2014 Feb 10;32(5):415-23. 14. Mahon FX, et al. Lancet Oncol. 2010;11(11):1029-1035. 15. Rousselot P, et al. Blood. 2011;118(21) [abstract 3781]. 16. Matsuki E, et al. Blood. 2011;118(21) [abstract 3765]. 17. Ross M, et al. Haematologica. 2012;97(s1):74 [abstract 0189].
Importance of Achieving Deep Molecular Response
So, you may ask, how do you choose which drug to use?
• Provincial or private payer guidelines and/or reimbursement may make this an easy choice
• A good initial history, physical and baseline bloodwork assessment may help define co-morbidities which make one drug preferable over another
• Lifestyle review including shift work and eating habits may help define a preferable drug
• At diagnosis, there are no response/resistance criteria to help with the decision
• For many patients, it will be like…
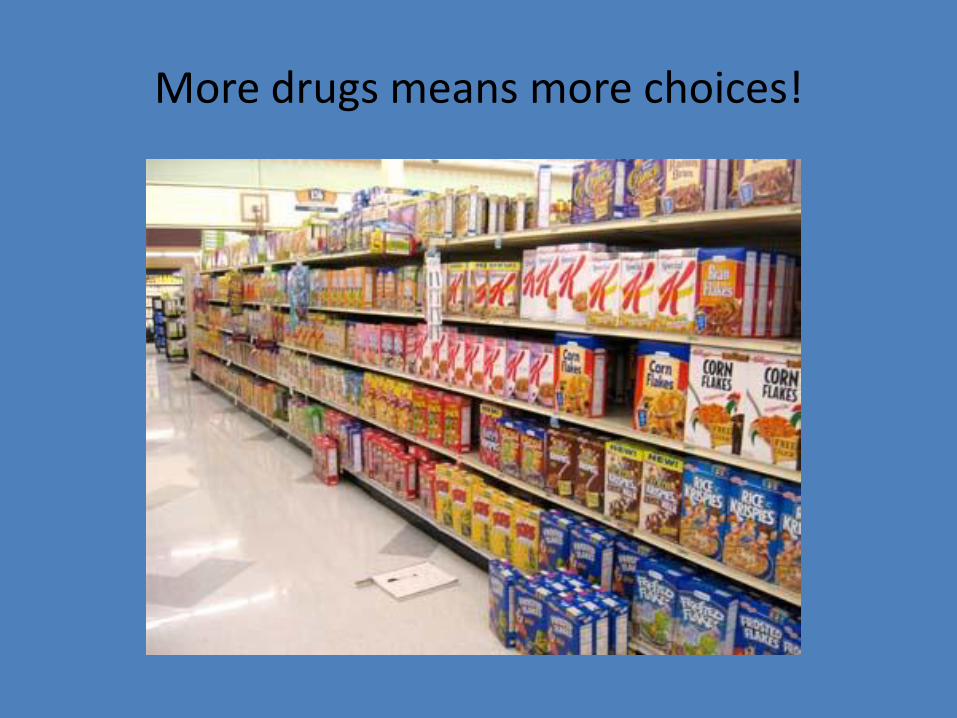
More drugs means more choices!
Monitoring
When we talk about monitoring…
• It is usually assumed that we are dealing with response to therapy
• Although this is in part correct, it is also important to check for
– Compliance
– Side effects that may influence compliance
– Additional medications that may have been changed or added by other treaters
Decisions based on monitoring visits include…
• Whether to continue with current management
• Whether to change management because of failed response
• Whether to change management because of side effects (INTOLERANCE)
– Dosing change
– Drug change
• Whether discontinuation of therapy on protocol for those with deepest responses
Therapy Efficacy Monitoring
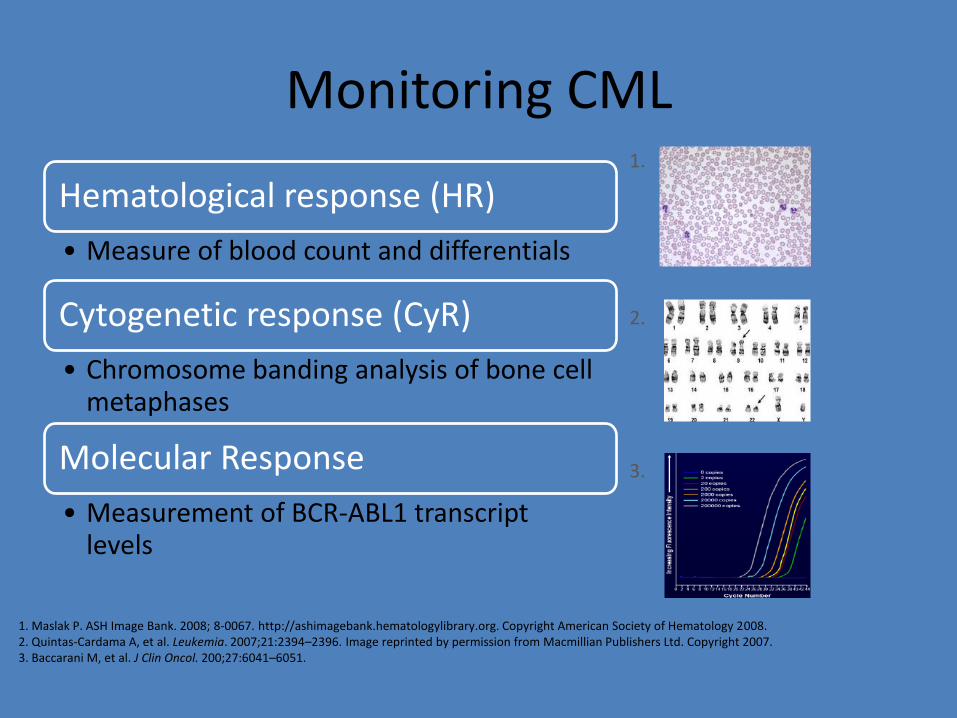
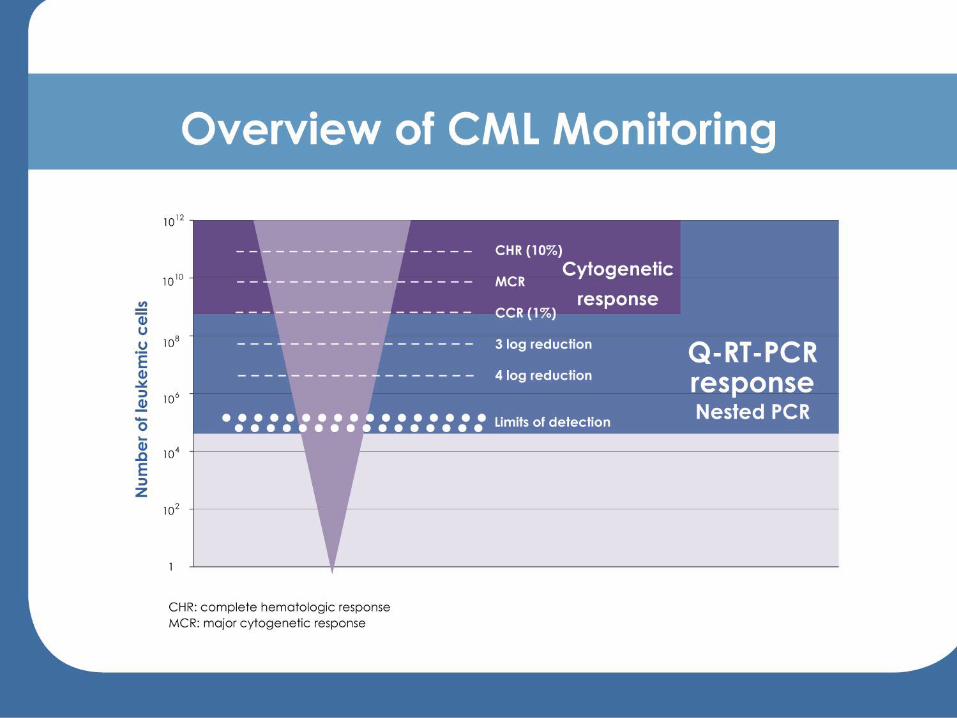
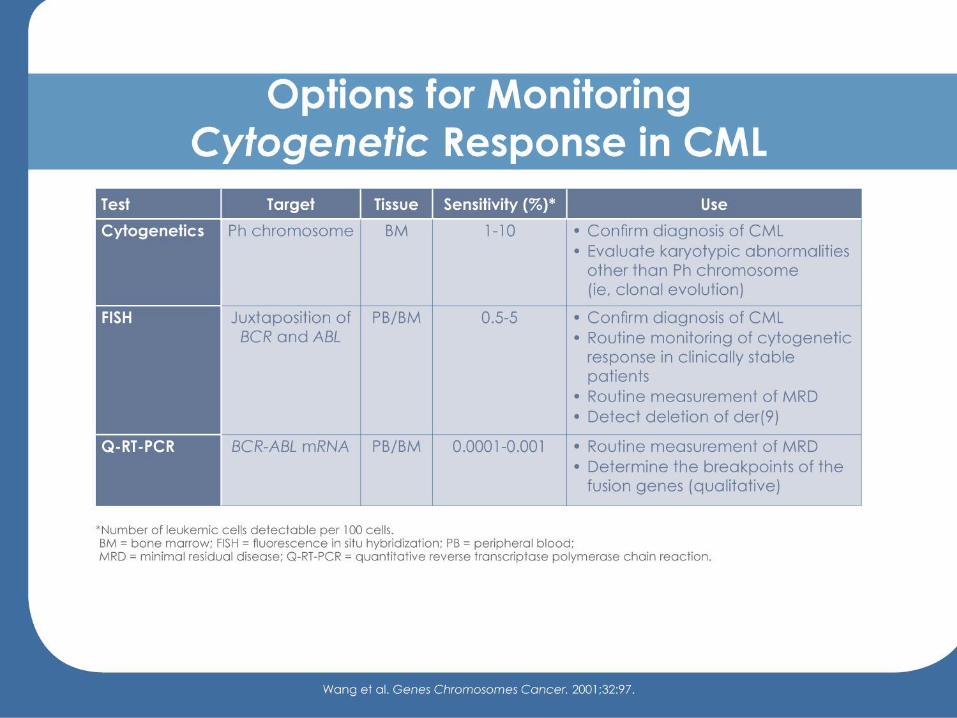
Monitoring CML
Hematological response (HR)
• Measure of blood count and differentials
Cytogenetic response (CyR)
• Chromosome banding analysis of bone cell metaphases
Molecular Response
• Measurement of BCR-ABL1 transcript levels
1.
2.
3.
1. Maslak P. ASH Image Bank. 2008; 8-0067. http://ashimagebank.hematologylibrary.org. Copyright American Society of Hematology 2008. 2. Quintas-Cardama A, et al. Leukemia. 2007;21:2394–2396. Image reprinted by permission from Macmillian Publishers Ltd. Copyright 2007. 3. Baccarani M, et al. J Clin Oncol. 200;27:6041–6051.
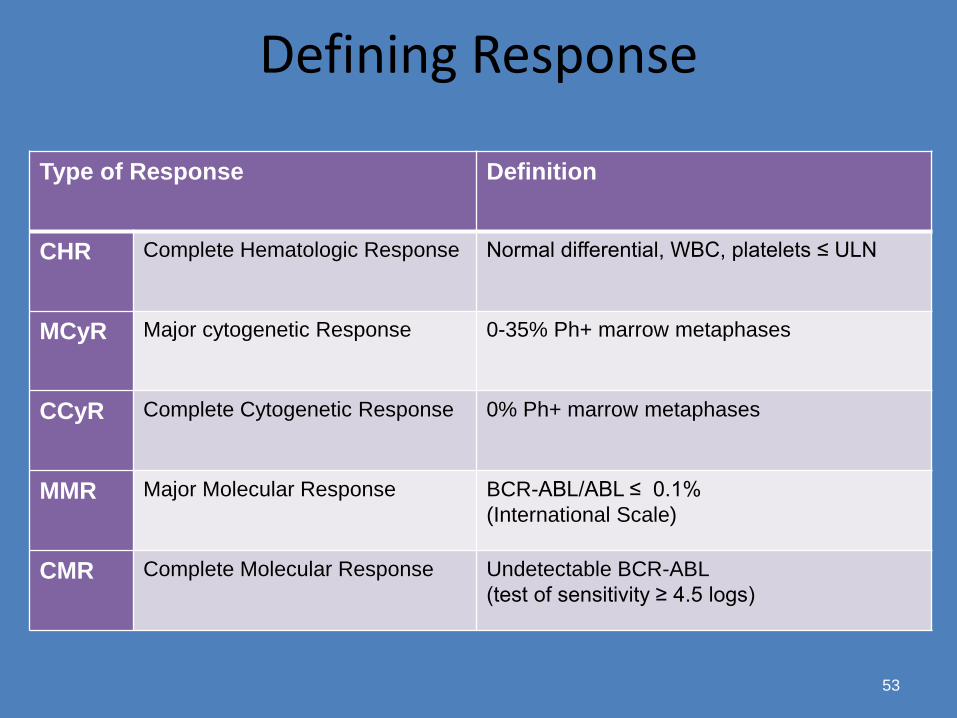
Defining Response
53
Type of Response Definition
CHR Complete Hematologic Response Normal differential, WBC, platelets ≤ ULN
MCyR Major cytogenetic Response 0-35% Ph+ marrow metaphases
CCyR Complete Cytogenetic Response 0% Ph+ marrow metaphases
MMR Major Molecular Response BCR-ABL/ABL ≤ 0.1%
(International Scale)
CMR Complete Molecular Response Undetectable BCR-ABL
(test of sensitivity ≥ 4.5 logs)
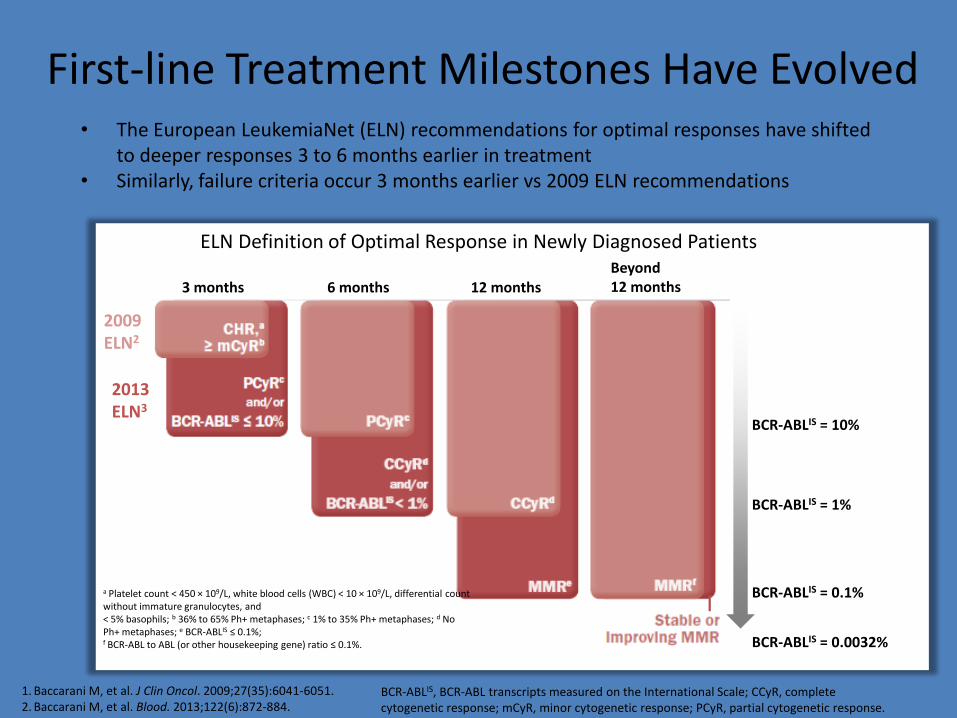
First-line Treatment Milestones Have Evolved • The European LeukemiaNet (ELN) recommendations for optimal responses have shifted
to deeper responses 3 to 6 months earlier in treatment • Similarly, failure criteria occur 3 months earlier vs 2009 ELN recommendations
1. Baccarani M, et al. J Clin Oncol. 2009;27(35):6041-6051. 2. Baccarani M, et al. Blood. 2013;122(6):872-884.
2009 ELN2
2013 ELN3
BCR-ABLIS = 10%
a Platelet count < 450 × 109/L, white blood cells (WBC) < 10 × 109/L, differential count without immature granulocytes, and < 5% basophils; b 36% to 65% Ph+ metaphases; c 1% to 35% Ph+ metaphases; d No Ph+ metaphases; e BCR-ABLIS ≤ 0.1%; f BCR-ABL to ABL (or other housekeeping gene) ratio ≤ 0.1%.
BCR-ABLIS, BCR-ABL transcripts measured on the International Scale; CCyR, complete cytogenetic response; mCyR, minor cytogenetic response; PCyR, partial cytogenetic response.
BCR-ABLIS = 1%
BCR-ABLIS = 0.1%
BCR-ABLIS = 0.0032%
ELN Definition of Optimal Response in Newly Diagnosed Patients
3 months 6 months 12 months Beyond 12 months
1012
1011
1010
109
108
107
106
Number of leukaemic cells
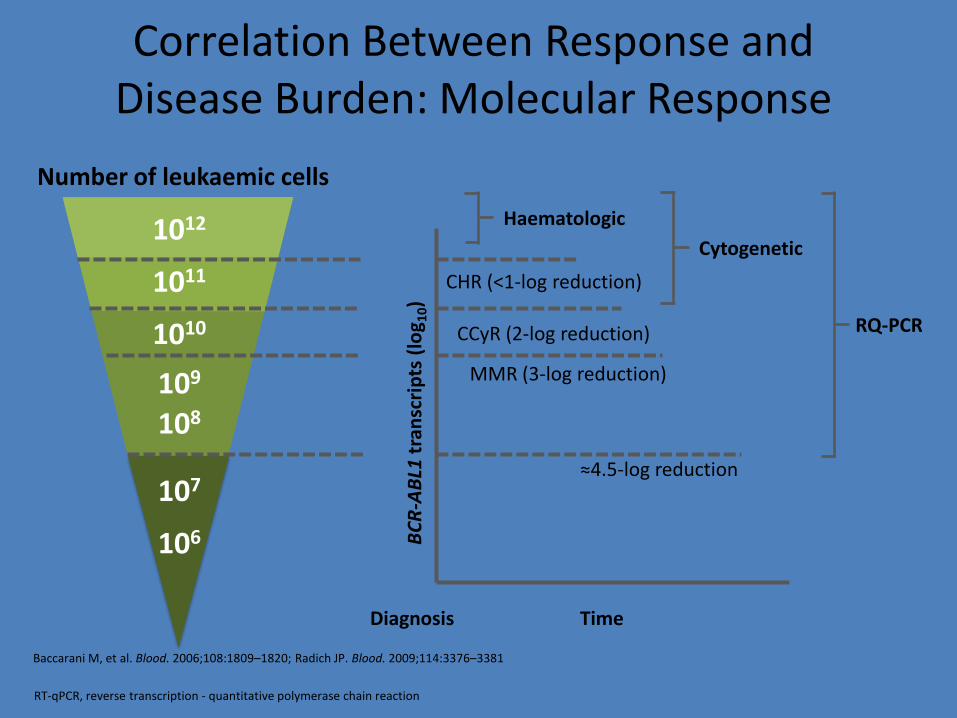
CHR (<1-log reduction)
CCyR (2-log reduction)
MMR (3-log reduction)
≈4.5-log reduction
Time Diagnosis
BC
R-A
BL1
tra
nsc
rip
ts (
log 1
0)
Haematologic
Cytogenetic
Baccarani M, et al. Blood. 2006;108:1809–1820; Radich JP. Blood. 2009;114:3376–3381
Correlation Between Response and Disease Burden: Molecular Response
RT-qPCR, reverse transcription - quantitative polymerase chain reaction
RQ-PCR
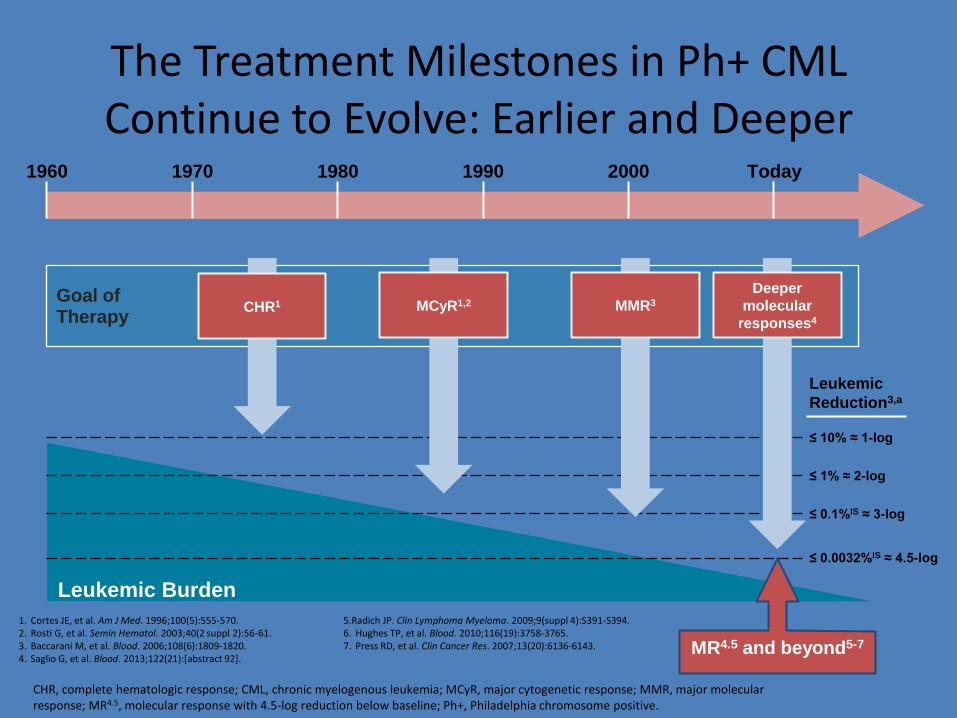
The Treatment Milestones in Ph+ CML Continue to Evolve: Earlier and Deeper
≤ 1% ≈ 2-log
≤ 10% ≈ 1-log
≤ 0.1%IS ≈ 3-log
Goal of Therapy
CHR1 MCyR1,2 MMR3
MR4.5 and beyond5-7
Deeper
molecular
responses4
1970 2000 1990 1980 1960 Today
Leukemic Burden
1. Cortes JE, et al. Am J Med. 1996;100(5):555-570. 2. Rosti G, et al. Semin Hematol. 2003;40(2 suppl 2):56-61. 3. Baccarani M, et al. Blood. 2006;108(6):1809-1820. 4. Saglio G, et al. Blood. 2013;122(21):[abstract 92].
Leukemic
Reduction3,a
≤ 0.0032%IS ≈ 4.5-log
5.Radich JP. Clin Lymphoma Myeloma. 2009;9(suppl 4):S391-S394. 6. Hughes TP, et al. Blood. 2010;116(19):3758-3765. 7. Press RD, et al. Clin Cancer Res. 2007;13(20):6136-6143.
CHR, complete hematologic response; CML, chronic myelogenous leukemia; MCyR, major cytogenetic response; MMR, major molecular response; MR4.5, molecular response with 4.5-log reduction below baseline; Ph+, Philadelphia chromosome positive.
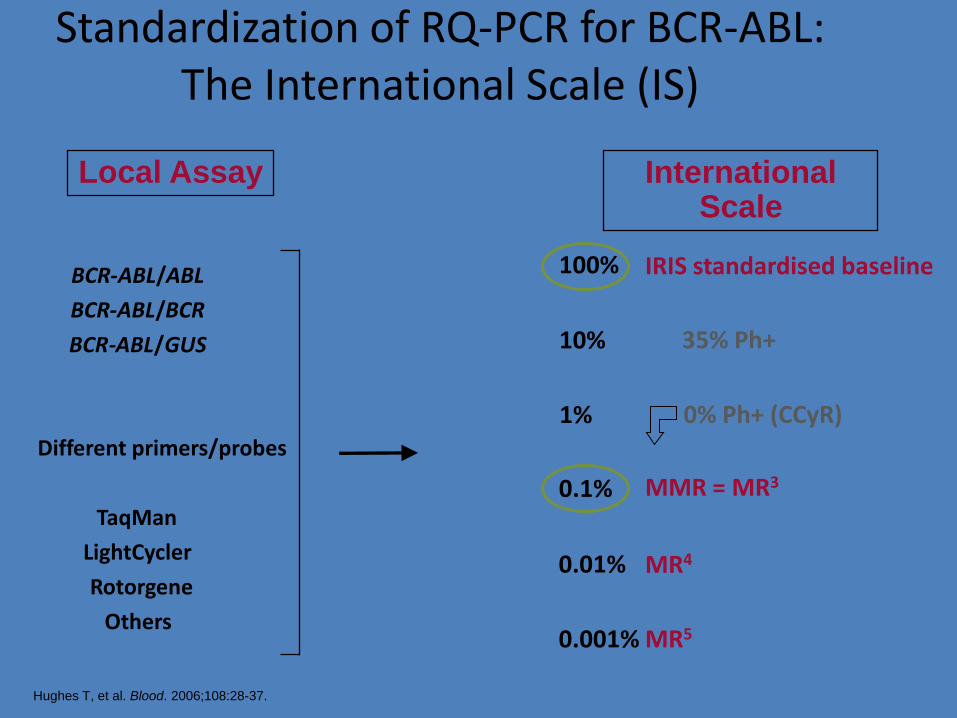
0.1%
1%
0.01%
10%
0.001%
100%
International Scale
Local Assay
BCR - ABL / ABL
BCR - ABL / BCR
BCR - ABL / GUS
Different primers/probes
TaqMan
LightCycler
Rotorgene
Others
IRIS standardised baseline
MR4
MR5
MMR = MR3
0% Ph+ (CCyR)
35% Ph+
Standardization of RQ-PCR for BCR-ABL: The International Scale (IS)
Hughes T, et al. Blood. 2006;108:28-37.
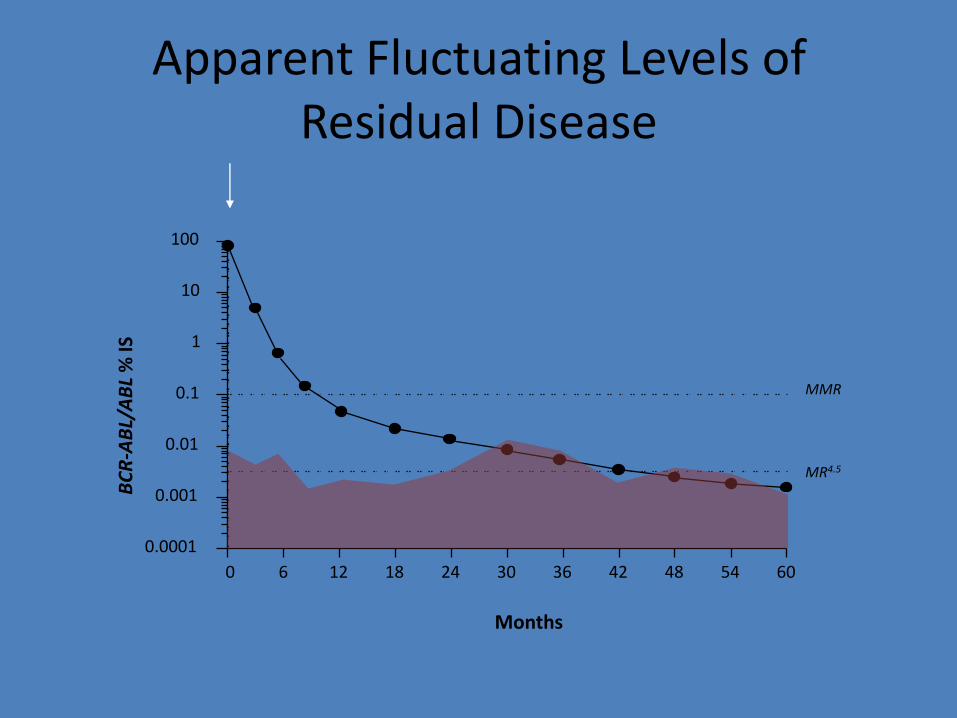
Apparent Fluctuating Levels of Residual Disease
0 12 18 24 30 36 42 48 54 60
0.0001
0.001
0.01
0.1
1
10
100
BC
R-A
BL/
AB
L %
IS
Months
MMR
MR4.5
6
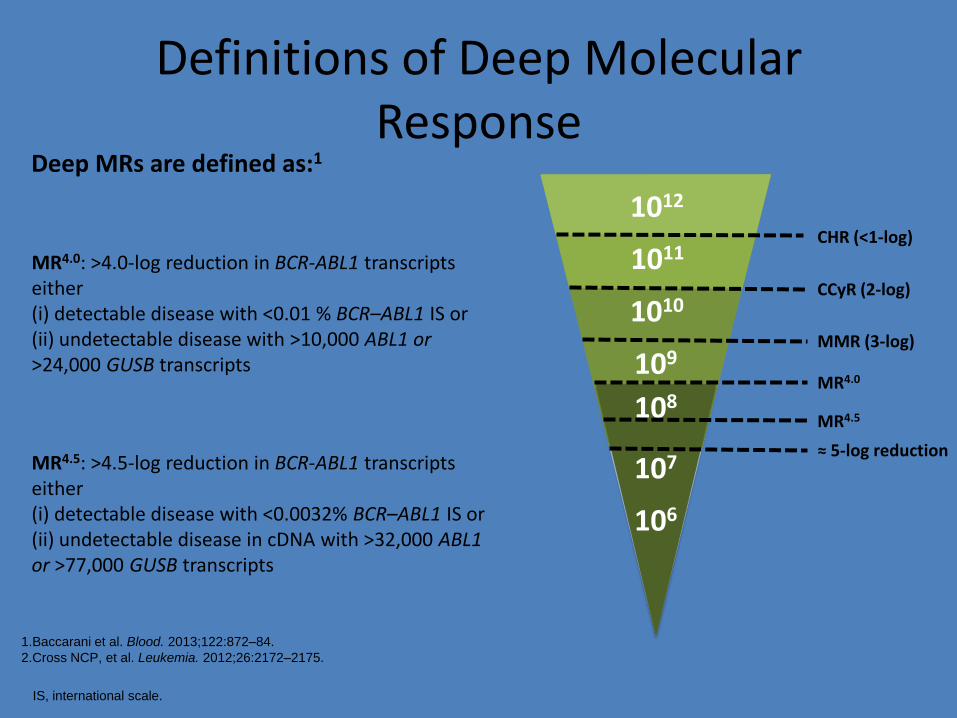
Definitions of Deep Molecular Response
1.Baccarani et al. Blood. 2013;122:872–84.
2.Cross NCP, et al. Leukemia. 2012;26:2172–2175.
MR4.0
MR4.5
1012
1011
1010
109
≈ 5-log reduction
CCyR (2-log)
MMR (3-log)
CHR (<1-log)
108
107
106
MR4.0: >4.0-log reduction in BCR-ABL1 transcripts either (i) detectable disease with <0.01 % BCR–ABL1 IS or (ii) undetectable disease with >10,000 ABL1 or >24,000 GUSB transcripts
MR4.5: >4.5-log reduction in BCR-ABL1 transcripts either (i) detectable disease with <0.0032% BCR–ABL1 IS or (ii) undetectable disease in cDNA with >32,000 ABL1 or >77,000 GUSB transcripts
Deep MRs are defined as:1
IS, international scale.
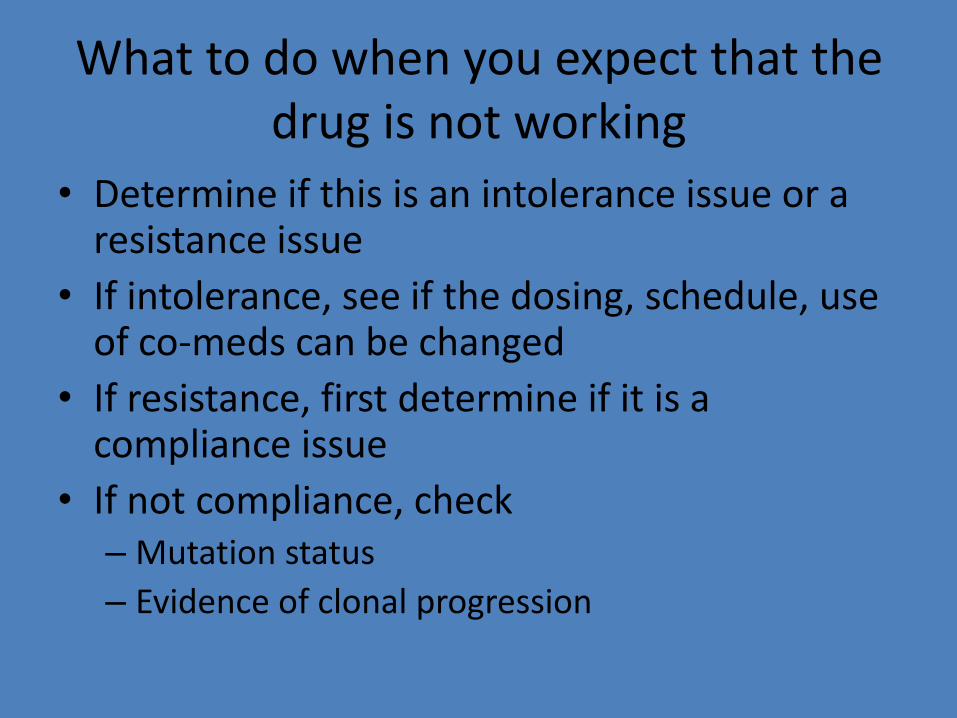
What to do when you expect that the drug is not working
• Determine if this is an intolerance issue or a resistance issue
• If intolerance, see if the dosing, schedule, use of co-meds can be changed
• If resistance, first determine if it is a compliance issue
• If not compliance, check – Mutation status
– Evidence of clonal progression
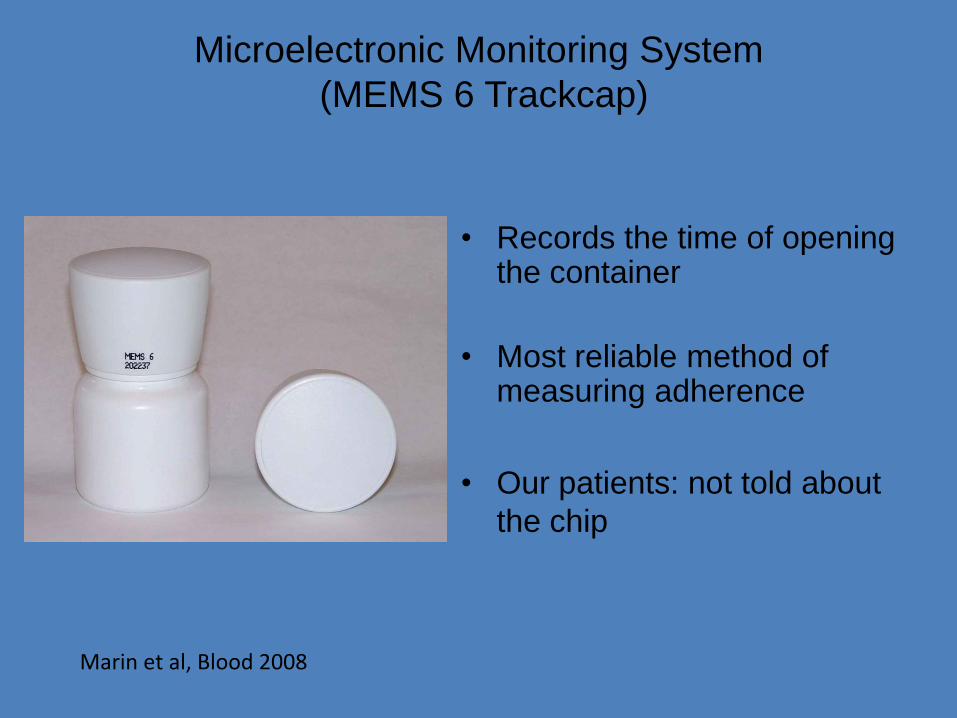
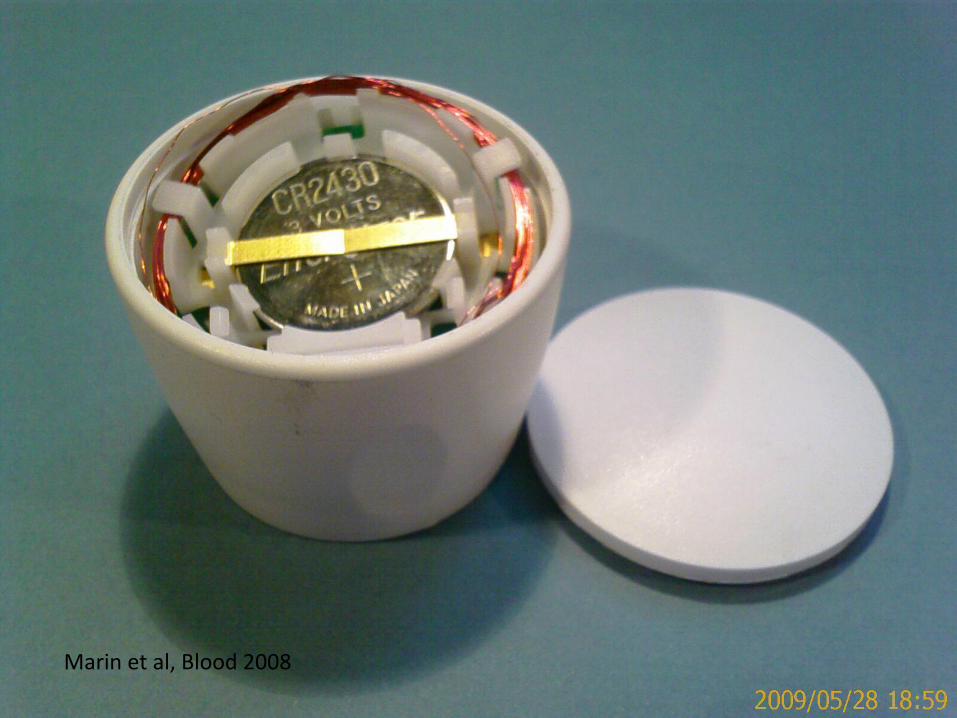
Microelectronic Monitoring System
(MEMS 6 Trackcap)
• Records the time of opening the container
• Most reliable method of measuring adherence
• Our patients: not told about
the chip
Marin et al, Blood 2008
Marin et al, Blood 2008
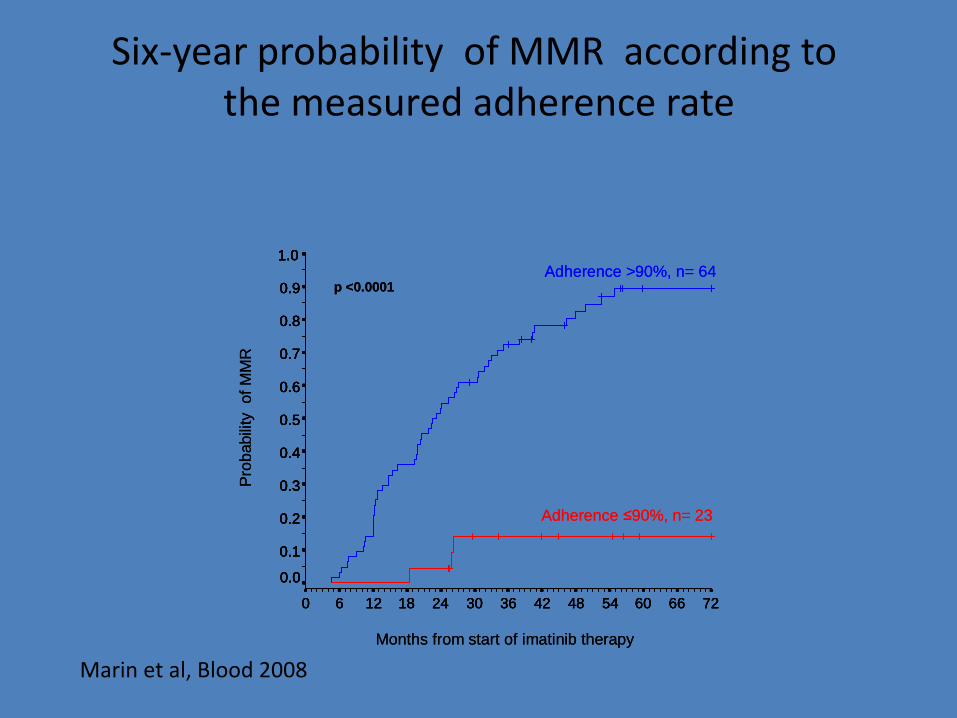
Six-year probability of MMR according to the measured adherence rate
726660544842363024181260
1.0
0.9
0.8
0.7
0.6
0.5
0.4
0.3
0.2
0.1
0.0
Months from start of imatinib therapy
Pro
babili
ty
of
MM
R
Adherence >90%, n= 64
Adherence ≤90%, n= 23
p <0.0001
726660544842363024181260
1.0
0.9
0.8
0.7
0.6
0.5
0.4
0.3
0.2
0.1
0.0
726660544842363024181260 726660544842363024181260
1.0
0.9
0.8
0.7
0.6
0.5
0.4
0.3
0.2
0.1
0.0
1.0
0.9
0.8
0.7
0.6
0.5
0.4
0.3
0.2
0.1
0.0
1.0
0.9
0.8
0.7
0.6
0.5
0.4
0.3
0.2
0.1
0.0
Months from start of imatinib therapy
Pro
babili
ty
of
MM
R
Adherence >90%, n= 64
Adherence ≤90%, n= 23
p <0.0001
Marin et al, Blood 2008
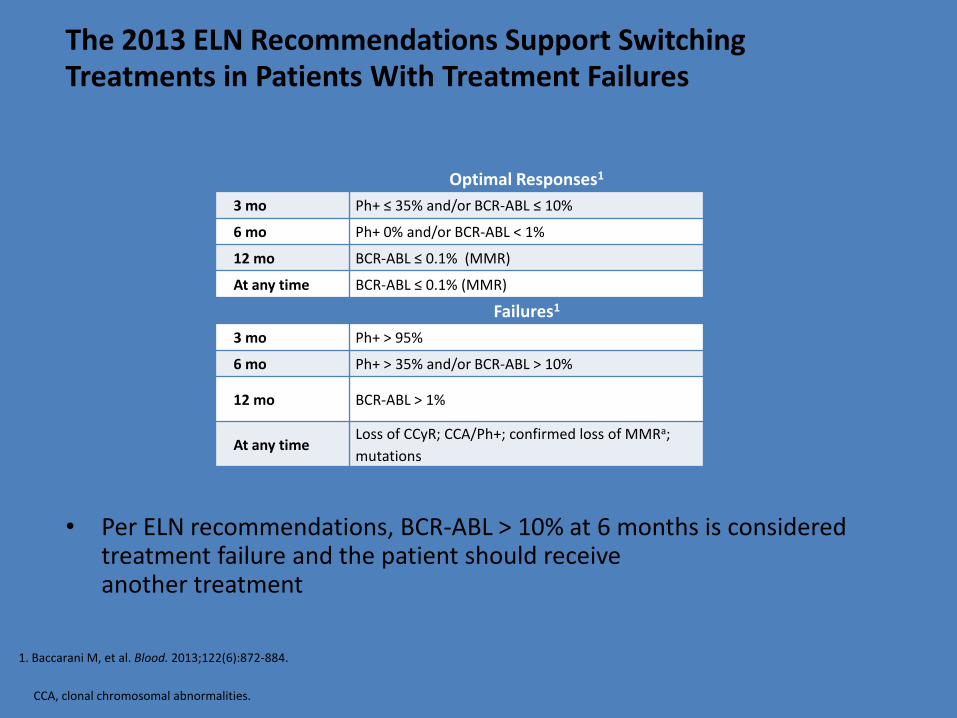
• Per ELN recommendations, BCR-ABL > 10% at 6 months is considered treatment failure and the patient should receive another treatment
Optimal Responses1
3 mo Ph+ ≤ 35% and/or BCR-ABL ≤ 10%
6 mo Ph+ 0% and/or BCR-ABL < 1%
12 mo BCR-ABL ≤ 0.1% (MMR)
At any time BCR-ABL ≤ 0.1% (MMR)
Failures1
3 mo Ph+ > 95%
6 mo Ph+ > 35% and/or BCR-ABL > 10%
12 mo BCR-ABL > 1%
At any time Loss of CCyR; CCA/Ph+; confirmed loss of MMRa;
mutations
1. Baccarani M, et al. Blood. 2013;122(6):872-884.
The 2013 ELN Recommendations Support Switching Treatments in Patients With Treatment Failures
CCA, clonal chromosomal abnormalities.
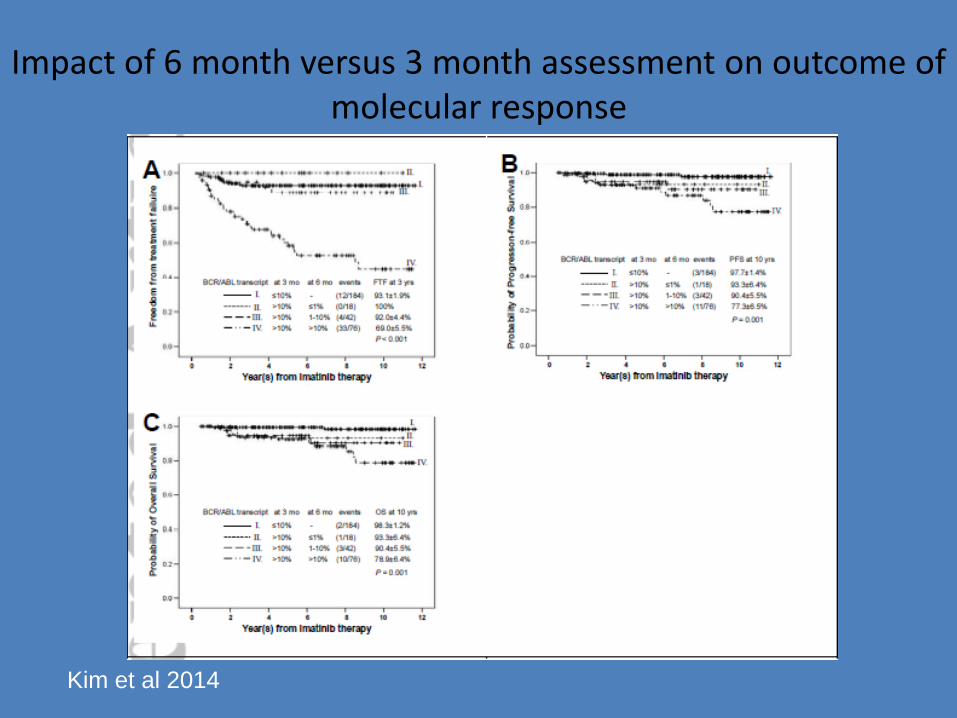
Impact of 6 month versus 3 month assessment on outcome of molecular response
Kim et al 2014
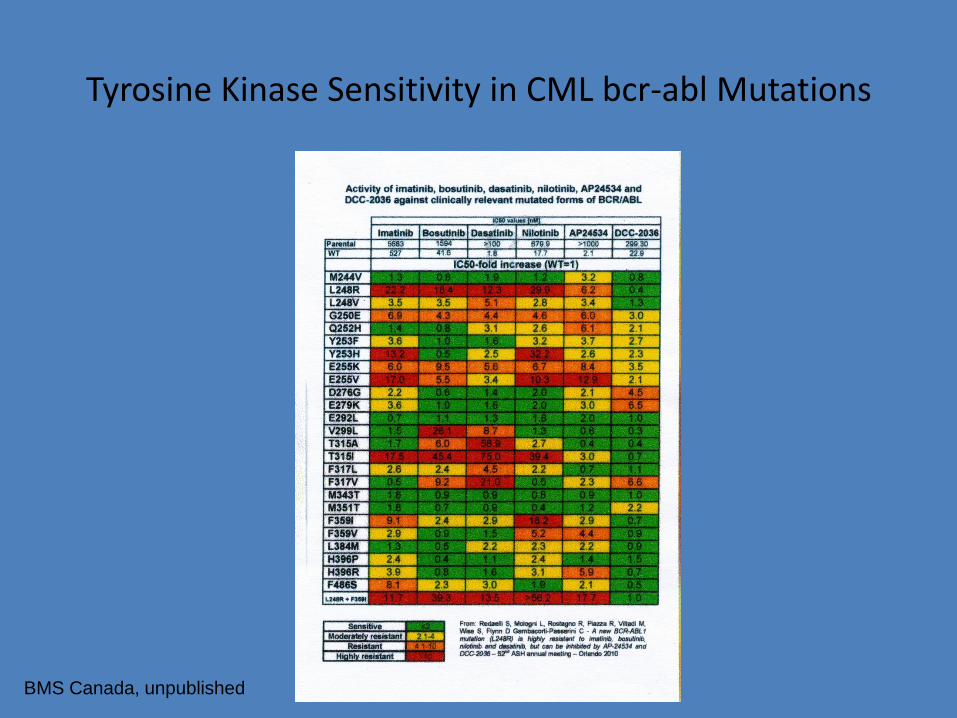
Tyrosine Kinase Sensitivity in CML bcr-abl Mutations
BMS Canada, unpublished
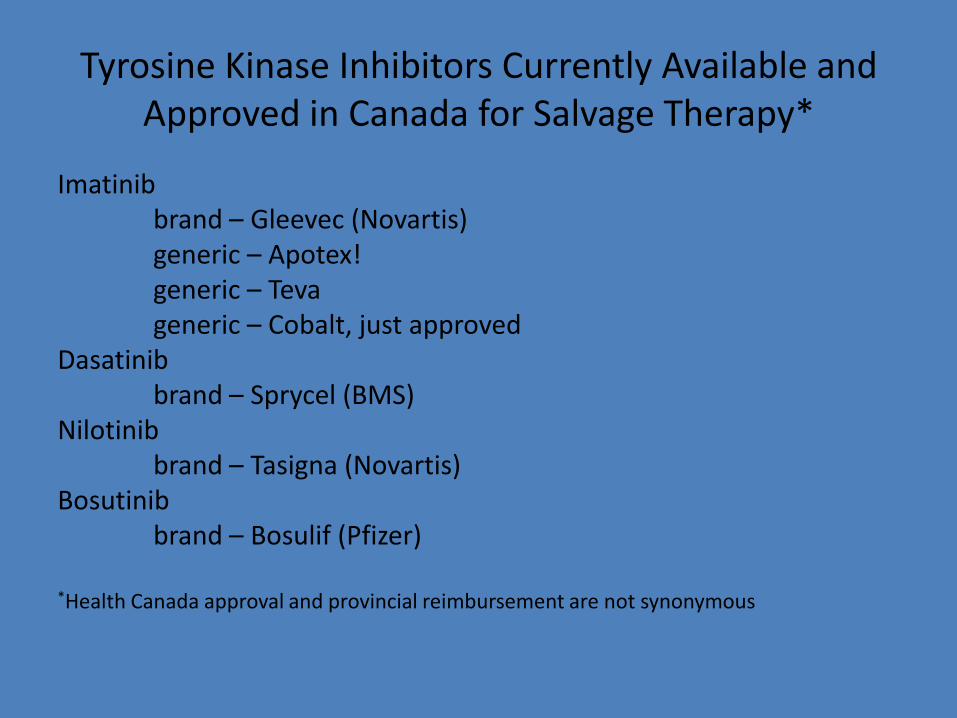
Tyrosine Kinase Inhibitors Currently Available and Approved in Canada for Salvage Therapy*
Imatinib brand – Gleevec (Novartis) generic – Apotex! generic – Teva generic – Cobalt, just approved Dasatinib brand – Sprycel (BMS) Nilotinib brand – Tasigna (Novartis) Bosutinib brand – Bosulif (Pfizer) *Health Canada approval and provincial reimbursement are not synonymous
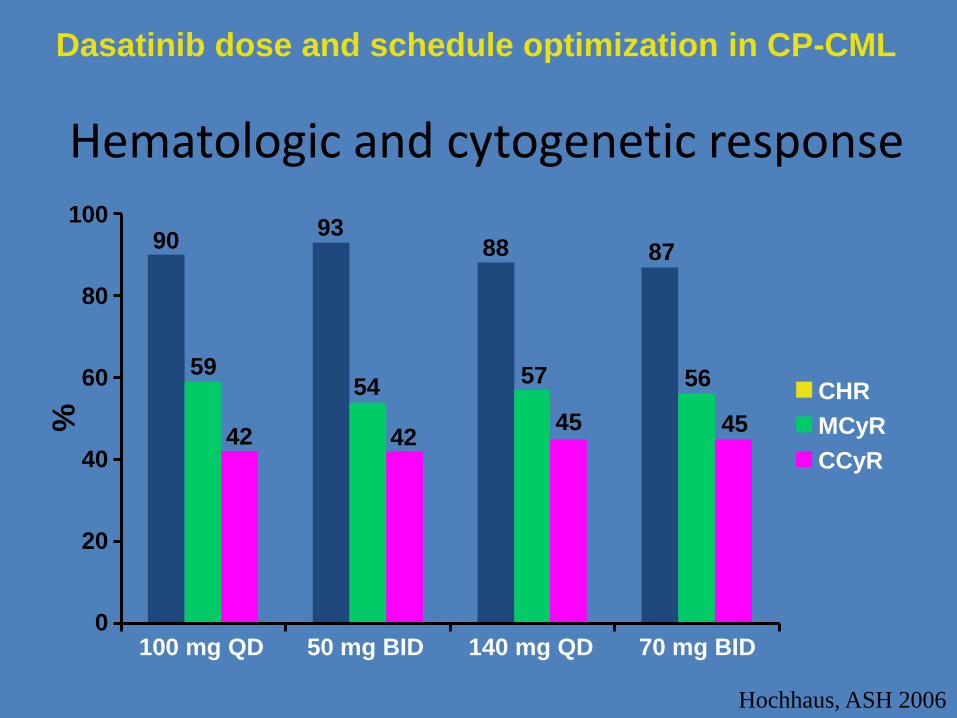
Hematologic and cytogenetic response
100 mg QD 50 mg BID 140 mg QD 70 mg BID
CHR
MCyR
CCyR
100
80
60
40
20
0
90 93
88 87
42 42 45 45
59 57 56 54
%
Dasatinib dose and schedule optimization in CP-CML
Hochhaus, ASH 2006
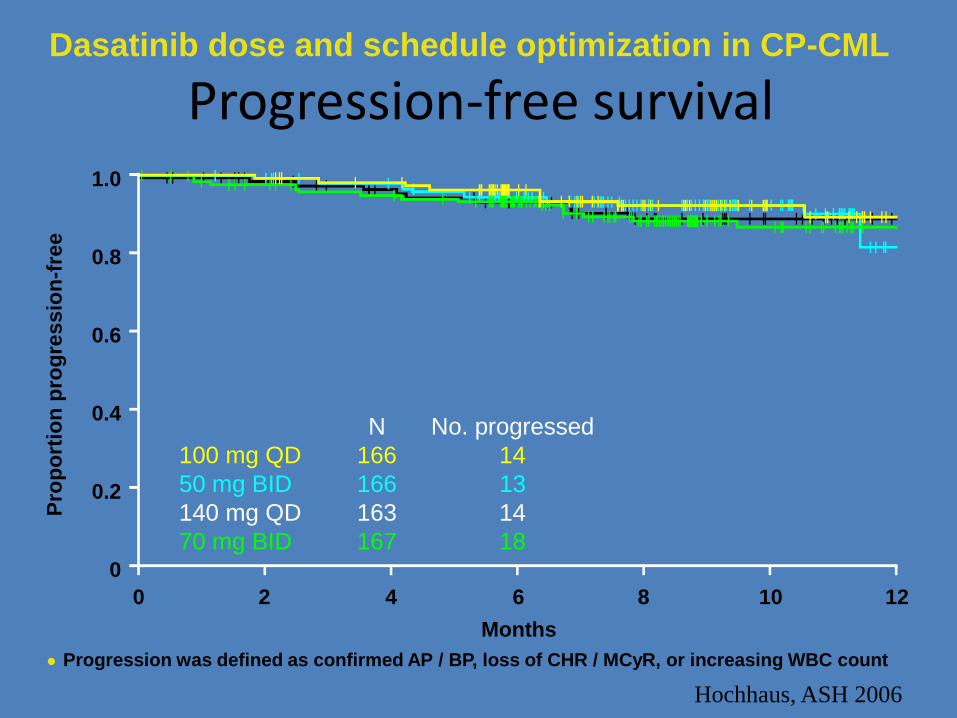
Progression-free survival
● Progression was defined as confirmed AP / BP, loss of CHR / MCyR, or increasing WBC count
N No. progressed
100 mg QD 166 14
50 mg BID 166 13
140 mg QD 163 14
70 mg BID 167 18
0 2 4 6 8 10 12
Months
Pro
po
rtio
n p
rog
ress
ion
-fre
e
1.0
0.8
0.6
0.4
0.2
0
Dasatinib dose and schedule optimization in CP-CML
Hochhaus, ASH 2006
78% 64%
Months Since Start of Treatment
Wit
ho
ut
Pro
gre
ssio
n, %
Total = 321
Failed = 88
lll = Censored observations
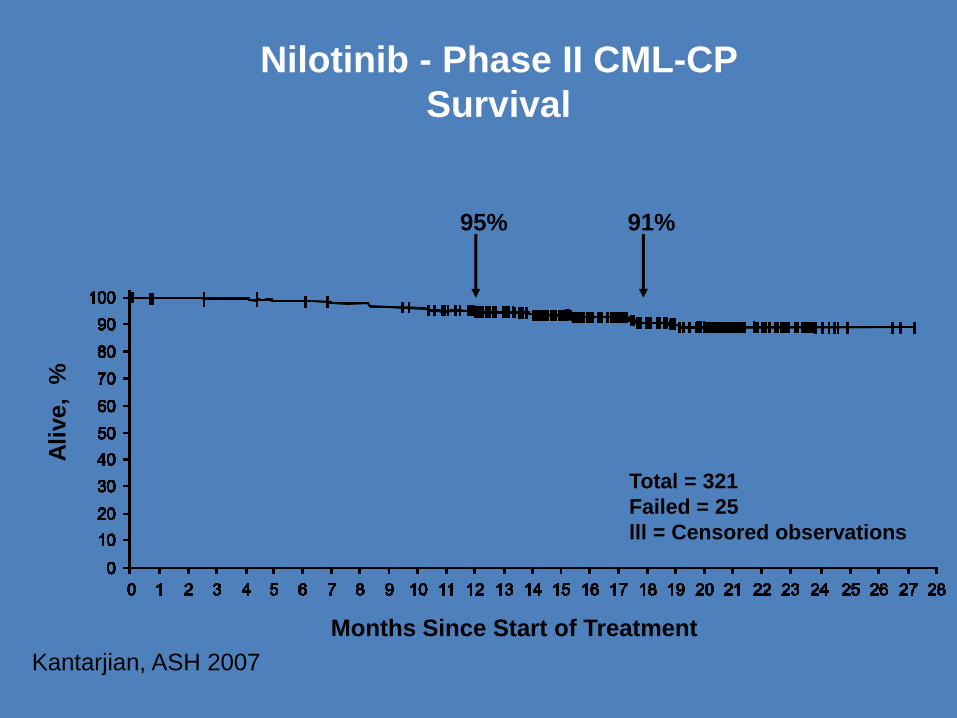
Nilotinib - Phase II CML-CP
Time to Progression
Kantarjian, ASH 2007
95% 91%
Months Since Start of Treatment
Ali
ve,
%
Total = 321
Failed = 25
lll = Censored observations
Nilotinib - Phase II CML-CP
Survival
Kantarjian, ASH 2007
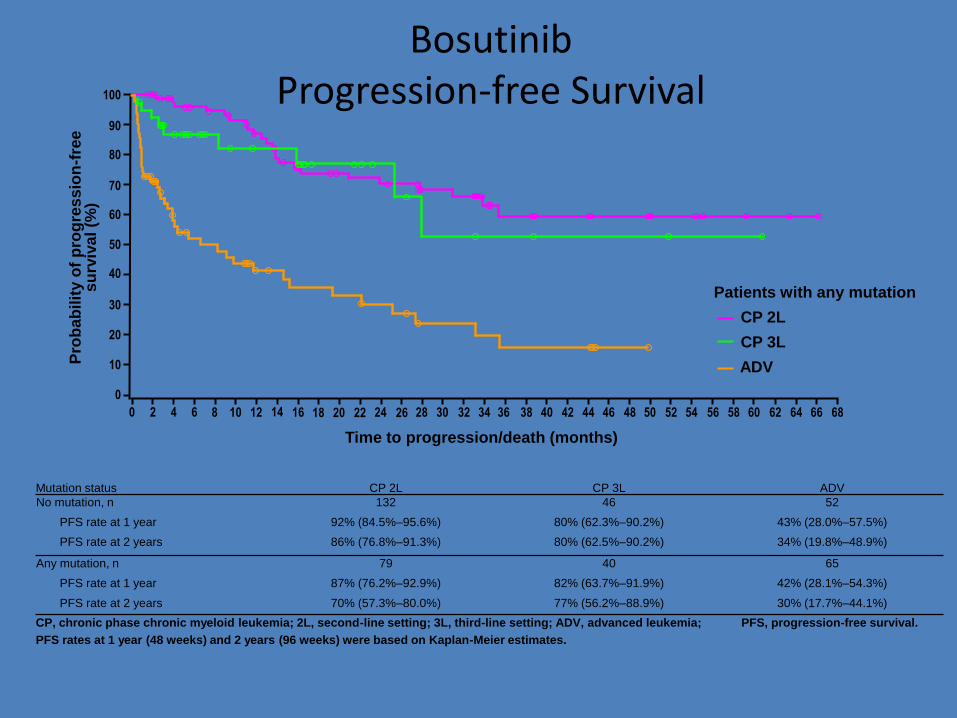
Bosutinib Progression-free Survival
Mutation status CP 2L CP 3L ADV
No mutation, n 132 46 52
PFS rate at 1 year 92% (84.5%–95.6%) 80% (62.3%–90.2%) 43% (28.0%–57.5%)
PFS rate at 2 years 86% (76.8%–91.3%) 80% (62.5%–90.2%) 34% (19.8%–48.9%)
Any mutation, n 79 40 65
PFS rate at 1 year 87% (76.2%–92.9%) 82% (63.7%–91.9%) 42% (28.1%–54.3%)
PFS rate at 2 years 70% (57.3%–80.0%) 77% (56.2%–88.9%) 30% (17.7%–44.1%)
CP, chronic phase chronic myeloid leukemia; 2L, second-line setting; 3L, third-line setting; ADV, advanced leukemia; PFS, progression-free survival.
PFS rates at 1 year (48 weeks) and 2 years (96 weeks) were based on Kaplan-Meier estimates.
Time to progression/death (months)
Pro
ba
bilit
y o
f p
rog
res
sio
n-f
ree
s
urv
iva
l (%
) 100
90
80
70
60
50
40
30
20
10
0
0 2 4 6 8 10 12 14 16 18 20 22 24 26 28 30 32 34 36 38 40 42 44 46 48 50 52 54 56 68 58 60 62 64 66
Patients with any mutation
CP 2L
CP 3L
ADV
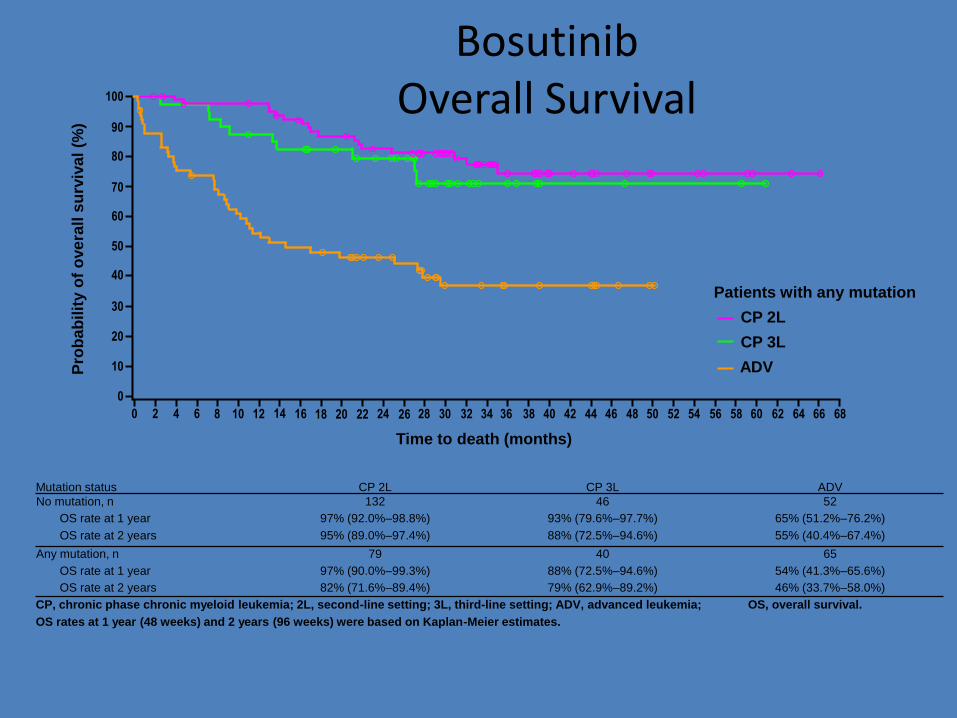
Bosutinib Overall Survival
Mutation status CP 2L CP 3L ADV
No mutation, n 132 46 52
OS rate at 1 year 97% (92.0%–98.8%) 93% (79.6%–97.7%) 65% (51.2%–76.2%)
OS rate at 2 years 95% (89.0%–97.4%) 88% (72.5%–94.6%) 55% (40.4%–67.4%)
Any mutation, n 79 40 65
OS rate at 1 year 97% (90.0%–99.3%) 88% (72.5%–94.6%) 54% (41.3%–65.6%)
OS rate at 2 years 82% (71.6%–89.4%) 79% (62.9%–89.2%) 46% (33.7%–58.0%)
CP, chronic phase chronic myeloid leukemia; 2L, second-line setting; 3L, third-line setting; ADV, advanced leukemia; OS, overall survival.
OS rates at 1 year (48 weeks) and 2 years (96 weeks) were based on Kaplan-Meier estimates.
Time to death (months)
Pro
ba
bilit
y o
f o
ve
rall
su
rviv
al
(%)
100
90
80
70
60
50
40
30
20
10
0
0 2 4 6 8 10 12 14 16 18 20 22 24 26 28 30 32 34 36 38 40 42 44 46 48 50 52 54 56 68 58 60 62 64 66
Patients with any mutation
CP 2L
CP 3L
ADV
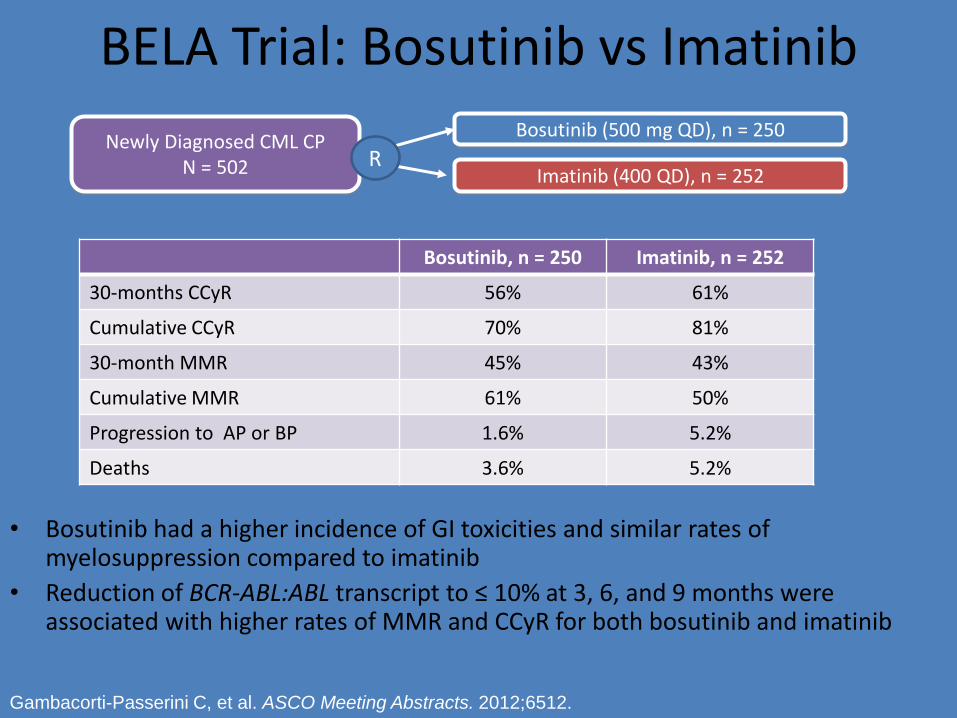
BELA Trial: Bosutinib vs Imatinib
• Bosutinib had a higher incidence of GI toxicities and similar rates of myelosuppression compared to imatinib
• Reduction of BCR-ABL:ABL transcript to ≤ 10% at 3, 6, and 9 months were associated with higher rates of MMR and CCyR for both bosutinib and imatinib
Bosutinib, n = 250 Imatinib, n = 252
30-months CCyR 56% 61%
Cumulative CCyR 70% 81%
30-month MMR 45% 43%
Cumulative MMR 61% 50%
Progression to AP or BP 1.6% 5.2%
Deaths 3.6% 5.2%
Newly Diagnosed CML CP N = 502
Bosutinib (500 mg QD), n = 250
Imatinib (400 QD), n = 252 R
Gambacorti-Passerini C, et al. ASCO Meeting Abstracts. 2012;6512.
So how do you chose which drug to use in salvage?
• All the criteria for front line choice
• PLUS
– Directed by a mutation
– Directed by a side effect of the front line drug that may also be present with one of the salvage drug

Side Effects
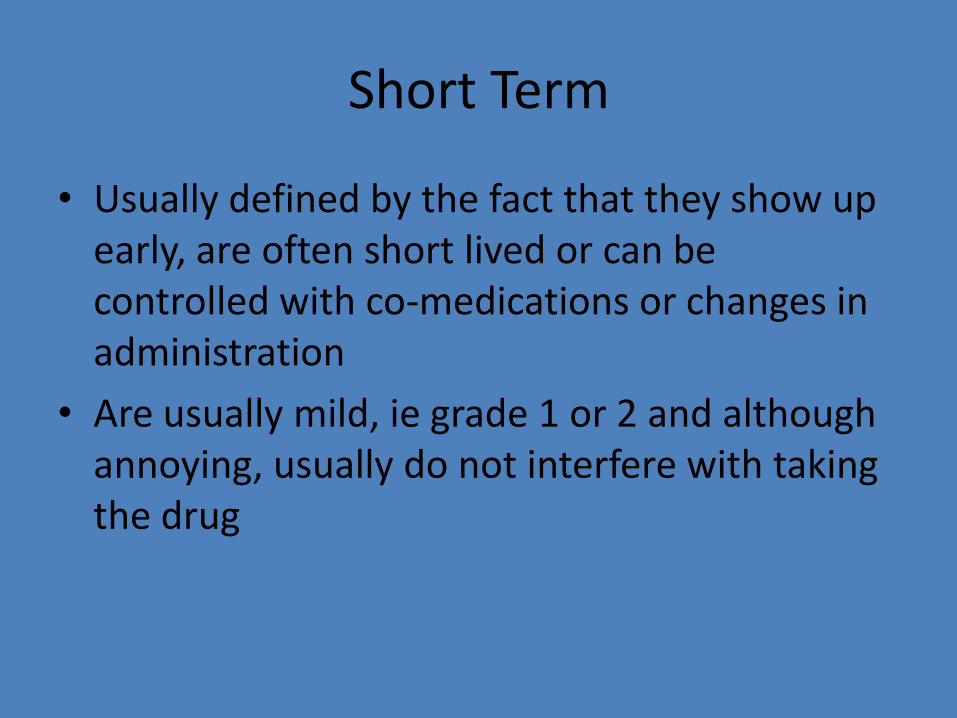
Short Term
• Usually defined by the fact that they show up early, are often short lived or can be controlled with co-medications or changes in administration
• Are usually mild, ie grade 1 or 2 and although annoying, usually do not interfere with taking the drug
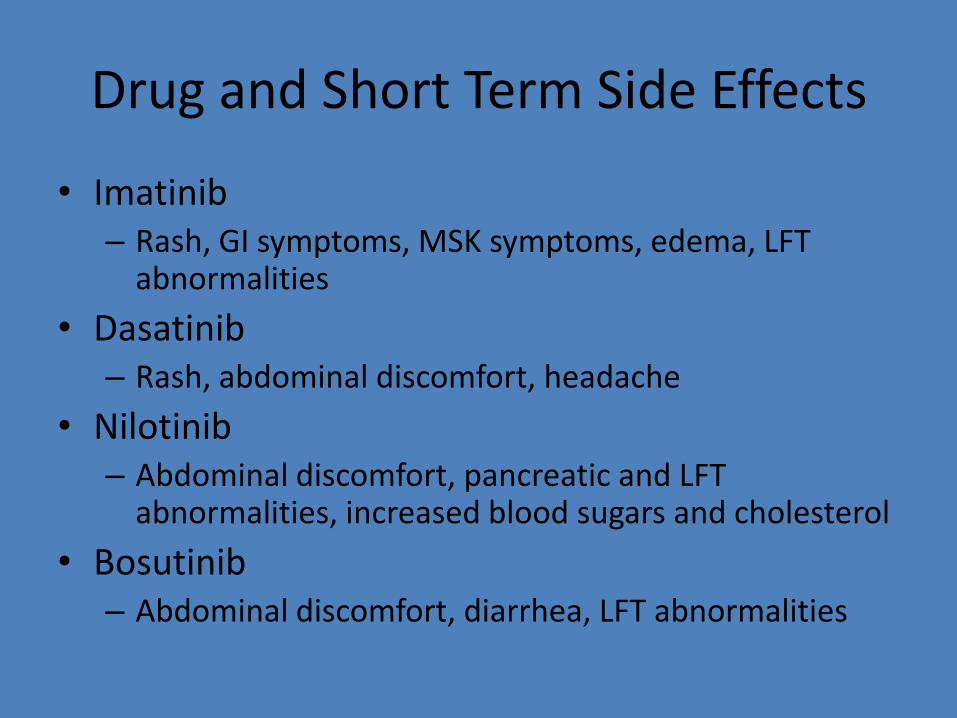
Drug and Short Term Side Effects
• Imatinib – Rash, GI symptoms, MSK symptoms, edema, LFT
abnormalities
• Dasatinib – Rash, abdominal discomfort, headache
• Nilotinib – Abdominal discomfort, pancreatic and LFT
abnormalities, increased blood sugars and cholesterol
• Bosutinib – Abdominal discomfort, diarrhea, LFT abnormalities
Potential Long-Term Drug Toxicities and Choice of TKI
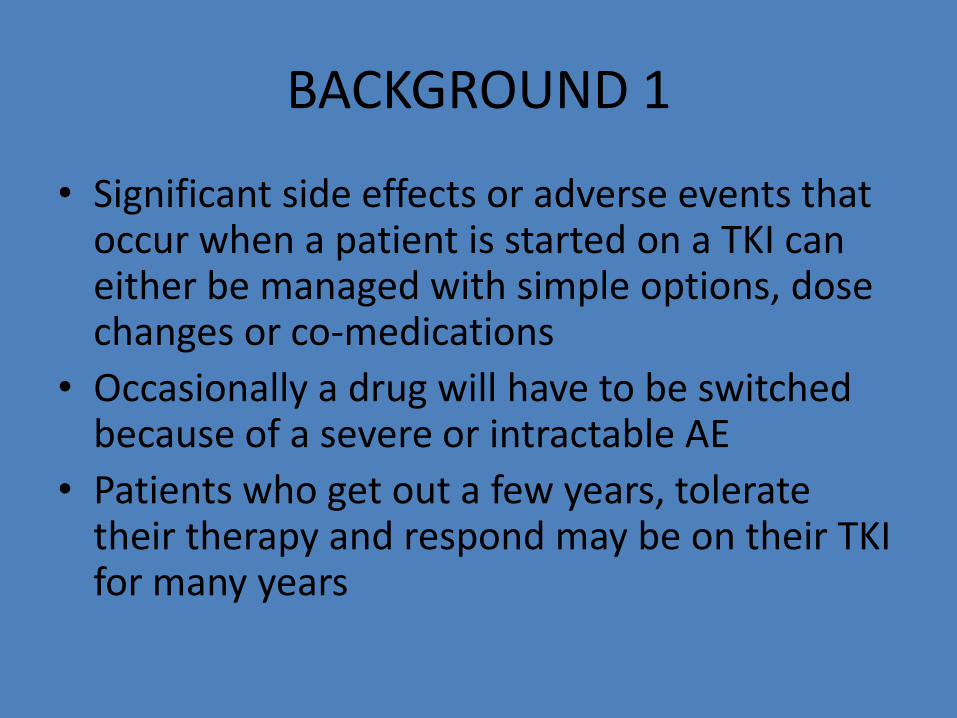
BACKGROUND 1
• Significant side effects or adverse events that occur when a patient is started on a TKI can either be managed with simple options, dose changes or co-medications
• Occasionally a drug will have to be switched because of a severe or intractable AE
• Patients who get out a few years, tolerate their therapy and respond may be on their TKI for many years
BACKGROUND 2
• Some patients will be eligible for discontinuing their therapy because of deep durable responses, the definition of which is still not standardized
• It is likely though that many patients will be on lifelong therapy and dealing with issues that may be associated with their particular therapy will need to be addressed
Fundamental Realities
• Generally, no specific medication is absolutely contraindicated, resistance aside
• Some TKIs in some people may pose a greater potential risk of side effects
• Choice of a TKI that has the potential for issues will therefore involve a risk/benefit analysis after getting full medical information, followed by a detailed discussion with the patient and more aggressive monitoring and possible intervention
Caveat
• I will look at problems that can continue to show up in patients even after years of therapy and at new late problems
• I will look at the “red flags” that have been raised with TKIs
• I will not comment on whether the definitions of these issues are correct or appropriate or whether studies were designed to collect this data accurately
• I am not going to talk about cause and effect, or patient risk going into treatment, just the observed associations that are likely significant and need thought and monitoring

Imatinib
Long Term AE’s with Imatinib
• In general, after more than a decade of usage, there have been no new long term adverse advents identified with imatinib
• Persistence of low grade chronic side effects such as edema, gastrointestinal sensitivity and musculoskeletal problems continue
• Imatinib has continued to be a safe long term tolerated medication in those individuals who are responding

Dasatinib
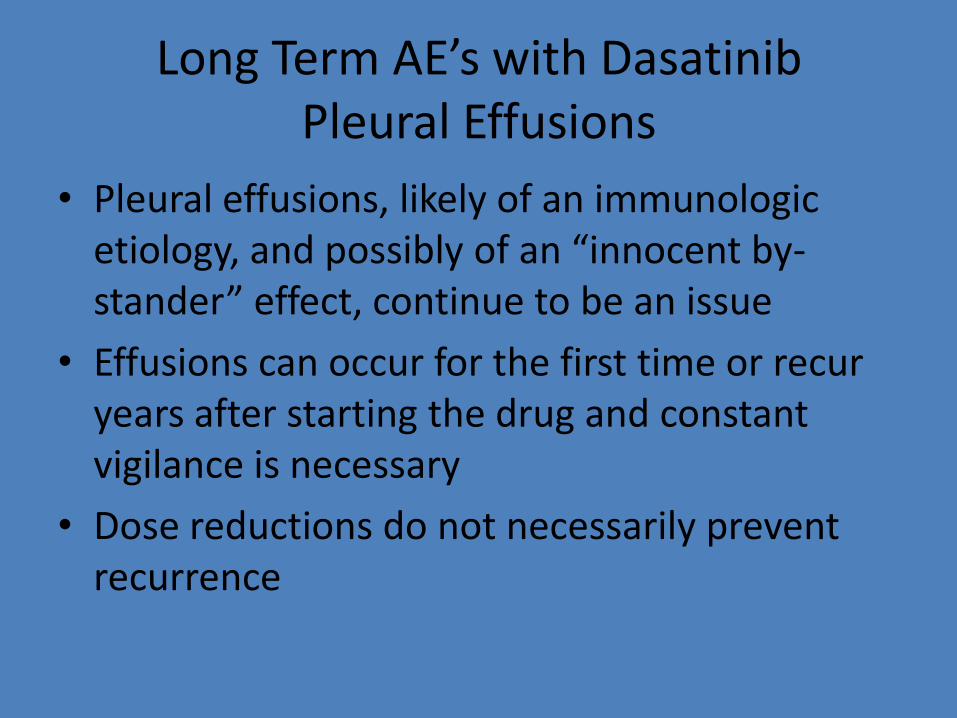
Long Term AE’s with Dasatinib Pleural Effusions
• Pleural effusions, likely of an immunologic etiology, and possibly of an “innocent by-stander” effect, continue to be an issue
• Effusions can occur for the first time or recur years after starting the drug and constant vigilance is necessary
• Dose reductions do not necessarily prevent recurrence
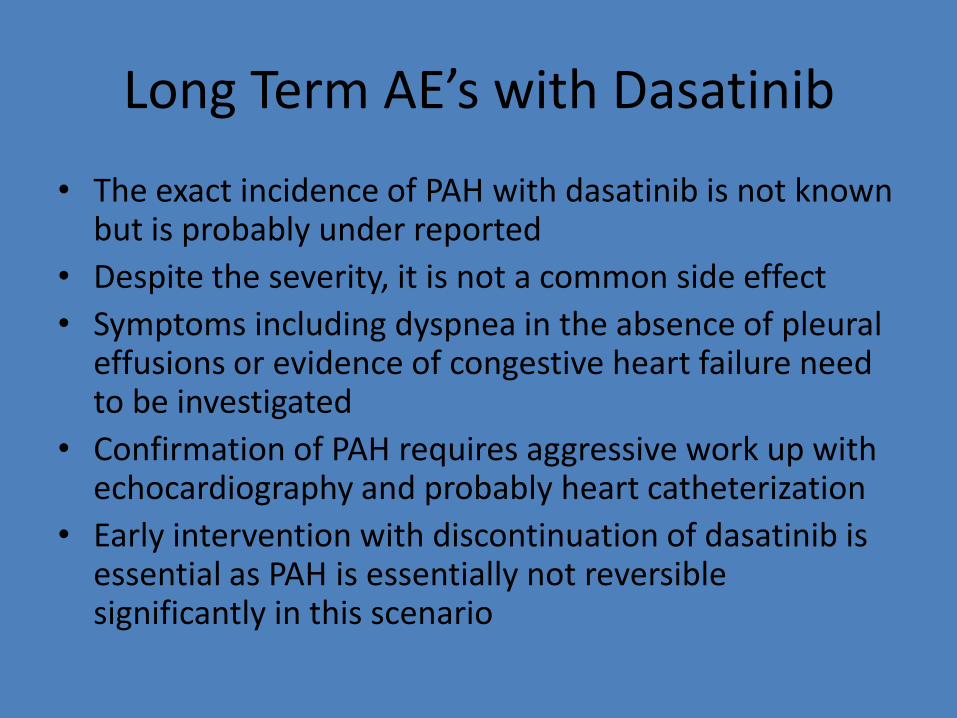
Long Term AE’s with Dasatinib
• The exact incidence of PAH with dasatinib is not known but is probably under reported
• Despite the severity, it is not a common side effect
• Symptoms including dyspnea in the absence of pleural effusions or evidence of congestive heart failure need to be investigated
• Confirmation of PAH requires aggressive work up with echocardiography and probably heart catheterization
• Early intervention with discontinuation of dasatinib is essential as PAH is essentially not reversible significantly in this scenario
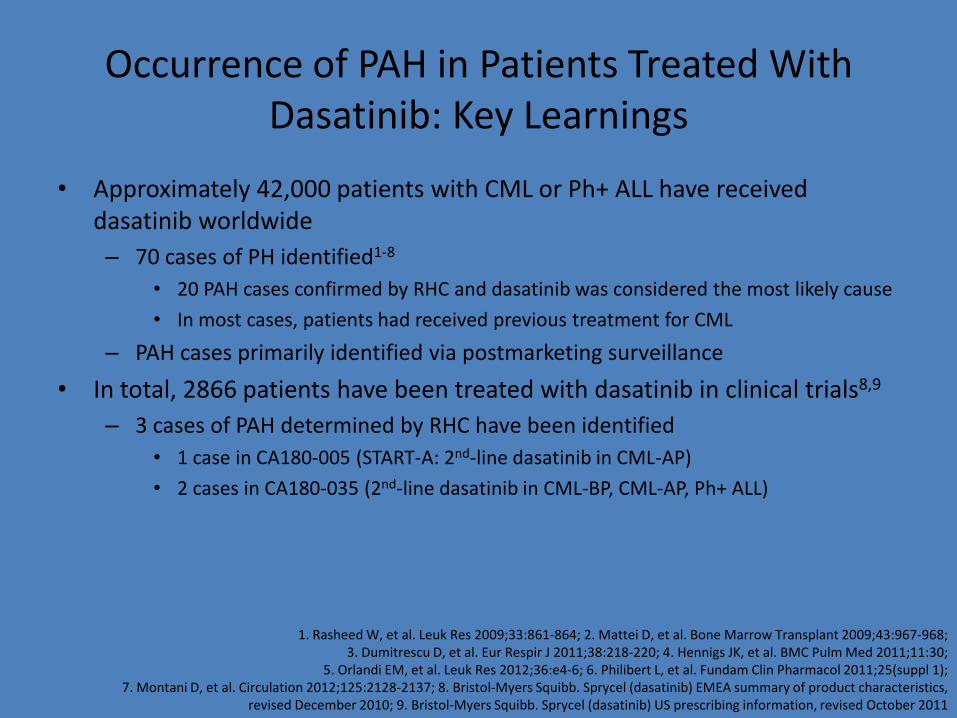
Occurrence of PAH in Patients Treated With Dasatinib: Key Learnings
• Approximately 42,000 patients with CML or Ph+ ALL have received dasatinib worldwide
– 70 cases of PH identified1-8
• 20 PAH cases confirmed by RHC and dasatinib was considered the most likely cause
• In most cases, patients had received previous treatment for CML
– PAH cases primarily identified via postmarketing surveillance
• In total, 2866 patients have been treated with dasatinib in clinical trials8,9
– 3 cases of PAH determined by RHC have been identified
• 1 case in CA180-005 (START-A: 2nd-line dasatinib in CML-AP)
• 2 cases in CA180-035 (2nd-line dasatinib in CML-BP, CML-AP, Ph+ ALL)
1. Rasheed W, et al. Leuk Res 2009;33:861-864; 2. Mattei D, et al. Bone Marrow Transplant 2009;43:967-968; 3. Dumitrescu D, et al. Eur Respir J 2011;38:218-220; 4. Hennigs JK, et al. BMC Pulm Med 2011;11:30;
5. Orlandi EM, et al. Leuk Res 2012;36:e4-6; 6. Philibert L, et al. Fundam Clin Pharmacol 2011;25(suppl 1); 7. Montani D, et al. Circulation 2012;125:2128-2137; 8. Bristol-Myers Squibb. Sprycel (dasatinib) EMEA summary of product characteristics,
revised December 2010; 9. Bristol-Myers Squibb. Sprycel (dasatinib) US prescribing information, revised October 2011

Nilotinib
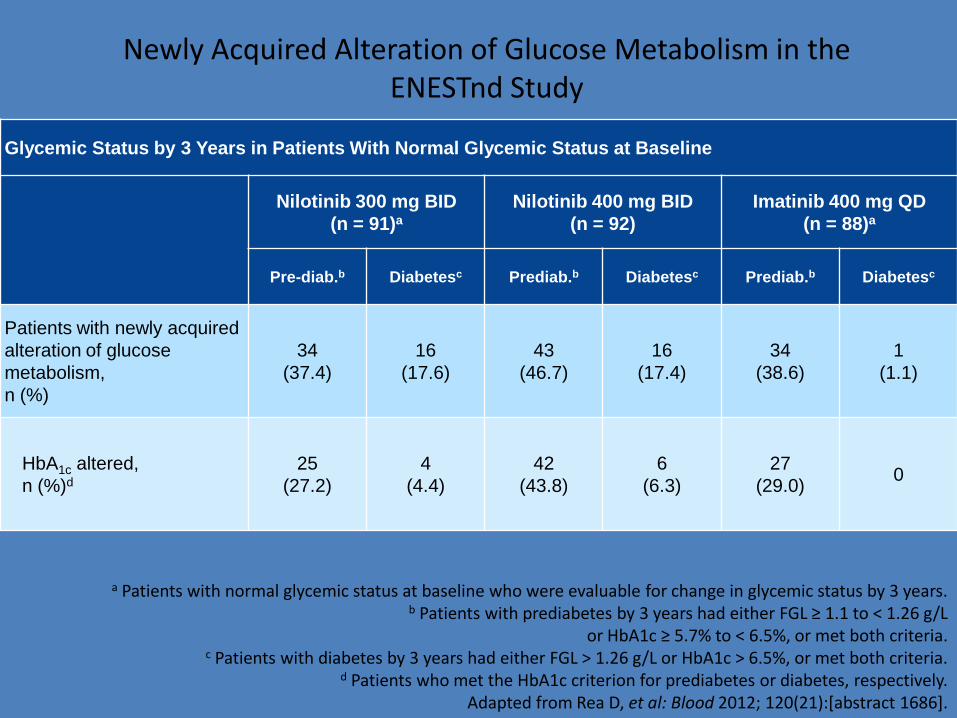
a Patients with normal glycemic status at baseline who were evaluable for change in glycemic status by 3 years. b Patients with prediabetes by 3 years had either FGL ≥ 1.1 to < 1.26 g/L
or HbA1c ≥ 5.7% to < 6.5%, or met both criteria. c Patients with diabetes by 3 years had either FGL > 1.26 g/L or HbA1c > 6.5%, or met both criteria.
d Patients who met the HbA1c criterion for prediabetes or diabetes, respectively. Adapted from Rea D, et al: Blood 2012; 120(21):[abstract 1686].
Newly Acquired Alteration of Glucose Metabolism in the ENESTnd Study
Glycemic Status by 3 Years in Patients With Normal Glycemic Status at Baseline
Nilotinib 300 mg BID
(n = 91)a
Nilotinib 400 mg BID
(n = 92)
Imatinib 400 mg QD
(n = 88)a
Pre-diab.b Diabetesc Prediab.b Diabetesc Prediab.b Diabetesc
Patients with newly acquired
alteration of glucose
metabolism,
n (%)
34
(37.4)
16
(17.6)
43
(46.7)
16
(17.4)
34
(38.6)
1
(1.1)
HbA1c altered,
n (%)d
25
(27.2)
4
(4.4)
42
(43.8)
6
(6.3)
27
(29.0) 0
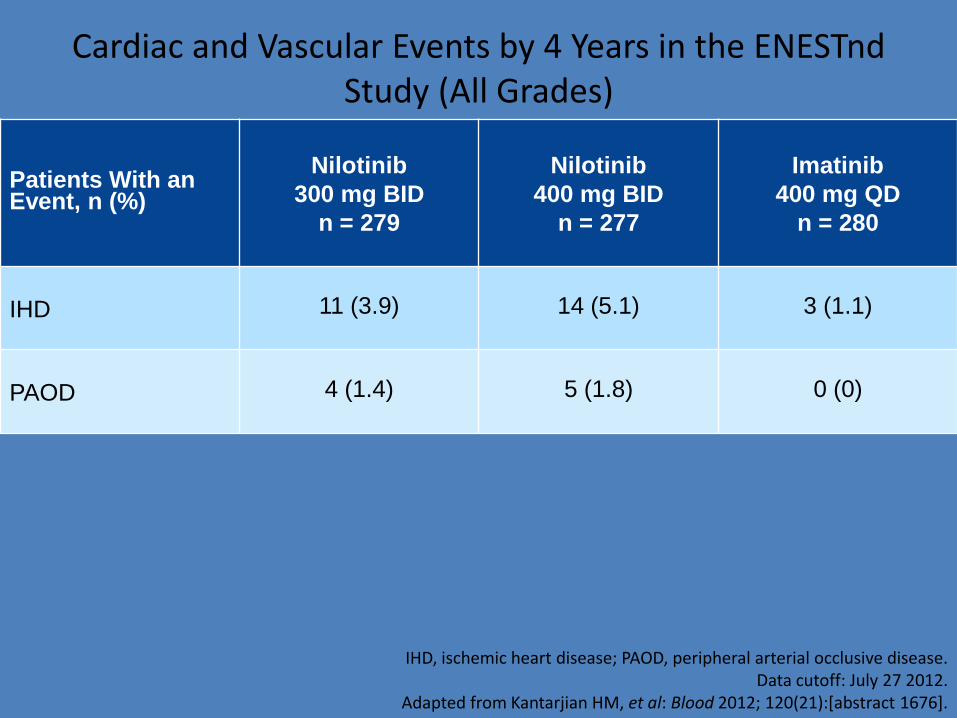
Cardiac and Vascular Events by 4 Years in the ENESTnd Study (All Grades)
Patients With an Event, n (%)
Nilotinib
300 mg BID
n = 279
Nilotinib
400 mg BID
n = 277
Imatinib
400 mg QD
n = 280
IHD 11 (3.9) 14 (5.1) 3 (1.1)
PAOD 4 (1.4) 5 (1.8) 0 (0)
IHD, ischemic heart disease; PAOD, peripheral arterial occlusive disease. Data cutoff: July 27 2012.
Adapted from Kantarjian HM, et al: Blood 2012; 120(21):[abstract 1676].

Bosutinib
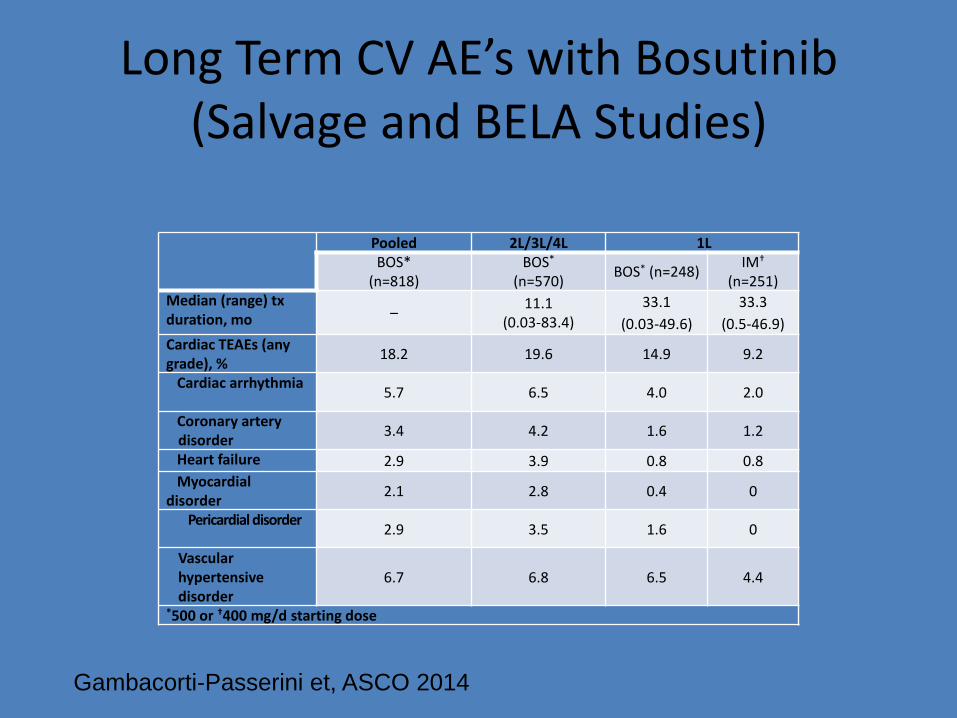
Long Term CV AE’s with Bosutinib (Salvage and BELA Studies)
Pooled 2L/3L/4L 1L BOS*
(n=818) BOS*
(n=570) BOS* (n=248)
IM† (n=251)
Median (range) tx duration, mo –
11.1 (0.03-83.4)
33.1
(0.03-49.6)
33.3
(0.5-46.9)
Cardiac TEAEs (any grade), %
18.2 19.6 14.9 9.2
Cardiac arrhythmia 5.7 6.5 4.0 2.0
Coronary artery disorder
3.4 4.2 1.6 1.2
Heart failure 2.9 3.9 0.8 0.8
Myocardial disorder
2.1 2.8 0.4 0
Pericardial disorder 2.9 3.5 1.6 0
Vascular hypertensive disorder
6.7 6.8 6.5 4.4
*500 or †400 mg/d starting dose
Gambacorti-Passerini et, ASCO 2014
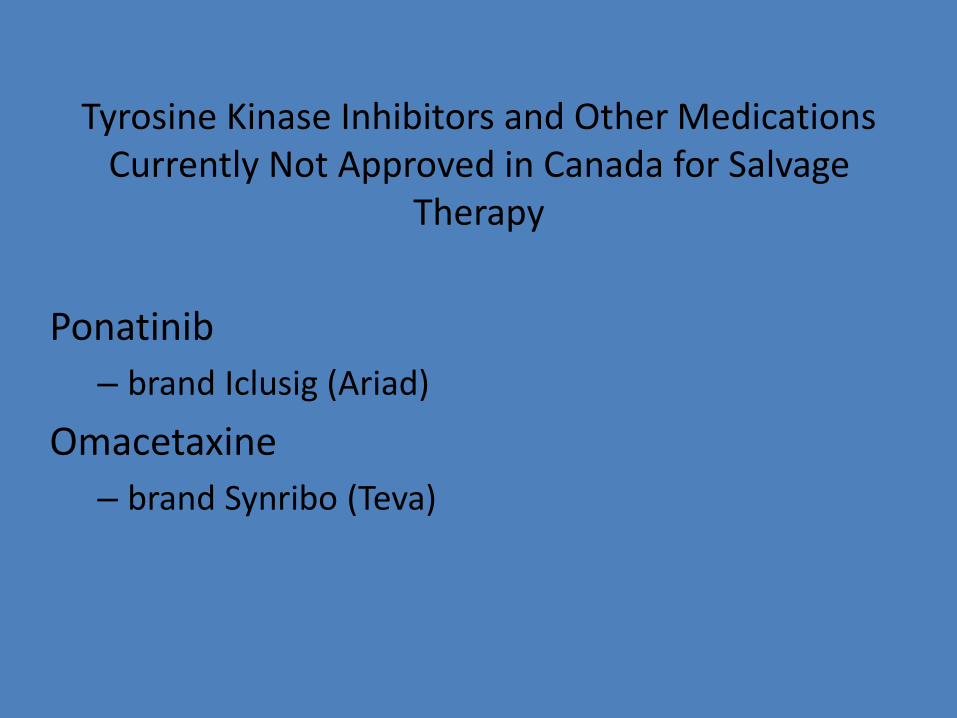
Tyrosine Kinase Inhibitors and Other Medications Currently Not Approved in Canada for Salvage
Therapy
Ponatinib
– brand Iclusig (Ariad)
Omacetaxine
– brand Synribo (Teva)
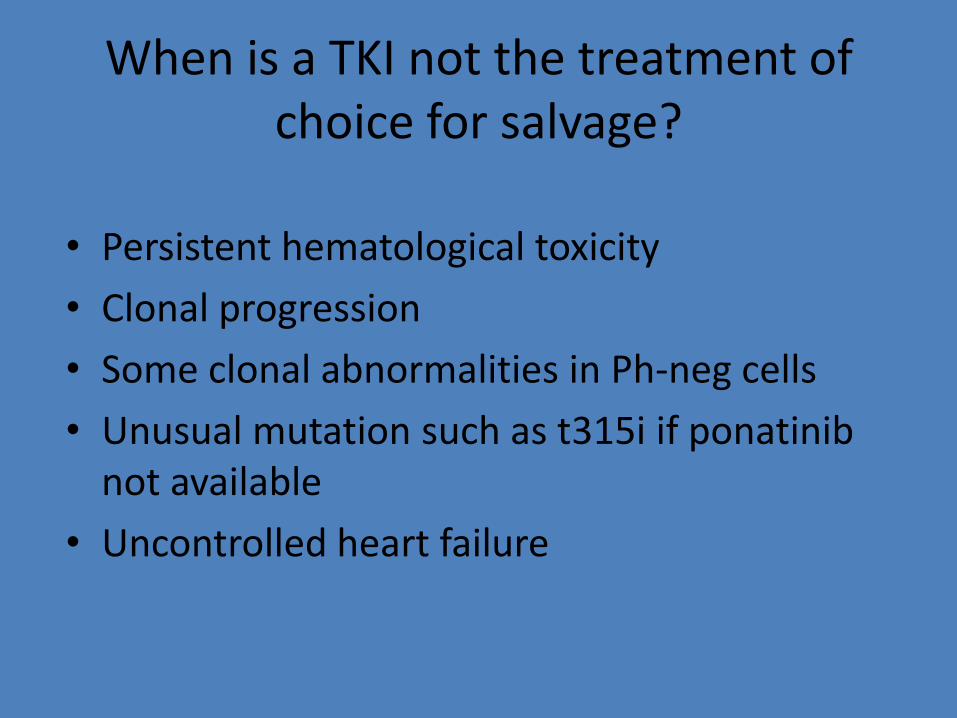
When is a TKI not the treatment of choice for salvage?
• Persistent hematological toxicity
• Clonal progression
• Some clonal abnormalities in Ph-neg cells
• Unusual mutation such as t315i if ponatinib not available
• Uncontrolled heart failure
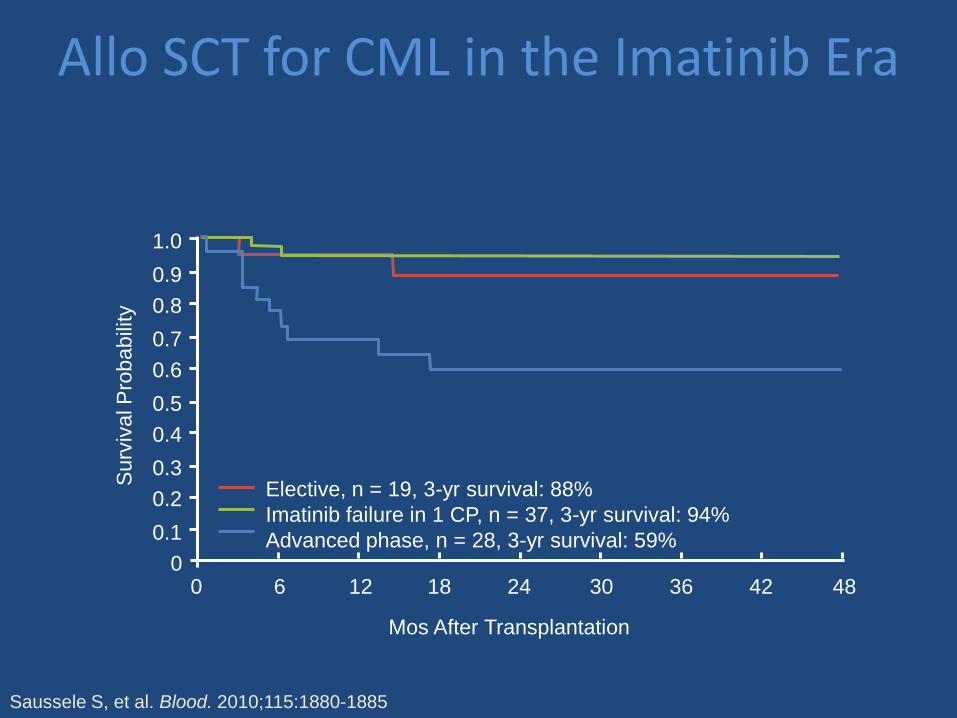
Allo SCT for CML in the Imatinib Era
Saussele S, et al. Blood. 2010;115:1880-1885
1.0
0.8
0.6
0.4
0.2
0
0.9
0.7
0.5
0.3
0.1
0 12 24 36 48 6 18 30 42
Mos After Transplantation
Surv
ival P
robabili
ty
Elective, n = 19, 3-yr survival: 88%
Imatinib failure in 1 CP, n = 37, 3-yr survival: 94%
Advanced phase, n = 28, 3-yr survival: 59%
What does a physician taking care of a patient with CML need to remember
and need to do?
Issues for the GPO
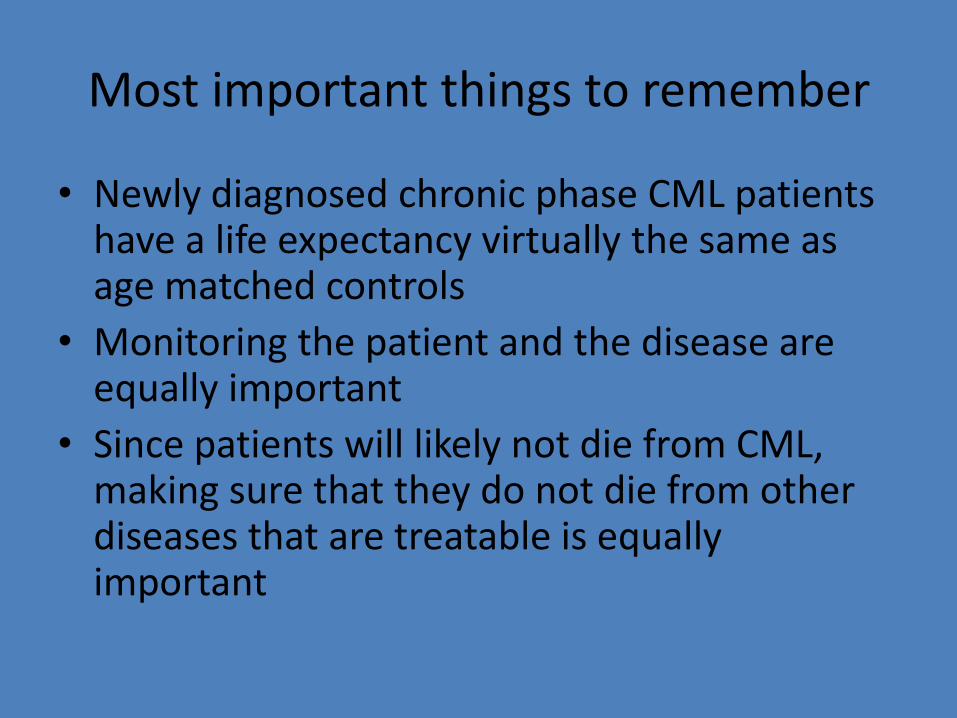
Most important things to remember
• Newly diagnosed chronic phase CML patients have a life expectancy virtually the same as age matched controls
• Monitoring the patient and the disease are equally important
• Since patients will likely not die from CML, making sure that they do not die from other diseases that are treatable is equally important
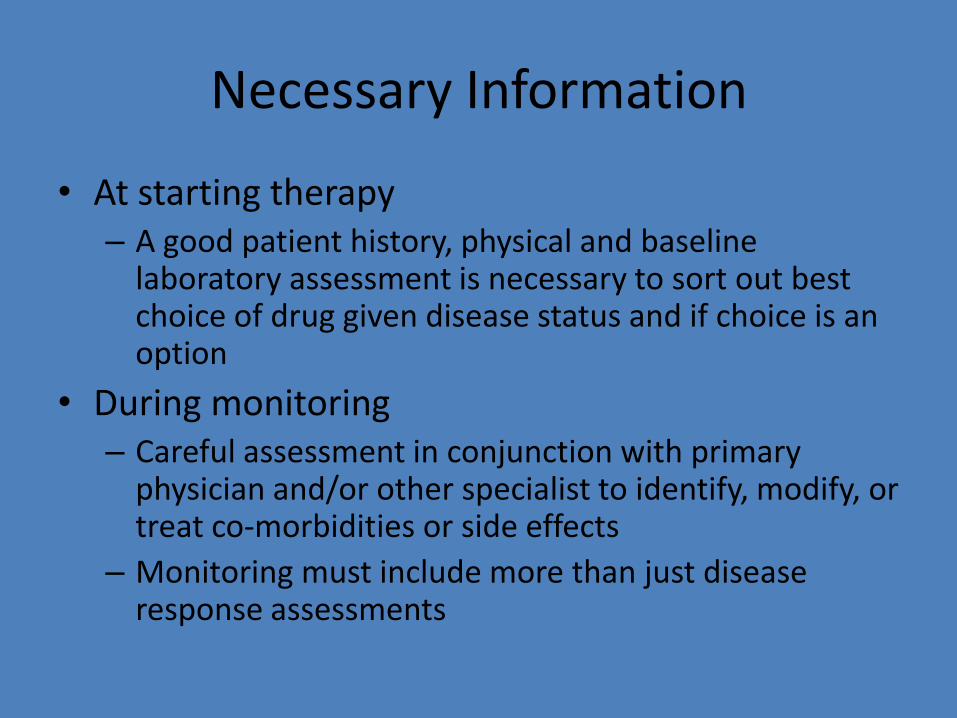
Necessary Information
• At starting therapy – A good patient history, physical and baseline
laboratory assessment is necessary to sort out best choice of drug given disease status and if choice is an option
• During monitoring – Careful assessment in conjunction with primary
physician and/or other specialist to identify, modify, or treat co-morbidities or side effects
– Monitoring must include more than just disease response assessments
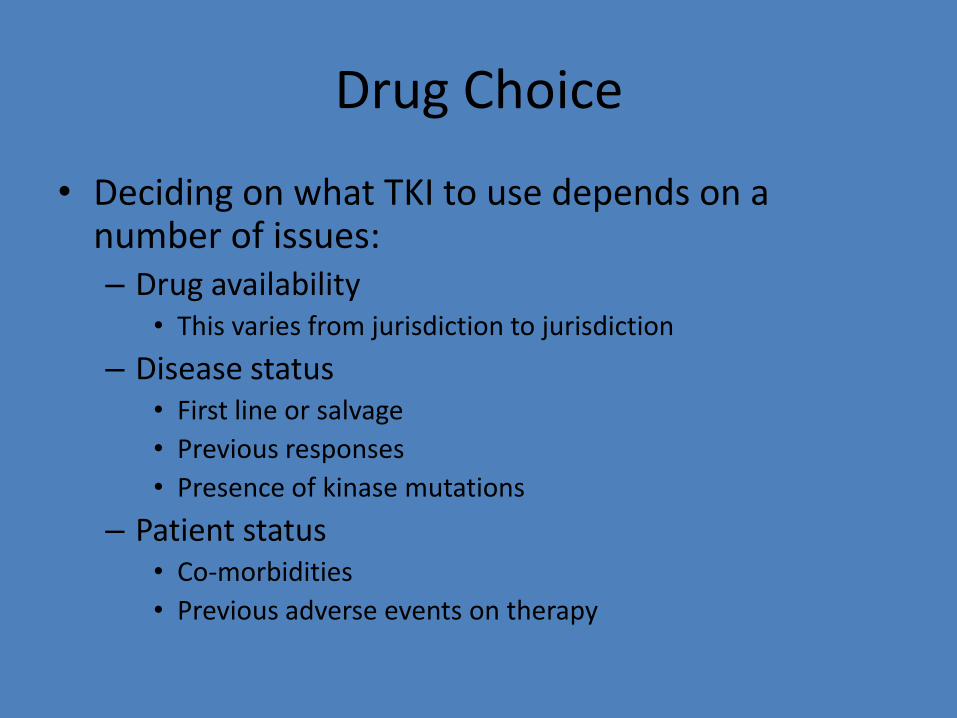
Drug Choice
• Deciding on what TKI to use depends on a number of issues: – Drug availability
• This varies from jurisdiction to jurisdiction
– Disease status • First line or salvage
• Previous responses
• Presence of kinase mutations
– Patient status • Co-morbidities
• Previous adverse events on therapy
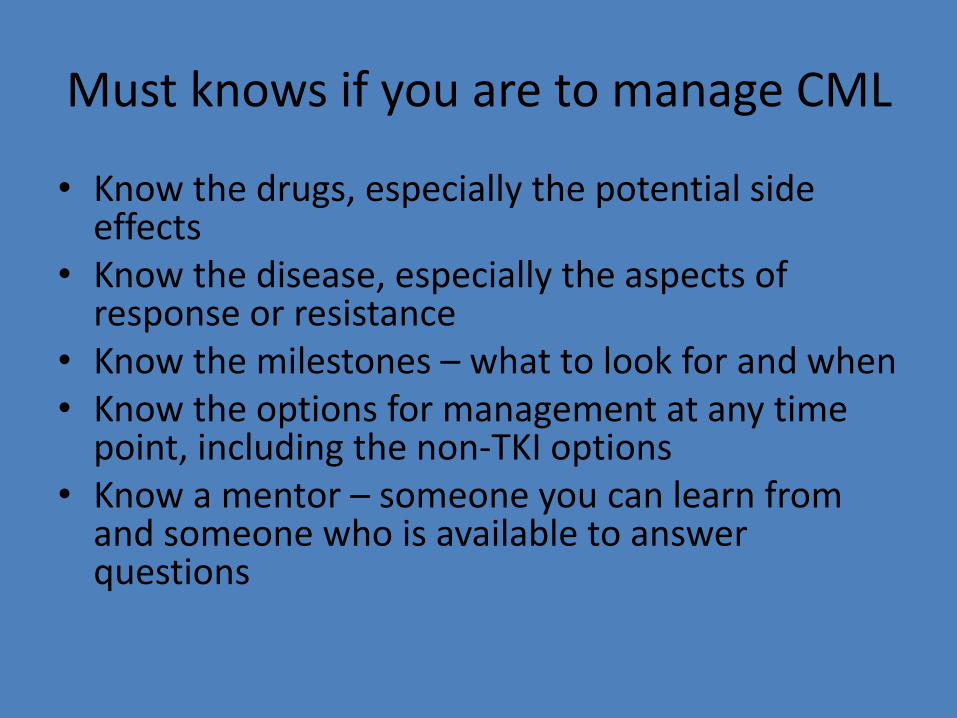
Must knows if you are to manage CML
• Know the drugs, especially the potential side effects
• Know the disease, especially the aspects of response or resistance
• Know the milestones – what to look for and when • Know the options for management at any time
point, including the non-TKI options • Know a mentor – someone you can learn from
and someone who is available to answer questions

The Future - Maybe
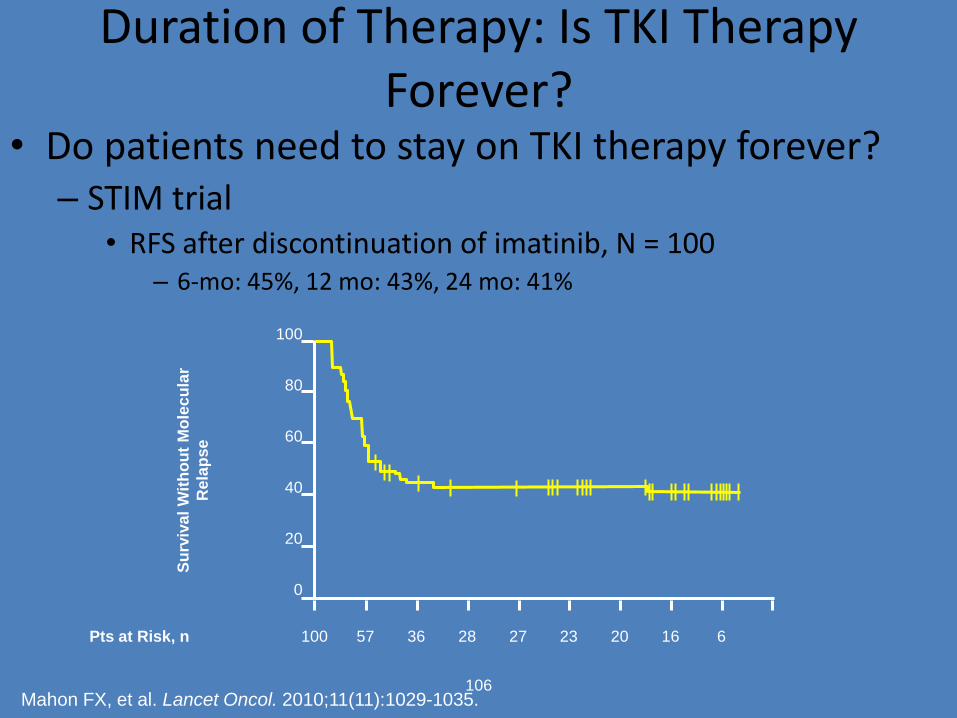
Duration of Therapy: Is TKI Therapy Forever?
• Do patients need to stay on TKI therapy forever? – STIM trial
• RFS after discontinuation of imatinib, N = 100 – 6-mo: 45%, 12 mo: 43%, 24 mo: 41%
106
100
80
60
40
20
0
Su
rviv
al
Wit
ho
ut
Mo
lec
ula
r
Rela
pse
Pts at Risk, n 100 57 36 28 27 23 20 16 6
Mahon FX, et al. Lancet Oncol. 2010;11(11):1029-1035.


![203341Orig1s000 - Food and Drug Administrationtreatment of adults with chronic myeloid leukemia [CP-CML, AP-CML, and BP-CML] with resistance or intolerance to prior therapy including](https://img.pdfslide.us/doc/110x75/60bcb776f8906f48904ac5cb/203341orig1s000-food-and-drug-administration-treatment-of-adults-with-chronic.jpg)