Embed Size (px)
Citation preview
Chronic diseases in Australia: Blueprint for preventive action
Sharon Willcox
Policy paper No. 2015-01
June 2015
AUSTRALIANHEALTH POLICYCOLLABORATION
i
AUSTRALIANHEALTH POLICYCOLLABORATION
Chronic diseases in Australia: the case for changing course
Policy paper No. 2014-02October 2014Sharon Willcox
Background and policy paper

Chronic diseases in Australia: the case for changing course
Sharon Willcox
Issues paper No. 2014-02
October 2014
AUSTRALIANHEALTH POLICYCOLLABORATION
ii
AUSTRALIANHEALTH POLICYCOLLABORATION
Chronic diseases in Australia: the case for changing course
Policy paper No. 2014-02October 2014Sharon Willcox
Background and policy paper

i | P a g e A u s t r a l i a n H e a l t h P o l i c y C o l l a b o r a t i o n 2 0 1 4
Acknowledgements The Australian Health Policy Collaboration sincerely thanks the members of the Expert Advisory Group on Preventable Chronic Diseases who contributed to the development of this report. The members are: Professor Rosemary Calder, (Chair) Director, Australian Health Policy Collaboration Professor Alex Brown, Deputy Director, South Australian Health and Medical Research Institute Professor Rob Carter, Director, Deakin Economics, Deakin University Professor Max de Courten, Director, Centre of Chronic Disease, Victoria University Professor James Dunbar, Director, Greater Green Triangle University, Department of Rural Health, Flinders University and Deakin University Dr Erin Lalor, CEO, National Stroke Foundation Professor Rob Moodie, Professor of Public Health, School of Population and Global Health, University of Melbourne Professor Ian Olver, CEO, Cancer Council Australia Mr Colin Sindall, Director, Prevention and Population Health, Department of Health, Victoria Professor Helena Teede, Director Monash Centre for Health Research and Implementation, School of Public Health and Preventive Medicine, Monash University
About the author Dr Sharon Willcox is the Director of Health Policy Solutions and Adjunct Associate Professor in the Department of Epidemiology and Preventive Medicine, Monash University. She has held senior roles in the development and implementation of major health system reforms including as a Commissioner on the National Health and Hospitals Reform Commission. She is co-author of the textbook, The Australian Health Care System.
About the Australian Health Policy Collaboration The Australian Health Policy Collaboration was established at Victoria University in 2015 to build from the work of the health program at the Mitchell Institute over the previous two years. The Collaboration is an independent think tank that aims to attract much required attention to the critical need for substantial and urgent health policy reform focused on addressing chronic disease on a national scale.
Suggested Citation When referencing this report please cite as: Willcox, S. (2014). Chronic diseases in Australia: The case for changing course, Australian Health Policy Collaboration Issues paper No. 2014-02. Melbourne: Australian Health Policy Collaboration. Note: This report was originally published in 2014 by the Mitchell Institute for Health and Education Policy as part of the health program.

ii | P a g e A u s t r a l i a n H e a l t h P o l i c y C o l l a b o r a t i o n 2 0 1 4
Foreword This report, Chronic diseases in Australia: the case for changing course, by Dr Sharon Willcox, is a foundation
piece in the Australian Health Policy Collaboration policy program.
The aim of the program is to propose, promote and inform a whole of population approach in policies, funding,
institutional arrangements and service models to better prevent and manage chronic disease in Australia. The
Collaboration was founded on the principle that health and early childhood are critical components in the
development and progress of an economically and socially prosperous society.
Reflecting international trends in policy thinking, our formative work has a strong focus on understanding the
circumstances of communities, local innovation, and how system reform can help success to spread. We have a
focus on working with socially and economically disadvantaged communities, and a developing relationship with
the west of Melbourne.
The AHPC is looking at how public policy can ensure that everyone has access to the opportunities that good
health and a good start in life can provide. Our streams of work include:
Policy initiatives that promote a population-wide approach to preventing chronic disease
Measuring health and education outcomes for people and communities
New models for health- funding, services and workforce
Chronic diseases – the case for changing course
Diseases such as cancer, mental illness, cardiovascular disease, respiratory disorders and diabetes, have major
long-term impacts on individuals, their families and their communities. The burden of chronic disease in
Australia threatens to overwhelm the health budget, the capacity of health services and the health workforce.
Much of that burden is preventable or capable of reduction through effective, evidence-based changes to policy.
Yet Australia’s health policy priorities continue to focus on treating illness rather than preventing it, with
investment in the prevention of chronic diseases lower than the OECD average. This investment is inadequate
given the impact that preventable chronic diseases are having, and are expected to have in the future, on our
economy and our population. Furthermore, while a range of national and state policies and programs focused on
chronic diseases have been put in place over decades, they are often fragmented, concentrating on specific
diseases or individual behaviours, rather than adopting a cohesive and integrated approach to prevention and
effective management.
This paper, written by Dr Sharon Willcox with the AHPC and a national expert advisory group, summarises the
evidence and provides the case for changing course in Australian policies, to address the health and non-health
factors contributing to the prevalence of chronic diseases.
Four major directions for change are put forward. We anticipate that this paper will promote debate in the
policy community and encourage new action on chronic disease.
Rosemary Calder Director Australian Health Policy Collaboration

iii | P a g e A u s t r a l i a n H e a l t h P o l i c y C o l l a b o r a t i o n 2 0 1 4
Table of Contents
Foreword................................................................................................................................................. ii
Executive summary ................................................................................................................................ iv
1. Introduction ................................................................................................................................ 1
2. The social, economic and health costs of chronic diseases to the Australian community ........ 3
2.1 Chronic diseases are causing more illness, disability and premature deaths ..................... 3
2.2 Chronic diseases are an important driver of health system utilisation and costs .............. 6
2.3 Chronic diseases cause significant productivity losses due to reduced workforce
participation............................................................................................................................... 7
2.4 Chronic diseases are caused by many factors, not just health behaviours ........................ 9
3. Chronic diseases can be prevented through cost-effective population health approaches .... 13
3.1 There are many opportunities or levels at which prevention can occur .......................... 13
3.2 Preventing chronic diseases involves starting early to reduce exposure to risks ............. 14
3.3 Preventive strategies can be directed towards populations and individuals ................... 17
3.4 Many interventions are cost-effective in preventing chronic diseases ............................ 19
3.5 The ACE-Prevention study provides a robust framework for tackling chronic diseases .. 26
4. Actions required to prevent chronic diseases .......................................................................... 28
4.1 Australia has signed up to the WHO Global Action Plan for chronic disease ................... 28
4.2 There is no integrated, public performance reporting on Australia’s progress in
preventing chronic diseases .................................................................................................... 30
4.3 Action on preventing chronic diseases has been ‘two steps forward, one step back’ in
recent years ............................................................................................................................. 34
4.4 Identifying key directions for acting on prevention is a vital first step ............................. 37
4.5 Achieving change in preventing and reducing chronic diseases for Australia’s health .... 42
5. Epilogue .................................................................................................................................... 44
Acronyms .............................................................................................................................................. 45
References ............................................................................................................................................ 46

C h r o n i c d i s e a s e s i n A u s t r a l i a : t h e c a s e f o r c h a n g i n g c o u r s e
iv | P a g e A u s t r a l i a n H e a l t h P o l i c y C o l l a b o r a t i o n 2 0 1 4
Executive summary
Australia has a strong track record in tackling some of the risk factors that contribute to the onset of chronic
diseases. A comprehensive approach to tobacco control has resulted in a major reduction in adult smoking
rates from 35 per cent in 1980 to 13 per cent in 2013. This reduction, since its peak in the mid-1970s, has
contributed to the achievement of declining death rates from coronary heart disease and stroke over the past
thirty years.
While we should celebrate such successes, this is no time for complacency or inaction. Chronic diseases are
steadily rising in prevalence and they are the predominant cause of illness, premature mortality and health
system utilisation, as well as having a major adverse impact on Australia’s economic prosperity. We cannot
afford a ‘business as usual’ approach that is mainly directed towards the effective management and treatment
of specific chronic diseases in sick individuals.
Chronic diseases are highly preventable
The World Health Organization (WHO) has estimated that at least 80 per cent of all heart disease, stroke and
diabetes cases, and 40 per cent of all cancers, are preventable. The compelling evidence is that many chronic
diseases share common causes – a set of behavioural risk factors, biomedical factors and social determinants
that increase the likelihood of developing chronic diseases. This creates enormous potential to transform
prevention efforts and move beyond a narrow, disease-specific approach to incorporate a comprehensive,
population-based approach that tackles concurrently the root causes of many chronic diseases.
There is expert consensus on the value of adopting a life course approach to preventing chronic disease. This
involves acting early and taking advantage of strategic opportunities to prevent the onset of chronic diseases
while simultaneously reducing or eliminating behavioural risk factors and other social and environmental
determinants that contribute to chronic diseases.
The scope of action and range of preventive interventions is broad. Prevention can be targeted at individuals, at
communities and at whole populations. Health professionals, especially those in the primary health care sector,
play a key role in the prevention and management of chronic disease among high-risk individuals. However, a
population-based approach to prevention can achieve increased reach and provides the opportunity for action
by governments, industry, non-government organisations, consumers and other groups. The success in tobacco
control illustrates the value of multi-sectoral action that is sustained and delivered on many fronts including
regulation, fiscal policy, social marketing and education.
Chronic diseases harm individuals, the health system and the economy
Chronic diseases are responsible for nine out of every ten deaths in Australia. Four disease groups–
cardiovascular disease, cancer, chronic obstructive pulmonary disease and diabetes–account for three-quarters
of all deaths due to chronic diseases. However, many chronic diseases wield their most enduring impact
through reducing quality of life and functioning abilities. Mental health conditions, respiratory diseases (such as
asthma) and musculoskeletal conditions (such as arthritis) result in poor quality life experiences and lost
opportunities for many people. Increasingly, cancer and kidney disease are chronic ‘treatable’ diseases that do
not kill quickly, but diminish the quality of life for some people over many decades. Of course, all these impacts
extend well beyond individuals living and dying with chronic diseases to their families, friends and carers.
Chronic diseases are the major driver of health system utilisation and costs. Cancer is responsible for about one
in every ten hospital admissions while dialysis accounts for about one in every eight hospital admissions.

C h r o n i c d i s e a s e s i n A u s t r a l i a : t h e c a s e f o r c h a n g i n g c o u r s e
v | P a g e A u s t r a l i a n H e a l t h P o l i c y C o l l a b o r a t i o n 2 0 1 4
Chronic diseases generate billions of dollars in avoidable health expenditure every year. The Business Council of
Australia (BCA) has estimated that if chronic diseases were totally eliminated, workforce productivity could
increase by 10 per cent. A more conservative estimate is that opportunity cost savings of about $2.3 billion
could be released, based on achievable reductions in six behavioural risk factors (smoking, high risk alcohol use,
physical inactivity, intimate partner violence, obesity and inadequate diet). This includes savings generated in
the health sector and as a result of improved workforce participation and productivity.
There is robust evidence on cost-effective interventions to prevent chronic diseases
Too often, the claim is made that we don’t know ‘what works’ in preventing chronic diseases. While it is true
that there are fewer published studies evaluating the impact of preventive interventions than curative
interventions, there is now a solid (and growing) core of robust evidence about cost-effective preventive
interventions. The Assessing Cost-Effectiveness (ACE) Prevention study provides a treasure trove of Australian
evidence, amassed over five years, on more than 150 preventive health interventions. It provides: evidence on
the interventions that have the largest population health impact (through reducing the burden of disease); a
ranking of interventions on their cost-effectiveness (including whether they result in cost savings to the health
system); and evidence on how to combine and sequence preventive interventions for important health priority
areas to achieve the greatest ‘bang for buck’.
The ACE-Prevention study found that many preventive interventions have very strong cost-effectiveness
credentials. It identified 43 preventive interventions that were either cost-saving or cost less than $10,000 per
disability-adjusted life year (DALY) prevented. For example, some population-based preventive interventions
that are strongly cost-effective include tax increases on tobacco (30 per cent), alcohol (30 per cent) and
unhealthy foods (10 per cent), as well as mandatory salt limits on processed foods. Together, these four
interventions would result in 650,000 fewer years lived with a disability for the Australian population and
generate $6 billion of net savings to the health system. In a climate of concern about health system
sustainability, it is inherently unethical not to take action on such ‘win-win’ preventive interventions that both
improve the Australian population’s health and save money.
Australia has a mixed scorecard in implementing a comprehensive approach to preventing chronic diseases
The Australian success in tobacco control is internationally applauded and much copied. However, there has
not been a matching commitment and concerted effort by governments to take action on other risk factors and
determinants of chronic diseases, such as unhealthy use of alcohol and the factors contributing to obesity.
Moving beyond the remit of the National Preventative Health Taskforce (NPHT), there has been even less action
on other preventable chronic diseases including mental health conditions and some types of cancers.
Past and future progress in preventing chronic diseases can be evaluated against four domains.
National commitment given force through public accountability: Australia has developed a series of national
strategies and agreements relating to chronic disease, commencing with the 2005 National Chronic Disease
Strategy. However, most effort under this strategy was focussed on improving service delivery for patients
already diagnosed with specific chronic diseases.
The Australian Government’s response to the NPHT’s National Preventative Health Strategy included its 2010
framework report, Taking Preventative Action, the establishment of the Australian National Preventive Health
Agency (ANPHA) and the National Partnership Agreement (NPA) on Preventive Health. Together, these
initiatives were developed to promote the implementation of programs and strategies to reduce risk factors and

C h r o n i c d i s e a s e s i n A u s t r a l i a : t h e c a s e f o r c h a n g i n g c o u r s e
vi | P a g e A u s t r a l i a n H e a l t h P o l i c y C o l l a b o r a t i o n 2 0 1 4
prevent chronic diseases. However, these initiatives are no longer operational, meaning that there is no existing
multilateral commitment by Australian governments to a systematic approach to preventing chronic diseases.
Turning to public accountability, the NPA on Preventive Health included measurable targets for reducing some
risk factors for chronic diseases. However, there was no requirement for regular public reporting against these
targets. The status and commitment of governments to these targets is now uncertain given the cessation of
funding through the NPA. In addition, the ANPHA and the Council of Australian Governments (COAG) Reform
Council, each of which contributed to reporting on progress on preventing chronic disease and risk factor
targets, have been discontinued.
Despite this mixed record, there is now a real opportunity to reinvigorate reporting on, and accountability for,
preventing chronic diseases. The Australian Government is a signatory to the WHO Global Action Plan for the
prevention and control of non-communicable diseases 2013-2020. This plan commits countries to achieve a 25
per cent reduction in premature mortality from non-communicable diseases (NCDs) by 2025 (with 2010 as the
baseline and intermediate monitoring in 2015 and 2020). This overarching objective of a 25 per cent reduction
in chronic disease mortality is underpinned by the expectation that each signatory country will set its own
specific targets for a range of specified risk factors (including harmful use of alcohol, physical inactivity, salt
intake, tobacco use, raised blood pressure, diabetes and obesity). Australia has (or had through the NPA on
Preventive Health) measurable targets for some of these risk factors. In order to give full effect to Australia’s
commitment to the Global Action Plan, Australian governments would need to agree and implement
measurable targets across all these risk factors including new targets for tackling harmful alcohol use, reducing
salt intake and reducing blood pressure.
Dedicated funding for prevention of chronic diseases: With the cessation of the NPA on Preventive Health,
there is no longer dedicated national funding that is specifically tied to the prevention of chronic diseases. It is
difficult to track how much is spent on preventing chronic diseases. While expenditure on public health is often
used as a proxy for preventive health expenditure, the scope of public health extends beyond preventing
chronic diseases. Data on public health spending reported by the Australian Institute of Health and Welfare
(AIHW) indicate that public health spending was about 1.8 to 2.0 per cent of total recurrent health spending
from the late 1990s to the mid-2000s. Public health spending peaked at 2.22 per cent of total recurrent health
spending in 2007-08, but has declined significantly since that time. In 2012-13 spending on public health was
only 1.54 per cent of total recurrent health spending. This indicates that spending on public health (and hence
prevention) has increasingly been given a lower priority in Australia than spending on health service delivery.
OECD data suggest that Australia is at the ‘low end’ in spending on prevention and public health services relative
to many comparable countries. In 2011 the OECD reported that Australian spending on prevention and public
health as a share of total recurrent health spending was 2.0 per cent, much lower than New Zealand (6.4 per
cent), Finland (6.1 per cent), Canada (5.9 per cent), Sweden (3.9 per cent), the United States (3.1 per cent) and
Japan (2.9 per cent).
Adoption of a broad, multifaceted approach to prevention across multiple sectors and partners: The NPHT
highlighted the value of ‘a broad, multifaceted and coordinated strategy over a sustained period with
partnerships between health and other portfolios and industry sectors, and between government, business and
community groups’. This ideal is commonly accepted, but has proved more challenging to achieve in practice.
The approach to tackling smoking has many of the desired hallmarks of a successful preventive approach. This
includes the use of a broad range of complementary interventions (tax, product labelling, social marketing and
regulation on smoking in different settings), as well as having the support of many different agencies
(governments, major non-government organisations such as the Cancer Council and National Heart Foundation,

C h r o n i c d i s e a s e s i n A u s t r a l i a : t h e c a s e f o r c h a n g i n g c o u r s e
vii | P a g e A u s t r a l i a n H e a l t h P o l i c y C o l l a b o r a t i o n 2 0 1 4
and health professional and community groups). The NPA on Preventive Health provided financial support for
expanding prevention activities into diverse settings including schools and workplaces, but this has now been
discontinued.
National infrastructure, research and evaluation of progress in preventing chronic diseases: There has been
some investment in expanding and updating core national datasets that are vital to monitoring progress on
chronic disease prevention (such as the expanded Australian Health Survey and the Burden of Disease study).
However, the development of this core intelligence infrastructure occurs on an ad hoc basis, with no public
commitment by governments (or relevant statistical and data agencies) to prioritise the national datasets
required for surveillance, monitoring and evaluation of chronic disease prevention. State governments have
made an important contribution through their development and maintenance of population health datasets
over several decades. The National Health and Medical Research Council (NHMRC) funding of the five-year ACE-
Prevention study represented an important step in building the evidence-base, but further sustained investment
in research on preventing chronic disease is required.
The development of a national action plan on preventing chronic diseases through a broad-based
expert coalition
The Australian Health Policy Collaboration is proposing a national action plan for chronic disease prevention
guided by four key directions:
1. Promote and implement interventions that impact early in life, as well as target high risk populations
2. Invest in cost-effective prevention, while innovating and building the evidence-base on what works to
reduce chronic diseases
3. Measure progress on reducing chronic diseases and engender accountability for action
4. Recognise that many of the levers to prevent chronic diseases involve changes outside the health
system, creating healthier environments at a whole of population level.

C h r o n i c d i s e a s e s i n A u s t r a l i a : t h e c a s e f o r c h a n g i n g c o u r s e
1 | P a g e A u s t r a l i a n H e a l t h P o l i c y C o l l a b o r a t i o n 2 0 1 4
1. Introduction
In the words of John Lennon, Imagine:
It is 1965.
For the first time, the number of annual road deaths in Australia exceeds 3,000 people. There has been a 50 per
cent increase over the past decade associated with rising rates of car ownership.
In the United States (US), Ralph Nader does not publish his groundbreaking book, Unsafe at any speed. The
concept of designing in safety does not come into existence and the car industry of the future does not invest in
head restraints, airbags and crumple zones.
It is 1969.
The Royal Australasian College of Surgeons does not establish a Road Trauma Committee. Road deaths and
injuries are viewed as inevitable ‘accidents’, rather than as a preventable public health problem. Orthopaedic
surgeons have instead pioneered new approaches to treating the victims of road accidents. There is a severe
shortage of orthopaedic surgeons.
It is 1973.
Australian governments have unofficially adopted the ‘Live free or die’ philosophy (copying the US state motto of
New Hampshire). Brief public debate on legislating for compulsory wearing of seat belts and motor cycle
helmets fizzled before it started. The new Action on Road Safety Association has fewer members than the Anti-
Football League.
It is 1987.
The Victorian Government does not establish the Transport Accident Commission. Innovative road safety
educational campaigns (If you drink then drive, you’re a bloody idiot; Don’t fool yourself, speed kills; and Knock
off five) are not created. Ten years hence, Tourism Australia’s campaign (Where the bloody hell are you?)
receives international advertising awards for its edgy language, but brickbats from grammar pedants.
It is 2001.
Reduced speed limits for roads near schools are not introduced. Governments argue that parents and children
need to take responsibility for their behaviours and not put themselves in danger. The term ‘nanny state’ is
unknown and is not used by tobacco companies in 2011 to challenge advertising bans. People continue to think
fondly of nannies and remember watching Mary Poppins at the movies.
It is 2014.
The number of road deaths and injuries has kept pace with population growth and car ownership. Every public
and private hospital now has its own road trauma ward and most communities have rehabilitation hospitals.
Shares in private sector companies that provide wheelchairs, aids and appliances represent blue chip
investments.
C h r o n i c d i s e a s e s i n A u s t r a l i a : t h e c a s e f o r c h a n g i n g c o u r s e
2 | P a g e A u s t r a l i a n H e a l t h P o l i c y C o l l a b o r a t i o n 2 0 1 4
Over two generations, road safety efforts have transformed Australian society. Many lives have been saved due
to actions on many fronts by many groups.
This report presents the case for an equally transformative approach to preventing chronic diseases in Australia.
The Australian Health Policy Collaboration believes that we need to change course now so that we do not look
back in one or two generations and imagine what we could have done to avoid the devastation that chronic
diseases have inflicted on our society.
We present, in Chapter 2, data on the magnitude of the challenges we are already facing today due to the
growth in chronic diseases. This includes the influence of chronic diseases on how we live and die, their impact
on health system use and costs, and the associated losses to productivity and economic growth.
In Chapter 3 we demonstrate that chronic diseases can be prevented. Early intervention and population-based
approaches to prevention make good sense and represent sound investments. There is robust Australian
research and evidence on the ‘best buys’ for prevention to guide resource allocation and the introduction of
policies and programs to create healthier environments and reduce risk factors.
In Chapter 4 we provide a high-level report card of recent Australian successes and existing gaps in action to
prevent chronic diseases. Finally, we outline the proposal by the Australian Health Policy Collaboration to
develop a national action plan for chronic disease prevention, supported and informed by health and other
experts, and evidence-based research.

C h r o n i c d i s e a s e s i n A u s t r a l i a : t h e c a s e f o r c h a n g i n g c o u r s e
3 | P a g e A u s t r a l i a n H e a l t h P o l i c y C o l l a b o r a t i o n 2 0 1 4
2. The social, economic and health costs of chronic diseases to the Australian community
Australia is a wealthy country with one of the longest life expectancies in the world. However, our failure to
prevent the growing burden of chronic diseases threatens both our future economic prosperity and our
probability of healthy life expectancies (years lived without disease or disability).
The burden of chronic diseases is a major public policy challenge that extends beyond its impact on the health of
individuals or health system costs. It is the impact of chronic diseases on reducing workplace productivity, on
decreasing rates of workforce participation and on limiting economic growth that has attracted the attention of
groups such as the Business Council of Australia (BCA) (2009), the Committee for Economic Development of
Australia (2013) and the Productivity Commission (2007).
This chapter examines the impact of chronic diseases, commencing with health impacts and health system costs
and then analysing its broader social and economic consequences. To set the scene for taking action, a
framework for understanding the determinants of chronic diseases is also presented.
2.1 Chronic diseases are causing more illness, disability and premature deaths
The dominant role of chronic diseases in influencing how we live and die is evident in the Australian Institute of
Health and Welfare’s (AIHW) most recent biennial report card on the health of the Australian population (AIHW
2014a). Some of the key findings from the AIHW and other reports include:
Most deaths are due to chronic diseases: In 2011, nine of every ten Australian deaths were due to chronic
disease. Four disease groups – cardiovascular disease, cancer, chronic obstructive pulmonary disease and
diabetes – account for three-quarters of all deaths due to chronic diseases. However, there have been some
significant changes in the patterns of death rates of different chronic diseases (see Figure 2.1). Age-
standardised death rates from coronary heart disease and cerebrovascular disease (e.g. strokes) have each
declined by about 70 per cent since 1979. In contrast, age-standardised death rates from diabetes have
increased by 11 per cent. This changing pattern reflects some success in reducing risk factors (such as
smoking), but also the earlier onset and mortality from diabetes.
Australians are dying from multiple chronic diseases: In 2011 coronary heart disease was the underlying or
main cause of death in both men (15.6 per cent) and women (13.7 per cent). However, it was an associated
(or contributory) cause of death for about one half (51 per cent) of deaths due to diabetes, over one quarter
(28 per cent) of deaths due to chronic and unspecified kidney failure and approximately one fifth (19 per
cent) of deaths due to chronic obstructive pulmonary disease. While kidney failure was not the direct cause
of many deaths (less than 2 per cent), it was an associated cause for one-quarter (26 per cent) of deaths due
to diabetes.

C h r o n i c d i s e a s e s i n A u s t r a l i a : t h e c a s e f o r c h a n g i n g c o u r s e
4 | P a g e A u s t r a l i a n H e a l t h P o l i c y C o l l a b o r a t i o n 2 0 1 4
Figure 2.1: The patterns of chronic disease deaths have changed over the past thirty years
Notes: COPD is chronic obstructive pulmonary disease
Source: Derived from Figure 4.2, Australian Institute of Health and Welfare 2014, Australia’s health 2014,
Canberra: AIHW.
Australians are living with multiple chronic diseases: In 2007-08 one in 50 people reported having four or
more chronic health conditions (including asthma, Type 2 diabetes, coronary heart disease, cerebrovascular
disease, arthritis, osteoporosis, chronic obstructive pulmonary disease, depression and high blood pressure).
This proportion increased with age - eight per cent of people aged 65 or older had four or more of these
chronic diseases. Australians experienced an increase in life expectancy between 1998 and 2009, however,
this went hand in hand with an increase in the years lived with a severe or profound disability plus years
with a lesser profound disability.
Many chronic diseases do not result in premature deaths but reduce the quality of life: The Australian
Burden of Disease study measures the impact of disease on premature mortality (years of life lost) and
quality of life (years lived with disability). Figure 2.2 shows the impact of these two measures for different
chronic diseases. About 80 per cent of the burden of disease for cancer and cardiovascular disease is
associated with premature deaths. The converse is true for mental disorders where 91 per cent of the
burden is associated with years lived with a disability. Neurological and sensory disorders (including
dementia, hearing loss, vision loss, Parkinson’s disease and epilepsy) are similar, with 83 per cent of the
burden of disease due to years lived with a disability.
0
50
100
150
200
250
300
350D
eat
hs
pe
r 1
00
,00
0 p
op
ula
tio
n
1979
2011

C h r o n i c d i s e a s e s i n A u s t r a l i a : t h e c a s e f o r c h a n g i n g c o u r s e
5 | P a g e A u s t r a l i a n H e a l t h P o l i c y C o l l a b o r a t i o n 2 0 1 4
Figure 2.2: Some chronic diseases cause early deaths while others result in people living with a
disability for many years
Note: All other conditions: this comprises all other conditions that cause illness or death such as injuries,
congenital anomalies, digestive diseases etc.
Source: Derived from Table 3.11, Begg, S. et al. 2007, The burden of disease and injury in Australia 2003, Canberra:
AIHW.
The burden of chronic disease is unevenly distributed: There is a socio-economic gradient for morbidity
and mortality which includes higher levels of chronic diseases and exposure to risk factors in populations
that experience some form of disadvantage. Compared to Australian adult smoking rates of 13 per cent
(Australian Government Department of Health 2014), homeless people have smoking rates as high as 77
per cent; Aboriginal and Torres Strait Islander people have smoking rates around 50 per cent; and
people with a mental illness have smoking rates of about 32 per cent (Cancer Council Victoria, Victorian
Council of Social Services and QUIT Victoria, undated). People living in rural and remote areas also have
higher levels of some risk factors for chronic diseases arising from comparative health and socio-
economic disadvantage (AIHW 2006; 2008). Using data from the Australian Bureau of Statistics (ABS),
the Australian National Preventive Health Agency (ANPHA) highlighted the systematic association
between disadvantage, risk factors and chronic diseases (Figure 2.3). However, poor health reflects the
complex interaction between health behaviours, socio-economic characteristics and environmental
factors. For example, even after adjusting for risk factors such as smoking, physical inactivity and
harmful drinking, unemployed men are significantly more likely to have poor health status than
employed men (Mathers 1994).
0
100000
200000
300000
400000
500000
600000
Dis
abili
ty a
dju
ste
d li
fe y
ear
s
Years of life lost Years of life with disability

C h r o n i c d i s e a s e s i n A u s t r a l i a : t h e c a s e f o r c h a n g i n g c o u r s e
6 | P a g e A u s t r a l i a n H e a l t h P o l i c y C o l l a b o r a t i o n 2 0 1 4
Figure 2.3: Disadvantage is linked to higher rates of chronic disease and unhealthy behaviours
Note: Disadvantage has been measured using the ABS Index of Relative Socio-Economic Disadvantage. This includes
variables such as the level of unemployment, educational status, income and housing status (see ABS 2011 for full details).
Source: Australian National Preventive Health Agency 2013, State of preventive health 2013, Canberra: ANPHA.
2.2 Chronic diseases are an important driver of health system utilisation and costs
Given that chronic diseases account for most deaths and illness, it is unsurprising that they result in substantial
spending in the health system. The AIHW (2014a) has estimated that in 2008-09, health system expenditure on
chronic diseases included $7.74 billion for cardiovascular disease, $6.38 billion for mental health, $5.67 billion
for musculoskeletal conditions, $4.95 billion for cancer, $4.59 billion for respiratory conditions, $3.39 billion for
nervous system disorders and $1.52 billion for diabetes mellitus. The cost of chronic diseases depends upon
their acuity/severity (do they involve costly hospital services or primary health care services?), as well as their
incidence (for example, mental health problems are more common than diabetes). However, the 2008-09
expenditure estimates understate actual spending on specific chronic diseases as the AIHW is not able to
allocate about 30 per cent of recurrent health expenditure to specific disease or injury groups.
“These trends present a challenge to the conventional wisdom of Australia as an egalitarian society with
life chances so dramatically affected by occupation and socio-economic status. It is hard to argue that all
Australians are getting a ‘fair go’!” (Duckett and Willcox 2011)

C h r o n i c d i s e a s e s i n A u s t r a l i a : t h e c a s e f o r c h a n g i n g c o u r s e
7 | P a g e A u s t r a l i a n H e a l t h P o l i c y C o l l a b o r a t i o n 2 0 1 4
People with chronic diseases make frequent use of hospital services as shown by the following examples:
Cardiovascular disease: In 2007-08 cardiovascular disease was the main cause for 475,000
hospitalisations and played a secondary role in about another 800,000 admissions (AIHW 2011a). This is
equivalent to one in every 16 hospital admissions having a principal diagnosis of cardiovascular disease
and one in ten with cardiovascular disease as an additional diagnosis.
Cancer: In 2010-11 cancer was responsible for about 880,000 hospital admissions, equal to about one in
every ten hospital admissions. Three-quarters of these hospital admissions were for same-day care,
mainly chemotherapy (AIHW & Australasian Association of Cancer Registries 2012).
Kidney disease: Between 1991 and 2009, the number of people receiving dialysis or a kidney transplant
almost tripled, from 6,643 to 18,267 (AIHW 2012). Much of the growth in kidney disease is due to an
increase in diabetes-related cases. In 2009-10 there were over 1.1 million hospital admissions for
regular dialysis, an increase of 92 per cent from 2000-01. In 2009-10 dialysis accounted for between
one in every seven to eight hospital admissions. Projections are that the prevalence of treated end-
stage kidney disease (with diabetes as a primary cause) will further double between 2011 and 2020
(AIHW 2014b).
2.3 Chronic diseases cause significant productivity losses due to reduced workforce participation
The impacts of chronic diseases on health system costs are borne mainly by governments, private health
insurers and individuals (through out-of-pocket costs). In addition, the business sector is not immune to the
growing burden of chronic diseases, with its impact on reducing workforce participation and productivity.
Measuring the impact of reductions in risk factors and/or chronic diseases on workforce productivity and
economic growth is complex. Different studies can produce wide-ranging estimates depending upon the
assumptions used.
In 2007 the Productivity Commission attempted to model the impact on reductions in the prevalence of chronic
diseases on workforce participation and productivity. This modelling was done in the context of the National
Reform Agenda agreed to by the Council of Australian Governments (COAG) in February 2006. The Productivity
Commission estimated that the health initiatives being considered as part of the National Reform Agenda could
increase the rate of workforce participation by about 0.6 of a percentage point (equivalent to about 175,000
individuals) by 2030. This relatively modest impact on workforce participation reflected a range of conservative
assumptions by the Productivity Commission (for example, it adjusted downwards the results of published
studies showing improved outcomes to allow for non-compliance for lifestyle programs in ‘real world’
situations). The Productivity Commission also noted that it was challenging to model the workforce impact as at
“The projected increase in the prevalence of treated end-stage kidney disease has significant implications
for health service planning and resource allocation in the future, including the probable increasing need
for dialysis services and kidney transplants. However, these results also highlight the ongoing need to
prevent chronic kidney disease and the progression of chronic kidney disease to end-stage kidney disease,
by eliminating or reducing modifiable risk factors such as high blood pressure, tobacco smoking and
obesity.” (AIHW 2014b)

C h r o n i c d i s e a s e s i n A u s t r a l i a : t h e c a s e f o r c h a n g i n g c o u r s e
8 | P a g e A u s t r a l i a n H e a l t h P o l i c y C o l l a b o r a t i o n 2 0 1 4
the time of its study, the nature and scale of COAG’s health promotion and disease prevention initiatives had
not yet been determined.
More recently, using data from the AIHW, the BCA (2011) has identified the reduced rates of workforce
participation for people with multiple chronic diseases (Figure 2.4). People with three or more chronic diseases
are only about half as likely to be in the paid workforce as people with no chronic diseases (these data have
been age-standardised to adjust for increasing rates of chronic disease as people get older).
Figure 2.4: Increasing chronic disease is associated with decreasing workforce participation
Source: Business Council of Australia 2011, Selected facts and statistics on Australia’s healthcare sector,
Melbourne: BCA.
The impact of chronic disease extends beyond individuals with a chronic disease (or diseases) to family
members who often assume carer responsibilities. People who are primary carers have workforce participation
rates of 39 per cent; those who are non-primary carers have participation rates of 60 per cent; and people who
are not carers have participation rates of 68 per cent (BCA 2011).
The BCA’s estimate of a ten per cent improvement in workforce productivity is much higher than that of the
Productivity Commission. In part, this is because the BCA has assumed that all the productivity losses could be
converted to gains, based on the complete elimination of chronic diseases. This is not likely to be achievable.
VicHealth funded Deakin University and the National Stroke Research Institute (Cadilhac et al. 2009) to conduct
a research study that estimated the health status, economic and financial benefits of reducing the prevalence of
six behavioural risk factors that contribute to chronic diseases. To date, this study provides the most robust and
methodologically advanced approach to estimating the economic benefits of reducing chronic diseases through
reducing exposure to risk factors. This study:
“The loss to the labour force from people suffering from chronic disease – or their carers – was estimated
at 537,000 full-time person years and 47,000 part-time person years. If chronic disease was eliminated,
the full-time workforce and hence productivity could increase by 10 per cent.” (BCA 2011)

C h r o n i c d i s e a s e s i n A u s t r a l i a : t h e c a s e f o r c h a n g i n g c o u r s e
9 | P a g e A u s t r a l i a n H e a l t h P o l i c y C o l l a b o r a t i o n 2 0 1 4
Used databases from the ABS and the 2003 Australian Burden of Disease study to ensure consistent
national data inputs for each risk factor;
Included estimates for realistic changes in risk factor prevalence based on a detailed literature review
and consultation with experts;
Adjusted for the joint effects of multiple risk factors to avoid over-estimating the economic benefits;
and
Developed decision analytic models on workforce productivity, household production and leisure time
costs. The household production element examined the unpaid financial benefits of home-based work
(such as cooking, cleaning and caring for children) and how these are impacted by the six risk factors.
The six behavioural risk factors examined were smoking, high risk alcohol use, physical inactivity, intimate
partner violence, obesity and inadequate diet which, together, contributed about 16 per cent to the burden of
disease in Australia. Figure 2.5 shows the distribution of potential cost savings for each risk factor across
workforce productivity losses, household and leisure costs and health sector costs.
The study quantified the financial benefits that could be achieved through realistic reductions in the prevalence
of the six behavioural risk factors. The opportunity cost savings were conservatively estimated to be $2.334
billion over the lifetime of the 2008 Australian adult population. This comprised $1.504 billion in health sector
offsets and $0.830 billion in financial benefits associated with total production. These estimates are
conservative as they are based on preventing new cases of disease over the lifetime of the 2008 population, and
do not count recurrent events that may occur in people who already have a chronic disease (such as a second
stroke or heart attack).
Figure 2.5: Reducing risk factors will produce gains in workforce productivity, household and leisure
savings and health sector savings
Note: IPV is intimate partner violence; BMI is body mass index
Source: Cadilhac, D.A. et al. 2009, The health and economic benefits of reducing disease risk factors, Melbourne: Deakin
University & National Stroke Research Institute.
“Achieving realistic targets in the prevention of behavioural risk factors has implications beyond health
and is a core outcome for the whole of government...As the report highlights, we are all beneficiaries
when it comes to reducing the prevalence of these six behavioural risk factors.” (Cadilhac et al. 2009)

C h r o n i c d i s e a s e s i n A u s t r a l i a : t h e c a s e f o r c h a n g i n g c o u r s e
10 | P a g e A u s t r a l i a n H e a l t h P o l i c y C o l l a b o r a t i o n 2 0 1 4
2.4 Chronic diseases are caused by many factors, not just health behaviours
Many chronic diseases share common risk factors. For example, tobacco use is a risk factor for cardiovascular
disease, stroke, asthma and other respiratory conditions, diabetes and a range of cancers. The commonality of
risk factors across chronic diseases explains the increasing incidence of people living with multiple chronic
diseases.
In recent years there has been a growing policy focus on so-called ‘lifestyle’ behaviours (smoking, alcohol use,
physical activity, nutrition) in tackling chronic diseases. However, Figure 2.6 shows that the causes of chronic
diseases are multifactorial and extend beyond individual behaviours to include many external factors such as
social, environmental and socio-economic characteristics of the communities in which people live. Other
important contributors that impact on individuals include genetics, epigenetics (including the antenatal
environment) and levels of health literacy.
A broad ‘social determinants of health’ perspective (shown in Figure 2.6 and defined further below) has
important implications for actions required to prevent chronic disease. It moves the focus beyond the
behaviour of individuals (whether they smoke and/or drink) to identify how to reduce exposure to risk factors at
different stages of life and in different settings.
Figure 2.6: Health status (including chronic disease) is determined by many factors
Note: Blue shading highlights selected social determinants of health Source: Australian Institute of Health and Welfare 2014, Australia’s health 2014, Canberra: AIHW.
C h r o n i c d i s e a s e s i n A u s t r a l i a : t h e c a s e f o r c h a n g i n g c o u r s e
11 | P a g e A u s t r a l i a n H e a l t h P o l i c y C o l l a b o r a t i o n 2 0 1 4
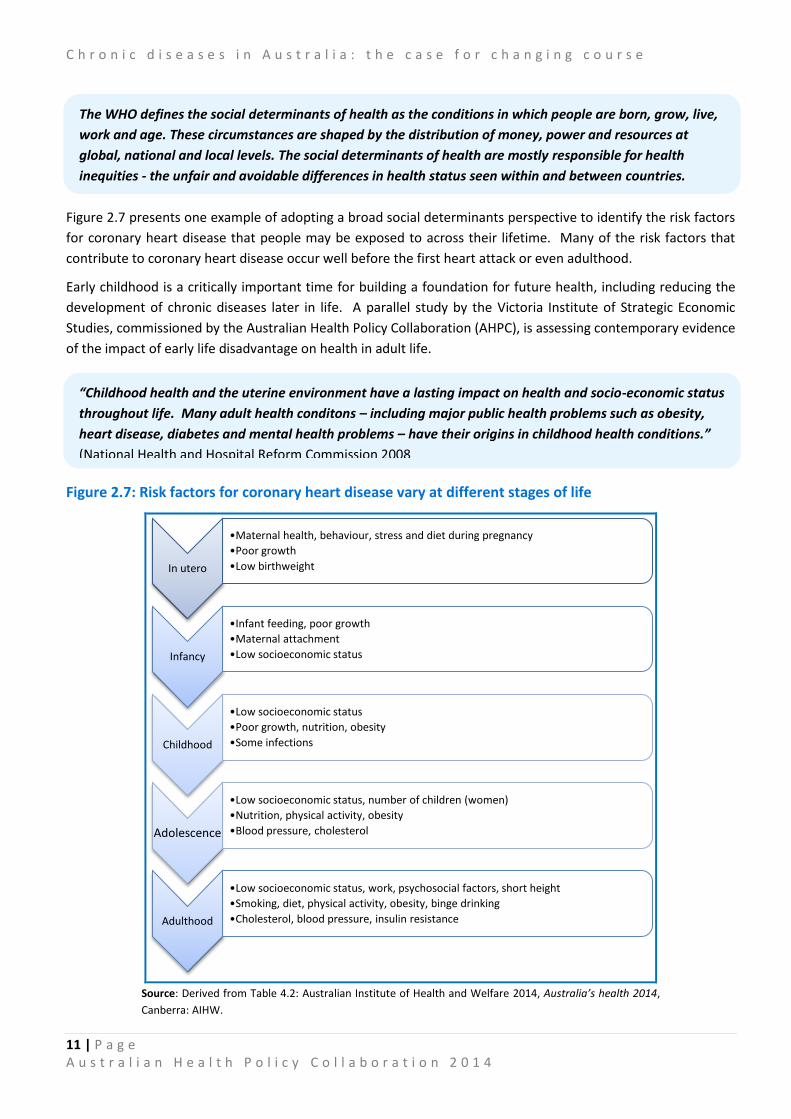
Figure 2.7 presents one example of adopting a broad social determinants perspective to identify the risk factors
for coronary heart disease that people may be exposed to across their lifetime. Many of the risk factors that
contribute to coronary heart disease occur well before the first heart attack or even adulthood.
Early childhood is a critically important time for building a foundation for future health, including reducing the
development of chronic diseases later in life. A parallel study by the Victoria Institute of Strategic Economic
Studies, commissioned by the Australian Health Policy Collaboration (AHPC), is assessing contemporary evidence
of the impact of early life disadvantage on health in adult life.
Figure 2.7: Risk factors for coronary heart disease vary at different stages of life
Source: Derived from Table 4.2: Australian Institute of Health and Welfare 2014, Australia’s health 2014,
Canberra: AIHW.
In utero
•Maternal health, behaviour, stress and diet during pregnancy
•Poor growth
•Low birthweight
Infancy
•Infant feeding, poor growth
•Maternal attachment
•Low socioeconomic status
Childhood
•Low socioeconomic status
•Poor growth, nutrition, obesity
•Some infections
Adolescence
•Low socioeconomic status, number of children (women)
•Nutrition, physical activity, obesity
•Blood pressure, cholesterol
Adulthood
•Low socioeconomic status, work, psychosocial factors, short height
•Smoking, diet, physical activity, obesity, binge drinking
•Cholesterol, blood pressure, insulin resistance
The WHO defines the social determinants of health as the conditions in which people are born, grow, live,
work and age. These circumstances are shaped by the distribution of money, power and resources at
global, national and local levels. The social determinants of health are mostly responsible for health
inequities - the unfair and avoidable differences in health status seen within and between countries.
“Childhood health and the uterine environment have a lasting impact on health and socio-economic status
throughout life. Many adult health conditons – including major public health problems such as obesity,
heart disease, diabetes and mental health problems – have their origins in childhood health conditions.”
(National Health and Hospital Reform Commission 2008

C h r o n i c d i s e a s e s i n A u s t r a l i a : t h e c a s e f o r c h a n g i n g c o u r s e
12 | P a g e A u s t r a l i a n H e a l t h P o l i c y C o l l a b o r a t i o n 2 0 1 4
Obesity is another area where there is a strong tendency to attribute causality (and blame) to individual
behaviours. Typically, the causes of obesity are portrayed as an ‘energy imbalance’ – too much food ‘in’ and not
enough physical activity ‘out’. However, the NPHT (2009) identified that health behaviours or ‘choices’ that
result in obesity are influenced by a complex web of individual and environmental factors (see Figure 2.8).
Individual behaviours are mediated through the environment. For example, food choices depend upon the
balance of environmental factors, including: access to affordable and nutritious foods; the increase in fast-food
outlets; widespread access to highly-processed foods; trends in portion sizes of food and drinks; marketing and
advertising of unhealthy foods; and access to food labelling information on ingredients.
Figure 2.8: Body weight is influenced by individual, behavioural and environmental factors
Source: National Preventative Health Taskforce 2009, Australia: The healthiest country by 2020 – the roadmap for action,
Canberra: Commonwealth of Australia.
In conclusion, the evidence on the need to take action on preventing chronic diseases is compelling. Nine in ten
deaths in Australia have chronic disease as an underlying cause. In addition, the burden of chronic diseases
threatens the sustainability of our health system and our future economic prosperity by reducing the
participation and productivity of our workforce.
Given the magnitude of these problems, the next chapter examines the evidence on preventing chronic
diseases. The evidence on where to focus effort to prevent and reduce the impact of chronic diseases is
becoming much better established.

C h r o n i c d i s e a s e s i n A u s t r a l i a : t h e c a s e f o r c h a n g i n g c o u r s e
13 | P a g e A u s t r a l i a n H e a l t h P o l i c y C o l l a b o r a t i o n 2 0 1 4
3. Chronic diseases can be prevented through cost-effective population health approaches
The increase in chronic diseases is frequently described in threatening terms as a ‘tsunami’ or ‘epidemic’ that
will wreak havoc on our health system and our economy. Implicit in this language is that although we might be
able to predict the upsurge in the prevalence of chronic diseases, there is little we can do to prevent its
occurrence.
That is far from the truth.
This chapter examines the evidence on preventability and how best to prevent chronic diseases. While Australia
has made substantial progress in reducing death rates from cardiovascular and other chronic diseases, much
more could be achieved through smart investment in cost-effective prevention strategies. First, however, it is
important to define what we mean by prevention.
3.1 There are many opportunities or levels at which prevention can occur
The concept and scope of what constitutes prevention has evolved significantly over time. Starfield and
colleagues (2008) have described how the concept of prevention has expanded from its original public health
meaning (with a strong focus on populations and ‘upstream’ action) to include the prevention of risk factors in
individuals and the management of chronic diseases by clinicians (equivalent to ‘downstream’ action).
The Australian Health Policy Collaboration uses a typology of prevention that was adopted in Australia by the
National Public Health Partnership (2006). This defines the levels of prevention according to a ‘stages of
disease’ continuum, with the typology comprising the following four levels of prevention:
Primordial prevention: this refers to preventing the emergence of predisposing social and
environmental conditions that can lead to causation of disease. It can also include population-based
interventions to prevent the development of risk factors that lead to chronic diseases. Examples of
primordial prevention include interventions to decrease the number of children who take up smoking,
such as regulation of age eligibility for purchase of cigarettes and plain packaging of tobacco.
Primary prevention: the next stage in the intervention chain is to limit the incidence (development of
new cases) of chronic diseases through eliminating or reducing specific risk factors and other
determinants, while promoting factors that are protective of health. Examples of primary prevention
include urban design that provides safe environments for walking, cycling and other physical activities
to encourage active lifestyles.
Secondary prevention: this involves reducing the progression of chronic diseases through early
detection (usually by screening at an asymptomatic stage) and early intervention. An example of
secondary prevention is dietary management and the promotion of physical activity for people at risk of
diabetes to reduce or delay the onset of that disease.
The WHO has estimated that at least 80 per cent of all heart disease, stroke and diabetes are preventable,
as are 40 per cent of all cancers. (WHO 2005)
C h r o n i c d i s e a s e s i n A u s t r a l i a : t h e c a s e f o r c h a n g i n g c o u r s e
14 | P a g e A u s t r a l i a n H e a l t h P o l i c y C o l l a b o r a t i o n 2 0 1 4
Tertiary prevention: this involves improving function and minimising the impact of established disease.
It also includes preventing or delaying complications through effective management and rehabilitation.
An example of tertiary prevention is cardiac rehabilitation for people who have established
cardiovascular disease and have suffered a heart attack.
The categories in this (or any) typology of prevention are not absolute. There is inevitably blurring across the
spectrum of prevention categories. A particular preventive intervention may be classified differently by
different stakeholders. However, this typology serves the purpose of defining what the Australian Health Policy
Collaboration means in discussing the scope of prevention of chronic diseases.
Two further concepts are next introduced, namely:
The value of a life course approach to preventing chronic diseases; and
The range of preventive interventions that can be used which include targeting individuals,
communities or entire populations.
3.2 Preventing chronic diseases involves starting early to reduce exposure to risks
Most health systems respond to chronic diseases through attempting to identify individuals at high risk of
chronic diseases and encouraging them to reduce their risk factors, usually late in life. That is the rationale, for
example, behind Medicare’s health check for people aged 45 to 49 years who are at risk of developing chronic
diseases. But there is widespread recognition that the development of chronic diseases is based on modifiable
risks to which people are exposed much earlier in life (Figure 3.1).
Taking a life course approach to preventing chronic diseases involves reducing risks at each stage of life
including early childhood (and in utero), adolescence and early adulthood, well before the onset of many
chronic diseases. A population-based approach to prevention that reduces risk factors at each stage of life will
need to be balanced with preventive strategies for high-risk populations. (The latter will involve secondary
prevention services delivered by primary health care and other health professionals focused on preventing
chronic disease through individually-based risk factor reduction).
The Queensland Chief Health Officer (2008) proposed that the three messages that are critical in adopting
a life course approach to the prevention of chronic diseases are:
1. The earlier the intervention the better
2. Intervene at strategic points in time; and
3. Intervene whenever there is an effective intervention.

C h r o n i c d i s e a s e s i n A u s t r a l i a : t h e c a s e f o r c h a n g i n g c o u r s e
15 | P a g e A u s t r a l i a n H e a l t h P o l i c y C o l l a b o r a t i o n 2 0 1 4
Figure 3.1: The risks of chronic disease accumulate over a lifetime
Source: World Health Organization (2005), Preventing chronic diseases: A vital investment,
Geneva: WHO.
Opportunities to prevent chronic diseases over the life course are outlined in Table 3.1.
Table 3.1: There are many opportunities to prevent chronic disease before its onset
Before birth Early childhood Adolescence
Improving nutritional status of mothers
Reducing maternal smoking
Improving access to antenatal services
Reducing exposure to tobacco smoke
Enhancing children’s mental health
Addressing overweight and obesity
Improving nutrition
Increasing physical activity
Encouraging sun-safe behaviour
Promoting healthy weight and physical activity
Discouraging the uptake of illicit drugs and harmful use of alcohol
Reducing the uptake of smoking
Providing safe and supportive environments for young people at risk of anxiety and depression
Source: Based upon: Queensland Health (2008), The health of Queenslanders: Prevention of chronic disease, Brisbane:
Queensland Health
A relevant example of the importance of adopting a life course approach to preventing chronic diseases relates
to the rapid increase in, and consequences of, childhood obesity (see Box 3.1).

C h r o n i c d i s e a s e s i n A u s t r a l i a : t h e c a s e f o r c h a n g i n g c o u r s e
16 | P a g e A u s t r a l i a n H e a l t h P o l i c y C o l l a b o r a t i o n 2 0 1 4
Box 3.1: Childhood obesity - the importance of early intervention
Risk factors for chronic diseases emerge and are already evident in childhood and adolescence. These include
obesity, high blood pressure, raised cholesterol levels and impaired glucose tolerance. Of particular concern is
that obesity in children appears to play a critical role and trigger the development of the other risk factors
(Aboderin et al. 2001).
Figure 3.2 shows the comparatively high rates of overweight and obesity for Australian boys and girls measured
in the recent 2011-12 Australian Health Survey. The same survey found that while high blood pressure
increases with age, it is already present in some young people. About one in 20 young men and women aged
18-24 years had measured high blood pressure (140/90mmHg or higher) (ABS 2013).
Figure 3.2: About one in four Australian children are overweight or obese
Source: ABS 2012, Australian Health Survey: First Results, 2011-12, Canberra: ABS
Until the early 1970s, Type 2 diabetes was almost exclusively a disease that affected adults. However, the
international trend of increased rates of obesity and overweight in children has seen Type 2 diabetes now
imposing a significant burden of disease on younger people. By 2005 almost one half (45 per cent) of all new-
onset cases of diabetes among children and adolescents were of Type 2 diabetes (WHO 2005). In Australia, over
1,500 adolescents (aged from 10-19 years) were diagnosed with Type 2 diabetes between 2002-03 and 2011-12
(AIHW 2014c). The management of Type 2 diabetes is more challenging in young people than adults, as well as
increasing the risk of complications due to the longer exposure to the disease.
17.1 16 17.6 19.2 17.6
4.1 8.7 7.1
7.4 7.7
0
5
10
15
20
25
30
2-4 years 5-7 years 8-11 years 12-15 year 16-17 years
Pe
r ce
nt
of
child
ren
Overweight Obese

C h r o n i c d i s e a s e s i n A u s t r a l i a : t h e c a s e f o r c h a n g i n g c o u r s e
17 | P a g e A u s t r a l i a n H e a l t h P o l i c y C o l l a b o r a t i o n 2 0 1 4
3.3 Preventive strategies can be directed towards populations and individuals
The typology of prevention (primordial, primary, secondary and tertiary) highlights that taking preventive action
on chronic diseases can occur in different settings (such as a GP clinic or through local council planning
guidelines). Prevention can be targeted at individuals (whether healthy, at risk, symptomatic or with
established chronic diseases), at communities (including geographically-based communities or specific
population groups such as Indigenous people or parents with young children) and at the total population.
Secondary and tertiary prevention activities are usually targeted at individuals (mainly at high-risk individuals
who have multiple risk factors for chronic diseases), while primordial and primary prevention activities can
influence the total population or specific communities, as well as individuals. By definition, population-based
prevention activities have greater reach and coverage than prevention activities targeted at individuals (Figure
3.3).
Figure 3.3: Prevention strategies that tackle the determinants and risk factors for chronic diseases at an environmental level have greater reach than individually based prevention
A population-based approach to prevention provides scope for multi-sectoral action involving many groups (e.g.
governments, industry and manufacturers, non-government organisations, health professionals) and many
settings (e.g. the workplace, community and sporting clubs, schools, health services). Such an approach can
complement the role of health professionals who will undertake prevention and management of high-risk
individuals.
Individuals
(e.g dietary advice for people with high blood
pressure)
Communities
(e.g. exercise programs for targeted groups)
Total population
(e.g. national salt reduction targets)

C h r o n i c d i s e a s e s i n A u s t r a l i a : t h e c a s e f o r c h a n g i n g c o u r s e
18 | P a g e A u s t r a l i a n H e a l t h P o l i c y C o l l a b o r a t i o n 2 0 1 4
The relative cost-effectiveness of population-based and individually targeted prevention interventions has been
examined in a recent American study (Chokshi & Farley 2012). Using the Boston Tufts Medical Center Cost
Effectiveness Registry, the researchers extracted all studies on prevention interventions which they classified
into three groups:
Environmental prevention: equivalent to population-based prevention, 31 studies (an example is
increasing fresh food availability in low income areas);
Clinical person-directed prevention: forms part of individual prevention, 401 studies (an example is
cancer screening); or
Non-clinical person-directed prevention: forms part of individual prevention but interventions are
delivered in non-clinical settings, 37 studies (an example is school-based smoking prevention programs).
All the prevention interventions were then examined to identify their cost-effectiveness ratio, which was
defined as the cost ($) per improved outcome as measured by quality adjusted life years (QALYs). Some
interventions were cost-saving (the cost per QALY was below zero), while other interventions required
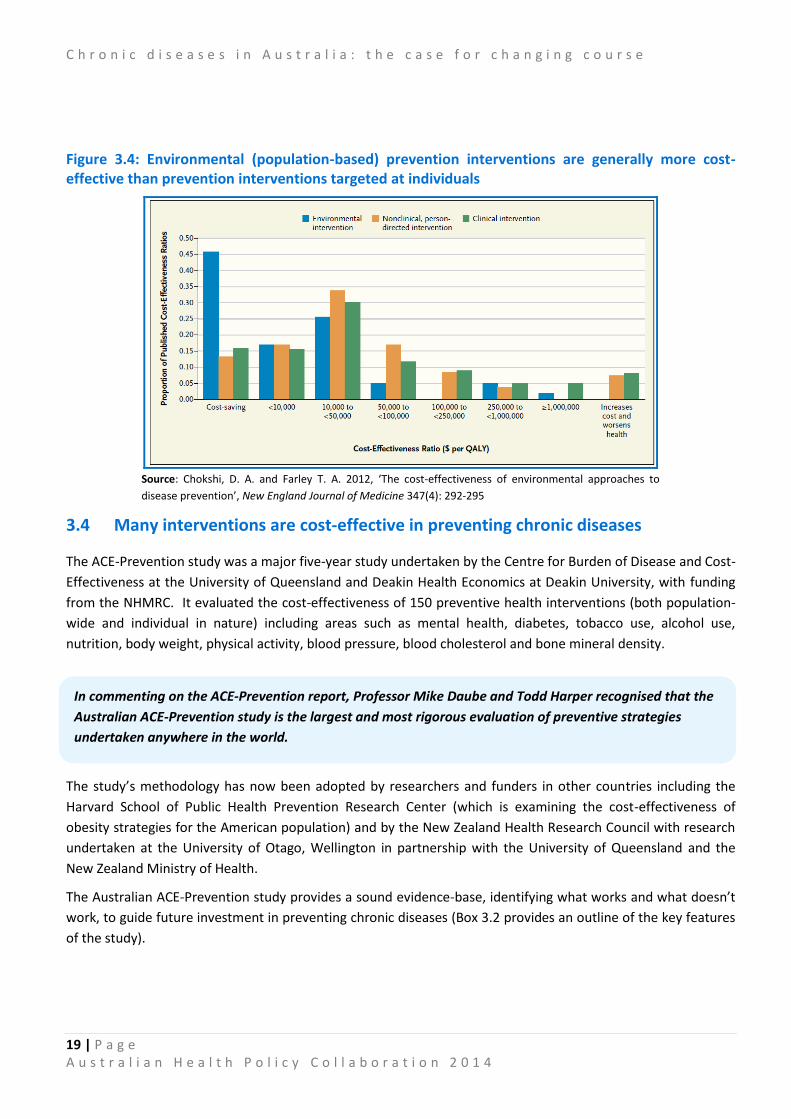
additional investment to generate improved outcomes. The researchers found that environmental prevention
interventions were generally more cost-effective than person-directed prevention interventions (including both
clinical and non-clinical interventions) (Figure 3.4). A much higher share of the environmental preventive
interventions (46 per cent) were cost-saving, compared to clinical interventions targeted at individuals (16 per
cent) or non-clinical interventions targeted at individuals (13 per cent).
The researchers identified two factors that are likely to contribute to environmental interventions being
generally more cost-effective, as follows:
Environmental interventions are likely to incur initial establishment costs but produce ongoing benefits,
whereas person-directed interventions are more likely to have ongoing costs associated with preventing
disease in high-risk individuals; and
The costs of environmental interventions are shared across the whole population. Small improvements
in health gain can translate to substantial improvements at a whole of population level, resulting in
many of these interventions being relatively cost-effective.
Figure 3.4 also illustrates that not all population-based interventions are cost-effective and individually-based
clinical interventions can be more cost-effective than population-based interventions in some cases. Australian
studies have also confirmed the value in preventive strategies that blend population-based and high-risk
approaches (Vartiainen et al. 2011). Hence, the evidence on whether specific preventive interventions work
needs to be examined for each intervention.
The National Preventative Health Taskforce (2009) identified principles for prevention including:
Shared responsibility: Develop strategic partnerships at all levels of government, industry, business,
unions, the non-government sector, research institutions and communities; and
Engaging communities: Act and engage with people where they live, work and play; at home, in
schools, workplaces and the community. Inform, enable and support people to make healthy
choices.
C h r o n i c d i s e a s e s i n A u s t r a l i a : t h e c a s e f o r c h a n g i n g c o u r s e
19 | P a g e A u s t r a l i a n H e a l t h P o l i c y C o l l a b o r a t i o n 2 0 1 4
Figure 3.4: Environmental (population-based) prevention interventions are generally more cost-effective than prevention interventions targeted at individuals
Source: Chokshi, D. A. and Farley T. A. 2012, ‘The cost-effectiveness of environmental approaches to
disease prevention’, New England Journal of Medicine 347(4): 292-295
3.4 Many interventions are cost-effective in preventing chronic diseases
The ACE-Prevention study was a major five-year study undertaken by the Centre for Burden of Disease and Cost-
Effectiveness at the University of Queensland and Deakin Health Economics at Deakin University, with funding
from the NHMRC. It evaluated the cost-effectiveness of 150 preventive health interventions (both population-
wide and individual in nature) including areas such as mental health, diabetes, tobacco use, alcohol use,
nutrition, body weight, physical activity, blood pressure, blood cholesterol and bone mineral density.
The study’s methodology has now been adopted by researchers and funders in other countries including the
Harvard School of Public Health Prevention Research Center (which is examining the cost-effectiveness of
obesity strategies for the American population) and by the New Zealand Health Research Council with research
undertaken at the University of Otago, Wellington in partnership with the University of Queensland and the
New Zealand Ministry of Health.
The Australian ACE-Prevention study provides a sound evidence-base, identifying what works and what doesn’t
work, to guide future investment in preventing chronic diseases (Box 3.2 provides an outline of the key features
of the study).
In commenting on the ACE-Prevention report, Professor Mike Daube and Todd Harper recognised that the
Australian ACE-Prevention study is the largest and most rigorous evaluation of preventive strategies
undertaken anywhere in the world.

C h r o n i c d i s e a s e s i n A u s t r a l i a : t h e c a s e f o r c h a n g i n g c o u r s e
20 | P a g e A u s t r a l i a n H e a l t h P o l i c y C o l l a b o r a t i o n 2 0 1 4
Box 3.2: Understanding and using the ACE-Prevention study
The ACE-Prevention study applied standardised evaluation methods to assess the comparative cost-
effectiveness of 123 preventive and 27 treatment interventions. Key elements of the methodology included:
Health sector perspective: The assessment of costs and benefits included the impact on governments and
individuals (such as out-of-pocket costs, travel costs, time costs and carer costs). This was broader than
many cost-effectiveness analyses which only examined the costs and benefits to governments as funders.
The primary analysis did not include production gains and losses in the wider economy and other non-health
sector impacts. However, when non-health sector impacts were relevant to particular interventions,
sensitivity analysis was undertaken to assess the significance of adopting a broader perspective.
Population under review: The study assessed the impact of the interventions on the Australian population
(or relevant sub-populations) using data on disease and mortality rates from the 2003 Australian Burden of
Disease study. This means that while some of the evidence on the interventions examined was from
international studies, they were reinterpreted to identify the specific impacts for the Australian population.
Measurement of outcomes: The study assessed the costs to avoid a DALY. The analysis compared each
intervention against ‘current practice’ or ‘do nothing’ scenarios. More DALYs ‘saved’ means a longer life, a
life with less disability, or a combination of these factors. The costs and outcomes were modelled based on
realistic expectations of how interventions would be implemented under routine health service conditions
in Australia (that is, real world conditions).
The analysis in the ACE-Prevention study can be used to map preventive interventions on a ‘cost-effectiveness
plane’, as shown in Figure 3.5. Mapping was on the basis of each intervention’s incremental cost-effectiveness
ratio (ICER), which is the ratio of net costs to net benefits of the intervention versus the current practice
comparator.
The preventive interventions were mapped to one of four quadrants:
South East Quadrant: The most favourable interventions (the ‘no brainer accept’) are described as
‘dominant’ – they improve health outcomes and achieve cost savings;
North West Quadrant: The least favourable interventions (the ‘no brainer reject’) are described as
‘dominated’ – they are less effective and result in additional costs;
North East Quadrant: These interventions produce improved health outcomes but at a higher cost than the
comparator;
South West Quadrant: These interventions are less effective but they are less costly than the comparator.
Among the interventions that generated net costs, the thresholds used in the study were that interventions
were assessed as cost-effective if they had a cost of $10,000 - $50,000/DALY, or as very cost-effective if they had
a cost of less than $10,000/DALY.

C h r o n i c d i s e a s e s i n A u s t r a l i a : t h e c a s e f o r c h a n g i n g c o u r s e
21 | P a g e A u s t r a l i a n H e a l t h P o l i c y C o l l a b o r a t i o n 2 0 1 4
Figure 3.5: Interventions can be mapped as to their relative cost-effectiveness
Source: Vos et al. 2010, Assessing cost-effectiveness in prevention (ACE-Prevention) Final Report,
University of Queensland, Brisbane and Deakin University, Melbourne.
The ACE-Prevention study provides a huge menu of options about how to intervene successfully, and at
relatively low cost, to reduce the incidence and impact of chronic diseases. There are many ways in which the
evidence can be used to aid decision-making about investing in interventions, such as:
Interventions can be selected based on those that have the largest population health impact (avoiding
the largest number of DALYs); or
Interventions can be selected on the basis that they are cost-saving – they produce measurable
improvements in health outcomes (avoiding DALYs) at the same time as resulting in cost savings to the
health system; or
Interventions can be selected for particular health priority areas (e.g. cancer) or where there is political
and community support to tackle specific risk factors.
There are no technically right answers. The ACE-Prevention study recognises that the evidence on cost-
effectiveness will be only one element of decision-making about how best to prevent chronic diseases. Other
factors (referred to as second-stage filters in the ACE-Prevention study) will need to be incorporated into
decision-making such as political and community acceptability, feasibility and sustainability. However, the ACE-
Prevention study highlights some of the as yet untaken opportunities (discussed in the following sections) to
reduce risk factors and lessen the burden of chronic diseases through investing in prevention.
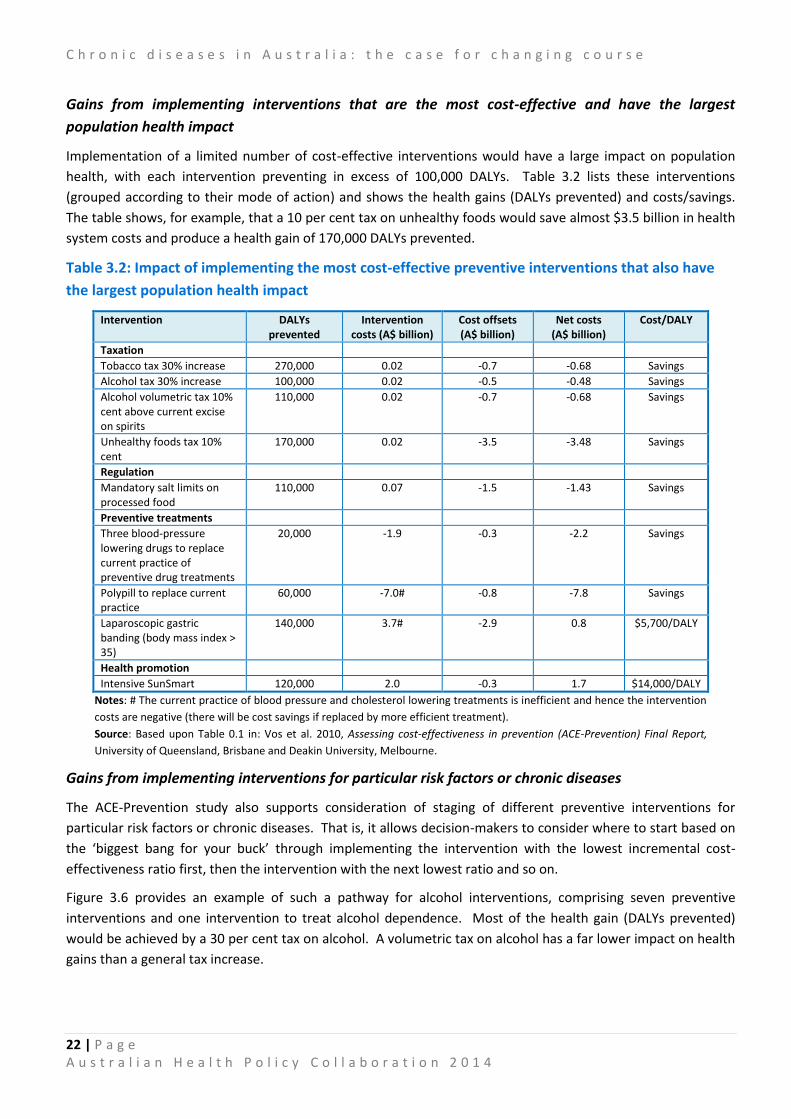
C h r o n i c d i s e a s e s i n A u s t r a l i a : t h e c a s e f o r c h a n g i n g c o u r s e
22 | P a g e A u s t r a l i a n H e a l t h P o l i c y C o l l a b o r a t i o n 2 0 1 4
Gains from implementing interventions that are the most cost-effective and have the largest
population health impact
Implementation of a limited number of cost-effective interventions would have a large impact on population
health, with each intervention preventing in excess of 100,000 DALYs. Table 3.2 lists these interventions
(grouped according to their mode of action) and shows the health gains (DALYs prevented) and costs/savings.
The table shows, for example, that a 10 per cent tax on unhealthy foods would save almost $3.5 billion in health
system costs and produce a health gain of 170,000 DALYs prevented.
Table 3.2: Impact of implementing the most cost-effective preventive interventions that also have
the largest population health impact
Intervention DALYs prevented
Intervention costs (A$ billion)
Cost offsets (A$ billion)
Net costs (A$ billion)
Cost/DALY
Taxation
Tobacco tax 30% increase 270,000 0.02 -0.7 -0.68 Savings
Alcohol tax 30% increase 100,000 0.02 -0.5 -0.48 Savings
Alcohol volumetric tax 10% cent above current excise on spirits
110,000 0.02 -0.7 -0.68 Savings
Unhealthy foods tax 10% cent
170,000 0.02 -3.5 -3.48 Savings
Regulation
Mandatory salt limits on processed food
110,000 0.07 -1.5 -1.43 Savings
Preventive treatments
Three blood-pressure lowering drugs to replace current practice of preventive drug treatments
20,000 -1.9 -0.3 -2.2 Savings
Polypill to replace current practice
60,000 -7.0# -0.8 -7.8 Savings
Laparoscopic gastric banding (body mass index > 35)
140,000 3.7# -2.9 0.8 $5,700/DALY
Health promotion
Intensive SunSmart 120,000 2.0 -0.3 1.7 $14,000/DALY
Notes: # The current practice of blood pressure and cholesterol lowering treatments is inefficient and hence the intervention
costs are negative (there will be cost savings if replaced by more efficient treatment).
Source: Based upon Table 0.1 in: Vos et al. 2010, Assessing cost-effectiveness in prevention (ACE-Prevention) Final Report,
University of Queensland, Brisbane and Deakin University, Melbourne.
Gains from implementing interventions for particular risk factors or chronic diseases
The ACE-Prevention study also supports consideration of staging of different preventive interventions for
particular risk factors or chronic diseases. That is, it allows decision-makers to consider where to start based on
the ‘biggest bang for your buck’ through implementing the intervention with the lowest incremental cost-
effectiveness ratio first, then the intervention with the next lowest ratio and so on.
Figure 3.6 provides an example of such a pathway for alcohol interventions, comprising seven preventive
interventions and one intervention to treat alcohol dependence. Most of the health gain (DALYs prevented)
would be achieved by a 30 per cent tax on alcohol. A volumetric tax on alcohol has a far lower impact on health
gains than a general tax increase.

C h r o n i c d i s e a s e s i n A u s t r a l i a : t h e c a s e f o r c h a n g i n g c o u r s e
23 | P a g e A u s t r a l i a n H e a l t h P o l i c y C o l l a b o r a t i o n 2 0 1 4
Figure 3.6: Implementation pathway for alcohol interventions
Notes: RBT = Random breath testing; Res. Treat = Residential treatment
Source: Vos et al. 2010, Assessing cost-effectiveness in prevention (ACE-Prevention) Final Report,
University of Queensland, Brisbane and Deakin University, Melbourne.
The study concluded that a package of seven preventive interventions could achieve a 31 per cent reduction in
the harmful health effects of alcohol. Taxation, advertising bans, and an increase in minimum legal drinking age
to 21 are cost-saving interventions, as indicated by the downward slope in the pathway above (Figure 3.6). Brief
intervention by a GP, licensing controls, drink driving mass media, and the current practice of random breath-
testing are cost-effective additions to the pathway. The slope of the line to residential treatment is very steep;
its inclusion in the pathway is not cost-effective.
Some of the key take-home messages from the ACE-Prevention study for other risk factors and chronic diseases
are summarised below. These are derived from the ACE-Prevention pamphlets available at
http://www.sph.uq.edu.au/index.html
Overweight and obesity
The study examined four interventions – two preventive interventions (a low fat diet or a diet and exercise
program) and two treatment interventions (Orlistat or Sibutramine) - all of which were targeted at overweight
and obese adults. Neither of the treatment interventions was cost-effective. The preventive interventions were
initially assessed as reasonably cost-effective (median costs per DALY of around $30,000 to $40,000). However,
the inclusion of participant costs for time and travel in the analysis resulted in the preventive interventions
being assessed as no longer cost-effective.

C h r o n i c d i s e a s e s i n A u s t r a l i a : t h e c a s e f o r c h a n g i n g c o u r s e
24 | P a g e A u s t r a l i a n H e a l t h P o l i c y C o l l a b o r a t i o n 2 0 1 4
The ACE-Prevention study concluded that:
Diet and exercise interventions can be reasonably cost-effective but are insufficient to substantially
reduce the burden due to overweight and obesity. In order to address the growing problem of obesity,
there is an urgent need to assess the (cost-) effectiveness of interventions that change the ‘obesogenic’
environment and target populations rather than individuals.
Physical activity interventions
The study examined six preventive interventions – four of which were population-based (a mass media-based
campaign, an active transport program called Travel Smart, a community program encouraging the use of
pedometers, and internet access to information on physical activity and advice); and two individually-based
interventions (physical activity prescriptions by GPs, and GP referral to an exercise physiologist). The study
concluded that:
The pedometer and mass-media based community campaigns and GP referral are very likely to lead to a
health gain at a cost-saving to the health sector. The internet-based intervention program, the GP
physical activity program, and the program to encourage more active transport are less likely to be cost-
saving, but still have a high probability of being under a A$50,000 per DALY threshold.
Taken as a package of interventions, all six physical activity interventions could lead to a substantial
improvement in population health at a cost-saving to the health sector. It is important to note, however,
that the evidence around physical activity interventions is relatively weak. There is uncertainty around
measures of intervention effect (particularly around sustainability of effects over the long term) and
uncertainty around the applicability of evidence from trials to the context of routine health care delivery.
Careful evaluation is recommended if these interventions are implemented on a larger scale in the
Australian health system.
Interventions to increase consumption of fruit and vegetables
The ACE-Prevention study examined 23 interventions for promoting fruit and vegetable intake across four
settings (the general population, supermarkets, workplaces and health care settings) and for one specified
population group (low income people). Twenty-two of the interventions aimed to change individual behaviour,
with only one intervention adopting a whole of community approach. The study concluded that:
None of the 23 interventions are currently in place in Australia. Only five out of 23 programs evaluated
for promoting fruit and vegetable intake are effective or cost-effective measures for improving
population health and those that are cost-effective would only have a small impact on population health.
Instead, we recommend more investment in evaluating interventions that target the whole population or
whole communities, such as changes to policies that influence fresh food prices or availability, to see if
these approaches can provide more effective and cost-effective incentives for improving fruit and
vegetable intake.

C h r o n i c d i s e a s e s i n A u s t r a l i a : t h e c a s e f o r c h a n g i n g c o u r s e
25 | P a g e A u s t r a l i a n H e a l t h P o l i c y C o l l a b o r a t i o n 2 0 1 4
Type 2 diabetes prevention
The study identified interventions that prevent or delay the onset of Type 2 diabetes in people with pre-
diabetes. It analysed three pharmaceutical and three lifestyle intervention programs for cost-effectiveness. The
study concluded that:
Screening for pre-diabetes followed by diet and exercise or metformin is cost-effective and should be
considered for incorporation into current practice. Workforce capacity of dietitians and exercise
physiologists to deliver lifestyle change interventions will need to be increased to appropriately support
the intervention.
This analysis was also undertaken separately for the Indigenous population and resulted in similar
recommendations. However, it was recommended that screening in the Indigenous population be targeted at
younger ages due to the earlier onset of Type 2 diabetes in Indigenous Australian populations.
Preventive interventions for adult depression
The study examined three individually-based interventions comprising: brief bibliotherapy; group-based
psychological therapy; and group-based therapy specifically for post-natal depression. All three interventions
were relatively cost-effective, with costs/DALY under $50,000. The study concluded that:
Screening in general practice for early signs of depression followed by brief interventions is cost-effective
and could avert up to 20 per cent of the burden of depression...The current analyses do not include all
potential benefits of such interventions, such as detecting untreated cases of a full-blown depressive
disorder, or impact on other mental disorders such as anxiety, so may be considered a conservative
estimate of cost-effectiveness.
Prevention of depression is still an emerging field of research and hence the evidence base is not yet fully
developed. There is enough evidence to recommend implementing these interventions in pilot studies
accompanied by evaluation to examine whether the benefits we have modelled can be realised.
Preventive interventions to reduce salt intake
Box 3.3 explores in more detail some of the issues in implementing preventive interventions to reduce salt
intake, one of the other risk factors examined in the ACE-Prevention study.
Box 3.3: Salt –a major risk factor that is not yet on the public radar
Despite the recent release of the New York Times best-seller Salt, Sugar and Fat: How the food giants hooked us
(Moss 2013), it would be fair to say that there is only limited public recognition of salt’s significant contribution
to chronic diseases. Moreover, Australia is lagging behind several other countries in taking effective action to
reduce salt intake in the general population.
Australians, similar to people in most other countries, consume salt that is considerably in excess of daily
requirements. Most of this salt is ‘invisible’ to consumers: studies have shown that about 75 per cent of all salt
consumed is included in processed foods, 10 per cent in fresh foods and only 15 per cent is added through
cooking or at the table (Beard 2004).
Almost two-thirds of strokes (62 per cent) and one half (49 per cent) of coronary heart disease events are
attributable to high blood pressure (Cappuccio and Capewell 2010). There is strong evidence of the link
between increased salt intake and raised blood pressure at the population level, with salt being a major
contributor to cardiovascular disease including stroke.

C h r o n i c d i s e a s e s i n A u s t r a l i a : t h e c a s e f o r c h a n g i n g c o u r s e
26 | P a g e A u s t r a l i a n H e a l t h P o l i c y C o l l a b o r a t i o n 2 0 1 4
The ACE-Prevention study examined the cost-effectiveness of four preventive interventions to reduce salt intake
comprising:
The Tick program: The National Heart Foundation’s (NHF) Tick program encourages voluntary reduction of
salt in breads (<450mg sodium/100g), margarines (<400mg sodium/100g) and cereals (<400mg
sodium/100g). This program is essentially ‘current practice’.
Mandatory limits: This intervention would involve legislation and enforcement so that all bread, margarine
and cereal products met the limits in the Tick program.
Dietary advice (for people with BP >140mmHg): Individual and group counselling.
Dietary advice (for people with BP > 115mmHg): Individual and group counselling.
The ACE-Prevention study found that there is zero probability of dietary advice being cost-saving or cost-
effective, even when targeted at people with hypertension. It also determined that while the current Tick
program is effective, making salt restrictions mandatory for manufacturers could achieve twenty times the
population health gain. Table 3.2 showed that mandatory salt limits would achieve savings to the health system
of $1.43 billion and result in major health gains (110,000 DALYs prevented). Mandatory limits on salt in bread,
cereals and margarine was one of the interventions classified by the authors of the ACE-Prevention study as
having such strong cost-effectiveness credentials that it should not be ignored without compelling reasons.
Through the Australian Dietary Guidelines, the National Health and Medical Research Council advises that
people ‘need to choose foods and drinks more wisely’. The specific guideline for salt is ‘to limit intake of foods
and drinks containing added salt’, with the recommendation that people choose foods with less than 120mg of
sodium/100g (NHMRC 2013a; 2013b).
Choosing wisely is easier said than done. The NHMRC guidelines (120mg sodium/100g) are considerably lower
than those used in the NHF Tick program, which itself is voluntary. This means that there are many food groups
(for example, bread and cheese) where there are essentially no available products that meet the NHMRC
definitions of ‘low salt’ products. In 2009 the National Preventative Health Taskforce recommended the
introduction of food labelling on the front of packs and menus including salt, energy, sugar and fats. This has
not yet been implemented.
Other countries (including England and New Zealand) have introduced national salt reduction targets and/or
food labelling that has created an incentive for manufacturers to reformulate their products (NPHT 2009).
3.5 The ACE-Prevention study provides a robust framework for tackling chronic
diseases
The ACE-Prevention study is a rich resource that can be used by stakeholders to take action to prevent chronic
diseases. It can influence resource allocation through: directing available funding towards the most cost-
effective services; modifying the approach to service provision to improve cost-effectiveness; and disinvesting in
services that are not cost-effective.

C h r o n i c d i s e a s e s i n A u s t r a l i a : t h e c a s e f o r c h a n g i n g c o u r s e
27 | P a g e A u s t r a l i a n H e a l t h P o l i c y C o l l a b o r a t i o n 2 0 1 4
In summary, the ACE-Prevention study concludes:
“Many interventions for prevention have very strong cost-effectiveness credentials (43 that are either
dominant or cost less than $10,000 per DALY prevented). Such interventions should only be ignored if
decision-makers have very serious reservations about the evidence base or are facing insurmountable
problems in relation to stakeholder acceptability or feasibility of implementation. Another group of
interventions (31) are good value for money compared to the decision threshold of less than $50,000
per DALY prevented.
Many interventions for prevention have poor cost-effectiveness credentials (38); an insufficient
evidence base (4); are associated with more harm than benefit (‘dominated’: 2); or are dominated by
more cost –effective alternatives (2). It is vital to recognise that prevention is not always value for
money and is not always ‘better than cure’. These interventions should only be implemented if there
are compelling social justice reasons to do so (e.g. the ‘rule of rescue’ or special equity needs) or, for
dominated interventions, an important ’clinical place’ rationale can be demonstrated.”

C h r o n i c d i s e a s e s i n A u s t r a l i a : t h e c a s e f o r c h a n g i n g c o u r s e
28 | P a g e A u s t r a l i a n H e a l t h P o l i c y C o l l a b o r a t i o n 2 0 1 4
4. Actions required to prevent chronic diseases
Over the last two decades there has been a strong focus on developing strategic frameworks and plans to tackle
chronic diseases, both in Australia and internationally.
This chapter first examines the WHO Global Action Plan for the prevention and control of non-communicable
diseases 2013-2020, together with recent progress and the current status of Australian efforts to prevent
chronic disease. It then outlines the AHPC’s commitment to developing a national action plan for chronic
disease prevention. This would be supported by a national coalition of health experts and scientists, informed
by evidence-based research, and guided by key directions about how to best prevent chronic diseases.
4.1 Australia has signed up to the WHO Global Action Plan for chronic disease
The WHO Global Action Plan was adopted by the World Health Assembly in May 2013. This followed in principle
agreement by member countries in 2011 to update the previous 2008-2013 Global Action Plan and to progress
global monitoring of non-communicable diseases. The Australian Government made submissions contributing
to the development of the Global Action Plan and has provided information in 2010 and 2014 on its capacity to
address non-communicable diseases.
The Global Action Plan provides a road map and menu of policy options to reduce the global burden of chronic
diseases. It includes a global monitoring framework to track progress, with the framework comprising a set of
nine voluntary global targets and 25 indicators (see Figure 4.1 for the targets). The overall objective is to
achieve a 25 per cent reduction in premature mortality from non-communicable diseases by 2025 (known as the
25 x 25 target) (Beaglehole et al. 2014), with intermediate monitoring in 2015 and 2020.
Figure 4.1: There are measurable global targets to reduce chronic disease
Source: WHO 2011, NCD global monitoring framework, Geneva: WHO.
Within the context of global targets, the WHO has urged governments to set “national targets for non-
communicable disease for 2025 based on national circumstances”. The baseline against which performance on
the targets is to be measured is 2010.

C h r o n i c d i s e a s e s i n A u s t r a l i a : t h e c a s e f o r c h a n g i n g c o u r s e
29 | P a g e A u s t r a l i a n H e a l t h P o l i c y C o l l a b o r a t i o n 2 0 1 4
As part of developing the Global Action Plan, the WHO invited countries to assess their capacity to tackle non-
communicable diseases. Country profiles were then produced by the WHO for each country in 2010 and 2014.
Figure 4.2 shows the WHO profile of Australia’s mortality and risk factors related to NCDs, while Figure 4.3
provides the self-reported assessment by Australia of its readiness to address and respond to NCDs.
Figure 4.2: Australia has performed well in reducing NCD mortality rates but NCDs are still the major
cause of death
Source: WHO (2014), Non-Communicable Disease Country profiles, Geneva: WHO.
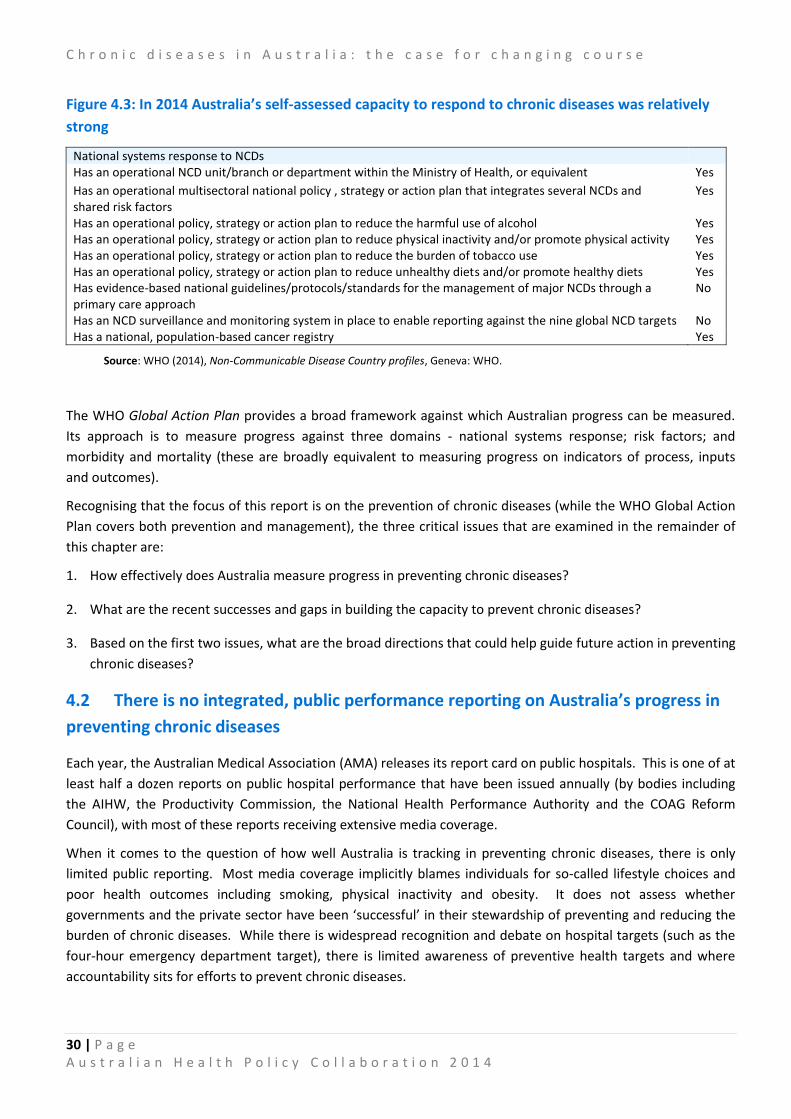
C h r o n i c d i s e a s e s i n A u s t r a l i a : t h e c a s e f o r c h a n g i n g c o u r s e
30 | P a g e A u s t r a l i a n H e a l t h P o l i c y C o l l a b o r a t i o n 2 0 1 4
Figure 4.3: In 2014 Australia’s self-assessed capacity to respond to chronic diseases was relatively
strong
National systems response to NCDs Has an operational NCD unit/branch or department within the Ministry of Health, or equivalent Yes
Has an operational multisectoral national policy , strategy or action plan that integrates several NCDs and shared risk factors
Yes
Has an operational policy, strategy or action plan to reduce the harmful use of alcohol Yes Has an operational policy, strategy or action plan to reduce physical inactivity and/or promote physical activity Yes Has an operational policy, strategy or action plan to reduce the burden of tobacco use Yes Has an operational policy, strategy or action plan to reduce unhealthy diets and/or promote healthy diets Yes Has evidence-based national guidelines/protocols/standards for the management of major NCDs through a primary care approach
No
Has an NCD surveillance and monitoring system in place to enable reporting against the nine global NCD targets No Has a national, population-based cancer registry Yes
Source: WHO (2014), Non-Communicable Disease Country profiles, Geneva: WHO.
The WHO Global Action Plan provides a broad framework against which Australian progress can be measured.
Its approach is to measure progress against three domains - national systems response; risk factors; and
morbidity and mortality (these are broadly equivalent to measuring progress on indicators of process, inputs
and outcomes).
Recognising that the focus of this report is on the prevention of chronic diseases (while the WHO Global Action
Plan covers both prevention and management), the three critical issues that are examined in the remainder of
this chapter are:
1. How effectively does Australia measure progress in preventing chronic diseases?
2. What are the recent successes and gaps in building the capacity to prevent chronic diseases?
3. Based on the first two issues, what are the broad directions that could help guide future action in preventing
chronic diseases?
4.2 There is no integrated, public performance reporting on Australia’s progress in
preventing chronic diseases
Each year, the Australian Medical Association (AMA) releases its report card on public hospitals. This is one of at
least half a dozen reports on public hospital performance that have been issued annually (by bodies including
the AIHW, the Productivity Commission, the National Health Performance Authority and the COAG Reform
Council), with most of these reports receiving extensive media coverage.
When it comes to the question of how well Australia is tracking in preventing chronic diseases, there is only
limited public reporting. Most media coverage implicitly blames individuals for so-called lifestyle choices and
poor health outcomes including smoking, physical inactivity and obesity. It does not assess whether
governments and the private sector have been ‘successful’ in their stewardship of preventing and reducing the
burden of chronic diseases. While there is widespread recognition and debate on hospital targets (such as the
four-hour emergency department target), there is limited awareness of preventive health targets and where
accountability sits for efforts to prevent chronic diseases.

C h r o n i c d i s e a s e s i n A u s t r a l i a : t h e c a s e f o r c h a n g i n g c o u r s e
31 | P a g e A u s t r a l i a n H e a l t h P o l i c y C o l l a b o r a t i o n 2 0 1 4
Australia has had two main sets of targets and/or indicators that cover issues related to preventing chronic
diseases:
1. The NPA on Preventive Health: This NPA was specifically established ‘to address the rising prevalence of
lifestyle related chronic diseases’. It specified outcomes, benchmarks and indicators to measure
progress in preventing chronic diseases.
2. The Performance and Accountability Framework: This framework identifies indicators against which
the performance of public hospitals and primary health care organisations are measured. Some of the
indicators relate to risk factors for chronic diseases.
Table 4.1 maps the targets included in the NPA on Preventive Health and the Performance and Accountability
Framework against those specified in the WHO Global Action Plan. Based on this table (and the
implementation/reporting arrangements for the NPA on Preventive Health and the Performance and
Accountability Framework), the Australian Health Policy Collaboration has evaluated Australia’s work towards
measuring progress in preventing chronic diseases. We conclude that:
Australia is focussing on a narrow suite of indicators to measure the prevention of chronic
diseases
The WHO Global Action Plan includes measurable targets in six risk factor prevention domains (this is effectively
seven domains as diabetes and obesity can be assessed as separate targets notwithstanding their aggregation in
the WHO plan). The Australian indicators provide a more limited coverage of risk factors, focussing on only
smoking, physical activity, body weight and consumption of fruits and vegetables. Australia has not established
measurable targets for tackling harmful alcohol use, reducing salt intake or reducing blood pressure.
Australian governments have also not yet committed to measurable targets related to the desired outcomes of
reduced mortality from (or even reduced prevalence of) chronic diseases.
While the Australian targets are narrow in scope, they are challenging relative to the WHO
targets and their achievement would represent considerable progress in preventing chronic diseases
The targets in the NPA on Preventive Health used different baselines and measurement points than those
included in the WHO Global Action Plan. Nonetheless, the NPA did include genuine ‘stretch’ targets that would
represent meaningful improvements in risk factor reduction.
The AIHW (2014) has reported that the daily smoking rate in Australia in 2010 (the baseline year for the WHO
targets) was 16 per cent for adults. Hence, the NPA target of reducing the daily smoking rate to 10 per cent
would represent a 60 per cent reduction from 2010 to be achieved by 1 January 2019. This is more challenging
than the WHO target of a 30 per cent reduction by 2025, particularly given that Australian smoking rates are
already among the lowest in the world. However, Australia is making good progress, with the most recent
National Drug Strategy Household Survey (Australian Government Department of Health 2014) reporting adult
smoking rates of 13.3 per cent in 2013.
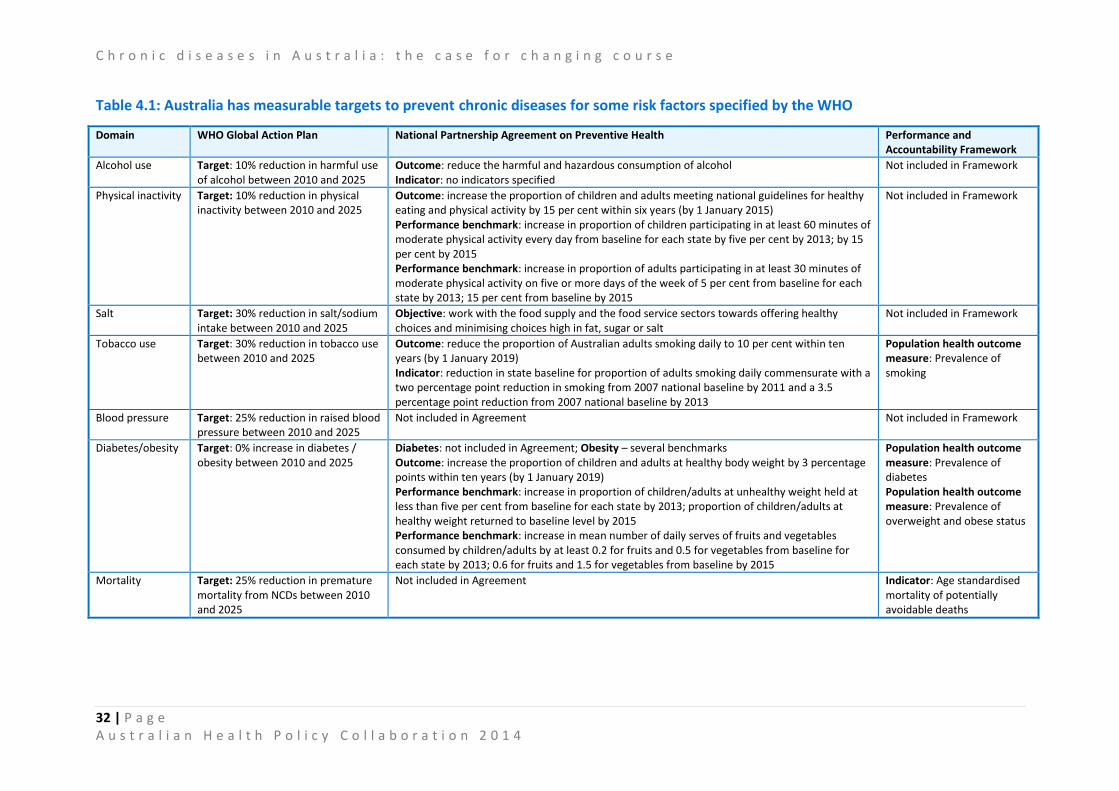
C h r o n i c d i s e a s e s i n A u s t r a l i a : t h e c a s e f o r c h a n g i n g c o u r s e
32 | P a g e A u s t r a l i a n H e a l t h P o l i c y C o l l a b o r a t i o n 2 0 1 4
Table 4.1: Australia has measurable targets to prevent chronic diseases for some risk factors specified by the WHO
Domain WHO Global Action Plan National Partnership Agreement on Preventive Health Performance and Accountability Framework
Alcohol use Target: 10% reduction in harmful use of alcohol between 2010 and 2025
Outcome: reduce the harmful and hazardous consumption of alcohol Indicator: no indicators specified
Not included in Framework
Physical inactivity Target: 10% reduction in physical inactivity between 2010 and 2025
Outcome: increase the proportion of children and adults meeting national guidelines for healthy eating and physical activity by 15 per cent within six years (by 1 January 2015) Performance benchmark: increase in proportion of children participating in at least 60 minutes of moderate physical activity every day from baseline for each state by five per cent by 2013; by 15 per cent by 2015 Performance benchmark: increase in proportion of adults participating in at least 30 minutes of moderate physical activity on five or more days of the week of 5 per cent from baseline for each state by 2013; 15 per cent from baseline by 2015
Not included in Framework
Salt Target: 30% reduction in salt/sodium intake between 2010 and 2025
Objective: work with the food supply and the food service sectors towards offering healthy choices and minimising choices high in fat, sugar or salt
Not included in Framework
Tobacco use Target: 30% reduction in tobacco use between 2010 and 2025
Outcome: reduce the proportion of Australian adults smoking daily to 10 per cent within ten years (by 1 January 2019) Indicator: reduction in state baseline for proportion of adults smoking daily commensurate with a two percentage point reduction in smoking from 2007 national baseline by 2011 and a 3.5 percentage point reduction from 2007 national baseline by 2013
Population health outcome measure: Prevalence of smoking
Blood pressure Target: 25% reduction in raised blood pressure between 2010 and 2025
Not included in Agreement Not included in Framework
Diabetes/obesity Target: 0% increase in diabetes / obesity between 2010 and 2025
Diabetes: not included in Agreement; Obesity – several benchmarks Outcome: increase the proportion of children and adults at healthy body weight by 3 percentage points within ten years (by 1 January 2019) Performance benchmark: increase in proportion of children/adults at unhealthy weight held at less than five per cent from baseline for each state by 2013; proportion of children/adults at healthy weight returned to baseline level by 2015 Performance benchmark: increase in mean number of daily serves of fruits and vegetables consumed by children/adults by at least 0.2 for fruits and 0.5 for vegetables from baseline for each state by 2013; 0.6 for fruits and 1.5 for vegetables from baseline by 2015
Population health outcome measure: Prevalence of diabetes Population health outcome measure: Prevalence of overweight and obese status
Mortality Target: 25% reduction in premature mortality from NCDs between 2010 and 2025
Not included in Agreement Indicator: Age standardised mortality of potentially avoidable deaths

33 | P a g e A u s t r a l i a n H e a l t h P o l i c y C o l l a b o r a t i o n 2 0 1 4
Similarly, the NPA obesity-related targets aimed to essentially slow the increase in unhealthy weight so that by
2015 the proportion of children/adults at unhealthy weight is brought back to 2007 levels and that subsequently
the proportion of children/adults at healthy body weight increases by 1 January 2019. Again, these targets
appear to have been more challenging than the WHO target to have zero increase in obesity by 2025.
The NPA targets on physical activity and consumption of fruit and vegetables are also meaningful and are more
clearly specified than the targets in the WHO Global Action Plan.
The National Partnership Agreement on Preventive Health included measurable targets, whereas
the Performance and Accountability Framework does not set targets related to the prevention of
chronic diseases
The NPA on Preventive Health provided better coverage of risk factors for chronic diseases than the
Performance and Accountability Framework (which is to be expected, given their individual remits). Equally
importantly, the NPA on Preventive Health included measurable ‘targets’ for reducing risk factors for chronic
diseases. (The NPA did not actually use the language of targets, but instead used a hierarchy of outcomes,
outputs and performance benchmarks. The performance benchmarks in the NPA were measurable, as were
some of the outcomes).
In contrast, the Performance and Accountability Framework does not include targets for reducing chronic
disease mortality or risk factors. Instead, most of the risk factor measures are included ‘to provide context for
the interpretation of Medicare Local performance indicators’. While their inclusion would allow trends to be
monitored, there is no benchmark or target against which performance will be assessed.
There is no regular public reporting against chronic disease prevention targets
One major gap in the commitment of Australian governments is that there is effectively no regular public
reporting against the chronic disease prevention targets. The NPA on Preventive Health required states and
territories to provide reports outlining performance against benchmarks as at 30 June 2013 and 31 December
2014, but there was and is no requirement for these reports to be made public. This significantly reduced
accountability for the targets.
More broadly, the COAG Reform Council had responsibility for monitoring the performance of various national
agreements and national partnership agreements. It published reports analysing performance against three
other health-related NPAs (Improving Public Hospital Services; Essential Vaccines; and the Elective Surgery
Waiting List Reduction Plan), but it did not publish any analysis of performance under the NPA on Preventive
Health.
The COAG Reform Council (2014) did take the opportunity in its penultimate health report, Healthcare in
Australia 2012–13: Five years of performance, to report more generally on chronic diseases including the
prevalence of risk factors and the prevalence and incidence of several chronic diseases. However, data was only
publicly reported for two of the performance benchmarks in the NPA on Preventive Health.
~

34 | P a g e A u s t r a l i a n H e a l t h P o l i c y C o l l a b o r a t i o n 2 0 1 4
The COAG Reform Council concluded that progress on smoking rates is positive but not necessarily sufficient,
and the lack of significant progress in improving healthy body weight and tackling obesity is of concern as it may
result in an increase in the incidence of Type 2 diabetes.
In summary, while Australia has developed measurable targets, there has been no comprehensive, regular
reporting of how Australia is tracking in preventing chronic diseases.
There is no ongoing commitment to measure progress on preventing chronic diseases with the
cessation of the NPA on Preventive Health and the COAG Reform Council
Government infrastructure for funding and measuring progress on preventing chronic diseases has now ceased
to exist.
The National Healthcare Agreement (the umbrella or framework agreement for all the partnership agreements)
includes two of the performance benchmarks (daily smoking rates and healthy body weight) that were included
in the former NPA on Preventive Health. (It also includes a performance benchmark to reduce the age-adjusted
prevalence rate for Type 2 diabetes to 2000 levels by 2023). However, the funding vehicle for driving these
improvements was the NPA on Preventive Health with its tied funding for investing in programs to reduce the
prevalence of chronic disease risk factors (programs included workplace-based, community-based and those
that targeted specific populations, such as children). The abolition of the COAG Reform Council means that
there is no ongoing commitment to national reporting on targets for the prevention of chronic diseases through
any of the intergovernmental agreements.
4.3 Action on preventing chronic diseases has been ‘two steps forward, one step
back’ in recent years
The second issue that is critical in determining ‘where to next’ is having a clear understanding of recent
successes and gaps in our capacity to prevent chronic diseases.
In 2014 the Australian Government Department of Health provided a fairly positive self-assessment to the WHO
of Australia’s capacity to address NCDs (as shown earlier in Figure 4.3). That assessment was based on: the
The COAG Reform Council (2014) reported on performance against two of the risk factor performance
benchmarks included in the NPA on Preventive Health.
Daily smoking rates
There was a significant fall from 19.1 per cent in 2007-08 to 16.3 per cent in 2011-12. “While the
national smoking rate has fallen over time, it may need to fall faster to meet the benchmark set by
COAG to reduce the rate to 10 per cent by 2018.”
Health body weight for adults and children
“There was no significant change in the proportion of adults or children at a healthy body weight
between 2007-08 and 2011-12. In 2011-12, 69.8 per cent of children were ‘normal weight’, up from
67.7 per cent in 2007-08. The 2018 target is 72.7 per cent. In 2011-12, 35.7 per cent of adults were
‘normal weight’, down from 36.9 per cent in 2007-08. The 2018 target is 41.9 per. “

35 | P a g e A u s t r a l i a n H e a l t h P o l i c y C o l l a b o r a t i o n 2 0 1 4
existence of operational policies, strategies or action plans for NCDs and risk factors; nominated responsibility
for NCDs within the Commonwealth Department of Health; and the existence of a national, population-based
cancer registry. Notably, in its self-assessment, the Australian Government indicated that it did not have two key
elements in place, namely:
Evidence-based national guidelines/protocols/standards for the management of major NCDs through a
primary care approach; and
An NCD surveillance and monitoring system to enable reporting against the nine global NCD targets.
The Australian Health Policy Collaboration has built upon the WHO assessment framework to identify four
domains against which progress in preventing chronic diseases can be evaluated. The domains are:
1. A national commitment to preventing chronic diseases (given force through a national strategy, action
plan or agreement with identified responsibilities and public accountability);
2. Backed up by dedicated funding to allow investment in evidence-based primary prevention of chronic
disease interventions;
3. Given effect by a broad multi-faceted approach to prevention that includes an array of approaches
(such as pricing, regulation, social marketing, education) for use in a variety of sectors (such as transport
and urban planning), settings (such as workplace and local communities) and population groups (such as
targeting across the life course or disadvantaged groups); and
4. Underpinned by national infrastructure, research and evaluation capabilities (including the existence of
core national datasets to monitor progress on risk factors, chronic diseases and their economic impacts;
and a commitment to investing in research to evaluate and monitor the effectiveness of prevention
interventions).
Using the above framework and the preliminary progress report provided below, the Australian Health Policy
Collaboration will seek advice from relevant experts as to the opportunities that might be leveraged to
strengthen prevention activities for chronic diseases.
There is a preventative health strategy, but there is no clear pathway for ongoing action
In 2005 Australia had a National Chronic Disease Strategy with five supporting national service improvement
frameworks (asthma; cancer; diabetes; heart, stroke and vascular disease; and osteoarthritis, rheumatoid
arthritis and osteoporosis). This reflected commitment by all Australian Health Ministers to an action agenda
for the prevention and treatment of chronic diseases (National Health Priority Action Council 2005). The
National Chronic Disease Strategy is no longer operational.
In 2014 the closest equivalent to an overarching strategy for the prevention of chronic diseases is the National
Preventative Health Strategy (National Preventative Health Taskforce 2009). However, in terms of agreed
commitments, the effective strategy is Taking Preventative Action – the Australian Government’s response to
the work of the NPHT (Australian Government 2010). As already noted, these frameworks focus mainly on risk
factors related to tobacco, alcohol and obesity. There are specific strategies or frameworks for some other
chronic diseases (such as the Roadmap for national mental health reform 2012-2022), although it is not always
evident that these strategies remain operational in guiding actions.
The implementation of the Australian Government’s response to the work of the NPHT was to be driven and
nationally coordinated through the ANPHA with funding under the NPA on Preventive Health. For example,
ANPHA had responsibility for the National Binge Drinking Strategy. Following the abolition of ANPHA and the
~

36 | P a g e A u s t r a l i a n H e a l t h P o l i c y C o l l a b o r a t i o n 2 0 1 4
cessation of the NPA, some of ANPHA’s functions are being transferred to the Australian Government
Department of Health.
In the absence of ANPHA and the NPA, there is no clear pathway under which the Australian, state and territory
governments have shared objectives and goals that reflect the evidence of population health and national
economic benefit identified in the National Preventative Health Strategy.
There is no longer identified funding for the prevention of chronic diseases nor ongoing reporting
on expenditure on public health and prevention
The NPA on Preventive Health provided just over $870 million in funding from 2009-10 to 2017-18, and included
the introduction of new programs to reduce risk factors and prevent chronic diseases in schools, workplaces and
in the community. The 2014-15 Australian Government Budget indicated that there would be savings of $368
million over the four years from 2014-15 to 2017-18 arising as a result of the cessation of the NPA on Preventive
Health. The Budget indicated that these savings would be invested by the Australian Government in the
Medical Research Future Fund. As already indicated, the cessation of the NPA on Preventive Health means that
there is no longer ‘tied’ funding for the delivery of programs to prevent chronic diseases.
Until 2011 the AIHW published detailed annual reports tracking expenditure by the Australian and State
governments on public health (comprising immunisation, screening, health promotion, environmental health,
food standards, drug use prevention, communicable disease control and public health research). Expenditure
on public health as a share of all recurrent health expenditure reached a peak of 2.22 per cent in 2007-08 under
the previous Public Health Outcome Funding Agreements (after averaging between 1.8 to 2.0 per cent for much
of the previous decade) (AIHW 2011b). The most recent expenditure data from the AIHW is for 2012-13, during
which public health accounted for only 1.54 per cent of total recurrent health expenditure (AIHW 2014d). The
cessation of detailed reporting by the AIHW on public health expenditure coincided with the completion of the
Public Health Outcome Funding Agreements.
By international standards, Australian spending on prevention is low. The OECD reports expenditure on
‘prevention and public health services’ using data reported from each country. Although there may be issues
with comparability of how expenditure data are classified and reported between countries, the OECD data
provides some ‘ballpark’ comparisons of Australia’s relative investment in prevention. The OECD (2014)
reported that in 2011 Australian expenditure on ‘prevention and public health services’ as a share of total
recurrent health expenditure was 2.0 per cent. This was considerably lower than many other countries
including New Zealand (6.4 per cent), Finland (6.1 per cent), Canada (5.9 per cent), Sweden (3.9 per cent), the
United States (3.1 per cent) and Japan (2.9 per cent). Countries with similar shares of expenditure on public
health to Australia included France (2.0 per cent), Luxembourg (2.0 per cent), Poland (2.1 per cent) and Portugal
(2.1 per cent).
Some valuable interventions have been introduced to prevent chronic diseases, with prevention
programs also implemented in a wide range of settings.
In response to the work of the NPHT, the Australian Government has introduced interventions including:
Pricing: an increase of 25 per cent in tobacco excise from April 2010 and harmonising tax rates for
alcopops with other spirit-based drinks;
Regulation: the introduction of plain packaging for tobacco products with full implementation from 1
December 2012;
37 | P a g e A u s t r a l i a n H e a l t h P o l i c y C o l l a b o r a t i o n 2 0 1 4
Food labelling: a front-of-package food labelling system known as the Health Star rating was introduced
in June 2014 on a voluntary basis for five years. A review of the progress of implementation is due in
two years (June 2016);
Programs targeting particular populations: the first major program to reduce smoking in Indigenous
communities was introduced; and
Social marketing and education: there has been significant investment through the NPA on Preventive
Health on educational campaigns relating to risk factors for chronic diseases.
In considering the entirety of the NPHT recommendations, it appears as if the most robust interventions by
government have been directed towards tobacco (where there has already been considerable success), while
‘softer’ interventions (e.g. educational campaigns) have been used for other risk factors such as obesity.
However, many of the NPHT’s recommendations have not been implemented including: greater restrictions on
promoting alcohol at times or locations (e.g. sporting events) that have high exposure to young people; the
introduction of health impact assessments by governments across all policies; and the phasing out of marketing
of energy-dense, nutrient poor foods and beverages.
There has been some investment in new research and expanded datasets, but research and
evaluation of policies and programs to prevent chronic diseases is still under-developed
The NHMRC funding of research by the University of Queensland and Deakin University to produce the ACE-
Prevention study is the undoubted highlight of recent investment in national intelligence for preventive health.
The expansion of the Australian Health Survey in 2011-2012 to include additional data on nutrition, physical
activity and biomedical measures was also welcomed by many researchers. However, this was long overdue,
given that the previous National Nutrition Survey was undertaken in 1995. Another example of important
research intelligence is the Australian Burden of Disease study which was last published in 2007 based on 2003
data. Updated estimates on the burden of disease are not expected to be released until late 2015, meaning that
there are no current estimates or recent trend data on the morbidity and mortality rates associated with chronic
diseases in Australia.
Australian researchers and performance agencies (including the COAG Reform Council and the National Health
Performance Agency) have been critical of the absence (or too infrequent collection) of vital data on health
outcomes. These data gaps are even more pronounced in being able to assess health outcomes for specific
population groups (for example, Indigenous populations).
Governments committed through the NPA on Preventive Health to invest in the evidence-base necessary for
effective prevention by establishing national programs in chronic disease risk factor surveillance, translational
research and evaluation. The ANPHA commenced implementation of the $13.1 million National Preventive
Health Research Fund in 2011, but the ongoing status of this research fund is unclear given the cessation of the
agency. ANPHA’s National Preventive Health Research Strategy 2013-2018 (ANPHA 2013b) identified the value
of a range of longitudinal studies and data collections both inside and outside the health system (such as the
Longitudinal Study of Indigenous Children and the Household, Income and Labour Dynamics in Australia survey).
4.4 Identifying key directions for acting on prevention is a vital first step
To recap, there have been some important successes in the past few years, as preventive health has gained
unparalleled prominence (a major government inquiry, a national agency, an intergovernmental funding
agreement, a set of targets to improve health and reduce chronic diseases). Australia’s introduction of plain
~

38 | P a g e A u s t r a l i a n H e a l t h P o l i c y C o l l a b o r a t i o n 2 0 1 4
packaging for tobacco products has been internationally acclaimed by public health experts and health
ministries in many countries.
While some of these gains have now been overturned, the reality is that, like stopping smoking, achieving these
successes the first time paves the way for future positive actions to prevent chronic diseases. A changed
political climate emphasising a more modest and non-duplicative role for the Australian government creates
fresh opportunities for non-government organisations, businesses, community groups, academic researchers,
policy think-tanks and state governments to develop innovative approaches to tackling chronic diseases. New
partnerships and alliances can be formed, reflecting the dictum of the National Preventative Health Taskforce
that ‘preventive health is everybody’s business’.
The ANPHA developed a framework for achieving a systematic approach to preventive health (see Figure 4.4).
This organisation highlighted the context in which action to prevent chronic diseases should be taken, as
follows:
Recognising that health is determined by a complex mix of biological, behavioural, socioeconomic,
societal and environmental factors that interact to shape health means answers to reducing the risk
factors that contribute to chronic disease are likely to be complex and multifaceted. Action is needed on
a number of fronts; and it needs to be coordinated, sequenced and connected.
Experience has consistently shown that preventive health effort requires a broad, multifaceted and
coordinated strategy over a sustained period with partnerships between health and other portfolios and
industry sectors, and between government, business and community group. (ANPHA 2013a)

39 | P a g e A u s t r a l i a n H e a l t h P o l i c y C o l l a b o r a t i o n 2 0 1 4
Figure 4.4: ANPHA has developed a framework for taking action on preventing chronic diseases
Source: Australian National Preventive Health Agency 2013, State of preventive health 2013,
Canberra: ANPHA.
Based on the ANPHA’s framework, our study into the impact of childhood disadvantage on health outcomes,
and our evaluation of recent successes and still to be realised opportunities, the AHPC is proposing that a
national action plan for chronic disease prevention be guided by four key directions:
1. Promote and implement interventions that impact early in life, as well as targeting high risk
populations
We must change the mindset that accepts the inevitability of a future where trends in obesity and overweight in
Australian children lead to reductions in life expectancy of the next generation (Holman & Smith 2008); where
children are increasingly being sentenced to a lifetime of ill-health with a diagnosis of Type 2 diabetes (AIHW
2014c); and where young people have risk factors including high blood pressure or harmful use of alcohol that
predispose them to the early onset of chronic diseases (ABS 2013).
We must dispel the myth that preventing chronic diseases is simply about adults taking responsibility for making
healthy ‘lifestyle’ choices. Preventive health requires intervening early to protect the health of vulnerable
children. Current advertising of unhealthy food and beverages normalises unhealthy behaviours for children.
We now find jarring the scenes in the television series, Mad Men, where young children are unrestrained in cars

40 | P a g e A u s t r a l i a n H e a l t h P o l i c y C o l l a b o r a t i o n 2 0 1 4
and pregnant women smoke. Similar societal and cultural shifts will be required to tackle obesity and other risk
factors for chronic diseases.
The evidence on chronic diseases and social disadvantage is equally damning (ANPHA 2013a). Higher risk
factors and chronic disease rates are associated with disadvantage across multiple domains – income level,
living in areas of socio-economic disadvantage, level of educational achievement and employment status
(Duckett and Willcox 2011). Speaking at the Oceania Tobacco Control Conference in 2011, Professor Ron
Borland warned:
Individuals whose life circumstances include socio-economic disadvantage are exposed to environments and
influences that increase their health risks through their opportunities and behaviours. A social determinants of
health perspective requires that programs and policies be designed to address disadvantage across populations
as early in life as possible. Prevention programs also have to be targeted to population groups at the highest
risk of exposure to chronic diseases.
2. Invest in cost-effective prevention, while innovating and building the evidence-base on what
works to reduce chronic diseases
Australia has a strong track record of using economic data to drive resource allocation in health. This includes
the use of cost-effectiveness analyses for listing new pharmaceuticals and new medical procedures on the
Pharmaceutical Benefits Scheme (PBS) and Medical Benefits Scheme (MBS) respectively, as well as promoting
debate on ‘disinvestment’ for clinically ineffective or cost ineffective services (Elshaug et al. 2012).
The ACE-Prevention study provides a similarly robust evaluation of the cost-effectiveness of preventive health
interventions to allow evidence-based decision-making. This resource can be used by funders and regulators at
national, state and community levels to inform ‘best buys’ for preventing chronic diseases, to cease programs
that do not represent value for money, and to guide the development of fiscal and regulatory policies.
The redirection of funding from the NPA on Preventive Health to the Medical Research Future Fund provides
another rationale for investing in research on preventive health. Relative to clinically-based interventions that
focus on secondary and tertiary ‘prevention’ of chronic disease for individuals, population-based approaches are
currently under-represented in evaluation studies. This evidence-base needs to be strengthened including
through research supported by the Medical Research Future Fund, the NHMRC and, indeed, by research funding
outside the health system.
3. Measure progress on reducing chronic diseases and engender accountability for action
We need to foster a culture of public reporting and accountability for preventing chronic diseases.
There is not much value in counting the number of public hospital beds or performance against four-hour
emergency department waiting time targets if we do not know whether smoking rates are being cut in
disadvantaged populations or whether we are achieving success in reducing prevalence and rates of premature
mortality from diabetes. What counts (and should be counted) are the health outcomes for the Australian
population, while how we use our health resources is very much a second order issue.
“There is a lot of death and suffering ahead of us, but it will be concentrated among those already
suffering the most.” (Cancer Council Victoria et al. undated)

41 | P a g e A u s t r a l i a n H e a l t h P o l i c y C o l l a b o r a t i o n 2 0 1 4
There is an opportunity to reinvigorate reporting on preventing chronic diseases. The requirement for Australia
to report against the WHO Global Action Plan provides a fresh prospect, outside the previous infrastructure of
the intergovernmental agreements, to recommit to measurable improvement in preventing chronic diseases.
In addition, the non-government sector could mirror the AMA’s success in highlighting public hospital
performance by creating and publishing regular reports on Australian progress in preventing chronic diseases.
The WHO assessment approach provides one possible model. Reporting could include quantitative trends in
behavioural and biomedical risk factors, the prevalence of chronic diseases and rates of premature mortality, as
well as qualitative assessments on the infrastructure required to prevent chronic diseases (public commitments,
funding, the range of interventions including future priorities for action).
State governments have been vitally important guardians in establishing and maintaining health surveillance
databases over the past ten to twenty years (examples include the WA Health and Wellbeing Surveillance
system and the NSW Population Health Survey), as well as publishing regular reports on the health status of
their populations (Queensland Health 2012; Tomlin and Joyce 2013). Data on population health deserve media
analysis. Reporting needs to celebrate public health successes, as well as identifying future opportunities and
accountability for actions required to prevent chronic diseases.
4. Recognise that many of the levers to prevent chronic diseases involve changes outside the health
system that create healthier environments at a whole of population level
There is no better illustration of the value of multi-sectoral action utilising a wide array of interventions than the
history of Australian success in smoking control (Figure 4.5). We don’t need to reinvent the wheel in
determining how to reduce the harm arising from unhealthy foods and beverages and excessive use of alcohol.
Many of the lessons and policy levers of successful tobacco control can be applied to reduce other risk factors
for chronic diseases.
Changes outside the health system (such as fiscal policy, regulation and addressing environmental factors) are
more likely to be cost-effective as they achieve greater reach and can impact before the onset of chronic
diseases. In its submission to the development of a National Urban Policy for Australia, the Australian Chronic
Disease Prevention Alliance argued that:
”
“The design of our neighbourhoods and cities has a major impact on the health and wellbeing of
individuals and communities. In particular there is strong and growing evidence that the way streets,
neighbourhoods, towns and cities are planned, designed and built affects how people use these spaces
and places and their levels of physical activity. There is also increasing evidence that the built
environment influences obesity rates.”

42 | P a g e A u s t r a l i a n H e a l t h P o l i c y C o l l a b o r a t i o n 2 0 1 4
Figure 4.5: Success in reducing Australian smoking rates has been achieved through action on many
fronts
Source: Australian National Preventive Health Agency 2013, State of preventive health 2013, Canberra: ANPHA
4.5 Achieving change in preventing and reducing chronic diseases for Australia’s
health
Australia has significant expertise in different areas of the chronic disease prevention and management jigsaw
(Figure 4.6). Much work has been done, by people with an enormous commitment to both improved health,
and increased social and economic participation for all Australians. Drawing on the best evidence and expertise

43 | P a g e A u s t r a l i a n H e a l t h P o l i c y C o l l a b o r a t i o n 2 0 1 4
in relevant fields of investigation, it is time to develop a national action plan for chronic disease prevention for
Australia.
Figure 4.6: Chronic diseases jigsaw
Sports & Recreation
Food Policy Urban Planning
Health Policies
Transport Policy
Pricing Policy Workplace Policies
Education Policy

44 | P a g e A u s t r a l i a n H e a l t h P o l i c y C o l l a b o r a t i o n 2 0 1 4
5. Epilogue
We need to take action now to ensure that the following future scenario does not become a reality:
It is 2016.
The voluntary Health Star food labelling system that was introduced in 2014 has only been implemented
by a few local muesli producers. Governments decide to scrap food labelling, as well as portion sizes and
advertising controls on health claims that can be made on food products. The 42 oz (1.24 litres) super-
size soft drinks that were phased out by McDonalds in the US in 2004 have been introduced to Australia.
It is 2019.
Telecommuting is now standard practice, courtesy of success in finally achieving national coverage of a
fast-speed broadband network. While digital connectivity is widespread with the use of Google glasses,
there is increasing social isolation and lack of human connectivity. Rates of depression, alcoholism and
suicide have increased.
It is 2023.
Following the cessation of all government funding in Australia for preventive health and health
promotion, many prevention experts emigrated to the United States. On the advice of these Australian
experts, the American President has introduced physical activity programs in all schools, used pricing
incentives and/or subsidies to promote production of, and affordable access to, healthier foods; and has
supported local government in changes to reduce sedentary behaviour and increase physical activity.
Australia now outranks the United States as the most obese country in the world.
It is 2025.
Australia has failed to meet most of the targets in the WHO Global Action Plan including the 25 per cent
reduction in mortality from non-communicable diseases. Its previous success in reducing tobacco
smoking has been overturned by the failure of governments to regulate e-cigarettes. The Australian
branch of the European Free Vaping Initiative was instrumental in lobbying government through its
‘hands-off free vaping’ campaign, despite the emergence of new studies in the early 2020s
demonstrating the health risks of e-cigarettes.
It is 2032.
The nation has gone into mourning following the screening of the final (twentieth) season of Game of
Thrones. High levels of sedentary behaviour have resulted in bariatric surgery being the most common
elective surgery procedure, now also frequently performed on primary school children. Health costs have
exceeded the Australian Institute of Health and Welfare’s estimate of 12.4 per cent of GDP in 2032 due
to the failure to tackle risk factors and the broad environmental determinants of chronic diseases. Over
the past thirty years, health costs have increased by over 430 per cent for treating diabetes, over 200 per
cent for respiratory disease and over 140 per cent for cardiovascular disease (AIHW 2009). This has been
partly offset by reductions in the cost of treating people with dementia due to earlier premature deaths
from other chronic diseases.
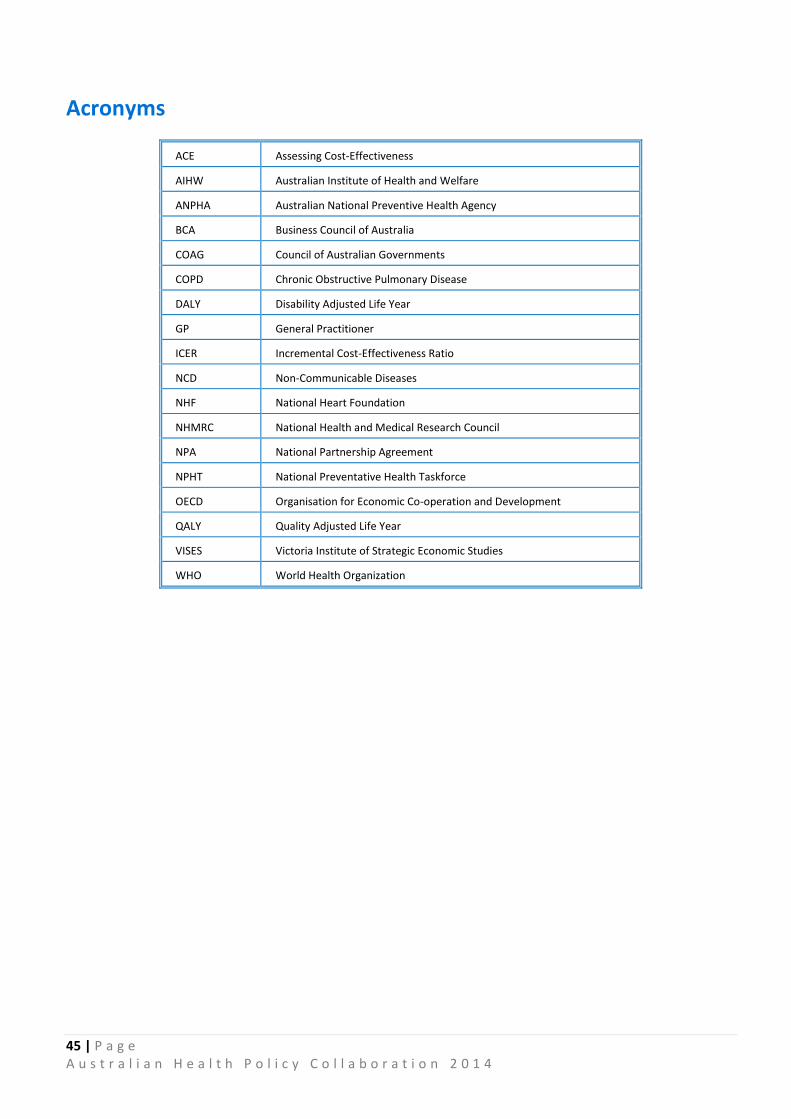
45 | P a g e A u s t r a l i a n H e a l t h P o l i c y C o l l a b o r a t i o n 2 0 1 4
Acronyms
ACE Assessing Cost-Effectiveness
AIHW Australian Institute of Health and Welfare
ANPHA Australian National Preventive Health Agency
BCA Business Council of Australia
COAG Council of Australian Governments
COPD Chronic Obstructive Pulmonary Disease
DALY Disability Adjusted Life Year
GP General Practitioner
ICER Incremental Cost-Effectiveness Ratio
NCD Non-Communicable Diseases
NHF National Heart Foundation
NHMRC National Health and Medical Research Council
NPA National Partnership Agreement
NPHT National Preventative Health Taskforce
OECD Organisation for Economic Co-operation and Development
QALY Quality Adjusted Life Year
VISES Victoria Institute of Strategic Economic Studies
WHO World Health Organization

46 | P a g e A u s t r a l i a n H e a l t h P o l i c y C o l l a b o r a t i o n 2 0 1 4
References
Aboderin, J., Kalache, A., Ben-Shlomo, Y., Lynch, J.W., Yajnik, C. S., Kuh, D. and Yach, D. 2001, Life course
perspectives on coronary heart disease, stroke and diabetes: key issues and implications for research, Geneva:
WHO.
Australian Bureau of Statistics 2011, Census of population and housing: Socio-economic indexes for areas,
Australia, 2011, Cat. No. 2033.0.55.001, Canberra: ABS.
Australian Bureau of Statistics 2012, Australian Health Survey: First results, 2011-12, Cat. No. 4364.0.55.001,
Canberra: ABS.
Australian Bureau of Statistics 2013, Australian Health Survey: Updated results, 2011-12, Cat. No. 4364.0.55.003,
Canberra: ABS.
Australian Chronic Disease Prevention Alliance undated, Submission to Our Cities – Building a productive
sustainable future, at:
http://www.cancer.org.au/content/pdf/ACDPA/ACDPA_submission_Our_cities.pdf
Australian Government 2010, Taking preventative action: A response to Australia: the healthiest country by
2020, Canberra: Commonwealth of Australia.
Australian Government Department of Health 2014, Tobacco: key facts and figures (Findings from the 2013
National Drug Strategy Household Survey), at:
http://www.health.gov.au/internet/main/publishing.nsf/Content/tobacco-kff
Australian Institute of Health and Welfare 2006, Chronic diseases and associated risk factors in Australia, Cat.
No. PHE 81, Canberra: AIHW.
Australian Institute of Health and Welfare 2008, Rural, regional and remote health: Indicators of health status
and determinants of health, Cat. No. PHE 97, Canberra: AIHW.
Australian Institute of Health and Welfare 2009, Estimating the impact of selected National Health and Hospitals
Reform Commission (NHHRC) reforms on health care expenditure, 2003 to 2033, Cat. No. HWE 45, Canberra:
AIHW.
Australian Institute of Health and Welfare 2011a, Cardiovascular disease: Australian facts 2011, Cat. No. CVD 53,
Canberra: AIHW.
Australian Institute of Health and Welfare 2011b, Public health expenditure in Australia 2008-09, Cat. No. HWE
52, Canberra: AIHW.
Australian Institute of Health and Welfare 2012, Dialysis and kidney transplantation in Australia 1991-2010, Cat.
No. PHE 162, Canberra: AIHW.
Australian Institute of Health and Welfare 2014a, Australia’s Health 2014, Cat. No. AUS 178, Canberra: AIHW.
Australian Institute of Health and Welfare 2014b, Projections of the prevalence of treated end-stage kidney
disease in Australia 2012–2020, Cat. No. PHE 176, Canberra: AIHW.
Australian Institute of Health and Welfare 2014c, Type 2 diabetes in Australia's children and young people: A
working paper (Diabetes Series No 21), Canberra: AIHW.

47 | P a g e A u s t r a l i a n H e a l t h P o l i c y C o l l a b o r a t i o n 2 0 1 4
Australian Institute of Health and Welfare 2014d, Health expenditure Australia 2012-13, Cat. No. HWE 61,
Canberra: AIHW.
Australian Institute of Health and Welfare and Australasian Association of Cancer Registries 2012, Cancer in
Australia: an overview, 2012. Cat. No. CAN 70, Canberra: AIHW.
Australian National Preventive Health Agency 2013a, State of preventive health 2013, Canberra: ANPHA.
Australian National Preventive Health Agency 2013b, National preventive health research strategy 2013-2018:
Building knowledge for a healthy Australia, Canberra: ANPHA.
Beard, T. 2004, Salt matters: the killer condiment, Sydney: Hachette Australia.
Beaglehole, R., Bonita, R., Ezzati, M., Alleyne, G., Dain, K., Kishore, S.P. and Horton, R. 2014, ‘NCD Countdown
2025: Accountability for the 25 x 25 NCD mortality reduction target’, The Lancet 384: 105-107.
Begg, S., Vos, T., Barker, B., Stevenson, C., Stanley L. and Lopez, A. D. 2007, The burden of disease and injury in
Australia 2003, Cat. No. PHE 82, Canberra: AIHW.
Business Council of Australia 2009, Fit for the job: Adapting to Australia’s new healthcare challenges,
Melbourne: BCA.
Business Council of Australia 2011, Selected facts and statistics on Australia’s healthcare sector, Melbourne:
BCA.
Cadilhac, D.A., Magnus, A., Cumming, T., Sheppard, L., Pearce D. and Carter, R. 2009, The health and economic
benefits of reducing disease risk factors, Melbourne: Deakin University & National Stroke Research Institute.
Cancer Council Victoria, Victorian Council of Social Service and Quit Victoria, Supporting disadvantaged people
to stop smoking, at:
http://www.quit.org.au/downloads/Quitvic_reducing_tobacco_disparities_plain_language.pdf
Cappuccio, F.P. and Capewell, S. 2010, ‘How to cut down salt intake in populations’, Heart 96(23): 1863-1864.
Chokshi, D. A. and Farley, T. A. 2012, ‘The cost-effectiveness of environmental approaches to disease
prevention’, New England Journal of Medicine 347(4): 292-295.
Committee for Economic Development of Australia 2013, Australia adjusting: Optimising national prosperity,
Melbourne: CEDA.
Duckett, S and Willcox S. 2011, The Australian health care system, Melbourne: Oxford University Press.
Elshaug, A., Watt, A., Mundy L. and Willis, C. 2012, ‘Over 150 potentially low-value health care practices: an
Australian study’, Medical Journal of Australia 197(10): 556-560.
Holman, C. D. J. and Smith, F. 2008, Implications of the obesity epidemic for the life expectancy of Australians -
Report to the Western Australian Institute for Public Health Advocacy, Perth: Public Health Advocacy Institute of
Western Australia.
Mathers, C. 1994, Health differentials among adult Australians aged 25-64 years, Canberra: AIHW.
Moss, M. 2013, Salt, sugar and fat: how the food giants hooked us, New York: Random House.
National Health and Hospitals Reform Commission 2008, A healthier future for all Australians: Interim report,
Canberra: Commonwealth of Australia.
48 | P a g e A u s t r a l i a n H e a l t h P o l i c y C o l l a b o r a t i o n 2 0 1 4
National Health and Medical Research Council 2013a, Eat for health: Australian dietary guidelines summary,
Canberra: Commonwealth of Australia.
National Health and Medical Research Council 2013b, Eat for health: Australian dietary guidelines (Providing the
scientific evidence for healthier Australian diets), Canberra: Commonwealth of Australia.
National Health Priority Action Council 2005, National Chronic Disease Strategy, Canberra: Australian
Government Department of Health and Ageing.
National Preventative Health Taskforce 2009, Australia: The healthiest country by 2020 – the roadmap for
action, Canberra: Commonwealth of Australia.
National Public Health Partnership 2006, The language of prevention, Melbourne: National Public Health
Partnership.
Organisation for Economic Co-operation and Development 2014, OECD health statistics 2014 (online database),
accessed 26 September 2014, at: http://www.oecd.org/els/health-systems/health-data.htm
Productivity Commission 2007, Potential benefits of the national reform agenda: Report to the Council of
Australian Governments, Canberra: Commonwealth of Australia.
Queensland Health 2008, The health of Queenslanders: Prevention of chronic disease, second report of the Chief
Health Officer Queensland, Brisbane: Queensland Health.
Queensland Health 2012, The health of Queenslanders 2012: Advancing good health, fourth report of the Chief
Health Officer Queensland, Brisbane: Queensland Health.
Starfield, B., Hyde, J., Gervas, J. and Heath, I. 2008, ‘The concept of prevention: a good idea gone astray?’,
Journal of Epidemiology and Community Health 62: 580-583.
Tomlin, S. and Joyce, S. 2013, The health and wellbeing of children in Western Australia in 2012, overview and
trends, Perth: Department of Health, Western Australia.
Vartiainen, E., T. Laatikainen, B. Philpot, E. Janus, N. Davis-Lameloise and J. Dunbar 2011, ‘The projected impact
of population and high-risk strategies for risk-factor control on coronary heart disease and stroke events’,
Medical Journal of Australia 194(1): 10- 15.
Vos, T., Carter, R., Barendregt, J., Mihalopoulos, C., Veerman, L., Magnus, A., Cobiac, L., Bertram, M. and
Wallace, A. 2010, Assessing cost-effectiveness in prevention (ACE-Prevention) Final Report, University of
Queensland, Brisbane and Deakin University, Melbourne.
World Health Organization 2005, Preventing chronic diseases: A vital investment, Geneva: WHO.
World Health Organization 2013, Global action plan for the prevention and control of non-communicable
diseases 2013-2020, Geneva: WHO.
World Health Organization 2014, Non-communicable diseases country profiles, at:
http://www.who.int/nmh/countries/en/

AUSTRALIANHEALTH POLICYCOLLABORATION
300 Queen Street, Melbourne, Victoria+61 3 9919 1820vu.edu.au/ahpc