Embed Size (px)
Citation preview

CHRONIC CANNABIS USE AND ATTENTION-
MODULATED PREPULSE INHIBITION OF THE
STARTLE REFLEX IN HUMANS
Karina Karolina Kędzior BSc (University of Otago), Postgrad Dip (University of Otago),
Grad Dip Tert Ed (Murdoch University)
This thesis is presented for the degree of
Doctor of Philosophy
of the University of Western Australia,
School of Medicine and Pharmacology
June 2004

ABSTRACT
Background. Various studies show that cannabis use alters attention and cognitive
functioning in healthy humans and may contribute to development of schizophrenia or
worsening of pre-existing psychosis. However, the impact of cannabis use on brain
function in humans is not well understood. Schizophrenia is associated with a deficit
in prepulse inhibition (PPI), the normal inhibition of the startle reflex by a non-
startling stimulus (prepulse), presented before the startle stimulus at short time
intervals (lead-time intervals). Such PPI deficit is thought to reflect a sensorimotor
gating dysfunction in schizophrenia. PPI is also modulated by attention and PPI
reduction in schizophrenia is observed when patients are asked to attend to, not ignore,
the stimuli producing PPI. The aim of the current study was to investigate the
association between self-reported chronic cannabis use and attentional modulation of
PPI in healthy controls and in patients with schizophrenia. Furthermore, the
association between cannabis use and other startle reflex modulators, including
prepulse facilitation (PPF) of the startle reflex magnitude at long lead-time intervals,
prepulse facilitation of the startle reflex onset latency and habituation of the startle
reflex magnitude, were examined. Method. Auditory-evoked electromyographic
signals were recorded from orbicularis oculi muscles in chronic cannabis users (29
healthy controls and 5 schizophrenia patients) and non-users (22 controls and 14
patients). The data for 36 participants (12 non-user controls, 16 healthy cannabis
users, and eight non-user patients) were used in the final analyses and the patient data
were used as a pilot study, because relatively few participants met the rigorous
exclusionary criteria. Participants were instructed to attend to or to ignore either the
startle stimuli alone (70 – 100 dB) or prepulse (70 dB) and startle stimuli (100 dB)
separated by short lead-time intervals (20 – 200 ms) and long lead-time intervals
(1600 ms). In order to ignore the auditory stimuli the participants played a visually
ii
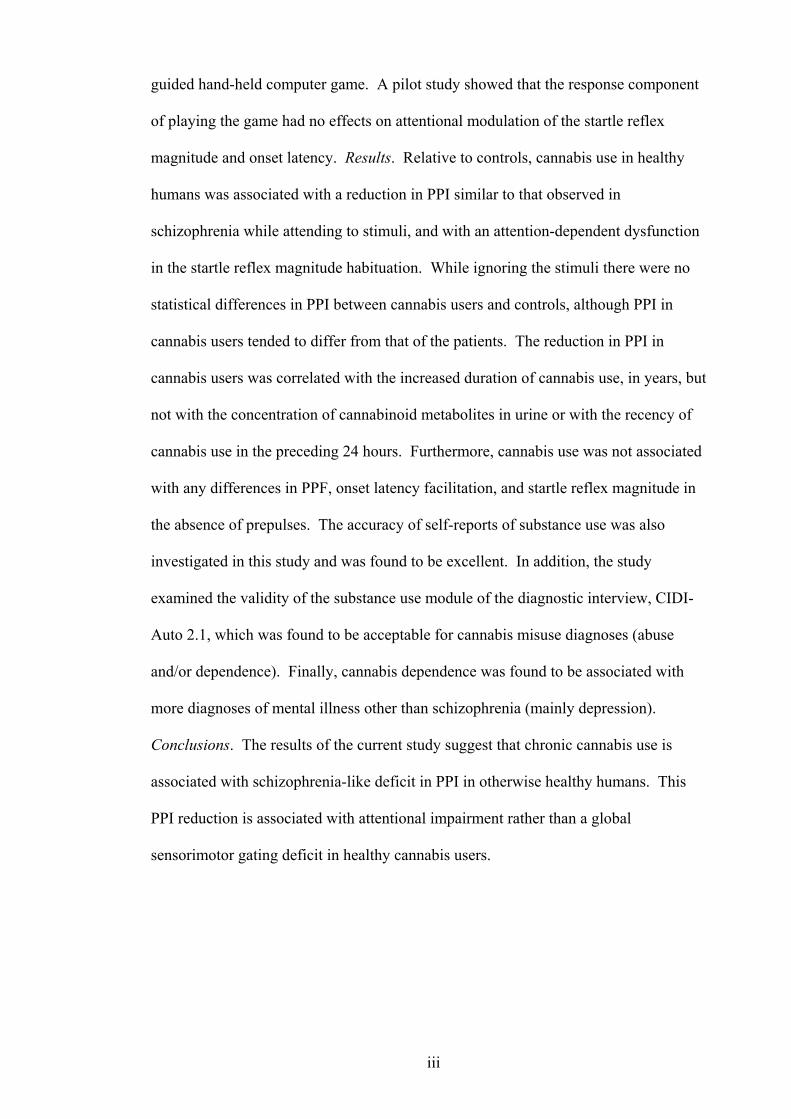
guided hand-held computer game. A pilot study showed that the response component
of playing the game had no effects on attentional modulation of the startle reflex
magnitude and onset latency. Results. Relative to controls, cannabis use in healthy
humans was associated with a reduction in PPI similar to that observed in
schizophrenia while attending to stimuli, and with an attention-dependent dysfunction
in the startle reflex magnitude habituation. While ignoring the stimuli there were no
statistical differences in PPI between cannabis users and controls, although PPI in
cannabis users tended to differ from that of the patients. The reduction in PPI in
cannabis users was correlated with the increased duration of cannabis use, in years, but
not with the concentration of cannabinoid metabolites in urine or with the recency of
cannabis use in the preceding 24 hours. Furthermore, cannabis use was not associated
with any differences in PPF, onset latency facilitation, and startle reflex magnitude in
the absence of prepulses. The accuracy of self-reports of substance use was also
investigated in this study and was found to be excellent. In addition, the study
examined the validity of the substance use module of the diagnostic interview, CIDI-
Auto 2.1, which was found to be acceptable for cannabis misuse diagnoses (abuse
and/or dependence). Finally, cannabis dependence was found to be associated with
more diagnoses of mental illness other than schizophrenia (mainly depression).
Conclusions. The results of the current study suggest that chronic cannabis use is
associated with schizophrenia-like deficit in PPI in otherwise healthy humans. This
PPI reduction is associated with attentional impairment rather than a global
sensorimotor gating deficit in healthy cannabis users.
iii

TABLE OF CONTENTS
ABSTRACT............................................................................................................................................... II
TABLE OF CONTENTS.........................................................................................................................IV
LIST OF TABLES ................................................................................................................................. VII
LIST OF FIGURES .................................................................................................................................IX
LIST OF ABBREVIATIONS..................................................................................................................XI
ACKNOWLEDGMENTS ..................................................................................................................... XII
CHAPTER 1. GENERAL INTRODUCTION........................................................................................ 1
1.1 PREFACE............................................................................................................................................ 1 1.2 PREVALENCE OF CANNABIS USE ....................................................................................................... 2 1.3 HEALTH CONSEQUENCES OF CANNABIS USE..................................................................................... 2 1.4 COMORBIDITY BETWEEN CANNABIS USE AND SCHIZOPHRENIA ........................................................ 4
1.4.1 Hypotheses Explaining Comorbidity ........................................................................................ 4 1.4.2 Why Study Comorbidity? .......................................................................................................... 5 1.4.3 Literature Review Regarding Comorbidity............................................................................... 6 1.4.4 Problems with Interpretation of Direction of Comorbidity ...................................................... 8 1.4.5 Summary of Evidence for Comorbidity................................................................................... 11
1.5 CANNABIS USE AND COGNITIVE FUNCTION..................................................................................... 12 1.6 CANNABIS USE AND NEUROPHARMACOLOGY ................................................................................. 14
1.6.1 Pharmacology of Cannabis .................................................................................................... 14 1.6.2 Cannabis and Endogenous Cannabinoid System.................................................................... 14 1.6.3 Cannabis and Dopamine Interaction...................................................................................... 16 1.6.4 Summary of Pharmacological Effects of Cannabis Use ......................................................... 21
1.7 STARTLE REFLEX MODIFICATION.................................................................................................... 21 1.7.1 Startle Reflex, Prepulse Inhibition and Facilitation ............................................................... 22 1.7.2 Prepulse Inhibition Deficit and Schizophrenia....................................................................... 24 1.7.3 Prepulse Facilitation and Schizophrenia................................................................................ 28 1.7.4 Startle Reflex Magnitude Habituation .................................................................................... 29 1.7.5 Startle Reflex Latency ............................................................................................................. 31 1.7.6 Summary of Startle Reflex Modification ................................................................................. 32
1.8 PHARMACOLOGICAL MODULATION OF PREPULSE INHIBITION......................................................... 33 1.8.1 PPI, Dopamine, and Other Neurotransmitters ....................................................................... 33 1.8.2 PPI and Substances of Abuse.................................................................................................. 36 1.8.3 Summary of Pharmacological Modulation of PPI.................................................................. 39
1.9 SUMMARY OF AIMS OF THE CURRENT STUDY ................................................................................. 39
CHAPTER 2. CONSISTENCY OF SELF-REPORTS REGARDING SUBSTANCE USE IN VOLUNTEERS FOR RESEARCH UNRELATED TO TREATMENT FOR SUBSTANCE USE.. 41
2.1 PREFACE.......................................................................................................................................... 41 2.2 ABSTRACT ....................................................................................................................................... 41 2.3 INTRODUCTION ................................................................................................................................ 42 2.4 METHODS ........................................................................................................................................ 46
2.4.1 Participants and Procedures .................................................................................................. 46 2.4.2 Recent Substance Use ............................................................................................................. 49 2.4.3 Past Substance Use................................................................................................................. 50 2.4.4 Statistical Analysis.................................................................................................................. 54
2.5 RESULTS .......................................................................................................................................... 55 2.5.1 Participant Characteristics..................................................................................................... 55 2.5.2 Recent Substance Use and Urine Drug Screens ..................................................................... 56 2.5.3 Past Substance Use and Dependence Questionnaires ............................................................ 58
2.6 DISCUSSION..................................................................................................................................... 60 2.6.1 Consistency of Self-Reports of Recent Substance Use ............................................................ 60 2.6.2 Consistency of Self-Reports of Past Substance Use................................................................ 65
iv

2.6.3 Consistency of Self-Reports and Schizophrenia...................................................................... 69 2.6.4 Conclusion .............................................................................................................................. 70
CHAPTER 3. CONCURRENT VALIDITY OF SUBSTANCE USE MODULE ON CIDI-AUTO 2.1............................................................................................................................................................... 71
3.1 PREFACE.......................................................................................................................................... 71 3.2 ABSTRACT ....................................................................................................................................... 71 3.3 INTRODUCTION ................................................................................................................................ 72 3.4 METHODS ........................................................................................................................................ 74
3.4.1 Participants ............................................................................................................................ 74 3.4.2 Cannabis Misuse Assessment.................................................................................................. 75 3.4.3 Statistical Analysis.................................................................................................................. 75
3.5 RESULTS .......................................................................................................................................... 79 3.5.1 Participant Characteristics..................................................................................................... 79 3.5.2 Cannabis-Misuse Diagnoses on CIDI-Auto and SDS............................................................. 80
3.6 DISCUSSION..................................................................................................................................... 84
CHAPTER 4. EFFECTS OF CHRONIC CANNABIS USE ON ATTENTIONAL MODULATION OF PREPULSE INHIBITION OF THE STARTLE REFLEX IN HUMANS ................................... 89
4.1 PREFACE.......................................................................................................................................... 89 4.2 ABSTRACT ....................................................................................................................................... 89 4.3 INTRODUCTION ................................................................................................................................ 90 4.4 METHODS ........................................................................................................................................ 97
4.4.1 Participants ............................................................................................................................ 97 4.4.2 Cannabis and Other Substance Use Assessment .................................................................... 99 4.4.3 Attentional Tasks, Auditory Stimuli, and Trial Types ............................................................. 99 4.4.4 Startle Reflex Acquisition and Filtering ............................................................................... 101 4.4.5 Startle Reflex Processing ...................................................................................................... 105 4.4.6 Participant Exclusionary Criteria ........................................................................................ 108 4.4.7 Statistical Analysis................................................................................................................ 109
4.4.7.1 Group Matching- Discrete Variables .............................................................................................110 4.4.7.2 Group Matching- Continuous Variables ........................................................................................110 4.4.7.3 Correlations among Measures of Startle Reflex Magnitude...........................................................111 4.4.7.4 Startle Reflex Analysis...................................................................................................................112
4.5 RESULTS ........................................................................................................................................ 120 4.5.1 Participant Characteristics................................................................................................... 120 4.5.2 Cannabis, Attention, Startle Stimulus Intensity, and Startle Reflex Magnitude on Startle Stimulus Alone Trials...................................................................................................................... 124 4.5.3 Cannabis, Attention, Lead-Time Intervals, and Startle Reflex Magnitude ........................... 126
4.5.3.1 Effects of Attention and Lead-Time Intervals on Startle Reflex Magnitude ..................................129 4.5.3.2 Effect of Cannabis on PPI and PPF................................................................................................131
4.5.4 Cannabis, Attention, Lead-Time Intervals, and % Startle Reflex Magnitude ....................... 133 4.5.4.1 Effects of Cannabis and Attention on %PPI...................................................................................133 4.5.4.2 Effects of Cannabis and Attention on %PPI in Schizophrenia- Pilot Study...................................137 4.5.4.3 Effects of Cannabis and Attention on %PPF..................................................................................139
4.5.5 Acute or Chronic Effect of Cannabis on PPI and %PPI? .................................................... 140 4.5.6 Cannabis, Attention, and Startle Reflex Magnitude Habituation.......................................... 143
4.5.6.1 Habituation on Startle Stimulus Alone Trials ................................................................................143 4.5.6.2 Habituation at Short Lead-Time Intervals......................................................................................146 4.5.6.3 Habituation at Long Lead-Time Intervals ......................................................................................148
4.5.7 Cannabis, Attention, Lead-Time Intervals, and Startle Reflex Onset Latency...................... 150 4.6 DISCUSSION................................................................................................................................... 152
4.6.1 Cannabis Use, PPI, Protection of Processing and Sensorimotor Gating............................. 153 4.6.2 Cannabis Use and Attentional Modulation of PPI ............................................................... 154 4.6.3 Cannabis Use, PPI, and Cognitive Functioning................................................................... 158 4.6.4 Cannabis Use and Startle Reflex Latency............................................................................. 160 4.6.5 Limitations of the Current Study........................................................................................... 161 4.6.6 Conclusion ............................................................................................................................ 170
CHAPTER 5. EFFECT OF FINGER MOVEMENTS ON ATTENTIONAL MODULATION OF THE STARTLE REFLEX MAGNITUDE AND LATENCY ............................................................ 172
5.1 PREFACE........................................................................................................................................ 172 5.2 ABSTRACT ..................................................................................................................................... 172 5.3 INTRODUCTION .............................................................................................................................. 173
v

5.4 METHODS ...................................................................................................................................... 174
5.4.1 Participants .......................................................................................................................... 174 5.4.2 Procedure ............................................................................................................................. 175 5.4.3 Exclusionary Criteria ........................................................................................................... 176 5.4.4 Statistical Analysis................................................................................................................ 176
5.5 RESULTS ........................................................................................................................................ 178 5.5.1 Participant Characteristics................................................................................................... 178 5.5.2 Attention, Lead-Time Intervals, and Startle Reflex Magnitude............................................. 179 5.5.3 Attention, Lead-Time Intervals, and Startle Reflex Onset Latency ....................................... 182
5.6 DISCUSSION................................................................................................................................... 184
CHAPTER 6. CANNABIS MISUSE AND DEPRESSION ............................................................... 187
6.1 PREFACE........................................................................................................................................ 187 6.2 ABSTRACT ..................................................................................................................................... 187 6.3 INTRODUCTION .............................................................................................................................. 188 6.4 METHODS ...................................................................................................................................... 188
6.4.1 Participants and Psychiatric Illness Assessment .................................................................. 188 6.4.2 Statistical Analysis................................................................................................................ 189
6.5 RESULTS ........................................................................................................................................ 190 6.6 DISCUSSION................................................................................................................................... 191
CHAPTER 7. OVERALL CONCLUSION......................................................................................... 194
REFERENCES....................................................................................................................................... 200
APPENDIX ............................................................................................................................................. 227
APPENDIX A. PARTICIPANT RECRUITMENT AND CONSENT.................................................................. 227 A.1 Advertisements at the Red Cross Blood Donation Clinics in Perth ........................................ 227 A.2 Advertisement in the Local Press (“West Australian” Newspaper)........................................ 228 A.3 Checklist for Patient Recruitment ........................................................................................... 229 A.4 Participant Information Sheet ................................................................................................. 230 A.5 Participant Consent Form....................................................................................................... 231
APPENDIX B. SUBSTANCE USE QUESTIONNAIRES ............................................................................... 232 B.1 Severity of (Cannabis) Dependence Scale, SDS...................................................................... 232 B.2 Fagerstrom Test for Nicotine Dependence, FTND ................................................................. 233 B.3 Short Michigan Alcoholism Screening Test, SMAST............................................................... 234 B.4 CAGE Questionnaire............................................................................................................... 235 B.5 Opiate Treatment Index, OTI, Modified to Cannabis Use....................................................... 236
APPENDIX C. EQUIPMENT DETAILS ..................................................................................................... 237 C.1 Startle Reflex Equipment......................................................................................................... 237 C.2 Sample LabView 4.1 Program ................................................................................................ 238
APPENDIX D. RESULTS PRESENTED IN CHAPTER 4 UNCORRECTED FOR COVARIATES (GLM ANOVA WITH REPEATED MEASURES) ............................................................................................................... 246 APPENDIX E. HOMOGENEITY OF VARIANCE TESTS FOR ANALYSES PRESENTED IN CHAPTER 4........... 254
vi

LIST OF TABLES
Table 1.1 Evidence for comorbidity between cannabis use and schizophrenia...............7
Table 2.1 Agreement between self-reports of substance use in the last 24 hours and results of urine drug screens....................................................................................56
Table 2.2 Agreement between self-reports of substance use in the last 24 hours and results of urine drug screens for all individual substances......................................57
Table 2.3 Correlations among lifetime dependence, amount and frequency in the last 12 months, and lifetime duration of use of cannabis, nicotine, and alcohol ................59
Table 3.1 Participant characteristics ..............................................................................79 Table 3.2 The lifetime diagnoses of cannabis misuse generated by CIDI-Auto 2.1......80 Table 3.3 SDS scores and cannabis use frequency in participants with and without
cannabis-misuse diagnoses on CIDI-Auto 2.1 ........................................................81 Table 3.4 Predicted group membership using SDS diagnoses as the predictor variable
and CIDI-Auto diagnoses as the outcome variable.................................................81 Table 3.5 Agreement between cannabis dependence diagnoses on SDS using a cut-off
score of 3 and cannabis misuse diagnoses on CIDI-Auto 2.1.................................83
Table 4.1 Correlations among measures of the startle reflex size (absolute peak amplitudes/magnitudes and AUC amplitudes/magnitudes) ..................................111
Table 4.2 Participant characteristics ............................................................................121 Table 4.3 Characteristics of participants included and excluded from the study.........123 Table 4.4 Effects of cannabis, attention, startle stimulus intensity, and covariates on the
startle reflex magnitude during the Startle Stimulus Alone Trials........................124 Table 4.5 Effects of cannabis, attention, lead-time intervals, and covariates on the
startle reflex magnitude during the Prepulse and Startle Stimulus Trials.............127 Table 4.6 Effects of cannabis, attention, lead-time intervals, and alcoholic drinks per
week (covariate) on the startle reflex magnitude during the Prepulse and Startle Stimulus Trials ......................................................................................................129
Table 4.7 Effects of cannabis, attention, and covariates on %PPI at short lead-time intervals (mean 20 – 200 ms) during the Prepulse and Startle Stimulus Trials ....134
Table 4.8 Effects of cannabis, attention, and covariates on %PPF at long lead-time intervals (mean 1600 ms) during the Prepulse and Startle Stimulus Trials ..........139
Table 4.9 Correlations among %PPI (difference scores) and urine concentration of cannabinoids, recency of use, and the total duration of cannabis use...................141
Table 4.10 Effects of cannabis, attention, block, and covariates on the startle reflex magnitude during the Startle Stimulus Alone Trials.............................................144
Table 4.11 Effects of cannabis, attention, block, and covariates on the startle reflex magnitude at short lead-time intervals (mean 20 – 200 ms) .................................146
Table 4.12 Effects of cannabis, attention, block, and covariates on the startle reflex magnitude at long lead-time intervals (mean 1600 ms) ........................................148
Table 4.13 Effects of cannabis, attention, lead-time intervals, and covariates on the startle reflex onset latency during the Prepulse and Startle Stimulus Trials.........151
Table 5.1 Participant characteristics ............................................................................178
vii

Table 5.2 Effects of attention and lead-time intervals on the startle reflex magnitude in control and pilot studies ........................................................................................179
Table 5.3 Effects of attention and lead-time intervals on the startle reflex onset latency in control and pilot studies ....................................................................................182
Table 6.1 Characteristics of participants with and without mental illness diagnoses on CIDI-Auto 2.1 .......................................................................................................191
Table E.1 Levene’s Test for homogeneity of variance of the startle reflex magnitude during the Startle Stimulus Alone Trials...............................................................254
Table E.2 Levene’s Test for homogeneity of variance of the startle reflex magnitude during the Prepulse and Startle Stimulus Trials....................................................254
Table E.3 Levene’s Test for homogeneity of variance of the startle reflex magnitude during the Prepulse and Startle Stimulus Trials- means adjusted for one covariate only (alcoholic drinks per week)...........................................................................255
Table E.4 Levene’s Test for homogeneity of variance of the % startle reflex magnitude (%PPI) during the Prepulse and Startle Stimulus Trials .......................................255
Table E.5 Levene’s Test for homogeneity of variance of the % startle reflex magnitude (%PPF) during the Prepulse and Startle Stimulus Trials ......................................255
Table E.6 Levene’s Test for homogeneity of variance for two blocks of the startle reflex magnitude during the Startle Stimulus Alone Trials ..................................256
Table E.7 Levene’s Test for homogeneity of variance for two blocks of the startle reflex magnitude during the Prepulse and Startle Stimulus Trials at short lead-time intervals .................................................................................................................256
Table E.8 Levene’s Test for homogeneity of variance for two blocks of the startle reflex magnitude during the Prepulse and Startle Stimulus Trials at long lead-time intervals .................................................................................................................256
Table E. 9 Levene’s Test for homogeneity of variance of the startle reflex onset latency during the Prepulse and Startle Stimulus Trials....................................................257
viii

LIST OF FIGURES
Figure 1.1 Schematic representation of the startle reflex, prepulse inhibition (PPI) and prepulse facilitation (PPF). .....................................................................................23
Figure 2.1 Relationship between ranked self-reported recency of cannabis use within 24 hours since the testing session and ranked concentration of cannabinoid metabolites in urine. ................................................................................................58
Figure 3.1 ROC curve for SDS scores using CIDI-Auto cannabis-misuse diagnoses as ‘gold standard’. .......................................................................................................82
Figure 4.1 Trial structure and lead-time intervals used in the present study. ..............101 Figure 4.2 Schematic representation of the EMG signal acquisition and filtering. .....103 Figure 4.3 Typical EMG signal following presentation of the startle stimulus. ..........106 Figure 4.4 Effects of cannabis and attention on the startle reflex magnitude at various
intensities of the startle stimuli during the Startle Stimulus Alone Trials. ...........125 Figure 4.5 Effects of attention on the startle reflex magnitude at various lead-time
intervals in controls (A) and in cannabis users (B). ..............................................130 Figure 4.6 Effects of cannabis on the startle reflex magnitude at various lead-time
intervals during the Attend Task (A) and the Ignore Task (B). ............................132 Figure 4.7 Effects of cannabis and attention on %PPI at short lead-time intervals (mean
20 – 200 ms) during the Attend and the Ignore Tasks. .........................................135 Figure 4.8 Effects of cannabis and attention on %PPI at short lead-time intervals (mean
20 – 200 ms) in controls, cannabis users, and patients with schizophrenia. .........138 Figure 4.9 Effects of cannabis and attention on %PPF at long lead-time intervals (mean
1600 ms) during the Attend and the Ignore Tasks. ...............................................140 Figure 4. 10 Correlations among %PPI (difference score) and concentration of
cannabinoids in urine, in µg/L (A), and the total duration of cannabis use, in years (B). ........................................................................................................................142
Figure 4.11 Effects of cannabis on the startle reflex magnitude habituation at the Startle Stimulus Alone Trials during the Attend and the Ignore Tasks in controls (A) and in cannabis users (B). ............................................................................................145
Figure 4.12 Effects of cannabis on the startle reflex magnitude habituation at short lead-time intervals (mean 20 – 200 ms) during the Attend and the Ignore Tasks in controls (A) and in cannabis users (B)..................................................................147
Figure 4.13 Effects of cannabis on the startle reflex magnitude habituation at long lead-time intervals (mean 1600 ms) during the Attend and the Ignore Tasks in controls (A) and in cannabis users (B)................................................................................149
Figure 4.14 Effects of cannabis and attention on the startle reflex onset latency at various lead-time intervals. ...................................................................................152
Figure 5.1 Trial structure in control and pilot studies..................................................176 Figure 5.2 Effects of attention on the startle reflex magnitude at various lead-time
intervals in control (A) and pilot (B) studies. .......................................................181 Figure 5.3 Effects of attention on the startle reflex onset latency at various lead-time
intervals in control (A) and pilot (B) studies. .......................................................183
ix

Figure D.1 Effects of cannabis and attention on the startle reflex magnitude at various intensities of the startle stimuli during the Startle Stimulus Alone Trials (means unadjusted for covariates). ....................................................................................246
Figure D.2 Effects of attention on the startle reflex magnitude at various lead-time intervals in controls (A) and in cannabis users (B; means unadjusted for covariates). ............................................................................................................247
Figure D.3 Effects of cannabis on the startle reflex magnitude at various lead-time intervals during the Attend Task (A) and the Ignore Task (B; means unadjusted for covariates). ............................................................................................................248
Figure D.4 Effects of cannabis and attention on %PPI at short lead-time intervals (mean 20 – 200 ms) during the Attend and the Ignore Tasks (means unadjusted for covariates). ............................................................................................................249
Figure D.5 Effects of cannabis and attention on %PPF at long lead-time intervals (mean 1600 ms) during the Attend and the Ignore Tasks (means unadjusted for covariates). ............................................................................................................249
Figure D.6 Effects of cannabis on the startle reflex magnitude habituation at Startle Stimulus Alone Trials during the Attend and the Ignore Tasks in controls (A) and in cannabis users (B; means unadjusted for covariates)........................................250
Figure D.7 Effects of cannabis on the startle reflex magnitude habituation at short lead-time intervals (mean 20 – 200 ms) during the Attend and the Ignore Tasks in controls (A) and in cannabis users (B; means unadjusted for covariates). ...........251
Figure D.8 Effects of cannabis on the startle reflex magnitude habituation at long lead-time intervals (mean 1600 ms) during the Attend and the Ignore Tasks in controls (A) and in cannabis users (B; means unadjusted for covariates). .........................252
Figure D.9 Effects of cannabis and attention on the startle reflex onset latency at various lead-time intervals (means unadjusted for covariates). ............................253
x

LIST OF ABBREVIATIONS
ANCOVA, ANOVA analysis of covariance and variance, respectively AUC area under curve CAGE alcohol dependence questionnaire CB1, CB2 cannabinoid receptor type 1 and 2, respectively CD critical difference CEDIA cloned-enzyme-donor-immunoassay CIDI-Auto 2.1 Composite International Diagnostic Interview, version AUTO 2.1 ∆9-THC delta-9-tetrahydrocannabinol df degrees of freedom DIP-DM Diagnostic Interview for Psychosis, Diagnostic Module DSM-III-R, IV Diagnostic and Statistical Manual of Mental Disorders, 3rd edition
revised and 4th edition, respectively EMG electromyography FTND Fagerstrom Test for Nicotine Dependence GCMS gas chromatography mass spectrometry GLM general linear model hm harmonic mean ICD-10 International Classification of Disorders, version 10 +LR, –LR positive and negative likelihood ratio, respectively LRA logistic regression analysis MSerror error term for the ANOVA OTI Opiate Treatment Index pF Fisher’s Exact Probability Test PPF prepulse facilitation PPI prepulse inhibition PPM peak magnitude modification Q score cannabis use index calculated from OTI ROC curve receiver operating characteristics curve SDS Severity of (Cannabis) Dependence Scale SMAST Short Michigan Alcoholism Screening Test SPSS-PC 11.0 Statistical Package for Social Sciences version PC 11.0 U Mann-Whitney U-test
xi

ACKNOWLEDGMENTS
The past few months of my life can be best summarised by similar experiences of a
fiction writer, Wilbur Smith:
“There was no money for fun and plenty of long lonely nights- just what a writer
needs to concentrate his mind” (Wilbur Smith, “Weekend Australian”, June 28-29,
2003).
Now, I have finally come to the end of this journey of discovery and maturation both
as a scientist and as a person. I am especially indebted to my supervisor, Associate
Professor Mathew Martin-Iverson, who invited me to Perth and helped me to settle here
when I first arrived in Australia. Matt, I would like to thank you for your advice,
invaluable expertise, and for encouraging me to think independently. Most of all, thank
you for sharing your incredibly vast knowledge and experience with me.
This thesis would not have been completed without the assistance of the following
people and organisations:
• The West Australian Foundation for Schizophrenic Research for a grant to
financially support the study,
• Dr Johanna Badcock for NART training, advice regarding the psychological
instruments used in this study (Chapter 2) and for all her support when there seemed
to be no light at the end of the tunnel,
• Dr Helen Stain for DIP-DM training and clinical advice,
• Leon Dusci from the PathCentre for his assistance with interpretation of urine drug
screens (Chapter 2),
• Daniel Rock for assistance and advice regarding patient recruitment,
• Patrick O’Connor for advice regarding control recruitment,
xii

• Sarah Heinzman from the “West Australian” newspaper for the article about this
study, which helped me to recruit most of the cannabis-using participants,
• Milan Dragovic and Dana Hince for assistance with statistical issues (Milan with
Chapter 3 and Dana with Chapter 4),
• Nick Mondinos for IT assistance (and for saving my computer from being thrown out
of the window on many occasions…),
• Maggie Hegarty and Ann Johnstone for help with administrative aspects of the study,
• School of Psychiatry and Clinical Neurosciences, the University of Western
Australia, for a PhD scholarship and a stipend to conduct the study,
• the Centre for Clinical Research in Neuropsychiatry (CCRN) at Graylands Hospital,
where I was based, for excellent facilities,
• all staff and students at CCRN for warmly welcoming me into “the family”,
providing advice regarding work issues, and for becoming supportive friends,
• participants in this study for their time and enthusiasm.
Finally, I would like to thank my family, both in New Zealand and in Poland, for
their constant interest and all the good vibes sent via the phone calls, e-mails, and
letters. Especially, to Basia, Waldi, and Wojtek for putting up with my moving around
the world and reminding me to keep going forward when everything seemed too
difficult. Last, but not least, to my friends all over the world, my friends and flatmates
in Australia, and the fellow students- thanks for making me smile when I was ready to
start pulling my hair out! Now, I’m ready to return the favour!
xiii

This thesis is dedicated to people suffering from schizophrenia,
especially A.K. and D.P., with the hope that one day
the illness will be cured.
xiv
“The most significant findings often result from
the investigation of relatively simple processes”
Landis and Hunt, 1939
xv

CHAPTER 1. GENERAL INTRODUCTION
1.1 Preface
A co-occurrence of two disorders is called comorbidity and it refers to the effects of
one disorder on the presentation, course, biological parameters, and treatment outcome
of another disorder (Bogenschutz & Nurnberg, 2000). Many studies have shown that
such comorbidity exists between cannabis misuse and psychotic illness, mainly
schizophrenia, although it remains unclear what, if any, causal relationship exists
between them. The understanding of this comorbidity is especially difficult, because
the neurobiological bases of schizophrenia and effects of cannabis on the brain function
in living humans are not well understood. Therefore, the aim of this study was to
investigate the association between cannabis use and prepulse inhibition of the startle
reflex, which is deficient in patients with schizophrenia and can be altered by
cannabinoids in rodents.
This thesis is written as a collection of scientific papers. Each chapter begins with a
preface to summarise the content of the chapter. Furthermore, each chapter contains its
own abstract, introduction, methods, results, and discussion sections. The current
chapter contains a general overview of the evidence linking cannabis use and
schizophrenia, including symptomatic similarities, cognitive deficits, and possible
pharmacological links between the two. The second part of this chapter focuses on the
modulation of the startle reflex as one marker of brain function in living humans. The
chapter finishes with a summary of the aims of the current study. The investigation of
such aims is reported in Chapters 2 – 6. Finally, Chapter 7 contains an overall
discussion and conclusion.
1

1.2 Prevalence of Cannabis Use
Cannabis is the most widely used illegal substance in Australia and throughout the
world. The consumption of cannabis has particularly increased among young adults in
recent years as reported by large epidemiological studies from New Zealand (NZ), the
United Kingdom (UK), and the United States (USA; Degenhardt, Lynskey, & Hall,
2000; Fergusson & Horwood, 2000a; Gledhill-Hoyt, Lee, Strote, & Wechsler, 2000;
Miller & Plant, 2002; Poulton, Brooke, Moffitt, Stanton, & Silva, 1997). In Australia, a
third of the adult population and 41% of respondents 14 years or older reported having
ever tried cannabis (Hall, Solowij, & Lemon, 1994; Makkai & McAllister, 1997).
While most users consume cannabis once or twice a year, a large percentage (34%)
report more regular use (once a week or more often; Makkai & McAllister, 1997).
Furthermore, some studies also show that the potency of cannabis may have
increased in the last 20 years. For instance, the potency of cannabis has risen from
1.5% in 1980 to 4.47% in 1997 in the USA (ElSohly et al., 2000). Cannabis with
similar potency is currently available in Australia and New Zealand (Hall & Swift,
2000). In addition, many users in Australia prefer the more potent forms of cannabis,
such as heads rather than leaves (Ashton, 2001; Didcott, Reilly, Swift, & Hall, 1997;
Hall & Swift, 2000).
1.3 Health Consequences of Cannabis Use
The widespread use of cannabis may have various consequences on health, including
therapeutic and adverse effects. The therapeutic use of cannabis was firstly noted in
China 5000 years ago and reports of medicinal use of cannabis subsequently appeared
throughout the world (Robson, 2001). In general, cannabis is thought to relieve pain,
nausea, intra-ocular pressure, movement disorders, and to enhance appetite (for review
see Hall et al., 1994; Hollister, 1986).
2

Regardless of the potential therapeutic effects, the vast majority of scientific
literature focuses on the adverse consequences of cannabis use on mental health.
Firstly, heavy cannabis use can lead to development of cannabis dependence and abuse
disorders (Fergusson & Horwood, 1997, 2000a; Poulton et al., 1997; Swift, Hall, &
Teesson, 2001). The proportion of persons with a primary cannabis-related problem in
Australia has steadily increased from 4% in 1990 to 10.8% in 1997 (Hall & Swift,
2000). Similarly, in Western Australia (WA), where the current study was conducted,
cannabis misuse problems (abuse and dependence) account for rapidly increasing rate of
first-time hospital admissions (185 in early 1980s to 1617 in early 1990s; Patterson,
Holman, English, Hulse, & et al., 1999). The authors of the study argue that due to lack
of any major changes in treatment policy in WA these rates were unlikely to be affected
by hospital records of substance use, interest of clinicians and the public, or any
financial incentives to record comorbid conditions (Patterson et al., 1999).
Secondly, cannabis use may also lead to use of other substances (gateway
hypothesis) and development of other substance-misuse disorders. In support for this
hypothesis, a longitudinal study in NZ showed that cannabis use preceded the use of
other illicit substances and heavy cannabis users had 140 times the risk of using other
substances (Fergusson & Horwood, 2000b; Fergusson, Horwood, & Swain-Campbell,
2002). In contrast, data from Holland suggests that cannabis use may not have the
gateway effect if users can obtain cannabis legally in coffee shops (MacCoun & Reuter,
2001). Such environment removes the need to purchase cannabis from street dealers
and thus reduces the potential contact with other illegal substances (MacCoun & Reuter,
2001).
Finally, cannabis misuse disorders and mental illness, in particular schizophrenia,
seem to co-occur together at rates higher than those observed in the general population
(Schneier & Siris, 1987). For instance, individuals with cannabis misuse diagnoses
3

were 4.8 times as likely to have a concurrent diagnosis of schizophrenia in the USA
(Regier et al., 1990), and 90% of respondents with cannabis dependence disorder had a
lifetime diagnosis of mental illness (Agosti, Nunes, & Levin, 2002). In Australia,
72.2% of people with psychotic illness reported having used cannabis at least once in
their lifetime (Jablensky et al., 1999), compared to the rate of 33% among the adult
population in Australia (Hall et al., 1994). In addition, 24% of cannabis users with
psychotic illness were daily or nearly daily users in the last year (Jablensky et al., 1999)
compared to 2% in the general population (Hall & Swift, 2000). Another study showed
that 25.1% of people with psychotic illness and 36% of patients with schizophrenia had
a lifetime diagnosis of cannabis abuse or abuse/dependence respectively (Fowler, Carr,
Carter, & Lewin, 1998; Jablensky et al., 1999). Apart from psychosis, some attention
has also been devoted to the link between cannabis use and affective mental illnesses,
such as depression and anxiety disorders (Fergusson et al., 2002; Johns, 2001; Patton et
al., 2002; Rey, Sawyer, Raphael, Patton, & Lynskey, 2002).
1.4 Comorbidity between Cannabis Use and Schizophrenia
1.4.1 Hypotheses Explaining Comorbidity
The link between cannabis use and schizophrenia is not well understood and could be
explained using one of the following hypotheses:
1. the causation hypothesis, which states that cannabis use either increases the risk for
the development of psychosis and/or schizophrenia or worsens the symptoms of pre-
existing schizophrenia,
2. the self-medication hypothesis, which states that individuals predisposed to psychosis
and/or schizophrenia are more likely to use cannabis to alleviate the symptoms of
their illness and/or to obtain relief from the side-effects of antipsychotic medication,
4

3. the common-cause hypothesis, which states that there is a common factor
predisposing to both disorders, which otherwise are not related to each other
(Bogenschutz & Nurnberg, 2000; Khantzian, 1985; Krystal, D'Souza, Madonick, &
Petrakis, 1999).
1.4.2 Why Study Comorbidity?
There are a number of reasons why it is important to understand the link between
cannabis use and schizophrenia. Firstly, if cannabis use contributes to development of
mental illness then education about the risks of cannabis use could potentially reduce
the proportion of mental illnesses in the world. Currently, neuropsychiatric disorders
account for approximately 25% of all illnesses in developed countries (Jablensky et al.,
2000) and mental disorders contribute 19.1% to the total burden of disease in Australia
(Jorm, Griffiths, Christensen, & Medway, 2001). Schizophrenia is especially
detrimental to both the individual and the society. It often develops in young adulthood
with a prevalence rate of 2 to 5 in every 1000 (Jablensky et al., 1999). Regardless of its
low prevalence status, schizophrenia is a lifelong chronic or recurrent illness
characterised by behavioural and personality disorganisation, and long-term dependency
on treatments and services (Jablensky et al., 2000). A large Australian study found that
people with psychotic disorders experience high rates of functional impairments and
disability, decreased quality of life, persistent symptoms, substance use comorbidity,
side effects from medication, social isolation, and difficult socioeconomic
circumstances (Jablensky et al., 1999). Thus, understanding the action of cannabis
could prevent at least some individuals from developing schizophrenia, if cannabis is
found to be a causative factor.
Secondly, if cannabis use is an attempt to self-medicate then cannabinoids could be
used to develop new medications to improve the quality of patients’ life. The advantage
5

of such medications would be that the patients would obtain well-controlled doses from
legal distributors and would not need to inhale them.
Thirdly, if cannabis use and schizophrenia are not related in cause-effect relationship
then studies could help to discover common factors linking the two disorders. Such
factors could include similar neurobiological mechanisms underlying cannabis use and
development of schizophrenia. Understanding of such neural networks could contribute
to a better understanding of schizophrenia. Alternatively, a common cause may be
social in origin and an understanding of the relationship between cannabis use and
schizophrenia may increase attention to the relevant social conditions.
1.4.3 Literature Review Regarding Comorbidity
In order to assess the evidence for comorbidity between cannabis use and
schizophrenia a detailed literature search was performed using the following electronic
databases:
• MEDLINE 1966 to November 2003
• PsycINFO 1872 to November 2003
• EMBASE 1988 to November 2003.
Selected references were examined for similarity of symptoms between cannabis users
and schizophrenia patients and the temporal association between the onset of any
symptoms and the onset of cannabis use. The literature review is summarised in Table
1.1.
The literature in Table 1.1 suggests that cannabis use is associated with
schizophrenia in terms of symptomatology, number and duration of hospital admissions,
premorbid adjustment, and compliance with medication, although the results among the
studies are often inconsistent. In particular, there is little evidence to support either
causal or effective relationship between cannabis use and schizophrenia.
6

Table 1.1 Evidence for comorbidity between cannabis use and schizophrenia
Trend Studies (by author’s name)
More positive and/or negative symptoms and psychopathology • Case-control studies (1 – 100 participants) • Epidemiological/longitudinal studies (over 100
participants)
(Basu, Malhotra, Bhagat, & Varma, 1999; Bernhardson & Gunne, 1972; Bowers, 1998; Caspari, 1999; Dalby & Duncan, 1987; Dumas et al., 2002; Georgotas & Zeidenberg, 1979; Gersten, 1980; Harding & Knight, 1973; Keeler, 1967; Keup, 1970; Knudsen & Vilmar, 1984; Leweke & Emrich, 1998; Linszen, Dingemans, & Lenior, 1994; Martinez-Arevalo, Calcedo-Ordonez, & Varo-Prieto, 1994; Mathers & Ghodse, 1992; McGuire et al., 1995; Nunez & Gurpegui, 2002; Rabe-Jablonska & Gmitrowicz, 1989; Sembhi & Lee, 1999; Talbott & Teague, 1969; Thacore & Shukla, 1976; Treffert, 1978; Tsuang, Simpson, & Kronfol, 1982; Verdoux, Gindre, Sorbara, Tournier, & Swendsen, 2003) (Allebeck, Adamsson, Engstrom, & Rydberg, 1993; Andreasson, Allebeck, Engstrom, & Rydberg, 1987; Andreasson, Allebeck, & Rydberg, 1989; Arseneault et al., 2002; Chopra & Smith, 1974; Degenhardt & Hall, 2001a; Farrell et al., 2002; Fergusson, Horwood, & Swain-Campbell, 2003; Hambrecht & Hafner, 2000; Negrete, Knapp, Douglas, & Smith, 1986; Nunn, Rizza, & Peters, 2001; Tennant & Groesbeck, 1972; Thomas, 1996; Tien & Anthony, 1990; van Os et al., 2002; Verdoux, Sorbara, Gindre, Swendsen, & Van Os, 2002; Williams, Wellman, & Rawlins, 1996; Zammit, Allebeck, Andreasson, Lundberg, & Lewis, 2002)
Less positive and/or negative symptoms; less psychopathology
(Bersani, Orlandi, Gherardelli, & Pancheri, 2002a; Bersani, Orlandi, Kotzalidis, & Pancheri, 2002b; Katz et al., 2000; Peralta & Cuesta, 1992; Zisook et al., 1992)
No impact on positive and/or negative symptoms
(Dervaux et al., 2003; Hamera, Schneider, & Deviney, 1995; Peralta & Cuesta, 1992)
More hospitalisations; more remissions; longer hospital stays (Allebeck et al., 1993; Caspari, 1999; Dervaux et al., 2003; Grace, Shenfield, & Tennant, 2000; Martinez-Arevalo et al., 1994; Negrete et al., 1986)
Less hospitalisations, shorter duration of hospital stay, faster recovery
(Mueser et al., 2000; Warner et al., 1994)
Same number of hospitalisations and duration of hospital stay; same age of first psychiatric contact
(Dervaux et al., 2003; Grace et al., 2000)
Worse premorbid adjustment, less social contacts, worse social functioning
(Caspari, 1999; Mueser et al., 2000)
Better premorbid adjustment, more social contacts, better social functioning
(Warner et al., 1994; Wolthaus, Linszen, Dingermans, & Schene, 2000)
Substance use began before the onset of mental illness or during prodromal phase; substance use diagnosis best predictor of schizophrenia; younger age of first admission/onset of positive/negative symptoms
(Allebeck et al., 1993; Bersani, Orlandi, Kotzalidis et al., 2002b; Dervaux et al., 2003; Linszen et al., 1994; Saxena, 1993; Wolthaus et al., 2000)
Substance use began after the onset of mental illness; older age of onset of mental illness
(Bersani, Orlandi, Kotzalidis et al., 2002b; Silver & Abboud, 1994)
Same age of onset of substance use and schizophrenia
(Verdoux et al., 2003)
Poor compliance with medication; diminished responsiveness towards medication
(Knudsen & Vilmar, 1984)
Same compliance with medication; same responsiveness to medication
(Dervaux et al., 2003)
7

1.4.4 Problems with Interpretation of Direction of Comorbidity
Regardless of the volume of literature (Table 1.1), interpretation of association data
in terms of cause/effect relationships is difficult for a number of reasons. Firstly, the
main argument against causation and self-medication hypotheses is that the rates of
schizophrenia are relatively constant throughout the world (Jablensky et al., 1992), even
in countries traditionally associated with high rates of cannabis use, such as Jamaica
(Hickling, 1991). Similarly, the incidence of schizophrenia in Australia, where
cannabis use has rapidly increased in the last 30 years, is comparable with the rest of the
world (Degenhardt & Hall, 2002; Degenhardt, Hall, & Lynskey, 2003; Degenhardt et
al., 2000).
Secondly, symptoms of schizophrenia and/or psychosis could be misdiagnosed for
symptoms of intoxication with cannabis and/or other substances being frequently co-
used by cannabis users (Mueser et al., 1990; Schneier & Siris, 1987; Thornicroft, 1990).
Symptoms of schizophrenia particularly resemble cannabis-induced acute paranoid
psychosis, cannabis psychosis, which arises following prolonged heavy use, is short-
lived, and presumably would not occur in the absence of cannabis use (Basu et al.,
1999; Ghodse, 1986; Mathers & Ghodse, 1992; Nunez & Gurpegui, 2002; Thacore &
Shukla, 1976; Thomas, 1993). The symptoms of cannabis psychosis often disappear
with the cessation of use and it is unclear whether a single episode of such cannabis
psychosis could progress to development of schizophrenia. In fact, some authors argue
that chronic cannabis psychosis per se does not exist (Thomas, 1993; Thornicroft, 1990)
or if it does exist then it is indistinguishable from symptoms of schizophrenia (Abruzzi,
1975; Imade & Ebie, 1991). Some go as far as to suggest that cannabis psychosis and
schizophrenia are both the final stage of the same underlying pathological process and
that cannabis psychoses are triggered schizophrenias (Taschner, 1983).
8

Thirdly, most studies do not control for temporal relationship between symptoms of
the two disorders (Fergusson et al., 2003). Thus, in most studies patients are assessed
only once, during an acute episode of psychosis, which may be mistaken for
schizophrenia (Bogenschutz & Nurnberg, 2000). Longitudinal studies are more reliable
in terms of temporality, however the measurements are often discrete, taken at few
points in time, and not gathered continuously (Fergusson et al., 2003). It is, therefore,
difficult to determine whether the symptoms induced by cannabis use represent a
relapse in previously psychotic patients, precipitation of psychosis in participants
predisposed to psychosis, or development of a truly new psychosis (Thomas, 1993). An
interesting suggestion is that, in short-term, cannabis use may provide temporary relief
from the emerging negative symptoms of schizophrenia and/or the neuroleptic-induced
side effects, if already diagnosed with the illness, but long-term use seems to exacerbate
positive symptoms (Buckley, 1998). Furthermore, patients may stop using medication
due to unwanted side-effects and thus a relapse in symptoms could be due to such low
compliance with medication and not due to cannabis use alone (Warner et al., 1994).
However, some studies show that relapses in schizophrenia patients using substances
could be attributed to non-compliance with medication only in 50% of cases (Swofford,
Kasckow, Scheller-Gilkey, & Inderbitzin, 1996).
Fourthly, due to ethical and legal aspects of cannabis use most studies in humans
suffer from various recruitment problems also encountered in the current study. Most
studies use small sample sizes and lack well-matched control groups, in terms of
ethnicity and socioeconomic background (Thornicroft, 1990). These problems are often
encountered even by large epidemiological studies, such as perhaps the most famous
15-year follow up study of Swedish army conscripts, which demonstrated that cannabis
use in early adulthood was associated with a 2.4 times increase in the probability of
developing schizophrenia later on in life (Andreasson et al., 1987). The main limitation
9

of this study was that, of the 45570 conscripts, 274 were schizophrenic and of these
only 21 were heavy cannabis users and only 49 had ever tried cannabis (Andreasson et
al., 1987), thus weakening the evidence for the causation hypothesis. Another study
demonstrated that when schizophrenia patients were matched with controls in a similar
geographical area and with a similar socioeconomic background then the pattern and the
reasons given for substance use were similar between the two groups (Condren,
O'Connor, & Browne, 2001), thus providing evidence against the self-medication
hypothesis. Specifically, it appears that cannabis use may be affected by cultural and
social factors and availability (Condren et al., 2001; Mueser, Bellack, & Blanchard,
1992) rather than be used for specific self-medication purposes (Gearon, Bellack,
Rachbeisel, & Dixon, 2001). Furthermore, samples of schizophrenia patients are also
biased due to limited availability of patients and the local hospitalisation policy. The
participants are often recruited from acute patients or selected from previously
hospitalised samples, who may be predisposed to poorer outcomes (Baigent, Holme, &
Hafner, 1995; Cuffel & Chase, 1994). The baseline rates of remission and relapse are
often not reported so that the patients studied may have a high rate of hospitalisations
even before developing a substance use disorder (Cuffel & Chase, 1994). Similarly,
many samples include involuntary public hospital patients who may be less compliant
with medication, more ill, and more likely to use substances than patients in private care
(Fowler et al., 1998).
Finally, it appears that some studies find no causation/self-medication effects of
cannabis use and suggest that other factors combined with cannabis use could
precipitate schizophrenia-like psychosis. For instance, cannabis use may be associated
with genetic predisposition to schizophrenia because psychotic patients with, but not
without, cannabis in their urine were found to have a higher familial risk of psychosis
(McGuire et al., 1995). Other factors could include similar age of onset of
10

schizophrenia and substance use, gender, low socioeconomic background, availability
and cost of substances (Bogenschutz & Nurnberg, 2000; Fergusson & Horwood, 1997;
Hambrecht & Hafner, 1996). Cannabis use can also result from the more rapid
discharges from hospitals, before the patients are fit enough to stop their cannabis use
(Siris, 1992) or simply the increased sensitivity of the investigators towards cannabis
use (Alterman, 1992). Some authors even suggest that psychotic symptoms following
illegal substance use could be due to thoughts occurring as a result of being engaged in
an illegal activity rather than to the strict pharmacological effects of drugs (Tien &
Anthony, 1990). In addition, some studies have found that patients with comorbid
substance use disorder often report a better premorbid adjustment (Arndt, Tyrrell,
Flaum, & Andreasen, 1992). Thus, substance use may result from more social contacts,
and allow for social acceptance, at least within the substance-using groups, and for an
identity more acceptable than that of a ‘mentally ill’ (Lamb, 1982). On the other hand
patients with less social skills may be more likely to become involved in social circles
where substances are used (a social marginalisation effect; Mueser et al., 2000).
1.4.5 Summary of Evidence for Comorbidity
In summary, based on the above evidence it seems unlikely that cannabis use alone
causes/results from schizophrenia. Instead, it is more likely that cannabis use combined
with other factors, including family history of schizophrenia, early age of onset of
cannabis use, socioeconomic background, and premorbid adjustment, could precipitate
schizophrenia-like psychosis. It appears that such psychosis ceases with cessation of
use; however, it is unclear whether cannabis-induced psychosis could progress into
schizophrenia.
11

1.5 Cannabis Use and Cognitive Function
The comorbidity between cannabis use and schizophrenia could also be investigated
by comparing the cognitive function in cannabis users and schizophrenia patients. In
general, schizophrenia is characterised by an overall decline in cognitive functioning in
terms of reduced IQ, deficits in memory, attention, learning, and planning (Kuperberg &
Heckers, 2000). The deficits in controlled cognitive processes (Callaway & Naghdi,
1982; Gjerde, 1983) may be due to reduced availability of controlled processing
resources (Nuechterlein & Dawson, 1984). Specifically, patients with schizophrenia
show primary impairments in the early stages of information processing following
stimulus onset, particularly in terms of filtering of internal and external stimulation
(McGhie & Chapman, 1961).
Cannabis users experience similar cognitive impairments, some of which may be due
to alteration in the endogenous cannabinoid system (refer to the next section; Emrich,
Leweke, & Schneider, 1997; Schneider, Leweke, Mueller-Vahl, & Emrich, 1998).
Acutely, cannabis produces many psychotropic effects in humans for approximately 4 –
24 hours after use, including euphoria, impaired attention and short-term memory,
altered perception of time and space, and dream states (Solowij, 1998). Some users,
unfamiliar with the effects of cannabis, may also experience anxiety and acute paranoid
states (Hollister, 1986). The long-term use of cannabis produces impairments,
particularly in selective attention, which resemble similar impairments in schizophrenia.
Specifically, using frontal processing negativity to irrelevant stimuli, chronic and heavy
cannabis users demonstrated impairments in focusing attention and filtering irrelevant
stimuli related to the overall length of cannabis use (Solowij, 1995a; Solowij, Michie, &
Fox, 1991, 1995b). Speed of processing was also delayed in the cannabis group and
this was related to the frequency of use and not to the duration of use (Solowij et al.,
1995b). Similarly, in another ERP study, chronic cannabis users utilised different
12

strategies to allocate attention in a selective attention task (Kempel, Lampe, Parnefjord,
Hennig, & Kunert, 2003). Current cannabis use was also related to deficits in
attentional inhibition, assessed with negative priming tests (Mass, Bardong, Kindl, &
Dahme, 2001; Skosnik, Spatz-Glenn, & Park, 2001). In addition, it appears that the
early age of onset of cannabis use leads to attentional dysfunction in adults, assessed in
terms of impaired reaction times in a visual scanning task (Ehrenreich et al., 1999).
However, any deficiencies in the cognitive function in cannabis users are not associated
with any specific brain damage (Solowij, 1998; Wert & Raulin, 1986).
While the acute effects seem to disappear with cessation of use, controversy
surrounds the possibility that chronic effects of cannabis use may persist and even
become permanent (Pope, Gruber, & Yurgelun-Todd, 1995; Solowij, 1995a). Some
studies found that the cognitive impairments in long-term users, such as decline in IQ
and a recall of words, were reversed following abstinence or cessation of use (Fried,
Watkinson, James, & Gray, 2002; Pope, Gruber, Hudson, Huestis, & Yurgelun-Todd,
2001). Similarly, attentional inhibition was impaired only in the current cannabis users,
but not in the past users and was not related to amount of cannabis consumed per week
(Skosnik et al., 2001). In contrast, others found that cognitive performance, including
memory and attention measures, declined with the duration of cannabis use in years
(Solowij et al., 2002a) and persisted even after 28 days of abstinence (Bolla, Brown,
Eldreth, Tate, & Cadet, 2002).
In summary, similarities in cognitive impairment could account for the comorbidity
between cannabis use and schizophrenia. Depending on the acute and chronic use
cannabis produces differential cognitive impairments in healthy humans. It appears that
particularly the chronic and heavy use of cannabis is associated with subtle cognitive
impairment similar to that observed in schizophrenia. Specifically, cannabis use
impairs attention and memory function in healthy humans. However, in contrast to
13

schizophrenia, it is unclear whether such cognitive impairments are long-lasting
following cessation of cannabis use, because cannabis use does not seem to cause any
specific and permanent brain damage.
1.6 Cannabis Use and Neuropharmacology
Even though the link between cannabis use and schizophrenia is supported by a vast
amount of literature, the pharmacological bases for such comorbidity are not well
understood.
1.6.1 Pharmacology of Cannabis
Cannabis is derived from cannabis plant (Cannabis sativa) which consists of at least
66 oxygen-containing aromatic hydrocarbon compounds called cannabinoids (Joy,
Watson, & Benson, 1999). The psychoactive properties of cannabis can be attributed to
one such cannabinoid, delta-9-tetrahydrocannabinol, ∆9-THC (Gaoni & Mechoulam,
1964). The main effects of cannabinoids are mediated via two types of G-protein-
coupled cannabinoid receptors, although more receptors may be involved (Pertwee,
1997). The cannabinoid-1 receptors (CB1) are mainly found in the central nervous
system and are thought to mediate the psychoactive properties of cannabinoids
(Matsuda, Lolait, Brownstein, Young, & Bonner, 1990). In contrast, the cannabinoid-2
receptors (CB2) are mainly found in the periphery, particularly in the immune system
and mediate other effects of cannabinoids (Munro, Thomas, & Abu-Shaar, 1993).
Following the discovery of cannabinoid receptors, endogenous cannabinoids have also
been identified, the main ones being anandamide (Devane et al., 1992) and 2-
arachidonyl glycerol (Mechoulam et al., 1995).
1.6.2 Cannabis and Endogenous Cannabinoid System
The comorbidity between cannabis use and schizophrenia could result from either a
disruption to the endogenous cannabinoid system by schizophrenia and/or by cannabis
14

use influencing neural circuitry involved in schizophrenia. In support of these
possibilities, some studies found that schizophrenia patients had elevated levels of
anandamide in cerebrospinal fluid (Leweke, Giuffrida, Wurster, Emrich, & Piomelli,
1999) and an abnormal metabolism of anandamide precursor, arachidonic acid (Yao,
van Kammen, & Gurklis, 1996). However, the increase in anandamide depends on
cannabis use by the patients. Specifically, among the antipsychotic-naïve first-episode
schizophrenia patients only the low-frequency cannabis users showed an increase in
anandamide in contrast to controls, while the high-frequency users were no different to
controls (Markus Leweke, personal communication). The function of such increase in
anandamide is not well understood. It has been suggested that anandamide may have a
protective role, because elevated levels of anandamide were correlated with reduction in
PANSS scores in prodromal states of schizophrenia (Leweke et al., 2004). The high
frequency of exogenous cannabis use may also normalise the elevated levels of
anandamide by triggering a homeostatic adaptation of the endogenous cannabinoid
system (Markus Leweke, personal communication), thus suggesting a self-medication
role of cannabis.
Furthermore, it has been demonstrated that a diagnosis of schizophrenia independent
of cannabis use and recent use of cannabis, independent of psychiatric diagnosis,
contributed to an up-regulation of CB1 receptor binding in postmortem brains relative to
healthy controls (Dean, Sundram, Bradbury, Scarr, & Copolov, 2001). Such alteration
in CB1 receptor functioning could result from genetic mutations in the 6q14 region,
which contains the gene coding for CB1 receptors and is also a candidate genetic region
for schizophrenia (Fritzsche, 2000). However, only one study showed that
schizophrenia was associated with a genetic mutation of the CB1 receptor gene (Ujike et
al., 2002), while others failed to find such an association (Tsai, Wang, & Hong, 2000).
Similarly, no mutations in CB1 receptor gene were detected in participants with
15

cannabis-induced psychosis versus non-psychotic controls (Hoehe et al., 2000).
Interestingly, a silent mutation in CB1 gene was discovered in non-substance abusing
patients with schizophrenia in contrast to substance abusing patients who were no
different from controls, suggesting that substance use may be protective against
abnormalities in CB1 genes (Leroy et al., 2001). On the other hand, patients without
mutations in the CB1 genes may be able to experience the reinforcing effects of
substances and thus continue to use them (Leroy et al., 2001).
1.6.3 Cannabis and Dopamine Interaction
Apart from the disruption to the endogenous cannabinoid system, the comorbidity
between cannabis use and schizophrenia could result from an interaction between
cannabinoids and neurotransmitters thought to be affected in schizophrenia, such as the
most likely candidate, dopamine. The abnormal transmission of dopamine in the brain,
likely in the mesolimbic and mesocortical pathways, has been proposed as the causative
model of schizophrenia, known as the dopamine hypothesis of schizophrenia (Seeman,
1987; Snyder, 1976). Specifically, the positive symptoms of schizophrenia may be due
to the increase in dopamine transmission in the mesolimbic pathway while the negative
symptoms may be related to the decrease in dopaminergic activity in the prefrontal
cortex (Davis, Kahn, Ko, & Davidson, 1991; Knable & Weinberger, 1997; Weinberger,
1987).
There are a number of lines of evidence suggesting that cannabinoids may interact
with the dopamine system. Firstly, CB1 receptors are mainly distributed in the
dopamine rich regions of the human brain, such as the basal ganglia, hippocampus,
cerebellum, globus pallidus, substantia nigra, and cerebral cortex (Glass, Dragunow, &
Faull, 1997a; Herkenham et al., 1990; Howlett et al., 1990; Mailleux & Vanderhaeghen,
1992). Furthermore, perinatal exposure to cannabinoids altered the normal development
16

of nigrostriatal dopaminergic neurons in rats (de Fonseca, Cebeira, Fernandez-Ruiz,
Navarro, & Ramos, 1991).
Secondly, the interaction between dopamine and cannabinoids could affect the
endogenous cannabinoids and alter the dopamine signalling pathways in the brain. In
support for this hypothesis microdialysis studies showed that acute activation of
dopamine D2-like, but not D1-like, receptors in rat dorsal striatum can trigger release of
anandamide (Giuffrida et al., 1999). In addition, the acute activation of CB1 receptor
inhibited either a dopamine D1-mediated increase in cyclic AMP (cAMP) accumulation
in rat striatal slices (Bidaut-Russell & Howlett, 1991) or a dopamine D2-mediated
inhibition of cAMP accumulation (Glass & Felder, 1997b). Similarly, chronic ∆9-THC
treatment resulted in a decreased activation of G proteins and region-specific down-
regulation and desensitisation of cannabinoid receptors in rat brain slices (Breivogel et
al., 1999).
Thirdly, cannabis could increase dopamine transmission, similarly to other drugs of
abuse, such as amphetamines (Di Chiara & Imperato, 1988), which also induce
schizophrenia-like psychosis (Angrist & Gershon, 1970). However, the evidence for
such increase in dopamine transmission is equivocal. In rats acute treatment with
cannabinoids (∆9-THC and/or synthetic cannabinoid agonists) enhanced dopamine
synthesis (Bonnin, de Miguel, Castro, Ramos, & Fernandez-Ruiz, 1996; de Fonseca,
Cebeira, Hernandez, Ramos, & Fernandez-Ruiz, 1990; Hernandez, Garcia-Gil,
Berrendero, Ramos, & Fernandez-Ruiz, 1997), increased dopamine metabolite
(homovanillic acid) concentrations (Bowers, Jr. & Hoffman, 1986), and decreased the
number of striatal dopamine D2 binding sites (de Fonseca et al., 1992). Similarly,
electrophysiological studies have shown that acute treatment with cannabinoids
increased firing of dopamine neurons in substantia nigra pars compacta, ventral
tegmental area, and prefrontal cortex (Diana, Melis, & Gessa, 1998; French, Dillon, &
17

Wu, 1997; Gessa, Melis, Muntoni, & Diana, 1998; Melis, Gessa, & Diana, 2000),
decreased thresholds for electrical self-stimulation in rats (Gardner et al., 1988), and
increased potassium-evoked release of dopamine in neostriatum in vivo (Ng Cheong
Ton et al., 1988). The acute administration of ∆9-THC to rats also inhibited the uptake
of dopamine (Sakurai-Yamashita, Kataoka, Fujiwara, Mine, & Ueki, 1989) and
increased extracellular dopamine concentration in brain slices of striatum (Malone &
Taylor, 1999), limbic forebrain (Navarro et al., 1993), and nucleus accumbens (Chen et
al., 1990; Chen, Paredes, Lowinson, & Gardner, 1991), particularly in the shell region
(Tanda, Loddo, & Di Chiara, 1999; Tanda, Pontieri, & Di Chiara, 1997). Similarly to
acute administration, chronic administration of ∆9-THC in rats stimulated firing of
dopamine neurons in ventral tegmental area and only a minimal increase in firing in
substantia nigra pars compacta (Wu & French, 2000).
Finally, limited evidence regarding acute effects of cannabis use and dopamine
interaction is also provided by human studies. A report on a drug-free schizophrenic
patient who used cannabis secretively during a break in a brain imaging study (single
photon emission computerised tomography, SPECT) showed that following cannabis
use the synaptic dopaminergic activity increased as indicated by a 20% decrease in the
striatal dopamine D2 receptor binding ratio (Voruganti, Slomka, Zabel, Mattar, & Awad,
2001). Similarly, up-regulation in the dopamine uptake mechanism, indicated by
increase in the concentration of dopamine transporter (DAT), was observed in
postmortem brain slices of schizophrenia patients who used cannabis recently (Dean,
Bradbury, & Copolov, 2003).
In contrast to these results, a number of studies found that acutely administered ∆9-
THC had no effect on extracellular dopamine concentration in striatum, limbic system
and nucleus accumbens in rats (Castaneda, Moss, Oddie, & Whishaw, 1991; de Fonseca
et al., 1992). In fact, acute administration of anandamide and cannabinoid agonist CP
18

55940 reduced release of dopamine in electrically stimulated rat striatal slices
(Cadogan, Alexander, Boyd, & Kendall, 1997) and acute treatment with ∆9-THC also
reduced potassium-stimulated DA release in the limbic forebrain (Navarro et al., 1993).
Additionally, in rat brain slices, cannabinoid receptor agonists (WIN-55212-2 and CP-
55940) and antagonists (SR-141716A) did not affect electrically evoked release of
dopamine in striatum and nucleus accumbens (Szabo, Muller, & Koch, 1999).
Furthermore, cannabinoid effects on the motor behaviour in rodents resemble the
effects of dopamine antagonists and suggest that cannabinoids could reduce dopamine
transmission in the brain. Specifically, cannabinoids inhibit movements and grooming
(Chesher & Jackson, 1980; Crawley et al., 1993; Navarro et al., 1993; Sanudo-Pena et
al., 2000), reduce the stimulation of motor behaviours elicited by selective dopamine
D2-like receptor agonist (Beltramo et al., 2000), potentiate neuroleptic-induced
hypokinesia (Moss, Manderscheid, Montgomery, Norman, & Sanberg, 1989), and
enhance catalepsy produced by dopamine D1 and D2 antagonists (Anderson, Kask, &
Chase, 1996). In humans, cannabis use seems to attenuate some movements, such as
tics (Muller-Vahl, Kolbe, Schneider, & Emrich, 1998), and parkinsonian dyskinesia
(Muller-Vahl, Kolbe, Schneider, & Emrich, 1999). However cannabis use was also
correlated with the presence of tardive dyskinesia (Zaretsky, Rector, Seeman, &
Fornazzari, 1993), a side-effect of chronic treatment with dopamine antagonists.
Finally, the interaction between cannabinoids and other neurotransmitter systems in
the brain could lead to schizophrenia-like disruption and/or modulation of the
dopaminergic transmission. However, the evidence for the role of cannabinoids in
modulation of other neurotransmitters is unclear. Also, it is unknown how some of
these transmitters could alter the dopaminergic system. In some studies cannabinoids
seem to alter acetylcholine (Dewey, 1986), and GABA (Hershkowitz & Szechtman,
1979), but not in others (Cadogan et al., 1997). Furthermore, dopamine release induced
19

by ∆9-THC is modulated by serotonergic changes induced by fluoxetine (Malone &
Taylor, 1999) and by endogenous opioid peptide system located in the ventral
mesencephalic tegmentum (Chen et al., 1990). Finally, ∆9-THC has a similar action on
mesolimbic dopamine transmission as heroin (Tanda et al., 1997).
The apparently contradictory results regarding the effects of cannabinoids on the
dopaminergic function could be due to methodological differences among the studies
including doses, rat strains, gender, specific brain area, type of cannabinoid used, route
of cannabinoid administration, interaction with other compounds (freely moving vs.
anaesthetised animals; dissolving the drugs in alcohol vs. other medium), and the stage
of exposure to cannabinoids (current or withdrawal stage). Furthermore, the acute and
chronic effects of cannabinoids may trigger different responses in the dopaminergic
system (Oviedo, Glowa, & Herkenham, 1993). Specifically, dopamine neuron activity
is normally controlled by negative feedback pathways, which operate to maintain
constant levels of dopamine in the brain (Bunney, 1988). These pathways become
active when dopamine levels change (either increase or decrease) and work to
counteract such a change. Therefore, a cannabinoid-mediated acute increase in
dopamine transmission could be a function of the negative feedback system. The net
effect of cannabis use may be a reduction in dopamine transmission, similar to the
effects of antipsychotic drugs, resulting in compensatory increases in dopamine cell
firing and dopamine release (Hirsch & Weinberger, 1995; Stanley-Cary, Harris, &
Martin-Iverson, 2002). This hypothesis could explain why a one-off use of cannabis
rarely causes psychosis and why some schizophrenia patients use cannabis as a self-
medicating agent. The chronic use of cannabis is likely to contribute to development of
tolerance and, indeed, chronic users tend to use more cannabis to obtain the same effects
(Solowij, 1998). Furthermore, similarly to antipsychotic drugs, sudden cessation of
cannabis use could lead to increase in dopamine transmission and presumably
20

precipitate psychotic symptoms (‘rebound psychosis’). Psychotic symptoms may also
occur following cannabis use during a period of sudden cessation of use due to
withdrawal-induced supersensitivity.
1.6.4 Summary of Pharmacological Effects of Cannabis Use
In summary, it appears that the comorbidity between cannabis use and schizophrenia
could arise from the effects of cannabinoids on the neurotransmitter systems implicated
in schizophrenia. In particular, patients with schizophrenia may be biologically
vulnerable to dopamine and substances acting on the dopamine system. A large volume
of evidence indicates the cannabinoid system may increase the dopamine transmission
in the brain, although behavioural evidence suggests that this effect of cannabinoids
may be secondary to a net decrease in transmission in the dopamine circuitry, similar to
the increase in dopamine cell firing and dopamine release after acute treatment with
dopamine antagonists. Cannabis use may also affect dopamine transmission by altering
other neurotransmitter systems, although the evidence for such interactions is limited
and not well understood. Furthermore, there is also some evidence to suggest that both
cannabis use and schizophrenia affect the endogenous cannabinoid system in the brain.
Therefore, the altered brain chemistry could account for similarities between symptoms
of schizophrenia and cannabis-related psychosis.
1.7 Startle Reflex Modification
The evidence presented in the previous sections suggests that the comorbidity
between schizophrenia and cannabis use could be explained by similarities in
symptoms, neurocognitive impairments, and possible common neurological pathways.
In addition, comorbidity could be investigated in terms of the effects of cannabis use on
various aspects of brain function affected in schizophrenia. One example of
21

physiological abnormality in schizophrenia is reduction in prepulse inhibition (PPI) of
the startle reflex.
1.7.1 Startle Reflex, Prepulse Inhibition and Facilitation
The startle reflex is a contraction of skeletal and facial muscles in response to an
unexpected, abrupt stimulus, such as a sudden loud burst of noise (Landis & Hunt,
1939). In humans the most robust component of the startle reflex is a rapid eye closure
(Landis & Hunt, 1939) which can be quantified by measuring the electromyographic
activity (EMG) of the orbicularis oculi muscles surrounding human eyes (Berg &
Balaban, 1999). The reflex is mediated by a simple neural pathway consisting of three
synaptic connections in the brainstem (auditory nerve - ventral cochlear nucleus -
ventral nucleus of the lateral lemniscus - the nucleus reticularis pontis caudalis) and one
synaptic connection with motoneurons in the spinal cord (Davis, Gendelman, Tischler,
& Gendelman, 1982).
The magnitude of the startle reflex can be modified (inhibited or facilitated) when a
non-startling stimulus (prepulse) is presented before the startle stimulus at a certain time
interval, called lead-time interval (Graham, 1975). In general, prepulses at short lead-
time intervals (30 – 500 ms) induce prepulse inhibition (PPI) of the startle reflex, which
refers to reduction in the magnitude of the startle reflex (Figure 1.1; Graham, 1975). In
contrast, prepulses at long lead-time intervals (1000 ms and greater) increase the
magnitude of the startle reflex in the process of prepulse facilitation (PPF; Graham,
1975).
22

Long lead-timeinterval (ms)
Prepulsestimulus
Startlestimulus
Peakmagnitude
Startlereflex
Onset latency (ms)
Peak latency (ms)
PPI
PPFShort lead-timeinterval (ms)
Figure 1.1 Schematic representation of the startle reflex, prepulse inhibition (PPI) and prepulse facilitation (PPF).
There are a number of advantages of using PPI as a marker of brain function in living
humans. Firstly, PPI can be assessed accurately and non-invasively with surface
electrodes (Berg & Balaban, 1999; Fridlund & Cacioppo, 1986). Secondly, it has high
within-subject and temporal stability (Cadenhead, Carasso, Swerdlow, Geyer, & Braff,
1999; Ludewig, Geyer, Etzensberger, & Vollenweider, 2002a) and high test-retest
reliability in healthy males, females, and patients with schizophrenia (Abel, Waikar,
Pedro, Hemsley, & Geyer, 1998; Schwarzkopf, McCoy, Smith, & Boutros, 1993).
Thirdly, PPI is a robust phenomenon in that it occurs on the first exposure to prepulse
and startle stimuli, does not exhibit habituation or extinction (Light & Braff, 1999), and
is observed in studies utilising various methodologies (Blumenthal, 1999). Fourthly,
the availability of animal models of PPI helps with the understanding of the neural
23

networks controlling the process (Swerdlow, Geyer, & Braff, 2001b). Finally, PPI is
sensitive to sensory, cognitive, social, and pharmacological manipulations (reviewed in
the subsequent sections).
While PPI appears to be a useful technique in assessing the neural function in living
humans and animals, the main problem with interpretation of PPI studies is the
heterogeneity of methodology employed by different studies. Among others, such
differences in methodology include various parameters of the stimuli, such as type,
intensity, and duration, length of lead-time intervals, and presence or absence of
background stimuli, such as white noise. The issue of methodological heterogeneity
will be discussed throughout this thesis, especially in subsections 1.8, Chapter 4, 5, and
7. Such differences in methodology often result in problems with data interpretation
and complicate the comparisons among studies. However, regardless of such variable
methodology the PPI data collected from many laboratories worldwide in the last 30
years appears to have provided some common trends and have contributed to
development of a number of influential theories used until today (refer to the rest of
subsection 1.7, 1.8, and Chapters 4 and 5).
1.7.2 Prepulse Inhibition Deficit and Schizophrenia
The startle reflex and PPI became of interest to psychiatry with a discovery that
patients with schizophrenia show a deficit in PPI relative to healthy controls (Braff et
al., 1978). The reduction in PPI seems to be a robust feature of schizophrenia, because
it has been shown in a large number of studies (for example: Braff, Grillon, & Geyer,
1992; Braff et al., 1978; Braff, Swerdlow, & Geyer, 1999; Grillon, Ameli, Charney,
Krystal, & Braff, 1992; Kumari, Soni, Mathew, & Sharma, 2000; Kumari, Soni, &
Sharma, 1999a; Parwani et al., 2000; Weike, Bauer, & Hamm, 2000). However, the
deficit in PPI is not specific to schizophrenia and has been observed in schizotypal
patients (Cadenhead, Geyer, & Braff, 1993), bipolar patients (Perry, Minassian, Feifel,
24

& Braff, 2001), among the unaffected family members of patients with schizophrenia
(Cadenhead, Swerdlow, Shafer, Diaz, & Braff, 2000), and in psychosis-prone students
(Simons & Giardina, 1992; Swerdlow, Filion, Geyer, & Braff, 1995a). Furthermore,
there is some evidence for reduction in PPI in non-psychotic illnesses, such as obsessive
compulsive disorder (Swerdlow, Benbow, Zisook, Geyer, & Braff, 1993b), attention
deficit hyperactivity disorder (Anthony, 1990), and motor illnesses, such as Tourette’s
syndrome (Castellanos et al., 1996) and Huntington’s disease (Swerdlow et al., 1995b).
The above disorders share a common deficit in terms of inhibition of thoughts,
attention, and movements, suggesting that while a deficit in PPI cannot be thought of as
a biological marker for schizophrenia, it may represent a deficient capacity to suppress
irrelevant processes (Swerdlow, Caine, Braff, & Geyer, 1992b).
There are a number of possible explanations for the PPI reduction in schizophrenia.
Firstly, patients with schizophrenia may exhibit deficiencies in preattentive (automatic)
processing of sensory stimuli. Specifically, the processing of a low-intensity prepulse
stimulus could automatically trigger a protective mechanism to reduce the impact of the
subsequent (startle) stimulus (protection of processing hypothesis; Graham, 1975). In
support for this hypothesis some studies have found that presence of the prepulse
decreased the estimation of the intensity of the startle stimulus (Blumenthal, Schicatano,
Chapman, Norris, & Ergenzinger, 1996a; Cohen, Stitt, & Hoffman, 1981). Similarly,
participants with greater PPI had a more accurate perception of prepulse stimuli (for
review refer to Filion, Dawson, & Schell, 1998). Furthermore, PPI can be thought of as
an automatic process, because it is observed in humans even when they are asleep
(Silverstein, Graham, & Calloway, 1980).
However, the reduction in PPI in schizophrenia cannot be fully explained by the
protection of processing hypothesis, because there is no consistent evidence that
schizophrenia patients are unable to detect and thus process prepulses (refer to
25

subsection 1.7.5). Instead, schizophrenia could be associated with a deficit in
sensorimotor gating (Braff & Geyer, 1990). The term “sensorimotor gating” refers to
inhibition (gating) of a reflexive motor response (startle reflex) by a weak sensory event
(prepulse stimulus; Swerdlow, Braff, & Geyer, 2000b) to prevent sensory overload
(Braff & Geyer, 1990). This ability to ‘gate’ seems to be impaired in schizophrenia
patients compared to healthy controls (Braff et al., 1978; Grillon et al., 1992).
Specifically, the sensory disturbance in schizophrenia seems to manifest itself by an
inability to filter out unwanted stimuli (Shagass, 1976; Stevens, 1973) leading to
‘flooding’ by overwhelming sensory stimulation (Venables, 1964). Therefore, the
disruption in sensorimotor gating could reflect a failure of automatic preattentive stages
of information processing in schizophrenia (Braff & Geyer, 1990; Graham, 1975).
While the protection of processing and sensorimotor gating mechanisms suggest that
PPI is a preattentive and automatic process, a number of studies demonstrated that in
fact PPI can be modified by modality-specific selective attention (the ability to avoid
distraction) at short-lead time intervals. Specifically, healthy humans show an increase
in PPI when instructed to attend to prepulse stimuli relative to ignoring them (Dawson,
Hazlett, Filion, Nuechterlein, & Schell, 1993; Dawson, Schell, Hazlett, Nuechterlein, &
Filion, 2000; DelPezzo & Hoffman, 1980; Filion, Dawson, & Schell, 1993; Filion,
Dawson, & Schell, 1994). Patients with schizophrenia do not show any attentional
modulation of PPI while attending to or ignoring the prepulses (Dawson et al., 1993;
Dawson et al., 2000). Furthermore, the PPI reduction in schizophrenia was observed
when patients were instructed to attend to prepulses, but not when ignoring prepulses at
short lead-time intervals relative to healthy controls (Dawson et al., 1993; Dawson et
al., 2000). The reduction in PPI in schizophrenia was also correlated with increased
distractibility scores (Karper et al., 1996) suggesting a deficit in selective attention in
schizophrenia.
26
Similarly to preattentive processing, selective attention alone may not explain the
PPI reduction in schizophrenia, because such reduction was observed when patients
were not instructed to complete any specific attentional tasks in a large number of
studies mentioned above (for example, Braff et al., 1978). However, during
uninstructed studies patients may passively or actively attempt to attend to stimuli,
because they often sit in front of a blank wall or a computer screen and have no other
tasks to complete. Therefore, a general deficit in attention (McGhie & Chapman, 1961)
may contribute to the lack of attentional modulation of PPI in schizophrenia patients
during instructed studies (Dawson et al., 1993; Dawson et al., 2000) and the PPI
reduction in uninstructed studies.
Finally, PPI deficit in schizophrenia could result from abnormalities in the reflex
circuit controlling PPI and from the physiological properties of neurons controlling the
startle reflex. Indeed the abnormal neurotransmission in the forebrain cortico-striato-
pallido-thalamic circuitry controlling PPI (Swerdlow & Geyer, 1998) is implicated in
various disorders (Swerdlow et al., 1992b). Similarly, neurotoxic lesions of the
component of the PPI circuit (pedunculopontine tegmental nucleus) reduced PPI in rats
(Koch, Kungel, & Herbert, 1993). Based on this evidence it could be speculated that
the reduction in PPI in schizophrenia could also be related to specific anatomical
abnormalities. However, to date, the evidence for consistent anatomical changes in
schizophrenia is controversial (for review see Stevens, 1997).
Furthermore, PPI reduction could result from mechanical properties of neurons
responsible for elicitation of the startle reflex (Hackley & Boelhouwer, 1997).
Specifically, it could be the case that refractory period, which occurs following cell
firing in response to one stimulus (the prepulse stimulus) could account for reduction in
response to the subsequent stimulus (the startle stimulus; Schicatano, Peshori,
Gopalaswamy, Sahay, & Evinger, 2000). In support for this hypothesis it was
27

demonstrated that prepulse inhibition was disrupted in animals with lesions to substantia
nigra pars compacta and the magnitude of prepulse modification was correlated with
reflex excitability (Schicatano et al., 2000). In contrast, the inhibitory processes
mediating PPI have been found to be independent of the motor response to the prepulse
(Swerdlow et al., 2002b). Therefore, it is unlikely that PPI depends primarily on the
properties of the neural circuits, although different processes, including a ‘feed-
forward’, ‘feed-back’ and ‘intrinsic’ inhibition may all contribute to the overall process
of PPI under different conditions (Swerdlow et al., 2001b).
In summary, the PPI reduction at short lead-time intervals in schizophrenia may be
related to a general attentional dysfunction, rather than a primary deficit in processing of
stimuli, sensorimotor gating, or disruption in the neural pathways controlling PPI. Such
attentional dysfunction could lead to sensory overload and subsequent development of
psychosis in schizophrenia.
1.7.3 Prepulse Facilitation and Schizophrenia
In contrast to PPI, PPF at long lead-time intervals seems to reflect sensory
enhancement associated with modality-specific and conscious attentional processing of
the startle reflex (Anthony, 1985b; Graham, 1975). Specifically, the processing of
prepulses at long lead-time intervals seems to depend on selective attention, such that
PPF occurs if attention is directed to the same modality as the startle stimulus and PPI
occurs if attention is directed to a different modality (Anthony & Graham, 1985a). It
has been suggested that attending to sensory modality facilitates sensory processing of
all input in that modality and simultaneously inhibits sensory processing of other
modalities (Anthony, 1985b). Furthermore, any changes in PPF may be secondary to
the emotional modulation of the startle reflex magnitude at long-lead time intervals
(Lang, Bradley, & Cuthbert, 1990). In general, unpleasant pictures (Lang et al., 1990)
or stimuli previously predictive of aversive events (Davis, 1997) increase startle reflex
28

magnitude, while pleasant stimuli reduce the startle reflex magnitude (Lang et al.,
1990).
While the PPI reduction in schizophrenia was robustly demonstrated across many
studies, the assessments of PPF in schizophrenia are infrequent and show inconsistent
results. Studies utilising selective attention paradigms demonstrated PPF reduction in
patients with schizophrenia attending to, but not ignoring prepulses (Dawson et al.,
1993; Dawson et al., 2000). Similar reduction in PPF was observed during an
uninstructed study only in a subgroup of schizophrenia patients with deficit syndrome
(Ludewig & Vollenweider, 2002b). However, patients with non-deficit syndrome
(Ludewig & Vollenweider, 2002b) and patients in other uninstructed passive attention
studies did not show a PPF deficit (Braff et al., 1978). In fact, PPF data, similarly to
PPI data, may be confounded by medication (refer to section 1.8), because never-
medicated first-episode schizophrenia patients showed PPF reduction relative to healthy
controls [Ludewig, 2003a #1251].
In summary, the reduction in PPF at long lead-time intervals does not appear to be a
robust feature of schizophrenia, unlike the reduction in PPI at short lead-time intervals.
However, PPF may be used as a marker of modality-specific selective attention during
instructed attentional tasks and deficits in PPF could indicate an inability to consciously
attend to relevant stimuli and ignore the irrelevant stimuli.
1.7.4 Startle Reflex Magnitude Habituation
In addition to PPI the magnitude of the startle reflex can be reduced in the process of
habituation. Habituation is a reduction in the magnitude of the startle reflex with
repeated presentation of the same startle stimulus (Geyer & Braff, 1982). Unlike a
deficit in PPI, a deficit in habituation of the startle reflex magnitude in schizophrenia
has been demonstrated in some studies [Bolino, 1992 #1303;Braff, 1992 #59;Geyer,
29

1982 #57;Ludewig, 2003a #1251;Taiminen, 2000 #1394], but not in others (Braff et al.,
1999; Ludewig et al., 2002a; Mackeprang, Kristiansen, & Glenthoj, 2002).
The functional role of the startle reflex magnitude habituation is not well understood
in schizophrenia. It has been proposed that disruption in habituation in some patient
subgroups is due to deficit in development and maintenance of selective attention (Abel
et al., 1998; Braff, Swerdlow, & Geyer, 1995; Geyer, Swerdlow, Mansbach, & Braff,
1990). Specifically, it has been suggested that habituation to unimportant stimuli allows
the organism to selectively attend to only the relevant events (Braff et al., 1995).
Therefore, similarly to sensorimotor gating, habituation may represent a protective
attentional filter, whereby reducing the response to the unimportant stimuli protects the
individual from recruitment of attention by irrelevant stimuli (Cowan, 1988).
Therefore, similarly to PPI, deficits in habituation might leave the individual open to
overload of sensory and cognitive information and result in cognitive fragmentation
(Abel et al., 1998). However, while habituation can contribute to selective attention, it
is not a function of selective attention nor it is dependent upon attention. Instead,
habituation represents the simplest form of learning and is a memory-dependent process
(Staddon, Chelaru, & Higa, 2002). Furthermore, it has been suggested that habituation
is not a unitary process and consists of initial sensitisation followed by habituation to
repeated stimulation (Groves & Thompson, 1970). Thus, various schizophrenia
subtypes may be associated with differential abnormalities in these two processes.
At the cellular level habituation of the gill withdrawal reflex in a sea hare Aplysia is
due to reduction in the amount of serotonin released at the synapse between sensory and
motor neurons (Delcomun, 1998; Kandel, Schwartz, & Jessell, 1995). Similarly, rodent
studies suggest that habituation of the startle reflex can be affected by imbalance in
serotonergic and noradrenergic neurotransmitter systems (Geyer & Braff, 1987), which
are targeted by some antipsychotic drugs (Stahl, 1999). Therefore, antipsychotic
30

treatment might have contributed to the contradictory findings regarding disruption in
the startle reflex habituation in schizophrenia patients. In fact, one study demonstrated
that never-medicated first-episode schizophrenia patients may exhibit a generalised
disruption in all aspects of startle reflex modification, including deficits in PPI, PPF,
and the startle reflex habituation [Ludewig, 2003a #1251].
In summary, even though the deficit in the startle reflex habituation is not a
consistent feature of schizophrenia, the investigation of habituation is important,
because habituation could contribute to reduction of PPI (Blumenthal, 1997; Lipp &
Krinitzky, 1998a), thus providing a potential confound factor in studies of PPI. The
startle reflex habituation may also be used to investigate the short-term memory and
contribute to selective attention. Future studies are also necessary to establish the
functional significance of deficit in habituation in some subgroups of schizophrenia
patients.
1.7.5 Startle Reflex Latency
Apart from altering the magnitude of the startle reflex, prepulses also modulate the
onset latency of the startle reflex. In general, the onset latency is reduced (the startle
reflex is facilitated) when prepulses are presented at short and long lead-time intervals
relative to startle stimulus alone trials (Graham, 1975).
The function of latency facilitation is not well understood. In general, it appears that
the inhibition of the startle magnitude and onset latency are independent processes
(Graham, 1975; Graham & Murray, 1977; Hoffman & Ison, 1980). Facilitation of the
startle reflex onset latency does not seem to support the protection of processing
hypothesis. Specifically, if prepulse protects the brain from sensory overload by
reducing the processing of a subsequent stimulus, then it would be expected that
presence of the prepulse would also delay the startle response rather than facilitate it.
Furthermore, some early studies hypothesised that onset latency facilitation may reflect
31

the excitation at the non-specific reticular system which was activated by the preceding
signal (prepulse; Pickenhain & Sakano, 1966), although there is no direct evidence to
support such hypothesis.
The effects of schizophrenia on the startle reflex onset latency have not been
investigated in most studies, which often focus on the startle reflex magnitude and PPI.
It has been proposed that the onset latency facilitation could be interpreted in terms of
detection of prepulses (for example, Braff et al., 1992). Therefore, the subgroups of
schizophrenia patients who can detect prepulses should show similar startle onset
latency as controls. However, the evidence for this hypothesis is inconsistent.
Specifically, the latency reduction by the prepulse was deficient at short lead-time
intervals in some studies of schizophrenia patients (Braff et al., 1978), but not in others
(Braff et al., 1992; Parwani et al., 2000). Similarly to PPI, PPF, and magnitude
habituation, medication of the patients may also contribute to such inconsistent results
regarding the onset latency, because unmedicated first-onset schizophrenia patients
showed the same onset latency facilitation at short lead-time intervals as healthy
controls [Ludewig, 2003a #1251].
In summary, it appears that facilitation of the startle reflex onset latency is an
independent process from PPI/PPF. The functional significance of latency shortening is
not well understood, but cannot be explained in terms of protection of processing
hypothesis. Furthermore, the facilitation of onset latency seems to be affected in
subgroups of schizophrenia patients, suggesting that such patients may have difficulties
with detection of sensory stimuli.
1.7.6 Summary of Startle Reflex Modification
The startle reflex can be thought of as a marker of brain function in living humans.
The magnitude and latency of the startle reflex are modulated by prepulses with the
former depending on the lead-time intervals separating the prepulse and the startle
32

stimuli. Patients with schizophrenia exhibit a reduction in PPI, which may be secondary
to attentional dysfunction in schizophrenia rather then represent a primary deficit in
sensorimotor gating. While the PPI reduction seems to be a robust feature of
schizophrenia, other aspects of startle reflex modification may be altered only in
subtypes of schizophrenia patients depending on their medication status. Specifically, it
appears that some patients show abnormal PPF and startle reflex habituation, which
may also reflect deficits in attention and memory in schizophrenia. Similarly, the onset
latencies of the startle reflex may be affected in schizophrenia implying that some
patients may have difficulties with detection and processing of sensory stimuli. Future
studies should focus on the functional significance of various aspects of the startle
reflex modification. These investigations may help to identify potential biological
markers for schizophrenia and related disorders.
1.8 Pharmacological Modulation of Prepulse Inhibition
Since the discovery of PPI reduction in schizophrenia many studies have shown that
PPI can be modulated in rats and healthy humans by factors implicated in the
development of schizophrenia. For instance, PPI can be reduced in adult rats following
social isolation during weaning (Geyer, Wilkinson, Humby, & Robbins, 1993; Powell &
Geyer, 2002) and stress induced by corticosteroid hormone administration during the
neonatal period (Reid-Milligan, 2002). Many studies also demonstrated that PPI can be
modulated by various pharmacological treatments.
1.8.1 PPI, Dopamine, and Other Neurotransmitters
In rats, depending on a dose and strain, PPI is reduced following an increase in
dopamine transmission by administering dopamine agonists (apomorphine,
amphetamine, quinpirole) either systemically or directly infusing them into the nucleus
accumbens, the major terminal field of the mesolimbic dopamine system (Campeau &
33

Davis, 1995; Davis et al., 1990; Mansbach, Geyer, & Braff, 1988; Martin-Iverson,
1999; Peng, Mansbach, Braff, & Geyer, 1990; Schwarzkopf, Mitra, & Bruno, 1992;
Swerdlow, Braff, Geyer, & Koob, 1986; Swerdlow, Braff, Masten, & Geyer, 1990a;
Swerdlow, Caine, & Geyer, 1992a; Swerdlow, Keith, Braff, & Geyer, 1991). The PPI
reduction is not always observed in healthy humans following treatment with dopamine
and dopamine agonists possibly due to lower doses administered to humans than to rats
for ethical reasons (Swerdlow et al., 2002a). Therefore, it is likely that only a major
disruption in the dopamine transmission achieved with large doses of dopamine agonists
can contribute to the reduction in PPI.
In rats, the PPI deficit induced by dopamine agonists can be blocked by dopamine
antagonists (Hoffman & Donovan, 1994; Swerdlow, Braff, Taaid, & Geyer, 1994;
Swerdlow et al., 1991; Varty & Higgins, 1995) and by depleting dopamine from the
mesolimbic dopamine system using neurotoxic lesions of dopamine neurons (Swerdlow
et al., 1990b). Similarly, antipsychotic drugs, acting as dopamine antagonists, reverse
apomorphine-, amphetamine-, and lesion-induced PPI deficits in rats (Le Pen &
Moreau, 2002; Mansbach et al., 1988; Rigdon & Viik, 1991). The effect of
antipsychotic drugs on PPI deficits in humans is controversial. In some studies PPI
deficits were not observed in patients treated with atypical neuroleptics compared to
patients treated with typical neuroleptics (Kumari et al., 2000; Kumari et al., 1999a;
Kumari, Soni, & Sharma, 2002a; Leumann, Feldon, Vollenweider, & Ludewig, 2002;
Oranje, Van Oel, Gispen-de Wied, Verbaten, & Kahn, 2002), but such effects were not
observed in other studies (Duncan et al., 2003a; Duncan et al., 2003b; Graham, Langley,
Bradshaw, & Szabadi, 2001; Mackeprang et al., 2002).
The reason for such contradictory findings could be that the effects of medication on
PPI depend on lead-time intervals, doses, and allocation of patients into groups (Kumari
& Sharma, 2002b). In some studies no differences in PPI (Weike et al., 2000) or a PPI
34

deficit in contrast to healthy controls (Perry, Feifel, Minassian, Bhattacharjie, & Braff,
2002) could be explained by the fact that the medicated patient groups consisted of
patients treated with typical or atypical neuroleptics and/or a combination of both.
Furthermore, it appears that different antipsychotic medications have variable effects on
PPI, because they target a range of neurotransmitters in addition to dopamine (Stahl,
1999) and depending on the drug they have different affinities, occupancies and
dissociation time-course at dopamine and other receptors (Seeman, 2002). Indeed, PPI
has been shown to be altered by acetylcholine (Koch et al., 1993), glutamate antagonists
(Swerdlow et al., 2001a), GABA (Japha & Koch, 1999), and serotonin (Rigdon &
Weatherspoon, 1992; Sipes & Geyer, 1994). In addition, the effects of antipsychotic
drugs on PPI may depend on acute versus chronic treatment with antipsychotics. For
instance, some studies found that phencyclidine (PCP)-induced PPI deficit in rats was
reversed following a sustained treatment with haloperidol (Martinez, Oostwegel, Geyer,
Ellison, & Swerdlow, 2000), but not following acute treatment with typical and atypical
neuroleptics (Keith, Mansbach, & Geyer, 1991; Wiley, 1994). Finally, most studies do
not control for treatment with other medications, commonly prescribed to patients with
schizophrenia, such as anxiolytics, antidepressants, and anticholinergic drugs, which
have been found to differentially modulate PPI in humans. For example, anxiolytic
drugs reduced startle amplitude, but had no effects on PPI in healthy humans
(Abduljawad, Langley, Bradshaw, & Szabadi, 2001), while antidepressants increased
PPI in depressed people (Martin-Iverson and Neumann, unpublished data). Similarly,
an anticholinergic drug, procyclidine, caused dose-dependent PPI impairment and
reduction in startle amplitude in healthy humans (Kumari et al., 2001b) and reduced PPI
in patients with schizophrenia concurrently treated with atypical neuroleptics (Kumari et
al., 2003).
35

Studies of the impact of antipsychotic drugs on PPI raise an important issue
regarding the nature of PPI deficit in schizophrenia. Namely, the studies suggest that
one aspect of PPI reduction in schizophrenia is reversible (‘state’-linked), while the fact
that PPI is also reduced in healthy family members and non-psychotic patients indicates
that PPI is also a ‘trait-like’ deficit, which could be thought of as a potential biologic
marker of schizophrenia and/or vulnerability marker to schizophrenia (Swerdlow et al.,
2000b). Such state and trait aspects of PPI deficits may respond differently to
antipsychotic medications due to potential differences in anatomical substrates which
control the two aspects of PPI deficit (Swerdlow et al., 2000b).
1.8.2 PPI and Substances of Abuse
PPI can also be modulated by substances of abuse, some of which presumably act by
altering the dopaminergic transmission in the brain (Di Chiara & Imperato, 1988).
Specifically, substances that act as indirect dopamine agonists, such as amphetamine, or
N-methyl-D-aspartate glutamate receptor antagonists, such as PCP, seem to reduce PPI
in healthy humans, rats, and monkeys (Hutchison & Swift, 1999; Kumari et al., 1998;
Linn & Javitt, 2001; Mansbach & Geyer, 1989). However, regardless of the evidence
that cannabis use interacts with dopamine transmission, the effects of cannabis on PPI
are inconclusive in animals and have not been investigated in humans to date.
Specifically, acute administration of cannabinoid agonists either increased PPI (Stanley-
Cary et al., 2002) or reduced PPI (Mansbach, Rovetti, Winston, & Lowe III, 1996;
Schneider & Koch, 2002) in rats. The chronic treatment of pubertal rats with
cannabinoid agonist also reduced PPI in adult rats (Schneider & Koch, 2003).
Furthermore, the adult offspring of pregnant rats treated with ∆9-THC exhibited no
differences in auditory startle reflex from controls (Hutchings et al., 1991). Finally, an
acute treatment with nonopioid analgetic related to cannabinoids (levonantradol)
impaired habituation of tactile startle reflex in rats (Geyer, 1981). These conflicting
36

results are likely to be due to differences between the studies in terms of species, doses,
agonists, lead-time intervals and stimulus parameters used. Furthermore, in case of
humans, the effects of cannabis use on PPI could be altered by interaction between
cannabis and either the other commonly used substances, such as nicotine, alcohol, and
caffeine on PPI or the interactions between these substances and attention (Hutchison,
Rohsenow, Monti, Palfai, & Swift, 1997).
In the case of alcohol, there is some evidence for cannabinoid-alcohol interaction
with PPI, such that dissolving a cannabinoid agonist, CP 55940, in an alcohol solution
reversed the effects of CP 55940 on PPI in rats (Stanley-Cary et al., 2002).
Furthermore, chronic administration of ethanol to mice showed a down-regulation of
CB1 receptors, that could potentially have an effect on PPI (Basavarajappa, Cooper, &
Hungund, 1998). The evidence also suggests that alcohol alone modulates PPI. In
general it appears that acutely ethanol reduces startle amplitude in rats and in humans
(Grillon, Sinha, Ameli, & O'Malley, 2000; Grillon, Sinha, & O'Malley, 1994;
Hutchison, McGeary, Wooden, Blumenthal, & Ito, 2003; Hutchison et al., 1997;
Wecker & Ison, 1984). Similarly, acute treatments with ethanol reduce PPI in rats and
in healthy humans (Grillon et al., 1994; Hutchison et al., 2003; Wecker & Ison, 1984),
and in offspring of alcoholics compared to the offspring of parents with no psychiatric
disorder (Grillon et al., 2000), however, the modulation of PPI was dependent on the
baseline PPI, doses, and type of alcohol used (Hutchison et al., 1997; Wecker & Ison,
1984).
Nicotine is another substance commonly co-used with cannabis (Degenhardt, Hall, &
Lynskey, 2001b). While the cannabis-nicotine interaction has not been investigated, the
acute and chronic treatment with nicotine increases startle amplitude and PPI in rats
depending on the dose and prepulse intensity (Acri, Grunberg, & Morse, 1991; Acri,
Morse, Popke, & Grunberg, 1994; Curzon, Kim, & Decker, 1994). In contrast, acute
37

treatment with nicotine had no effects on PPI in rats and chronic treatment with nicotine
reduced PPI in the same study (Mirza, Misra, & Bright, 2000). It is likely that the
results of the rat studies differ due to species used, prepulse intensity, and doses of
nicotine. In humans, nicotine gum normalised sensory gating (the P50 response during
the evoked potential recording) in relatives of schizophrenia patients (Adler, Hoffer,
Griffith, Waldo, & Freedman, 1992), acute subcutaneous nicotine increased PPI in
healthy males (Kumari, Cotter, Checkley, & Gray, 1997), and smoking a cigarette
before the session also increased PPI in patients with schizophrenia (Kumari, Soni, &
Sharma, 2001a). Similarly, smoking before or during the experimental session acutely
normalised the P50 response in schizophrenic patients (Adler, Hoffer, Wiser, &
Freedman, 1993) and increased PPI in healthy males following smoking deprivation
(Della Casa, Hofer, Weiner, & Feldon, 1998; Duncan et al., 2001; Kumari, Checkley, &
Gray, 1996). However, smoking two cigarettes with high nicotine content reduced PPI
in healthy humans in contrast to smoking two control cigarettes after overnight
deprivation (Hutchison, Niaura, & Swift, 2000). Finally, Kumari and colleagues
showed that healthy participants more dependent on nicotine had a lower PPI compared
to non-nicotine users (Kumari & Gray, 1999b). Therefore, the effects of nicotine on
PPI in humans may depend on nicotine content of the cigarettes, acute effects of use,
degree of dependence upon nicotine, and withdrawal stage vs. ad lib smoking.
Finally, caffeine, another popular substance of use, had no effects on PPI in rats
(Bakshi, Geyer, Taaid, & Swerdlow, 1995). In humans, caffeine delayed the
habituation of startle amplitude (Schicatano & Blumenthal, 1994, 1995) depending on a
dose and the chronicity of caffeine use, but had no effect on PPI. Caffeine had no effect
on startle magnitude, but depending on heaviness of use caffeine either reduced PPI in
the absence of withdrawal, or increased PPI during withdrawal (Swerdlow et al.,
38

2000a). Finally, caffeine abolished the increase in PPI when participants were asked to
attend to auditory stimuli (Flaten & Elden, 1999).
1.8.3 Summary of Pharmacological Modulation of PPI
In summary, PPI seems to be differentially modulated by various neurotransmitters,
medications, and substances of abuse. In non-human animals, dopamine and dopamine
agonists seem to reduce PPI, while some antipsychotic medications seem to reverse
these effects. The effects of substances of abuse on PPI are less conclusive, particularly
in terms of cannabis. It could be the case that cannabis effects on PPI in humans could
be altered due to interaction with other substances of abuse and attention. Therefore, an
investigation of the effects of cannabis use on PPI in humans should control for other
substance use and for the effects of cannabis use on attention.
1.9 Summary of Aims of the Current Study
The detailed aims and hypotheses of the current study will be presented in each
chapter of this thesis. In general, the main aim of the current study was to investigate
the association between chronic cannabis use and attention-modulated prepulse
inhibition of the startle reflex in healthy controls and patients with schizophrenia. No
studies to date have reported the effects of cannabinoids on PPI in humans. Such a
study is necessary to reveal whether the use of cannabis in humans has a similar or a
different effect on PPI than in patients with schizophrenia. Thus, the results could be
used to provide more evidence for the comorbidity between cannabis use and
schizophrenia. The results for this study are reported in Chapter 4.
In order to overcome the issue of administering cannabis to humans the participants
recruited for the current study were self-reported, voluntary cannabis users. Therefore,
before assessing the effects of cannabis use on PPI, it was necessary to investigate the
accuracy of such self-reports of substance use to remove a possible confounding factor.
39

The accuracy was assessed in terms of the most recent use (last 24 hours) and the past
substance use (lifetime and last 12 months). This investigation is reported in Chapter 2.
Furthermore, another side issue investigated in the current study was the validity of
Substance Use Module on a diagnostic interview (Composite International Diagnostic
Interview, version CIDI-Auto 2.1) used as a screening tool for mental illness and
substance use disorders in non-schizophrenic (healthy control) participants. The
psychometric properties of this module using the CIDI-Auto 2.1 version of the
interview have not been established to date. Thus another aim of the current study was
to investigate the concurrent validity between cannabis misuse diagnoses (abuse and/or
dependence) generated by CIDI-Auto 2.1 and cannabis dependence diagnoses provided
by a psychological scale, Severity of Dependence Scale (SDS). The results of this
investigation are reported in Chapter 3.
Following the completion of the study reported in Chapter 4 it became necessary to
investigate a potential confound identified during the data analysis. Therefore, Chapter
5 contains the results of a pilot study carried out to investigate the potential impact of
the response component of the task used to divert attention during the Ignore Task on
attentional modulation of the startle reflex.
Finally, a number of cannabis users reported lifetime symptoms of mental illness,
particularly depression. Thus, Chapter 6 focuses on the relationship between cannabis
dependence and mental illness other than schizophrenia.
40

CHAPTER 2. CONSISTENCY OF SELF-REPORTS
REGARDING SUBSTANCE USE IN VOLUNTEERS FOR
RESEARCH UNRELATED TO TREATMENT FOR
SUBSTANCE USE
2.1 Preface
The first aim of the present study was to establish whether the information regarding
substance use provided by the participants was accurate. Other studies have found that
cannabis users and schizophrenia patients, who were included in the current study, often
under-report their substance use. The accurate reporting of cannabis use was crucial for
investigation of the primary aim of this study, which was to examine the effects of self-
reported cannabis use on prepulse inhibition of the startle reflex. Therefore,
misreporting of cannabis use could have influenced the interpretation of the startle
reflex data.
2.2 Abstract
The validity of self-reports of substance use is often questionable, particularly in
drug-treatment settings. However, the validity of self-reports of substance use by
volunteers for research where the self-report has no obvious consequences for the
participant is not well known. This study investigated self-reports in 70 volunteers for
research unrelated to substance use treatment. The participants were recruited from
general community and included patients with schizophrenia and regular cannabis users.
The self-reports of recent use (last 24 hours) were verified with urine screens. The self-
reports of past use (lifetime and last 12 months) were investigated using correlations
among measures of dependence, frequency and amount of use, and total duration. Self-
reports of recent use were consistent with the urine screens, as shown by Cohen’s kappa
41

of 0.90. The relationships among the measures of past substance use were in directions
indicating consistency; however some of the correlations were non-significant, or
significant correlations indicated only moderate shared variance, suggesting that the
self-reports of past substance use were less consistent than the self-reports of recent
substance use. In conclusion, participants for research unrelated to substance use
treatment, including patients with schizophrenia and regular cannabis users, can report
their most recent substance use very accurately, and also provide information regarding
their past use that, while being more inconsistent than information on recent use, has
low rates of inconsistency.
2.3 Introduction
Substance use is an important factor to consider in research, as the use of
substancesby research participants may affect the measures used in many studies. The
most common method of assessing substance use is a verbal self-report. This technique,
however, has been often criticised in terms of its low psychometric properties,
especially low validity (Maisto, McKay, & Connors, 1990). Validity refers to the extent
to which the instrument measures what it is intended to measure (Carmines & Zeller,
1979). There are various types of validity that can be assessed (Dawe, Loxton, Hides,
Kavanagh, & Mattick, 2002), including:
1. content validity- a measure of all aspects of a condition which is supposed to be
measured,
2. construct validity- a measure of only the aspects of the condition the instrument was
designed to measure
• convergent validity is established by correlating the measure with other tests or
methods measuring the same construct
• discriminant validity is established by correlating the measure with methods
measuring other unrelated constructs
42

3. criterion validity- the extend to which the instrument corresponds to another
accurate measure of the condition.
• concurrent validity, refers to the relationship between scores on an instrument and
another measure of the same construct or a diagnosis at the same time
• predictive validity is the extend to which individual’s current scores accurately
predict that individual’s future scores.
Self-reports of substance use are often assessed in terms of construct (convergent)
validity by confirming the information provided by the participants with biochemical
tests, such as urine drug screens or hair analysis.
There are a number of reasons why the self-reports of substance use may have a low
validity. Firstly, self-reports are often assessed in participants involved in treatment
programs for substance misuse. Such participants usually under-report their drug use in
attempt to remain in treatment, or sometimes over-report their use in order to be
admitted into a program in the first place (Digiusto, Seres, Bibby, & Batey, 1996;
Sherman & Bigelow, 1992). These factors may, however, not apply to research
volunteers not seeking drug-treatment who have no obvious reason for under- or over-
reporting their substance use. In fact, even the participants in drug-treatment programs
can reliably report their substance use if assured of confidentiality and lack of impact on
their treatment (Martin, Wilkinson, & Kapur, 1988).
Secondly, most studies do not distinguish between the validity of self-reports
regarding the recent and the lifetime (past) use of substances. While self-reports of
recent substance use can be validated with urine screens, single pharmacological tests
are not sensitive enough to detect the presence or absence of past substance use (Maisto
et al., 1990; Schwartz, 1988). Multiple-sample drug screens would be necessary to
provide an external validation of self-reports of past use or lifetime use of drugs.
However, such screens are not practical or ethical in their level of intervention for most
43

experiments. Detection of substances of abuse could also be conducted using a
radioimmunoassay of hair (Swartz, Swanson, & Hannon, 2003). While this technique is
a promising alternative to a urine analysis it is also limited in terms of a detection
window of approximately three months for most substances of abuse (Swartz et al.,
2003). Therefore, in order to validate the past substance use extending beyond the last
three months, non-pharmacological techniques need to be employed. Such techniques
include interviews with external informants (partners, family, friends, physicians) and
by obtaining a range of measures of past substance use from the participants themselves.
While confirming self-reports with other self-reports cannot determine accuracy,
sometimes such technique may be the only available option due to ethical and legal
constraints of obtaining information about the participant from third parties, in
particular if this information concerns an illegal activity. The validity of self-reports of
past substance use may be improved by using multiple self-reports regarding substances
being commonly co-used, such as cannabis, nicotine, alcohol, and caffeine (Degenhardt
& Hall, 2001c; Jablensky et al., 1999; Regier et al., 1990). The multiple self-reports
regarding these substances could include questionnaires investigating lifetime
dependence, frequency, amount, and total duration of use. The scores on such
questionnaires would be expected to highly correlate with each other for the above
substances if the self-reports of past substance use were valid. Such assessment would
provide information about criterion (concurrent) validity of self-reports. However, high
correlations cannot guarantee accuracy of self-reports, because the participants may
consistently under/over-report their use of substances on all questionnaires. Therefore,
such method of validation allows for estimation of minimum inaccuracy of self-reports
reflected by lack of agreement on such questionnaires.
The aim of the present study was to assess the validity of self-reported substance use
in volunteers for this non-drug treatment related study, including healthy controls,
44

regular cannabis users and patients with schizophrenia. Verbal self-reports of the most
recent use (last 24 hours) were validated against urine drug screens. Verbal and written
self-reports of past substance use (lifetime and last 12 months) were validated against
each other by using correlations among scores on various questionnaires regarding
lifetime dependence, frequency, amount, and total duration of use of cannabis, nicotine,
and alcohol. The study was designed to test the following hypotheses. Firstly, self-
reports of recent substance use should be valid in this sample of research volunteers,
since there are no established constraints dependent on reported drug use, as may occur
in drug-treatment programs. Therefore, the self-reported recency of substance use
should strongly agree with the results of urine drug screens. Secondly, it is
hypothesised that reports of past substance use would be largely valid, but less so than
reports of recent use. It is thought that reports of substance use would demonstrate
agreement because there are no explicit constraints against such reporting. However,
the validity is expected to be less than for recent reports because of two main reasons:
relatively poor memory for distant events and the lack of a known (by the author)
objective test of past substance use. Due to the lack of such test there is no clear
method of judging the true accuracy of past reports. There may be systematic error that
occurs in all reports; such error cannot be determined in the present study. However,
there may be unsystematic error; such error would be evident by inconsistencies among
reports that assess the same behaviours. Thus, it is hypothesised that the minimum
inaccuracy in self-reports of past substance use would be revealed by lack of significant
correlations among different self-reported measures of past substance use. Specifically,
it is expected that to the extent that there is unsystematic error in past reports of
substance use, the scores on lifetime dependence questionnaires for cannabis, nicotine,
and alcohol would not be positively correlated with the amount of use reported for each
substance, respectively. Similarly, the total duration of cannabis and nicotine use would
45

not be positively correlated with the lifetime dependence scores for cannabis and
nicotine, respectively. Furthermore, the two measures of lifetime alcohol dependence
would not be correlated with each other. In case any of the correlations were
significant, the minimum inaccuracy in self-reports of past substance use would be
revealed by low level of shared variance; that is, correlation coefficients lower than the
ones reported in other studies. Finally, dependence on some substances, such as
cannabis, may manifest itself by increased amount and also frequency of use (American
Psychiatric Association, 1994; Solowij, 1998). Therefore, it is expected that if the self-
reports were inaccurate then the more frequent cannabis users in the last 12 months
(daily users) would not report higher lifetime cannabis dependence than less frequent
users (monthly or less users).
2.4 Methods
2.4.1 Participants and Procedures
This study was approved by the Human Research Ethics Committee at the University
of Western Australia and Graylands Hospital in Perth. Approximately 170 participants
from the general community of Perth and patients at a major psychiatric hospital in
Western Australia (Graylands Hospital) responded to advertisements calling for study
participants. The healthy controls and healthy cannabis users were recruited using
advertisement at Red Cross blood donation clinics in Perth (Appendix A.1), local press
(“West Australian”; Appendix A.2), and radio interview about the present study. The
inpatients at Graylands Hospital were initially contacted by a research nurse (Mr Daniel
Rock) at Graylands Hospital and screened using a Checklist for Patient Recruitment
(Appendix A.3). All prospective participants were screened over the telephone or in
person for presence or absence of hearing disorders, neurological disorders and/or loss
of consciousness for over 15 min, current diagnosis and/or treatment for mental illness
46

for all non-patients, current or past treatment for substance-use disorders, schizophrenia
in a first-degree relative (parent, sibling) for all non-patients, and highest level of formal
education (high-school only or no more than four years of post-high school education).
Following signing a written informed consent form (Appendix A.4 and A.5), 70
volunteers, who did not meet any of the above exclusionary criteria, participated in this
study as part of a project investigating the effects of cannabis use on the startle reflex.
The participants were 51 non-schizophrenic controls and 19 patients with schizophrenia.
A lack of diagnosis of schizophrenia in controls was established using a self-
administered version of the Composite International Diagnostic Interview, CIDI-Auto
2.1 (World Health Organization, 1997b). The diagnoses generated by CIDI-Auto 2.1
are based on the standard DSM-IV and ICD-10 criteria (American Psychiatric
Association, 1994; World Health Organization, 1992). The psychometric properties of
the CIDI have been tested in a number of countries and the interviewer-administered
CIDI has acceptable test-retest and inter-rater reliabilities (for review see Wittchen,
1994). Similarly, the agreement between the CIDI and CIDI-Auto is acceptable to
excellent ranging between 0.43 to 0.92 for DSM-III-R and ICD-10 diagnoses (Peters,
Clark, & Carroll, 1998). The psychometric properties of the CIDI-Auto 2.1 are still
being investigated (Andrews & Peters, 2003), however the reliability of CIDI-Auto 1.1
and a draft version of CIDI-Auto 2.1 were excellent for most items (Andrews & Peters,
1998, 2003). The validity of the CIDI-Auto 2.1 is more difficult to assess due to
problems with establishment of a valid ‘gold standard’ against which the validity of an
instrument can be tested (Spitzer, 1983). It appears that the CIDI-Auto underestimates
schizophrenic diagnoses in contrast to clinicians in acute psychiatric patients (Cooper,
Peters, & Andrews, 1998). For this reason the CIDI was not used to confirm a
diagnosis of schizophrenia in psychiatric patients in the current study. In contrast, the
CIDI overestimates anxiety and depression diagnoses in patients treated for anxiety
47

disorders (Peters & Andrews, 1995) and overdiagnoses psychotic disorders in the
general population (Kendler, Gallagher, Abelson, & Kessler, 1996). Therefore, it
appears that the CIDI may have a low threshold for judging some symptoms in the
general population (Kendler et al., 1996). Thus, it has been suggested that the
psychiatric diagnoses on the CIDI should be confirmed with other sources of
information to improve the validity of the CIDI (Dawe et al., 2002). Due to strict
confidentiality and time restrictions the CIDI diagnoses of participants from the general
population in the current study could not be confirmed with any other diagnoses.
However, the use of the CIDI in the current study provided a conservative screening
tool for mental illness to assure that the participants in the ‘healthy control’ groups were
indeed free from mental illnesses other than substance misuse disorders (abuse and/or
dependence) among the substance users. The issue of validity of substance misuse
diagnoses on CIDI-Auto 2.1 will be addressed in more detail in Chapter 3.
A lifetime diagnosis of schizophrenia was obtained from patient’s case notes and
confirmed during the Diagnostic Interview for Psychoses- Diagnostic Module (DIP-
DM) with the author trained in the use of this instrument. DIP-DM is a structured
clinical interview, which was developed for the National Mental Health Survey on Low
Prevalence (Psychotic) Disorders Study conducted in Australia in 1997 – 1998
(Jablensky et al., 1999). The instrument generates lifetime diagnoses of affective and
psychotic symptoms according to ICD-10 and DSM-III-R diagnostic criteria. DIP-DM
has a high inter-rater reliability with a kappa of 0.73 for ICD-10 diagnoses (Jablensky et
al., 2000). The items in DIP-DM were selected from two instruments with well-
established psychometric properties, including the Schedules for Clinical Assessment in
Neuropsychiatry, SCAN (Wing et al., 1990) and the Operational Criteria Checklist for
Psychotic Illness, OPCRIT (McGuffin, Farmer, & Harvey, 1991). The diagnosis of
schizophrenia was not confirmed in one patient, the data from whom were subsequently
48

excluded from all analyses. Due to temporary problems with a computer containing the
CIDI-Auto 2.1 software (hardware crash) one cannabis-control also completed DIP-
DM.
All participants were told prior to their appointment that they would be required to
provide a detailed report of their substance use and a urine sample for a drug screen.
They were also assured of confidentiality and lack of implications on their treatment in
case of patients with schizophrenia. All participants were reimbursed at A$20 for their
participation in the project.
2.4.2 Recent Substance Use
The accuracy of self-reports of recent substance use was verified by urine drug
screen. A single urine sample was collected from each participant within the first two
hours of the beginning of the testing session. The recency of use was defined as the
time (in hours) of last use within 24 hours since the beginning of the testing session.
All participants were asked the following questions:
1. Have you ever used alcohol, nicotine, cannabis?
2. When was the last time you have used any of these substances?
3. Have you ever used any other substances, such as amphetamine, cocaine,
benzodiazepines, and opiates?
4. When was the last time you have used any of these substances?
The urine samples were tested at a pathology laboratory (PathCentre) at Sir Charles
Gairdner Hospital, in Perth, blind to the purpose of the study. Each urine sample was
analysed using a cloned-enzyme-donor-immunoassay, CEDIA (Microgenics, USA;
Armbruster, Hubster, Kaufman, & Ramon, 1995) for the presence of alcohol (ethanol;
0.04 % cut-off), opiates (morphine, codeine; 300 µg/L), amphetamines (various
metabolites including methamphetamine and amphetamine; 300 µg/L), benzodiazepines
(various metabolites including diazepam; 200 µg/L), cannabinoids
49

(carboxytetrahydrocarboxylic acid; 50 µg/L), and cocaine (benzoylecgonine; 300 µg/L).
As detection time for different substances in urine varies due to a range of factors (see
subsection 2.6.1), 24 hours was the detection time for all tested substances except
alcohol (10 hours). In addition, urine samples of the first 48 participants were screened
using a gas chromatography - mass spectrometry technique, GCMS (Lisi, Kazlauskas,
& Trout, 1993), for a presence of metabolite of nicotine, cotinine (20 µg/L). Finally,
the first 24 urine samples positive for cannabinoids were re-analysed using GCMS
technique to provide a quantitative measure of ∆9-THC metabolite
(carboxytetrahydrocannabinol, in µg/L). A urine sample of one patient was too diluted
to detect substances according to the Australian standard (urine creatinine level below
1.8 mmol/L). Therefore, the final analyses were performed on the data for 68
participants (51 controls and 18 patients with schizophrenia).
2.4.3 Past Substance Use
The history of substance use was determined from verbal and written self-reports,
and included information on lifetime, last 12-month and last 24-hour use. Firstly, the
participants verbally reported whether they have ever used nicotine, alcohol and
cannabis. In case of any affirmative answers, the participants reported the usual
frequency and amount of use within 12 months since the testing session and the recency
of use (in hours) of any of the above substances within 24 hours since the testing
session if applicable. In addition, participants also reported the total duration of
nicotine and cannabis use, in years. The participants who affirmatively reported a
lifetime use of cannabis, nicotine or alcohol were subsequently asked to fill out pen-
and-paper questionnaires regarding severity of lifetime dependence on these three
substances.
The lifetime severity of cannabis dependence was established using the Severity of
Dependence Scale, SDS (Appendix B.1; Gossop et al., 1995). SDS is a five-item
50

questionnaire about participant’s ability to control their cannabis use and each answer is
rated on a scale from 0 to 4. The total SDS score of zero indicates no dependence and
the total score of 15 indicates maximum dependence (Gossop et al., 1995). SDS was
developed for research purposes and it focuses on the psychological aspects of
dependence, such as control over cannabis use, anxiety about use, and difficulty
stopping (Gossop et al., 1995). SDS was also designed to measure dependence upon
substances which do not have a clearly defined withdrawal syndrome, such as cannabis
(Gossop et al., 1995). The psychometric properties of SDS include moderate to high
internal consistency (0.72 – 0.90; Gossop et al., 1995; Swift, Hall, Didcott, & Reilly,
1998a) and high test-retest reliability of 0.89 (Gossop, Best, Marsden, & Strang, 1997),
and high inter-rater reliability with intraclass correlation coefficient of 0.74 in cannabis
users (Ferri, Marsden, de Araujo, Laranjeira, & Gossop, 2000). SDS scores also
correlate with behavioural patterns of drug taking, such as dose, frequency and duration
of use (Ferri et al., 2000; Gossop et al., 1995), confirming construct validity of the
instrument. Similarly, SDS shows criterion validity in that substance users seeking
treatment for their use had higher SDS scores than non-treatment samples (Gossop et
al., 1995) and participants who overdosed on heroin had significantly higher SDS scores
than those who have not overdosed, indicating higher levels of heroin dependence
(Darke, Ross, & Hall, 1996). SDS scores for cannabis use have a high concurrent
validity with DSM-IV criteria for cannabis dependence with Pearson’s r = 0.77 (Ferri et
al., 2000). A more detailed discussion of the psychometric properties of SDS is
included in Chapter 3.
The lifetime severity of nicotine dependence was established using the Fagerstrom
Test for Nicotine Dependence, FTND (Appendix B.2; Heatherton, Kozlowski, Frecker,
& Fagerstrom, 1991). FTND contains six questions regarding smoking habits and each
answer is rated on a scale from 0 to 3. An overall FTND score of zero indicates no
51

dependence and the total score of 10 indicates maximum dependence. The instrument
has an acceptable level of internal consistency with Cronbach’s alpha of 0.61 – 0.70
(Etter, Duc, & Perneger, 1999; Heatherton et al., 1991; Pomerleau, Carton, Lutzke,
Flessland, & Pomerleau, 1994) and a high test-retest reliability of 0.88 (Heatherton et
al., 1991). FTND is also associated with smoking cessation and is a valid measure of
heaviness of smoking confirmed by biochemical tests (Kozlowski, Porter, Orleans,
Pope, & Heatherton, 1994).
The lifetime severity of alcohol dependence was established using two instruments,
the Short Michigan Alcoholism Screening Test, SMAST (Appendix B.3; Selzer,
Vinokur, & van Rooijen, 1975), and the CAGE (C- cutting down, A- annoyance, G-
guilt, E- eye opener) questionnaire (Appendix B.4; Ewing, 1984). Both instruments
contain questions regarding alcohol-drinking habits and each alcohol misuse-indicating
responses are given one point. The range of scores on SMAST and CAGE is 0 – 13 and
0 – 4 respectively, indicating minimum to maximum alcohol dependence. The
psychometric properties of SMAST include moderate to good internal consistency with
Cronbach’s alpha of 0.62 – 0.90 (Barry & Fleming, 1993; Fleming & Barry, 1991;
Zung, 1984). The criterion validity of SMAST is high with a correlation of 0.83 – 0.94
between the SMAST scores and criterion groups of alcoholics versus non-alcoholics
(Selzer et al., 1975). In the same study, SMAST was found to highly correlate with the
original reliable and valid version of the instrument (Michigan Alcoholism Screening
Test, MAST) with r of 0.90 – 0.97 (Selzer et al., 1975). Similarly to SMAST, CAGE
has a good internal consistency with Cronbach’s alpha of 0.71 (Mischke & Venneri,
1987), and 44 – 82% consistency between scores obtained seven years apart in a large
population survey (Green & Whichelow, 1994). The instrument also has a good
concurrent validity with DSM-III-R criteria for alcohol dependence (Beresford, Blow,
Hill, Singer, & Lucey, 1990).
52

Finally, the Opiate Treatment Index questionnaire, OTI, adapted for cannabis use
(Appendix B.5; Darke, Ward, Hall, Heather, & Wodak, 1991), was used to establish the
heaviness of cannabis consumption in terms of amount and frequency of use in four
weeks prior to the testing session (Darke et al., 1991). This instrument consists of five
questions regarding the three most recent occasions of cannabis use. The average recent
consumption of cannabis (Q score) was calculated as the amount (equivalent to the
number of joints) on the last two occasions divided by the interval (number of days)
between the last two occasions of use within four weeks since the testing session. The
Q score of 0 indicates abstinence over the past four weeks and the higher the Q score
the heavier the use of cannabis in the last four weeks. The psychometric properties of
the instrument include high test-retest reliability between the same and different
interviewers (0.77 – 0.86) and moderate - high internal consistency in opioid users with
Cronbach’s alpha of 0.34 – 0.93 (Adelekan, Green, Dasgupta, Tallack, & et al, 1996;
Darke, Hall, Wodak, Heather, & Ward, 1992; Deering & Sellman, 1996). The
concurrent validity of the instrument was demonstrated by significant correlations
between each section of OTI, including the Drug Use Section used in the current study,
and the subscales of the Addiction Severity Index, ASI, in opiate users (Darke et al.,
1992).
Participants who were lifetime non-users of a particular substance were not required
to fill out a dependence questionnaire regarding that substance and were assigned a
score of zero on the questionnaire indicating lack of dependence. In addition, any
questions on SDS, FTND, SMAST, and CAGE related to the current use were repeated
using “have you ever” phrase to assess the lifetime dependence on cannabis, nicotine,
and alcohol.
53

2.4.4 Statistical Analysis
Recent substance use. The overall agreement between self-reports and results of
urine drug screens for all substances was estimated using Cohen’s kappa in Excel-PC 97
(Cohen, 1960). Kappa was also established for nicotine and cannabis, but not for other
individual substances due to asymmetrical prevalence of scores which can affect the
value of kappa (Feinstein & Cicchetti, 1990). The kappa was interpreted as poor < 0.40,
fair to good = 0.40 – 0.75, and excellent > 0.75 (Donker, Hasman, & Van Geijn, 1993).
Past substance use. All data regarding the past substance use were assessed for
meeting assumptions underlying the use of parametric bivariate Pearson’s Product
Moment Correlations, namely: normality, linearity, and homoscedasticity (Tabachnick
& Fidell, 2001), using SPSS-PC 11.0. The assessments were done according to
guidelines provided by Tabachnick and Fidell (2001). Firstly, normality was assessed
statistically using the Kolmogorov-Smirnov test for goodness of fit and graphically,
using histograms. The visual inspection of histograms is highly subjective and thus
SPSS-PC 11.0 was used to calculate the measures of symmetry of distribution
(skewness) and peakedness of distribution (kurtosis). Both of these measures should be
equal to zero if the distribution of scores for each variable is normal (Tabachnick &
Fidell, 2001). Furthermore, box-plots were used to identify outliers. Secondly,
linearity and homoscedasticity between two variables were assessed roughly by visual
inspection of scatter-plots. The homoscedasticity assumption states that the variability
in scores for one continuous variable should be the same at all scores for another
continuous variable. This assumption is related to normality because relationships
between normally distributed variables are homoscedastic (Tabachnick & Fidell, 2001).
The preliminary analyses described above revealed that all data violated at least one
of the above assumptions. Therefore, the non-parametric equivalent to bivariate
Pearson’s Product Moment Correlations, bivariate Spearman’s Rank Order correlations
54

(one-tailed, p < 0.05), were used to explore relationships among the data with SPSS-PC
11.0. The non-parametric correlations were appropriate for use in this study for two
reasons, in addition to violation of assumptions for parametric correlations. Firstly, the
Spearman’s correlation coefficient rho is equivalent to Pearson’s correlation coefficient
r performed on ranks of data instead of the actual data points. Thus, the non-parametric
procedure eliminates biasing of the results by data containing apparent outliers. In the
current study, some outliers were identified due to the fact that the sample contained
light users/non-users of substances with low scores on all substance-related
questionnaires (such as FTND = 0, cigarettes/day = 1) and heavy users with higher
scores. The outliers were: 1/68 SDS score, 5/68 Q scores, 2/68 cigarettes/day scores,
1/68 total duration of nicotine use score, 5/68 SMAST scores, 6/68 CAGE scores, and
4/68 drinks/week scores. Other than the relevant score, there were no characteristics
that distinguished the outliers from the rest of the sample, and, thus, these scores were
retained for the final analyses. Secondly, a statistical method with reduced power, such
as a non-parametric correlation, reduces the rate of Type I errors and inflates the rate of
Type II errors (Type II error rate = 1 – power). Therefore, such analysis would be
biased towards increasing the minimum rates of inaccuracy among the self-reports of
past substance use, providing a conservative test of the hypothesis.
Similarly, due to lack of normality among the SDS scores, the non-parametric
equivalent of a t-test, Mann-Whitney U-test (one-tailed, p < 0.05), was used to compare
SDS scores in daily and monthly-or-less cannabis users.
2.5 Results
2.5.1 Participant Characteristics
Of the 68 participants, 57 were male. All participants had a mean age (± SD) of 33 ±
9 years (range: 18 – 56), a mean length of education (± SD) of 12 ± 2 years (range: 7 –
55

17), and a mean IQ (± SD) of 103 ± 10 (range: 79 – 118) estimated using the National
Adult Reading Test, NART (Nelson & Willison, 1991).
2.5.2 Recent Substance Use and Urine Drug Screens
The first aim of this study was to investigate agreement between self-reports of
recent substance use (within last 24 hours) and results of urine drug screens. The
overall agreement between all self-reports and all urine drug screens was excellent, with
Cohen’s kappa = 0.90. All self-reports were classified as 53 true-positives, 394 true-
negatives, one false-positive, and nine false-negatives (Table 2.1). In general, the self-
reports were consistent with the results of the urine screens for all participants,
including patients with schizophrenia and regular cannabis users.
Table 2.1 Agreement between self-reports of substance use in the last 24 hours and results of urine drug screens
Self-reported substance use (24 hours)
Yes
No
Urine screen Positive Negative
53 1
9 394
Note. The table represents a total number of self-reports provided by 68 participants regarding their use or lack of use of alcohol in the last 10 hours and all other substances (nicotine, cannabis, amphetamine, cocaine, benzodiazepines, and opiates) in the last 24 hours. There were 48 reports of nicotine use and 68 reports for all other substances.
Table 2.2 shows the rates of agreement and disagreement reported in Table 2.1 for
each individual substance. The Cohen’s kappa coefficients were determined only for
nicotine and cannabis, as the other substances had low and asymmetrical prevalence in
this sample (Table 2.2). In case of nicotine, there was a good agreement between self-
reports of recent use and results of urine screens for cotinine with kappa = 0.83. An
excellent agreement was also observed between self-reports of recent cannabis use and
detection of cannabinoids in urine with kappa = 1.00.
56

Table 2.2 Agreement between self-reports of substance use in the last 24 hours and results of urine drug screens for all individual substances
Self-report of last 24 hour use (yes/no) vs urine screen (+/-)
Substance
True-positive yes/ +
False-positive yes/ –
True-negative no/ –
False-negative no/ +
nicotine alcohol cannabis amphetamine cocaine benzodiazepine opiate ephedrine Total
22
26 1
2 2
53
1a
1
22 68 42 66 68 65 63
394
3b
1c
1d
3e
1f
9
Note. The numbers represent self-reports of recent substance use (last 10 hours for alcohol and last 24 hours for all other substances) verified by urine drug screens. Each row represents the total number of self-reports for each substance. There were 48 reports of nicotine use and 68 reports for all other substances. aOne cannabis-using control (self-reported nicotine use with cannabis 13 hr prior to the testing session) bThree cannabis-using controls (two self-reported nicotine use 48 hr and one month prior to the testing session respectively and were both positive for cannabinoids, one lack of self-report and negative for cannabinoids) cOne cannabis-control (self-reported Ecstacy use 4 days prior to the testing session) dOne cannabis-control (self-reported Valium use within a few days prior to the testing session) eTwo controls and one patient (lack of self-reports, however all had colds during the testing session rising a possibility that they all have used anti-cold medications, such as Panadol, which contains opiates; one control reported a past abuse of codeine) fOne cannabis-using control tested positive for an additional metabolite- ephedrine (lack of self-report).
In addition, all 24 samples positive for cannabinoids were confirmed as positive with
the GCMS technique, which also provided a urine concentration of cannabinoid
metabolites, in micrograms per litre. This concentration of cannabinoid metabolites was
significantly correlated with the recency of cannabis use in the last 24 hours (Figure
2.1); rho = -0.48, n = 24, p = 0.01 (one-tailed). Thus, the more recent the reported use
of cannabis, the higher the concentration of cannabinoid metabolites in urine.
57

30
35
40
45
50
55
60
65
70
75
80
0 5 10 15 20 25 30
Ranked recency of ca nna bis use in last 24 ho urs (hr)
Ran
ked
urin
e ca
nnab
inoi
ds (µ
g/L)
Figure 2.1 Relationship between ranked self-reported recency of cannabis use within 24 hours since the testing session and ranked concentration of cannabinoid metabolites in urine.
In terms of alcohol, amphetamine, cocaine, and benzodiazepines the sample size was
adequate to determine that the rate of false-positives for each of these substances was
zero. However, the rates of false-negatives could not be established in this sample due
to low prevalence of use of these substances. In case of opiates, two true-positives, 63
true-negatives, zero false-positives, and three false-negatives were observed. However,
due to low numbers of true-positives, the rate of false-negatives may not be accurately
determined in this sample. Finally, a positive test for ephedrine was reported in one
participant; however the use of this substance was not investigated by self-reports. It
should be noted that ephedrine is a common component of non-prescription medicines.
2.5.3 Past Substance Use and Dependence Questionnaires
The second aim of this study was to investigate the accuracy of self-reported
substance use extending beyond detection of a substance by urine screen. The lifetime
and last 12-month history of substance use was obtained from written questionnaires.
58

Various relationships among scores on these questionnaires were investigated to
examine the accuracy of self-reports of past substance use (Table 2.3).
Table 2.3 Correlations among lifetime dependence, amount and frequency in the last 12 months, and lifetime duration of use of cannabis, nicotine, and alcohol
Variables tested
Spearman correlation coefficient rho
Sample size
One-tailed probability
Cannabis SDSa vs. Qb
SDS vs. total duration of use (yrs)
0.59 0.49
68 68
< 0.0005** < 0.0005**
Nicotine FTNDa vs. cigarettes/dayc
FTND vs. total duration of use (yrs)
0.51 0.56
68 68
< 0.0005** < 0.0005**
Alcohol SMASTa vs. CAGEa
SMAST vs. drinks/weekc,d
CAGE vs. drinks/weekc,d
0.63 0.15 0.16
68 68 68
< 0.0005**
0.107 0.098
Note. Abbreviations: CAGE- alcohol dependence questionnaire, FTND- Fagerstrom Test for Nicotine Dependence, Q- Opiate Treatment Index Quotient, SDS- Severity of Dependence Scale, SMAST- Short Michigan Alcoholism Screening Test, yrs- years. alifetime dependence measures. bindex of cannabis use in the last four weeks. cuse in the last 12 months. dstandard alcoholic drink. **p < 0.0005
The data presented in Table 2.3 indicate that the self-reports of past cannabis and
nicotine use were accurate, similarly to the self-reports of recent use of these two
substances. This is evident by presence of significant correlations in consistent
directions and with correlation coefficients similar to the ones reported in other studies
(refer to subsection 2.6.2). Furthermore, the lifetime dependence on cannabis was
reported consistently between the more and less frequent cannabis users. Specifically,
lifetime cannabis dependence was significantly higher among the daily (mean rank =
15.8, n = 20) than the monthly-or-less cannabis users in the last 12 months (mean rank =
8.8, n = 7; U = 33.5, z = -2.0, p = 0.042). In contrast, the self-reports of past alcohol use
were less accurate with non-significant correlations between lifetime alcohol
dependence and the amount/frequency of use in the last 12 months.
59

2.6 Discussion
2.6.1 Consistency of Self-Reports of Recent Substance Use
The results of this study indicate that participants for a non-drug treatment related
study, including regular cannabis users and patients with schizophrenia, accurately
report their most recent substance use. This conclusion is supported by a high overall
agreement between the self-reported recent use of nicotine, alcohol, cannabis,
amphetamine, cocaine, benzodiazepines, and opiates, and the results of urine screens for
these substances. The high consistency of self-reports and urine screens in this study
could have resulted from a number of factors. Firstly, the participants were informed
about the urine screen prior to the testing session. Indeed, compared to self-report
alone, collection of a biological sample, even without an actual laboratory assay –
known as a bogus-pipeline technique – was found to improve the accuracy of self-
reports regarding cigarette smoking (Aguinis, Pierce, & Quigley, 1993). However,
bogus-pipeline technique does not seem to improve the validity of self-reported use of
other substances, such as alcohol and cannabis (Aguinis, Pierce, & Quigley, 1995).
Secondly, all participants were assured of strict confidentiality and lack of legal
implications except for a clause: “unless required to (disclose the information) by law”
stated in the Consent Form- Appendix A.2. Meeting these conditions has been found to
improve the reliability and validity of self-reports in other studies (Sherman & Bigelow,
1992). Thirdly, the participants were given a clear explanation regarding the study, as
the context often affects the validity and reliability of self-reports (Finch & Strang,
1998). Specifically, they were told that different substances may change the blinking
pattern (the startle reflex) investigated in this study and hence precise information on
substance use and urine samples were required. Furthermore, the participants were also
reassured that they would not be contacted in the future, as the study involved a one-off
appointment only. Therefore, it seems that participants in this study had less obvious
60

reasons to misreport their substance use in comparison to drug users in treatment.
Participants attending drug-treatment programs know that their admission and/or
continued participation in the program depends on their self-reports and hence may
misreport their actual use (Digiusto et al., 1996). On the other hand, participants in the
current study may have had other reasons for misreporting their substance use. For
instance, they may have wanted to maximise their social appearance in front of the
author of this thesis. Fourthly, the sensitivity of the assays may have also contributed to
high agreements among the results. The CEDIA assays and GCMS technique have
been found to be reliable and effective at detecting all substances tested in this study
(Armbruster et al., 1995; Lisi et al., 1993). CEDIA also has high sensitivity and
specificity when compared to other assays widely used for urine substance detection,
such as EMIT II (Wu et al., 1995). The cannabis results were particularly accurate in
this study, as the positive samples identified by CEDIA were reanalysed with GCMS
technique to confirm the results. Such approach is desired, as other substances may
interfere with one type of analytical method and mimic the drug of abuse in question
(Maisto et al., 1990; Schwartz, 1988). A confirmatory test can, therefore, remove any
false-negative cases. Furthermore, high consistency of results could be due to the
choice of substances tested. For instance, cocaine use has a low prevalence in
Perth/Australia compared to other countries (Jablensky et al., 1999; Regier et al., 1990),
where cocaine may be available more widely and perhaps also being under-reported
more widely. This is however unlikely, as cannabis was reported accurately, even
though it is the most common illegal substance of abuse in Australia (Makkai &
McAllister, 1997).
Nine false-negative cases were observed suggesting that there may have been as
many as nine misreports. The most plausible explanation for the presence of such cases
is under-reporting of substance use. Under-reporting is often triggered by social factors
61

arising from substance use (Darke, 1998). For example, participants tend to under-
report socially undesirable behaviours and over-report the behaviours considered
desirable (Aguinis et al., 1995). Participants representing certain professions, such as
teachers or police officers, may prefer to deny any substance use, when that use may be
frowned upon in their employment. Furthermore, participants may prefer to report their
use of legal and/or more socially acceptable substances (such as cannabis) and under-
report their use of less socially acceptable substances. Indeed, opioid use is reported
less accurately than cannabis use by multiple drug users and methadone-program
participants (Downey, Helmus, & Schuster, 2000; Magura, Goldsmith, Casriel,
Goldstein, & Lipton, 1987; Martin et al., 1988). Also some participants may prefer to
deny their current substance use and admit to it as a past problem (Wittchen et al.,
1989). This may have been the reason for inconsistency between self-reported opiate
use and urine screen for opiates by a self-reported past codeine abuser in this study.
The presence of false-negative cases may also be explained by other factors. Firstly,
accidental or environmental exposure to a substance in question may result in a positive
test for that substance. For instance, a more detailed investigation of three false-
negative nicotine cases revealed that the participants were also cannabis users. In
addition, two of the three participants were regular cannabis users, who tested positive
for both cotinine and cannabinoid metabolites. These two participants may have mixed
tobacco with cannabis - which is a common practice among cannabis users (Kavanagh,
McGrath, Saunders, Dore, & Clark, 2002) - and, therefore, may have perceived such use
of nicotine as secondary to cannabis use and simply not important enough to report.
However it is unlikely that the positive cotinine result may have been explained by
environmental exposure to nicotine, as only nicotine, but not cotinine, can be detected in
the urine samples of most non-smokers (Baselt, 2000; Matsukura et al., 1979).
62

Secondly, the use of prescription or over-the-counter medications may also account
for some false-negative results. For example, the positive urine screen for opiates could
indicate the use of codeine-containing pain relief medications for legitimate medical
purposes. Similarly, the use of benzodiazepine-based medications by patients with
schizophrenia resulted in positive urine tests for benzodiazepines. In addition, some
medications, such as ephedrine-containing asthma medications, can interact with the
immunoassay for amphetamines and produce positive urine results (Schwartz, 1988). In
this study, however, the participant with the positive screen for ephedrine was negative
for amphetamines. Therefore, in addition to information regarding substances of abuse
it is crucial to inquire about any medication the participant may be treated with,
including over-the-counter drugs, which the participant may still simply forget to report.
Thirdly, the presence of false-negative cases may reflect the limitations of the drug
assays. In case of some substances, such as cannabis, the best predictor for a positive
urine test is the recency of use (Martin et al., 1988). Indeed, a significant negative
correlation was observed between cannabinoid concentration and the time of last
cannabis use in the current study. However, detection time of different substances in
urine varies according to a range of factors, such as type of biological sample, analytical
test, purity of the substance, weight and metabolism of the participant, and the regularity
and heaviness of use (Baselt, 2000; Dawe et al., 2002; Schwartz, 1988). The
participants in this study were asked to report only their most recent (24-hour) use, as
most of them were only casual substance users except for some heavy users of cannabis
and nicotine. This conservative 24-hour cut-off may have accounted for presence of
three false-negative cases. Indeed, these three participants tested positive for nicotine,
amphetamine, and benzodiazepines respectively, but reported the use of these
substances more than 24 hours before the testing session (48 hours for nicotine, 4 days
for amphetamine, and within last month for benzodiazepines). Therefore, it appears that
63
individual variation in metabolism and excretion of substances may have accounted for
these discrepant results, rather than misreporting.
Fourthly, the use of only one type of biological sample – urine – can compromise the
results. Urine is a frequent sample of choice, as it is less invasive and cheap to collect
and analyse compared to blood samples. However, the most recent use of some
substances may be more easily detectable in other body fluids, such as blood (for
instance, alcohol level; Chan, 1993) or by testing expired air carbon monoxide
(nicotine; Waage, Silsand, Urdal, & Langard, 1992). Therefore, the analytical method
chosen may not be sensitive enough to detect a substance in question and subsequently
increase the rates of false-positive cases (Maisto et al., 1990). In fact, self-reports may
have a greater sensitivity over the urine screens for some substances (Martin et al.,
1988). For instance, in this study urine screens may have not been robust enough to
detect casual alcohol and nicotine use. To prevent increased rates of false-positives
alcohol was given a different detection time of 10 hours rather than 24 hours, as the
average half-life of alcohol is 2 – 14 hours. Alcohol is also rapidly cleared from urine,
and alcohol metabolism depends on a dose, weight, gender, and presence of food in the
stomach (Baselt, 2000). Similarly, the false-positive nicotine case probably resulted
from a low sensitivity of urine towards detection of cotinine in casual user rather than
from over-reporting, as admitting to nicotine use had no obvious advantage to the
participant Indeed, some authors suggest that in fact cotinine may not be a good index
of recent nicotine use, but rather provide information regarding the degree of chronic
cigarette consumption (Matsukura et al., 1979). To support this argument, two
participants in this study reported using nicotine 13 hours before the testing session, but
only the more frequent nicotine user was positive for cotinine. This finding also
emphasises that drug use histories and other variables, such as the amount, frequency of
64

use and dependence measures, may influence the accuracy of urine screens for the
recent substance use (Bharucha-Reid et al., 1995).
In conclusion, there was remarkably good agreement between self-reports of
substance use and the urine drug-screens. It is possible that the good agreement was
increased by the knowledge that drug levels would also be determined by the urine
screens. It is also possible that emphasising the importance of knowing the actual drug
use because of its influence on the measure used in the study aided in the good
agreement. Finally, the lack of any clear adverse consequences of reporting substance
use may also have contributed to the agreements between self-reports of recent
substance use and the results of the urine drug screens. The number of self-reports that
appeared to be false-negatives/positives on the basis of the urine screens represents the
maximum possible misreporting in this sample. However, not all the false-
negatives/positive cases appear to be the true misreports, for the reasons outlined above.
Nonetheless, the conservative approach for the purpose of this study is to assume that
all false-negatives and false-positives are misreports.
2.6.2 Consistency of Self-Reports of Past Substance Use
In general, self-reports of lifetime and last 12-month use of cannabis and nicotine,
were as consistent as the self-reports of recent use of these substances, while the self-
reports of past alcohol use were less consistent than the self-reports of cannabis and
nicotine use. Due to lack of external method of validation, the overall accuracy of self-
reports of past substance use could not be determined; however inconsistency among
the reports was used as a measure of minimum inaccuracy. The self-reports of past
cannabis and nicotine use were consistent in terms of significance and directions of all
correlations. In case of alcohol, only the correlation between the two measures of
lifetime alcohol dependence was significant, although all correlations were in directions
indicating consistency. The amount of shared variance for all correlations was low as
65
indicated by the range of rho coefficients (0.49 – 0.59 for cannabis, 0.51 – 0.56 for
nicotine, and 0.63 for alcohol). However, similar correlation coefficients were reported
in other studies either testing the psychometric properties of SDS, FTND, SMAST,
CAGE and/or utilising the instruments in substance users. For example, SDS was
reported to significantly correlate with the quantity of cannabis use in the previous
month with Pearson’s r = 0.30 (Ferri et al., 2000). Similarly, the duration of use and
SDS for heroin, amphetamine, and cocaine were significantly correlated with Pearson’s
r ranging between 0.24 – 0.30 (Gossop et al., 1995). In case of nicotine, FTND scores
were significantly correlated with the amount/frequency of use (cigarettes/day;
Pearson’s r = 0.38 – 0.39; Payne, Smith, McCracken, McSherry, & Antony, 1994;
Yang, McEvoy, Wilson, Levin, & Rose, 2003) and with the total duration of use
(Pearson’s r = 0.52; Pomerleau et al., 1994). The two lifetime alcohol dependence
questionnaires (SMAST and CAGE) were correlated with a higher correlation
coefficient (Pearson’s r = 0.70; Hays, Merz, & Nicholas, 1995) than the one obtained in
the present study (rho = 0.63). Similarly, unlike in the current study, others found that
SMAST, MAST (original, longer version of SMAST), and CAGE scores were
significantly correlated with the frequency and heaviness of drinking (Pearson’s r
between 0.28 – 0.54; Harburg et al., 1988; Smart, Adlaf, & Knoke, 1991; Watson et al.,
1995).
The low correlation coefficients among self-reports of past substance use and the
lack of significance for alcohol correlations (SMAST and CAGE vs. drinks/week) could
be attributed to a range of factors. Firstly, participants may have misreported their
substance use, as discussed above. One plausible reason for less consistency in past use
reports relative to recent use reports is a perception by the participants that there is no
urine screen to provide external validation for their self-reports. This may reduce
incentive for the participants to correctly report the past substance use. Even though
66

misreporting may result from a conscious decision, it may also be due to other factors.
For instance, time may alter the emotional apprehension of past substance use,
particularly if the use had some perceived negative influences on participants’ lives
(Darke, 1998; Kiejna, Grzesiak, & Kantorska-Janiec, 1998). Furthermore, perceived
social acceptability may also lead to misreporting to conform to those perceptions
(Makkai & McAllister, 1997). Some participants also tend to misinterpret lifetime
questionnaires and base their answers on the current rather than the past substance use
(Green & Whichelow, 1994).
Secondly, multiple dimensions of substance misuse and dependence may account for
low shared variance (Gossop et al., 1995). For example, some questionnaires may
measure dependence by assessing the heaviness of use (amount per day), such as FTND
(Kozlowski et al., 1994; Payne et al., 1994; Yang et al., 2003). In contrast, other
instruments used in this study measure the psychological aspects of dependence, such as
loss of control over use, difficulty stopping and continued use despite adverse effects on
health (SMAST and CAGE; Ewing, 1984; Selzer et al., 1975). Thus, the low
correlation coefficients could reflect the inadequacy of the instruments at measuring all
aspects of dependence on a given substance.
Thirdly, differences in the time course of the measures of substance use may have
contributed to the discrepancies among self-reports. For example, alcohol dependence
questionnaires provided a lifetime measure of dependence, while the heaviness of use
(drinks/week) was reported for the last 12 months only. Therefore, it is plausible that
the amount of alcohol used in the past year may have not been representative of the
lifetime use, thus, leading to non-significant correlations between the two dependence
and amount/frequency measures.
Fourthly, the low correlation coefficients and discrepancies in alcohol results of this
study could be due to difficulties with establishment of ‘standard’ amounts of
67

substances. For example, cannabis often has an unknown composition in comparison to
substances such as nicotine (Darke et al., 1991; Deering & Sellman, 1996). Similarly,
alcohol may be consumed in various concentrations and sizes of standard drinks vary
substantially. In case of nicotine, cigarettes vary in their nicotine content, which could
alter the number used per day. Furthermore, most users in this study were light/casual
users of substances, while most questionnaires used in research have been developed for
heavy users and, thus, may not be able to adequately measure dependence in light users
(Etter et al., 1999).
Fifthly, discrepancies in alcohol results could arise from the outdated wording of
SMAST and CAGE, because the attitudes towards alcohol have changed over the past
30 years (since the instruments were developed) and people are more aware of dangers
associated with alcohol misuse (Rydon, Redman, Sanson-Fisher, & Reid, 1992;
Waterson & Murray-Lyon, 1988). For example, some participants may report being
‘not normal drinker’, because they drink much less than what is normally accepted in
the society. Similarly, some questions on the instruments may not be very specific. For
instance, some participants may answer “yes” to having attended a meeting of
Alcoholics Anonymous, however the reason for attending such meeting could be to
support a friend/partner rather than to seek help for their own alcohol-related problems.
Despite of these problems SMAST and CAGE are still being widely used in research
around the world.
In conclusion, the past use of substances was reported less accurately than the most
recent substance use, as far as could be determined without external validation.
Nevertheless, the minimum possible inaccuracy was low for reports of past cannabis
and nicotine use and higher for the past alcohol use. Therefore, it can be concluded
that, while the actual level of accuracy could not be determined, the maximum possible
accuracy in self-reports of past substance use was high.
68

2.6.3 Consistency of Self-Reports and Schizophrenia
The results of this study also suggest that patients with schizophrenia can accurately
report their substance use. However, this conclusion needs to be accepted with some
caution. Firstly, the cognitive functioning of patients in this study was good, with most
of the out-patients living independently in the community and the in-patients being
close to discharge. Some have argued that self-reports of patients might be influenced
by cognitive impairment, such as reduced ability to comprehend instructions and recall
information (Becker & Jaffe, 1984). Thus consistency among poor-functioning patients
may be worse than those in the present sample. On the other hand, cognitive
functioning may not influence self-reports of substance use. For instance, cognitive
functioning of in-patients to a substance abuse clinic without mental illness did not
influence reliability for alcohol, cocaine and cannabis reports (Brown, Kranzler, & Del
Boca, 1992). Similarly, regardless of illness severity, patients with acute or chronic
schizophrenia were found to correctly report their nicotine use and their illness did not
affect the utility of the nicotine use measures, such as FTND (Yang et al., 2003).
Secondly, the consistency of self-reports may have resulted from a limited access to
substances among the patients recruited for this study due to being hospitalised or
possessing limited financial resources. Thirdly, substance use is reported more reliably
when patients with mental illness are assessed using not one, but a range of short
instruments of different modes, such as self-completed questionnaires, verbal
interviews, and laboratory tests (Drake, Rosenberg, & Mueser, 1996), as was done in
this study.
While 17 patients reported their substance use consistently, one patient may have
tried to deliberately hide their substance use by providing an over-diluted sample. One
explanation for this result could be the presence of paranoid delusions regarding drug
testing in this patient. It has also been suggested that patients with schizophrenia may
69

deny substance use due to fear of losing psychiatric treatment and/or entitlements to
pensions (Ridgely, Goldman, & Willenbring, 1990). This apparently was not the case
in the present study, based on the high consistency between self-reports and urine screen
results.
2.6.4 Conclusion
The results of this study suggest that participants from general community, including
regular cannabis users and patients with schizophrenia, volunteering for research
unrelated to substance use treatment, provide consistent self-reports of their substance
use. Particularly, self-reports of the current use (last 24 hours) were remarkably
consistent with urine screens. The self-reports of past 12-month and lifetime use of
cannabis, nicotine, and alcohol were less consistent than self-reports of recent use, but
also acceptable. Therefore, obtaining a comprehensive history of the current and the
past substance use may be an adequate method for assessing substance use in general
research participants under similar conditions to the ones described in the current study.
However, when such conditions could not be met it would be desirable to confirm the
self-reports with other methods, such as urinalysis or reports from external informants.
Furthermore, relatively well functioning patients with schizophrenia can accurately
report their substance use under certain conditions; however this finding should be
interpreted with caution until replicated in a larger sample of patients. Finally, the
results of this study should not be extrapolated to participants in substance-use treatment
programs, who may have reasons for misreporting of their substance use.
70

CHAPTER 3. CONCURRENT VALIDITY OF
SUBSTANCE USE MODULE ON CIDI-AUTO 2.1
3.1 Preface
The second aim of the present study was to establish the validity of cannabis misuse
diagnoses generated by a diagnostic interview, CIDI-Auto 2.1. So far, the substance use
module of this version of the CIDI has not been validated. The following chapter
explores the issue of concurrent validity between cannabis misuse diagnoses generated
by CIDI-Auto 2.1 and cannabis dependence diagnoses provided by a psychological
scale, Severity of Dependence Scale, SDS.
3.2 Abstract
The Composite International Diagnostic Interview, CIDI, is a widely used diagnostic
instrument in research settings. The current versions of the interview, CIDI 2.1 and
computerised CIDI-Auto 2.1, generate diagnoses of mental illness and substance use
according to DSM-IV and ICD-10 diagnostic criteria. While the psychometric
properties of various versions and modules of the interview have been investigated, the
substance use module of the CIDI-Auto 2.1 has not been validated to date. Therefore,
the present study investigated the concurrent validity of the CIDI-Auto 2.1-generated
diagnoses of cannabis misuse (abuse and dependence) and cannabis dependence
diagnoses generated by a psychological questionnaire, Severity of Dependence Scale
(SDS), in a sample of 50 participants from the general population, including regular
cannabis users. A direct logistic regression analysis showed an 86% agreement between
cannabis misuse diagnoses generated by the two instruments. SDS was 3.46 times as
likely to predict the presence of cannabis misuse diagnoses on the CIDI. Therefore, the
71

results of this study indicate that CIDI-Auto 2.1 has an acceptable concurrent validity in
terms of assigning cannabis-misuse diagnoses to research participants.
3.3 Introduction
The use of substances in volunteers from the general population can be assessed
using one of many diagnostic instruments existing in psychiatry (Grzesiak & Kiejna,
1999). The Composite International Diagnostic Interview (CIDI) is one of such
diagnostic instruments developed by the World Health Organisation (WHO) and the
former Alcohol, Drug Abuse, and Mental Health Administration’s (ADAMHA) Joint
Project on Diagnosis and Classification of Mental Disorders in Alcohol and Drug-
Related Problems (Wittchen, 1994). The most current versions of the CIDI are the pen-
and-paper CIDI 2.1 and the computerised CIDI-Auto 2.1 (World Health Organization,
1997a, 1997b). The CIDI 2.1 is a comprehensive and a fully structured interview using
a standard algorithm to create alcohol and substance-misuse diagnoses based on DSM-
IV and ICD-10 criteria (American Psychiatric Association, 1994; Andrews & Peters,
2003; World Health Organization, 1992). The main advantage of the computerised
version of the CIDI is that it can be self-administered and is quick to complete. Such
self-administration removes the interviewer subjectivity and improves interrater and
test-retest reliability (Andrews & Peters, 2003). Further, as the CIDI-Auto is fully
automated, it provides a low cost tool for generating substance-misuse diagnoses in the
general population (Kiejna et al., 1998).
While the CIDI 2.1 and the early versions of the CIDI-Auto (1.0 and 1.1) have
demonstrated generally good psychometric properties in terms of psychiatric diagnoses
(Wittchen, 1994), only limited data is available on the psychometric properties of the
substance use modules of the CIDI-Auto 2.1. The available data suggest that CIDI-
Core 0.0 and CIDI-Auto 1.1 demonstrate excellent interrater reliability, with a kappa of
0.93 (Cottler et al., 1991), and show a good to excellent test-retest reliability of
72

substance misuse diagnoses for ICD-10 (Uestuen et al., 1997) and ICD-10/DSM-III-R
diagnoses of substance misuse (Rubio-Stipec, Peters, & Andrews, 1999). The good to
excellent interrater and test-retest reliabilities, however, may not necessarily reflect
good validity of the instrument for the assessment of substance use (Andrews, Peters,
Guzman, & Bird, 1995). In fact, some controversy surrounds the validity of substance
use modules of the CIDI. Some studies showed a good agreement (kappa of 0.83)
between diagnoses of the psychoactive substance use generated by the CIDI 1.0 and the
Research Criteria Checklist, ICD-10 (Janca, Robins, Cottler, & Early, 1992). Similarly,
a large international study demonstrated a moderate agreement (kappas between 0.44 –
0.68) on lifetime ICD-10 dependence diagnoses between the CIDI 1.1 and Schedules for
Clinical Assessment in Neuropsychiatry (SCAN) for various substances, including
alcohol, opiates, cannabis, sedatives, and cocaine (Uestuen et al., 1997). In contrast,
others found a poor agreement (kappa of 0.31) between the substance-misuse diagnoses
generated by the CIDI-Auto 1.0 and clinicians (Rosenman, Levings, & Korten, 1997b).
CIDI-Auto 1.1 also diagnosed significantly more participants in an acute psychiatric
sample with substance use disorders than did psychiatrists (Rosenman, Korten, &
Levings, 1997a). In general, it is difficult to assess the validity of a diagnostic interview
using clinicians’ diagnoses because such diagnoses are not perfectly reliable
themselves. The criteria used to establish the presence of a substance misuse disorder
may vary across clinicians and thus, clinical diagnoses cannot be used as the only ‘gold
standard’ to validate other measures of substance misuse (Spitzer, 1983). While
clinicians often ask about the main symptoms and assign diagnoses that need to be
treated (Komiti et al., 2001), the CIDI investigates ALL symptoms and may have a
lower threshold for attributing diagnoses than do clinicians (Peters & Andrews, 1995).
Therefore, it has been suggested that to estimate a validity of a diagnostic interview the
interview needs to be tested not only against diagnoses provided by clinicians but also
73

against other psychological instruments available (Peters & Andrews, 1995).
Furthermore, each version of the CIDI should be tested separately, as they differ subtly
and, thus, may have different psychometric properties (Andrews & Peters, 1998).
The aim of this study was to test the concurrent validity of the substance-misuse
diagnoses generated by CIDI-Auto 2.1, which has not been established to date for this
version of the instrument. Specifically, the study was designed to test the agreement
between lifetime cannabis-misuse diagnoses generated by CIDI-Auto 2.1 and lifetime
cannabis-dependence diagnoses on Severity of (Cannabis) Dependence Scale (Gossop
et al., 1995). The hypothesis of the study was that the substance-misuse module of the
CIDI-Auto 2.1 is valid, similar to other modules and other versions of the instrument. If
this hypothesis is correct then a presence of a lifetime cannabis-misuse diagnosis on
CIDI-Auto 2.1 should be associated with higher scores on SDS and higher frequency of
cannabis use (more daily-weekly users). Further, CIDI-Auto should accurately
discriminate between participants with and without a lifetime cannabis dependence
diagnosis generated by SDS using a similar cut-off score as reported elsewhere.
3.4 Methods
3.4.1 Participants
The details regarding participant recruitment can be found in Chapter 2. Briefly, of
70 participants recruited for a study investigating the effects of cannabis use on the
startle reflex, 50 non-schizophrenia-patient participants completed the CIDI-Auto 2.1,
as CIDI was specifically developed for use in general populations (Andrews & Peters,
1998). Of the 50 participants, 28 had used cannabis within 12 months since the testing
session.
74

3.4.2 Cannabis Misuse Assessment
The information on cannabis use was collected using verbal and written self-reports.
Such self-reports regarding cannabis use in this sample of participants, not involved in
any drug-treatment programs, were found to be consistent for both the recent and the
past use, as determined by urine drug screens and correlations on various measures of
cannabis use (Chapter 2).
Lifetime cannabis-misuse diagnoses were obtained from two sources. Firstly, all
participants self-completed the CIDI-Auto 2.1 substance-use module. The data were
processed automatically by the CIDI diagnostic algorithm, which provided presence or
absence of lifetime DSM-IV and ICD-10 diagnoses of cannabis abuse and dependence.
Participants were divided into two groups- No CIDI-Diagnoses Group based on absence
of both diagnoses (abuse and/or dependence) and CIDI Cannabis-Diagnoses Group
based on presence of either one or both diagnoses on CIDI-Auto. Secondly, lifetime
cannabis-dependence diagnoses were generated from a pen-and-paper questionnaire
called the Severity of (Cannabis) Dependence Scale, SDS (Appendix B.1; Gossop et al.,
1995). For psychometric properties of SDS refer to Chapter 2. Participants who had
never used cannabis did not fill out the questionnaire and were automatically assigned a
score of zero indicating lack of cannabis dependence. All participants also reported the
average frequency of cannabis use over the 12 months prior to the testing session (refer
to Appendix B.1- Additional Question) and according to this information were divided
into daily-weekly and monthly or less- including none groups.
3.4.3 Statistical Analysis
The statistical analyses were carried out using SPSS-PC 11.0 unless stated otherwise.
Continuous variables. The continuous variables were age, years of education, IQ,
and SDS scores. These variables were assessed separately for each group (No CIDI-
Diagnoses and CIDI Cannabis-Diagnoses) for normality of distribution using the
75

Kolmogorov-Smirnov test for goodness of fit and for homogeneity of variance using
Levene’s test (Tabachnick & Fidell, 2001). The variables which met the above
assumptions (age, years of education, and IQ) were compared using independent
samples t-tests (two-tailed, p < 0.05). The variable which violated the assumption of
normality (SDS scores) was compared between the two groups using the non-parametric
equivalent of a t-test, the Mann-Whitney U-test (two-tailed, p < 0.05). The effect size
(eta squared, η2) was used to investigate the strength of association for each t-test and
was calculated according to the following formula:
dftt+
= 2
22η (Cohen, 1988), where:
t = value of t-test adjusted for meeting the homogeneity of variance assumption, df = degrees of freedom (df = n1 + n2 – 2) n1 = 28 (sample size of the No CIDI-Diagnoses Group) n2 = 22 (sample size of the CIDI Cannabis-Diagnoses Group)
The η2 was interpreted as small < 0.01, small - moderate: 0.01 – 0.06, moderate: 0.06 –
0.14, large > 0.14 (Cohen, 1988). The effect size is defined as “the degree to which the
phenomenon is present in the population, or the degree to which the null hypothesis is
false” (Cohen, 1988; p. 10). In general, null hypothesis means that the effect size is
zero while the larger the value of an effect size the greater the degree to which the
studied phenomenon is manifested (Cohen, 1988). Thus the effect size provides a
measure of the total variance in the dependent variable that is predictable from the
levels of the independent variable (Tabachnick & Fidell, 2001).
Discrete variables. The discrete variables were frequencies of: males and females,
daily and non-daily cannabis users in the last 12 months, and DSM-IV and ICD-10
cannabis-misuse diagnoses generated by CIDI-Auto 2.1. Contingency tables (2 x 2)
were used to test the assumption that the expected frequencies in any cell should be at
least 10 for each of the three variables (Kiess, 1989). The variable which met this
assumption (frequency of daily or non-daily cannabis users in the last 12 months) was
76

compared between the two groups using chi-square test with Yates’ Continuity
Correction (two-tailed, p < 0.05). The Yates’ correction compensates for the
overestimate of the chi-square value when used with a 2 x 2 contingency table thus
making the chi-square test more conservative (Pallant, 2001). The variables which
violated the above assumption (frequencies of males and females, and DSM-IV and
ICD-10 cannabis-misuse diagnoses generated by CIDI-Auto 2.1) were compared
between the two groups using the Fisher’s Exact (Probability) Test; two-tailed, p < 0.05
(Kiess, 1989). While chi-square test compares the difference between the observed and
expected frequencies, the Fisher’s Exact Test computes the exact probability of
obtaining the observed frequencies across cells and, thus, is appropriate even if such
frequencies are small (Lowry, 1999-2003).
Agreement between CIDI and SDS. A logistic regression analysis (LRA) was used to
test the agreement between the number of participants with lifetime CIDI-Auto 2.1
cannabis-misuse diagnoses and lifetime SDS cannabis-dependence diagnoses. The
LRA predicts a discrete outcome, such as a group membership, from a set of variables
(Tabachnick & Fidell, 2001). This technique was chosen over a discriminant function
analysis, because LRA has no assumptions regarding the distribution of predictor
variables, and predictors can be continuous or discrete (Tabachnick & Fidell, 2001). In
the current study, the CIDI-Auto 2.1 diagnosis was a dependent discrete variable
(outcome variable) and was coded 1. The range of SDS scores was a continuous
predictor variable and was coded 0. The LRA was conducted using the ENTER
method, whereby the predictors enter the logistic equation simultaneously (only one
predictor in this study). The data met two assumptions relevant to one-predictor LRA
(Bagley, White, & Golomb, 2001; Tabachnick & Fidell, 2001). Firstly, the ratio of
number of predictors to the number of observations was above 10 (one predictor to 50
observations). Secondly, the non-significant Hosmer and Lemeshow Test of observed
77

and expected frequencies showed that the goodness-of-fit assumption was met. In
general, Hosmer and Lemeshow Test requires large expected frequencies- all greater
than one and no more than 20% less than five (Tabachnick & Fidell, 2001). This
assumption was violated in the current study, meaning that while the rate of Type I
errors in the Hosmer and Lemeshow Test was not increased, the power of the test was
reduced (Tabachnick & Fidell, 2001). The strength of association was reported as Cox
and Snell’s and Nagelkerke’s R coefficients, which are equivalent to Pearson’s r
correlation coefficient.
In addition, the receiver operating characteristics curve (ROC curve) in MedCalc-
PC 6.12 was obtained to estimate the most optimal cut-off score between presence and
absence of cannabis dependence diagnosis on SDS using CIDI-Auto diagnoses of
cannabis misuse as ‘gold standard’. The ROC curves are plots of the probability of a
false-positive (incorrect identification of dependence when dependence is absent) and
true positive (correct diagnosis of dependence when dependence is present) at each
value of SDS (Swift, Copeland, & Hall, 1998b). The area under the curve (AUC) has
values between 0.5 (a true case diagnosed by chance) and 1.0 (a perfect discrimination
between participants with and without diagnoses) with larger AUC indicating larger
sensitivity. For each possible SDS score (0 – 15) the ROC curve generates:
• sensitivity (correct identification of participants with a diagnosis),
• specificity (correct identification of participants without a diagnosis),
• positive and negative likelihood ratios (+LR and -LR respectively; the ratios indicate
by how much the SDS score will increase or decrease the pretest probability of
having the cannabis dependence diagnosis on CIDI). The likelihood ratios were
interpreted as large: LR > 10, moderate: 5 – 10, and small: 2 – 5 (Jaeschke, Guyatt,
& Sackett, 1994).
78

Once the SDS cut-off score for presence/absence of cannabis dependence diagnoses
was established, the Cohen’s kappa was used to find the overall agreement between
diagnoses generated by CIDI-Auto 2.1 and SDS (Cohen, 1960). The agreement was
interpreted according to criteria specified in Chapter 2.
3.5 Results
3.5.1 Participant Characteristics
Characteristics of the participants are reported in Table 3.1. There were no
significant differences between the No CIDI-Diagnoses Group and CIDI Cannabis-
Diagnoses Group on gender, age, years of formal education, and IQ estimated with the
National Adult Reading Test, NART (Nelson & Willison, 1991).
Table 3.1 Participant characteristics
Variable No CIDI-Diagnoses Group
CIDI Cannabis-Diagnoses Group
Test (df)
Sample size (n)
28 22
Male (%) Female (%)
23 (82%) 5 (18%)
17 (77%) 5 (23%)
pF = 0.732
M ± SD (range) Age IQ Education (yrs)
34 ± 9 (18 – 56) 105 ± 8
(86 – 117) 13 ± 2
(9 – 17)
30 ± 9 (19 – 51) 104 ± 9
(79 – 117) 13 ± 2
(9 – 17)
t (48)
1.5
0.4
0.2
p
0.142
0.718
0.830
η2
0.04
< 0.01
< 0.01
Note. Abbreviations: CIDI- Composite International Diagnostic Interview, df- degrees of freedom, pF- two-tailed Fisher’s Exact Probability, yrs- years.
Table 3.2 shows the proportions of participants with cannabis-misuse diagnoses
(abuse and/or dependence) generated by CIDI-Auto according to ICD-10 and DSM-IV
criteria.
79

Table 3.2 The lifetime diagnoses of cannabis misuse generated by CIDI-Auto 2.1
Lifetime CIDI-Auto cannabis misuse diagnosis
Type of diagnosis
ICD-10
DSM-IV
Total diagnoses assigned/50 (%) Abuse (Harmful use) Dependence Both
17 (34%)
2 5
10
21 (42%)
6 2
13
Note. Abbreviations: CIDI-Auto 2.1- Composite International Diagnostic Interview, version Auto 2.1; ICD-10- International Classification of Disorders version 10; DSM-IV- Diagnostic and Statistical Manual of Mental Disorders, 4th edition.
In terms of cannabis misuse diagnoses, more participants met the lifetime DSM-IV
criteria (42%) than the ICD-10 criteria (34%) for cannabis misuse diagnoses (Table 2).
The difference in frequencies was significant with Fisher’s Exact Probability of pF <
0.0005. Due to small numbers of participants with individual diagnoses of abuse
(harmful use) and dependence the data were analysed according to the presence or
absence of any lifetime CIDI-Auto cannabis-misuse diagnosis (abuse and/or
dependence on ICD-10 and/or DSM-IV).
3.5.2 Cannabis-Misuse Diagnoses on CIDI-Auto and SDS
The agreement between CIDI-Auto and SDS diagnoses of cannabis misuse was
tested in three ways. Firstly, SDS scores and frequency of cannabis use were compared
for participants with and without cannabis misuse diagnoses on CIDI-Auto (Table 3.3).
80

Table 3.3 SDS scores and cannabis use frequency in participants with and without cannabis-misuse diagnoses on CIDI-Auto 2.1
Variable No CIDI- Diagnoses Group
CIDI Cannabis-Diagnoses Group
Test (df)
Sample size (n)
28 22
SDS (median) range
0 0 – 3
5 0 – 13
U = 45.5, z = -5.4, p < 0.0005**
Cannabis usea
Daily-weekly Monthly/less/none
6 (21%)
22 (79%)
18 (82%) 4 (18%)
χ2 (1) = 15.7; p < 0.0005**
Note. Abbreviations: CIDI- Composite International Diagnostic Interview, df- degrees of freedom, SDS- Severity of Dependence Scale, U- Mann-Whitney U-test. afrequency of cannabis use in the last 12 months. **p < 0.0005
Table 3.3 shows that SDS scores were significantly higher in participants with
cannabis-misuse diagnoses than in participants without cannabis-misuse diagnoses.
Furthermore, the proportion of daily-weekly cannabis users was significantly higher in
participants with any cannabis misuse diagnoses.
Secondly, the agreement between CIDI-Auto and SDS diagnoses of cannabis misuse
was tested using a direct logistic regression analysis (LRA). The LRA was performed
using a presence or absence of CIDI-Auto cannabis misuse diagnoses as the outcome
variable and SDS scores as the predictor variable with a cut-off of 0.6 for presence of
cannabis misuse diagnosis (Table 3.4).
Table 3.4 Predicted group membership using SDS diagnoses as the predictor variable and CIDI-Auto diagnoses as the outcome variable
Cannabis-dependence diagnoses predicted by SDS
Absent
Present
% correct
Observed cannabis misuse diagnoses on CIDI-Auto 2.1 Overall %
Absent Present
27 (54%) 6 (12%)
1 (2%) 16 (32%)
96 73
86
Note. The overall model was significant with χ2 (1) = 29.7, p < 0.0005 (cut-off 0.6). The predictor variable (SDS scores) significantly contributed to the model with Wald χ2 (1) = 10.1, p = 0.001, and odds ratio (OR) = 3.46 (95% confidence interval: 1.61 – 7.45). The strength of association was large with Cox and Snell’s R = 0.74 and Nagelkerke’s R = 0.85. The goodness-of-fit assumption was met with Hosmer and Lemeshow χ2 (1) = 0.4, p = 0.980. For abbreviations refer to Table 3.3.
81

According to the model presented in Table 3.4 the SDS scores correctly identified
96% of participants without the CIDI-Auto cannabis-misuse diagnoses and 73% of
participants with cannabis-misuse diagnoses (Table 3.4). The overall rate of correct
identification of CIDI-Auto cannabis-misuse diagnoses with SDS scores was 86%. The
odds ratio indicates that the SDS scores were 3.46 times more likely than chance to
predict presence of the CIDI-Auto cannabis misuse diagnoses.
Thirdly, the ROC curve was used to find the most optimal cut-off score for presence
and absence of cannabis dependence diagnosis on SDS using CIDI-Auto cannabis-
misuse diagnoses as ‘gold standard’ (Figure 3.1). The establishment of SDS cut-off
score was necessary to test the agreement between presence/absence of the CIDI-Auto
and SDS diagnoses of cannabis misuse using kappa.
0
10
20
30
40
50
60
70
80
90
100
0
Tru
e po
sitiv
e ra
te (S
ensi
tivity
) .
01
2
6
7-
Figure 3.1 ROC standard’.
According to F
confidence interva
3
5
4-10 20 30 40 50 60 70 80 90 100
False positive rate (100-specificity)
Chance (AUC = 0.50) SDS score (AUC = 0.93)
15
curve for SDS scores using CIDI-Auto cannabis-misuse diagnoses as ‘gold
igure 3.1 the AUC for SDS was 0.93 (95% CI = 0.82 – 0.98). As the
l does not include 0.50, SDS predicts cannabis dependence at a level
82

better than chance, which supports the validity of SDS scale. The scores of 2 and 3
produced the most optimal sensitivity, specificity, and positive and negative likelihood
ratios (+LR and –LR respectively) for the instrument. At the score of 2 SDS had a
sensitivity of 82%, specificity of 93%, +LR of 11, and –LR of 0.2, while at the score of
3 SDS had a sensitivity of 73%, specificity of 96%, +LR of 20, and –LR of 0.3. Using
the positive and negative likelihood ratios it was decided that the score of 3 had the
most optimal parameters, as the +LR score of 20 indicates that cannabis dependence
diagnosis on SDS is 20 times as likely to occur in participants with cannabis misuse
diagnoses on CIDI-Auto 2.1. A score of 3 was also previously reported as the most
optimal cut-off score for presence of cannabis dependence in cannabis users in Australia
(Swift et al., 1998b).
The SDS cut-off score of 3 was then used to determine the number of participants
with and without SDS cannabis dependence diagnoses. The agreement between the
number of such participants with and without cannabis dependence on SDS and
cannabis-misuse diagnoses on CIDI-Auto was determined using kappa (Table 3.5).
Table 3.5 Agreement between cannabis dependence diagnoses on SDS using a cut-off score of 3 and cannabis misuse diagnoses on CIDI-Auto 2.1
SDS cannabis-dependence diagnoses (score of 3 or more)
Absent Present
CIDI-Auto cannabis-misuse diagnoses
Absent Present
27 6
1 16
Note. For abbreviations refer to Table 3.3.
Table 3.5 shows that at the cut-off score of 3 SDS scores produced the same table as
the one obtained from logistic regression (Table 3.4), which indicates that this cut-off
score was the most optimal to identify cannabis misuse in this sample. The agreement
83

between cannabis dependence diagnoses on SDS using a cut-off of 3 and cannabis
misuse diagnoses on CIDI-Auto 2.1 was good with a kappa = 0.71.
3.6 Discussion
The results of this study suggest that the substance use module of CIDI-Auto 2.1 has
an acceptable concurrent validity in participants from the general population, including
regular cannabis users. This conclusion can be supported by the following lines of
evidence. Firstly, a significantly larger proportion of participants with the CIDI
cannabis-misuse diagnoses were daily-weekly cannabis users (82%), in contrast to
participants without the CIDI diagnoses (21%), who were predominantly monthly-or-
less users. Indeed, it has been suggested that cannabis dependence may manifest itself
via increased frequency of use (daily-weekly use) rather than an absolute amount of use
(American Psychiatric Association, 1994; Solowij, 1998). Secondly, participants with
the CIDI diagnoses reported significantly more lifetime cannabis dependence
symptoms, as reflected by higher SDS scores in this group. The SDS scores were also
86% more likely than chance to correctly identify participants with the CIDI diagnoses.
Even though results of the current study show a high concordance between cannabis
misuse diagnoses on CIDI and SDS, 12% of all participants were assigned cannabis
misuse diagnoses on the CIDI, but not on SDS (Table 3.4). This discrepancy in the
results could have been due to a number of factors. Firstly, a relatively low number of
individual cannabis abuse and dependence diagnoses were generated in the present
study (Table 3.2). Thus, the cannabis dependence diagnoses on SDS were compared
with cannabis dependence and/or abuse diagnoses on the CIDI. Some authors argue
that abuse and dependence are closely related constructs with abuse being a mild form
of dependence (Feingold & Rounsaville, 1995). However, others suggest that substance
abuse and dependence are mutually exclusive classifications with dependence being
often classified by greater severity, physiological dependence, and compulsive use
84

(Drake et al., 1996). Thus, on the one hand, the high overall agreement between SDS
and CIDI diagnoses in the present study supports the argument that cannabis abuse and
dependence are closely related. Similarly, the last 12-month dependence and abuse
criteria, generated by a modified version of the CIDI (using DSM-IV and ICD-10
criteria), loaded onto a single factor in a large Australian community study (Teesson,
Lynskey, Manor, & Baillie, 2002). Furthermore, SDS was predictive of the CIDI
diagnoses of cannabis dependence or abuse in an unpublished study of patients with
schizophrenia (Hides et al., in Dawe et al., 2002). However, the 12% rate of false-
positive cases in the present study supports the notion that the two diagnostic systems
may in fact represent two mutually exclusive classifications. To clarify this issue
further, the agreement between dependence scores on SDS would need to be
investigated separately for participants with CIDI abuse and CIDI dependence
diagnoses. If cannabis abuse and dependence represent two mutually exclusive
classifications then the agreement between SDS- and CIDI-generated cannabis
dependence diagnoses would be expected to be even higher than the agreement between
dependence (SDS) and abuse and/or dependence (CIDI) observed in the present study
(86%).
Secondly, the discrepancy between SDS and CIDI could be due to the two
instruments measuring different aspects of dependence construct. While SDS seems to
measure how much the user is concerned about their use, the DSM-IV, similarly to
DSM-III-R, and ICD-10, may assess other behavioural and physiological aspects of
dependence (Didcott et al., 1997). In general, dependence upon substances can be
measured in terms of behavioural factors, such as loss of control over use, difficulty
stopping, continued use despite adverse health and personal effects, and physiological
factors, including withdrawal and tolerance (Swift et al., 1998a). The very existence of
cannabis dependence has been controversial since the 1960s; however, there is general
85
consensus suggesting that cannabis dependence does exist (Hall et al., 1994). In
addition, it is likely that cannabis dependence has multiple dimensions, some of which
may be different to dependence on other substances, thus making the measurement of
cannabis dependence a difficult task (Swift et al., 1998a). Specifically, the
physiological aspects of cannabis dependence are less well defined than the behavioural
aspects of cannabis dependence (Swift et al., 1998a). SDS does not address
physiological aspects of dependence, because it was designed to measure dependence
upon substances like cannabis, which do not have a clearly defined withdrawal
syndrome (Gossop et al., 1995). Such differences between behavioural and
physiological criteria being unequally addressed by SDS and CIDI could account for
discrepancies in the results of the current study.
Thirdly, the differences between DSM-IV and ICD-10 diagnostic systems may have
contributed to the discrepancy between the results of the current study. Similarly to
other studies (Andrews & Slade, 1997; Cottler et al., 1991), CIDI assigned significantly
more DSM-IV than ICD-10 diagnoses (Table 3.2). It has been suggested that DSM-IV
has broader diagnostic criteria than ICD-10 (Cottler et al., 1991). Also, while the
criteria for dependence diagnoses are similar between the two diagnostic systems,
DSM-IV and ICD-10 differ in terms of criteria for abuse/harmful use diagnoses
(Andrews & Slade, 1997). Specifically, the criteria for abuse diagnoses include
substance-related adverse social consequences on DSM-IV and substance-related
physical or psychological harm on ICD-10 (Andrews & Slade, 1997). These similarities
and differences between the two diagnostic systems were confirmed by a number of
studies. For instance, three Australian studies showed agreement in the prevalence of
cannabis dependence on DSM-IV and ICD-10 in the last 12 months (Swift et al., 2001),
and in the lifetime (Andrews & Slade, 1997; Swift et al., 1998a). However, while the
two sets of criteria seemed to measure a unidimensional construct of dependence, the
86
studies showed only a modest agreement between DSM-IV and ICD-10 diagnoses of
abuse/harmful use (Andrews & Slade, 1997; Swift et al., 2001). In the current study,
the DSM-IV and ICD-10 cannabis-misuse diagnoses (generated by the CIDI) were
compared with SDS dependence-diagnoses, which seems to measure cannabis
dependence according to the DSM-IV diagnostic criteria only (Ferri et al., 2000; World
Health Organization, 1997b). It may be the case that the CIDI, using the two diagnostic
systems, may have been over-inclusive in comparison to SDS, using the DSM-IV
diagnostic criteria alone. In fact, CIDI-Auto 1.1 assigned more diagnoses of substance
misuse disorders than clinicians in acutely hospitalised psychiatric patients (Rosenman
et al., 1997a). Thus, the inclusion of ICD-10 diagnoses and the differences between
DSM-IV and ICD-10 diagnoses of abuse/harmful use generated by the CIDI may have
contributed to the discrepancy between the results in the present study. On the other
hand the CIDI did not assign cannabis misuse diagnoses to 25% of daily cannabis users
(Table 3.3). Therefore, it is unlikely that the CIDI was over-inclusive. Thus, it appears
that frequency of use alone may not be sufficient to diagnose a cannabis user with
cannabis dependence syndrome.
Fourthly, a cut-off score of 3 on SDS may have contributed to the apparent
discrepancy between cannabis-misuse diagnoses generated by the two instruments. In
general, the choice of a cut-off score depends on the purpose for which the test is being
used (Rey, Morris-Yates, & Staanislaw, 1992; Swift et al., 1998b). For instance,
sensitivity should be high in screening tests, as false positives are usually of less
consequence than false negatives. High specificity is required in treatment studies to
avoid treating participants without the disease. Previous research has shown that the
most optimal SDS cut-off for cannabis dependence in research setting was a score of 3,
even though at such a score SDS had a low sensitivity of 64% and a moderate
specificity of 82% when discriminating between regular cannabis users with and
87
without at least moderate DSM-III-R cannabis-dependence diagnoses obtained from a
modified version of the CIDI, CIDI-SAM (Swift et al., 1998b). These results suggest
that SDS can identify only 64% of participants with a cannabis dependence diagnosis
compared to DSM-III-R criteria for cannabis dependence. Other studies have shown
that SDS with an even higher cut-off score of 4 or more also identified less than a third
as many (15%) as dependent in comparison to DSM-III-R and ICD-10 criteria (Didcott
et al., 1997). In the current study, the sensitivity of 73% at the score of 3, even though
higher than previously reported, nevertheless may have been insufficient to assign
cannabis dependence diagnoses to all participants with the CIDI cannabis-misuse
diagnoses. Thus, it may have been more appropriate to choose a cut-off score of 2 with
sensitivity of 82%. However, the specificity of SDS would decrease at this cut-off score.
Finally, any discrepancies in the results of the current study could have been due to
misreporting of cannabis use by the participants. However, this issue was explored in
Chapter 2 and it appears that cannabis use was reported accurately in terms of most
recent use (last 24 hours), last 12-month use, and lifetime use. Thus, it appears unlikely
that participants correctly reported their cannabis use on all instruments, but the CIDI.
In conclusion, this study demonstrates that the substance use module of the CIDI-
Auto 2.1 has acceptable concurrent validity in terms of cannabis misuse diagnoses.
However, due to the fact that CIDI-Auto 2.1 did not identify all participants with the
cannabis dependence diagnoses on SDS, the diagnoses generated by the CIDI-Auto may
need to be confirmed using other sources of information. Further studies are also
needed to determine the agreement between the substance-misuse diagnoses generated
by CIDI-Auto 2.1 and by clinicians. The results of this study generally support the use
of CIDI-Auto 2.1 to screen for substance misuse disorders in research participants from
the general population not involved in drug treatment programs.
88
CHAPTER 4. EFFECTS OF CHRONIC CANNABIS USE
ON ATTENTIONAL MODULATION OF PREPULSE
INHIBITION OF THE STARTLE REFLEX IN HUMANS
4.1 Preface
The main aim of the study was to assess the physiological effects of cannabis use on
brain function. Specifically, this chapter will explore the relationship between chronic
cannabis use and a biological measure of brain function, prepulse inhibition of the
startle reflex (PPI), which has been found to be deficient in schizophrenia and related
disorders.
4.2 Abstract
Background. Various studies show that cannabis use alters attention and cognitive
functioning in healthy humans and may contribute to development of schizophrenia or
worsening of pre-existing psychosis. Schizophrenia is associated with a deficit in
prepulse inhibition (PPI), the normal inhibition of the startle reflex by a non-startling
stimulus (termed the prepulse). Such PPI deficit is thought to provide a biological
marker of sensorimotor gating dysfunction in schizophrenia, although PPI dysfunction
in schizophrenia is also mediated by attention. Specifically, during instructed
attentional studies PPI deficit is observed when patients attend to the prepulses
presented shortly before the startle stimuli, but not when they ignore them in contrast
to healthy controls. Thus, the aim of the current study was to investigate the effects of
self-reported chronic cannabis use on PPI in healthy controls and patients with
schizophrenia attending to and ignoring stimuli producing PPI. Furthermore, the
effects of cannabis use associated with other startle reflex modulators, including
prepulse facilitation of the startle reflex magnitude (PPF) and onset latency, and
89

habituation of the startle reflex magnitude, were examined. Method. Auditory-evoked
electromyographic signals were recorded from orbicularis oculi muscles in chronic
cannabis users (29 healthy controls and 5 schizophrenia patients) and non-users (22
controls and 14 patients). The data for 36 participants (12 non-user controls, 16
healthy cannabis users, and eight non-user patients) were used in the final analyses and
the patient data were used as a pilot study, because relatively few participants met the
rigorous exclusionary criteria. Participants were instructed to attend to or to ignore
either startle stimuli alone (70 – 100 dB) or prepulses (70 dB) and startle stimuli (100
dB) separated by short lead-time intervals (20 – 200 ms) and long lead-time intervals
(1600 ms). Results. In contrast to controls, cannabis use in healthy humans was
associated with a reduction in %PPI similar to that observed in schizophrenia while
attending to stimuli, and with an attention-dependent dysfunction in startle habituation.
There were no statistical differences in PPI between cannabis users and controls while
ignoring the stimuli. However, PPI in cannabis users tended to differ from that of the
patients while ignoring prepulses. The reduction of PPI in cannabis users was
correlated with the longer total duration of cannabis use and was not associated with
the acute use (no correlation with the concentration of cannabinoid metabolites in
urine or with the time of cannabis use in the preceding 24 hours). Furthermore,
cannabis use was not associated with differences in PPF, startle latency facilitation,
and startle magnitude in the absence of prepulses. Conclusions. These results suggest
that chronic, but not acute, cannabis use is associated with schizophrenia-like
disruption of PPI in healthy controls. Such reduction in PPI is related to attentional
dysfunction rather than a global deficit in sensorimotor gating.
4.3 Introduction
Various studies suggest that chronic cannabis use could contribute to development of
schizophrenia or worsen pre-existing psychosis (the causation hypothesis; for review
90

see Chapter 1). Others hypothesise that cannabis could be used to self-medicate various
aspects of the illness and/or the side effects of antipsychotic medications (self-
medication hypothesis). The third alternative is that other factors, such as genetic
vulnerability, similar age of onset of cannabis use and schizophrenia, and social
marginalisation, contribute to the apparent link between the two disorders (common
cause hypothesis). Apart from psychosis, acute and chronic cannabis use is also
associated with disruption in attention, short-term memory, and other cognitive
processes in healthy humans (Solowij, 1998). Regardless of the evidence supporting the
effects of cannabis use on mental health and cognitive function, it is not well understood
how cannabis modifies physiology of the brain.
One marker of brain function in living humans is prepulse inhibition of the startle
reflex (PPI). PPI refers to the normal inhibition of the startle reflex magnitude by non-
startling stimulus (prepulse) presented prior to the startle stimulus at short time intervals
(called lead-time intervals) of approximately 30 – 500 ms (Graham, 1975). At long
lead-time intervals (1000 ms or greater) prepulses tend to increase the startle magnitude
in the process of prepulse facilitation, PPF (Graham, 1975). In humans, PPI/PPF can be
assessed non-invasively by measuring the inhibition/facilitation of electromyographic
(EMG) signal from the orbicularis oculi muscle with surface electrodes (Berg &
Balaban, 1999).
PPI is of interest because it has been shown to be reduced in patients with
schizophrenia relative to healthy controls, although similar reductions in PPI have been
observed in schizotypal patients, and healthy family members of schizophrenia patients
(for review refer to Chapter 1). Reductions in PPI, as seen in schizophrenia, seem to
reflect a deficit in sensorimotor gating mechanism. Specifically, the prepulse is thought
to protect the brain from sensory overload by reducing (‘gating’) the impact of the
subsequent event, such as the startle stimulus (Braff & Geyer, 1990). A failure in such
91

a process may result in flooding by sensory stimuli and development of psychosis (Braff
& Geyer, 1990). However, the reduction in PPI in schizophrenia may be secondary to
attentional dysfunction, because patients with schizophrenia show a reduction in PPI
when attending to prepulses, but not when ignoring them during instructed studies
(Dawson et al., 1993; Dawson et al., 2000).
A schizophrenia-like reduction in PPI can also be induced in rats and in healthy
humans with various behavioural and pharmacological treatments. Firstly, PPI can be
reduced in adult rats by factors implicated in the development of schizophrenia, such as
social isolation during weaning (Powell & Geyer, 2002) and corticosteroid hormone
administration during the neonatal period (Reid-Milligan, 2002).
Secondly, depending on a dose, PPI can be reduced in rats and healthy humans by
drugs affecting neurotransmitters implicated in schizophrenia, such as dopamine
agonists and drugs that affect glutamate, GABA, and serotonin neurotransmission (for
review see Geyer, Krebs, Braff, & Swerdlow, 2001). Atypical neuroleptics also seem to
reverse PPI deficits in patients with schizophrenia in some studies (refer to Discussion
section).
Thirdly, substances of abuse, such as amphetamine (Hutchison & Swift, 1999;
Kumari et al., 1998) and PCP (Linn & Javitt, 2001; Mansbach & Geyer, 1989), also
induce a schizophrenia-like deficit in PPI. In contrast, other substances, such as
nicotine tend to increase PPI in rats and humans (Della Casa et al., 1998; Duncan et al.,
2001; Kumari et al., 1996) or decrease PPI in more dependent users and users of
stronger cigarettes (Hutchison et al., 2000; Kumari & Gray, 1999b).
While the above evidence indicates that substances of abuse either reduce or increase
PPI in humans, the reported effects of cannabis on PPI are conflicting in animals and
have not been investigated in humans to date. In rats, acute administration of
cannabinoid agonists either increased PPI (Stanley-Cary et al., 2002) or reduced PPI
92

(Mansbach et al., 1996; Schneider & Koch, 2002). The chronic treatment of pubertal
rats with cannabinoid agonist also reduced PPI in adult rats (Schneider & Koch, 2003).
These conflicting results are likely to be due to differences between the studies in terms
of species, doses, agonists, and stimulus parameters used.
The aim of the present study was to investigate the effects of cannabis use on PPI, as
a measure of physiological brain function, in living humans. The participants included
self-reported, voluntary cannabis users and non-users, including psychiatrically healthy
people and patients with schizophrenia. The effects of cannabis use on PPI were
determined in terms of either acute use, assessed by the recency of use in the last 24
hours and the concentration of cannabinoid metabolites in urine, or chronic use,
measured by the total length of use (daily to less than monthly use) for at least one year
since the testing session.
The effects of cannabis use on PPI could be confounded by a number of factors.
Firstly, any cannabis effects on PPI in humans could be secondary to cannabis-induced
modulation of attention (Solowij, 1998), which normally alters PPI. Specifically,
attending to prepulse stimuli increases PPI in healthy controls relative to ignoring the
stimuli and depending on the lead-time interval (Dawson et al., 1993; Dawson et al.,
2000). Such attentional modulation of PPI is not observed in patients with
schizophrenia (Dawson et al., 1993; Dawson et al., 2000). Therefore, participants in the
current study were asked to either attend to or to ignore auditory prepulse and startle
stimuli to investigate the effects of cannabis use on attentional modulation of PPI. It
was hypothesised that similarly to rats chronically treated with cannabinoid agonists,
chronic cannabis use in healthy humans, assessed by the total duration of use, would be
associated with reduction in PPI. Furthermore, similarly to patients with schizophrenia,
the reduction in PPI would be observed while attending to auditory stimuli, but not
when ignoring them. Cannabis-using patients were expected to show an even larger
93

deficit in PPI in contrast to non-using patients if the effects of cannabis use and
schizophrenia on PPI were additive. Furthermore, it was expected that if cannabis use
alters attention then cannabis users, would either not show attentional modulation of PPI
similarly to schizophrenia patients, or show attentional modulation of PPI different to
that seen in controls.
Secondly, the effects of cannabis use on PPI could result from cannabis alteration of
attentional modulation of the startle reflex magnitude on trials when prepulses are not
presented (Startle Stimulus Alone Trials). Specifically, any effects of cannabis use on
attentional modulation of the startle reflex magnitude in the absence of prepulses could
affect PPI if PPI is expressed as a difference score between startle reflex magnitude on
trials with and without the prepulse. However, to the author’s knowledge, studies do
not report the effects of attention on the startle reflex magnitude in the absence of
prepulses either in controls or in patients with schizophrenia. Furthermore, chronic
treatment with cannabinoid agonists had no effects on the startle reflex magnitude in the
absence of prepulses in rats (Schneider & Koch, 2003), while acute treatment with
cannabinoids had either no effects (Schneider & Koch, 2002) or reduced the startle
reflex magnitude depending on a dose (Mansbach et al., 1996; Martin et al., 2003).
Therefore, one aim of the study was to investigate the effects of cannabis use on
attentional modulation of the startle reflex magnitude on Startle Stimulus Alone Trials
in all groups. It was hypothesised that, similarly to the chronic treatment with
cannabinoids in rats, cannabis use would have no effects on the startle reflex magnitude
in the absence of prepulses in humans. However, if cannabis use alters attention then
attentional modulation of the startle reflex magnitude may differ between cannabis users
and non-users. Specifically, similarly to attentional modulation of PPI, controls may
show an increase in the startle reflex magnitude when attending relative to ignoring the
94

startle stimuli on the Startle Stimulus Alone Trials, while patients and cannabis users
may show no attentional modulation of the startle reflex magnitude.
Thirdly, cannabis modification of PPI could depend on the intensity of the startle
stimuli. In general, the startle reflex magnitude increases with increase in the startle
stimulus intensity (Blumenthal et al., 1996a; Blumenthal, 1996b). However, to the
author’s knowledge, studies do not report the effects of attention on the startle reflex
magnitude at different startle stimulus intensities either in controls or in patients with
schizophrenia. Furthermore, there are no animal studies of the effects of cannabinoids
on the startle reflex magnitude at various startle stimulus intensities. Similarly to
potential effects of cannabis use on the startle reflex magnitude when prepulses are not
presented, any effects of cannabis use on the startle reflex magnitude at different startle
stimulus intensities could confound the PPI data. Therefore, one aim of the current
study was to determine if there were any effects of cannabis use and schizophrenia on
the attentional modulation of the startle reflex magnitude using multiple startle stimulus
intensities on Startle Stimulus Alone Trials. It was hypothesised that all groups, would
show an increase in the startle reflex magnitude with an increase in the startle stimulus
intensity if cannabis use and schizophrenia have no effects on the startle stimulus
reactivity.
Apart from PPI, cannabis use could also affect other aspects of the startle reflex
modification, such as PPF and habituation of the startle reflex magnitude. In contrast to
PPI, deficits in PPF and magnitude habituation, have not been consistently described in
schizophrenia (for review refer to Chapter 1). Similarly, the effects of cannabinoids on
PPF are unknown in rodents, while an acute treatment with non-opioid analgesic related
to cannabinoids (levonantradol) impaired habituation of tactile startle reflex in rats
(Geyer, 1981). In general, PPF is thought to provide a measure of conscious and
modality-specific selective attention (Anthony, 1985b; Graham, 1975). In healthy
95

controls PPF increases when attending to relative to ignoring the prepulses while
schizophrenia patients show a lack of attentional modulation of PPF (Dawson et al.,
1993; Dawson et al., 2000). Selective attention is also altered in cannabis users in terms
of allocation of attentional resources and stimulus evaluation (Kempel et al., 2003;
Solowij, 1998). The startle reflex magnitude habituation, which is the normal reduction
in the startle reflex magnitude with repeated presentation of the same startle stimulus, is
also thought to depend on selective attention (Geyer & Braff, 1987), although there are
no studies of the attentional modulation of the startle reflex habituation. It has been
proposed that organisms are able to selectively attend to relevant events by habituating
to stimuli that have no important consequences (Braff et al., 1995). However, while
habituation can contribute to selective attention, it is not a measure of selective
attention. Instead, habituation is thought to represent the simplest form of learning
(Kandel et al., 1995) and is dependent on memory (Staddon et al., 2002), which is
impaired in cannabis users (Solowij, 1998). Furthermore, habituation may contribute to
reduction in PPI (Blumenthal, 1997; Lipp & Krinitzky, 1998a), thus providing a
potential confound factor in studies of PPI. Therefore, another aim of the current study
was to investigate the effects of chronic cannabis use on attentional modulation of PPF
and startle reflex magnitude habituation. It was hypothesised that, if cannabis use
impairs selective attention then cannabis users would show attentional modulation of
PPF different to that seen in controls or lack of attentional modulation observed in
schizophrenia patients. Furthermore, if cannabis use impairs short-term memory then
cannabis users would exhibit abnormal startle reflex habituation similar to that observed
in rats treated with cannabinoids. Finally, if cannabis use affects attentional modulation
of the startle reflex habituation differently to schizophrenia then the habituation would
differ between controls, cannabis users, and schizophrenia patients.
96

In addition to modulation of the startle reflex magnitude, prepulses also facilitate
(reduce) the onset latency of the startle reflex at both short and long lead-time intervals
(Graham, 1975). While the function of such process is not well understood it appears
that facilitation of the startle latency and inhibition/facilitation of startle magnitude
(PPI/PPF) may be controlled by different neural mechanisms (Graham, 1975). Some
argue that the lack of latency facilitation by the prepulse could be seen as evidence for
failure to detect prepulses or a more generalised deficit in auditory processing (Braff et
al., 1992). Some studies support this hypothesis in that startle latency modulation by
prepulse was deficient in schizophrenia (Braff et al., 1978), while others have not found
any deficits in startle reflex latency facilitation in schizophrenia (Parwani et al., 2000).
Similarly to subgroups of patients with schizophrenia, cannabis users could exhibit
some attention-modulated deficits in detection and processing of sensory stimuli. Thus,
the last aim of the study was to investigate the effects of chronic cannabis use on
facilitation of the startle onset latency and compare such effects with effects of chronic
cannabis use on inhibition/facilitation of the startle reflex magnitude (PPI/PPF). It was
hypothesised that cannabis use may have differential effects on PPI/PPF of startle
magnitude and facilitation of startle latency if the two processes are controlled by
different neural mechanisms.
4.4 Methods
4.4.1 Participants
Details about participant recruitment can be found in Chapter 2. Briefly, following
signing a written informed consent, 70 participants randomly recruited from the general
community and from in- and out-patients at a primary psychiatric hospital (Graylands
Hospital) in Perth, took part in this study. Using yes/no-answer questions none of the
participants reported hearing, neurological, substance use, and other mental disorders,
97

and schizophrenia in their first-degree relatives, because healthy relatives of
schizophrenia patients often show reductions in PPI (Cadenhead et al., 2000). All
participants were instructed not to alter their cannabis use on the day of testing (if users)
and to refrain from nicotine (for at least one hour before testing session) and alcohol (on
the day of testing).
The participants were divided into four groups based on cannabis use in the last 12
months (presence or absence) and diagnosis of schizophrenia. The groups were:
• 22 healthy controls, non-users of cannabis in the last 12 months (controls)
• 29 healthy controls, users of cannabis in the last 12 months (cannabis-controls)
• 14 schizophrenia patients, non-users of cannabis in the last 12 months (patients)
• 5 schizophrenia patients, users of cannabis (cannabis-patients).
The controls and cannabis-controls completed a computerised version of a
Composite International Diagnostic Interview, CIDI-Auto version 2.1 (World Health
Organization, 1997b), to eliminate participants with mental illness other than substance
misuse disorders (abuse and/or dependence), because various mental illnesses are
associated with reduction in PPI. The lifetime diagnosis of schizophrenia in patients
was obtained from patients’ case notes and confirmed during a Diagnostic Interview for
Psychoses - Diagnostic Module, DIP-DM (Jablensky et al., 1999), with the author
trained in the use of this instrument. The diagnosis of schizophrenia was not confirmed
in one patient, the data from whom were subsequently excluded from all analyses. Due
to temporary problems with a computer containing the CIDI-Auto 2.1 software
(hardware crash) one cannabis-control also completed DIP-DM. Both instruments, the
CIDI-Auto 2.1 and DIP-DM, have acceptable psychometric properties (refer to Chapters
2 and 3).
98
4.4.2 Cannabis and Other Substance Use Assessment
The details of substance use assessment in the present sample can be found in
Chapter 2. Briefly, verbal self-reports of the most recent use of cannabis, nicotine,
alcohol, amphetamine, cocaine, benzodiazepines, and opiates (hours ago in the last 24
hours) were confirmed with a single urine drug screen. The first 24 urine samples
positive for cannabinoids were also re-analysed to provide a quantitative measure of ∆9-
THC metabolite (carboxytetrahydrocannabinol, in µg/L). Furthermore, the average last
12-month use of cannabis (daily-weekly, monthly/less/none), nicotine (cigarettes/day),
alcohol (standard drinks/week), and caffeine (standard cups/day) was also assessed
using verbal self-reports. All participants were also required to complete Severity of
(Cannabis) Dependence Scale (SDS; Chapter 2), reported the age of their first ever use
of cannabis (in years), and the total duration of cannabis use between the first ever and
last ever use (in years). The CIDI-Auto 2.1 was also used to obtain lifetime diagnoses
of cannabis misuse (abuse and/or dependence; Chapter 3). Self-reports of recent and
past substance use were accurate and consistent, respectively (Chapter 2).
4.4.3 Attentional Tasks, Auditory Stimuli, and Trial Types
The details regarding equipment models and manufacturers mentioned in the
following subsections can be found in Appendix C. The experiment consisted of two
attentional tasks, each 29-min long, separated by a short break with the order of the two
tasks counterbalanced within each group. The instructions on the Attend Task were to
listen to auditory stimuli (startle and prepulse stimuli) presented binaurally via
headphones and sit still in a chair, approximately 70-cm away from a blank computer
screen. On the Ignore Task participants were instructed to ignore all auditory stimuli
and play a handheld computer game (Tetris©-like Block Game). The game was
handheld instead of being presented on the computer screen due to interference with the
timing between presentation of the sound stimuli and presentation of the game. The
99

reason for choosing the computer game as means for diverting attention is addressed in
subsection 4.6.2.
The auditory stimuli, calibrated with a sound level meter prior to each testing
session, were generated by a white noise generator, transmitted to the headphones via a
stereo preamplifier and controlled by the LabView software. The stimuli consisted of:
• background white noise (60 dB)
• startle stimuli (50-ms long bursts of white noise with intensities of 70, 80, 90, and
100 dB and with nearly instantaneous rise and fall times)
• prepulse stimuli (non-startling stimuli consisting of 20-ms long pure tone with a
frequency of 5000 Hz, intensity of 70 dB, and rise and fall times of 5 ms).
In general, the startle reflex is enhanced by a wider bandwidth and longer durations
of startle stimuli and thus a white noise was used as a startle stimulus (Berg & Balaban,
1999). The pure tones were used as prepulses to replicate the methodology of the
original study, which found the PPI deficit in patients with schizophrenia (Braff et al.,
1978).
Each attentional task consisted of 72 trials, each of which was 3000 ms long and
separated by a pseudo-random intertrial interval of 10 – 20 s. The 72 trials consisted of
36 Startle Stimulus Alone Trials and 36 Prepulse and Startle Stimulus Trials. The
startle stimulus was always presented at 2000 ms after the beginning of the trial, while
the prepulse stimuli were presented at six different lead-time intervals, in ms, before the
startle stimuli (Figure 4.1).
100

6 x 70 dB6 x 80 dB6 x 90 dB
18 x 100 dB
36Startle Stimulus
Alone Trials
6 lead-timeintervals
(20, 40, 80,100, 200, 1600 ms)
6 Startle Stimuliat 100 dB
36Prepulse and Startle
Stimulus Trials
72 trials perattentional task(total: 2 x 72)
Figure 4.1 Trial structure and lead-time intervals used in the present study.
The 72 trials were presented in a pseudo-random order during each attentional task.
Specifically, all 72 trials were divided into six blocks of 12 trials:
• 1 × Startle Stimulus Alone at 70, 80, and 90 dB
• 3 × Startle Stimulus Alone at 100 dB
• 1 × Startle and Prepulse Stimulus at 20, 40, 80, 100, 200, and 1600 ms
The order of trials was randomised within each block during each attentional task for
all participants. Therefore, the attentional trials differed in terms of instructions to
participants and the order of presentation of trials within each block.
4.4.4 Startle Reflex Acquisition and Filtering
The acoustic startle reflex was recorded as an increase in EMG signal from the left
orbicularis oculi muscle, which is responsible for eye closure during the eye blink.
Prior to recording, the skin under the left eye and on the left hand was cleaned with an
alcohol swab. Next, two tin-cup surface electrodes (refer to Appendix C.1 for details on
model number and manufacturer) filled with a conductive paste were placed 1 cm
underneath the pupil at a distance of 1 cm apart from each other. The earth electrode
101

was a silver/silver-chloride disposable adhesive patch, which was attached to the left
arm. The EMG signal from the electrodes was transmitted via an AC preamplifier to
the EMG acquisition PC card and subsequently displayed on a PC using LabView 4.1
software. Prior to the experimental trials, the EMG signal was monitored on the screen
for approximately 1 – 5 min, to ensure that the noise level of the signal was low. The
experiment began once the signal reached a steady state (noise range of 0 – 2 arbitrary
units).
The EMG signal was filtered during the experiment using the hardware (AC
preamplifier) and after the experiment using the LabView 4.1 digital software (EMG
processing program; refer to Figure 4.2). The original computer programs used to
acquire and process the EMG data were written by A/Prof Mathew Martin-Iverson, Dr
David Neumann, and substantially modified by the author of this thesis (the processing
program was almost entirely re-written). The summary of the processing program is
included in Appendix C.2.
102

EMG PROCESSING PROGRAM (LabView 4.1) SEMI-AUTOMATED PARTEMG signal displayed for processing on computer screen for operator validation andcorrection of auto-processing (assigning cursors to onset latency, peak latency,and end of reponse). Processed EMG signal saved in a format for statistical analysis
Software filtered, smoothed, andrectified EMG signal in µV
EMG PROCESSING PROGRAM (LabView 4.1) AUTOMATED PARTEMG signal: band-pass filtered between 78 - 200 Hz, smoothed with 2nd orderChebyshev Filter, 400 ms extracted for analysis, rectified (by taking absolute value),converted from digital to metric units (µV)
EMG ACQUISITION PROGRAM (LabView 4.1)EMG signal sampling (1000 Hz) and recording (3000 ms)
EMG ACQUISITION PC CARD WITH SINGLEREFERENCED INPUT LINE
Analog to digital unit conversion and online software timing and control
Hardware-amplified and filteredEMG signal through shielded cable
AC PREAMPLIFIERAmplification and initial hardware filter(EMG signal band-pass filtered between 100 - 1000 Hz and band-stop filtered at 50 Hz)
Analog AC EMG signal
ORBICULARIS OCULI MUSCLE - ELECTRODES
Figure 4.2 Schematic representation of the EMG signal acquisition and filtering.
EMG filtering and sampling theorem. Figure 4.2 shows that the EMG signal was
band-pass filtered using the hardware (100 – 1000 Hz) with a 50 Hz notch (band-stop)
filter added to reduce noise from background 50 Hz electrical fields and the software
(78 – 200 Hz). The reason for using the two filters was to comply with the sampling
theorem, and to include most of the frequency range (75 – 250 Hz) in which most of the
orbicularis oculi signal resides (see below). The theorem states that to reconstruct a
continuous-time signal from discrete, equally spaced samples, the sampling frequency
needs to equal to at least twice the highest frequency in the time signal (Berg &
Balaban, 1999). Adhering to the sampling theorem provides a finer time resolution of
data (Lawrence & De Luca, 1983). In the present study, both the sampling rate and the
103

highest frequency of the EMG signal were 1000 Hz. Thus, the software filter was used
to filter out the EMG signal between 200 – 1000 Hz to keep the highest frequency
below half of the sampling frequency and to reduce the preamplifier noise arising at
frequencies above 250 Hz (Fridlund & Cacioppo, 1986). The 200 Hz high-pass filter
setting was also high enough to keep the majority of the relevant EMG signal from
orbicularis oculi, which normally ranges between 28 – 512 Hz with a peak power
between 78 – 100 Hz (van Boxtel, Boelhouwer, & Bos, 1996). The low-pass filter of 78
Hz, together with the 50 Hz band-stop filter on the AC preamplifier, removed the 50 Hz
noise detectable in the data even when the band-stop filter was used alone.
Furthermore, the EMG signal was smoothed using a second-order low-pass Chebyshev
filter. This filter was chosen over the more common Butterworth filter because the
Chebyshev filter provides equivalent or better filtration characteristics. More
importantly, the Chebyshev filter is less distorted in processing time and, therefore, it
provides more accurate latency measurements. In addition, the distortion in time was
determined empirically, and the final timing of the curve was adjusted to better fit the
rectified signal without digital filtering. Overall, the two stage (hardware and software)
filtering process improved the signal-to-noise ratio of the EMG signal by keeping the
most relevant frequencies and by decreasing a duration distortion between the raw and
the smoothed data.
Determination of conversion factor from digital to metric units. The internal voltage
calibrator on the AC preamplifier was used to determine the conversion factor for the
EMG signal from digital to metric units (µV). Six calibrator settings (0, 10, 20, 50, 100,
and 200 µV) generated six readings (in µV) on five different occasions, separated by
approximately one month each. Standard linear regression was used to investigate the
degree of relationship between the calibrator settings and the corresponding values
produced by the calibrator. The regression equation was obtained using the calibrator
104

settings as the dependent variable and the calibrator readings corresponding to these
settings on all five occasions as the independent (predictor) variable. The analysis
showed that there was a significant linear relationship between inputs from 0 – 200 µV
and the amplified response (F (1, 28) = 1081.1, p < 0.005) with the slope of the line
(adjusted R2 = 0.97) relating the input in µV to the output in arbitrary amplified units.
The unstandardised regression coefficient B was 49.74 µV per arbitrary unit with a 95%
confidence interval of 46.64 – 52.84, which was significantly different from zero; t =
32.9 and p < 0.005. This regression coefficient (B = 49.74) was used as a conversion
factor from digital to metric units (µV). The adjusted R2 statistic was more appropriate
in the current study than the R2 value, because the former provides a better estimate of
the true population value if small sample sizes are used (Pallant, 2001).
Regression assumptions. The regression technique has a number of assumptions,
two of which were relevant to the current study. Firstly, the ratio of sample size to the
number of predictors should be at least 15:1 in social science research (Stevens, 1996).
Other authors suggest larger sample sizes, such as n > 50 + 8m, where m- number of
predictor variables (Tabachnick & Fidell, 2001). In the current study the sample size
was 30 (six readings on five occasions) and there was only one predictor variable.
Secondly, the regression was used in the current study, because the dependent variable
was strongly correlated with the independent (predictor) variable (bivariate Pearson’s
Product Moment Correlation Coefficient r = 0.99, one-tailed, p < 0.0005, n = 30) and no
outliers were identified in the continuous predictor variable (Tabachnick & Fidell,
2001).
4.4.5 Startle Reflex Processing
Processing of the EMG signal representing the startle reflex was done by the author
after all data files were re-coded by a fellow PhD student so that the author did not
105

know which group each data file belonged to. The startle reflex was measured as the
highest peak of the EMG signal following the onset of the startle stimulus (Figure 4.3).
Figure 4.3 Typical EMG signal following presentation of the startle stimulus. The red line represents the unmodified (raw) EMG signal, while the black line represents the smoothed and rectified EMG signal. The three vertical lines represent the onset latency, peak latency and end of startle reflex elicited by the startle stimulus presented at time = 0 ms. The time of 100 ms before the startle stimulus presentation was considered the baseline for determining the threshold, onset latency and end of the startle reflex.
The EMG processing program calculated various parameters of the EMG signal by
automatically assigning three cursors to the signal to mark the onset latency, peak
latency and end of response to the startle stimulus (Figure 4.3). The automated
computer scores were either accepted or overruled by changing the position of cursors.
The parameters assigned to the startle reflex were:
• Baseline magnitude- mean EMG signal, in µV, during 100 ms before the onset of the
startle stimulus.
• Onset magnitude threshold - the mean + 3 SD of baseline magnitude. This threshold
for the onset magnitude was chosen to prevent 99% of spontaneous bursts of EMG
activity to be processed as true responses to the startle stimuli.
106

• Peak magnitude- the maximum EMG signal, which exceeded onset magnitude
threshold, measured from 0 µV to the top of the peak. The typical magnitude of the
acoustic startle reflex is between 50 – 200 µV (Berg & Balaban, 1999).
• Peak area magnitude (AUC magnitude)- another measure of the startle reflex
magnitude between the onset latency and end of response. The AUC magnitude is
more accurate than the absolute peak magnitude as it takes into account magnitude
and duration of the startle reflex.
• Onset latency- the first time point (in ms) that the EMG signal went below the onset
magnitude threshold, moving backwards in time from the peak, + 1 ms. The typical
onset latency of the acoustic startle reflex is between 21 – 120 ms (Berg & Balaban,
1999).
• Peak latency- the time of maximum peak magnitude. Only the onset latency
measure was analysed due to the fact that the peak latency is a more variable
measure and depends on the magnitude of the startle reflex.
• End of response- the first time that the EMG signal fell under the baseline mean
magnitude, moving forwards in time from the peak.
• Duration of response- the time between the onset latency and the end of response.
The startle responses were classified as:
• present- onset latency was between 20 – 150 ms inclusive and the magnitude
exceeded the onset magnitude threshold
• no-response trials (peak magnitude and AUC magnitude of 0 µV)- the EMG signal
had not exceeded the onset magnitude threshold between 20 – 150 ms after the onset
of the startle stimulus and/or the onset latency was longer than 150 ms. The no-
response trials were included in the magnitude analyses and excluded from the
amplitude analyses (see subsection on Statistical Analysis);
107

• undefined (excluded)- onset latency was less than 20 ms (spontaneous eye blink),
onset magnitude threshold was over 20 µV (due to noisy baseline and, therefore,
difficulties in detecting the onset latency and the end of response), or end of response
was longer than 300 ms, suggestive of a voluntary eye blink.
All undefined trials were excluded. The percentage of excluded trials was calculated
according to the following formula:
⎠⎞
⎜⎝⎛
××=
taskslattentiona2 trials72TasksIgnore&Attendonexcluded trialsno.of
100ExcludedTrials%
4.4.6 Participant Exclusionary Criteria
Of the 70 participants, who took part in this study, 34 met at least one of the
following exclusionary criteria:
• lack of confirmation of diagnosis of schizophrenia (one patient)
• completion of only one attentional task due to either refusal to play the Block Game
(one patient) or problems with obtaining a measurable EMG signal (one cannabis-
control)
• urine sample positive for amphetamines and/or benzodiazepines (three cannabis-
controls)
• current treatment with antidepressants (one control, one cannabis-control)
• current (last 12 months) diagnosis of mental illness on CIDI-Auto 2.1 (four cannabis-
controls),
• mean peak magnitude < 10 µV during the Startle Stimulus Alone Trials with 100 dB
startle stimulus on Attend and/or Ignore Tasks (seven controls, four cannabis-
controls, two patients, five cannabis-patients),
• inability to detect substances in urine due to overdiluted urine sample (one patient)
108

• counter-balancing for the order of attentional tasks (two controls, one patient). In
addition, in order to counter-balance the cannabis-control group for order of
attentional tasks, one cannabis-control with a current CIDI-Auto 2.1 diagnosis of
depression was included in the final analyses. This participant had never been
diagnosed or treated for depression and had not met any other exclusionary criteria.
The analyses were repeated without this participant and there were no differences in
results.
The final sample included in the analyses consisted of 12 controls, 16 cannabis-
controls, and eight patients. Due to problems with patient recruitment and high
exclusionary rates, the patient data were treated as pilot findings. The additional
limitation of the patient sample was that the patients were treated with a combination of
medications, including: atypical neuroleptics (6), atypical and typical neuroleptics (1),
typical neuroleptics (1), antidepressants (5), mood stabilisers (2), and anticholinergics
(1). Only one patient was treated with a typical neuroleptic alone. Therefore, due to
medication being a potential confounding factor (see Introduction and Discussion) the
hypotheses about patients could not have been investigated and only the results for PPI
are presented in the Results section, as preliminary data. Similar exclusionary rates
were reported in other pharmacological studies of PPI in healthy humans (for instance,
Swerdlow et al., 2002a). The exclusionary rates are discussed in subsection 4.6.5.
4.4.7 Statistical Analysis
All statistical analyses were performed with SPSS-PC 11.0. The 12 controls and 16
cannabis-controls were matched on a number of discrete and continuous variables.
Furthermore, all non-patient participants included in the study (included-controls) were
matched with all non-patient participants excluded from the study (excluded-controls)
also using a number of discrete and continuous variables.
109

4.4.7.1 Group Matching- Discrete Variables
All discrete variables in the current study were assessed for minimum expected
frequencies using 2 x 2 contingency tables. Variables with all lowest expected
frequencies of more than 10 were compared using chi square tests with Yates’
Continuity Correction (two-tailed, p < 0.05). Variables with at least one lowest
expected frequency of less than 10 were compared using Fisher’s Exact (Probability)
Test (two-tailed, p < 0.05). More details regarding Yates’ Continuity Correction and
Fisher’s Exact Probability Test can be found in Chapter 3.
4.4.7.2 Group Matching- Continuous Variables
The normality of continuous variables was assessed separately for each group using
the Kolmogorov-Smirnov test for goodness of fit. The variables that were normally
distributed were also assessed for homogeneity of variance, using Levene’s test, and, if
variance was homogeneous, were compared using independent samples t-tests (two-
tailed, p < 0.05). The effect size (eta squared, η2) was used to investigate the strength of
associations for all t-tests (refer to Chapter 3).
The variables that violated the assumption of normality were compared using the
non-parametric equivalent of a t-test, Mann-Whitney U-test (two-tailed, p < 0.05).
The analyses of discrete and continuous variables (reported in Table 4.2, Results
subsection 4.5) revealed that controls and cannabis-controls were matched on all
variables except for the number of cigarettes per day and the number of alcoholic drinks
per week and the frequency of nicotine users. Therefore, the two continuous variables
(number of cigarettes per day and number of alcoholic drinks per week) were used as
covariates in the startle reflex analyses described below. The issue of higher proportion
of nicotine users in the cannabis-control group is addressed in the Discussion subsection
4.6.5.
110

4.4.7.3 Correlations among Measures of Startle Reflex Magnitude
A number of measures of size of the startle reflex were obtained during the study.
These included absolute peak magnitudes and amplitudes, and AUC amplitudes and
magnitudes. The magnitude measures included the no-response trials (zero trials),
while amplitude measures included non-zero response trials only (Berg & Balaban,
1999). The AUC magnitude was chosen for the final analyses as it is the most accurate
measure of the size of the startle reflex taking into account not only the absolute size of
the peak (peak magnitude/amplitude), but also the duration of the peak. The mean AUC
magnitude for all lead-time intervals was also highly correlated with the other mean
measures of startle reflex size at all lead-time intervals (Table 4.1) showing that all
measures of the startle reflex size were similar.
Table 4.1 Correlations among measures of the startle reflex size (absolute peak amplitudes/magnitudes and AUC amplitudes/magnitudes)
Mean peak size
Peak amplitude
Peak magnitude
AUC amplitude
AUC magnitude
Peak amplitude
– 0.98** 0.99** 0.97**
Peak magnitude
– 0.98** 0.99**
AUC amplitude
– 0.98**
AUC magnitude
–
Note. All variables in this table violated at least one assumption underlying the use of parametric bivariate Pearson’s Product Moment Correlations, namely: normality, linearity, and homoscedasticity, assessed according to steps specified in Chapter 2. Thus the data were analysed using the non-parametric equivalent to Pearson’s Product Moment Correlations, bivariate Spearman Rank Order correlations (one-tailed, p < 0.05, rho coefficients reported in this table). Sample sizes for all correlations are n = 28. AUC- peak area (area under curve). **p < 0.0005
111

4.4.7.4 Startle Reflex Analysis
Dependent variables. The dependent measures of the startle reflex were the peak
magnitude (AUC magnitude in µV), percent peak magnitude modification (%PPM), and
onset latency (ms). The %PPM was calculated according to the following formula:
⎥⎦
⎤⎢⎣
⎡⎟⎟⎠
⎞⎜⎜⎝
⎛×−−=
TrialsAlone Stimulus Startleonmagnitude AUCTrials StimulusStartle & Prepulseonmagnitude AUC100100PPM%
The positive values of %PPM indicate prepulse facilitation, %PPF, and the negative
values indicate prepulse inhibition, %PPI. Expressing the absolute magnitude as
percentage separates the effects of independent variables (cannabis and attention) on
PPI and PPF from the effects of independent variables on the absolute peak magnitude
(Hutchison & Swift, 1999; Jennings, Schell, Filion, & Dawson, 1996; Mansbach et al.,
1988).
GLM ANCOVA with repeated measures. The main effects of cannabis use, attention,
lead-time intervals, and interactions among these variables on each of the three
measures (AUC magnitude, %PPM, and onset latency) were tested using the General
Linear Model (GLM) analysis of covariance (ANCOVA) with repeated measures. The
ANCOVAs were conducted using the following factors:
1. between-subjects factor = cannabis use (2 levels- user and non-user)
2. within-subject factors:
• attention (2 levels- Attend and Ignore Tasks)
• startle stimulus intensity (4 levels- 70, 80, 90, 100 dB)
• lead-time interval (7 levels- 0- Startle Stimulus Alone Trial, 20, 40, 80, 100, 200,
1600 ms)
• block (2 levels- first and last 18 trials on each attentional task)
3. covariates = number of cigarettes per day and number of alcoholic drinks per week.
112

Planned pairwise comparisons. The individual means for each dependent variable
were compared using planned pairwise comparisons with multiple F-tests (two-tailed, p
< 0.05). The planned pairwise comparisons were as follows:
1. startle reflex magnitude on the Startle Stimulus Alone Trials
• in controls vs. cannabis-controls during each attentional task (Attend and Ignore)
at each startle stimulus intensity (70, 80, 90, and 100 dB)
• on Attend Task vs. Ignore Task at each startle stimulus intensity in each group
(controls and cannabis-controls)
• with startle stimulus intensity of 100 dB vs. each other startle stimulus intensity
during each attentional task in each group
• at block 1 vs. block 2 during each attentional task in each group
2. startle reflex magnitude on the Prepulse and Startle Stimulus Trials
• in controls vs. cannabis-controls during each attentional task at each lead-time
interval (0- Startle Stimulus Alone Trial, 20, 40, 80, 100, 200, 1600 ms)
• on Attend Task vs. Ignore Task at each lead-time interval in each group (controls
and cannabis-controls)
• with lead-time interval of 0 ms (Startle Stimulus Alone) vs. each other lead-time
interval during each attentional task in each group
• block 1 vs. block 2 at short lead-time intervals (mean 20 – 200 ms) and at long
lead-time intervals (mean 1600 ms) during each attentional task in each group
3. %startle reflex magnitude (%PPI and %PPF) on the Prepulse and Startle Stimulus
Trials
• controls vs. cannabis-controls at short lead-time intervals (mean 20 – 200 ms) and
at long lead-time intervals (mean 1600 ms) during each attentional task
4. startle reflex onset latency on the Prepulse and Startle Stimulus Trials
113

• in controls vs. cannabis-controls during each attentional task at each lead-time
interval
• on Attend Task vs. Ignore Task at each lead-time interval in each group (controls
and cannabis-controls)
• with lead-time interval of 0 ms (Startle Stimulus Alone) vs. each other lead-time
interval during each attentional task in each group
Multiple F-test critical difference. The critical difference (CD) as determined by the
multiple F-test was used to determine significance among the planned pairwise
comparisons and was calculated according to the following formula:
nMSFCD error
crit ××= )2( (Kiess, 1989), where:
Fcrit- critical (multiple) F-test with p < 0.05 and one degree of freedom in the numerator and degrees of freedom associated with an overall error for within-subject effects in the denominator (1, dferror)
MSerror- appropriate error term from the ANOVA. Note that even if the assumption of sphericity is violated for the within-subjects main effects, the CD is calculated for the difference between only two means and thus MSerror used to calculate the CD always meets the assumption of sphericity
n- number of participants in each group- if n is unequal between the two groups then harmonic mean (hm) should be used instead of n. The hm was calculated according to the following formula:
⎟⎠⎞
⎜⎝⎛ ++
=
k
m
nnn
kh111
21
(Glass & Stanley, 1970), where:
k- number of groups n1,2,k- sample size of group 1, 2, to k hm in the present study = 13.71 (n1 = 12, n2 = 16)
The CD is similar to Bonferroni test in that it adjusts the significance of multiple
pairwise comparisons (within-subject effects) and thus protects against an inflated rate
of Type I errors (Kiess, 1989), and if the planned comparison predicts a specific
direction, then the probability of a Type I error is decreased further. However, in
addition to Bonferroni, the CD also specifies the minimum difference between two
114

treatment means (between-subject effects) that is statistically significant at the chosen
alpha level (Kiess, 1989). If a difference between two means is larger than the CD then
the two means differ significantly for either the within-subject comparisons or between-
subject comparisons (Kiess, 1989). Furthermore, it is appropriate to use CD even if the
overall ANOVA is not significant (Kiess, 1989). This is especially true for ordinal
interactions, since ANOVA is not sensitive to this kind of interaction, even when present
(Strube & Bobko, 1989). The strength of the multiple F-test is that it uses the pooled
variance (between- and within-subject); thus, only one estimate of the variance is used,
rather than multiple estimates as with the various post-hoc modified t-tests. The pooled
variance also is the potential drawback of the multiple F-test, if there is a significant
heterogeneity of variances amongst the cells. In this case, pairwise comparisons
between means with high variance will result in a bias towards Type I errors, and
pairwise comparisons between means with relatively low variance will result in a Type
II error bias. Thus, the multiple F-test is appropriate when there is homogeneity of
variance.
Assumptions for GLM ANCOVA with repeated measures. The GLM ANCOVA with
repeated measures and with a univariate approach comprises of assumptions for
univariate GLM ANOVA, repeated measures GLM ANOVA, and GLM ANCOVA. The
assumptions for all these methods are as follows.
1. Independence of observations. This assumption was adopted with as much
confidence as can occur in recruitment of human participants.
2. Normality. Normality applies to the sampling distribution of means of variables
rather than the raw scores for each variable (Tabachnick & Fidell, 2001). The
sampling distribution of means should be normal regardless of the distribution of
individual variables according to the Central Limit Theorem (Tabachnick & Fidell,
115

2001). Normality was assumed for all sampling distributions of variable means used
in this study.
3. Homogeneity of variance was tested using Levene’s test. In general, F-test is robust
against heterogenous variances when group sizes are either equal or the ratio of the
largest to the smallest group is 1.5 or less (Stevens, 1996). In this study the ratio of
group sizes was 1.33 (16:12).
4. Sphericity was assessed using Mauchly’s W-test. Presence of sphericity (the value of
Mauchly’s W-test close to 1.0 with p > 0.05 ) suggests that the variance of difference
scores for any two conditions is the same as the variance of the difference scores for
any other two conditions (Stevens, 1996). When the assumption of sphericity is not
met (the value of Mauchly’s W-test is close to 0.0 with p ≤ 0.05) then the F-test is
positively biased and thus the null hypothesis is falsely rejected too often (Stevens,
1996). If the assumption of sphericity was violated then a correction factor, called
the Greenhouse-Geisser epsilon, was used to adjust degrees of freedom for the
significance of the F values. This correction factor provides a conservative
adjustment with respect to Type I and Type II errors relative to other adjustment tests
available in SPSS (Stevens, 1996). In general, the Greenhouse-Geisser epsilon
should be used if n < k + 6, where n = sample size (in case of the present study it is
the harmonic mean of n) and k = the number of repeated measurements (Vasey &
Thayer, 1987). Furthermore, it has been suggested that the Greenhouse-Geisser
epsilon can be used only for ANOVAs with groups of equal sizes (Keselman, 1998).
However, this problem is not applicable because SPSS uses a Type III adjustment for
the sum of squares (and thus mean square) in ANOVAs and ANCOVAs (SPSS-PC
Version 11.0, 2001).
5. Homogeneity of variance-covariance matrices (homogeneity of inter-correlations)
was assessed using Box’s M-Test. This assumption extends the assumption of
116
sphericity in the within-subject design to the between- and within-subject design.
Thus the assumption is met when for each level of the between-subject variable the
pattern of inter-correlations among the levels of the within-subject variable is the
same (Stevens, 1996). Similarly to homogeneity of variance, homogeneity of
variance-covariance matrices is met if group sizes are either equal or the ratio of the
largest to the smallest group is 1.5 or less (Stevens, 1996), as was the case in the
present study. The Box’s M-test is very sensitive and a more conservative alpha
level of 0.001 should be used (Pallant, 2001). The assumption of homogeneity of
variance-covariance is met either if Box’s M-test is not significant (p > 0.001) or if
there are fewer than two non-singular cell covariance matrices (Box’s M-test is not
conducted in such instance).
6. Linearity between the two covariates was assessed roughly with scatterplots
(Tabachnick & Fidell, 2001). The linearity between each covariate and each level of
each dependent variable was assumed based on the linear relationship between the
two covariates. In general, the power to detect individual relationships among each
covariates and dependent variables would be compromised due to a large number of
levels of each dependent variable.
7. Multicollinearity of covariates. This assumption requires that multiple covariates
should not be strongly correlated with each other. In general, if the correlation is
higher than r = 0.80 then one of the covariates should be removed, as such highly
overlapping covariates do not contribute to a reduction in error variance (Stevens,
1996). To assess the multicollinearity of the covariates (number of cigarettes per day
and number of alcoholic drinks per week), which were not normally distributed
according to the Kolmogorov-Smirnov test for goodness of fit, the covariates were
correlated using non-parametric equivalent to bivariate Pearson’s Product Moment
Correlation, bivariate Spearman’s Rank Order Correlation (one-tailed, p < 0.05).
117
The resulting rho = 0.49, with p = 0.004 and n = 28, was sufficiently low (less than
0.80) to assume that multicollinearity was not violated and thus allowing to keep
both covariates in the final analyses.
8. Homogeneity of regression. This assumption requires that the relationship between
covariates and dependent variable for each group is the same (Stevens, 1996). Thus,
there should be no interactions between independent variables and covariates for
ANCOVA to be valid (Tabachnick & Fidell, 2001). The interactions among the
covariates and the dependent variables were tested concurrently with the main effects
and interactions among the independent variables in the study (refer to tables in the
Results section). In general, there were no significant main effects or interactions
involving either covariate except for an interaction of lead-time interval and
cigarettes per day reported in Table 4.5 and a main effect of cigarettes per day
reported in Table 4.7. These effects are explored further in the Results and
Discussion sections.
9. Reliability of covariates. This assumption was assessed in Chapter 2, in which the
validity of self-reports of substance use was estimated as excellent in this study. It
can be concluded that the self-reports of nicotine and alcohol use were reliable.
Power and effect size. In addition to the above assumptions, power and effect size
can be used to determine the reliability of the association between the independent and
dependent variables. The power of a statistical test is the probability that the test will
produce significant results if those results are present in the population (Cohen, 1988); it
is related to the probability of Type II errors. The desired power of a test should
approach 0.80 with a p = 0.05 (Cohen, 1988); that is, it has been accepted that the
probability of a Type 1 error be no higher than 0.05, and the probability of a Type II
error no higher than 0.2 (1.0 – 0.8). Power of the analysis depends on the effect size
(strength of association) - a measure of the degree to which a phenomenon is present in
118

a study (Cohen, 1988). The effect size for ANCOVA (partial eta squared, η2part) was
calculated by SPSS according to the following formula:
erroreffect
effect
SSSSSS+
=part2η (Tabachnick & Fidell, 2001), where:
SSeffect = proportion of variance attributable to the effect SSerror = proportion of variance attributable to the error
Thus, η2part is more appropriate than η2 calculated for t-tests because η2
part takes into
account the error variance in addition to the systematic variance for the effect of interest
(Tabachnick & Fidell, 2001). The η2part was interpreted according to the same criteria as
for η2- small < 0.01, small-moderate 0.01 – 0.06, moderate 0.06 – 0.14, large > 0.14
(Cohen, 1988). Note that both effect size and power depend on the degrees of freedom.
The main advantage of using ANOVA over multiple t-tests is that ANOVA improves
chances of detecting real differences between groups by reducing the rate of Type I
errors due to multiple t-tests. ANOVA also allows for testing of not only main effects of
independent variables on the dependent variable, but also to test for interactions in the
effects of the independent variables. The use of ANCOVA in this study can be justified
by the presence of covariates (cigarettes per day and alcoholic drinks per week), which
have been found to affect the startle reflex in other studies (refer to Introduction of this
chapter). While ANCOVA cannot statistically control for group differences, it can be
used to remove the variance due to covariates from the within-group variance and
increase the power and sensitivity of the F-tests (Miller & Chapman, 2001). Thus, in
the present study ANCOVA was used to remove the effects of nicotine and alcohol from
the effects of cannabis on the startle reflex. All analyses were also conducted without
covariates using the GLM ANOVA with repeated measures. ANOVAs produced the
same significant main effects and interactions as ANCOVAs. The means unadjusted for
covariates are graphed in Appendix D.
119

4.5 Results
4.5.1 Participant Characteristics
Due to recruitment problems and exclusion of most patients (refer to subsection
4.4.6) the remaining eight patients’ data were treated as a pilot study and thus the
patients are not included in the participant characteristics table (Table 4.2). There were
no significant differences between controls and cannabis-controls on all variables except
for the number of cigarettes per day, the number of alcoholic drinks per week, the
frequency of nicotine users, and cannabis use variables (five controls used cannabis
more than 12 months before the testing session). The continuous variables (number of
cigarettes per day and the number of alcoholic drinks per week) were thus used as
covariates in analyses reported in this chapter. The higher frequency of nicotine use
among cannabis users supports findings from other studies (refer to subsection 4.6.5).
In addition, the 16 cannabis-controls had the following characteristics regarding their
cannabis use over the last 12 months:
• Frequency of cannabis use: 13 daily-weekly users, three monthly-or-less users
• 12/16 had used cannabis within 24 hours since the testing session with median time
of use of 12 hours, range 2 – 17 hours (all 12 samples positive for cannabinoids)
• Median urine cannabinoid concentration of 230 µg/L, range 0 – 2000 µg/L.
As mentioned above the cannabis users significantly differed from controls in terms
of having more lifetime diagnoses of cannabis misuse on CIDI-Auto 2.1, more lifetime
diagnoses of cannabis dependence on SDS, higher SDS scores, and longer duration of
cannabis use, however, the two groups were matched on the age of first cannabis use
(Table 4.2).
120

Table 4.2 Participant characteristics
Variable Controls n = 12
Cannabis-controls n = 16
Test (df)
Male (%) Female (%)
11 (92%) 1 (8%)
11 (68%) 5 (32%)
pF = 0.196
Right-handed (%) Left-handed (%)
10 (83%) 2 (17%)
14 (88%) 2 (12%)
pF = 1.000
Substance use Cannabis
currenta (%) pastb (%) none (%)
Alcohol currenta (%) pastb or none (%)
Nicotine currenta (%) pastb or none (%)
0 5 (42%) 7 (58%)
10 (83%) 2 (17%)
2 (17%)
10 (83%)
16 (100%) 0 0
14 (88%) 2 (12%)
10 (62%) 6 (38%)
pF = 1.000
pF = 0.023*
Mental illness (CIDI-Auto 2.1) Last 12 months (%) Lifetime (%)
Lifetime diagnoses Cannabis misuse (CIDI)c
Present Absent
Cannabis dependence (SDS) Present Absent
0
4 (33%) depression
2 (17%) 10 (83%)
1 (1%)
11 (99%)
1i (1%) depression
5 (31%) depression-3, delusional disorder-2
11 (73%) 4 (27%)
8 (50%) 8 (50%)
pF = 0.006**
pF = 0.039*
M ± SD (range) Age (yr) IQd
Education (yr) Age of first cannabis use (yr)
33 ± 8
(18 – 43) 104 ± 9
(86 – 115) 12 ± 2
(10 – 14) 18 ± 4
(14 – 24)
30 ± 8
(19 – 44) 104 ± 9
(79 – 117) 14 ± 2
(9 – 17) 16 ± 2
(13 – 21)
t (26) 1.2
-0.1
-1.3
t (19) 1.3
p 0.231
0.901
0.216
0.193
η2
0.05
< 0.01
0.06
0.07 Median (range)
Cigarettes/day#
Alcohole/week#
Coffeef/day#
Last cigarette$
Last alcohol$
Last coffee$
% Trials excluded SDS Duration of cannabis use (yr)g
0 (0 – 25) 2 (0 – 12) 2 (0 – 15)
2 (2)h
14 (12–19) 5 (1 – 24) 8 (4 – 28) 0 (0 – 6)
0 (0 – 16)
1 (0 – 10) 6 (0 – 24) 1 (0 – 10) 12 (2 – 13)
14 (12 – 24) 3 (2 – 24) 9 (2 – 28) 2 (0 – 7)
13 (2 – 27)
U 52.0 46.5 60.5 1.0
17.5 56.0 87.5 35.5 34.5
z -2.3 -2.3 -1.7 -1.2 -0.4 -0.3 -0.4 -3.1 -2.9
p 0.023* 0.021* 0.096 0.210 0.720 0.790 0.692
0.002** 0.004**
Note. Abbreviations: CIDI-Auto 2.1- Composite International Diagnostic Interview, version AUTO 2.1; df- degrees of freedom, pF- two-tailed Fisher’s Exact Probability, SDS- Severity of (Cannabis) Dependence Scale; U- Mann-Whitney U-test, yr- years. auser during the last 12 months since the testing session. buser more than 12 months since the testing session. cone cannabis-control did not complete CIDI-Auto 2.1 due to software problems. dIQ was estimated with the National Adult Reading Test, NART (Nelson & Willison, 1991). estandard alcoholic drink. fstandard cup (250 mL). gtotal duration of cannabis use in years between the first ever and last ever use. honly one participant used nicotine within 24 hours since the testing session. ithe inclusion of this participant had no effects on the PPI results (subsection 4.5.4.1). #frequency of use in the last 12 months. $recency of use in the last 24 hours (in hours). *p < 0.05, **p < 0.01
121

Due to a high exclusionary rate, the excluded non-patient participants (excluded-
controls) were compared to the sample included in the study (included-controls). The
results presented in Table 4.3 show that the excluded participants were not
systematically different from the participants included in the final analyses except for
the excluded-controls meeting the exclusionary criteria specified in the Methods
subsection (4.4.6).
122

Table 4.3 Characteristics of participants included and excluded from the study
Variable Included-controls n = 28
Excluded-controls n = 23
Test (df)
Male (%) Female (%)
22 (78%) 6 (22%)
19 (83%) 4 (17%)
pF = 1.000
Right-handed (%) Left-handed (%)
24 (86%) 4 (14%)
22 (96%) 1 (4%)
pF = 0.362
Substance use Cannabis
currenta (%) pastb or none (%) daily-weekly (%) monthly/less/none (%)
Alcohol currenta (%) pastb or none (%)
Nicotine currenta (%) pastb or none (%)
16 (57%) 12 (43%)
13 (46%) 15 (54%)
24 (86%) 4 (14%)
12 (43%) 16 (57%)
13 (56%) 10 (44%)
12 (52%) 11 (48%)
22 (96%)
1 (4%)
11 (48%) 12 (52%)
pF = 1.000
χ2 (1) = 0.02, p = 0.899
pF = 0.362
χ2 (1) = 0.01, p = 0.943
Lifetime diagnoses Cannabis misuse (CIDI)c
Present Absent
Cannabis dependence (SDS) Present Absent
13 (48%) 14 (52%)
9 (32%) 19 (68%
9 (39%) 14 (61%)
8 (35%) 15 (65%
χ2 (1) = 0.13, p = 0.723
pF = 1.000
M ± SD (range)
Age (yr) IQd
Education (yr) Duration of cannabis use (yr)g
31 ± 8 (18 – 44) 104 ± 9
(79 – 117) 13 ± 2
(9 – 17) 10 ± 8
(0 – 27)
34 ± 11 (19 – 56) 105 ± 8
(92 – 117) 12 ± 2
(9 – 17) 11 ± 11 (0 – 39)
t (49)
-1.0
-0.5
1.4
-0.4
p
0.331
0.634
0.167
0.710
η2
0.02
< 0.01
0.04
< 0.01
Median (range)
Cigarettes/day#
Alcohole/week#
Coffeef/day#
Last cigarette$
Last alcohol$
Last coffee$
Last cannabis$
Urine cannabise
Age of first cannabis use (yr) SDS
0 (0 – 25) 3 (0 – 24) 1 (0 – 15)
12 (2 – 13) 14 (12 – 24) 4 (1 – 24)
12 (2 – 17) 0 (0 – 2000) 16 (13 – 24)
0 (0 – 7)
0 (0 – 30) 6 (0 – 30) 3 (0 – 12) 2 (1 – 20)
12 (11 – 20) 4 (2 – 24) 11 (2 – 24)
38 (0 – 2078) 16 (13 – 24) 1 (0 – 13)
U
274.0 297.5 236.5 27.0 22.5 185.5 66.0 293.0 153.0 287.0
z
-1.0 -0.5 -1.6 -1.8 -1.6
-0.04 -0.4 -0.4 -0.5 -0.7
p
0.320 0.642 0.104 0.077 0.140 0.966 0.728 0.711 0.642 0.480
Refer to Table 4.2 for notes.
123

4.5.2 Cannabis, Attention, Startle Stimulus Intensity, and Startle Reflex
Magnitude on Startle Stimulus Alone Trials
The first aim of the study was to investigate the effects of cannabis use on the
magnitude of the startle reflex (the AUC magnitude) when prepulses were not presented
(on Startle Stimulus Alone Trials) with participants attending to or ignoring the startle
stimuli. Table 4.4 summarises the effects of cannabis use, attention, startle stimulus
intensity, and covariates on the startle reflex magnitude.
Table 4.4 Effects of cannabis, attention, startle stimulus intensity, and covariates on the startle reflex magnitude during the Startle Stimulus Alone Trials
Between subject-effects
df F p η2part Power
Cannabis use (THC) Cigarettes/day (CIG) Drinks/week (ALC) MSerror
1 1 1
24
0.3 0.6 0.5
(810131)
0.611 0.433 0.496
0.01 0.03 0.02
0.08 0.12 0.10
Within subject-effects
df F p η2part Power
Attention (ATT)a
ATT x CIG ATT x ALC ATT x THC MSerror
1 1 1 1
24
27.8** 0.1 0.2
0.01 (242695)
< 0.0005 0.723 0.662 0.942
0.54 0.01 0.01
< 0.01
1.00 0.06 0.07 0.05
Startle stimulus intensity (DB)b
DB x CIG DB x ALC DB x THC MSerror
1^
1^
1^
1^
31^
36.6** 0.6 0.4 0.1
(1321282)
< 0.0005 0.493 0.596 0.796
0.60 0.02 0.02
< 0.01
1.00 0.12 0.10 0.06
Interactions ATT x DBc
ATT x DB x CIG ATT x DB x ALC ATT x DB x THC MSerror (ATT x DB)
3 3 3 3
72#
6.9** 0.1 0.2
0.05 (125090)#
< 0.0005
0.967 0.913 0.985
0.22
< 0.01 0.01
< 0.01
0.97 0.06 0.08 0.06
Note. Values in parentheses represent mean square errors (MSerror). Abbreviations: df- degrees of freedom, η2
part- partial eta squared (measure of effect size). Homogeneity of variance was met for all levels of the dependent variable on both attentional tasks (Appendix E, Table E.1), but one (80 dB). This single violation was of no importance, because there were no significant effects of attention or cannabis use on startle magnitude at this startle stimulus intensity (see Figure below). Homogeneity of variance-covariance matrices was violated, Box’s M = 109.1, F (df1 36, df2 1893) = 2.0, p = 0.001. This violation was of no importance, because there were no significant between-subject effects. aAssumption of sphericity is always met when only two means are compared (Mauchly’s W = 1). bAssumption of sphericity violated: Mauchly’s W (df 5) = 0.1, p < 0.0005- degrees of freedom adjusted using Greenhouse-Geisser epsilon. cAssumption of sphericity met: Mauchly’s W (df 5) = 0.7, p = 0.177. ^df adjusted using Greenhouse-Geisser epsilon due to lack of sphericity. #MSerror, df, and hm = 13.71 used to calculate critical difference for planned pairwise comparisons (CD = 269.29). **p < 0.01
124
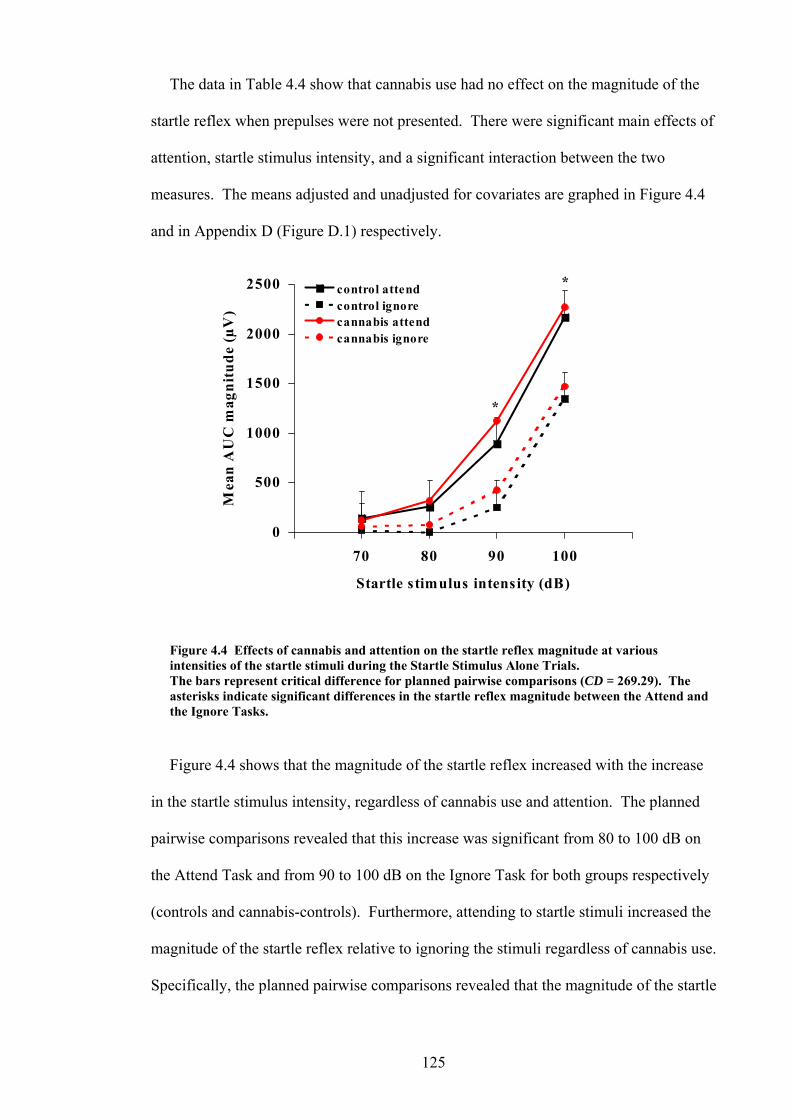
The data in Table 4.4 show that cannabis use had no effect on the magnitude of the
startle reflex when prepulses were not presented. There were significant main effects of
attention, startle stimulus intensity, and a significant interaction between the two
measures. The means adjusted and unadjusted for covariates are graphed in Figure 4.4
and in Appendix D (Figure D.1) respectively.
0
1000
Startle stimulus intensity (dB)
Me
n m
500
2500
70 80 90 100
a A
UC
agn
control attendcontrol ignorecannabis attend
1500
2000
itud
e (µ
V)
cannabis ignore
*
*
intensities of the startle stimuli during the Startle Stimulus Alone Trials.
sks.
ned
sk for both groups respectively
a se.
Figure 4.4 Effects of cannabis and attention on the startle reflex magnitude at various
The bars represent critical difference for planned pairwise comparisons (CD = 269.29). The asterisks indicate significant differences in the startle reflex magnitude between the Attend and the Ignore Ta
Figure 4.4 shows that the magnitude of the startle reflex increased with the increase
in the startle stimulus intensity, regardless of cannabis use and attention. The plan
pairwise comparisons revealed that this increase was significant from 80 to 100 dB on
the Attend Task and from 90 to 100 dB on the Ignore Ta
(controls and cannabis-controls). Furthermore, attending to startle stimuli increased the
m gnitude of the startle reflex relative to ignoring the stimuli regardless of cannabis u
Specifically, the planned pairwise comparisons revealed that the magnitude of the startle
125

reflex increased significantly during the Attend Task at 90 and 100 dB relative to
Ignore Task.
In summary, when prepulses were not presented, cannabis use had no effect on the
magnitude of the startle reflex at all intensities o
the
f the startle reflex. Furthermore,
4.5.3 Cannabis, Attention, Lead-Time Intervals, and Startle Reflex Magnitude
The second aim of this study was to investigate the effects of cannabis use on the
magnitude of the startle reflex when prepulses were presented at various lead-time
intervals before the startle stimuli (on Prepulse and Startle Stimulus Trials) compared to
the magnitude of the startle reflex when no prepulses were presented (on Startle
Stimulus Alone Trials) with participants attending to or ignoring the startle and prepulse
stimuli. Table 4.5 summarises the effects of cannabis use, attention, lead-time intervals,
and covariates on the startle reflex magnitude.
The results in Table 4.5 revealed that there was a significant interaction between
lead-time interval and one of the covariates (cigarettes per day). Presence of interaction
between a covariate and a dependent variable violates one of the assumptions for
conducting of ANCOVA (homogeneity of regression, refer to section 4.4.7.4).
Therefore, it was necessary to investigate the source of such interaction and understand
its meaning.
Standard linear regression was used to further explore the relationships between the
startle reflex magnitude at each of the seven lead-time intervals (predictor variables) and
cig . All seven regressions were
non-significant ( R values (f less th
0.01 ctions o he regress showed th startle reflex magnitude
tended to decrease with the increased nu garettes per day at lead-time intervals
attending to the startle stimuli, relative to ignoring the stimuli, significantly increased
the startle reflex magnitude regardless of cannabis use.
arettes per day (dependent variable) in cannabis users
p values between 0.428 – 0.969) with low 2 rom an
to 0.04). The dire f t ions at the
mber of ci
126

between 0 (Startle Stimulus Alone Trials) – ms and 1600 ms, and tended to increase
with the increased number of cigarettes pe t lead-tim rvals en 80 0
ms. Therefore, it is likely that such differen in slope d ns, ev ugh n
significan e interval, may have produced the significan
intera een the lead-ti intervals igarettes y.
Ta cts of cannabis, ention, lead- intervals, a riates startle x ma e Prepulse and Startle Stimulus Trials
B ects Power
40
r aday e inte betwe – 20
ces irectio en tho ot
t at each individual lead-tim t
ction betw me a cnd per da
ble 4.5 Effe att time nd cova on the reflegnitude during th
etween subject-eff
df F p η2part
C 0.599 0. 0.08 annabis use (THC) Cigarettes/day (CIG) Drinks/week (ALC) MSerror
1 1
24
0.1 0.5
(7204012)
0.736 0.488
0.01 0.02
0.06 0.10
1 0.3 01
2part Power Within subject-effects df F p η
Attention (ATT) 1 14.1** 0.00
2 a 1 0.37 0.95
ATT x CIG 1 0.2 0.70ATT x ALC ATT x THC
1 1
0.003 0.2
0.960 0.629
< 0.01 0.01
0.05 0.08
MSerror
24 (1617375)
0.01
0.07
Lead-time interval (LT)b
LT x CIG
MS
6 6
144
12.4** 3.2**
(202712)
< 0.0005 0.005
0.34 0.12
1.00 0.92
Interactions
MSerror (ATT x LT)
144#
(142543)#
7 4
LT x ALC LT x THC
error
6 6
1.7 1.3
0.118 0.277
0.07 0.05
0.64 0.49
ATT x LTc
ATT x LT x CIG ATT x LT x ALC ATT x LT x THC
6 6 6 6
1.5 0.3 0.9 1.4
0.181 0.916 0.529 0.202
0.06 0.01 0.03 0.06
0.50.10.33 0.55
Note. Values in parentheses represent mean square errors (MSerror). Abbreviations: df- degrees of
variance-covariance matrices was met (Box’s M-test not computed due to fewer than two nonsingular
Assumption of sphericity is always met when only two means are compared (Mauchly’s W = 1).
#
**p < 0.01
r
freedom, η2part- partial eta squared (measure of effect size). Homogeneity of variance was met for all
levels of the dependent variable on both attentional tasks (Appendix E, Table E.2). Homogeneity of
cell covariance matrices). a
bAssumption of sphericity met: Mauchly’s W (df 20) = 0.3, p = 0.096. cAssumption of sphericity met: Mauchly’s W (df 20) = 0.3, p = 0.246. MSerror, df, and hm = 13.71 used to calculate critical difference for planned pairwise comparisons (CD
= 285.02).
It was hypothesised that the interaction between lead-time intervals and cigarettes pe
day would disappear if two separate analyses of the effects of cannabis use and attention
127

on the startle reflex magnitude would be conducted. Specifically, the two analyses
would include the lead-time intervals, during which the startle reflex magnitude tended
to either increase or decrease with the increased number of cigarettes per day. To
investigate this possibility, two separate ANCOVAs were conducted using the lead-tim
intervals of either 0 – 40 and 1600 ms (trend for decrease in the startle reflex
magnitude) or 80 – 200 ms (trend for increase in the startle reflex magnitude) and
cigarettes per day, as a covariate. The results showed that the interaction between lea
time interval the number of cigarettes per day was not significant in both analyses.
Therefore, based on these results and the lack of effects of cigarettes per day on the
startle reflex magnitude when prepulses were not presented (on Startle Stimulus Alon
Trials), it was concluded that the significant interaction between lead-time interval and
cigarettes per day was due to the effects of the covariate on PPI rather than the startle
reflex magnitude itself. Th
e
d-
e
us, the number of cigarettes per day was used as a covariate
the ANCOVA conducted to investigate the effects of cannabis use and attention on
PI (see subsection 4.5.4). However, the use of cigarettes per day as a covariate to
nalyse the effects of cannabis use and attention on the startle reflex magnitude during
the
betw the e intervals meaning t ANCOVA would
prov ervative st of the hypotheses. Therefore, analysis of the effects
of cannabis use and attention he star agnitude during the Prepulse and
Startle Trials was repeated using ANCOVA with one covariate only (alcoholic drinks per
week not interact h the de variable result s ana
are reported in Table 4.6.
in
P
a
Prepulse and Startle Trials was not appropriate due to the significant interaction
een the covariate and lead-tim hat not
ide the most cons te
on t tle reflex m
), which did wit pendent . The s of thi lysis
128

Ta annabis, ention, lead- intervals, a holic d er we(co le refle gnitude Prepulse and Startle Stimulus Trials
ble 4.6 Effects of c att time nd alco rinks p ek variate) on the start x ma during the
Between subject-effects
df F p η2part Power
Cannabis use (THC) Drinks/week (ALC) MSerror
1 1
25
0.3 0.6
(6949272)
0.590 0.444
0.01 0.02
0.08 0.12
2 oweWithin subject-effects
df F p η part P r
Attention (ATT)a
ATT x ALC 1 < 0.0005 0.994 1 16.1** < 0.00
ATT x THC MSerror
1 25
0.2 (1562381)
0.626 0.01 0.08
05 0.39 < 0.01
0.97 0.05
Lead-time interval (LT)b
LT x ALC LT x THC MSerror
4^
4^
4^
105^
9.5** 1.5 1.1
(316088)
< 0.0005 0.198 0.340
0.28 0.06 0.04
1.00 0.47 0.36
ATT x LTc 6 1.6 0.143 0.06 0.61 6
Interactions
ATT x LT x ALC ATT x LT x THC MSerror (ATT x LT)
6 6
150#
0.9 1.5
(138769)#
0.481 0.189
0.04 0.06
0.30.56
Note. Values in parentheses represent mean square errors (MSerror). Abbreviations: df- degrees of freedom, η2
part- partial eta squared (measure of effect size). Homogeneity of variance was met for all
variance-covariance matrices was met (Box’s M-test not computed due to fewer than two nonsingularcell covariance matrices).
levels of the dependent variable on both attentional tasks (Appendix E, Table E.3). Homogeneity of
adjusted using Greenhouse-Geisser epsilon. (df 20) = 0.3, p = 0.200.
df adjusted using Greenhouse-Geisser epsilon due to lack of sphericity. #MSerror, df, and hm = 13.71 used to calculate critical difference for planned pairwise comparisons (CD = 281.13). **p < 0.01
4.5.3.1 Effects of Attention and Lead-Time Intervals on Startle Reflex Magnitude
Similarly to Startle Stimulus Alone Trials, there was a significant main effect of
attention on the startle reflex magnitude when prepulses were presented vs when
prepulses were absent (Table 4.6). In addition, there was also a main effect of lead-time
on the startle reflex magnitude. The means adjusted for alcoholic drinks per week and
unadjusted for covariates are graphed in Figures 4.5A and 4.5B, and in Appendix D
(Figures D.2A and D.2B) respectively.
aAssumption of sphericity is always met when only two means are compared (Mauchly’s W = 1). bAssumption of sphericity violated: Mauchly’s W (df 20) = 0.2, p = 0.017- degrees of freedom
cAssumption of sphericity met: Mauchly’s W^
129

1000
1500
3000
Mea
n A
UC
ma
attend
5000 20 40 80 100 200 1600
Lead-time interval (ms)
CONTROL Aignore *
2000
gnit
ude
( 2500µV)
*
*
* * **
500
1000
1500
2500
3000
Mea
n A
UC
mag
nud
eµV
)
attend CANNABIS Bignore
2000
100 200 1600
Lead-time interval (ms)
it (
0 20 40 80
*
*
*
Figure 4.5 Effects of attention on the startle reflex magnitude at various lead-time intervals in
3). The
to the mean startle reflex magnitude on the Startle Stimulus Alone Trials.
*
* **
controls (A) and in cannabis users (B). The bars represent critical difference for planned pairwise comparisons (CD = 281.1asterisks indicate significant differences in the startle reflex magnitude between the Attend and the Ignore Tasks at various lead-time intervals. Note that the lead-time interval of 0 ms refers
130

Planned pairwise comparisons in Figures 4.5A and 4.5B revealed that the magnitude
of the startle reflex was significantly higher during the Attend than the Ignore Tasks
when prepulses were presented at various lead-time intervals regardless of cannabis us
In controls, presentation of prepulses at short lead-time intervals (between 20 – 200 ms
significantly reduced startle reflex magnitude (induced inhibition of the startle reflex
PPI) in comparison to Startle Stimulus Alone Trials (
e.
)
,
lead-time interval = 0 ms; Figure
4.5A). This effect was independent of attention and, thus, was observed during both
attentional tasks. Also in controls, presentation of prepulses at long lead-time intervals
(1600 ms) induced facilitation (PPF) of the startle reflex magnitude in comparison to
trials when prepulses were not presented (lead-time interval = 0 ms; Figure 5A). The
PPF was significant only during the Attend Task.
4.5.3.2 Effect of Cannabis on PPI and PPF
The data presented in Table 4.6 show that cannabis use had no significant main
effects on the startle reflex magnitude when prepulses were presented. Figures 4.6A
and 4.6B show the data from Figures 4.5A and 4.5B to allow between-group
comparisons (refer to Appendix D, Figures D.3A and D.3B for means unadjusted for
covariates).
sig
sh stimulus). Therefore,
cannabis use was associated with a significant REDUCTION in PPI of the startle reflex.
This effect was significant at all short lead-time intervals during the Attend Task and
only at one lead-time interval (20 ms) during the Ignore Task. Furthermore, cannabis
use was not associated with any changes in the startle reflex magnitude at long lead-
time intervals (1600 ms) on either attentional task.
Planned pairwise comparisons revealed that cannabis use was associated with a
nificant increase in the startle reflex magnitude when prepulses were presented at
ort lead-time intervals (between 20 – 200 ms before the startle
131

500
1
1500an
U
C m
000
3000
eA
agd
control
2000
2500
nitu
e (µ
V)
0 20 40 80 100 200 1600
Lead-time interval (ms)
M
cannabisATTEND A
**
**
*
500
1000
1500
2000
3000
Man
AU
C m
agni
de (
V)
2500
200 1600
Lead-time interval (ms)
etu
µ
0 20 40 80 100
controlcannabis IGNORE B
*
Figure 4.6 Effects of cannabis on the startle reflex magnitude at various lead-time intervals during the Attend Task (A) and the Ignore Task (B). The bars represent critical difference for planned pairwise comparisons (CD = 281.13). The asterisks indicate significant differences in the startle reflex magnitude between controls and cannabis users on both attentional tasks. Note that the lead-time interval of 0 ms refers to the mean startle reflex magnitude on the Startle Stimulus Alone Trials.
132

ulses at s rt lead-time intervals (20 – 200 ms) induced inhibition
of nitud PI), while p pulses at long lead-time tervals
m itation of the tartle refle itude (PP urthe atten to
prep rtle stimuli in ased startle ex magnitude regardle lead-t
interval and cannabis use. Cannabis use was associated with reduction in PPI only
wh
eff
nnab , Attention, Lead-Time Intervals, and % Startle Reflex
Magnitude
cts of
dependent of the startle reflex magnitude on Startle Stimulus
I
nabis use and attention on %PPI and %PPF.
4.5.4.1 Effects of Cannabis and Attention on %PPI
Table 4.7 summarises the effects of cannabis use, attention, and covariates on %PPI
(mean percent peak magnitude modification at short lead-time intervals of 20 – 200 ms).
In summary, prep ho
the startle reflex mag e (P re in (1600
s) induced facil s x magn F). F rmore, ding
ulse and sta cre refl ss of ime
en participants were attending to prepulse and startle stimuli. Cannabis use had no
ect on PPF during either attentional task.
4.5.4 Ca is
The problem with assessing the effects of cannabis use on PPI/PPF (Figures 4.6A
and B) was that the startle magnitudes were significantly increased when attending in
contrast to ignoring startle stimuli on Startle Stimulus Alone Trials in controls and in
cannabis users (Figures 4.4, 4.5A, and 4.5B). Thus, in order to investigate the effe
cannabis use on PPI/PPF in
Alone Trials, percent PPI/PPF values were used. Furthermore, the data presented in
Figure 4.6A show that cannabis use was associated with significant reductions in PP
between 20 – 200 ms but not in PPF. Thus, the PPI data were collapsed into one short
lead-time interval (mean 20 – 200 ms) and were analysed separately from the long lead-
time intervals (mean 1600 ms), during which PPF was observed (Figure 4.6A), to
investigate the effects of can
133

Table 4.7 Effects of cannabis, attention, and covariates on %PPI at short lead-time intervals (mean 20 – 200 ms) during the Prepulse and Startle Stimulus Trials
Between subject-effects
df F p η2part Power
Cannabis use (THC) Cigarettes/day (CIG) Drinks/week (ALC) MSerror
1 1 1
24
0.1 8.3** 0.3
(422)
0.755 0.008 0.572
< 0.01 0.26 0.01
0.06 0.79 0.08
Within subject-effects
df F p η2part Power
Attention (ATT) ATT x CIG ATT x ALC ATT x THC MSerror
1 1 1 1
24#
0.004 1.3 1.0
6.2* (326)#
0.948 0.261 0.327 0.020
< 0.01 0.05 0.04 0.21
0.05 0.20 0.16 0.67
Note. Values in parentheses represent mean square errors (MSerror). Abbreviations: df- degrees of freedom, η2
part- partial eta squared (measure of effect size). Homogeneity of variance was violated for %PPI on the Attend Task (this issue is addressed below) and met for %PPI on the Ignore Task (Appendix E, Table E.4). Homogeneity of variance-covariance matrices was met, Box’s M = 2.4, F (df1 3, df2 58290) = 0.7, p = 0.539. Assumption of sphericity is always met when only two m ns are compared (Mauchly’s W = 1). #
as a significant interaction between
the startle reflex magnitude relative to the control
group during the Attend Task only. This eff
ea
MSerror, df, and hm = 13.71 used to calculate critical difference for planned pairwise comparisons (CD= 14.23). *p < 0.05 **p < 0.01
The data presented in Table 4.7 show that there w
cannabis use and attention on %PPI. Also, there was a main effect of one covariate on
%PPI (cigarettes per day); this effect is addressed in more detail below. The means
adjusted and unadjusted for covariates are graphed in Figure 4.7 and Appendix D
(Figure D.4) respectively.
The planned pairwise comparisons revealed that cannabis use was associated with a
significant reduction in %PPI of
ect of cannabis appeared reversed (although
non-significantly) on the Ignore Task, where there was significantly greater %PPI than
on the attend task. The difference in %PPI between the Attend and Ignore Tasks was
not significant in controls.
134

-50
-40
-30
Me
n pe
-20
10
20
50
Ignorea
aat
ion
(P
% PPF
30
40
%P
M) control
-10
0Attend
k m
odifi
c
cannabis
200 ms) during the Attend and the Ignore Tasks. ritical difference for planned pairwise comparisons (CD = 14.23). The
in %PPI between controls and cannabis users. Note
Due to a violation of the homogeneity of variance for the %PPI during the Attend
Task the unpooled variance was examined. Specifically, the lower and upper bounds of
and thus revealed that the %PPI was still significantly reduced in cannabis users (mean
-21.8, 95% CI: -9.8, -33.7).
The analysis was also repeated excluding one participant with the current diagnosis
results including and excluding this participant (cannabis use by attention interaction
planned pairwise comparisons revealed a significant reduction in %PPI in cannabis
users in contrast to controls on the Attend Task).
*
% PPI
Figure 4.7 Effects of cannabis and attention on %PPI at short lead-time intervals (mean 20 –
The bars represent casterisk indicates a significant differencethat the positive values of %PPM indicate %PPF (prepulse facilitation) and the negative values of %PPM indicate %PPI (prepulse inhibition).
the 95% confidence intervals (CI) did not overlap the means of the comparison group
%PPIATTEND control = -38.1, 95% CI: -24.1, -52.1; mean %PPIIGNORE cannabis-control =
of depression on CIDI-Auto 2.1. There were no significant differences between the
was significant with p = 0.022, the means were distributed in the same directions, and
135
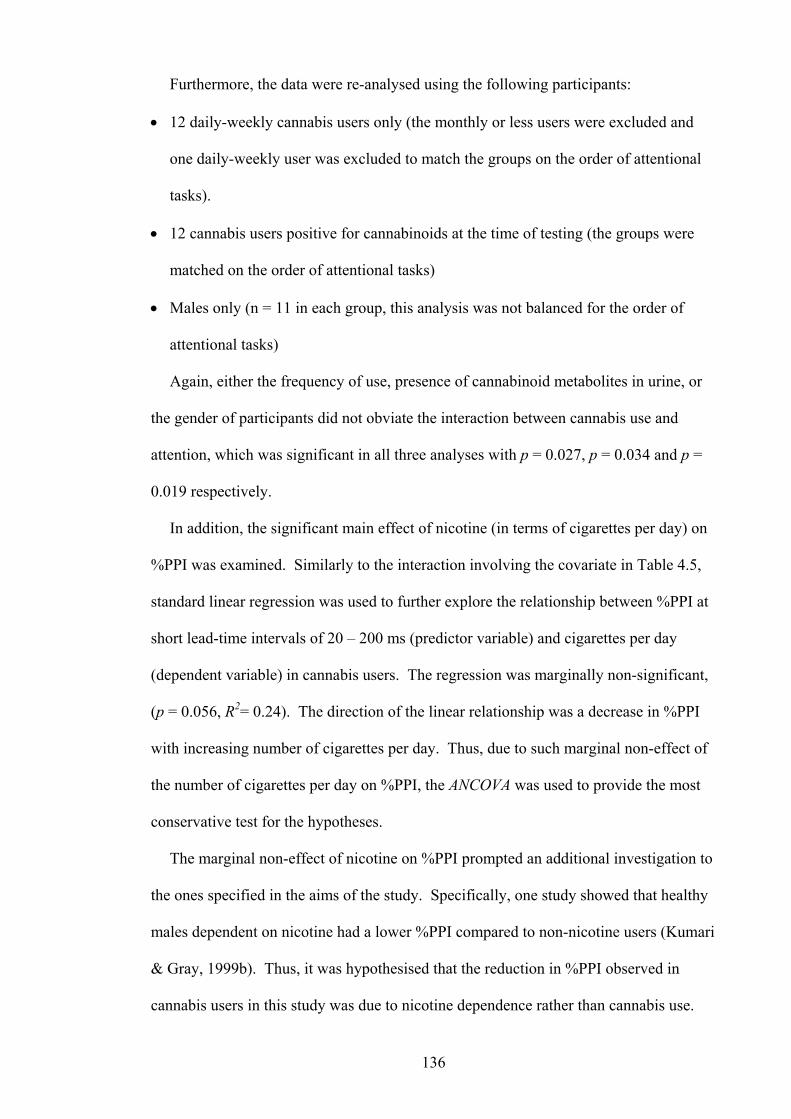
Furthermore, the data were re-analysed using the following participants:
• 12 daily-weekly cannabis users only (the monthly or less users were excluded and
one daily-weekly user was excluded to match the groups on the order of attentional
tasks).
• 12 cannabis users positive for cannabinoids at the time of testing (the groups were
Males only (n = 11 in each group, this analysis was not balanced for the order of
, or
n
of 20 – 200 ms (predictor variable) and cigarettes per day
,
vestigation to
males dependent on nicotine had a lower %PPI compared to non-nicotine users (Kumari
& Gray, 1999b). Thus, it was hypothesised that the reduction in %PPI observed in
cannabis users in this study was due to nicotine dependence rather than cannabis use.
matched on the order of attentional tasks)
•
attentional tasks)
Again, either the frequency of use, presence of cannabinoid metabolites in urine
the gender of participants did not obviate the interaction between cannabis use and
attention, which was significant in all three analyses with p = 0.027, p = 0.034 and p =
0.019 respectively.
In addition, the significant main effect of nicotine (in terms of cigarettes per day) o
%PPI was examined. Similarly to the interaction involving the covariate in Table 4.5,
standard linear regression was used to further explore the relationship between %PPI at
short lead-time intervals
(dependent variable) in cannabis users. The regression was marginally non-significant
(p = 0.056, R2= 0.24). The direction of the linear relationship was a decrease in %PPI
with increasing number of cigarettes per day. Thus, due to such marginal non-effect of
the number of cigarettes per day on %PPI, the ANCOVA was used to provide the most
conservative test for the hypotheses.
The marginal non-effect of nicotine on %PPI prompted an additional in
the ones specified in the aims of the study. Specifically, one study showed that healthy
136

To examine the effect of nicotine dependence on PPI in the current study the %PPI
expressed in terms of a difference score calculated according to the following formula:
Difference score = %PPI
was
PPI observed across the lead times of 20 – 200 ms.
The reason for using the difference score rather than %PPI on each attentional task
wa
su
e ithin-subjects variable (attention).
es
the Kolmogorov-Smirnov Test.
The analysis revealed a lack of significant association between the difference scores and
at the reduction in %PPI was
4.5.4.2 Effects of Cannabis and Attention on %PPI in Schizophrenia- Pilot Study
The effects of attention on PPI were also assessed in the pilot study using data for
eig xclusionary criteria
specified in the Methods section. The patients were matched on the order of attentional
ATTEND TASK – %PPIIGNORE TASK, where:
%PPI- the mean of the %
s the significant interaction between attention and cannabis use. Such a within-
bjects interaction in ANCOVA indicates that there may be a significant difference
tween the groups in the difference scores of the wb
The lifetime nicotine dependence was established using the Fagerstrom Test for
Nicotine Dependence, FTND (Heatherton et al., 1991), completed by all participants
during the study. The total FTND score of zero indicates no dependence and the total
score of 10 indicates maximum dependence. More information regarding this test can
be found in Chapter 2.
The difference scores for cannabis users were subsequently correlated with FTND
scor using a bivariate Spearman Rank Order Correlation (one-tailed, p < 0.05) due to
a violation of normality by FTND scores according to
FTND scores (rho = 0.02, p = 0.475, n = 16), suggesting th
associated with cannabis use, but not with nicotine use and dependence.
ht patients (non-users of cannabis), who did not meet the e
137

tasks. The data were analysed using a GLM ANOVA with ted m . Th
startle reflex was recorded fr the right o aris oculi muscle in one patient due to
an injury to the left muscle. Furthermore, the trends in data were used to compare PPI
on t nd the Ignore sks amon ients, ca s user ontr
Figure 4.7 with patient data is reproduced ure 4.8 be atient s are
un
repea easures e
om rbicul
he Attend a Ta g the pat nnabi s, and c ols.
as Fig low (p mean
adjusted for covariates).
-50
-40Mea
pe
-30
-20
20
40
50
Ignore
na
at(
PM
)
% PPF
-10
0
10
30
Attend
k m
odifi
cio
n %
P
controlcannabispatient
Figure 4.8 Effects of cannabis and attention on %PPI at short lead-time intervals (mean 20 – 200 ms) in controls, cannabis users, and patients with schizophrenia. The critical difference was not calculated due to a low number of patients with schizophrenia. Note that the positive values of %PPM indicate %PPF (prepulse facilitation) and the negative values of %PPM indicate %PPI (prepulse inhibition).
In comparison to controls, patients showed an apparent reduction in %PPI during the
Attend Task, as reported in other studies. This reduction in %PPI was similar to that
observed in cannabis users. However, the %PPI of the patients during the Ignore Task
was similar to that of controls, but may have differed from %PPI of cannabis users.
Furthermore, there was no indication of attentional modulation of %PPI in patients, as
previously reported; overall ANOVA was non-significant with F(1, 7) = 0.1, p = 0.827,
% PPI
138

MSerror = 421, η2part < 0.01, and power = 0.05. The problems with interpretation of the
patient data are addressed in the Discussion section.
4.5.4.3 Effects of Cannabis and Attention on %PPF
Table 4.8 summarises the effects of cannabis use, attention, and covariates on %PPF
(mean % peak magnitude modification at long lead-time intervals of 1600 ms).
Table 4.8 Effects of cannabis, attention, and covariates on %PPF at long lead-time intervals (mean 1600 ms) during the Prepulse and Startle Stimulus Trials
Between subject-effects
df F p η2part Power
Cannabis use (THC) Cigarettes/day (CIG) Drinks/week (ALC) MSerror
1 1 1
24
1.5 0.1 3.8
(621)
0.233 0.794 0.064
0.06 < 0.01 0.13
0.22 .06 .46
00
Within subject-effects df F p η2 Power
part
Attention (ATT) ATT x CIG
1 1
1.0 < 0.0005
0.333 0.986
0.04 < 0.01
0.16 0.05
ATT x ALC ATT x THC
1 1
#
0.6 0.2
#
0.440 0.671
0.02 0.01
0.12 0.07
MSerror
24 (835)
Note. Values in parentheses represent mean square errors (MS ). Abbreviations: df- degrees of or
%PPF on both attentional tasks (Appendix E, Table E.5). Homogeneity of variance-covariance is
#
ions
bis
ed
ectively.
The planned pairwise comparisons revealed that cannabis use was not associated
errorfreedom, η2
part- partial eta squared (measure of effect size). Homogeneity of variance was met f
matrices was met, Box’s M = 4.1, F (df1 3, df2 58290) = 1.2, p = 0.289. Assumption of sphericityalways met when only two means are compared (Mauchly’s W = 1). MSerror, df, and hm = 13.71 used to calculate critical difference for planned pairwise comparisons (CD
= 22.78).
The data presented in Table 4.8 show that there were no main effects or interact
of cannabis use and attention, and no significant interactions among attention, canna
and covariates on %PPF. The means adjusted and unadjusted for covariates are graph
in Figure 4.9 and in Appendix D (Figure D.5) resp
with any significant changes in %PPF of the startle reflex magnitude during both
attentional tasks. Similarly, there was significant attentional modulation of %PPF in
neither group.
139

% PPF
-50
-40
-20
-10 Attend Ignore
ea p
ea m
o
-30
0
10
40
50
Mn
kdi
ficat
i%
PP
M)
30
20
on (
control
cannabis
% PPI
Figure 4.9 Effects of cannabis and attention on %PPF at long lead-time intervals (mean 1600
that
To summarise, cannabis users and patients showed a reduction in %PPI while
attending to prepulse and startle stimuli, relative to controls. On the Ignore Task,
cannabis users increased their PPI, but did not significantly differ from controls,
although they tended to exhibit more PPI than did patients with schizophrenia. There
were no differences between cannabis users and controls in terms of %PPF during both
att ificant attentional
modulation of %PPI, cannabis users showed a significant
Attend Task in contrast to the Ignore Task. Finally, both controls and cannabis users
sho
4.5.5 Acute or Chronic Effect of Cannabis on PPI and %PPI?
%PPI on the Attend Task was associated with chronic or acute use of cannabis. The
ms) during the Attend and the Ignore Tasks. The bars represent critical difference for planned pairwise comparisons (CD = 22.78). Note the positive values of %PPM indicate %PPF (prepulse facilitation) and the negative values of %PPM indicate %PPI (prepulse inhibition).
entional tasks. While controls and patients did not show sign
reduction in %PPI on the
wed lack of attentional modulation of %PPF.
The third aim of the current study was to investigate whether the reduction in PPI or
140

%PPI was expressed in terms of a difference score calculated according to the following
formula:
Difference score = %PPIATTEND TASK – %PPIIGNORE TASK, where:
%PPI- the mean of the %PPI observed across the lead times of 20 – 200 ms.
The difference scores for all participants were subsequently correlated with the acute
measures of cannabis use (concentration of cannabinoids in urine, in µg/L, and the
recency of cannabis use in the last 24 hours, in hrs), and the chronic measure of
cannabis use (the total duration of cannabis use, in years; Table 4.9). Two variables
(urine cannabinoids and recency of cannabis use) violated the assumption of normality,
according to the Kolmogorov-Smirnov Test, and thus the correlations reported in Table
4.9 were performed using a non-parametric equivalent to bivariate Pearson Product-
Moment Correlation, Spearman Rank Order Correlation. Even though the total duration
of cannabis use and the difference score variables were normally distributed and also
met other assumptions for parametric correlations (refer to Chapter 2), the non-
pa d using a test with
ilar power and sensitivity.
Table 4.9 Correlations among %PPI (difference scores) and urine concentration of
Difference scorea
rametric technique was used to assure that all data were analyse
sim
cannabinoids, recency of use, and the total duration of cannabis use
Variable
rho p n
Urine cannabinoids (µg/L) 0.43* 0.024
27
Cannabis use recency (hours)b
0.20 0.532 12
Cannabis use duration (years)
0.44* 0.018 28
Note. The correlation coefficients are bivariate Spearman Rank Order coefficients rho (two-tailed, p < 0.05). The difference scores were calculated as the difference between mean %PPI at 20 – 200 ms lead-time
intervals during the Attend and the Ignore Tasks. a
*p < 0.05 bhours (within last 24 hours).
141

Table 4.9 shows that the difference scores were significantly correlated with both the
concentration of cannabinoids in urine (in µg/L; Figure 4.10A) and the total duration of
rs). cannabis use (in years, Figure 4.10B), but not with the recency of cannabis use (in h
-5
0
5
15
20
0 5 10 15 20 25 30
Ran
k d
iffer
ence
sre
(%Ig
noe)
10
25
35
Ranked urine cannabinoids (µg/L)
edco
Pen
d -
rA
40
30
PI A
tt
-5
Ranked total duration of cannabis use (years)
R
0
5
10
20
25
ked
der
enc
sco
re (%
PPI
nore
)
15
30
0 5 10 15 20 25 30
aniff
e A
- Ig
Figure 4. 10 Correlations among %PPI (difference score) and concentration of cannabinoids in
35
40
tten
d
B
urine, in µg/L (A), and the total duration of cannabis use, in years (B). Higher difference scores indicate less PPI.
142

ion plots were inspect was revea t the Figu
4. ly distrib d into tw partici
cannabinoids in urine. The correlation between the difference scores and the
co annabinoid urine usi the par pos r
cannabinoids was not signific t (rho = -0 n ).
To further investigate the interaction between PPI (difference score) and the total
dur nnabis use the c relation wa etr rtial P n
Product Moment correlation (two-tailed, to control for the effects of age (all
variables were normally distributed as menti
the ts had no fects on th elation be PPI (difference score)
and the total duration of cann s use in 0.42, p = 0.026, n = 26 vs controlling
for
asp
cannabis use (recency of use, urine concentration of cannabinoids).
4.5.6 Cannabis, Attention, and Startle Reflex Magnitude Habituation
The fourth aim of the study was to investigate the effects of cannabis use on
habituation of the startle reflex magnitude during the two attentional tasks. The peak
magnitude data were split into two blocks- the first 36 and the last 36 trials in each
block. Habituation was investigated separately on Startle Stimulus Alone Trials, at
short lead-time intervals (mean 20 – 200 ms), and at long lead-time intervals (mean
1600 ms).
4.5.6.1 Habituation on Startle Stimulus Alone Trials
Table 4.10 summarises the effects of cannabis use, attention, block, and covariates
on the startle reflex magnitude during Startle Stimulus Alone Trials.
When the correlat ed it led tha data in re
10A were bimodal ute o groups- pants with and without
ncentration of c s in ng only ticipants i otive f
an .02, p = 0.958, = 11
ation of ca or s repeated using a param ic pa earso
p < 0.05)
oned above). The correlation revealed that
age of participan ef e corr tween
abi years (r =
age: r = 0.45, p = 0.018, n = 25).
In summary, the results suggest that reductions in %PPI were related to chronic
ects of cannabis use (total duration of cannabis use), but not due to acute aspects of
143

The data in Table 4.10 show that there was a main effect of attention and block on
the startle reflex magnitude when prepulses were not presented. The means adjusted
and unadjusted for covariates are graphed in Figures 4.11A and 4.11B, and Appendix D
(Figures D.6A and D.6B) respectively.
The planned pairwise comparisons showed that habituation of the startle reflex
magnitude was significant only during the Ignore Task in controls. In contrast,
habituation was significant on both attentional tasks in cannabis users.
Table 4.10 Effects of cannabis, attention, block, and covariates on the startle reflex magnitude during the Startle Stimulus Alone Trials
Between subject-effects
df F p η2part Power
C 05 .14
annabis use (THC) Cigarettes/day (CIG) Drinks/week (ALC) MS
1 1 1
0.04 0.8 0.2
0.844 0.375 0.634
< 0.01 0.03 0.01
0.00.08
error
24 (1136544)
Within subject-effects
df F p η2part Power
Attention (ATT) ATT x CIG ATT x ALC
error
1 1 1
22.9** 0.002 0.4
< 0.0005 0.966 0.552 0.958
0.49 < 0.01 0.02
< 0.01
1.00 0.05 0.09 0.05 ATT x THC
MS1
24 0.003
(499442)
Block (BL)
BL x ALC BL x THC
1
1 1
10.1**
0.3 0.1
0.004
0.583 0.785
0.30
0.01 < 0.01
0.86 BL x CIG
MSerror
1
24
1.9
(185411)
0.182 0.07
0.26 0.08 0.06
Interactions
MSerror (ATT x BL)
24
1 0
(104706)#
0.911 0.
< 0.01
0.05
ATT x BL ATT x BL x CIG ATT x BL x ALC
1 1 1
0.1 0.01 0.0
0.737 0.909
< 0.01 < 0.01
0.06 0.05
ATT x BL x THC
1 #
.03 855 < 0.01 0.05
Note. Values in parentheses represent mean squ rors (MSerror reviati degreel eta squar (measure of effect size). Homo of vari s me l
f the dependent variabl oth atten (Appendix E, Table E.6). Homogeneity of nce-covariance matrices was met, Box’s M = 14.8, F (df1 10, df2 2643) = 1.2, p = 0.271.
is always met when only two means are co ared (Ma s W = MSerror, df, and hm = 13.71 used to calculate critical difference for planned pairwise comparisons (CD
*
are er ). Abb ons: df- s of freedom, η2
part- partia ed geneity ance wa t for allevels o e on b tional tasksvariaAssumption of sphericity
#mp uchly’ 1).
= 255.08). *p < 0.01
144

0
500
1000
Mea
n1500
m
2000
2500
3000
Startle Stimulus Alone Trials
µV)
blo 1ck
Attend Ignore
blo 2NTROL
ck
*
CO A
AU
Cag
nitu
de (
0
500
1000
1500
2000
2500
3000
mgn
itu
e (µ
Attend Ignore
Startle Stimulus Alone Trials
Mea
n A
UC
ad
V)
block 1block 2
*
CANNABIS
*
B
Figure 4.11 Effects of cannabis on the startle reflex magnitude habituation at the Startle Stimulus Alone Trials during the Attend and the Ignore Tasks in controls (A) and in cannabis users (B). The bars represent critical difference for planned pairwise comparisons (CD = 255.08). The asterisks indicate significant differences in the startle reflex magnitude between blocks on each attentional task in controls and in cannabis users.
145

on itude at short lead-time intervals (mean 20 – 200 ms).
4.5.6.2 Habituation at Short Lead-Time Intervals
Table 4.11 summarises the effects of cannabis use, attention, block, and covariates
the startle reflex magn
Table 4.11 Effects of cannabis, attention, block, and covariates on the startle reflex magnitudeat short lead-time intervals (mean 20 – 200 ms)
Between subject-effects
df F p η2part Power
Cannabis use (THC) Cigarettes/day (CIG)
1 1
0.4 0.01
0.518 0.946
0.02 < 0.01
0.10 0.05
Drinks/week (ALC) MSerror
1 24
0.7 (1035237)
0.399 0.03
0.13
Within subject-effects df F
p η2
part Power
Attention (ATT)
ATT x ALC ATT x THC
1
1 1
10.7**
0.003 0.472
0.003
0.955 0.499
0.31
< 0.01 0.02
0.88 ATT x CIG
MSerror
1
24
0.252
(492688)
0.620 0.01 0.08 0.05 0.10
Block (BL)
1 5.6*
0.4 (98 6)
0.027
0.525
0.19
0.02
0.62
0.10
x BL x ALC ATT x BL x THC
1 0.9 (101 6)#
0.865 0.349
< 0.01 0.04
0.05 0.15
BL x CIG BL x ALC BL x THC
1 1 1
1.0 0.003
0.326 0.954
0.04 < 0.01
0.16 0.05
MSerror 24 29
Interactions ATT x BL ATT x BL x CIG ATT
MSerror (ATT x BL)
1 1 1
24#
0.6 0.2
0.03
51
0.443 0.627
0.02 0.01
0.12 0.08
Note. Values in parentheses represent mean sq rs (MSerror reviatio reef - partial eta squared (measure of effect size). Homo of va as me l l pendent variable both attentio sks (Append able E. ogen v iance matrices was met, Box’s M .7, F (df1 10, 3) = 2. .026 (0 ssumption of spheric always m ly two means are compared (Mauchly’s W = 1
nd hm = 13.71 used calculate critical difference for d pairw mpariso D =* p < 0.01
Table 4.11 sho that, similarl to Startle Stim
was attention d block on startle refl gnitud hort le
time 0 – 20 s). The justed and unadjusted for covariates
uare erro ). Abb ns: df- deg s of reedom, η2
part geneity riance w t for alevels of the de on nal ta ix E, T 7). Hom eity ofariance-covar = 24 df2 264 0, p = 0 p > .001). A ity is et when on).
#MSerror, df, a to planne ise co ns (C 251.16). p < 0.05 **
The data in w y ulus Alone Trials, there
a main effect of an the ex ma e at s ad-
intervals (mean 2 0 m means ad
146

are B)
res
graphed in Figures 4.12A and 4.12B, and Appendix D (Figures D.7A and D.7
pectively.
0
500
1000
1500
2000
2500
3000
Attend Ignore
Short lead-time intervals (mean 20 - 200 ms)
Mea
n A
UC
mag
nitu
de (µ
V)
block 1block 2
*
CONTROL A
0
500
1000
1500
AU
C m
agn
2000
itud
e (
2500
3000
Mea
n µV
)
Attend Ignore
Short lead-time intervals (mean 20 - 200 ms)
block 1block 2
CANNABIS B
Figure 4.12 Effects of cannabis on the startle reflex magnitude habituation at short lead-time ttend and the Ignore Tasks in controls (A) and in
Ignore Task in controls.
intervals (mean 20 – 200 ms) during the Acannabis users (B). The bars represent critical difference for planned pairwise comparisons (CD = 251.16). The asterisk indicates a significant difference in the startle reflex magnitude between blocks on the
147

Planned pairwise comparisons revealed that, at short lead-time intervals, habituat
of the startle reflex magnitude was significant only during the Ignore Task in contro
(similarly to hab
ion
ls
ituation on the Startle Stimulus Alone Trials, Figure 4.11A). In
ers.
4.5.6.3 Habituation at Long Lead-Time Intervals
Table 4.12 summarises the effects of cannabis use, attention, block, and covariates
on the startle reflex magnitude at long lead-time intervals (mean 1600 ms).
Table 4.12 Effects of cannabis, attention, block, and covariates on the startle reflex magnitude
part
contrast, habituation was not significant on both attentional tasks in cannabis us
at long lead-time intervals (mean 1600 ms)
Between subject-effects df F p η2 Power
Cannabis use (THC) Cigarettes/day (CIG)
MSerror
1 1
0.03 1.1
0.863 0.313
< 0.01 0.04
0.05 0.17
Drinks/week (ALC)
1 24
0.1 (1001005)
0.798 < 0.01 0.06
Within subject-effects df F p η
er 2part Pow
Attention (ATT)
ATT x ALC ATT x THC MS
ATT x CIG 1 0.1 0.793 < 0.01 0.06
error
1
1 1
24
14.6**
0.01 0.8
(799018)
0.001
0.926 0.378
0.38
< 0.01 0.03
0.96
0.05 0.14
Block (BL)
BL x ALC
1
1
13.3**
0.1
0.001 0.264 0.722
0.36 0.05
< 0.01
0.94 0.20 0.06
ATT x BL
ATT x BL x THC
1
1
0.6
0.5
0.460
0.467
0.02 0.01 0.02 0.02
0.11 0.08 0.11 0.11
BL x CIG 1 1.3
BL x THC MSerror
1 24
1.9 (292770)
0.183 0.07
0.26
Interactions
ATT x BL x CIG ATT x BL x ALC
1 1
0.3 0.6
0.609 0.459
MSerror (ATT x BL)
24# (305669)#
No s represent mean squa rrors (MSerror). Abbreviatio df- degrees ofquare easure of effect size). Homogeneity of vari s m
nt variable on both attentional sks (Appendi able E.8) mogeneiatrices was met, Box’s M F (df1 10, d ) = 0.4 .939. ty is always met when only two means are ed (M s W = 1
13.71 used e critical difference for d pair pariso D 2).
te. Values in parenthesefreedom, η
re e ns: ance wa
et for all 2
partde
- partial eta s d (mlevels of the pendevariance-covariance m
ta= 5.1,
x E, Tf 2643
. Ho, p = 0
ty of 2
Assumption of spherici compar awise com
uchly’ ). #MSerror, df, and hm = to calculat planne ns (C= 435.8**p < 0.01
148

block 1
500M
100
n
0
1500
2000
2500
3000
ma
V)
eaA
UC
gnit
ude
(µ
bloc NTROLk 2
*
CO A
0
Attend Ignore
Long lead-time intervals (mean 1600 ms)
0
500
3000 block 1block 2
CANNABIS B
2500
V)
1000
Attend Ignore
Mea
AU
C
1500
Long lead-time intervals (mean 1600 ms)
n m
ait
2000ude
(µgn
Figure 4.13 Effects of cannabis on the startle reflex magnitude habituation at long lead-time intervals (mean 1600 ms) during the Attend and Ignore Tasks in controls (A) and in cannabis users (B).
the
The bars represent critical difference for planned pairwise comparisons (CD = 435.82). The asterisk indicates a significant difference in the startle reflex magnitude between blocks on the Ignore Task in controls.
149

The data in Table 4.12 show that there was a main effect of attention and block o
the startle reflex magnitude at long lead-time intervals. The means adjusted and
unadjusted for covariates are graphed in Figures 4.13A and 4.13B, and
n
in Appendix D
(Figures D.8A and D.8B) respectively.
Planned pairwise comparisons revealed that, at long lead-time intervals, habituation
4.5.7 Cannabis, Attention, Lead-Time Intervals, and Startle Reflex Onset
t
the
s
muli.
e
of the startle reflex magnitude was significant only during the Ignore Task in controls
(similarly to habituation on the Startle Stimulus Alone Trials and at short lead-time
intervals). In contrast, habituation was not significant on either attentional tasks in
cannabis users.
In summary, on Startle Stimulus Alone Trials controls showed a significant
habituation only during the Ignore Task, while cannabis users showed a significant
habituation on both attentional tasks. On Prepulse and Startle Stimulus Trials (at both
short and long lead-time intervals), controls showed a significant habituation only
during the Ignore Task, while cannabis users showed lack of habituation on either
attentional task.
Latency
The fifth aim of the study was to investigate the effects of cannabis use on the onse
latency of the startle reflex on Prepulse and Startle Stimulus Trials compared to
onset latency of the startle reflex when no prepulses were presented (on Startle Stimulu
Alone Trials) with participants attending to or ignoring the prepulse and startle sti
Table 4.13 summarises the effects of cannabis use, attention, lead-time interval, and
covariates on the onset latency of the startle reflex.
The data in Table 4.13 show that there was a main effect of lead-time interval on the
onset latency of the startle reflex. The means adjusted and unadjusted for covariates ar
graphed in Figure 4.14 and Appendix D (Figure D.9) respectively.
150

Table 4.13 Effects of cannabis, attention, lead-time intervals, and covariates on the startle reflexonset latency during the Prepulse and Startle Stimulus Trials
Between subject-effects df F p η
r 2
part Powe
Cannabis use (THC) Cigarettes/day (CIG) Drinks/week (AMS
LC)
1 24
0.1 (346)
0.718 < 0.01 0.06 error
1 1
0.3 1.0
0.582 0.336
0.01 0.04
0.08 0.16
Within subject-effects df F p η
2part Power
Attention (ATT)a
ATT x CIG ATT x ALC ATT x THC
1 1 1 1
0.4 0.1 0.1 0.7
0.515 0.765 0.748 0.401
0.02 < 0.01 < 0.01 0.03
0.10.00.06 0.13
MSerror 24 (135)
0 6
Lead-time interval (LT)b
LT x CIG LT x ALC
MS
3^
LT x THC
3^ 0.6 0.601 0.03
00
0.18
ATT x LT x THC
^
3 0.2 0.874 0.01 0.09
error
3^
3^
76^
86.1** 1.7 0.2
(143)
< 0.0005 0.165 0.929
0.78 0.07
< 0.01
1.0.45 0.08
Interactions ATT x LTc
ATT x LT x CIG ATT x LT x ALC
MSerror (ATT x LT)
3^
33^
^
144#
2.5 0.6 0.6
(64)#
0.065 0.654 0.643
0.09 0.02 0.02
0.61 0.16 0.16
Note. Values in parentheses represent mean square errors (MSerror). Abbreviations: df- degrees of freedom, η2
part- partial eta squared (measure of effect size). Homogeneity of variance was met for all
Ignore Task). This single violation was of no importance, because there were no significant effects of
time interval = 0 ms; see Figure below). Homogeneity of variance-covariance matrices was met (Box’s M-test not computed due to fewer than two nonsingular cell covariance matrices). Assumption of sphericity is always met when only two means are compared (Mauchly’s W = 1).
levels of the dependent variable on both attentional tasks (Appendix E, Table E.9), but one (0 ms on
attention or cannabis use on the startle reflex onset latency on the Startle Stimulus Alone Trials (lead-
a
adjusted using Greenhouse-Geisser epsilon.
ons (CD = 6.06).
bAssumption of sphericity violated: Mauchly’s W (df 20) = 0.1, p < 0.0005- degrees of freedom
cAssumption of sphericity violated: Mauchly’s W (df 20) = 0.1, p < 0.0005- degrees of freedom adjusted using Greenhouse-Geisser epsilon. ^df adjusted using Greenhouse-Geisser epsilon due to lack of sphericity. #MSerror, df, and hm = 13.71 used to calculate critical difference for planned pairwise comparis
**p < 0.01
Planned pairwise comparisons revealed that in contrast to the Startle Stimulus Alone
Trials (lead-time interval = 0 ms) the onset latency of the startle reflex was significantly
reduced on Prepulse and Startle Stimulus Trials (lead-time intervals of 20 – 1600 ms).
This reduction was independent of cannabis use and attention.
151

80
90
0 20 40 80 100 200 1600
Lead-time interval (ms)
100ean 110
140
170
M o
na
y)
control attendcontrol ignorecannabis attendcannabis ignore
120
130
150
160
set l
tenc
(ms
* * * * * *
Startle Stimulus Alone Trials (lead-time interval = 0 ms) and the Prepulse and Startle Stimulus
In summary, regardless of the lead-time interval and attentional task, prepulses
facilitated onset latencies of the startle reflex, while inhibiting magnitudes at short-lead
time intervals and facilitating magnitudes at long lead-time intervals.
–
startle
Figure 4.14 Effects of cannabis and attention on the startle reflex onset latency at various lead-time intervals. The bars represent critical difference for planned pairwise comparisons (CD = 6.06). Theasterisks indicate significant differences between the startle reflex onset latency during the
Trials (lead-time intervals of 20 – 1600 ms).
4.6 Discussion
The results of this study provide physiological evidence for an association between
chronic cannabis use and schizophrenia. Specifically, cannabis users experienced a
schizophrenia-like reduction in PPI of the startle reflex at short lead-time intervals (20
200 ms) when attending to prepulse and startle stimuli relative to non-cannabis using
healthy controls (Figure 4.7). This reduction was observed either as levels of the
magnitude (Figure 4.6A) or as a percentage score (%PPI; Figure 4.7) due to effects of
attention on the startle reflex magnitude when prepulses were not presented (Figure
4.4). Cannabis use had no effects on the startle reflex magnitude in the absence of
152

prepulse stimuli (on Startle Stimulus Alone Trials; Figure 4.4) suggesting that the
reduction in PPI was not confounded by the effects of cannabis use on the startle reflex
ma
4.6.1 Cannabis Use, PPI, Protection of Processing and Sensorimotor Gating
The reduction of PPI in otherwise psychiatrically healthy cannabis users could be
interpreted in a number of ways. Firstly, cannabis use may be associated with
difficulties in processing of prepulse and startle stimuli. Specifically, Graham (1975)
hypothesised that PPI protects preattentive stimulus processing by finer stimulus
analysis during the period of stimulus recognition. Therefore, the reduction in PPI in
cannabis users could be interpreted as a deficit in such a protective mechanism, which
could arise from difficulties in perception of the prepulse and startle stimuli. However,
the lack of impact of cannabis use on the normal latency facilitation (Figure 4.14) and
startle reactivity at various startle stimulus intensities when prepulses were not
presented (Figure 4.4) indicates that cannabis users process prepulse and startle stimuli
as quickly as controls. Therefore, it is unlikely that the reduction in PPI in cannabis
users was due to a primary deficit in perception of stimuli leading to a faulty protection
of processing.
Secondly, the PPI reduction in cannabis users may be associated with schizophrenia-
like deficit in sensorimotor gating in healthy humans. Specifically, cannabis users,
similarly to patients with schizophrenia, may have difficulties in preattentive stages of
information processing in terms of being unable to filter out (‘gate’) the unwanted
sensory stimuli (Braff & Geyer, 1990). Such deficit in filtering of stimuli could lead to
sensory overload (Braff & Geyer, 1990) and subsequent development of schizophrenia
in cannabis users. However, regardless of the fact that the reduction in PPI was even
more pronounced in longer users of cannabis (Figure 4.10B), none of the participants in
the current study reported lifetime symptoms of schizophrenia and only one participant
gnitude.
153

reported symptoms of depression in the last 12 months. In fact, PPI deficit may prec
cannabis use in psychiatrically healthy individuals; that is, people with deficits in PPI
may be more likely to become chronic cannabis users than those without these deficits.
If such PPI deficit is a vulnerability factor for schizophrenia, then, in combination with
other factors, such as family history, it could contribute to prodromal phase of the
illness. During such phase cannabis could be used to self-medicate the positive
symptoms, because, acutely, cannabis has calming effects (Solowij, 1998). The
negative prodromal symptoms, such as social withdrawal and apathy, could also
targeted, because cannabis use involves social contacts with other users and/or dealers.
While acute use of cannabis could contribute to self-medication of positive and negative
symptoms, prolonged cannabis use could contribute to further reduction in PPI, possi
elevation of the positive symptoms, including paranoia, and the final development of
full-blown psychosis. However, cannabis could also be used for other reasons unrelated
to PPI, such as social interactions and to have something to do. Therefore, the reduction
in PPI in cannabis users cannot be explained by a primary deficit in sensorimotor ga
in terms of problems with filtering of sensory stimuli leading to development of
schizophrenia. Longitudinal studies are needed to establish the temporal relationsh
between cannabis use and reduction in PPI.
ede
be
ble
ting
ip
4.6.2 Cannabis Use and Attentional Modulation of PPI
The PPI deficit in the current study was clearly related to the effects of cannabis use
on attention due to a significant interaction between cannabis use and attention.
Specifically, the reduction in PPI was observed only when participants were instructed
to attend to auditory stimuli, but not when they were required to ignore them (Figures
4.6A, 4.6B, and 4.7), similarly to observations in schizophrenia patients (Dawson et al.,
1993; Dawson et al., 2000). Therefore, it appears that at short lead-time intervals
cannabis use may be associated with attentional dysfunction resembling that observed in
154

schizophrenia. Cannabis users may have difficulties in focusing attention on relevant
stimuli, filtering out of irrelevant information, or they may use differential attentional
resources and strategies to evaluate stimuli relative to healthy controls (Kempel et al.,
2003; Solowij, 1995a; Solowij et al., 1991, 1995b).
On the one hand the current data suggest that cannabis use may have a global effect
on
120
t sensory modality. Furthermore, cannabis use had no
eff
sk,
ffect on attention in the current
study.
In agreement with Dawson and colleagues’ findings (1993) schizophrenia patients in
the current study did not show attentional modulation of PPI (Figure 4.8). However, in
contrast to Dawson et al.’s findings, controls in the current study failed to show a
significant increase in PPI and PPF on the Attend versus Ignore Tasks at short and long
lead-time intervals respectively (Figures 4.7 and 4.9). The lack of significant attentional
modulation of PPI and PPF in controls could be due to a number of differences between
the two studies. Firstly, the current study employed a passive Attend Task (the degree
of attending to stimuli was not measured), while the Dawson’s group used an active
attention paradigm by offering monetary rewards for correctly reporting the number of
longer-than-usual high-pitch prepulse stimuli. Secondly, the Ignore Tasks differed even
more substantially between the two studies. Participants in Dawson et al.’s study were
attention, because the reduction in PPI was observed at all short lead-time intervals
(20 – 200 ms) relative to only one lead-time interval in the Dawson et al.’s studies (
ms). However, the dependence of the attentional modulation of PPI on the lead-time
intervals in the Dawson et al.’s studies may be due to different levels of attention to the
auditory stimuli used in these studies, whereas in the present study attention was
diverted to an entirely differen
ects on attentional modulation of the startle reflex magnitude when prepulses were
not presented and the reduction in PPI was observed only during one attentional ta
suggesting that cannabis use did not have a global e
155

instructed to ignore only the low pitch prepulses and the two attentional tasks were not
separated, as was the case in the current study. The ignore component of the Dawson’s
gro
. In
.
ude,
nt
at playing the computer game
an
nitude
he
n
and
up task involved substantial amount of attention to discriminate between the high
and the low-pitch prepulses before the low pitch prepulses could have been ignored
contrast, a computer game (the Block Game) was used to divert attention away from the
auditory modality to a different modality (visuo-motor modality) in the current study;
however, the degree to which the game diverted attention was not measured. Most
participants thought that, relative to the Attend Task, the Ignore Task was shorter and
the sounds were quieter, while in fact the auditory stimuli were identical in both tasks
Such subjective reports could be used as an indication that participants indeed ignored
the auditory stimuli and attended to the game. Thirdly, the motor action of pushing
buttons on the computer game may have contributed to the discrepancies between the
two studies. The potential confound of the performance requirement of the Ignore Task
on attentional modulation of PPI was investigated and the results are reported in the
subsequent chapter (Chapter 5). Fourthly, the lack of attentional modulation of PPF in
controls may have resulted from an affective modulation of the startle reflex magnit
and thus PPF, related to playing a computer game (satisfaction or anger) in the curre
study. In general, positive emotions attenuate, while negative emotions increase the
magnitude of the startle reflex (Lang et al., 1990). Therefore, one group of participants
in the current study may have experienced more pleasure
d show an overall pleasant-affect suppression of the startle reflex magnitude.
However, cannabis users showed attentional modulation of the startle reflex mag
on Startle Stimulus Alone Trials similar to that of controls (Figure 4.4), discounting t
possibility that there was a difference in emotional modulation between the groups.
Fifthly, the lack of attentional modulation of PPI and PPF in controls could have bee
due to the fact that the two studies used different short and long lead-time intervals
156

different parameters of prepulse stimuli (high and low pitch vs. one pitch in the curren
study). Finally, the relatively low power of the PPF data (power for the interaction
between cannabis use and a
t
ttention of 0.07; Table 4.8) in the current study may have
co
be
y
s
changes in PPI following the ‘attend’ and the ‘ignore’
ins
r
nnabis use and schizophrenia could have a
differential effect on such non-specific arousal/activational system, although there is no
direct evidence to support such speculations.
Cannabis use was not associated with attentional modulation of PPF suggesting that
cannabis use may not be affecting all selective attentional processes. However, as
mentioned before, the low power of the PPF data (Table 4.8) may have contributed to
the Type II error in retaining the null hypothesis. Therefore, a repetition of the current
study with a larger power would determine if cannabis use has no effects on some
aspects of selective attention.
ntributed to the lack of significant attentional modulation of PPF. Therefore, a
replication of the study with greater power could determine if the null hypothesis can
accepted with some confidence.
Even though the patient data collected in the current study could only be interpreted
as a pilot study, it appears that the effects of cannabis use and schizophrenia on PPI ma
differ when participants are instructed to ignore the auditory stimuli (Figure 4.8). It ha
been suggested that the
tructions could be related to selective, stimulus specific effects on the Attend Task,
and non-specific arousal/activational effect on the Ignore Task (Filion et al., 1998).
However, no evidence for such non-specific/activational effect was found in healthy
humans because the similar amounts of inhibition were produced in participants eithe
instructed to ignore prepulse stimuli or in participants not given any attentional
instructions (Jennings et al., 1996). Both ca
157

In summary, the current study suggests that the schizophrenia-like reduction
observed in chronic cannabis users is secondary to the effects of cannabis use on
attention rather than a primary deficit in PPI itself.
in PPI
4.6.3 Cannabis Use, PPI, and Cognitive Functioning
Apart from altering the attentional modulation of PPI, chronic cannabis use was also
associated with abnormal habituation of the startle reflex either when prepulses were
absent (on Startle Stimulus Alone Trials) or present at short and long lead-time
intervals. The impairment of habituation in cannabis users was similar to observations
so phrenia patients (Braff et al., 1995).
ist
tion of
s in
2 controls used cannabis more than 12 month since the
metimes (but not always) reported in schizo
Abnormal habituation in cannabis users could be due to cannabis-induced short-term
memory dysfunction (Solowij, 1998), because habituation is a simple form of memory
(Staddon et al., 2002). The impairment in habituation may have also contributed to
abnormal attentional modulation of PPI in cannabis users, because habituation is likely
to contribute to selective attention (Braff et al., 1995). Furthermore, the lack of
habituation on the Attend Task during short lead-time intervals (20 – 200 ms; Figure
4.12B) in cannabis users suggests that the reduction in PPI was not confounded by the
habituation of the startle reflex magnitude.
The current data cannot be used to determine whether the deficit in PPI would pers
or be reversed after the cessation of cannabis use. A reversal of PPI deficit would
support the argument that cognitive impairments in long-term cannabis users are
reversible and depend on the current use (Fried et al., 2002; Pope et al., 2001; Pope et
al., 1995; Skosnik et al., 2001). In contrast, persistent PPI deficit following cessa
cannabis use would indicate that cannabis use contributes to the long-lasting deficit
cognitive function (Bolla et al., 2002; Solowij, Babor, Stephens, & Roffman, 2002b;
Solowij et al., 2002a). Based on the current study two interesting speculations could be
made. Firstly, five of the 1
158

testing session. Therefore, the significant reduction in PPI in cannabis users relative to
controls including past users suggests that the PPI deficit may be reversible if cann
use ceases. On the other hand, the cannabis group contained four participants w
traces of cannabis in their urine, two of whom were daily users until about four m
prior to the testing session. Including or excluding such participants who had used
cannabis in the last 12 months, but not recently before the testing session, made no
difference in terms of the reduction in PPI. Therefore, it appears that PPI deficit may b
reversible if cannabis is not used for more than 12 months. This speculation would need
to be assessed using well-designed longitudinal studies.
The results of the current study support the findings of others (Solowij et al., 1995b
Solowij et al., 2002a) in that the total duration of use rather than the residues of
cannabis in the body (concentration of cannabinoid metabolites in urine) seem to be
associated with cognitive deficits in cannabis users. It may be the case that gradual
adaptation of the nervous system to prolonged exposure to exogenous cannabinoids
could alter the endogenous cannabinoid system or other neurotransmitter systems
(Solowij et al., 2002b). Such changes could, therefore, lead to further worsening and
development of a permanent PPI deficit. Longitudinal studies would be needed to
investigate this possibility.
Another suggestion is that cannabis use could have a more pronounced impact on the
cognitive function depending on the earlier age of first use (Ehrenreich et al., 1999;
Fried et al., 2002; Kempel et al., 2003). Similarly, puberty in rats was a vulnerability
period for cannabinoid effects on PPI, while adults treated with cannabinoid agonists
did not show PPI deficits (Schneider & Koch, 2003). There was insufficient range of
the age-of-onset in the current study to determine if there was a relationship between
this variable and PPI.
abis
ith no
onths
e
;
159

In summary, the PPI reduction and deficient habituation in the current study sugges
that chronic cannabis use is associated with cognitive dy
t
sfunctions in terms of attention
an
4.6.4 Cannabis Use and Startle Reflex Latency
Finally, the results of the current study suggest that there were no effects of cannabis
use and attention on the startle reflex onset latencies at all lead-time intervals. In
contrast to the PPF data, the lack of significance in the onset latency data appears to be
due to lack of differences in means (Figure 4.14) rather than low power.
While the magnitude of the startle reflex can be altered by attention, the timing of the
reflex is unaffected by attentional domain. Therefore, the reduction in onset latency and
reduction in peak magnitude are independent processes controlled by different pathways
in the brain.
The functional relevance of prepulse-mediated latency reduction is not well
understood. The facilitation of onset latency does not support the protection of
processing hypothesis (Graham, 1975), because protective reduction in the magnitude of
the startle reflex should be accompanied by delay rather than facilitation of the startle
reflex latency. Furthermore, as discussed above, the lack of effects of cannabis use on
the startle reflex onset latency suggests that cannabis users could perceive the prepulse
and the startle stimuli and respond to them as quickly as controls. Future studies are
needed to establish the functional significance of the startle reflex latency facilitation.
d memory. These dysfunctions were related to the total duration of cannabis use
rather than cannabis residues in the body. Future studies are needed to determine if
such dysfunctions would persist after the cessation of cannabis use and whether they are
related to the age of onset of cannabis use.
160

4.6.5 Limitations of the Current Study
There were a number of limitations of the current study. Firstly, problems with
recruitment of suitable participants contributed to small group sizes. Specifically, the
illegal nature of cannabis use might have deterred some volunteers from the general
population to participate in the study. Similarly, regardless of confidentiality assurance,
cannabis-using schizophrenia patients were reluctant to participate in the current study.
The reasons behind such decisions included the need to either travel to the psychiatric
hospital or to disclose information regarding cannabis use while being an in-patient at
the major psychiatric hospital in Western Australia, where the current study was
conducted. Interestingly, many regular cannabis-using patients were unmotivated
participate in research and when contacted often admitted to their use of cannabis, but
refused to travel to the hospital, even if an offer of return transport was made. This
observation could provide some anecdotal ev
to
idence for cannabis use being associated
he time
ed
o typical
an et
with the amotivational syndrome described in some studies (Tunving, 1987). In
addition, due to geographic isolation of Perth the limited number of schizophrenia
patients living here have been previously tested in multiple studies and thus refused to
participate in more research. Therefore, the current study should be replicated using a
larger sample of patients.
Secondly, patient data was confounded by the pharmacological treatment at t
of testing. Specifically, all patients in the current study were treated with typical
neuroleptics, atypical neuroleptics (the most common medicines prescribed to
schizophrenia patients in Australia; Daniel Rock, personal communication), or a
combination of both. Studies of the effects of antipsychotic medications on PPI show
that PPI deficits may not be observed in patients treated with atypical relative t
neuroleptics (Kumari et al., 2000; Kumari et al., 1999a, 2002a; Leumann et al., 2002;
Oranje et al., 2002), although such effects were not observed in other studies (Dunc
161

al., 2003a; Duncan et al., 2003b; Graham et al., 2001; Mackeprang et al., 2002). PPI
could also be differentially altered by higher circulating doses of typical neuroleptics
following a depot injection, although this issue has not been investigated to date. Apart
from neuroleptics, patients in the current study were also treated with other medications
including antidepressants, mood stabilisers, and anticholinergic drugs. All of these
medications have been found to differentially affect PPI (Abduljawad et al., 2001
Kumari et al., 2003; Kumari et al., 2001b; Martin-Iverson and Neumann, unpublished
data). The best way to overcome the effects of medication on PPI would have been to
test patients before they received medication, however patients in acute psychotic state
may have not been able to give informed consent a
;
nd comply with requirements of the
ruited
f
n
ital
es
ed
study. Therefore, the study should be conducted in patients, who should preferably be
treated with typical neuroleptics alone and be stringently matched on their medication
status with cannabis-using patients. Due to time restriction of a PhD study such criteria
were too difficult to meet and thus it was decided to focus the current study on healthy
controls. The strength of the current study was that the healthy controls were rec
from the general community of Perth to closely match them with the patients in terms o
IQ, educational level, and socioeconomic background. These issues are often ignored i
PPI research and thus most control participants are recruited from university/hosp
staff and students. However, such participants may not be a representative sample of
the general population to be matched with the patients.
Thirdly, due to recruitment problems a decision was made to recruit both males and
females. Even though the groups did not differ in terms of relative distribution of mal
versus females (Table 4.2), the inclusion of females in the study may have contribut
to some PPI variation. Specifically, rat and human studies have shown that females
exhibit a reduction in PPI relative to males (Swerdlow et al., 1993a; Swerdlow et al.,
1999b), particularly at luteal phase of menstrual cycle, corresponding to peaks of
162

estrogen and progesterone activity (Koch, 1998; Swerdlow, Hartman, & Auerbach,
1997). In contrast, administration of estrogen alone increased PPI in ovariectomised ra
females (van den Buuse & Eikelis, 2001). These results suggest that sex hormones may
have differential effects on PPI, which may have increased the variance in the data of
the current study. Therefore, the current study should be replicated using male samples
alone.
Fourthly, various methodological issues regarding the acquisition of the startle reflex
data could have confounded the results of the current study. The lack of response to
startle stimuli, as evidenced by low startle reflex magnitude (< 10 µV) on the Startle
Stimulus Alone Trials, contributed to exclusion of 18 participants. It was unlikely that
such lack of response to the
t
startle stimuli was due to cannabis-related deficits in
pe -
ed
the
to
e
rception of stimuli, because half of the excluded participants were users and half non
users of cannabis. However, the unresponsiveness to startle stimuli might have result
from problems with detection of either the auditory stimuli due to hearing disorders,
presence of which was not formally tested in the current study, or, most likely, due
problems with detection of the EMG signal by the electrodes. In order to acquire the
EMG data standard surface electrodes were used, which, unlike needle electrodes, are
non-invasive and thus less selective. In fact, surface electrodes detect broad firing of
motor units, which correlates with the overall muscle contraction (Lawrence & De
Luca, 1983) and they can detect EMG signals in other facial muscles (Fridlund &
Cacioppo, 1986). Therefore, the placement of the electrodes is crucial for obtaining a
quality EMG signal. However, even after cleaning the skin with alcohol swab, the
surface electrodes are difficult to place on some skin types (for instance, wrinkly or oily
skin), as was the case with some participants in the current study. Therefore, to prevent
recordings of a poor signal the electrode resistance should be measured prior to data
collection (Meincke, Morth, Vo, & Gouzoulis-Mayfrank, 2002). In addition, the startl
163

reflex was assessed using a unilateral measurement (left orbicularis oculi muscle only)
However, it would be interesting to record the EMG signal from both muscles to
investigate any potential effects of laterality on PPI (Swerdlow, Braff, & Geyer, 1999a).
Such effects could potentially confound the association between cannabis use and
attentional modulation of PPI.
.
th
PI
to
rge
in
and
gh
in
e
ount of
Fifthly, the properties of auditory stimuli used in the current study may have affected
the results. Specifically, the effects of cannabis use on different prepulse intensities
were not investigated in the current study due to a large number of trials and the leng
of each task (29 minutes per task). However, the effects of various substances on P
seem to be dependent on the intensity of the prepulse. For instance, in rats, reduction in
PPI mediated by cannabinoid agonist, CP 55940, was reversed by cannabinoid
antagonist, SR 141716A, only on trials with low prepulse intensity of 73 dB relative
85 dB (Martin et al., 2003). Similarly, apomorphine reduced PPI in rats only if the
difference between the background noise level was small (less than 10 dB) but not la
(over 10 dB; Davis, 1988; Davis et al., 1990). However, in humans, the reduction
PPI in schizophrenia was observed across a range of prepulses indicating that
schizophrenic patients suffer from a general inhibitory impairment (Grillon et al., 1992).
Similarly, in the current study, PPI was reduced at all short lead-time intervals
cannabis use seemed to have no effect on various startle stimulus intensities, althou
the startle stimuli differed from prepulses (white noise vs. pure tone). The reduction
PPI in the current study might have been even more pronounced if discrete white nois
prepulse stimuli were used, because such prepulses produced the most PPI reduction in
schizophrenia patients and in healthy controls (Braff et al., 2001; Wynn, Dawson, &
Schell, 2000). However, healthy participants showed that attending to different
prepulses (tones of two intensities or a broadband noise) produced the same am
PPI (Acocella & Blumenthal, 1990). Therefore, the current study should be extended to
164

investigate whether different prepulse intensities and modalities would alter the effects
of cannabis use on attentional modulation of PPI.
Sixthly, four participants were excluded due to presence of mental illness diag
within 12 months since the testing session on the CIDI-Auto 2.1. Also, a number of
cannabis users reported lifetime symptoms of mental illness other than schizophrenia.
This finding prompted a short investigation reported in Chapter 6. In general, problem
with recruitment of ‘normal’ controls for research are widely documented in the
literature. In particular, a high percentage of participants volunteering for behavioura
studies have some psychopathology. For instance, only 13% of 3289 volunteers, who
responded to an advertisement for normal controls in behavioural research, were
included as controls in ongoing studies (Huang, Koo, Dougherty, & Hassan, 2003). T
high rates of psychopathology in volunteers for psychiatric research may be due to
different motivations to participate in such research (Olson, Bornstein, Schwarzkopf, &
Nasrallah, 1993). For instance, some volunteers may be curious about mental illness
having witnessed such illness in family members or friends, while others may seek
evaluation of their own perceived psychopathology. Furthermore, the four mental
illness diagnoses in the current study could be due to participants’ misinterpretation of
some items exploring psychotic experiences on the self-completed interview, CIDI-
Auto 2.1 (Eaton, Romanoski, Anthony, & Nestadt, 1991; Jablensky, 1995; Verdoux et
al., 1998). In fact, CIDI appears to overestimate the diagnoses of anxiety, depression,
and psychosis (Kendler et al., 1996; Peters & Andrews, 1995). Therefore, the high ra
of mental illness in the current study could be due to lack of confirmation of the CIDI
diagnoses with other information to improve the valid
noses
s
l
he
tes
ity of the instrument (Dawe et al.,
e
to
2002). Furthermore, some controls (five) have been past cannabis users, although hav
not used cannabis in the last 12 months since the testing session. Unfortunately, due
time and cost of research it is impossible to find ‘ideal’ participants for human PPI
165

studies and other studies in this area often do not control for as many factors as the
current study. Other human studies also report similar exclusionary rates (f
Swerdlow et al., 2002a).
Seventhly, the groups were not matched on the frequency of nicotine users and the
number of cigarettes per day and alcoholic drinks per week due to high exclusionary
rates. In general, cannabis use is associated with high rates of other substance u
particularly nicotine (Degenhardt et al., 2001b). Therefore, participants with urine
samples positive for substances of abuse, including amphetamine and benzodiazepines
(n = 3), were excluded from all analyses. However, due to a high prevalence of n
and alcohol use among cannabis users, participants using these substances could not
have been excluded from the final analyses. In general, the effects of alcohol on PPI a
not well understood, although it appears that acutely there is an interaction between
two substances in rats (Stanley-Cary et al., 2002). Specifically, cannabinoid agonist,
55940, dissolved in alcohol reduced PPI in rats, while CP 55940 increased PPI when
dissolved in a commonly used detergent solution, Tween 80 (Stanley-Cary et al., 2002
Acute administration of ethanol also reduces PPI in rats and in healthy humans (Grillo
et al., 1994; Hutchison et al., 2003; Wecker & Ison, 1984). For this reason, none of the
participants were under an influence of alcohol at the time of testing, as evidenced by
the urine screen and verbal self-reports. Furthermore, the number of alcoholic dr
per week was used as a covariate in the ANCOVA and there were no main effects or
interactions between alcohol use and any of the dependent variables tested in the curren
study. Therefore, it can be speculated that ANCOVA removed some variance related to
alcohol use and that alcohol use had no effects on
or instance,
se,
icotine
re
the
CP
).
n
inks
t
PPI in the current study.
ate in
e
Apart from alcohol, the number of cigarettes per day was also used as a covari
the current study. In contrast to alcohol, the nicotine use covariate contributed to on
significant interaction with lead-time intervals (Table 4.5) and one significant main
166

effect (Table 4.7). Further investigation of these effects using standard regression
revealed a nearly significant reduction in %PPI with the increased number of ci
per day. Therefore, the association between cannabis use and %PPI may be due to the
combination of both substances. However, the results of other studies suggest that
acutely nicotine increases PPI in rats, healthy humans and patients with schizophreni
(Acri et al., 1994; Curzon et al., 1994; Della Casa et al., 1998; Duncan et al., 2001;
Kumari et al., 1996; Kumari et al., 1997; Kumari et al., 2001a). In contrast, acute
treatment with nicotine had no effects on PPI in rats and chronic treatment with nic
reduced PPI in the same study (Mirza et al., 2000). It appears that such variable effects
of nicotine on PPI in rats could be due to various species, doses, and prepulse
intensities. PPI was also reduced in healthy humans depending on the strength of
cigarettes smoked immediately before the session (Hutchison et al., 2000). Finally
Kumari and colleagues showed that healthy participants more dependent on nicotine
(reporting higher scores on Fagerstrom Tolerance Questionnaire, FTQ) had a lower PP
compared to non-nicotine users (Kumari & Gray, 1999b). Therefore, the effects o
nicotine on PPI may depend on the nicotine content of the cigarettes, acute effects of
use, degree o
garettes
a
otine
,
I
f
f dependence upon nicotine, and the effects of nicotine following
withdrawal period compared to normal ad lib smoking. However, in the current study,
acute nicotine use could not have confounded the PPI results, because the participants
were required to refrain from smoking for one hour before the study. This requirement
was adhered to because participants spent one hour with the author of the thesis
providing a written consent, completing various questionnaires (handedness, substance
use questionnaires; refer to Chapter 2), IQ test, and being prepared for the startle reflex
testing. The groups were also matched on the recency of nicotine use, suggesting that
the acute effects of nicotine use on PPI were balanced between the two groups. In terms
of chronic nicotine use, there were no effects of nicotine dependence (assessed with
167

FTND scores) on PPI in the current participants in contrast to the results by Kumari
colleagues (1999b). This discrepancy could be explained by some methodological
differences between the two studies. Specifically, the current study used an updated
version of FTQ (FTND) with better psychometric properties (Heatherton et al., 1991).
Furthermore, participants in the current study were light smokers (0.1 – 10 cigarett
per day in the last 12 months) in contrast to heavier smokers in Kumari et al.’s study (all
participants smoked more than 10 cigarettes per day). The two studies also utilise
different intensities of prepulse and startle stimuli, and different lead-time intervals.
Therefore, even though it cannot be conclusively determined in the present study, the
evidence suggests that the interaction found in the current study is due to cannabis use
rather than nicotine use. Even if chronic nicotine use affects PPI then most studies
PPI in patients with schizophrenia would be confoun
and
es
d
of
ded by nicotine, because patients
wi
d
tial
cannabis consumed by the users. Such measurement is difficult due to different potency
of cannabis plants, in contrast to other substances, such as known nicotine content in
various cigarette brands, varying methods of cannabis use, absorption and
bioavailability, potential interaction with other substances, such as nicotine, and
accumulation of cannabis in body adipose tissue. All these factors could account for the
users being exposed to variable amounts of cannabis, which could have differential
effects on PPI. However, the recency of use and the concentration of cannabis
me bolites in urine had no effects on PPI in the current study (Figure 4.10A and B),
suggesting that the amount of cannabis residues in the body may not be related to any
th schizophrenia and cannabis users consume more nicotine than healthy controls
(Hughes, Hatsukami, Mitchell, & Dahlgren, 1986). Therefore, all studies of PPI shoul
control for acute and chronic effects of nicotine use.
Eighthly, cumulative doses of cannabis stored in the body could have differen
effects on PPI. Thus, it would have been interesting to quantify the total amount of
ta
168

changes in PPI. Instead, the reduction in PPI was related to the total duration of
cannabis use. However, such duration of use was calculated as the difference between
the age of last- and first-ever use. Therefore, the ‘duration of use’ measure may have
been confounded by the abstinence periods in some users and lack of information
regarding the frequency and amount of use. In general, it is difficult to establish the
precise duration of substance use, due to problems with deciding when the use becomes
regular (whole joint vs. occasional puff from another person) and when it ends (using
cannabis only when available vs. regular daily use). Therefore, the ‘duration of use’
measure in the current study tried to avoid such issues regarding the regularity of use by
establishing when the first- and the last-eve
data
Specifically, P
than monthly users) or more frequent users (daily to at least weekly users). Therefore,
the total duration of use rather than t ency of cannabis use appear to be
s
ems
tion to the endogenous cannabinoid system, changes in
cellular signalling, and genetic abnormalities resulting in faulty functioning of
cannabinoid receptors. Furthermore uld have altered the functioning of
een
r use took place. Furthermore, the current
suggest that the regularity of cannabis use had no effects on PPI reduction.
PI was reduced during the Attend Task either in all users (daily to less
he amount/frequ
associated with PPI reduction in healthy users.
Finally, the current study did not investigate the neurobiological mechanism
underlying the effects of cannabis use on PPI. In general, PPI deficit in the current
study could have been related to the effects of cannabis use on neurotransmitter syst
affected in schizophrenia, disrup
, cannabis use co
the neural networks controlling the startle reflex. These possibilities were reviewed in
detail in Chapter 1, sections 1.6 and 1.7.2. While PPI reduction in the current study
could have been due to any and/or all of the above options, most of them have not b
adequately researched to date. The possibility supported by a large amount of evidence
is that the reduction of PPI could be related to cannabis-mediated alteration in the
169

dopamine transmission in the brain. Specifically, dopamine and its direct and ind
agonists reduce PPI in rats (for review refer to Chapter 1). Therefore, a reduct
could be mediated by cannabis-related increase in dopamine transmission. However,
such increase in dopamine transmission could trigger a negative feedback control
mechanism to reduce dopamine neuron activity in antipsychotic-like fashion (Stanley-
Cary et al., 2002). Therefore, the reduction in PPI in chronic cannabis users could be
related to a net decrease in the dopamine transmission in the brain, although this
possibility would need to be investigated in future studies using various brain scanning
techniques.
irect
ion in PPI
4.6.6 Conclusion
In summary, the results of the current study provide physiological evidence for
comorbidity between cannabis use and schizophrenia in terms of schizophrenia-like
reduction in PPI in otherwise healthy cannabis users. However, the results of the study
cannot be interpreted in terms of cause or effect relationship between cannabis use and
schizophrenia. The reduction in PPI was secondary to the effects of cannabis use on
attention rather than a primary deficit in sensorimotor gating. The lack of effects of
cannabis use on the startle reflex onset latency and magnitude when prepulses were not
presented suggests that cannabis use was unrelated to deficits in stimulus detection and
processing. The reduction in PPI was related to the chronic effects of cannabis use
because PPI was reduced even fu in the total duration of use. In
cy of
rther with the increase
contrast, the reduction in PPI was unrelated to acute effects of cannabis use (recen
use and cannabinoid metabolites in urine) nor the amount and frequency of use in the
preceding 12 months. Cannabis use was also associated with abnormalities in the
magnitude habituation of the startle reflex likely due to cannabis-related deficit in short-
term memory. It would be of interest to determine if the reduction in attentional
modulation of PPI in chronic cannabis users is secondary to a primary effect on short-
170

term memory or is an independent primary effect on attention. The lack of effects of
cannabis use on attentional modulation of PPF suggests that cannabis use may not be
associated with deficits in all kinds of selective attention providing that the lack of
significant differences is not due to a lack of power.
The PPI results of the current study should be compared to results obtained from
schizophrenia patients using and not using cannabis to find out whether the effects of
cannabis and schizophrenia on PPI are additive. Longitudinal prospective studies ar
needed to investigate whether the changes in PPI precede or follow the onset of
cannabis use and if the reduction in PPI persists following cessation of cannabis use.
e
171

CHAPTER 5. EFFECT OF FINGER MOVEMENTS ON
ATTENTIONAL MODULATION OF THE STARTLE
REFLEX MAGNITUDE AND LATENCY
5.1 Preface
The attentional modulation of the startle reflex magnitude and lack of attentional
modulation of the startle reflex onset latency, reported in Chapter 4, could be
confounded by a motor action of pushing buttons on the computer game used to divert
attention on the Ignore Task. Therefore, a pilot study, reported in this ch
apter, was
performed to address this issue.
reflex magnitude, but not onset latency, can be achieved when participants
sim puter game. However, the motor action of pushing buttons on the computer
itude
an
att
pa e
co nd
pla e reflex was recorded from
sta ith
the ter
4.
5.2 Abstract
Background. Previous research in this thesis suggests that attentional modulation of
the startle
either attend to prepulse and startle stimuli, or ignore such stimuli while playing a
ple com
game could potentially affect the attentional modulation of the startle reflex magn
d onset latency. Therefore, the aim of the current study was to investigate the
entional modulation of the startle reflex magnitude and onset latency when
rticipants either attended to auditory stimuli and concurrently pushed buttons on th
mputer game without playing the game (Attend Task), or ignored auditory stimuli a
yed the game (Ignore Task). Methods. Auditory startl
orbicularis oculi muscle in eight undergraduate university students (pilot study). The
rtle magnitude and onset latency for the pilot study participants were compared w
results obtained from 12 healthy controls, non-users of cannabis reported in Chap
All participants were required to attend to prepulse (70 dB) and startle stimuli (100
172

dB
gu
pa ter
ga
lea
tw eral
mo
Co ency in
umans is independent of the motor action of pushing buttons on a computer game.
5.3 Introduction
Evidence from Chapter 4 suggests that attentional modulation of startle reflex
magnitude, but not latency, can be achieved when participants either attend to startle
and prepulse stimuli during the Attend Task, or ignore such stimuli and instead play a
simple hand-held computer game during the Ignore Task. However, playing a computer
game could introduce a potential confound into the study. Specifically, the motor action
of pushing buttons on the computer game could confound the attentional modulation of
the startle reflex magnitude and the lack of attentional modulation of the startle reflex
onset latency due to potential response competition. The effects of such motor action
could not have been statistically removed, for instance with the help of analysis of
ovariance. Thus, a pilot study was conducted during which a modified Attend Task
inger movements. Specifically, during the modified
nd
the main studies (Chapter 4) and required the participants to play a Block Game and
) during the Attend Task and ignore auditory stimuli and play a hand-held visually-
ided computer game during the Ignore Task. In addition, during the Attend Task the
rticipants in the pilot study were instructed to randomly push buttons on the compu
me without playing the game. The prepulses were presented at either short or long
d-time intervals before the startle stimuli, the length of which differed between the
o studies. Thus, the results of the two studies were compared informally for gen
trends. Results. Inspection of the data revealed the same trends in attentional
dulation of the startle reflex magnitude and onset latency across the two studies.
nclusion. Attentional modulation of the startle reflex magnitude and onset lat
h
c
was introduced to control for the f
Attend Task participants in the pilot study were instructed to listen to the prepulse and
startle stimuli, as in the main study, and, in addition, randomly push buttons on the
Block Game without playing the game. The Ignore Tasks were identical in the pilot a
173

ignore all auditory stimuli. The aim of the pilot study was to investigate the attentional
modulation of the startle reflex magnitude and onset latency using a modified Atte
Task and co
nd
mpare the results to the data obtained in the main study (Chapter 4). It was
hypothesised that pushing buttons on the computer game during the Attend Task in the
pilot study would alter the attentional modulation of the startle reflex magnitude and
onset latency observed during the main study. If this were true, then the attentional
modulation of the startle reflex magnitude and onset latency would differ between the
main study and the pilot study. The alternative hypothesis was that pushing buttons on
the Attend Task would have no effects on attentional modulation of the startle reflex
magnitude and onset latency suggesting that motor action is not a confound in the main
study. In line with this hypothesis, there would be no differences in attentional
modulation of the startle reflex magnitude and onset latency observed between the two
studies.
5.4.1 Participants
ersity
ta
the 12
5.4 Methods
This study was approved by the Human Research Ethics Committee at the Univ
of Western Australia in Perth. Following signing a written informed consent, eight
undergraduate neuroscience students at the University of Western Australia participated
in this study as a part of their laboratory class in March 2001. The experiment was
designed and the data collection was supervised by the author of this thesis. The da
obtained from these participants (pilot study) were compared with the data for
controls (non-users of cannabis) described in Chapter 4 (control study).
174

5.4.2 Procedure
The procedures regarding collection of the startle reflex data were identical to thos
described in
e
Chapter 4. The pilot study differed from the control study in the following
l
Attend
constraints the experiment was designed to fit in with the
neuroscience class timetable, such udents as possible could complete
the study during their laboratory time. Secondly, apart from being used as a pilot
he study was designed to teach the neuroscience
ss
in the pilot study due to student confidentiality
issues (the pilot study participants were students of the author of this thesis).
aspects:
• Startle stimuli were 100 dB only in contrast to 70, 80, 90, and 100 dB in the contro
study.
• The Attend Task instructions were to listen to all sounds (prepulse and startle
stimuli) AND randomly push buttons on a handheld computer game (Tetris©-like
Block Game), without playing the game. In contrast, the instructions of the
Task during the control study were to listen to all sounds without having to push
buttons on the Block Game. The Ignore Task instructions in both studies were to
play the Block Game and ignore the auditory stimuli.
• Each attentional task consisted of 42 trials in contrast to 72 trials in the control study.
The trials in both studies were presented in a pseudo-random order described in
Chapter 4. Also, different prepulse-to-startle lead-time intervals were used in the
two studies (summarised in Figure 5.1). The reasons for such differences were two-
fold. Firstly, due to time
that as many st
study for the purpose of this thesis, t
students about the attentional modulation of the startle reflex and to replicate the
results of Dawson et al. study (1993) by introducing a modified Ignore Task.
• Information regarding substance use, current medication status, and mental illne
was not obtained from participants
175

6 x 70 dB6 x 80 dB6 x 90 dB
18 x 100 dB
36Startle Stimulus
e TrialsAlon
6 lead-timeintervals
(20, 40, 80, 100,200, 1600 ms)
6 Startle Stimuli at 100 dB
36Prepulse and Startle
Stimulus Trials
72 triaattentional ta
ls persk
Control Study
18 x 100 dB
18Startle Stimulus
Alone Trials
4 lead-timeintervals(60, 120,
240, 2000 ms)
6 Startle Stimuli at 100 dB
24tartle
ialsPrepulse and S
Stimulus Tr
42 trials perattentional task
Pilot Study
Trial Structure
Figure 5.1 Trial structure in control and pilot studies.
5.4.4 Statistical Analysis
sts were carried out using SPSS-PC 11.0. A more detailed discussion
regarding the tests used and their assumptions can be found in Chapters 3 and 4.
Group . The frequency of males and females in the two groups (control and
pilot studies) was compared using Fisher’s Proba st (tw iled, p
0.05). This test was used because the expec requencie ch ce 2 x 2
contingency table were lower than 10, thus violating the assumption for a chi-square
5.4.3 Exclusionary Criteria
The data from two of the eight participants in the pilot study were excluded either
due to high levels of background noise (one participant exceeded the onset magnitude
threshold of 20 µV on each trial during the Attend Task) or to counterbalance for the
order of attentional tasks (one participant). The remaining data had a mean ± SD of 8 ±
6% of trials excluded. Exclusionary criteria for the control study can be found in
Chapter 4.
All statistical te
matching
Exact ( bility) Te o-ta <
ted f s of ea ll in a
176

test. The two groups were also compared based on age using a non-parametric
equivalent to a t-test, the Mann-Whitney o-taile 0.05). test w
chosen because the distribution of age in the pilot study violated the as tion o
norm
ach study
we V) and onset latency (ms). The General
Lin epeated measures
(at rval) was used to test for the main effects of attention, lead-
tim eractions among attention and lead-time intervals on each of the
two measures (startle reflex magnitude and onset latency). Due to differences in lead-
time intervals, the data for each study were analysed separately. The comparisons
between the two studies were done by visual inspection of the graphs and by
comparisons of main effects and interactions generated from the separate analyses. The
ANOVAs were conducted using two within-subject factors: attention (2 levels) in all
analyses and lead-time interval (7 levels in the control study and 5 levels in the pilot
study). The individual means for each dependent variable were compared using
planned pairwise comparisons with multiple F-tests (two-tailed, p < 0.05). The planned
pairwise comparisons for each study included the startle reflex magnitude and onset
latency at:
• Attend Task vs. Ignore Task at each lead-time interval
• lead-time interval of 0 ms (Startle Stimulus Alone Trials) vs. each other lead-time
interval (Prepulse and Startle Stimulus Trials) during each attentional task.
Multiple F-test critical difference (CD) was used to determine significance among
the planned pairwise comparisons (for more details refer to Chapter 4). Briefly, if a
difference between two means is larger than the CD then the two means differ
significantly for the within-subject comparisons (Kiess, 1989). Means and CDs for each
U- twtest ( d, p < This as
sump f
ality tested with the Kolmogorov-Smirnov test for goodness of fit.
rtle reflex in eStartle reflex analysis. The dependent measures of the sta
re the peak magnitude (AUC magnitude in µ
ear Model (GLM) Analysis of Variance (ANOVA) with two r
tention and lead-time inte
e intervals, and int
177

measure on the Attend and Ignore Tasks at each lead-time interval were plotted on
graphs for each study separately (control and pilot). The comparison between the two
studies was done informally by comparing the significance of results and trends in each
graph. The assumptions applicable to the current analyses (GLM ANOVA with repeated
easures and with a univariate approach) include independence of observations and
normality, which were assumed, and sphericity reported in each table below (for more
details refer to Chapter 4).
5.5 Results
5.5.1 Participant Characteristics
Characteristics of the participants in the pilot and the control studies are reported in
Table 5.1. In general, participants in the control study were significantly older than
those in the pilot study. In addition, there were proportionately more males in the
control study than in the pilot study.
Table 5.1 Participant characteristics
m
Variable
Pilot Study Control Study Test
S
ample size (n) 6 12
MF Age (median) range
20 20 – 34
34 18 – 43
U = 11.0, z = -2.4, p = 0.018*
ale (%) emale (%)
2 (33%) 4 (67%)
11 (92%) 1 (8%)
pF = 0.022*
Note. Abbreviations: pF- two-tailed Fisher’s Exact Probability, U- Mann-Whitney U-test. *p < 0.05
The data collected during the pilot and the control studies were analysed separately.
The results are summarised in Tables 5.2 and 5.3 and the overall means and critical
differences for planned pairwise-comparisons are plotted in Figures 5.2 and 5.3 below
178

using the same axes in the pilot and the control studies to aid the visual compariso
the data.
n of
5.5.2 Attention, Lead-Time Intervals, and Startle Reflex Magnitude
The first aim of the study was to investigate the effects of attention on the magnitude
of the startle reflex when prepulses were either absent or presented at various lead-time
intervals before the startle stimuli. Table 5.2 summarises the effects of attention on
startle reflex e Startle Stimulus Alone Trials (lead rval = 0
m ) and the Prepulse and Startl Stimulus Tri ls (lead-time intervals > 0 ms) in control
and pilot studies separately.
Effects of attention an lead-time inte vals on the star e reflex magnitude in co rol
effects Power
magnitude during th -time inte
s e a
Table 5.2 and pilot studies
d r tl nt
Within-subject
df F p η2part
Control study n = 12#
TT)a
e b
MAM
^(
< 0
0.69
Attention (AMSerrorL
1 909364)
8.8**
0.001
0.63
0.99
1 11
11.4** (511158)
3.1*
.0005
0.037
0.51
0.22
1.00
ad time (LT)SerrorTT x LTc
S 66
333^
3^
# (135550)#error
Pi AMLeMAM
20$
(198034)$
0.70
0.02
0.77
0.07
lot study n = 6$
tStention (ATT)a 1
5 11.4*
(2599466) 0.020
4 4.2* 0.012
0.46
0.85
errorad time (LT)S
d
20 4
(630970) 0.1
0.971
errorT x LTeT
Serror
Note. Values in parentheses represent mean square errors (MSerror). Abbreviations: df- degrees of
dmet (Mauchly’s W (df 9) = 0.01, p = 0.087);
df adjusted using Greenhouse-Geisser epsilon due to lack of sphericity. ) in the
$ , and n used to calculate CD in the pilot study (CD = 535.94). **p < 0.01
freedom, η2part- partial eta squared (measure of effect size). Assumption of sphericity:
aalways met when only two means are compared (Mauchly’s W = 1); bviolated (Mauchly’s W (df 20) = 0.01, p = 0.012); cviolated (Mauchly’s W (df 20) = 0.01, p = 0.002);
emet (Mauchly’s W (df 9) = 0.03, p = 0.240). ^
#MS , df, and n used to calculate critical difference for planned pairwise-comparisons (CDcontrol study (CD = 300.09). MS , df
*p < 0.05
error
error
179

There were significant main effects of attention and lead-time interval in both
studies. The interaction between attention and lead-time interval was significant only in
the control study. The means and critical difference for planned pairwise-comparisons
are graphed in Figures 5.2A and 5.2B for each group separately.
Figures 5.2A and 5.2B show that attending to prepulse and startle stimuli increased
the size of the startle reflex relative to ignoring the stimuli in both studies. Specifically,
the planned pairwise comparisons revealed that the startle reflex magnitude increased
significantly during the Attend Task at all lead-time intervals in both studies.
Furthermore, relative to the Startle Stimulus Alone Trials (lead-time interval = 0 ms),
presentation of the prepulse induced either inhibition of the startle reflex magnitude
(PPI) at short lead-time intervals (20 – 200 ms in the control study and 60 – 240 m in
the
int
airwise comparisons revealed that, in the control study, PPI was significant at all short
ly
y.
s
pilot study), or facilitation of the startle reflex magnitude (PPF) at long lead-time
ervals (1600 ms in the control study and 2000 ms in the pilot study). Planned
p
lead-time intervals (20 – 200 ms) during the Attend Task and at two short lead-time
intervals (80 – 100 ms) during the Ignore Task. The PPF at the long lead-time intervals
(1600 ms) was not significant during both attentional tasks in the control study. In the
pilot study, PPI was significant during one short lead-time interval (60 ms). Similar
to the control study, PPF at the long lead-time intervals (2000 ms) was not significant
during both attentional tasks in the pilot stud
180

0
500
1000
Lead-time interval (ms)
Mea
A1500
2000
2500
3000
UC
ma
nitu
e (µ
V)
3500
0 20 40 80 100 200 1600
ng
d
attendignore
CONTROL A
**
** * * *
0
500
1000
0 60 120 240 2000
Lead-time interval (ms)
ean
Aag
1500
2000
2500
3000
M
UC
mn
3500
itud
e (µ
V)
attendignore
PILOT B*
**
*
*
in
control (A) and pilot (B) studies.
CDPILOT = 535.94). The asterisks indicate significant differences in the startle reflex magnitude Attend and the Ignore Tasks at various lead-time intervals. Note that the lead-time ms refers to the mean startle reflex magnitude on the Startle Stimulus Alone Trials.
Figure 5.2 Effects of attention on the startle reflex magnitude at various lead-time intervals
The bars represent critical difference for planned pairwise comparisons (CDCONTROL = 300.09,
between theinterval of 0
181

5.5.3 Attention, Lead-Time Intervals, and Startle Reflex Onset Latency
The second aim of the study was to investigate the effects of attention on the onset
latency of the startle reflex when prepulses were either absent or presented at various
lead-time intervals before the startle stimuli. Table 5.3 summarises the effects of
attention on the startle reflex onset latency during the Startle Stimulus Alone Trials
(lead-time interval = 0 ms) and the Prepulse and Startle Stimulus Trials (lead-time
intervals > 0 ms) in control and pilot studies separately.
Table 5.3 Effects of attention and lead-time intervals on the startle reflex onset latency in control and pilot studies
Within-subject effects
df F p η2 Power part
Controls n = 12# AMSerror
errorc
11
^
(108)
0.05
ttention (ATT)a
Lead time (LT)b MSATT x LT MSerror
1
6 66 3
66#
0.04
82.6** (65) 1.8
(47)#
0.853
< 0.0005
0.157
< 0.01
0.88
0.14
1.00
0.45
Pilot n = 6$
Attention (ATT)a MS
d
ATT x LT
4
0.3
0.849
0.06
0.11
errorLead time (LT) MSerror
e
MSerror
1 5 4
20
20$
3.0 (206)
22.2** (172)
(155)$
0.146
< 0.0005
0.37
0.82
0.29
1.00
Note. Values in parentheses represent mean square errors (MSerror). Abbreviations: df- degrees of freedom, η2
part- partial eta squared (measure of effect size). Assumption of sphericity:
bmet (Mauchly’s W (df 20) = 0.1, p = 0.546); c
dmet (Mauchly’s W (df 9) = 0.03, p = 0.295); emet (Mauchly’s W (df 9) = 0.02, p = 0.146). df adjusted using Greenhouse-Geisser epsilon due to lack of sphericity.
#MS
aalways met when only two means are compared (Mauchly’s W = 1);
violated (Mauchly’s W (df 20) = 0.02, p = 0.018);
^
control study (CD = 5.57).
There were significant main effects of lead-time interval in both studies. The main
effect of attention and the interaction between attention and lead-time interval were not
significant in both studies. The means and critical difference for planned pairwise-
error, df, and n used to calculate critical difference for planned pairwise-comparisons (CD) in the
$MSerror, df, and n used to calculate CD in the pilot study (CD = 15.02). **p < 0.01
182
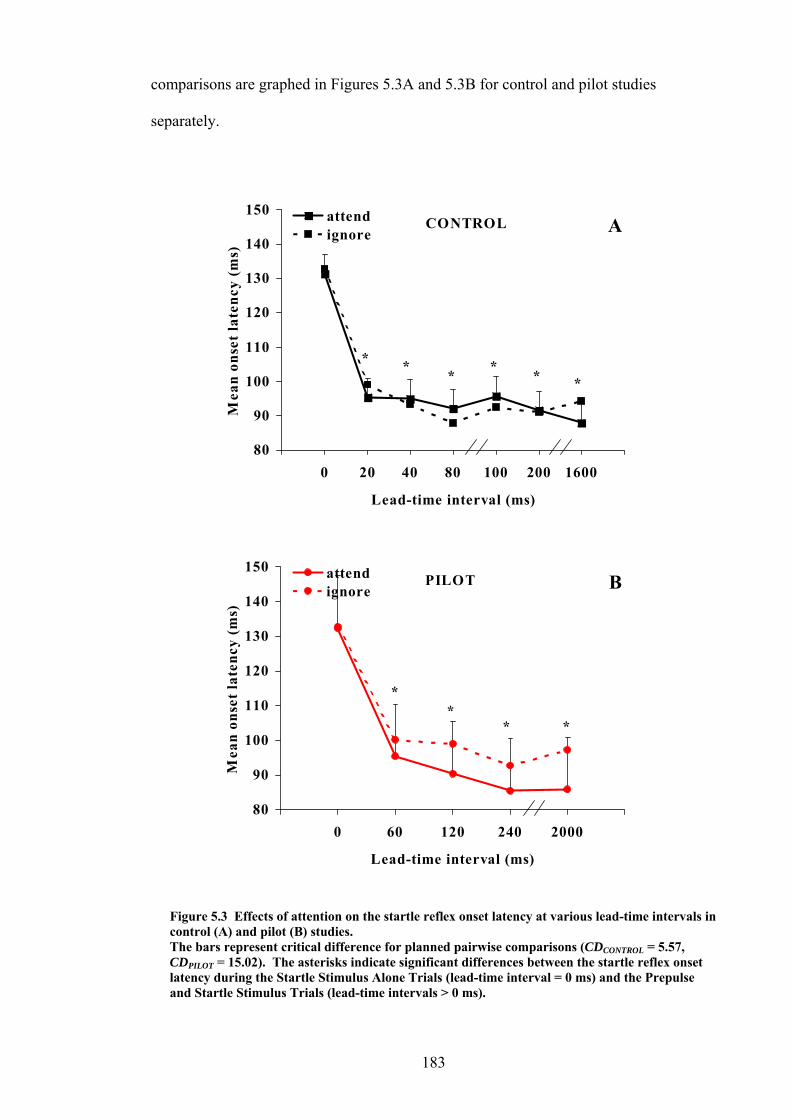
comparisons are graphed in Figures 5.3A and 5.3B for control and pilot studies
separately.
80
90
100
110
120
130
140M
an o
nset
lte
ncy
(ms
150
0 20 40 80 100 200 1600
Lead-time interval (ms)
ea
)attendignore
CONTROL A
*
* * * * *
800 60 120 240 2000
90
100
120
130
140
150
Lead-time interval (ms)
Mea
n on
ste
ncy
(ms)
attendignore
PILOT B
110et la *
** *
control (A) and pilot (B) studies. lanned pairwise comparisons (CDCONTROL = 5.57,
PILOT ant differences between the startle reflex onset latency during the Startle Stimulus Alone Trials (lead-time interval = 0 ms) and the Prepulse and Startle Stimulus Trials (lead-time intervals > 0 ms).
Figure 5.3 Effects of attention on the startle reflex onset latency at various lead-time intervals in
The bars represent critical difference for pCD = 15.02). The asterisks indicate signific
183

Figures 5.3A and 5.3B show that effect on the onset latency of the
s of
is effect
The results of this study suggest that pushing buttons on the computer game did not
have any effects on attentional modulation of the startle reflex as shown by similar
trends between the two studies. The attentional modulation of the startle reflex
magnitude observed in the pilot and the control studies was similar to the one observed
in other studies (Dawson et al., 1993) in that the startle reflex magnitude increased
while attending relative to ignoring the auditory stimuli. Thus, these results indicate
that the computer game was successful at selectively diverting the attention of
participants away from the auditory stimuli during the Ignore Task, and that the
apparent effects of attention are n the different response demands
of
ents,
e
e,
modulation of the startle reflex in the current study.
attention had no
startle reflex in either study. Planned pairwise comparisons revealed that, regardles
attentional task, presence of the prepulse at either short or long lead-time intervals (lead-
time interval > 0 ms) significantly reduced the onset latency compared to the onset
latency during the Startle Stimulus Alone Trials (lead-time interval = 0 ms). Th
of prepulse was significant in both studies.
5.6 Discussion
ot likely to result from
of the Attend and Ignore Tasks.
The results of the pilot and the control studies were similar regardless of a number
limitations. Firstly, the two studies differed in terms of characteristics of the
participants. Specifically, the participants in the pilot study were university stud
who were mostly women, and were younger than the (mainly) male volunteers from th
general community of Perth, who participated in the control study and were, therefor
matched to the chronic cannabis users, who were also predominantly male. Even
though some studies suggest that gender might affect PPI (Swerdlow et al., 1993a;
Swerdlow et al., 1997), it appears that gender had no influence on attentional
184

Secondly, due to ethical and confidentiality considerations the participants in the
pilot study were not screened for substance use, medication use, and mental illness at
the time of testing. Although schizophrenia (Dawson et al., 1993), cannabis use
(Chapter 4), and caffeine use (Flaten & Elden, 1999) affect the attentional modulation
of PPI in humans, the effects of substances of abuse and medication on attentional
modulation of the startle reflex magnitude and onset latency have not been extensively
investigated. It appears that the potential use of substances and medications had no
effects on attentional modulation of the startle reflex magnitude and onset laten
pilot study.
Thirdly, the pilot study participants were not blind to the purpose of the study.
Specifically, before participation in the experiments the
cy in the
students were taught about the
attentional modulation of the startle reflex and were told about the purpose of the study.
In contrast, the controls were told that the reason for playing the computer game was to
nt. However, it appears
dy.
ibuted to
sions
s were not exactly matched in terms of response demand.
give them something to do while they complete the experime
that the knowledge of expected results had no effects on attentional modulation of the
startle reflex magnitude and onset latency in the pilot study relative to the control stu
Fourthly, the smaller sample size in the pilot study contributed to a larger variance,
reduced power and effect sizes relative to the results of the control study. Such lower
effect sizes and power to detect significance in the pilot study may have contr
the lack of attention by lead-time interaction in terms of the startle reflex magnitude in
the pilot study. On the other hand, all main effects were identical between the two
studies. Similarly, the large variance in the pilot study data prevented any conclu
to be drawn regarding the effects of finger movements on %PPI (not reported).
Fifthly, the group
Specifically, the strength and the frequency of key presses on the computer game were
not monitored between controls, cannabis-controls in Chapter 4, and the pilot study
185

participants. The modified Attend Task in the pilot study, involving randomly pushing
buttons on the game, was used as an approximation of the motor demand during t
Ignore Task. It can only be speculated that all participants in Chapter 4 and the pilot
study used a similar motor demand to play the Block Game.
Sixthly, apart from the motor action of pushing buttons on the computer game the
game also includes a visual component, which could add another confounding fac
the study. Specifically, visual stimuli could induce additional eye-blinks or affec
attentional modulation of the startle reflex to auditory stimuli. Therefore, apart f
motor actions the task should have been matched on the visual com
he
tor to
t the
rom the
ponent of stimuli
during the Attend and the Ignore Tasks.
Finally, the two studies differed in terms of the lead-time intervals and the number of
trials used. However, the range of short and long lead-time intervals among the two
studies was similar and thus unlikely to alter the results.
In conclusion, it appears that the effects of the attentional modulation of the startle
reflex magnitude and onset latency are related to attending to auditory stimuli on the
Attend Task and shifting attention from irrelevant auditory stimuli to another modality
(playing a computer game) on the Ignore Task. Finger and hand movements while
playing the computer game had no effects on such attentional modulation of the startle
reflex. However, the effects of finger and hand movements on attentional modulation
of PPI should be investigated in a larger sample due to high variance in the pilot study.
186

CHAPTER 6. CANNABIS MISUSE AND DEPRESSION
6.1 Preface
Many studies focus on the relationship between cannabis use and psychosis.
However, links between heavy (frequent) cannabis use and affective disorders, such as
depression, have also been established. The last aim of the current study was to explore
the relationship between cannabis dependence, as a measure of ‘heaviness’ of use, and
mental illness other than schizophrenia.
of use. However, unlike dependence, the frequency
f use alone does not provide any information regarding the psychological and
hysiological effects of such frequent use. Therefore, the aim of the current study was
extend the previous findings and investigate a relationship between the severity of
fetime dependence on cannabis and lifetime mental illness in 50 participants recruited
fro
diagnostic interview (CIDI-Auto 2.1) had signi e lifetime cannabis misuse
diagnoses (abuse and/or dependence) on the CIDI and higher severity of cannabis
dependence on Severity of Dependence Scale (SDS). Depression accou most of
the mental illness diagnoses (74%). These results suggest that increased severity of
lifetime dependence on cannabis is associated with presence of
than schizophrenia.
6.2 Abstract
A number of studies suggest that heavy use of cannabis may be associated with
mental illnesses other than psychotic illnesses, such as depression. The heaviness of use
is often measured by the frequency
o
p
to
li
m the general community. The participants with psychiatric diagnoses on a
ficantly mor
nted for
m ntal illnesses other e
187

6.3 Introduction
ss is associated with increased rates of cannabis use. However, links
between cannabis misuse and affective disorders, such as depression, have also been
est
suggest that heavy and regular cannabis
ass 002; Patton et al.,
20
fre dence
that the construct of dependence consists
not only of the increased frequency ut also of the psychological and
Thus, the aim of this study was to extend the findings from other studies and investigate
ss
(other than schizophrenia) in volunteers recruited to participate in a study investigating
would be associated with presence of a lifetime diagnosis of mental illness other than
(Cannabis) Dependence Scale (SDS), and more lifetime diagnoses of cannabis misuse
f
70 participants recruited for a study investigating the effects of cannabis use on the
Psychotic illne
ablished (Johns, 2001). Large epidemiological studies in Australia and New Zealand
use in adolescents and young adults is
ociated with an increase in depression scores (Fergusson et al., 2
02; Rey et al., 2002). While ‘heaviness’ of cannabis use is often measured using
quency of use, it can also be investigated using the severity of lifetime depen
on cannabis. The reason for such rationale is
of substance use, b
physiological aspects of such a frequent use (American Psychiatric Association, 1994).
the association between severity of cannabis dependence and presence of mental illne
the relationship between chronic cannabis use and prepulse inhibition of the startle
reflex (PPI). Based on previous research it was hypothesised that cannabis dependence
schizophrenia. Specifically, it was expected that higher scores on Severity of
(abuse and/or dependence) on CIDI-Auto 2.1 would be associated with presence of
lifetime diagnoses of mental illness on CIDI-Auto 2.1.
6.4 Methods
6.4.1 Participants and Psychiatric Illness Assessment
The details regarding participant recruitment can be found in Chapter 2. Briefly, o
188

startle reflex, 50 non-schizophrenia-patient participants (same as the ones incl
Chapter 3) were screened for lifetime presence of major psychiatric illness (anxiety
uded in
,
ric
onnaire
spectively. For the psychometric properties of SDS
6.4.2 Statistical Analysis
The statistical analyses were carried out using SPSS-PC 11.0.
Continuous variables. The continuous variables were age, years of education, IQ,
and SDS scores. These variables were assessed separately for each group (No CIDI-
Diagnoses Group and CIDI Mental Illness Group) for normality of distribution using
the Kolmogorov-Smirnov test for goodness of fit and for homogeneity of variance using
Levene’s test (Tabachnick & Fidell, 2001). The variables which met the above
depression, mania, and psychosis) and cannabis misuse disorders (abuse and
dependence) using CIDI-Auto 2.1. Based on absence or presence of CIDI psychiat
illness diagnoses (ICD-10 and/or DSM-IV), other than substance misuse diagnoses, all
participants were divided into two groups- No CIDI-Diagnoses Group and CIDI
Psychiatric Illness Group respectively. For the psychometric properties of the CIDI
refer to Chapter 2.
Furthermore, a self-reported questionnaire, SDS (Gossop et al., 1995), was used to
screen for lifetime severity of cannabis dependence. SDS is a five-item questi
focused on the psychological aspects of dependence, such as control over cannabis use,
anxiety about use, and difficulty stopping (Gossop et al., 1995). The severity of
dependence is established by rating each answer on a scale from 0 to 4. The range of
possible scores on this questionnaire is between 0 – 15 indicating minimum to
maximum cannabis dependence re
refer to Chapter 2. Participants who had never used cannabis did not fill out the
questionnaire and were automatically assigned a score of zero indicating lack of
cannabis dependence. Self-reported measures of cannabis use were found to be
accurate in the current sample (Chapter 2).
189

assumptions (age, years of education, and IQ) were compared between the two gr
using independent samples t-tests (two-tailed, p < 0.05). The variable which violated
the assumption of normality (SDS scores) was compared between the two groups using
the non-parametric equivalent of a t-test, the Mann-Whitney U-test (two-tailed, p <
0.05). T
oups
he effect size (eta squared, η2) was used to investigate the strength of
, 1989). Thus the
ariables were compared between the two groups using the Fisher’s Exact (Probability)
est (Chapter 3); two-tailed, p < 0.05 (Kiess, 1989).
6.5 Results
Characteristics of the participants are reported in Table 6.1. There were no
ignificant differences between the No CIDI-Diagnoses Group and CIDI Mental Illness
roup on gender, age, years of formal education, and IQ estimated with the National
dult Reading Test, NART (Nelson & Willison, 1991).
The data in Table 6.1 suggest that significantly higher proportion of lifetime cannabis
misuse diagn he presence
of
associations for all t-tests (refer to Chapter 3).
Discrete variables. The discrete variables were frequencies of: males and females,
and participants with and without lifetime cannabis-misuse diagnoses generated by
CIDI-Auto 2.1. Both variables violated the assumption that the expected frequencies in
any cell of a contingency table (2 x 2) should be at least 10 (Kiess
v
T
s
G
A
oses and significantly higher SDS scores were associated with t
lifetime diagnoses of mental illness, other than schizophrenia, on CIDI-Auto 2.1. Of
the 19 participants with mental illness diagnoses, 14 (74%) had diagnoses of dysthymia
and/or mild to severe depression.
190

Table 6.1 Characteristics of participants with and without mental illness diagnoses on CIDI-Auto 2.1
Variable No CIDI- CIDI Mental Test (df) Diagnoses Illness Group
Group Sample size (n)
31 19
Male (%)
26 (84%) 14 (74%) pFemale (%) 5 (16%) 5 (26%)
M ± SD (range)
(18 – 56)
(86 – 117)
(19 – 44)
(79 – 117)
t (48)
p
η
2
CIDI Cannabis Diagnoses (%) 9 (29%) 13 (68%)
SDS (median) 0 3 U = 186.5, z = -2.3,
Diagnosis type/19
Other Diagnoses
9 (47%)
F = 0.474
Age
IQ
Education (yrs)
34 ± 10
105 ± 7
13 ± 2 (9 – 17)
29 ± 8
103 ± 10
13 ± 2 (9 – 16)
1.7
0.9
0.1
0.096
0.353
0.958
2
0.06
< 0.01
0.0
No CIDI-Cannabis Diagnoses (%)
22 (71%) 6 (32%) pF = 0.009**
range
0 – 6 0 – 13 p = 0.022*
Depressiona b
14 (74%)
Note. Abbreviations: CIDI- Composite International Diagnostic Interview, df- degrees of freedomp
, sher’s Exact Probability, SDS- Severity of Dependence Scale; U- Mann-Whitney U-
aDepression category included:
depression (4), and/or
),
DSM-IV diagnoses of: delusional disorder (2 participants) and brief psychotic disorder (2)
creased
ce) on CIDI-Auto 2.1 are associated with mental illness other
s
F- two-tailed Fitest; yrs- years.
ICD-10 diagnoses of: dysthymia (2 participants), mild depression (1), moderate depression (3), severe
DSM-IV diagnoses of: dysthymia (1 participant) and major depression (12) bOther Diagnoses category included: ICD-10 diagnoses of: delusional disorder (3 participants), acute and transient psychotic disorders (1and/or
*p < 0.05 **p < 0.01
6.6 Discussion
The results of this study suggest that higher lifetime SDS scores, indicating in
severity of cannabis dependence, and more diagnoses of lifetime cannabis misuse
(abuse and/or dependen
than schizophrenia (mainly depression). These findings confirm and extend the result
of other studies, which found that heavy cannabis use is associated with higher
depression scores (Fergusson et al., 2002; Patton et al., 2002; Rey et al., 2002a). The
191

results of the current study cannot be ascribed to a specific causal relationship betw
cannabis use and mental illness on the basis of the present data. It can be speculate
that, similarly to the relationship betwe
een
d
en cannabis use and schizophrenia, cannabis use
co
ween
ess
ms
in
e,
e
rately
4, a high percentage
uld either contribute to development of other than schizophrenia mental illnesses,
such as depression, or be used as self-medication agent for people experiencing
symptoms of mental illness. The third possibility could be that the relationship bet
mental illness, such as depression, and cannabis use could be due to other common
factors, such as family history of depression and similar age of onset of mental illn
and cannabis use. Also, it is likely that cannabis use alters neurotransmitter syste
involved in development of mental illnesses, including dopamine, serotonin,
noradrenaline, GABA, and acetylcholine (for review see Pertwee & Ross, 2002).
There are a number of limitations regarding the results of the current study. Firstly,
the information regarding mental illness and cannabis use was obtained using self-
reports, which should be validated to confirm their accuracy. In the current study, the
accuracy of self-reports of cannabis use was found to be excellent for participants not
involved in treatment for substance misuse problems (Chapters 2 and 3). Similarly, the
validity of CIDI-Auto 2.1 was found to be acceptable for cannabis misuse diagnoses
the current sample (Chapter 3). However, the mental illness diagnoses on the CIDI-
Auto have not been validated in the current study due to time restrictions and
confidentiality issues in terms of testing participants using illicit substances. Therefor
such lack of validation of the mental illness diagnoses could confound the results (se
below). However, it could be speculated that the participants might have accu
reported their mental health status, because they have also accurately reported their
substance use (Chapters 2 and 3).
Secondly, the study raises an issue of the ‘normality’ of participants recruited as
healthy controls for behavioural research. As discussed in Chapter
192

of participants volunteering for behavioural studies have some psychopathology (Huang
et al., 2003). However, the apparent over-reporting of mental illness symptoms usin
self-completed interview, such as CIDI-Auto 2.1, could be due to either the
misinterpretation of some items exploring psychotic experiences (Eaton et al., 1991;
Jablensky, 1995; Verdoux et al., 1998) or overestimation of mental illness diagn
the instrument itself (Kendler et al., 1996; Peters & Andrews, 1995). Therefore, as
mentioned above the mental illness diagnoses should be confirmed in studies to preve
any over- or underestimation of mental illness in the participants.
Thirdly, a low number of participants was used in the current study. Only 19
participants reported lifetime diagnoses of mental illness. In addition, the participants
were recruited specifically for a cannabis study, which may have led to selection biase
Therefore, the study should be repeated in
g a
oses by
nt
s.
a larger random sample to confirm the
d
ssion.
ome
l
results.
In conclusion, cannabis misuse (dependence and/or abuse) appears to be associate
with higher rates of mental illness other than schizophrenia, particularly depre
Mental illness in participants used as healthy controls may confound the results of s
studies. Therefore, it is important to screen study participants for symptoms of menta
illness particularly if such participants are heavy cannabis users.
193

CHAPTER 7. OVERALL CONCLUSION
The main aim of the current thesis was to investigate the physiological evidence for
the comorbidity between cannabis use and schizophrenia. The results demonstrated that
chronic cannabis use in otherwise psychiatrically healthy volunteers was associated with
schizophrenia-like reduction in PPI of the acoustic startle reflex while attending to
auditory stimuli, but not when ignoring such stimuli (Chapter 4). This reduction in PPI
was related to attentional dysfunction rather than a primary deficit in PPI. Furthermore,
PPI was reduced with the longer total duration of cannabis use rather than due to the
acute effects of use, when the latter was determined by the concentration of cannabinoid
metabolites in urine and verbal reports of the recency of cannabis use (Chapter 4).
Even though the startle reflex modification is a useful paradigm for testing various
aspects of brain function in living humans, there are many inconsistencies among the
results of the startle reflex studies reported in the literature. Such inconsistencies could
result from the fact that the startle reflex modification is affected by various factors,
such as the modality and intensity of the startle and prepulse stimuli, lead-time intervals,
instructions given to participants, and the characteristics of the participants, such as
presence of mental illness and substance use. The current study suggests that the
reduction in PPI observed in some studies could be confounded by cannabis use
(Chapter 4). Cannabis use also appears to contribute to mental illnesses, other than
schizophrenia (Chapter 6). Therefore, studies of the startle reflex should control for
cannabis use and assess mental health, particularly if participants consist of frequent
cannabis users.
Furthermore, most studies in the startle reflex area do not report the EMG processing
criteria, which may be vital for comparisons of results across different studies. For
instance, the current study suggests that while the stringent processing of the EMG
signal contributes to high exclusionary rates, it is needed to exclude ‘noisy’ trials and
194

potential spontaneous eye blinks (Chapter 4). In contrast, automatic processing of the
data may allow many artefacts of the signal to be included in the final analyses
confounding the results. Therefore, the future of startle reflex studies lies in the
standardisation of the methodology, in terms of parameters used and processing of the
EMG signal criteria.
In addition, greater focus should be placed on investigation of other aspects of the
startle reflex modification, such as PPF, startle reflex onset latency and magnitude
habituation. The understanding of the neural substrates and functional significance of
these processes may improve the current interpretation of the reduction in PPI in
schizophrenia and other disorders. Such understanding could also help to identify
biological markers for schizophrenia.
The m
ajor limitation of the current study is the lack of conclusions regarding patients
in
c
ld
orted.
Perth
patients are ‘over-tested’ and thus do not wish to participate in further studies.
Fu
recruitment was the issue of pharmacological treatment of the patients, which could
with schizophrenia. While conducting the project the mental health system changed
Western Australia resulting in major restructure of Graylands Hospital, where the
current study was conducted. These changes resulted in reduction of the number of
beds and shifting the major treatment focus of the hospital onto the most chroni
patients, who often are too unwell to participate in research. The recruitment of
outpatients was difficult for a number of reasons outlined in Chapter 4. The study cou
only be conducted at the hospital, since the equipment could not be easily transp
The need to travel to the hospital deterred some patients from participating in the study.
In general, the patient population is limited in Western Australia and especially in
where the
rthermore, many cannabis-using patients had little motivation to participate and often
declined to participate. All these factors and limited time frame to conduct this study
accounted for a small number of patients recruited. The major problem with patient
195

confound the results of the study. As discussed in Chapter 4 most patients in Austral
are currently treated with atypical neuroleptics, which may r
ia
everse the PPI reduction
us ent
ry to
ms
th of the study is that
e healthy participants were carefully screened and were recruited from a range of
ocioeconomic backgrounds to match them to patients with schizophrenia. Therefore,
ese participants better represent a general community of Perth than university and
ospital staff and students, who are often used as controls in other PPI studies.
urthermore, it appears that the results of the current study can be extrapolated to the
eneral community due to typical pattern of substance use in the current participants
ompared to other epidemiological studies in Australia (for example, Jablensky et al.,
999). On the other hand, the disadvantage of such a detailed screening process was the
long time and great effort involved in recruitment of participants. However, in order to
prevent any confounding factors from affecting the PPI data such stringent screening
The the
explain
schizop tended and
ually reported in patients treated with typical neuroleptics. Therefore, the curr
study should be conducted in patients with schizophrenia treated with typical
neuroleptics and matched on other medication use. Such study would be necessa
investigate whether the effects of cannabis use and schizophrenia are additive in ter
of a deficit in PPI. The answer to such question would strengthen the argument that
cannabis use is associated with schizophrenia-like changes in PPI.
Regardless of the problems with patient recruitment, the streng
th
s
th
h
F
g
c
1
process should be used in future studies.
current study did not investigate the neurobiological mechanisms underlying
PPI reduction in cannabis users. The understanding of such processes could help to
the comorbidity between cannabis use and schizophrenia in terms of
ansmitters involved and any commneurotr on neural pathways possibly affected by
hrenia and cannabis use. Therefore, the current study could be ex
196

repeated using various brain-scanning techniques to identify brain regions and
ansmitters involved in PPI reduction in caneurotr nnabis users.
Two tly,
no effe ion of the startle reflex magnitude and lack
of atten
of the s n in other studies (Chapter 5). The advantage
of usin tle
.
Therefo he study
more e
of
contributed to high variance in the pilot study (Chapter 5). Therefore, the effects of
finger m e not
me
on atten lation of PPI in participants well matched with the controls in the
current ttend
The future studies could also be designed to measure the degree of attending to and
ignorin s
could b
game o the score on the game,
providi
potential confounds were identified and addressed in the current study. Firs
finger and hand movements while playing the computer game on the Ignore Task had
cts on the normal attentional modulat
tional modulation of the startle reflex onset latency (Chapter 5). Therefore,
these results suggest that playing the computer game could elicit attentional modulation
tartle reflex similar to the one see
g the computer game to divert attention away from auditory stimuli in the star
reflex studies is that such studies are often monotonous and boring for the participants
re, the use of a computer game serves an additional purpose of making t
njoyable for the participants. However, the small sample size of the pilot study
and differences in terms of participant characteristics, such as gender, age, and lack
information regarding the history of mental illness and substance use may have
ovements while playing the game on attentional modulation of PPI wer
investigated. Future studies should investigate the effects of playing a computer ga
tional modu
study. Furthermore, the effects of attending to auditory stimuli on the A
Task and attending to a visual modality on the Ignore Task should be investigated.
g of the auditory stimuli in the current attentional task. For instance, participant
e instructed to count the number of loud stimuli (startle stimuli) during the
Attend Task. The attention away from the auditory stimuli and towards the computer
n the Ignore Task could be assessed by inspecting
ng that all players had similar skills at playing the game. Such an approach
197

could help to understand the effects of cannabis use on attention and how such effects
n
sensori g or if it is primarily dependent on attention. Furthermore,
assessm
with th hysiological deficits in cannabis users.
The icipants
was
ing
treatme in substance
users v the
the cur their substance use. The
results
researc suse can accurately report their
most re reens. In case of the past use,
which c
In ad
Use Module of a diagnostic interview (Composite International Diagnostic Interview,
version
diagno neral
relate to reduction in PPI. Also, the effects of cannabis use on PPI should be tested in
uninstructed attentional studies to find out if the deficit in PPI is a generalised deficit i
motor gatin
ent of attentional and memory impairments using standardised psychological
tasks could be correlated with reduction in PPI and dysfunction in habituation to assist
e interpretation in these p
second potential confound in the current study was the fact that the part
were voluntary substance users and the information regarding such substance use
obtained using self-reports. Self-reports are often invalid in substance users seek
nt. However, the validity of such self-reports was not investigated
olunteering for psychiatric research unrelated to drug treatment. Therefore,
investigation reported in Chapter 2 was conducted to assess whether the participants in
rent study could provide accurate self-reports regarding
suggest that reports of the most recent use (last 24 hours) were more accurate
than the reports of past use (lifetime and last 12 months). Therefore, participants in
h settings unrelated to treatment for substance mi
cent use, when such use is validated with urine sc
annot be easily validated with biochemical tests, the validity of such reports
should be tested using multiple instruments to reduce the minimum inaccuracy of the
reports.
dition, two more studies were conducted to investigate different aspects of
cannabis dependence. Firstly, the data reported in Chapter 3 suggest that the Substance
CIDI-Auto 2.1) has an acceptable validity in terms of cannabis misuse
ses (dependence and/or abuse) in participants recruited from the ge
198

population. Therefore, the CIDI-Auto 2.1 can be used as an easily administrable and
cheap instrument to screen for cannabis misuse diagnoses in research settings.
er, due to lack of perfect detection of cannabis misuse diaHowev gnoses, the diagnoses
generat
Seco
such m
attentio bling the PPI deficit in
patient
between cannabis use and schizophrenia. However, prospective longitudinal studies are
necessa
ed by the instrument may need to be confirmed by clinicians in treatment
settings.
ndly, the data presented in Chapter 6 suggest that a large proportion of cannabis
users with cannabis dependence diagnoses report lifetime symptoms of mental illness
other than schizophrenia (mainly depression). Therefore, studies utilising cannabis
users may need to screen the participants for lifetime symptoms of mental illness, if
ental illness could confound the results of the study.
In conclusion, chronic cannabis use in healthy individuals is associated with
n-modulated reduction in PPI of the startle reflex resem
s with schizophrenia. The future studies should investigate the effects of
cannabis use on attentional modulation of PPI in patients with schizophrenia. The
results of the current study provide more physiological evidence for the comorbidity
ry to establish the temporal relationship between the two.
199

REFERENCES
Abdulj onidine ibition of the acoustic startle response and the
Abel, K althy human
Abruzz f
Acocel attention influences the modification of
Acri, J.de in rats. Psychopharmacology, 104, 244-248.
Drug & Alcohol Review, 15(3), 261-270.
.
Adler, of auditory ournal of
Agosti, U.S.
oking: a meta-cial Psychology, 23, 352-373.
pipeline procedure: a meta-
Allebec abis and
Alterm prevalence estimates of substance 4.
Americ n, DC: American Psychiatric
Anders f cannabinoid receptor stimulation
Andrea
1483-1486.
awad, K., Langley, R., Bradshaw, C., & Szabadi, E. (2001). Effects of cland diazepam on prepulse inhN1/P2 auditory evoked potential in man. Journal of Psychopharmacology, 15(4), 237-242. ., Waikar, M., Pedro, B., Hemsley, D., & Geyer, M. (1998). Repeated testing ofprepulse inhibition and habituation of the startle reflex: a study in hecontrols. Journal of Psychopharmacology, 12(4), 330-337. i, W. (1975). Drug-induced psychoses ... or schizophrenia? American Journal oPsychoanalysis, 35(4), 329-342. la, C., & Blumenthal, T. (1990). Directed startle reflex probability. Psychological Reports, 66(1), 275-285. , Grunberg, N., & Morse, D. (1991). Nicotine increases acoustic startle reflex amplitu
Acri, J., Morse, D., Popke, E., & Grunberg, N. (1994). Nicotine increases sensory gating measured as inhibition of the acoustic startle reflex in rats. Psychopharmacology, 114(2), 369-374.
Adelekan, M., Green, A., Dasgupta, N., Tallack, F., & et al. (1996). Reliability and validity of the opiate treatment index among a sample of opioid users in the United Kingdom.
Adler, L., Hoffer, L., Griffith, J., Waldo, M., & Freedman, R. (1992). Normalization of deficient auditory sensory gating in the relatives of schizophrenics by nicotineBiological Psychiatry, 32, 607-616. L., Hoffer, L., Wiser, A., & Freedman, R. (1993). Normalizationphysiology by cigarette smoking in schizophrenic patients. American JPsychiatry, 150(12), 1856-1861. V., Nunes, E., & Levin, F. (2002). Rates of psychiatric comorbidity amongresidents with lifetime cannabis dependence. American Journal of Drug & Alcohol Abuse, 28(4), 643-652.
Aguinis, H., Pierce, C., & Quigley, B. (1993). Conditions under which a bogus pipeline procedure enhances the validity of self-reported cigarette smanalytic review. Journal of Applied So
Aguinis, H., Pierce, C., & Quigley, B. (1995). Enhancing the validity of self-reported alcohol and marijuana consumption using a bogusanalytic review. Basic and Applied Social Psychology, 16(4), 515-527. k, P., Adamsson, C., Engstrom, A., & Rydberg, U. (1993). Cannschizophrenia: a longitudinal study of cases treated in Stockholm County. Acta Psychiatrica Scandinavica, 88, 21-24. an, A. (1992). Methodological issues andabuse in schizophrenia. Journal of Nervous & Mental Disease, 180(9), 593-59an Psychiatric Association. (1994). Diagnostic and Statistical Manual of MentalDisorders. 4th edition- DSM-IV. WashingtoAssociation. on, J., Kask, A., & Chase, T. (1996). Effects oand blockade on catalepsy produced by dopamine receptor antagonists. European Journal of Pharmacology, 295(2-3), 163-168. sson, S., Allebeck, P., Engstrom, A., & Rydberg, U. (1987). Cannabis and schizophrenia. A longitudinal study of Swedish conscripts. Lancet, 2(8574),
200

Andreasson, S., Allebeck, P., & Rydberg, U. (1989). Schizophrenia in users and nonusers of cannabis. A longitudinal study in Stockholm County. Acta Psychiatrica Scandinavica, 79, 505-510.
Andrews, G., & Peters, L. (1998). The psychometric properties of the Composite International Diagnostic Interview. Social Psychiatry & Psychiatric Epidemiology, 33(2), 80-88.
iew tm
Andrews, G., & Peters, L. (2003). The CIDI-Auto: a computerised diagnostic intervfor psychiatry. http://www.crufad.com/cidi/discuss.h , accessed on 11/02/03.
d SCAN. Australian and New Zealand
Andrews, G., & Slade, T. (1997). Depression, dysthymia and substance use disorders:
Angris y of experimentally induced
Anthony, B. (1985b). In the blink of an eye: implications of reflex modification for
Anthon
or 1(1),
l
Arseneault, L., Cannon, M., Poulton, R., Murray, R., Caspi, A., & Moffitt, T. (2002).
Ashton ffects of cannabis: a brief review. British
Bagleyse and reporting, with particular attention to one
Baigen eraction between
the
Barry, , M. (1993). The Alcohol Use Disorders Identification Test ample.
Basavarajappa, B., Cooper, T., & Hungund, B. (1998). Chronic ethanol administration
Baselt, Foster City, California: Chemical Toxicology Institute.
Andrews, G., Peters, L., Guzman, A., & Bird, K. (1995). A comparison of two structured diagnostic interviews: CIDI anJournal of Psychiatry, 29, 124-132.
sources of dissonance between ICD-10 and DSM-IV. International Journal of Methods in Psychiatric Research, 7(2), 116-120.
t, B., & Gershon, S. (1970). The phenomenologamphetamine psychosis: preliminary observations. Biological Psychiatry, 2, 95-107.
information processing. Advances in Physiology, 1, 167-218. y, B. (1990). Blink modulation in attention-deficit disorder. Psychophysiology, 27, S6.
Anthony, B., & Graham, F. (1985a). Blink reflex modification by selective attention: evidence for the modulation of 'automatic' processing. Biological Psychology, 21, 43-59.
Armbruster, D., Hubster, E., Kaufman, M., & Ramon, M. (1995). Cloned enzyme donimmunoassay (CEDIA) for drugs-of-abuse screening. Clinical Chemistry, 492-98.
Arndt, S., Tyrrell, G., Flaum, M., & Andreasen, N. (1992). Comorbidity of substance abuse and schizophrenia: the role of pre-morbid adjustment. PsychologicaMedicine, 22, 379-388.
Cannabis use in adolescence and risk for adult psychosis: longitudinal prospective study. British Medical Journal, 325(7374), 1212-1213. , C. (2001). Pharmacology and eJournal of Psychiatry, 178, 101-106. , S., White, H., & Golomb, B. (2001). Logistic regression in the medical literature: standards for umedical domain. Journal of Clinical Epidemiology, 54, 979-985. t, M., Holme, G., & Hafner, R. (1995). Self reports of the intsubstance abuse and schizophrenia. Australian & New Zealand Journal of Psychiatry, 29(1), 69-74.
Bakshi, V. P., Geyer, M. A., Taaid, N., & Swerdlow, N. R. (1995). A comparison ofeffects of amphetamine, strychnine and caffeine on prepulse inhibition and latent inhibition. Behavioural Pharmacology, 6(8), 801-809. K., & Fleming(AUDIT) and the SMAST-13: Predictive validity in a rural primary care sAlcohol & Alcoholism, 28(1), 33-42.
down-regulates cannabinoid receptors in mouse brain synaptic plasma membrane. Brain Research, 793(1-2), 212-218. R. (2000). Disposition of toxic drugs and chemicals in man. (5th ed.).
201

Basu, D., Malhotra, A., Bhagat, A., & Varma, V. (1999). Cannabis psychosis and acuteschizophrenia. A case-control study from India. European Addiction Research, 5(2), 7
1-73.
Beltram Fonseca, F., Navarro, M., Calignano, A., Gorriti, M.,
Beresfo & Lucey, M. (1990). Comparison of CAGE
Berg, W ban, M. (1999). Startle elicitation: stimulus parameters, recording
nd rsity Press.
users.
Bersanhrenia: Absence of relationship and influence
Bersansychopathology and outcomes.
Bharuc , W., et al. urine drug screen in a
0-
Bidaut- regulated cyclic AMP
Blumen es.
ll
6a). tle
, 58(1), 73-80. oth
-
Bogens ical and methodological issues in
Bolino E., Rossi, A., et al. study.
Bolla, Krelated neurocognitive effects of marijuana use. Neurology, 59(9), 1337-
Bonnin s rly
Becker, J., & Jaffe, J. (1984). Impaired memory for treatment-relevant information in inpatient men alcoholics. Journal of Studies on Alcohol, 45, 339-343. o, M., de Grammatikopoulos, G., et al. (2000). Reversal of Dopamine D2 Receptor Responses by an Anandamide Transport Inhibitor. Journal of Neuroscience, 20(9), 3401-3407. rd, T., Blow, F., Hill, E., Singer, K.,questionnaire and computer-assisted laboratory profiles in screening for convertalcoholism. Lancet, 336, 482-485. ., & Bala
techniques, and quantification. In M. Dawson, A. Schell & A. Bohmelt (Eds.), Startle Modification: Implications for Neuroscience, Cognitive Science, aClinical Science. (pp. 21-50). USA: Cambridge Unive
Bernhardson, G., & Gunne, L. (1972). Forty-six cases of psychosis in cannabis abThe International Journal of the Addictions, 7(1), 9-16. i, G., Orlandi, V., Gherardelli, S., & Pancheri, P. (2002a). Cannabis and neurological soft signs in schizopon psychopathology. Psychopathology, 35(5), 289-295. i, G., Orlandi, V., Kotzalidis, G., & Pancheri, P. (2002b). Cannabis and schizophrenia: impact on onset, course, pEuropean Archives of Psychiatry & Clinical Neuroscience, 252(2), 86-92. ha-Reid, R., McCann, D., Schork, M., Foxman, B., Bass, A., Fraser(1995). A comparison of self-reported drug use with aworking population. Experimental & Clinical Psychopharmacology, 3(3), 28286. Russell, M., & Howlett, A. (1991). Cannabinoid receptor-accumulation in the rat striatum. Journal of Neurochemistry, 57, 1769-1773. thal, T. (1997). Prepulse inhibition decreases as startle reactivity habituatPsychophysiology, 34(4), 446-450.
Blumenthal, T. (1999). Short lead interval startle modification. In M. Dawson, A. Sche& A. Bohmelt (Eds.), Startle Modification: Implications for Neuroscience, Cognitive Science, and Clinical Science. (pp. 51-71). USA: Cambridge University Press.
Blumenthal, T., Schicatano, E., Chapman, J., Norris, C., & Ergenzinger, E. J. (199Prepulse effects on magnitude estimation of startle-eliciting stimuli and starresponses. Perception & Psychophysics
Blumenthal, T. D. (1996b). Inhibition of the human startle response is affected by bprepulse intensity and eliciting stimulus intensity. Biological Psychiatry, 44, 85104. chutz, M., & Nurnberg, H. (2000). Theoretpsychiatric comorbidity. Harvard Review of Psychiatry, 8, 18-24.
, F., Manna, V., Di Cicco, L., Di Michele, V., Daneluzzo, (1992). Startle reflex habituation in functional psychoses: a controlledNeuroscience Letters, 145, 126-128. . I. P., Brown, K. M., Eldreth, D. B., Tate, K. B., & Cadet, J. L. M. (2002).
Dose-1343. , A., de Miguel, R., Castro, J., Ramos, J., & Fernandez-Ruiz, J. (1996). Effectof perinatal exposure to delta-9-tetrahydrocannabinol on the fetal and ea
202

postnatal development of tyrosine hydroxylase-containing neurons in rat bJournal of Molecular Ne
rain. uroscience, 7, 291-308.
Bowersnal of Clinical Psychiatry, 59(4), 198-199.
nd
Braff, D., Geyer, M., Light, G., Sprock, J., Perry, W., Cadenhead, K., et al. (2001).
Braff, D., Grillon, C., & Geyer, M. (1992). Gating and habituation of the startle reflex in
Braff, D ick, I., & Bali, L. (1978). Prestimulus
Braff, D., Swerdlow, N., & Geyer, M. (1995). Gating and habituation deficits in the
Braff, D of prepulse
Breivo Vogt, L., & Sim-Selley, L.
G rochemistry, 73(6), 2447-2459.
Buckle
Bunney, B. (1988). Effects of acute and chronic neuroleptic treatment on the activity of ,
Cadenhead, K., Carasso, B., Swerdlow, N., Geyer, M., & Braff, D. (1999). Prepulse
. Cadenhead, K., Geyer, M., & Braff, D. (1993). Impaired startle habituation and prepulse
Cadenh raff, D. (2000). Modulation of
ibitory
Cadoga
he rat striatum. Journal of Neurochemistry, 69, 1131-1137. ia.
Campeau, S., & Davis, M. (1995). Prepulse inhibition of the acoustic startle reflex using
Carmin ity assessment. Sage University Paper Number 17. USA: Sage Publications, Inc.
Bowers, M., Jr., & Hoffman, F., Jr. (1986). Regional brain homovanillic acid followingdelta9-tetrahydrocannabinol and cocaine. Brain Research, 366, 405-407. , M. J. (1998). Family history and early psychotogenic response to marijuana (letter). Jour
Braff, D., & Geyer, M. (1990). Sensorimotor gating and schizophrenia. Human aanimal model studies. Archives of General Psychiatry, 47(2), 181-188.
Impact of prepulse characteristics on the detection of sensorimotor gating deficits in schizophrenia. Schizophrenia Research, 49(1-2), 171-178.
schizophrenic patients. Archives of General Psychiatry, 49(3), 206-215. ., Stone, C., Callaway, E., Geyer, M., Gl
effects on human startle reflex in normals and schizophrenics. Psychophysiology, 15(4), 339-343.
schizophrenia disorders. Current Psychiatry Reports, 3(2), 131-139. ., Swerdlow, N., & Geyer, M. (1999). Symptom correlates
inhibition deficits in male schizophrenic patients. American Journal of Psychiatry, 156(4), 596-602.
gel, C., Childers, S., Deadwyler, S., Hampson, R., (1999). Chronic delta9-tetrahydrocannabinol treatment produces a time-dependent loss of cannabinoid receptors and cannabinoid receptor-activatedproteins in rat brain. Journal of Neu
Brown, J., Kranzler, H., & Del Boca, F. (1992). Self-reports by alcohol and drug abuseinpatients: factors affecting reliability and validity. Addiction, 87, 1013-1024. y, P. (1998). Substance abuse in schizophrenia: a review. Journal of Clinical Psychiatry Supplementum, 59(3), 26-30.
midbrain dopamine neurons. Annals of the New York Academy of Sciences, 53777-85.
inhibition and habituation of the startle response are stable neurobiological measures in a normal male population. Biological Psychiatry, 45(3), 360-364
inhibition in patients with schizotypal disorder. American Journal of Psychiatry, 150, 1862-1867. ead, K., Swerdlow, N., Shafer, K., Diaz, M., & Bthe startle response and startle laterality in relatives of schizophrenic patients and in subjects with schizotypal personality disorder: evidence of inhdeficits. American Journal of Psychiatry, 157(10), 1660-1668. n, A.-K., Alexander, S., Boyd, E., & Kendall, D. (1997). Influence of cannabinoids on electrically evoked dopamine release and cyclic AMP generation in t
Callaway, E., & Naghdi, S. (1982). An information processing model for schizophrenArchives of General Psychiatry, 39, 339-347.
visual and auditory prepulses: disruption by apomorphine. Psychopharmacology, 117, 267-274. es, E., & Zeller, R. (1979). Reliability and valid
203

Caspari, D. (1999). Cannabis and schizophrenia: results of a follow-up study. EuropeanArchives of Psychiatry & Clinical Neuroscience, 249(1), 45-49.
eda, E., Moss, D., Oddie, S., & Whisha
Castan w, I. (1991). THC does not affect striatal
Castell ., & Hallett, M. (1996). inary
Chan, A
Chen, Jaloxone-blockable enhancement of presynaptic
Chen, J cific facilitation of
Cheshe e inhibited by dopamine
Chopra
Cohen,6.
J: m.
an
e
tric
al
Cottler n, H.-U., et al. (1991).
58.
formation-processing system.
Crawle, an endogenous ligand of the cannabinoid receptor, induces
dopamine release: microdialysis in freely moving rats. Pharmacology, Biochemistry & Behavior, 40, 587-591. anos, F., Fine, E., Kaysen, D., Marsh, W., Rapoport, JSensorimotor gating in boys with Tourette's syndrome and ADHD: prelimfindings. Biological Psychiatry, 39, 33-41. . (1993). Recent developments in detection and biological indicators of
alcoholism. Drugs and Society, 8(1), 31-67. ., Paredes, W., Li, J., Smith, D., Lowinson, J., & Gardner, E. (1990). Delta-9-tetrahydrocannabinol produces nbasal dopamine efflux in nucleus accumbens of conscious, freely-moving rats as measured by intracerebral microdialysis. Psychopharmacology, 102, 156-162. ., Paredes, W., Lowinson, J., & Gardner, E. (1991). Strain-spedopamine efflux by delta 9-tetrahydrocannabinol in the nucleus accumbens of rat: an in vivo microdialysis study. Neuroscience Letters, 129(1), 136-180. r, G., & Jackson, D. (1980). Post-swim grooming in micreceptor antagonists and by cannabinoids. Pharmacology, Biochemistry & Behavior, 13(3), 479-481. , G., & Smith, J. (1974). Psychotic reactions following cannabis use in East Indians. Archives of General Psychiatry, 30, 24-27. J. (1960). A coefficient of agreement for nominal scales. Educational and Psychological Measurement, 20, 37-4
Cohen, J. (1988). Statistical power analysis for the behavioural sciences.: Hillsdale, NErlbau
Cohen, M. E., Stitt, C. L., & Hoffman, H. S. (1981). Sensory magnitude estimation inthe context of reflex modification. Journal of Experimental Psychology: HumPerception & Performance, 7(6), 1363-1370.
Condren, R., O'Connor, J., & Browne, R. (2001). Prevalence and patterns of substancmisuse in schizophrenia. A catchment area case-control study. PsychiaBulletin, 25, 17-20.
Cooper, L., Peters, L., & Andrews, G. (1998). Validity of the Composite InternationDiagnostic Interview (CIDI) psychosis module in a psychiatric setting. Journal of Psychiatric Research, 32, 361-368. , L., Robins, L., Grant, B., Blaine, J., Towle, L., WittcheThe CIDI-Core substance abuse and dependence questions: cross-cultural and nosological issues. British Journal of Psychiatry, 159, 653-6
Cowan, N. (1988). Evolving conceptions of memory storage, selective attention, and their mutual constraints within the human inPsychological Bulletin, 104(2), 163-191. y, J., Corwin, R., Robinson, J., Felder, C., Devane, W., & Axelrod, J. (1993). Anandamidehypomotility and hypothermia in vivo in rodents. Pharmacology, Biochemistry & Behavior, 46, 967-972.
Cuffel, B., & Chase, P. (1994). Remission and relapse of substance use disorders in schizophrenia: Results from a one year prospective study. Journal of Nervous &Mental Disease, 182, 342-348.
Curzon, P., Kim, D., & Decker, M. (1994). Effects of nicotine, lobeline, and mecamylamine on sensory gating in the rat. Pharmacology, Biochemistry, and Behavior, 49, 877-882.
204

Dalby, J., & Duncan, B. (1987). Shared paranoid disorder preceded by cannabis abuse: case report. Canadian Journal of Psychiatry, 32(1), 64-65.
Darke, S. (1998). Self-report among injecting drug users: A review. Drug and Alcohol Dependence, 51, 253-263.
Darke, S., Hall, W., Wodak, A., Heather, N., & Ward, J. (1992). Development and validation of a multi-dimensional instrument for assessing outcome of treatment
n, 91(3),
Darke, atment
rican Journal of Psychiatry, 148(11), 1474-
Davis, t y, 95,
Davis, artle modulation: research
-96). and Hillsdale.
),
).
Dawe, and other drug use and other
tion
r gating in
de Fon os, J. (1991). ny of
de Fonseca, F., Cebeira, M., Hernandez, M., Ramos, J., & Fernandez-Ruiz, J. (1990).
de Fonseca, F., Fernandez-Ruiz, J., Murphy, L., Cebeira, M., Steger, R., Bartke, A., et
among opiate users: the Opiate Treatment Index. British Journal of Addiction, 87, 733-742.
Darke, S., Ross, J., & Hall, W. (1996). Overdose among heroin users in Sydney, Australia: I. Prevalence and correlates of non-fatal overdose. Addictio405-411. S., Ward, J., Hall, W., Heather, N., & Wodak, A. (1991). The Opiate TreIndex (OTI) Manual. Technical Report Number 11. NSW, Australia: National Drug and Alcohol Research Centre, University of New South Wales.
Davis, K., Kahn, R., Ko, G., & Davidson, M. (1991). Dopamine and schizophrenia: a review and reconceptualization. Ame1486. M. (1988). Apomorphine, d-amphetamine, strychnine and yohimnbine do noalter prepulse inhibition of the acoustic startle reflex. Psychopharmacolog151-156. M. (1997). The neurophysiological basis of acoustic ston fear motivation and sensory gating. In P. Lang, R. Simons & M. Balaban (Eds.), Attention and orienting: sensory and motivational processes. (pp. 69New York: Erlbaum
Davis, M., Gendelman, D., Tischler, M., & Gendelman, P. (1982). A primary acoustic startle circuit: lesion and stimulation studies. Journal of Neuroscience, 2(6791-805.
Davis, M., Mansbach, R., Swerdlow, N., Campeau, S., Braff, D., & Geyer, M. (1990Apomorphine disrupts the inhibition of acoustic startle induced by weak prepulses in rats. Psychopharmacology, 102(1), 1-4. S., Loxton, N., Hides, L., Kavanagh, D., & Mattick, R. (2002). Review of diagnostic screening instruments for alcoholpsychiatric disorders. (2nd ed.). Commonwealth of Australia: Australian Government Publishing Service.
Dawson, M., Hazlett, E., Filion, D., Nuechterlein, K., & Schell, A. (1993). Attenand schizophrenia: impaired modulation of the startle reflex. Journal of Abnormal Psychology, 102(4), 633-641.
Dawson, M., Schell, A., Hazlett, E., Nuechterlein, K., & Filion, D. (2000). On the clinical and cognitive meaning of impaired sensorimotoschizophrenia. Psychiatry Research, 96(3), 187-197.
seca, F., Cebeira, M., Fernandez-Ruiz, J., Navarro, M., & RamEffects of pre- and perinatal exposure to hashish extracts on the ontogebrain dopaminergic neurons. Neuroscience, 43, 713-723.
Changes in brain dopaminergic indices induced by perinatal exposure to cannabinoids in rats. Developmental Brain Research, 51, 237-240.
al. (1992). Acute effects of delta-9-tetrahydrocannabinol on dopaminergic activity in several rat brain areas. Pharmacology, Biochemistry & Behavior, 42(2), 269-275.
205

Dean, B., Bradbury, R., & Copolov, D. (2003). Cannabis-sensitive dopaminergic markers in postmortem central nervous system: Changes in schizophrenBiological Psychiatry, 53(7), 585-592.
ia.
eview, 15(1), 57-63.
dings from the National -
Degenh o use, substance-l
Degenh, 191-196.
nd rders, and psychosis. Addiction, 96(11),
Degenh about the ,
Degenh on Australian and New Zealand Journal of Public Health,
Delcom ed States of
Della C on, J. (1998). The effects of smoking on y,
DelPez M., & Hoffman, H. S. (1980). Attentional factors in the inhibition of a
Dervau t s.
ench]. Encephale, 29(1), 11-17.
stituent that binds to the cannabinoid
DeweyDi Chia . Drugs abused by humans preferentially increase
ing f
. European Journal
Didcot 997). Long-term cannabis users on the New South Wales north coast.: National Drug and Alcohol Research Centre Monograph 30.
Dean, B., Sundram, S., Bradbury, R., Scarr, E., & Copolov, D. (2001). Studies on [3H]CP-55940 binding in the human central nervous system: regional specific changes in density of cannabinoid-1 receptors associated with schizophrenia and cannabis use. Neuroscience, 103(1), 9-15.
Deering, D., & Sellman, J. (1996). An inter-rater reliability study of the Opiate Treatment Index. Drug & Alcohol R
Degenhardt, L., & Hall, W. (2001a). The association between psychosis and problematical drug use among Australian adults: finSurvey of Mental Health and Well-Being. Psychological Medicine, 31(4), 659668. ardt, L., & Hall, W. (2001c). The relationship between tobaccuse disorders and mental health: results from the National Survey of MentaHealth and Well-Being. Nicotine & Tobacco Research, 3(3), 225-234. ardt, L., & Hall, W. (2002). Cannabis and psychosis. Current Psychiatry Reports, 4(3)
Degenhardt, L., Hall, W., & Lynskey, M. (2001b). Alcohol, cannabis and tobacco use among Australians: a comparison of their associations with other drug use ause disorders, affective and anxiety diso1603-1614. ardt, L., Hall, W., & Lynskey, M. (2003). Testing hypothesesrelationship between cannabis use and psychosis. Drug & Alcohol Dependence71(1), 37-48. ardt, L., Lynskey, M., & Hall, W. (2000). Cohort trends in the age of initiatiof drug use in Australia. 24(4), 421-426. un, F. (1998). Foundations of neurobiology. New York, The UnitAmerica: W.H. Freeman and Company. asa, V., Hofer, I., Weiner, I., & Feldacoustic prepulse inhibition in healthy men and women. Psychopharmacolog137(4), 362-368. zo, E.reflex by a visual stimulus. Science., 210(4470), 673-674. x, A., Laqueille, X., Bourdel, M.-C., Le Borgne, M.-H., Olie, J.-P., Loo, H., eal. (2003). Cannabis and schizophrenia: Demographic and clinical correlate[abstract only; Fr
Devane, W., Hanus, L., Breuer, A., Pertwee, R., Stevenson, L., Griffin, G., et al. (1992).Isolation and structure of a brain conreceptor. Science, 258, 1946-1949. , W. (1986). Cannabinoid pharmacology. Pharmacology Review, 38, 151-172. ra, G., & Imperato, A. (1988)synaptic dopamine concentrations in the mesolimbic system of freely movrats. Proceedings of the National Academy of Sciences of the United States oAmerica, 85(14), 5274-5278.
Diana, M., Melis, M., & Gessa, G. (1998). Increase in meso-prefrontal dopaminergic activity after stimulation of CB1 receptors by cannabinoidsof Neuroscience, 10(9), 2825-2830.
t, P., Reilly, D., Swift, W., & Hall, W. (1
206

Digiusto, E., Seres, V., Bibby, A., & Batey, R. (1996). Concordance between urinaresults and self-reported drug use by applicants for methadone maintenance in Austr
lysis
alia. Addictive Behaviors, 21(3), 319-329. a
Downe with self-
17.
typal personality traits in healthy
Duncan t al. startle and prepulse inhibition in humans.
Duncan t al. on prepulse inhibition of acoustic startle in
Duncan
Eaton, , J., & Nestadt, G. (1991). Screening for psychosis
Ehrenr L., et al. (1999).
ElSohl B. (2000). Potency
Emrich sis of
07. Etter, J
endence and of the Heaviness of Smoking Index among relatively light
Ewing,
a national survey of prisoners.
Feingold, A., & Rounsaville, B. (1995). Construct validity of the abuse-dependence
Feinste(6), 543-549.
Donker, D. K., Hasman, A., & Van Geijn, H. P. (1993). Interpretation of low kappvalues. International Journal of Biomedical Computing, 33, 55-64. y, K., Helmus, T., & Schuster, C. (2000). Contingency management for accuratepredictions of urinalysis test results and lack of correspondence reported drug use among polydrug abusers. Psychology of Addictive Behaviors, 14(1), 69-72.
Drake, R., Rosenberg, S., & Mueser, K. (1996). Assessing substance use disorder in persons with severe mental illness. New Directions for Mental Health Services,70, 3-
Dumas, P., Saoud, M., Bouafia, S., Gutknecht, C., Ecochard, R., Dalery, J., et al. (2002). Cannabis use correlates with schizostudents. Psychiatry Research, 109(1), 27-35. , E., Madonick, S., Chakravorty, S., Parwani, A., Szilagyi, S., Efferen, T., e(2001). Effects of smoking on acoustic Psychopharmacology, 156, 266-272. , E., Szilagyi, S., Efferen, T., Schwartz, M., Parwani, A., Chakravorty, S., e(2003a). Effect of treatment status schizophrenia. Psychopharmacology, 167(1), 63-71. , E., Szilagyi, S., Schwartz, M., Kunzova, A., Negi, S., Efferen, T., et al. (2003b). Prepulse inhibition of acoustic startle in subjects with schizophrenia treated with olanzapine or haloperidol. Psychiatry Research, 120(1), 1-12. W., Romanoski, A., Anthonyin the general population with a self-report interview. Journal of Nervous and Mental Disease, 179, 689-693.
eich, H., Rinn, T., Kunert, H., Moeller, M., Poser, W., Schilling, Specific attentional dysfunction in adults following early start of cannabis use. Psychopharmacology, 142(3), 295-301.
y, M., Ross, S., Mehmedic, Z., Arafat, R., Yi, B., & Banahan,trends of delta9-THC and other cannabinoids in confiscated marijuana from1980-1997. Journal of Forensic Science, 45(1), 24-30. , H., Leweke, F., & Schneider, U. (1997). Towards a cannabinoid hypotheschizophrenia: cognitive impairments due to dysregulation of the endogenous cannabinoid system. Pharmacology, Biochemistry & Behavior, 56(4), 803-8., Duc, T., & Perneger, T. (1999). Validity of the Fagerstrom Test for Nicotine Depsmokers. Addiction, 94(2), 269-281. J. (1984). Detecting alcoholism: the CAGE questionnaire. JAMA, 252, 1905-1907.
Farrell, M., Boys, A., Bebbington, P., Brugha, T., Coid, J., Jenkins, R., et al. (2002). Psychosis and drug dependence: Results fromBritish Journal of Psychiatry, 181, 393-398.
distinction as measured by DSM-IV criteria for different psychoactive substances. Drug and Alcohol Dependence, 39, 99-109. in, A. R., & Cicchetti, D. V. (1990). High agreement but low kappa: I. The problems of two paradoxes. Journal of Clinical Epidemiology, 43
Fergusson, D., & Horwood, L. (1997). Early onset cannabis use and psychosocial adjustment in young adults. Addiction, 92(3), 279-296.
207

Fergusson, D., & Horwood, L. (2000a). Cannabis use and dependence in a New Zealanbirth cohort. New Zealand Medical Journal, 113, 156-158.
d
Fergusson, D., & Horwood, L. (2000b). Does cannabis use encourage other forms of
nd
Ferri, C ssop, M. (2000). Validity and
flex al
artle -78.
Filion, e psychological significance of human
Finch, ance l Dependence, 51, 269.
artle
Flemintory care setting. Journal of Studies on Alcohol, 52(1), 33-36.
455. e
arch. 3(5), 567-589.
ana
Fritzsche, M. (2000). Are cannabinoid receptor knockout mice animal models for
Gaoni, n f the American Chemical Society,
Gardne 988).
Georgo eeks of
Gersten al of 60-61.
of Pharmacology, 341(1), 39-44.
illicit drug use? Addiction, 95(4), 505-520. Fergusson, D., Horwood, L., & Swain-Campbell, N. (2002). Cannabis use and
psychosocial adjustment in adolescence and young adulthood. Addiction, 97, 1123-1135.
Fergusson, D., Horwood, L., & Swain-Campbell, N. (2003). Cannabis dependence apsychotic symptoms in young people. Psychological Medicine, 33(1), 15-21. ., Marsden, J., de Araujo, M., Laranjeira, R., & Goreliability of the Severity of Dependence Scale (SDS) in a Brazilian sample of drug users. Drug & Alcohol Review, 19(4), 451-455.
Filion, D., Dawson, M., & Schell, A. (1993). Modification of the acoustic startle-reeyeblink: a tool for investigating early and late attentional processes. BiologicPsychology, 35, 185-200.
Filion, D., Dawson, M., & Schell, A. (1994). Probing the orienting response with stmodification and secondary reaction time. Psychophysiology, 31, 68D., Dawson, M., & Schell, A. (1998). Thstartle eyeblink modification: a review. Biological Psychology, 47(1), 1-43. E., & Strang, J. (1998). Reliability and validity of self-report: on the importof considering context. Drug and Alcoho
Flaten, M., & Elden, A. (1999). Caffeine and prepulse inhibition of the acoustic streflex. Psychopharmacology, 147(3), 322-330. g, M., & Barry, K. (1991). The effectiveness of alcoholism screening in an ambula
Fowler, I., Carr, V., Carter, N., & Lewin, T. (1998). Patterns of current and lifetime substance use in schizophrenia. Schizophrenia Bulletin, 24(3), 443-
French, E., Dillon, K., & Wu, X. (1997). Cannabinoids excite dopamine neurons in thventral tegmentum and substantia nigra. Neuroreport, 8(3), 649-652.
Fridlund, A., & Cacioppo, J. (1986). Guidelines for human electromyographic resePsychophysiology, 2
Fried, P., Watkinson, B., James, D., & Gray, R. (2002). Current and former marijuuse: Preliminary findings of a longitudinal study of effects on IQ in young adults. CMAJ: Canadian Medical Association Journal, 166(7), 887-891.
schizophrenia? Medical Hypotheses, 56(6), 638-643. Y., & Mechoulam, R. (1964). Isolation, Structure, and Partial Synthesis of aActive Constituent of Hashish. Journal o86(8), 1646-1647. r, E., Paredes, W., Smith, D., Donner, A., Milling, C., Cohen, D., et al. (1Facilitation of brain stimulation reward by delta-9-tetrahydrocannabinol. Psychopharmacology, 96, 142-144.
Gearon, J., Bellack, A., Rachbeisel, J., & Dixon, L. (2001). Drug-use behavior and correlates in people with schizophrenia. Addictive Behaviors, 26(1), 51-61. tas, A., & Zeidenberg, P. (1979). Observations on the effects of four wheavy marihuana smoking on group interaction and individual behavior. Comprehensive Psychiatry, 20(5), 427-432. , S. (1980). Long-term adverse effects of brief marijuana usage. JournClinical Psychiatry, 41(2),
Gessa, G., Melis, M., Muntoni, A., & Diana, M. (1998). Cannabinoids activate mesolimbic dopamine neurons by an action on cannabinoid CB1 receptors. European Journal
208

Geyer, M. (1981). Effects of levonantradol on habituation of startle in rats. JournalClinical Pharmacology Supplementum, 21, 235-239S. M., & Braff, D. (1982). Habituation of the blink
of
Geyer, reflex in normals and
Geyer, M., & Braff, D. (1987). Startle habituation and sensorimotor gating in
Geyer, M., Swerdlow, N., Mansbach, R., & Braff, D. (1990). Startle response models of
f rats
ogical Psychiatry, 34, 361-372.
154. Ghodse, A. (1986). Cannabis psychosis. British Journal of Addiction, 81, 473-478.
Glass, G., & Stanley, J. (1970). Statistical methods in education and psychology.
Glass, M., Dragunow, M., & Faull, R. (1997a). Cannabinoid receptors in the human
Glass, M., & Felder, C. (1997b). Concurrent stimulation of cannabinoid CB1 and
nce, 17,
ana
Gossop, M., Best, D., Marsden, J., & Strang, J. (1997). Test-retest reliability of the
Gossop 5). The
mples of heroin, cocaine and amphetamine users.
Grace, tric admissions. Drug & Alcohol Review, 19(3), 287-290.
Graham prestimulation on 08-
ol se and the
schizophrenic patients. Psychophysiology, 19(1), 1-6.
schizophrenia and related animal models. Schizophrenia Bulletin, 13(4), 643-668.
sensorimotor gating and habituation deficits in schizophrenia. Brain Research Bulletin, 25(3), 485-498.
Geyer, M., Wilkinson, L., Humby, T., & Robbins, T. (1993). Isolation rearing oproduces a deficit in prepulse inhibition of acoustic startle similar to that inschizophrenia. Biol
Geyer, M. A., Krebs, K., Braff, D. L., & Swerdlow, N. R. (2001). Pharmacological studies of prepulse inhibition models of sensorimotor gating deficits in schizophrenia: a decade in review. Psychopharmacology, 156, 117-
Giuffrida, A., Parsons, L., Kerr, T., Rodriguez de Fonseca, F., Navarro, M., & Piomelli, D. (1999). Dopamine activation of endogenous cannabinoid signalling in dorsal striatum. Nature Neuroscience, 2, 358-363.
Gjerde, P. (1983). Attentional capacity dysfunction and arousal in schizophrenia. Psychological Bulletin, 93, 57-72.
Englewood Cliffs, New Jersey: Prentice-Hall, Inc.
brain: a detailed anatomical and quantitative autoradiographic study in the fetal, neonatal and adult human brain. Neuroscience, 77, 299-318.
dopamine D2 receptors augments cAMP accumulation in striatal neurons: evidence for a Gs linkage to the CB1 receptor. The Journal of Neuroscie5327-5333.
Gledhill-Hoyt, J., Lee, H., Strote, J., & Wechsler, H. (2000). Increased use of marijuand other illicit drugs at US colleges in the 1990s: results of three national surveys. Addiction, 95(11), 1655-1667.
Severity of Dependence Scale (letter). Addiction, 92(3), 353. , M., Darke, S., Griffiths, P., Hando, J., Powis, B., Hall, W., et al. (199Severity of Dependence Scale (SDS): psychometric properties of the SDS in English and Australian saAddiction, 90, 607-614. R., Shenfield, G., & Tennant, C. (2000). Cannabis and psychosis in acute psychia
Graham, F. (1975). The more or less startling effects of weak prestimulation. Psychophysiology, 12(3), 238-248. , F. K., & Murray, G. (1977). Discordant effects of weakmagnitude and latency of the reflex blink. Physiological Psychology, 5(1), 1114.
Graham, S., Langley, R., Bradshaw, C., & Szabadi, E. (2001). Effects of haloperidand clozapine on prepulse inhibition of the acoustic startle responN1/P2 auditory evoked potential in man. Journal of Psychopharmacology, 15(4), 243-250.
209

Green, S., & Whichelow, M. (1994). Longitudinal validity of the CAGE questionnaire.Addiction Research, 2(2), 195-201.
gating
Grillon , & O'Malley, S. S. (2000). Effects of alcohol on
Grillon171.
Grzesia, 519-
Hackle rting effects of weak s.
ing: Sensory .
s
Hall, W is in Australia: evidence and 503-
Hambrecht, M., & Hafner, H. (1996). Substance abuse and the onset of schizophrenia.
Hambr
.
Hays, R., Merz, J., & Nicholas, R. (1995). Response burden, reliability, and validity of or
Heathe agerstrom, K. (1991). The Fagerstrom
Herken elvin, L., de Costa, B., et al. l
Hernanes activity of tyrosine hydroxylase in
-
Grillon, C., Ameli, R., Charney, D., Krystal, J., & Braff, D. (1992). Startledeficits occur across prepulse intensities in schizophrenic patients. Biological Psychiatry, 32(10), 939-943. , C., Sinha, R., Ameli, R.baseline startle and prepulse inhibition in young men at risk for alcoholism and/or anxiety disorders. Journal of Studies on Alcohol., 61(1), 46-54. , C., Sinha, R., & O'Malley, S. (1994). Effects of ethanol on the acoustic startle reflex in humans. Psychopharmacology, 114(1), 167-
Groves, P. M., & Thompson, R. F. (1970). Habituation: A dual-process theory. Psychological Review, 77(5), 419-450. k, M., & Kiejna, A. (1999). The diagnostic questionnaires and their use in epidemiological studies in psychiatry [Polish]. Psychiatria Polska, 33(4)533. y, S., & Boelhouwer, A. (1997). The more or less staprestimulation- revisited: prepulse modulation of multicomponent blink reflexeIn P. Lang, R. Simons & M. Balaban (Eds.), Attention and orientand motivational processes. Mahwah, NJ: Lawrence Erlbaum
Hall, W., Solowij, N., & Lemon, J. (1994). The health and psychological consequenceof cannabis use. Canberra: Australian Government Publishing Service. ., & Swift, W. (2000). The THC content of cannabimplications. Australian & New Zealand Journal of Public Health, 24(5),508.
Biological Psychiatry, 40(11), 1155-1163. echt, M., & Hafner, H. (2000). Cannabis, vulnerability, and the onset of schizophrenia: an epidemiological perspective. Australian & New Zealand Journal of Psychiatry, 34(3), 468-475.
Hamera, E., Schneider, J., & Deviney, S. (1995). Alcohol, cannabis, nicotine, and caffeine use and symptom distress in schizophrenia. Journal of Nervous & Mental Disease, 183(9), 559-565.
Harburg, E., Gunn, R., Gleiberman, L., Roeper, P., Di Franceisco, W., & Caplan, R.(1988). Using the Short Michigan Alcoholism Screening Test to study social drinkers: Tecumseh, Michigan. Journal of Studies on Alcohol, 49(6), 522-531
Harding, T., & Knight, F. (1973). Marihuana-Modified Mania. Archives of General Psychiatry, 29(5), 635-637.
the CAGE, Short MAST, and AUDIT alcohol screening measures. BehaviResearch Methods, Instruments, & Computers, 27(2), 277-280. rton, T., Kozlowski, L., Frecker, R., & FTest for Nicotine Dependence: a revision of the Fagerstrom Tolerance Questionnaire. British Journal of Addiction, 86, 1119-1127. ham, M., Lynn, A., Little, M., Johnson, M., M(1990). Cannabinoid receptor localization in brain. Proceedings of the NationaAcademy of Sciences of the United States of America, 87(5), 1932-1936. dez, M., Garcia-Gil, L., Berrendero, F., Ramos, J., & Fernandez-Ruiz, J. (1997). Delta-9-tetrahydrocannabinol increascultured fetal mesencephalic neurons. Journal of Molecular Neuroscience, 8, 8391.
210

Hershkowitz, M., & Szechtman, H. (1979). Pretreatment with delta-1-tetrahydrocannabinol and psychoactive drugs: effects on uptake of biogenic
276. Hicklin on rates in Jamaica, 1971 and 1988.
. ene
Hoffmabition deficits in an animal model of schizophrenia.
Hoffma
Howlet , tomical and behavioral
Huang, normal controls in behavioral research
Hughes king
Hutchi T. (2003). Startle
rmacology, 150(3), 244-252.
Hutchix in humans. Psychopharmacology, 143(394-400).
annabis-avica, 83(2), 134-136.
Jablens , Gureje, O., Evans, M., et al.
y, 34,
, et al.
alth of Australia.
amines and on behaviour. European Journal of Pharmacology, 59, 267-g, F. (1991). Psychiatric hospital admissiBritish Journal of Psychiatry, 159, 817-821.
Hirsch, S. R., & Weinberger, D. R. (1995). Schizophrenia. Great Britain: Blackwell Science.
Hoehe, M., Rinn, T., Flachmeier, C., Heere, P., Kunert, H., Timmerman, B., et al(2000). Comparative sequencing of the human CB1 cannabinoid receptor gcoding exon: no structural mutations in individuals exhibiting extreme responses to cannabis. Psychiatric Genetics, 10(4), 173-177. n, D., & Donovan, H. (1994). D1 and D2 dopamine receptor antagonists reverse prepulse inhiPsychopharmacology, 115, 447-453. n, H., & Ison, J. (1980). Reflex modification in the domain of startle: I. Some empirical findings and their implications for how the nervous system processes sensory input. Psychological Review, 87(2), 175-189.
Hollister, L. (1986). Health aspects of cannabis. Pharmacological Reviews, 38(1), 1-20. t, A., Bidaut-Russell, M., Devane, W., Melvin, L., Johnson, M., & HerkenhamM. (1990). The cannabinoid receptor: biochemical, anacharacterization. TINS, 13(10), 420-423. D., Koo, H., Dougherty, D., & Hassan, Y. (2003). Psychopathology among persons responding to participation asstudies. Comprehensive Psychiatry, 44(2), 83-87. , J., Hatsukami, D., Mitchell, J., & Dahlgren, L. (1986). Prevalence of smoamong psychiatric outpatients. American Journal of Psychiatry, 143, 993-997.
Hutchings, D., Brake, S., Banks, A., Nero, T., Dick, L., & Zmitrovich, A. (1991). Prenatal delta-9-tetrahydrocannabinol in the rat: effects on auditory startle in adulthood. Neurotoxicology and Teratology, 13, 413-416.
son, K., McGeary, J., Wooden, A., Blumenthal, T., & Ito, magnitude and prepulse inhibition: effects of alcohol and attention. Psychopharmacology, 167(3), 235-241.
Hutchison, K., Niaura, R., & Swift, R. (2000). The effects of smoking high nicotine cigarettes on prepulse inhibition, startle latency, and subjective responses. Psychopha
Hutchison, K., Rohsenow, D., Monti, P., Palfai, T., & Swift, R. (1997). Prepulse inhibition of the startle reflex: preliminary study of the effects of a low dose of alcohol in humans. Alcoholism: Clinical & Experimental Research, 21(7), 1312-1319.
son, K., & Swift, R. (1999). Effect of d-amphetamine on prepulse inhibition of the startle refle
Imade, A., & Ebie, J. (1991). A retrospective study of symptom patterns of cinduced psychosis. Acta Psychiatrica Scandin
Jablensky, A. (1995). Schizophrenia: recent epidemiologic issues. Epidemiologic Reviews, 17, 10-20. ky, A., McGrath, J., Herrman, H., Castle, D.(2000). Psychotic disorders in urban areas: an overview of the Study on Low Prevalence Disorders. Australian and New Zealand Journal of Psychiatr221-236.
Jablensky, A., McGrath, J., Herrman, H., Castle, D., Gureje, O., Morgan, V.(1999). People living with psychotic illness: An Australian study 1997-98. Canberra: Commonwe
211

Jablensky, A., Sartorius, N., Ernberg, G., Anker, M., Korten, A., Cooper, J., et al. (1992). Schizophrenia: manifestations, incidence and course in different
Jaeschke, R., Guyatt, G., & Sackett, D. (1994). User's Guides to the Medical Literature.
Janca, A., Robins, L., Cottler, L., & Early, T. (1992). Clinical observation of assessment
,
Jenning king early and late
Johns, ournal of Psychiatry, 178,
Jorm, An
sessing the
Kandel ls of neural science and
.
atry & Clinical
Katz, G 00). ;
w]. Harefuah, 138(12), 1015-1018,1088.
Keith, V., Mansbach, R., & Geyer, M. (1991). Failure of haloperidol to block the effects
Kempe
s and controls. Neuropsychobiology, 48(2), 95-101.
S community sample. Archives of General Psychiatry, 53, 1022-
Keselm e 35, 470-478.
cultures. A World Health Organization Ten-Country Study. Psychological Medicine, Monograph Supplement 20, 1-97.
III. How to use an article about a diagnostic test. B. What are the results and will they help me in caring for my patients. JAMA, 271(9), 703-707.
using the Composite International Diagnostic Interview (CIDI). An analysis of the CIDI Field Trials- Wave II at the St Louis Site. British Journal of Psychiatry, 160, 815-818.
Japha, K., & Koch, M. (1999). Picrotoxin in the medial prefrontal cortex impairs sensorimotor gating in rats: reversal by haloperidol. Psychopharmacology144(4), 347-354. s, P., Schell, A., Filion, D., & Dawson, M. (1996). Tracstages of information processing: contributions of startle eyeblink reflex modification. Psychophysiology, 33, 148-155. A. (2001). Psychiatric effects of cannabis. British J116-122. ., Griffiths, K., Christensen, H., & Medway, J. (2001). Research priorities in mental health. Canberra: Centre for Mental Health Research, The AustraliaNational University.
Joy, J., Watson, S., Jr., & Benson, J., Jr. (1999). Marijuana and medicine. Asscience base. (1st ed.). USA: National Academy Press, Washington, D.C. , E., Schwartz, J., & Jessell, T. (1995). Essentiabehavior. (International ed.). The United States of America: Prentice Hall International, Inc.
Karper, L., Freeman, G., Grillon, C., Morgan, C. R., Charney, D., & Krystal, J. (1996)Preliminary evidence of an association between sensorimotor gating and distractibility in psychosis. Journal of NeuropsychiNeurosciences, 8(1), 60-66. ., Shufman, E., Knobler, H., Joffe, M., Bar-Hamburger, R., & Durst, R. (20Drug abuse among patients requiring psychiatric hospitalization [abstract onlyHebre
Kavanagh, D., McGrath, J., Saunders, J., Dore, G., & Clark, D. (2002). Substancemisuse in patients with schizophrenia: epidemiology and management. Drugs, 62(5), 743-755.
Keeler, M. (1967). Adverse reaction to marihuana. American Journal of Psychiatry, 124(5), 674-677.
of phencyclidine and dizocilpine on prepulse inhibition of startle. Biological Psychiatry, 30(6), 557-566. l, P., Lampe, K., Parnefjord, R., Hennig, J., & Kunert, H. J. (2003). Auditory-evoked potentials and selective attention: different ways of information processing in cannabis user
Kendler, K., Gallagher, T., Abelson, J., & Kessler, R. (1996). Lifetime prevalence, demographic risk factors, and diagnostic validity of non-affective psychosis asassessed in a U1031. an, H. (1998). Testing treatment effects in repeated measures designs: an updatfor psychophysiological researchers. Psychophysiology,
212

Keup, W. (1970). Psychotic symptoms due to cannabis abuse. Diseases of the NervSystem, 31(2), 119-126.
ous
us on -
l
-479.
Knable31.
Knudse ia.
Koch, M cycle in female rats.
Koch, Mmediation of prepulse
l. (2001). terview (CIDI-Auto)
&
Kozlow Heatherton, T. (1994). Predicting
Krystal, J., D'Souza, D., Madonick, S., & Petrakis, I. (1999). Toward a rational
Kumar
Kumar & Gray, J. (1997). Effect of acute subcutaneous n-
Kumar cotine dependence and
Kumarn
ce
Kumar inhibition of the
Kumaria with clozapine. American Journal of Psychiatry,
156(7), 1046-1051.
Khantzian, E. (1985). The self-medication hypothesis of addictive disorders: focheroin and cocaine dependence. American Journal of Psychiatry, 142(11), 12591264.
Kiejna, A., Grzesiak, M., & Kantorska-Janiec, M. (1998). The Composite InternationaDiagnostic Interview: possibilities of utilization for economic studies in psychiatry [Polish]. Psychiatria Polska, 32(4), 463
Kiess, H. (1989). Statistical concepts for the behavioral sciences. USA: Allyn and Bacon. , M. B., & Weinberger, D. R. (1997). Dopamine, the prefrontal cortex and schizophrenia. Journal of Psychopharmacology, 11(2), 123-1n, P., & Vilmar, T. (1984). Cannabis and neuroleptic agents in schizophrenActa Psychiatrica Scandinavica, 69(2), 162-174.
. (1998). Sensorimotor gating changes across the estrousPhysiology and Behavior, 64(5), 625-628.
., Kungel, M., & Herbert, H. (1993). Cholinergic neurons in the pedunculopontine tegmental nucleus are involved in the inhibition of the acoustic startle response in the rat. Experimental Brain Research, 97(1), 71-82.
Komiti, A., Jackson, H., Judd, F., Cockram, A., Kyrios, M., Yeatman, R., et aA comparison of the Composite International Diagnostic Inwith clinical assessment in diagnosing mood and anxiety disorders. AustralianNew Zealand Journal of Psychiatry, 35(2), 224-230. ski, L., Porter, C., Orleans, C., Pope, M., & smoking cessation with self-reported measures of nicotine dependence: FTQ, FTND, HSI. Drug and Alcohol Dependence, 34, 211-216.
pharmacotherapy of comorbid substance abuse in schizophrenic patients. Schizophrenia Research Supplementum, 35, 35-49. i, V., Checkley, S., & Gray, J. (1996). Effect of cigarette smoking on prepulse inhibition of the acoustic startle reflex in healthy male smokers. Psychopharmacology, 128(1), 54-60. i, V., Cotter, P., Checkley, S., nicotine on prepulse inhibition of the acoustic startle reflex in healthy male nosmokers. Psychopharmacology, 132(4), 389-395. i, V., & Gray, J. (1999b). Smoking withdrawal, niprepulse inhibition of the acoustic startle reflex. Psychopharmacology, 141(1), 11-15. i, V., Mulligan, O., Cotter, P., Poon, L., Toone, B., Checkley, S., et al. (1998). Effects of single oral administrations of haloperidol and d-amphetamine oprepulse inhibition of the acoustic startle reflex in healthy male volunteers. Behavioural Pharmacology, 9(7), 567-576.
Kumari, V., & Sharma, T. (2002b). Effects of typical and atypical antipsychotics on prepulse inhibition in schizophrenia: A critical evaluation of current evidenand directions for future research. Psychopharmacology, 162(2), 97-101. i, V., Soni, W., Mathew, V., & Sharma, T. (2000). Prepulsestartle response in men with schizophrenia: effects of age of onset of illness, symptoms, and medication. Archives of General Psychiatry, 57(6), 609-614. i, V., Soni, W., & Sharma, T. (1999a). Normalization of information processing deficits in schizophren
213

Kumari, V., Soni, W., & Sharma, T. (2001a). Influence of Cigarette Smoking on Prepulse Inhibition of the Acoustic Startle Response in Schizophrenia. Human Psychopharmacology, 16(4), 321-326.
Kumar
trolled study. Journal of
Kumar . (2001b). ition of the acoustic startle response in
Kuperb Neurobiology, 10(2), 205-210.
Lang, P lex.
Lawren
Le Pen, G., & Moreau, J.-L. (2002). Disruption of prepulse inhibition of startle reflex in
.
of chiatric Genetics), 105, 749-752.
d
Lewek ent of l
Leweke, F., Giuffrida, A., Gerth, C., Koethe, D., Schreiber, D., Schultze-Lutter, F., et
Lewek
uroreport, 10(8), 1665-1669.
Linn, G
Linszen ourse of
Lipp, O on startle prepulse inhibition. Biological Psychology, 47(1), 65-76.
Lisi, A., Kazlauskas, R., & Trout, G. (1993). Gas chromatographic-mass spectrometric quantification of urinary 11 nor delta-9-tetrahydrocannabinol 9 carboxylic acid
Kumari, V., Soni, W., & Sharma, T. (2002a). Prepulse inhibition of the startle responsein risperidone-treated patients: comparison with typical antipsychotics. Schizophrenia Research, 55(1-2), 139-146. i, V., Zachariah, E., Galea, A., Jones, H., Das, M., Mehrotra, R., et al. (2003). Effects of acute procyclidine administration on prepulse inhibition of the startleresponse in schizophrenia: A double-blind, placebo-conPsychopharmacology, 17(1), 89-95. i, V., Zachariah, E., Galea, A., Mehrotra, R., Taylor, D., & Sharma, TEffects of procyclidine on prepulse inhibhealthy human volunteers. Psychopharmacologia, 154(3), 221-229. erg, G., & Heckers, S. (2000). Schizophrenia and cognitive function. Current Opinion in
Lamb, H. (1982). Young adult chronic patients: the new drifters. Hospital and Community Psychiatry, 33(6), 465-468.
Landis, C., & Hunt, W. (1939). The startle pattern. New York: Farrar & Rinehart. ., Bradley, M., & Cuthbert, B. (1990). Emotion, attention, and the startle refPsychological Review, 97, 377-395. ce, J., & De Luca, C. (1983). Myoelectric signal vs. force relationship in different human muscles. Journal of Applied Physiology, 54, 1653-1659.
a neurodevelopmental model of schizophrenia: Reversal by clozapine, olanzapine and risperidone but not by haloperidol. Neuropsychopharmacology, 27(1), 1-11.
Leroy, S., Griffon, N., Bourdel, M. C., Olie, J. P., Poirier, M. F., & Krebs, M. O(2001). Schizophrenia and the cannabinoid receptor type 1 (CB1): Association study using a single-base polymorphism in coding exon 1. American JournalMedical Genetics (Neuropsy
Leumann, L., Feldon, J., Vollenweider, F., & Ludewig, K. (2002). Effects of typical anatypical antipsychotics on prepulse inhibition and latent inhibition in chronic schizophrenia. Biological Psychiatry, 52(7), 729-739.
e, F., & Emrich, H. (1998). Carbamazepine as an adjunct in the treatmschizophrenia-like psychosis related to cannabis abuse. International ClinicaPsychopharmacology, 14(1), 37-39.
al. (2004). The role of endogenous cannabinoids in developing psychoses (abstract). The World Journal of Biological Psychiatry, 5(Supplementum 1), 20.
e, F., Giuffrida, A., Wurster, U., Emrich, H., & Piomelli, D. (1999). Elevated endogenous cannabinoids in schizophrenia. Ne
Light, G., & Braff, D. (1999). Human and animal studies of schizophrenia-related gating deficits. Current Psychiatry Reports, 1(1), 31-40. ., & Javitt, D. (2001). Phencyclidine (PCP)-induced deficits of prepulse inhibition in monkeys. Neuroreport, 12(1), 117-120. , D., Dingemans, P., & Lenior, M. (1994). Cannabis abuse and the crecent-onset schizophrenic disorders. Archives of General Psychiatry, 51(4), 273-279. ., & Krinitzky, S. (1998a). The effect of repeated prepulse and reflex stimulus presentations
214

after derivatization by direct extractive alkylation. Journal of Chromatography, 617, 265-270. R. (1999-2003). ConceptsLowry, and applications of inferential statistics.: http://faculty.vassar.edu/lowry/webtext.html. ig, K., Geyer, M., Etzensberger, M., & VollenweiLudew der, F. (2002a). Stability of the
ophrenia.
d
eekly,
Macke in drug-naive schizophrenic patients.
Magura rnal of the
Mailleu the ganglia. Higher levels in the striatonigral
Maisto and future directions. Behavioral Assessment, 2, 117-134.
Malone ine release ts.
logs gy, 2(4), 299-308.
pts
Mansbinoid CB1 receptor antagonist SR141716A on the behavior of pigeons
Martin nnabis use
003). odels
d
g deficits. Neuropsychopharmacology, 23(5), 517-
Martins a prognostic factor in schizophrenia. British Journal of
acoustic startle reflex, prepulse inhibition, and habituation in schizSchizophrenia Research, 55(1-2), 129-137.
Ludewig, K., Geyer, M., & Vollenweider, F. (2003). Deficits in prepulse inhibition anhabituation in never-medicated, first-episode schizophrenia. Biological Psychiatry, 54(2), 121-128.
Ludewig, K., & Vollenweider, F. (2002b). Impaired sensorimotor gating in schizophrenia with deficit and with nondeficit syndrome. Swiss Medical W132(13-14), 159-165.
MacCoun, R., & Reuter, P. (2001). Evaluating alternative cannabis regimes. British Journal of Psychiatry, 178, 123-128.
prang, T., Kristiansen, K., & Glenthoj, B. (2002). Effects of antipsychotics onprepulse inhibition of the startle response Biological Psychiatry, 52(9), 863-873. , S., Goldsmith, D., Casriel, C., Goldstein, P., & Lipton, D. (1987). The validityof methadone clients' self-reported drug use. International JouAddictions, 22, 727-749. x, P., & Vanderhaeghen, J. (1992). Localization of cannabinoid receptor in human developing and adult basal neurons. Neuroscience Letters, 148(1-2), 173-176. , S., McKay, J., & Connors, G. (1990). Self-report issues in substance abuse: state of the art
Makkai, T., & McAllister, I. (1997). Marijuana in Australia: patterns and attitudes. Canberra: Australian Government Publishing Service. , D., & Taylor, D. (1999). Modulation by fluoxetine of striatal dopamfollowing delta-9-tetrahydrocannabinol: a microdialysis study in conscious raBritish Journal of Pharmacology, 128(1), 21-26.
Mansbach, R., & Geyer, M. (1989). Effects of phencyclidine and phencyclidine bioon sensorimotor gating in the rat. Neuropsychopharmacolo
Mansbach, R., Geyer, M., & Braff, D. (1988). Dopaminergic stimulation disrusensorimotor gating in the rat. Psychopharmacology, 94(4), 507-514.
ach, R., Rovetti, C., Winston, E., & Lowe III, J. (1996). Effects of the cannaband rats. Psychopharmacology, 124, 315-322.
, G., Wilkinson, A., & Kapur, B. (1988). Validation of self-reported caby urine analysis. Addictive Behaviors, 13, 147-150.
Martin, R., Secchi, R., Sung, E., Lemaire, M., Bonhaus, D., Hedley, L., et al. (2Effects of cannabinoid receptor ligands on psychosis-relevant behavior min the rat. Psychopharmacology, 165(2), 128-135.
Martinez, Z., Oostwegel, J., Geyer, M., Ellison, G., & Swerdlow, N. (2000). "Early" an"late" effects of sustained haloperidol on apomorphine- and phencyclidine-induced sensorimotor gatin527.
ez-Arevalo, M., Calcedo-Ordonez, A., & Varo-Prieto, J. (1994). Cannabis consumption aPsychiatry, 164(5), 679-681.
215

Martin-Iverson, M. (1999). Does sensitization occur to prepulse inhibition of the starreflex effects of repeated apomorphine treatments in rats? Journal of Psychopharmacology, 13(3), 261-273.
tle
cognitive function in healthy subjects.
Mather
cture of
a, H.
cology and Therapeutics, 25, 555-561.
McGuffin, P., Farmer, A., & Harvey, I. (1991). A polydiagnostic application of
McGui Murray, R. (1995).
Mecho dky, M., Kaminski, N., Schatz, A., et sent in canine
Meinck , E. (2002).
hives ical Neuroscience, 252(3), 141-145.
t midbrain. Progress in
Miller,, 40-48.
Mirza, N., Misra, A., & Bright, J. (2000). Different outcomes after acute and chronic uropean
Mischk AST, Mortimer-ent. Journal of Studies on
Moss, Dent of
. Mueser
plications for treatment. Journal of Consulting & Clinical
Mueser, K., Yarnold, P., Levinson, D., Singh, H., Bellack, A., Kee, K., et al. (1990).
Mass, R., Bardong, C., Kindl, K., & Dahme, B. (2001). Relationship between cannabis use, schizotypal traits, and Psychopathology, 34(4), 209-214. s, D., & Ghodse, A. (1992). Cannabis and psychotic illness. British Journal of Psychiatry, 161, 648-653.
Matsuda, L., Lolait, S., Brownstein, M., Young, A., & Bonner, T. (1990). Strucannabinoid receptor and functional expression of the cloned cDNA. Nature, 346, 561-564.
Matsukura, S., Sakamoto, N., Seino, Y., Tamada, T., Matsuyama, H., & Muranak(1979). Cotinine excretion and daily cigarette smoking in habituated smokers. Clinical Pharma
McGhie, A., & Chapman, J. (1961). Disorders of attention and perception in early schizophrenia. British Journal of Medical Psychology, 1961(34), 103-116.
operational criteria in studies of psychotic illness. Development and reliability of the OPCRIT system. Archives of General Psychiatry, 48, 764-770. re, P., Jones, P., Harvey, I., Williams, M., McGuffin, P., & Morbid risk of schizophrenia for relatives of patients with cannabis-associated psychosis. Schizophrenia Research, 15, 277-281. ulam, R., Ben-Shabat, S., Hanus, L., Ligumal. (1995). Identification of an endogenous 2-monoglyceride, pregut, that binds to cannabinoid receptors. Biochemical Pharmacology, 50, 83-90.e, U., Morth, D., Vo, T., & Gouzoulis-MayfrankElectromyographical differentiation between the acoustic blink and startle reflex: Implications for studies investigating startle behavior. European Arcof Psychiatry & Clin
Melis, M., Gessa, G., & Diana, M. (2000). Different mechanisms for dopaminergic excitation induced by opiates and cannabinoids in the raNeuropsychopharmacol Biol Psychiatry, 24, 993-1006. G., & Chapman, J. (2001). Misunderstanding analysis of covariance. Journal of Abnormal Psychology, 110(1)
Miller, P., & Plant, M. (2002). Heavy cannabis use among UK teenagers: an explanation. Drug and Alcohol Dependence, 65, 235-242.
treatment with nicotine in pre-pulse inhibition in Lister hooded rats. EJournal of Pharmacology, 407(1-2), 73-81. e, H., & Venneri, R. (1987). Reliability and validity of the MFilkins Questionnaire and CAGE in DWI assessmAlcohol, 48(5), 492-501. ., Manderscheid, P., Montgomery, S., Norman, A., & Sanberg, P. (1989).
Nicotine and cannabinoids as adjuncts to neuroleptics in the treatmTourette syndrome and other motor disorders. Life Sciences, 44(21), 1521-1525, K., Bellack, A., & Blanchard, J. (1992). Comorbidity of schizophrenia and substance abuse: imPsychology, 60(6), 845-856.
Prevalence of substance abuse in schizophrenia: demographic and clinical correlates. Schizophrenia Bulletin, 16(1), 31-56.
216

Mueser, K., Yarnold, P., Rosenberg, S., Swett, C. J., Miles, K., & Hill, D. (2000). Substance use disorder in hospitalized severely mentally ill psychiatric patieprevalence, correlates, and subgroups. Schizophr
nts: enia Bulletin, 26(1), 179-192.
physiology and therapy of Gilles de la Tourette syndrome.
Muller nabis in movement
Munro receptor for cannabinoids. Nature, 365, 61-65.
, cannabinol affects behavioural and
l Brain
ty edicine,
Nelson
N., et oked nd in
Nuecht
zophrenia. Acta Psychiatrica Scandinavica, 105(3),
Nunn, .
Olson, trols in
Oranje , R. (2002). Effects
al of Clinical Psychopharmacology,
Oviedo, A., Glowa, J., & Herkenham, M. (1993). Chronic cannabinoid administration ic
Parwan t al. (2000). tle in schizophrenia. Biological
Patterslicit drug problems in Indigenous and non-Indigenous Western
Patton, L., Lynskey, M., & Hall, W. (2002).
98.
Muller-Vahl, K., Kolbe, H., Schneider, U., & Emrich, H. (1998). Cannabinoids: possible role in patho-Acta Psychiatrica Scandinavica, 98(6), 502-506.
-Vahl, K., Kolbe, H., Schneider, U., & Emrich, H. (1999). Candisorders. Forschende Komplementarmedizin Supplementum, 6(3), 23-27.
, S., Thomas, K., & Abu-Shaar, M. (1993). Molecular characterization of a peripheral
Navarro, M., Fernandez-Ruiz, J., de Miguel, R., Hernandez, M., Cebeira, M., & RamosJ. (1993). An acute dose of delta-9-tetrahydroneurochemical indices of mesolimbic dopaminergic activity. BehaviouraResearch, 57, 37-46.
Negrete, J., Knapp, W., Douglas, D., & Smith, W. (1986). Cannabis affects the severiof schizophrenic symptoms: results of a clinical survey. Psychological M16(3), 515-520. , H., & Willison, J. (1991). National Adult Reading Test (NART) Test Manual. (2nd ed.). Great Britain: The NFER-NELSON Publishing Company Ltd.
Ng Cheong Ton, J., Gerhardt, G., Friedemann, M., Etgen, A., Rose, G., Sharpless,al. (1988). The effects of delta-9-tetrahydrocannabinol on potassium-evrelease of dopamine in the caudate nucleus: an in vivo electrochemical avivo microdialysis study. Brain Research, 451, 59-68. erlein, K., & Dawson, M. (1984). Information processing and attentional functioning in the developmental course of schizophrenic disorders. Schizophrenia Bulletin, 10(2), 160-203.
Nunez, L., & Gurpegui, M. (2002). Cannabis-induced psychosis: a cross-sectionalcomparison with acute schi173-178.
J. A., Rizza, F., & Peters, E. (2001). The incidence of schizotypy among cannabisand alcohol users. Journal of Nervous & Mental Disease, 189(11), 741-748S., Bornstein, R., Schwarzkopf, S., & Nasrallah, H. (1993). Are conschizophrenia research "normal"? Annals of Clinical Psychiatry, 5(1), 1-5.
, B., Van Oel, C., Gispen-de Wied, C., Verbaten, M., & Kahnof typical and atypical antipsychotics on the prepulse inhibition of the startle reflex in patients with schizophrenia. Journ22(4), 359-365.
alters cannabinoid receptor binding in rat brain: a quantitative autoradiographstudy. Brain Research, 616, 293-302.
Pallant, J. (2001). SPSS survival manual. Victoria, Australia: Allen & Unwin. i, A., Duncan, E., Bartlett, E., Madonick, S., Efferen, T., Rajan, R., eImpaired prepulse inhibition of acoustic starPsychiatry, 47(7), 662-669.
on, K., Holman, D., English, D., Hulse, G., & et al. (1999). First-time hospital admissions with ilAustralians: an application of record linkage to public health surveillance.Australian and New Zealand Journal of Public Health, 23, 460-463. G., Coffey, C., Carlin, J., Degenhardt, Cannabis use and mental health in young people: cohort study. British Medical Journal, 325(7374), 1195-11
217
Payne, T., Smith, P., McCracken, L., McSherry, W., & Antony, M. (1994). Assessinnicotine dependence: a comparison of the Fagerstrom Tolerance Ques
g tionnaire
inical
Peng, R
alities in schizophrenia. Neuropsychopharmacology, 3(3), 211-218.
. Acta Psychiatrica Scandinavica, 85(2), 127-130.
chotic schizophrenia patients medicated and
. deficits
Pertweutics, 74(2), 129-180.
Peters, L., & Andrews, G. (1995). Procedural validity of the computerized version of
Peters, terized interviews equivalent to
Pickenhain, L., & Sakano, N. (1966). Influence of stimulus intensity and/or a preceding cortical
). erstrom Test
33-39.
l dence,
d
s as
Rabe-J tate of marijuana-smoking
Regier, abuse. Results
(ECA) Study. JAMA, 264(19), 2511-
(FTQ) with the Fagerstrom test for Nicotine Dependence (FTND) in a clsample. Addictive Behaviors, 19(3), 307-317. ., Mansbach, R., Braff, D., & Geyer, M. (1990). A D2 dopamine receptor agonistdisrupts sensorimotor gating in rats. Implications for dopaminergic abnorm
Peralta, V., & Cuesta, M. (1992). Influence of cannabis abuse on schizophrenic psychopathology
Perry, W., Feifel, D., Minassian, A., Bhattacharjie, I., & Braff, D. (2002). Informationprocessing deficits in acutely psyunmedicated at the time of admission. American Journal of Psychiatry, 159(8), 1375-1381
Perry, W., Minassian, A., Feifel, D., & Braff, D. L. (2001). Sensorimotor gatingin bipolar disorder patients with acute psychotic mania. Society of Biological Psychiatry, 50, 418-424. e, R. (1997). Pharmacology of cannabinoid CB1 and CB2 receptors. Pharmacology & Therape
Pertwee, R., & Ross, R. (2002). Cannabinoid receptors and their ligands. Prostaglandins Leukotrienes & Essential Fatty Acids, 66(2-3), 101-121.
the Composite International Diagnostic Interview (CIDI-Auto) in the anxiety disorders. Psychological Medicine, 25(6), 1269-1280. L., Clark, D., & Carroll, F. (1998). Are compuhuman interviewers? CIDI-Auto versus CIDI in anxiety and depressive disorders. Psychological Medicine, 28(4), 893-901.
signal on latency and amplitude of the startle reflex and the auditory evoked response (ACER) in man. Psychologia: an International Journal of Psychology in the Orient, 9(3), 134-136.
Pomerleau, C., Carton, S., Lutzke, M., Flessland, K., & Pomerleau, O. (1994Reliability of the Fagerstrom Tolerance Questionnaire and the Fagfor Nicotine Dependence. Addictive Behaviors, 19(1),
Pope, H., Gruber, A., Hudson, J., Huestis, M., & Yurgelun-Todd, D. (2001). Neuropsychological performance in long-term cannabis users. Archives of General Psychiatry, 58, 909-915.
Pope, H. J., Gruber, A., & Yurgelun-Todd, D. (1995). The residual neuropsychologicaeffects of cannabis: the current status of research. Drug & Alcohol Depen38(1), 25-34.
Poulton, R., Brooke, M., Moffitt, T., Stanton, W., & Silva, P. (1997). Prevalence ancorrelates of cannabis use and dependence in young New Zealanders. New Zealand Medical Journal, 110, 68-70.
Powell, S., & Geyer, M. (2002). Developmental markers of psychiatric disorderidentified by sensorimotor gating. Neurotoxicity Research, 4(5-6), 489-502. ablonska, J., & Gmitrowicz, A. (1989). Mental sadolescents [Polish]. Przeglad Lekarski, 46(12), 802-805. D., Farmer, M., Rae, D., Locke, B., Keith, S., Judd, L., et al. (1990). Comorbidity of mental disorders with alcohol and other drugfrom the Epidemiologic Catchment Area2518.
218

Reid-Milligan, K. (2002). Short- and long-term effects of neonatal corticosteroidtreatment on prepulse inhibition of the acoustic startle reflex in rats. Unpublished Honours The
sis, University of Western Australia, Perth.
hiatric Research, 2, 1-11.
rnal of
,
Rigdon tamine 1a receptor agonists
Robson abis and cannabinoids. British Journal of
Rosenm n acute
7-
aminergic transmission.
Sanudo alker, nnabinoids in the basal ganglia. 6th Internet
Rey, J., Morris-Yates, A., & Staanislaw, H. (1992). Measuring the accuracy of diagnostic tests using receiver operating characteristics (ROC) analysis. International Journal of Methods in Psyc
Rey, J., Sawyer, M., Raphael, B., Patton, G., & Lynskey, M. (2002). Mental health ofteenagers who use cannabis. Results of an Australian survey. British JouPsychiatry, 180, 216-221.
Ridgely, M., Goldman, H., & Willenbring, M. (1990). Barriers to the care of persons with dual diagnoses: organisational and financing issues. Schizophrenia Bulletin16, 123-132.
Rigdon, G., & Viik, K. (1991). Prepulse inhibition as screening test for potential antipsychotics. Drug Development Research, 23, 91-99. , G., & Weatherspoon, J. (1992). 5-Hydroxytrypblock prepulse inhibition of acoustic startle reflex. Journal of Pharmacology & Experimental Therapeutics, 263(2), 486-493. , P. (2001). Therapeutic aspects of cannPsychiatry, 178, 107-115. an, S., Korten, A., & Levings, C. (1997a). Computerised diagnosis i
psychiatry: validity of CIDI-Auto against routine clinical diagnosis. Journal of Psychiatric Research, 31(5), 581-592.
Rosenman, S., Levings, C., & Korten, A. (1997b). Clinical utility and patient acceptance of the computerized Composite International Diagnostic Interview. Psychiatric Services, 48(6), 815-820.
Rubio-Stipec, M., Peters, L., & Andrews, G. (1999). Test-retest reliability of the computerized CIDI (CIDI-Auto): Substance abuse modules. Substance Abuse, 20(4), 263-272.
Rydon, P., Redman, S., Sanson-Fisher, R., & Reid, A. (1992). Detection of alcohol-related problems in general practice. Journal of Studies on Alcohol, 53(3), 19202.
Sakurai-Yamashita, Y., Kataoka, Y., Fujiwara, M., Mine, K., & Ueki, S. (1989). Delta-9-tetrahydrocannabinol facilitates striatal dopPharmacology Biochemistry and Behaviour, 33, 397-400. -Pena, M., de Miguel, R., Romero, J., Fernandez-Ruiz, J., Ramos, J., & WM. (2000). Motor actions of caWorld Congress for Biomedical Sciences, http://www.uclm.es/inabis2000/symposia/files/2096/index.htm. , S. (1993). 'Cannabis-induced psychosis' may obscure paranoid schizophrenia. Saxena
Schicat es prepulse inhibition. Journal of Neuroscience, 20(11),
Schicat the human y, 22(2), 117-122.
n of the human acoustic startle reflex. Pharmacology, Biochemistry
Schnei
macology, 13(1), 29-37.
National Medical Journal of India, 6(2), 78-79. ano, E., Peshori, K., Gopalaswamy, R., Sahay, E., & Evinger, C. (2000). Reflexexcitability regulat4240-4247. ano, E. J., & Blumenthal, T. D. (1994). Caffeine delays habituation of acoustic startle reflex. Psychobiolog
Schicatano, E. J., & Blumenthal, T. D. (1995). The effects of different doses of caffeine on habituatio& Behavior, 52(1), 231-236.
der, M., & Koch, M. (2002). The cannabinoid agonist WIN 55,212-2 reduces sensorimotor gating and recognition memory in rats. Behavioural Phar
219

Schneider, M., & Koch, M. (2003). Chronic Pubertal, but not Adult Chronic Cannabinoid Treatment Impairs Sensorimotor Gating, Recognition Memory, and
Schnei , K., & Emrich, H. (1998).
Schnei tive substance use and abuse in
lity of startle response. Biological Psychiatry, 34,
Schwar ry Gating in Rats Depleted of ic
atry, 31(8), 759-773. a.
8.
an
, 529-532.
Sherma igelow, G. (1992). Validity of patients' self-reported drug use as a
Silver, st admission with those who began abusing
Silvers loway, J. M. (1980). Preconditioning and
Simons 8-16.
48.
Siris, S Mental
Skosni
mine
Solowi ver following cessation of cannabis use? Life Sciences, 56(23-24), 2119-2126.
the Performance in a Progressive Ratio Task in Adult Rats. Neuropsychopharmacology, 28(10), 1760-1769.
der, U., Leweke, F., Mueller-VahlCannabinoid/anandamide system and schizophrenia: is there evidence for association? Pharmacopsychiatry Supplementum, 31(2), 110-113.
er, F., & Siris, S. (1987). A review of psychoacschizophrenia. Patterns of drug choice. Journal of Nervous & Mental Disease, 175(11), 641-652.
Schwartz, R. (1988). Urine testing in the detection of drugs of abuse. Archives of Internal Medicine, 148, 2407-2412.
Schwarzkopf, S., McCoy, L., Smith, D., & Boutros, N. (1993). Test-retest reliabiprepulse inhibition of the acoustic 896-900. zkopf, S., Mitra, T., & Bruno, J. (1992). SensoDopamine as Neonates: Potential Relevance To Findings in SchizophrenPatients. Biological Psychi
Seeman, P. (1987). Dopamine receptors and the dopamine hypothesis of schizophreniSynapse, 1, 133-152.
Seeman, P. (2002). Atypical antipsychotics: mechanism of action. Canadian Journal ofPsychiatry - Revue Canadienne de Psychiatrie, 47(1), 27-3
Selzer, M., Vinokur, A., & van Rooijen, L. (1975). A self-administered Short MichigAlcoholism Screening Test (SMAST). Journal of Studies on Alcohol, 36(1), 117-126.
Sembhi, S., & Lee, J. (1999). Cannabis use in psychotic patients. Australian and New Zealand Journal of Psychiatry, 33
Shagass, C. (1976). An electrophysiological view of schizophrenia. Biological Psychiatry, 11, 3-30. n, M., & Bfunction of treatment status. Drug & Alcohol Dependence, 30(1), 1-11. H., & Abboud, E. (1994). Drug abuse in schizophrenia: comparison of patients who began drug abuse before their firdrugs after their first admission. Schizophrenia Research, 13(1), 57-63. tein, L. D., Graham, F. K., & Calexcitability of the human orbicularis oculi reflex as a function of state. Electroencephalography & Clinical Neurophysiology., 48(4), 406-417. , R., & Giardina, B. (1992). Reflex modification in psychosis-prone youngadults. Psychophysiology, 29,
Sipes, T., & Geyer, M. (1994). Multiple serotonin receptor subtypes modulate prepulseinhibition of the startle response in rats. Neuropharmacology, 33(3-4), 441-4. (1992). Substance abuse in schizophrenia. Journal of Nervous & Disease, 180(9), 595-596.
k, P., Spatz-Glenn, L., & Park, S. (2001). Cannabis use is associated with schizotypy and attentional disinhibition. Schizophrenia Research, 48(1), 83-92.
Smart, R., Adlaf, E., & Knoke, D. (1991). Use of the CAGE scale in a population survey of drinking. Journal of Studies on Alcohol, 52(6), 593-596.
Snyder, S. (1976). The dopamine hypothesis of schizophrenia: focus on the dopareceptor. American Journal of Psychiatry, 133(2), 197-202. j, N. (1995a). Do cognitive impairments reco
220

Solowij, N. (1998). Cannabis and cognitive functioning. UK: Cambridge University Press. j, N., Babor, T., Stephens, R., & RofSolowi fman, R. (2002b). Does marijuana cause
Solowi use on potential study. Pharmacology,
Solowi
Solowi dden, R., Miller, M., et al.
Spitzer, R. (1983). Psychiatric diagnosis: are clinicians still necessary? Comprehensive
SPSS-PStaddo ituation, memory and the brain: The
Stahl, SStanley-Cary, C., Harris, C., & Martin-Iverson, M. (2002). Differing effects of the
se
Steven ces. (3rd edition
Steven d. Schizophrenia Bulletin, 23(3),
Strube,chology, 74, 247-252.
tric
Swerdl a). inhibited than women by weak prepulses. Biological Psychiatry,
Swerdl A preliminary
Swerdl . (1999a). Cross-species studies of sensorimotor
Swerdlow, N., Braff, D., & Geyer, M. (2000b). Animal models of deficient we hope
04.
try, 21(1), 23-33.
nto the ology, 101(3), 414-420.
long-term cogntive deficits (letter)? JAMA, 287, 2652-2654. j, N., Michie, P., & Fox, A. (1991). Effects of long-term cannabis selective attention: an event-related Biochemistry & Behavior, 40(3), 683-688. j, N., Michie, P., & Fox, A. (1995b). Differential impairments of selective attention due to frequency and duration of cannabis use. Biological Psychiatry, 37(10), 731-739. j, N., Stephens, R., Roffman, R., Babor, T., Ka(2002a). Cognitive functioning of long-term heavy cannabis users seeking treatment. JAMA, 287(9), 1123-1131.
Psychiatry, 24(5), 399-411. C Version 11.0. (2001). Online User's Manual.
n, J., Chelaru, I., & Higa, J. (2002). Habdynamics of interval timing. Behavioural Processes, 57(2-3), 71-88. . (1999). Psychopharmacology of antipsychotics. USA: Martin Dunitz.
cannabinoid agonist, CP 55,940, in an alcohol or Tween 80 solvent, on prepulinhibition of the acoustic startle reflex in the rat. Behavioural Pharmacology, 13, 15-28.
Stevens, J. (1973). An anatomy of schizophrenia? Archives of General Psychiatry, 29(2), 177-189.
s, J. (1996). Applied multivariate statistics for the social sciened.). New York: HarperCollins.
s, J. (1997). Anatomy of schizophrenia revisite373-383. M., & Bobko, P. (1989). Testing hypotheses about ordinal interactions: simulations and further comments. Journal of Applied Psy
Swartz, M., Swanson, J., & Hannon, M. (2003). Detection of illicit substance use among persons with schizophrenia by radioimmunoassay of hair. PsychiaServices, 54(6), 891-895. ow, N., Auerbach, P., Monroe, S., Hartston, H., Geyer, M., & Braff, D. (1993Men are more 34(4), 253-260. ow, N., Benbow, C., Zisook, S., Geyer, M., & Braff, D. (1993b).assessment of sensorimotor gating in patients with obsessive compulsive disorder. Biological Psychiatry, 33, 298-301. ow, N., Braff, D., & Geyer, Mgating of the startle reflex. Annals of the New York Academy of Sciences, 877, 202-216.
sensorimotor gating: what we know, what we think we know, and what to know soon. Behavioural Pharmacology, 11(3-4), 185-2
Swerdlow, N., Braff, D., Geyer, M., & Koob, G. (1986). Central dopamine hyperactivity in rats mimics abnormal acoustic startle response in schizophrenics. Biological Psychia
Swerdlow, N., Braff, D., Masten, V., & Geyer, M. (1990a). Schizophrenic-like sensorimotor gating abnormalities in rats following dopamine infusion inucleus accumbens. Psychopharmac
221

Swerdlow, N., Braff, D., Taaid, N., & Geyer, M. (1994). Assessing the validity of ananimal model of deficient sensorimotor gating in schizophrenic patients. Archives of General Psychiatry, 51(2), 139-154. ow, N., Caine, S., Braff, D., & Geyer, M. (1992
Swerdl b). The neural substrates of ir
Swerdldopamine infusion on sensorimotor gating of the startle reflex in
Swerdl l. motor gating of the startle reflex in normal
8.
g in normal
Swerdl, and visuospatial gating. Biological
Swerdl nsorimotor d new treatments of schizophrenia.
Swerdlrent knowledge and future challenges.
Swerdlthe human startle reflex: all
Swerdlof sensorimotor gating in rats by hippocampal NMDA: anatomical
Swerdl
Swerdl piperone,
gy , 256(2), 530-536.
990b). tartle is reversed by
depletion of mesolimbic dopamine. Psychopharmacology, 100(3), 413-416. rs, N., Geyer, M., & Swenson, M. (1995b).
Impaired prepulse inhibition of acoustic and tactile startle response in patients with Huntington's disease. Journal of Neurology, Neurosurgery, and Psychiatry.
Swerdlow, N. R., Shoemaker, J. M., Stephany, N., Wasserman, L., Ro, H. J., & Geyer, M. A. (2002b). Prestimulus effects on startle magnitude: sensory or motor? Behavioral Neuroscience., 116(4), 672-681.
wift, W., Copeland, J., & Hall, W. (1998b). Choosing a diagnostic cut-off for cannabis dependence. Addiction, 93(11), 1681-1692.
Swift, W., Hall, W., Didcott, P., & Reilly, D. (1998a). Patterns and correlates of cannabis dependence among long-term users in an Australian rural area. Addiction, 93(8), 1149-1160.
sensorimotor gating of the startle reflex: a review of recent findings and theimplications. Journal of Psychopharmacology, 6(2), 176-190. ow, N., Caine, S., & Geyer, M. (1992a). Regionally selective effects of intracerebral rats. Psychopharmacology, 108(1-2), 189-195. ow, N., Eastvold, A., Gerbranda, T., Uyan, K., Hartman, P., Doan, Q., et a(2000a). Effects of caffeine on sensoricontrol subjects: impact of caffeine intake and withdrawal. Psychopharmacology, 151(4), 368-37
Swerdlow, N., Eastvold, A., Karban, B., Ploum, Y., Stephany, N., Geyer, M., et al. (2002a). Dopamine agonist effects on startle and sensorimotor gatinmale subjects: time course studies. Psychopharmacology, 161(2), 189-201. ow, N., Filion, D., Geyer, M., & Braff, D. (1995a). 'Normal' personality correlates of sensorimotor, cognitivePsychiatry, 37, 286-299. ow, N., & Geyer, M. (1998). Using an animal model of deficient segating to study the pathophysiology anSchizophrenia Bulletin, 24(2), 285-301. ow, N., Geyer, M., & Braff, D. (2001b). Neural circuit regulation of prepulse inhibition of startle in the rat: curPsychopharmacology, 156, 194-215. ow, N., Geyer, M., Hartman, P., Sprock, J., Auerbach, P., Cadenhead, K., et al. (1999b). Sex differences in sensorimotor gating of smoke? Psychopharmacology, 146(2), 228-232. ow, N., Hanlon, F., Henning, L., Kim, Y., Gaudet, I., & Halim, N. (2001a). Regulation localization. Brain Research, 898(2), 195-203. ow, N., Hartman, P., & Auerbach, P. (1997). Changes in sensorimotor inhibition across the menstrual cycle: implications for neuropsychiatric disorders. Biological Psychiatry, 41(4), 452-460. ow, N., Keith, V., Braff, D., & Geyer, M. (1991). Effects of sraclopride, SCH 23390 and clozapine on apomorphine inhibition of sensorimotor gating of the startle response in the rat. Journal of Pharmacolo& Experimental Therapeutics
Swerdlow, N., Mansbach, R., Geyer, M., Pulvirenti, L., Koob, G., & Braff, D. (1Amphetamine disruption of prepulse inhibition of acoustic s
Swerdlow, N., Paulsen, J., Braff, D., Butte
S
222

Swift, W., Hall, W., & Teesson, M. (2001). Characteristics of DSM-IV and ICD-10 cannabis dependence among Australian adults: results from the National Survey of Mental Health and Wellbeing. Drug and Alcohol Dependence, 63, 147-153.
wofford, C., Kasckow, J., Scheller-Gilkey, G., & Inderbitzin, L. (1996). Substance use: a powerful predictor of relapse in schizophrenia. Schizophrenia Research, 20(1-2), 145-151.
ffects of cannabinoids on dopamine release in the corpus striatum and the nucleus accumbens in vitro. Journal of Neurochemistry, 73(3), 1084-1089.
Tabachnick, B., & Fidell, L. (2001). Using multivariate statistics. (4th ed.). USA: Allyn and Bacon.
inen, T., Jaaskelainen, S., Ilonen, T., Meyer, H., Karlsson, H., Lauerma, H., et al. (2000). Habituation of the blink reflex in first-episode schizophrenia, psychotic depression and non-psychotic depression. Schizophrenia Research., 44(1), 69-79.
albott, J., & Teague, J. (1969). Marihuana psychosis. Acute toxic psychosis associated with the use of Cannabis derivatives. JAMA, 210(2), 299-302.
anda, G., Loddo, P., & Di Chiara, G. (1999). Dependence of mesolimbic dopamine transmission on delta-9-tetrahydrocannabinol. European Journal of Pharmacology, 376(1-2), 23-26.
anda, G., Pontieri, F., & Di Chiara, G. (1997). Cannabinoid and heroin activation of mesolimbic dopamine transmission by a common mu1 opioid receptor mechanism. Science, 276(5321), 2048-2050.
aschner, K. (1983). Psychopathology and differential diagnosis of so-called Cannabis psychoses [German]. Fortschritte der Neurologie-Psychiatrie, 51(7), 235-248.
eesson, M., Lynskey, M., Manor, B., & Baillie, A. (2002). The structure of cannabis dependence in the community. Drug & Alcohol Dependence, 68(3), 255-262.
ennant, F., & Groesbeck, C. (1972). Psychiatric effects of hashish. Archives of General Psychiatry, 27, 133-136.
. (1976). Cannabis and psychosis and paranoid schizophrenia. Archives of General Psychiatry, 33, 383-386.
as, H. (1993). Psychiatric symptoms in cannabis users. British Journal of Psychiatry, 163, 141-149.
as, H. (1996). A community survey of adverse effects of cannabis use. Drug & Alcohol Dependence., 42(3), 201-207.
bis and psychosis. Is there epidemiological evidence for an association? British Journal of Psychiatry, 157, 25-33.
iological analysis of alcohol and drug use as risk factors for psychotic experiences. Journal of Nervous & Mental Disease, 178(8), 473-480.
Treffert, D. (1978). Marijuana use in schizophrenia: a clear hazard. American Journal of Psychiatry, 135(10), 1213-1215.
Tsai, S., Wang, Y., & Hong, C. (2000). Association study of a cannabinoid receptor gene 10(3), 149-151.
Tsuang, M., Simpson, J., & Kronfol, Z. (1982). Subtypes of drug abuse with psychosis. ives of
Tunving, K. (1987). Psychiatric aspects of cannabis use in adolescents and young
Uestuen, B., Compton, W., Mager, D., Babor, T., Baiyewu, O., Chatterji, S., et al. (1997). WHO study on the reliability and validity of the alcohol and drug use
S
Szabo, B., Muller, T., & Koch, H. (1999). E
Taim
T
T
T
T
T
T
Thacore, V., & Shukla, S
Thom
Thom
Thornicroft, G. (1990). Canna
Tien, A., & Anthony, J. (1990). Epidem
(CNR1) polymorphism and schizophrenia. Psychiatric Genetics,
Demographic characteristics, clinical features, and family history. ArchGeneral Psychiatry, 39(2), 141-147.
adults. Pediatrician, 14, 83-91.
223

disorder instruments: overview of methods and results. Drug and Alcohol Dependence, 47(3), 161-169.
Ujike, H., Takaki, M., Nakata, K., Tanaka, Y., Takeda, T., Kodama, M., et al. (2002). , central h susc
, 7(5), 515-518. van Boxtel, A., B of electric,
interelectrode distance ( , S12-13. van den Buuse, M., & Eik epulse inhibition of
acoustic startle in r gy, 425, 33-41. an Os, J., Bak, M., Hanssen, M., Bijl, R., De Graaf, R., & Verdoux, H. (2002).
Epidemiology, 156(4), 319-327. arty, G., & Higgins, G. (1995). Examination of drug-induced and isolation-induced
asey, M., & Thayer, J. (1987). The continuing problem of false positives in repeated
Psychophysiology, 24(4), 479-486.
F., Tournier, M., & Swendsen, J. (2003). Effects of cannabis and psychosis vulnerability in daily life: an experience sampling test
Bourgeois, M. (1998). A survey of delusional ideation in primary care patients. Psychological
erdoux, H., Sorbara, F., Gindre, C., Swendsen, J., & Van Os, J. (2002). Cannabis use
ttar, A., & Awad, A. (2001). Cannabis induced iatry Research, 107(3), 173-
aage, H., Silsand, T., Urdal, P., & Langard, S. (1992). Discrimination of smoking expired air.
ly ill: prevalence, reasons for use, and effects on illness. American Journal of Orthopsychiatry, 64(1), 30-39.
aterson, E., & Murray-Lyon, I. (1988). Are the CAGE questions outdated (letter)? British Journal of Addiction, 83, 1113-1115.
hospital. Journal of Clinical Psychology, 51(5), 676-684. ecker, J., & Ison, J. (1984). Acute exposure to methyl or ethyl alcohol alters auditory
function in the rat. Toxicology and Applied Pharmacology, 74, 258-266. eike, A., Bauer, U., & Hamm, A. (2000). Effective neuroleptic medication removes
prepulse inhibition deficits in schizophrenia patients. Biological Psychiatry, 47(1), 61-70.
einberger, D. (1987). Implications of normal brain development for the pathogenesis of schizophrenia. Archives of General Psychiatry, 44, 660-669.
CNR1 cannabinoid receptor gene, associated wit eptibility to hebephrenic schizophrenia. Molecular Psychiatry
oelhouwer, A., & Bos, A. (1996). Optimal recording acoustic, and visual blink reflexes: Effects of EMG signal bandwidth and
abstract). Psychophysiology, Supplementum 1elis, N. (2001). Estrogen increases prats. European Journal of Pharmacolo
vCannabis use and psychosis: A longitudinal population-based study. American Journal of
Vdisruptions of prepulse inhibition as models to screen antipsychotic drugs. Psychopharmacology, 122, 15-26.
Vmeasures ANOVA in psychophysiology: a multivariate solution.
Venables, P. (1964). Input dysfunction in schizophrenia. In B. Maher (Ed.), Progress in Experimental Personality Research (pp. 1-47). New York: Academic Press.
Verdoux, H., Gindre, C., Sorbara,
study. Psychological Medicine, 33(1), 23-32. Verdoux, H., Maurice-Tison, S., Gay, B., van Os, J., Salamon, R., &
Medicine, 28, 127-134. V
and dimensions of psychosis in a nonclinical population of female subjects. Schizophrenia Research, 59(1), 77-84.
Voruganti, L., Slomka, P., Zabel, P., Madopamine release: an in-vivo SPECT study. Psych177.
Wstatus by thiocyanate and cotinine in serum, and carbon monoxide inInternational Journal of Epidemiology, 21, 488-493.
Warner, R., Taylor, D., Wright, J., Sloat, A., Springett, G., Arnold, S., et al. (1994). Substance use among the mental
W
Watson, C., Detra, E., Fox, K., Ewing, J., Gearhart, L., & DeMotts, J. (1995). Comparative concurrent validities of five alcoholism measures in a psychiatric
W
W
W
224

Wert, R., & Raulin, M. (1986). The chronic cerebral effects of cannabis use. II. Psychological findings and conclusions. The International Journal of the Addictions, 21(6), 629-642.
iley, J. (1994). Clozapine's effects on phencyclidine-induced disruption of prepulse inhibition of the acoustic startle response. Pharmacology, Biochemistry & Behavior, 49(4), 1025-1028.
illiams, J., Wellman, N., & Rawlins, J. (1996). Cannabis use correlates with schizotypy in healthy people. Addiction, 91(6), 869-877.
ing, J. K., Babor, T., Brugha, T., Burke, J., Cooper, J. E., Giel, R., et al. (1990). SCAN: Schedules for Clinical Assessment in Neuropsychiatry. Archives of General Psychiatry, 47, 589-593.
ittchen, H.-U. (1994). Reliability and validity studies of the WHO--Composite International Diagnostic Interview (CIDI): a critical review. Journal of Psychiatric Research, 28(1), 57-84.
ittchen, H.-U., Burke, J., Semler, G., Pfister, H., von Cranach, M., & Zaudig, M. (1989). Recall and dating of psychiatric symptoms. Test-retest reliability of time-related symptom questions in a standardised psychiatric interview. Archives of General Psychiatry, 46, 437-443.
olthaus, J., Linszen, D., Dingermans, P., & Schene, A. (2000). The relationship between personality traits, symptoms and cannabis abuse in recent-onset schizophrenia (abstract). Acta Psychiatrica Scandinavica, Supplementum 102(404), 5.
orld Health Organization. (1992). The ICD-10 Classification of Mental and Behavioural Disorders. Clinical descriptions and diagnostic guidelines. Geneva: World Health Organization.
orld Health Organization. (1997a). Composite International Diagnostic Interview (CIDI), version 2.1. Geneva: WHO.
orld Health Organization. (1997b). CIDI-Auto Version 2.1: administrator's guide and reference. Sydney: Training and Reference Centre for WHO CIDI.
u, A., Forte, E., Casella, G., Sun, K., Hemphill, G., Foery, R., et al. (1995). CEDIA for screening drugs of abuse in urine and the effect of adulterants. Journal of Forensic Sciences, 40(4), 614-618.
u, X., & French, E. (2000). Effects of chronic delta-9-tetrahydrocannabinol on rat midbrain dopamine neurons: an electrophysiological assessment. Neuropharmacology, 39(3), 391-398.
ynn, J., Dawson, M., & Schell, A. (2000). Discrete and continuous prepulses have differential effects on startle prepulse inhibition and skin conductance orienting.
oy, J., Wilson, W., Levin, E., & Rose, J. (2003). Reliabilities and intercorrelations of reported and objective measures of smoking in patients with schizophrenia. Schizophrenia Research, 60, 9-12.
Yao, J., van Kammen, D., & Gurklis, J. (1996). Abnormal incorporation of arachidonic s with schizophrenia. Psychiatry Research,
60, 11-21. ammit, S., Allebeck, P., Andreasson, S., Lundberg, I., & Lewis, G. (2002). Self
tor for schizophrenia in Swedish conscripts of ), 1199-1201.
rnazzari, X. (1993). Current cannabis use ia Research, 11(1), 3-8.
s ck, J., Jernigan, T., & Braff, D. (1992). Past rse of schizophrenia. American Journal of
W
W
W
W
W
W
W
W
W
W
W
W
Psychophysiology, 37, 224-230. Yang, Y., McEv
acid into platelets of drug-free patient
Zreported cannabis use as a risk fac1969: Historical cohort study. British Medical Journal, 325(7374
Zaretsky, A., Rector, N., Seeman, M., & Fonand tardive dyskinesia. Schizophre
oranville, J., KuZi ook, S., Heaton, R., Msubstance abuse and clinical couPsychiatry, 149(4), 552-553.
225

Zung, B. (1984). Reliability and validity of the Short MAST among psychiatricinpatients. Jo
urnal of Clinical Psychology, 40(1), 347-350.
226

APPENDIX
Appendix A. Pa nt and Consent rticipant Recruitme
A.1 Advertisements at the Red Cross Blood Donation Clinics in Perth
C E N T R E F O R C L I N I C A L R E S E A R C H I N N E U R O P S Y C H I A T R Y
UNIVERSITY OF WORLD HEALTH ORGANISATION COLLABORATING CENTRE FOR GW STERN AUSTRALIA RESEARCH & TRAINING IN MENTAL HEALTH E
RAYLANDS HOSPITAL
ne: (08) 9347-6429 Fax: (08) 9384-5128
The Centre is seek
ance on memory or attention tasks. Some projects
lease call between 9am and 5pm Monday to Friday on 800 648 223 (Freecall within WA) and leave your contact details.
researcher will call you back within a week for further information and appointments.
The Australian Red Cross Blood Service is not directly involved in any of the CCRN
John XXIII Avenue Mt Claremont Western Australia 6010
l: Private Mail Bag No. 1 Claremont WA 6010 TelephoMai
RESEARCH VOLUNTEERS MAY TO DECEMBER, 2001
ing men aged between 18 and 55 years to participate in some of its research projects.
The projects measure your performalso measure your brain electrical activity or create a 3D computer image of your brain. There are no invasive procedures and there are no medications involved. We will pay you a nominal hourly rate to cover your costs for attending at the Centre. We make appointments to suit your hours. Participation involves attendance at the Centre for a 3-hour appointment. P1 A •
research projects. • Participation is entirely voluntary. • Not all applicants may be suitabl e for participation.
[Note- most controls in the current study were recruited using this generic adve cal Research in Neuropsychiatry in Perth]
rtisement produced by Patrick O’Connor for all studies at the Centre for Clini
227

A.2 Advertis paper)
[Note- most cannabis users in the current study were recruited using this ad
ement in the Local Press (“West Australian” News
vertisement]
228
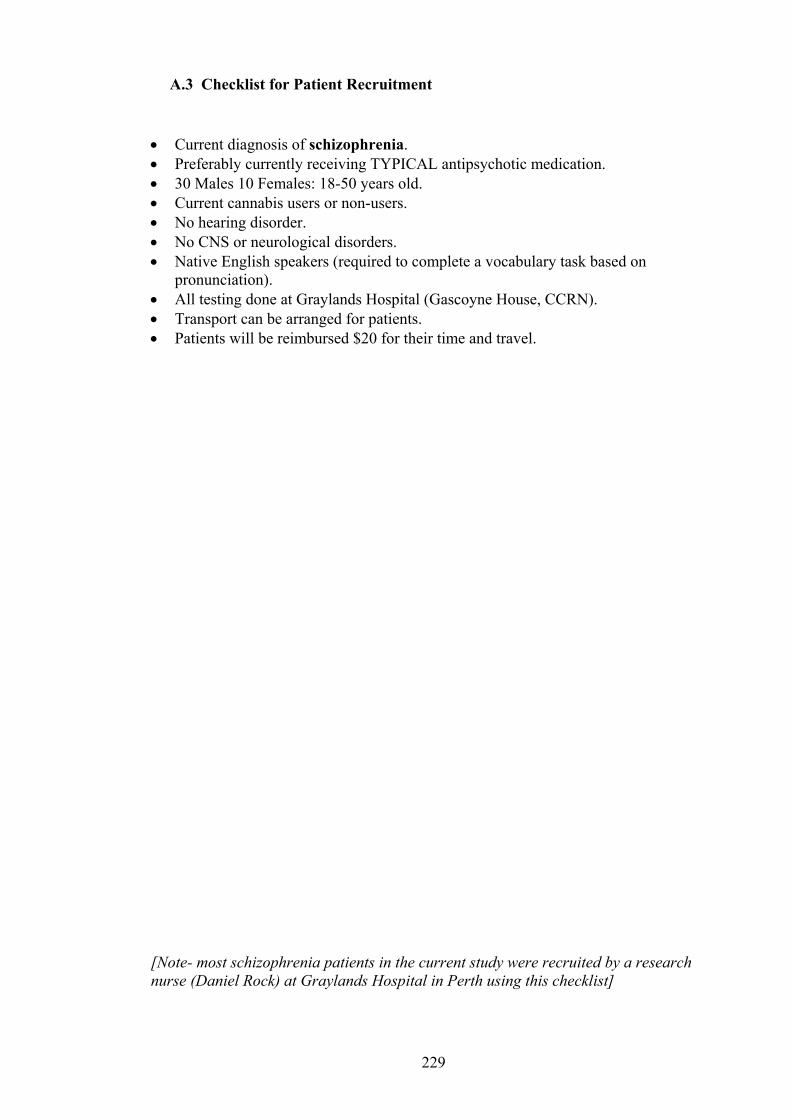
A.3 Checklist for Patient Recruitment
• nosis of schizophre• g TY dication.
• or non-us . • • • sk based on
• lands Ho tal (Gascoyne House, CCRN). • • l be reimbursed $20 for their time and travel.
[Note- most schizophrenia patients in the current study were recruited by a research nurse (Daniel c s H pital in Perth using this checklist]
Current diag nia. Preferably currently receivin PICAL antipsychotic me
• 30 Males 10 Females: 18-50 years old. Current cannabis users ersNo hearing disorder. No CNS or neurological disorders. Native English speakers (required to complete a vocabulary tapronunciation). All testing done at Gray spiTransport can be arranged for patients. Patients wil
Ro k) at Grayland os
229

A.4 Partic n
C H I N N E U R O P S Y C H I A T R Y
ipa t Information Sheet
C E N T R E F O R C L I N I C A L R E S E A R
UNIVERSITY OF ST
TH OR SATION COLLABORATING CENTRE FOR A ANDS HOSPITAL
III Avenue Mt Claremont Western Australia 6010 Mai 6010 Telephone: (08) 9347-6429 Fax: (08) 9384-5128
EN
WE ERN AUSTRALIA EARCH IN MENTAL HEALTH
John XX
l: Private Mai a
WORLD HEAL GANIRES & TRAINING
GR YL
l B g No. 1 Claremont WA
EFF ON EYE BLINKS IN SCHIZOPHRECT OF CANNABIS USE IA INFORMATION SHEET
Researcher: K Phone: 9347 6418 or 9
upervisor: o rson Phone: 9347 6443
any people would like to know if cannabis use causes schizophrenia. Before we can answer this question we need to understand h s can show us how our brain
orks and, therefore, tell us how cannabis affects brain function.
Ms arina Kedzior 347 6429 Ass c. Prof. M. T. Martin-IveS
M
ow cannabis affects our brain. Eye blinkw WHAT IS INVOL ED V IN THIS STUDY?
OUR): PART O•
NE (1 H Interview with the researcher about your general and mental health and substance use.
S n ine, alcohol and cannabis. • Handedness q s efer to use your right or the left hand. • Reading task. B he
researchers in stud
ART TWO (1 HOUR): 2 eye blink tasks. We will attach two small metal sensors to the skin under your left eye and one
sensor to your left hand. During both tasks you will listen to sounds played through headphones. Some of these sounds might make you blink. During one of the tasks we will also ask you to play a handheld computer game (Tetris). We will show you how to play this game before the experiment begins.
Urine sample to assess the level of substances such as nicotine, alcohol and cannabis, which might influence the way you blink.
ONFIDENTIALITY
• ubstance use questionnaire about your use of icotue tionnaire to see if you pr
oth the interview and the reading task will be audio videotaped, so that tvolved in this y can check their records.
P•
•
C
ll information you provide (including the urine sample) will be coded, such that your name is not sociated with the information and treated as strictly confidential. he results will not be given to any person other than the researchers involved in this study, unless
AasTrequired by law.
Please note that there are no risks involved in this study and that you are free to withdraw at any time. tement was omitted from
e any further questions about this study.
Your treatment will not be affected in any way if you wish to withdraw. (This stath Information Sheet for control participants). We will be happy to answer
230

.5 Participant Consent Form A
C E N T R E F O R C L I N I C A L R E S E A R C H I N N E U R O P S Y C H I A T R Y
UNIVERSITY OF TERN AUSTRALIA
WORLD HEALTH ORGANISATION COLLABORATING CENTRE FOR RESEARCH & TRAINING IN MENTAL HEALTH
GRAYLANDS HOSPITAL WES
EFFECT OF CANNABIS USE ON EYE BLINKS IN SCHIZOPHRENIA CONSENT FORM
John XXIII Avenue Mt Claremont Western Australia 6010 Mail: Private Mail Bag No. 1 Claremont WA 6010 Telephone: (08) 9347-6429 Fax: (08) 9384-5128
esearcher: Ms Karina Kedzior Phone: 9347 6418 or 9347 6429 upervisor: Assoc. Prof. M. T. Martin-Iverson Phone: 9347 6443
hank you for agreeing to take part in our study on the effect of cannabis on eye blinks in schizophrenia.
RS T I, have read the information sheet on the study and the questions that I have asked
ave been answered to my satisfaction.
I agree to participate in this research. I am over 18 years of age. I agree that the researcher may audio-videotape an interview and a reading task. I agree that the data gathered for this study may be published providing my name or other identifying
information is not used. I may withdraw at any time without it affecting my treatment. I understand that all information obtained in this study will be strictly confidential and will not be
released by the investigator, unless required by law. I agree that the data gathered for this study will be securely stored at Graylands Hospital for 7 years
following the completion of this study, and then destroyed. I consent to allowing the researcher access to my case notes, providing this information is
confidential and will be used for research purposes only. [This statement was omitted from the Consent Form for control participants].
ignature of Participant:
h ••••
••
•
•
S Date:
ignature of Researcher: S Date:
he Human Research Ethics Committee at the University of Western Australia requires that all articipants are informed that, if they have any complaint regarding the manner, in which a research roject is conducted, it may be given to the researcher or, alternatively to the Secretary, Human Research thics Committee, Registrar’s Office, University of Western Australia, Nedlands, WA 6907 (telephone
number 9380-3703). All study participants will be provided with a copy of the Information Sheet and s.
TppE
Consent Form for their personal record
231

Appendix B. Substance Use Questionnaires
B.1 Severity of (Cannabis) Dependence Scale, SDS
. Did you think your use of cannabis was out of control? • Never/almost never [] • Sometimes [] • Often [] • Always/nearly always []
. Did the prospect of missing a dose of cannabis make you anxious or worried? • Never/almost never [] • Sometimes [] • Often [] • Always/nearly always []
. Did you worry about your use of cannabis? • Never/almost never [] • Sometimes [] • Often [] • Always/nearly always []
. Did you wish you could stop? • Never/almost never [] • Sometimes [] • Often [] • Always/nearly always []
. How difficult did you find it to stop, or go without cannabis? • Not difficult [] • Quite difficult [] • Very difficult [] • Impossible []
(ADDITIONAL QUESTION)
. How often were you using cannabis in the past 12 months? • Not used [] • Daily/almost daily [] • 1-2 days/week []
• < monthly [] • not known []
1
2
3
4
5
6
• 2-4 times/month []
232
.2 Fagerstrom Test for Nicotine Dependence, FTND B
. How soon after you wake up do you smoke your first cigarette? • Within 5 min [] • 6-30 min [] • 31-60 min [] • After 60 min []
. Do you find it difficult to refrain from smoking in places where it is forbidden, e.g., in church, at the library, in cinema, etc.?
• Yes [] • No []
. Which cigarette would you hate most to give up: • The first in the morning [] • Any other []
. How many cigarettes/day do you smoke? • 10 or less [] • 11-20 [] • 21-30 [] • 31 or more []
. Do you smoke more frequently during the first hours after awakening than during the rest of the day?
• Yes [] • No []
. Do you smoke if you are so ill that you are in bed most of the day? • Yes [] • No []
(ADDITIONAL QUESTIONS)
. When did you start smoking cigarettes (age)? • …………...years old (total years of smoking:…………..……)
. Have you ever tried to quit smoking ? • No [] • Yes [] How many times? ……………
………
1
2
3
4
5
6
7
9
How long did it last for? …………
233

B.3 Short M es
feel y rma u drink less t as mos YES ur p la mpl out
ing YES NO 3. Do you ever feel guilty about your drinking? YES NO
or dr NO re you able when you want to? YES NO
eve olics S ing y , a p or
other near rel YES NO rk because of drinkin YES
v ns, you ork fo r YES NO
e rin v driving, driving while intoxicated, or
under c beverage u ev w s, because of other en
behaviour? YES NO
ichigan Alcoholism Screening T t, SMAST
1. Do youmuch as
ou are a normal drinker (by not other people)?
l we mean yo han or NO
2. Does yoyour drink
artner, a parent, or other near re?
tive ever worry or co ain ab
4. Do friends 5. A
relatives think you are a normal to stop drinking
inker? YES
6. Have you 7. Has drink
r attended a meeting of Alcoh ever created problems betweenative?
Anonymous? YEou and your partners
NO arent,
8. Have you ever gotten in9. Have you e
more days in a row because you were drinking?
to trouble at woer neglected your obligatio
g? r family, or your w
NO r two o
10. Have you ever gone to anyone for he11. Have you ev12. Have you e
lp about your drinking? r been in a hospital because of der been arrested for drunken
YES king? YES
NO NO
driving13. Have yo
the influence of alcoholier been arrested, even for a fe
s? YES hour
NO drunk
234

B.4 CAGE Questionnaire
C (Cutting down): Have you ever felt you should cut down on your drinking?
d you by criticising your drinking?
(Guilt): Have you ever felt guilty about your drinking?
(Eye-opener): Have you ever needed a drink in the morning to get yourself going?
A (Annoyance): Have people ever annoye
G
E
235

B.5 Opiate Treatment Index, OTI, Modified to Cannabis Use
1. On what day did you last use cannabis (date)?
2. How many joints did you have on that day?
3. On which day before that did you use cannabis?
4. How many joints did you have on that day?
5. And when was the day before that that you used cannabis?
6. How do you use cannabis (joint, bong, pipe, others?)
236

Appendix C. Equipment Details
C.1 Startle Reflex Equipment
Name Description Manufacturer
Model
LabView4.1 Software
Control of sound presentation and EMG data acquisition and processing
National Instruments Inc., Austin, TX, USAa
TB
etris©-like lock Game
Handheld computer game Westminster Inc., Atlanta, GA, USAb
und Level eter
Calibration of startle and prepulse stimuli
Bruel & Kjaer Ltd., Terrey Hills, NSW, Australiac
2237A
hite Noise enerator
Generation of background white noise and startle stimuli
Electrical Workshop, Dept of Psychology, UWA, Perth, WA, Australia
tereo plifier
Amplification of background white noise, startle and prepulse stimuli
AIWA, Japan AA-15XG
Headphones tereo, HI-FI)
Delivered the background white noise, prepulse and startle stimuli
Sennheiser, Ireland, UKd HD25
kin Preparation ads
Pads soaked in 70% alcohol to abrase and clean the skin
Promedica, Pymble, NSW, Australiae
up Electrodes Tin cup; 6-mm outside and 2-mm inside diameters with a single pin and 122-cm lead wire
Electro-Cap International Inc., Eaton, OH, USAe
E21-6
onductive EEG aste (Ten20)
EEG paste used to fill the cup electrodes to improve the signal detection
D.O. Weaver and Co., Aurora, CO, USAe
10-20-8
dhesive ars
Double-sided adhesive discs, 19-mm outside and 4-mm inside diameters
DM Davis Inc., New York, NY, USAe
E401
Disposable dhesive Pad
Solid conductive membrane (Silver/Silver Chloride) adhesive to the skin
ConMed Corp., Utica, NY, USAf
Fastrace4; 1915
round Electrode Lead
Alligator clip with 60-cm lead wire and 2-mm pin
The Electrode Store, Enumclaw, WA, USAe
ETL
plifier Low-pass filters: 0.01, 0.1, 0.3, 1, 3, 10, 30, 100, 300 Hz High-pass filters: 0.03, 0.1, 0.3, 1, 3, 10 kHz
Astro-Med, Inc. Grass Instrument Division, West Warwick, RH, USAg
CP511
-terminal AC Preamplifier
able
G1, G2 inputs and common; size: 4.4 cm x 3.2 cm x 0.5 cm
Astro-Med, Inc. Grass Instrument Division, West Warwick, RH, USAg
F-P5IC3/REV1
MG Acquisition C card
DAQ board for acquisition of the EMG signal
National Instruments Inc., San Diego, CA, USAg
AT-MI0/AIE Series
SoM
WG
SPream
(s
SP
C
CP
AElectrode Coll
A
G
AC Pream
3
C
EP
Note. The equipment details are listed in the order of appearance in text (Chapter 4). The subscripts indicate location of outlets where the equipment was purchased: adirectly from the manufacturer; bTarget Ltd., Perth, WA, Australia; cBruel & Kjaer Ltd. Perth, WA, Australia; dCapricorn Marketing, Perth, WA, Australia; eSurgicon Systems, Adelaide, SA, Australia; fCentral Neurophysiology Supplies, Jewells, NSW, Australia; gNational Instruments Ltd., Melbourne, VIC, Australia.
237

C.2 Sample LabView 4.1 Program
As stated in Chapter 4 the computer programs used to acquire and process the EMG
ata were written by A/Prof Mathew Martin-Iverson, Dr David Neumann, and
ubstantially modified by the author of this thesis. The following is a print out of a
rogram almost entirely rewritten by the author, used for EMG data processing. The
rint-out begins with a summary of all programs (represented by boxes) contained
ithin the processing program (Hierarchy Window page). The following page contains
e front panel of the program, on which the EMG data for each trial was displayed.
he subsequent five pages contain the code used to write the program.
d
s
p
p
w
th
T
238

239

240

241

242

243

244

245
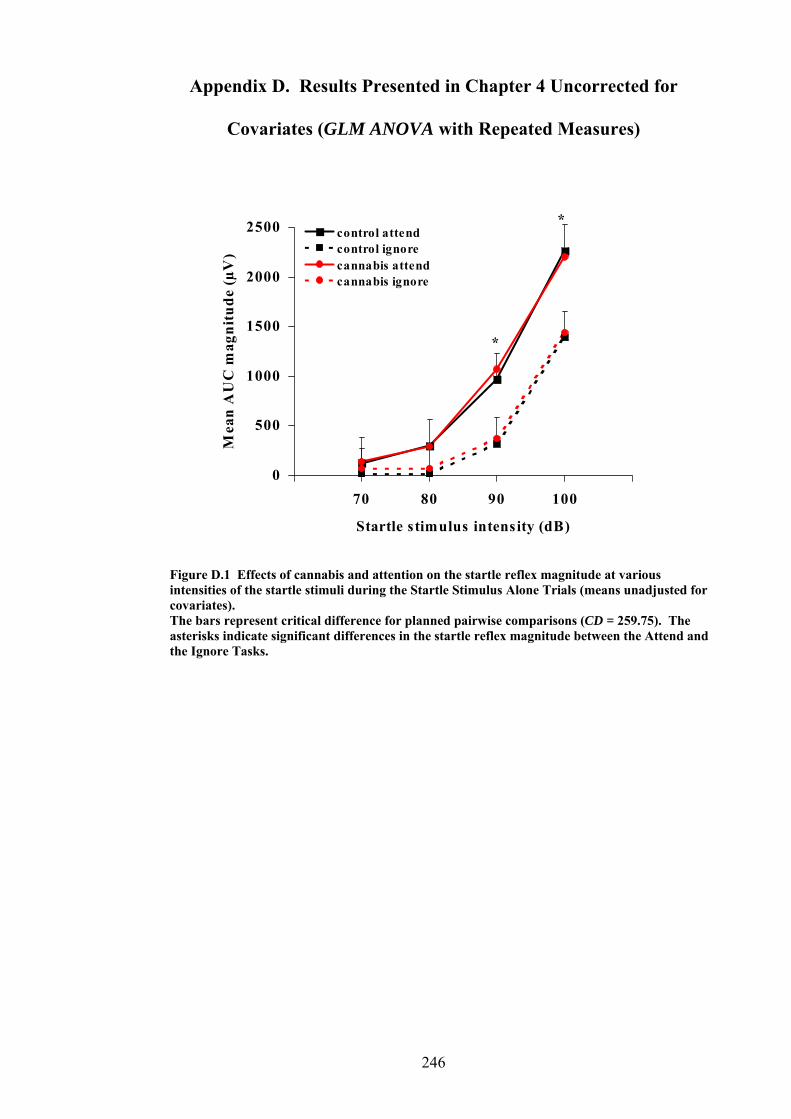
Appendix D. Results Presented in Chapter 4 Uncorrected for
Covariates (GLM ANOVA with Repeated Measures)
070
500
1000
1500
2000
2500
80 90 100
Mea
n A
UC
mag
nitu
de (µ
V)
Startle stimulus intensity (dB)
control attendcontrol ignorecannabis attendcannabis ignore
*
*
Figure D.1 Effects of cannabis and attention on the startle reflex magnitude at various intensities of the startle stimuli during the Startle Stimulus Alone Trials (means unadjusted for covariates). The bars represent critical difference for planned pairwise comparisons (CD = 259.75). The asterisks indicate significant differences in the startle reflex magnitude between the Attend and the Ignore Tasks.
246

500
1000
1500
2000
2500
3000
V)
0 20 40 80 100 200 1600
Lead-time interval (ms)
Mea
n A
UC
mag
nitu
de (µ
attend CONTROL Aignore
*
** * * *
*
500
1000
Me
1500
an A
UC
m
2000
2500
3000
0 20 40 80 100 200 1600
Lead-time interval (ms)
agni
tude
(µV
)
attendignore CANNABIS B
**
** *
*
*
usted for covariates). e
tartle Stimulus Alone Trials.
Figure D.2 Effects of attention on the startle reflex magnitude at various lead-time intervals in controls (A) and in cannabis users (B; means unadjThe bars represent critical difference for planned pairwise comparisons (CD = 280.62). Thasterisks indicate significant differences in the startle reflex magnitude between the Attend and the Ignore Tasks at various lead-time intervals. Note that the lead-time interval of 0 ms refers to the mean startle reflex magnitude on the S
247

500
1000
1500
2000
2500
3000
0 20 40 80 100 200 1600
Lead-time interval (ms)
Mea
n A
UC
mag
nitu
de (µ
V)
controlcannabis
ATTEND A
**
*
500
1000an A
1500
2000
3000
20 40 100 200 1
Lead-time rval ( s)
UC
mag
nitu
de (
2500µV)
0 80 600
inte m
Me
controlcannabis IGNORE B
Figure D.3 Effects of can the startle refl agnitud t variou -time in during the Attend Task (A e Ignore Task eans u djusted f ovariatesThe bars represent critical difference for planned pairwise comparisons (CD = 280.62). The
nabis on ex m e a s lead tervals) and th (B; m na or c ).
asterisks indicate significant differences in the startle reflex magnitude between controls and cannabis users on both attentional tasks. Note that the lead-time interval of 0 ms refers to the mean startle reflex magnitude on the Startle Stimulus Alone Trials.
248

-50
-40
-30
-20
-10
0
10
20
30
% PPF50
40
Attend Igno
Mea
n pe
ak m
odifi
cati
on (%
PP
M
re
) control
cannabis
*
% PPI
Figure D.4 Effects of cannabis and attention on %PPI at short lead-time intervals (mean 20 – 200 ms) during the Attend and the Ignore Tasks (means unadjusted for covariates). The bars represent critical difference for planned pairwise comparisons (CD = 14.18). The asterisk indicates a significant difference in %PPI between controls and cannabis users. Note that the positive values of %PPM indicate %PPF (prepulse facilitation) and the negative values of %PPM indicate %PPI (prepulse inhibition).
-50
-40
-30
-20
-10
0
10
20
30
40
50
Attend Ignore
Mea
n pe
ak m
odifi
cati
on (%
PP
M) control
cannabis
% PPI
% PPF
Figure D.5 Effects of cannabis and attention on %PPF at long lead-time intervals (mean 1600 ms) during the Attend and the Ignore Tasks (means unadjusted for covariates). The bars represent critical difference for planned pairwise comparisons (CD = 22.08). Note that the positive values of %PPM indicate %PPF (prepulse facilitation) and the negative values of %PPM indicate %PPI (prepulse inhibition).
249

0
500
1000
1500
2000
2500
V)
3000
Attend Ignore
Startle Stimulus Alone Trials
Mea
n A
UC
mag
nitu
de (µ
block 1
*
CONTROL A
block 2
0
500
1000
1500
2000
2500
3000
Attend Ignore
Startle Stimulus Alone Trials
Mea
n A
UC
mag
nitu
de (µ
V)
block 1block 2
*
CANNABIS B
*
Figure D.6 Effects of cannabis on the startle reflex magnitude habituation at Startle Stimulus Alone Trials during the Attend and the Ignore Tasks in controls (A) and in cannabis users (B; means unadjusted for covariates). The bars represent critical difference for planned pairwise comparisons (CD = 244.19). The asterisks indicate significant differences in the startle reflex magnitude between blocks on each attentional task.
250

0
500
1000
1500
2000
2500
3000
Attend Ignore
Short lead-time intervals (mean 20 - 200 ms)
Mea
n A
UC
mag
nitu
de (µ
V)
block 1block 2
*
CONTROL A
0
500
1000
1500
2000
2500
3000
Attend Ignore
Short lead-time intervals (mean 20 - 200 ms)
Mea
n A
UC
mag
nitu
de (µ
V)
block 1block 2
CANNABIS B
Figure D.7 Effects of cannabis on the startle reflex magnitude habituation at short lead-time intervals (mean 20 – 200 ms) during the Attend and the Ignore Tasks in controls (A) and in cannabis users (B; means unadjusted for covariates). The bars represent critical difference for planned pairwise comparisons (CD = 241.59). The asterisk indicates a significant difference in the startle reflex magnitude between blocks on the Ignore Task in controls.
251

252
0
500
1000
1500
2000
2500
3000
Attend Ignore
Long lead-time intervals (mean 1600 ms)
Mea
n A
UC
mag
nitu
de (µ
V)
block 1block 2
*
CONTROL A
0
500
1000
1500
2000
2500
3000
Attend Ignore
Long lead-time intervals (mean 1600 ms)
Mea
n A
UC
mag
nitu
de (µ
V)
block 1block 2
CANNABIS B
Figure D.8 Effects of cannabis on the startle reflex magnitude habituation at long lead-time intervals (mean 1600 ms) during the Attend and the Ignore Tasks in controls (A) and in cannabis users (B; means unadjusted for covariates). The bars represent critical difference for planned pairwise comparisons (CD = 423.35). The asterisk indicates a significant difference in the startle reflex magnitude between blocks on the Ignore Task in controls.

253
80
90
100
110
120
130
140
150
160
170
0 20 40 80 100 200 1600
Lead-time interval (ms)
Mea
n on
set l
aten
cy (m
s)
control attendcontrol ignorecannabis attendcannabis ignore
* * * * * *
Figure D.9 Effects of cannabis and attention on the startle reflex onset latency at various lead-time intervals (means unadjusted for covariates). The bars represent critical difference for planned pairwise comparisons (CD = 5.96). The asterisks indicate significant differences between the startle reflex onset latency during the Startle Stimulus Alone Trials (lead-time interval = 0 ms) and the Prepulse and Startle Stimulus Trials (lead-time intervals of 20 – 1600 ms).

254
Appendix E. Homogeneity of Variance Tests for Analyses Presented in
Chapter 4
Table E.1 Levene’s Test for homogeneity of variance of the startle reflex magnitude during the Startle Stimulus Alone Trials
Attentional Task
Startle reflex magnitude at four startle stimulus intensities
F dfB1 B dfB2 B p
Attend 70 dB 80 dB 90 dB
100 dB
0.03 0.6 0.8 0.8
1 1 1 1
26 26 26 26
0.855 0.434 0.370 0.373
Ignore 70 dB 80 dB 90 dB
100 dB
2.2 13.5 1.1
0.03
1 1 1 1
26 26 26 26
0.152 0.001** 0.307 0.864
Note. The homogeneity of variance was violated for the startle reflex magnitude at the startle stimulus intensity of 80 dB on the Ignore Task. This single violation was of no importance, because there were no significant effects of attention or cannabis use on the startle reflex magnitude at this startle stimulus intensity. **p < 0.01
Table E.2 Levene’s Test for homogeneity of variance of the startle reflex magnitude during the Prepulse and Startle Stimulus Trials
Attentional Task
Startle reflex magnitude at seven lead-time intervals
F
dfB1 B dfB2 B p
Attend 0 msa 20 ms 40 ms 80 ms
100 ms 200 ms
1600 ms
0.8 0.1 0.4 0.2
0.03 0.04 0.03
1 1 1 1 1 1 1
26 26 26 26 26 26 26
0.373 0.741 0.545 0.624 0.960 0.835 0.870
Ignore 0 msa 20 ms 40 ms 80 ms
100 ms 200 ms
1600 ms
0.03 0.7 2.8
0.01 0.3 0.4 0.2
1 1 1 1 1 1 1
26 26 26 26 26 26 26
0.864 0.401 0.107 0.913 0.599 0.532 0.656
Note. The homogeneity of variance was met for all the startle reflex magnitude values. a0 ms refers to the startle reflex magnitude on the Startle Stimulus Alone Trials

255
Table E.3 Levene’s Test for homogeneity of variance of the startle reflex magnitude during the Prepulse and Startle Stimulus Trials- means adjusted for one covariate only (alcoholic drinks per week)
Attentional Task
Startle reflex magnitude at seven lead-time intervals
F
dfB1 B dfB2 B p
Attend 0 msa 20 ms 40 ms 80 ms
100 ms 200 ms
1600 ms
0.2 0.03 0.2 0.2 0.1 0.2
0.01
1 1 1 1 1 1 1
26 26 26 26 26 26 26
0.638 0.868 0.656 0.652 0.798 0.662 0.916
Ignore 0 msa 20 ms 40 ms 80 ms
100 ms 200 ms
1600 ms
0.3 0.4 2.2
0.01 0.2 0.3
0.04
1 1 1 1 1 1 1
26 26 26 26 26 26 26
0.590 0.547 0.153 0.906 0.652 0.575 0.833
Note. The homogeneity of variance was met for all the startle reflex magnitude values. a0 ms refers to the startle reflex magnitude on the Startle Stimulus Alone Trials
Table E.4 Levene’s Test for homogeneity of variance of the % startle reflex magnitude (%PPI) during the Prepulse and Startle Stimulus Trials
%PPI
F
dfB1B dfB2B p
Attend Task Ignore Task
5.4 0.001
1 1
26 26
0.029* 0.978
Note. The homogeneity of variance was violated for %PPI on the Attend Task. This issue was addressed in Chapter 4. *p < 0.05
Table E.5 Levene’s Test for homogeneity of variance of the % startle reflex magnitude (%PPF) during the Prepulse and Startle Stimulus Trials
%PPF
F
dfB1B dfB2B p
Attend Task Ignore Task
0.1 0.3
1 1
26 26
0.736 0.572
Note. The homogeneity of variance was met for both %PPF values.

256
Table E.6 Levene’s Test for homogeneity of variance for two blocks of the startle reflex magnitude during the Startle Stimulus Alone Trials
Attentional Task
Startle reflex magnitude at two blocks
F
dfB1B dfB2B p
Attend Block 1 Block 2
0.1 1.4
1 1
26 26
0.706 0.238
Ignore Block 1
Block 2
0.1 < 0.0005
1 1
26 26
0.781 0.997
Note. The homogeneity of variance was met for all the startle reflex magnitude values.
Table E.7 Levene’s Test for homogeneity of variance for two blocks of the startle reflex magnitude during the Prepulse and Startle Stimulus Trials at short lead-time intervals
Attentional Task
Startle reflex magnitude at two blocks
F
dfB1 B dfB2 B p
Attend Block 1 Block 2
< 0.005 1.1
1 1
26 26
0.986 0.313
Ignore Block 1
Block 2
0.5 0.2
1 1
26 26
0.472 0.636
Note. The homogeneity of variance was met for all the startle reflex magnitude values.
Table E.8 Levene’s Test for homogeneity of variance for two blocks of the startle reflex magnitude during the Prepulse and Startle Stimulus Trials at long lead-time intervals
Attentional Task
Startle reflex magnitude at two blocks
F
dfB1 B dfB2 B p
Attend Block 1 Block 2
0.2 0.2
1 1
26 26
0.619 0.659
Ignore Block 1
Block 2
0.2 0.1
1 1
26 26
0.639 0.804
Note. The homogeneity of variance was met for all the startle reflex magnitude values.

257
Table E. 9 Levene’s Test for homogeneity of variance of the startle reflex onset latency during the Prepulse and Startle Stimulus Trials
Attentional Task
Startle reflex onset latency at seven lead-time intervals
F
dfB1 B dfB2 B p
Attend 0 msa 20 ms 40 ms 80 ms
100 ms 200 ms
1600 ms
0.5 1.8 0.5 0.7 2.3 3.6 0.2
1 1 1 1 1 1 1
26 26 26 26 26 26 26
0.500 0.190 0.491 0.400 0.145 0.069 0.672
Ignore 0 msa 20 ms 40 ms 80 ms
100 ms 200 ms
1600 ms
5.4 0.8
0.03 2.6 0.3 0.2 0.6
1 1 1 1 1 1 1
26 26 26 26 26 26 26
0.028* 0.383 0.858 0.120 0.566 0.635 0.438
Note. The homogeneity of variance was violated for the startle reflex onset latency on the Startle Stimulus Alone Trials during the Ignore Task. This single violation was of no importance, because there were no significant effects of attention or cannabis use on the startle reflex onset latencies on the Startle Stimulus Alone Trials. a0 ms refers to the startle reflex onset latency on the Startle Stimulus Alone Trials *p < 0.05