Embed Size (px)
Citation preview
The case for solar?Christopher Case
Next generation solar pow er 2
Next generation solar pow er 3
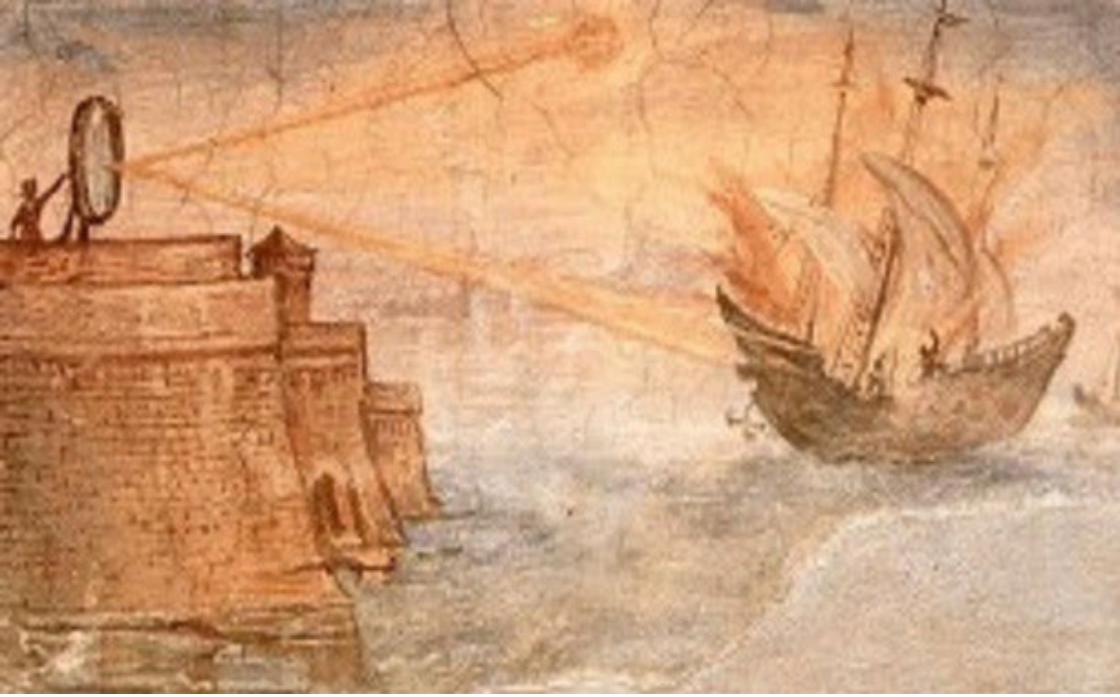
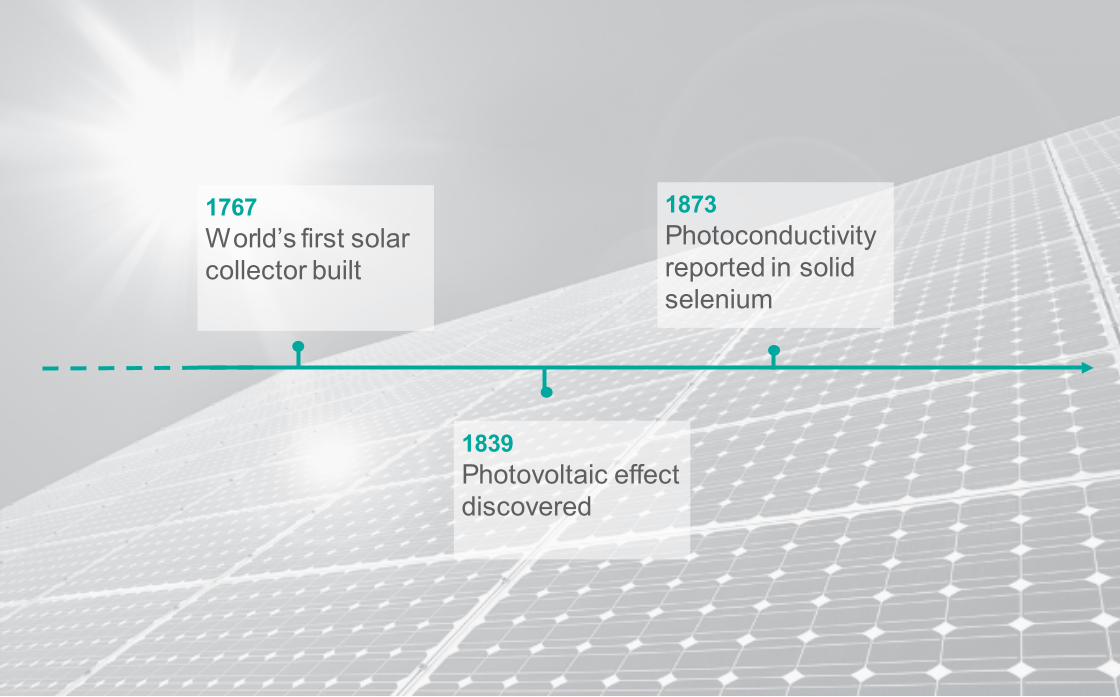
1767World’s first solar collector built
1839Photovoltaic effect discovered
1873Photoconductivity reported in solid selenium
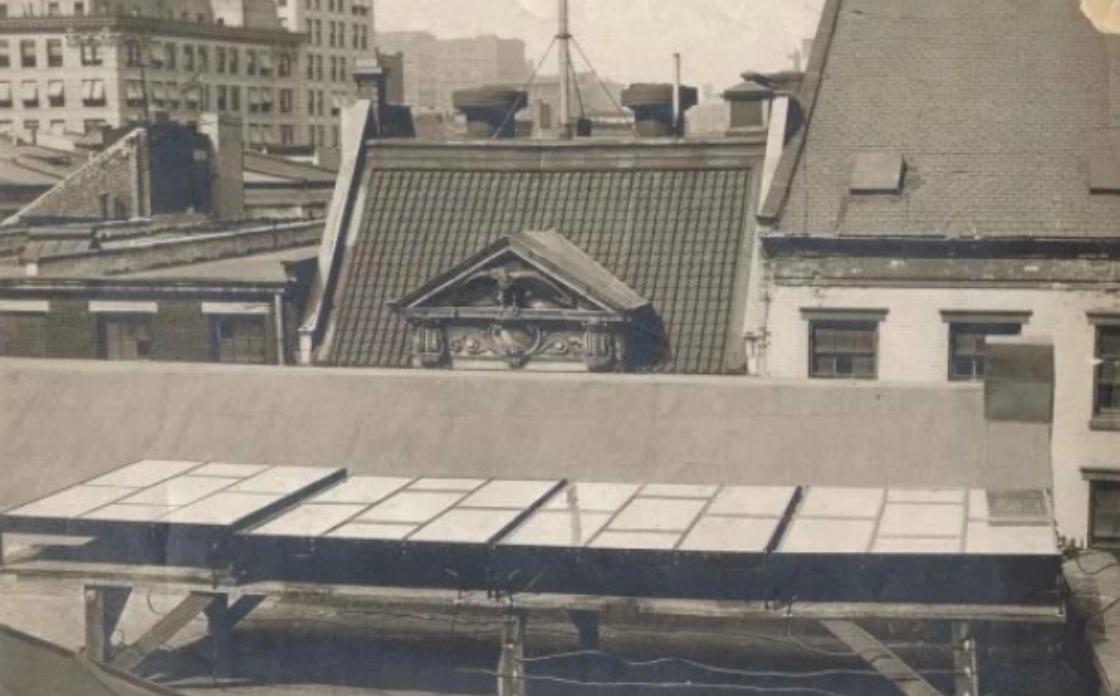
1883
Private & confidential 4
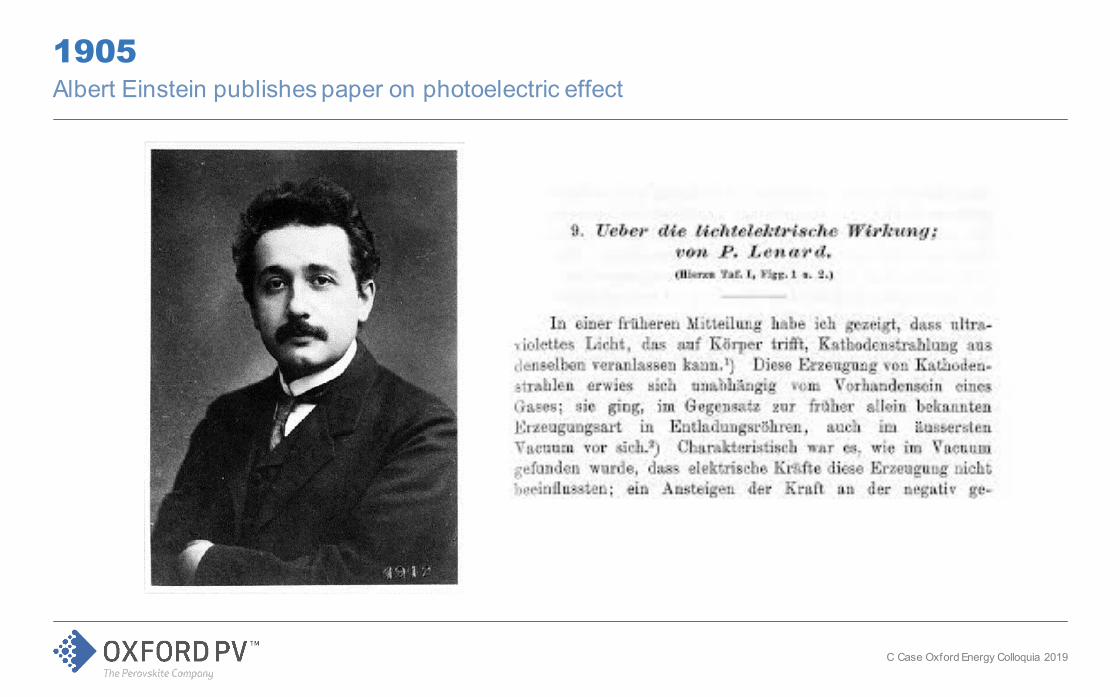
1905Albert Einstein publishes paper on photoelectric effect
C Case Oxford Energy Colloquia 2019
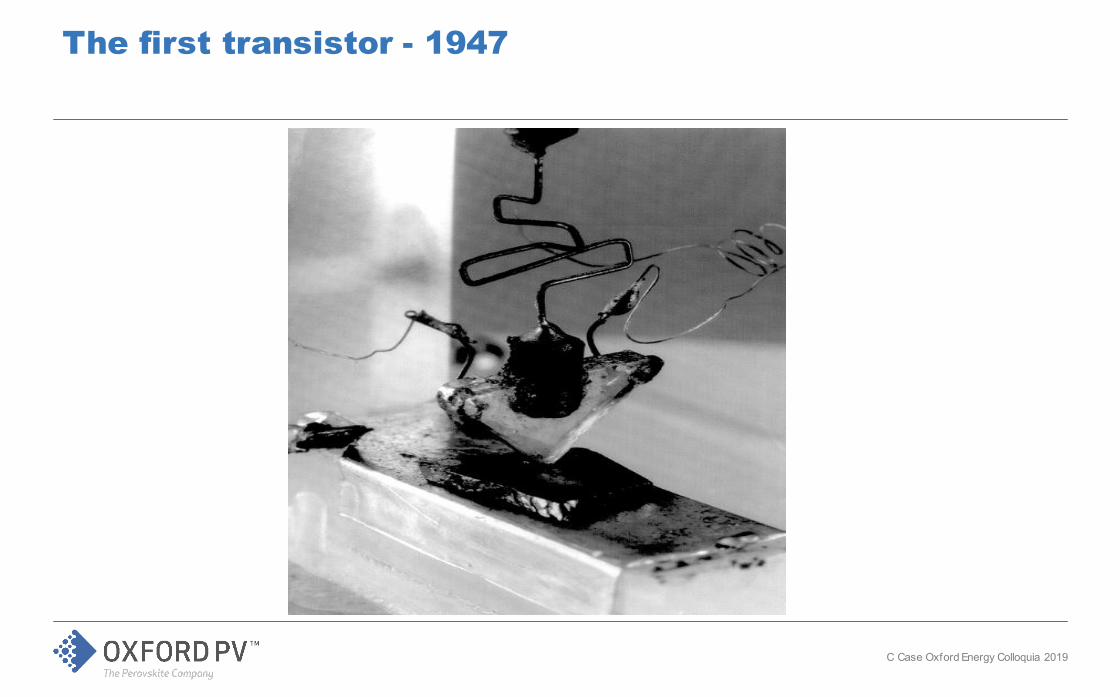
The first transistor - 1947
C Case Oxford Energy Colloquia 2019
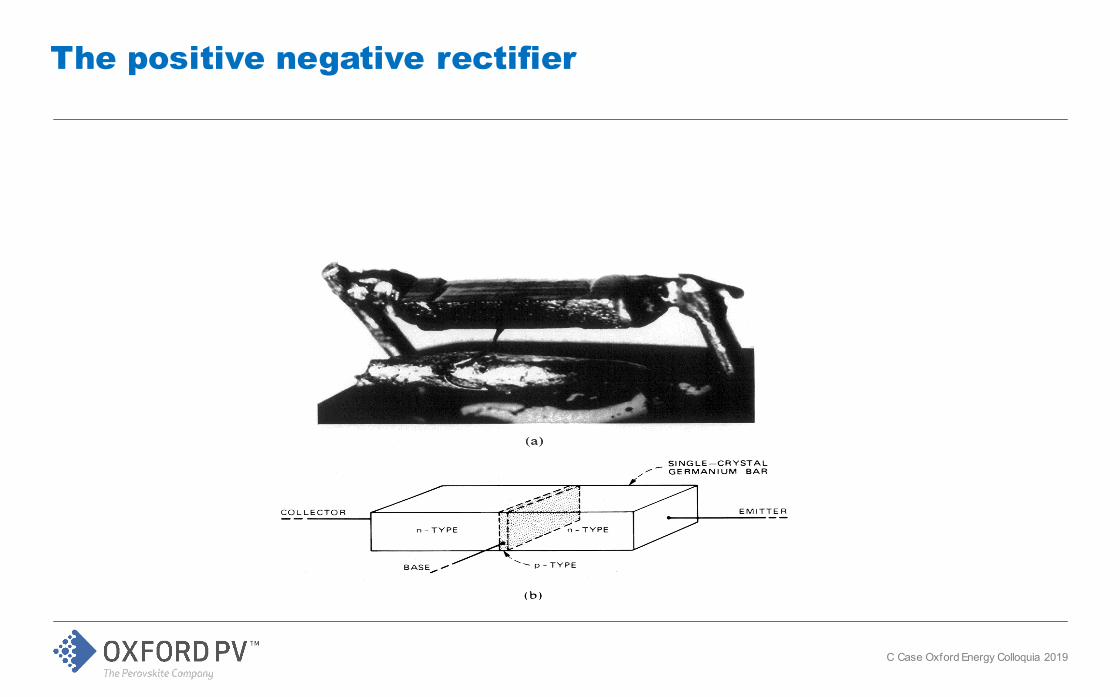
The positive negative rectifier
C Case Oxford Energy Colloquia 2019
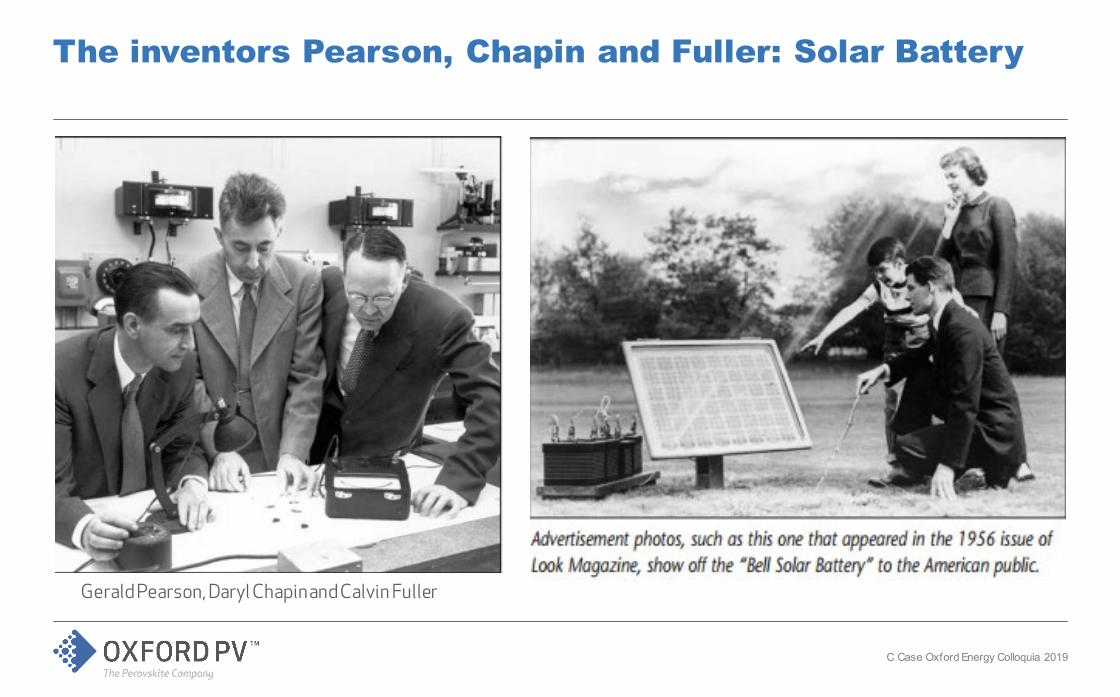
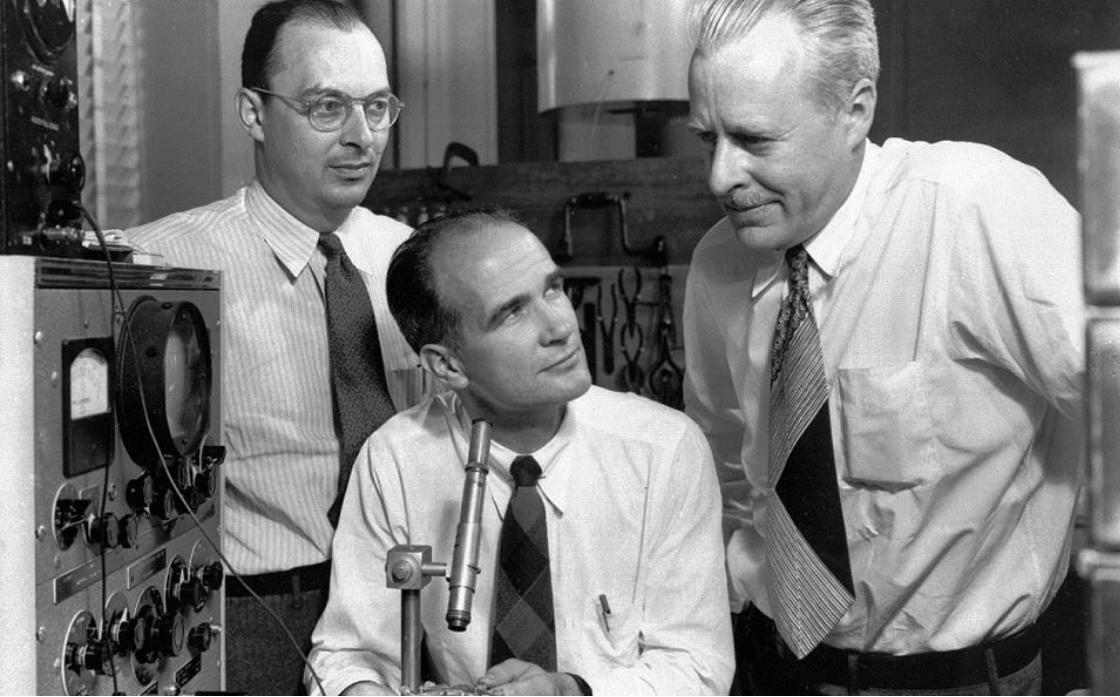
The inventors Pearson, Chapin and Fuller: Solar Battery
Gerald Pearson, Daryl Chapin and Calvin Fuller
C Case Oxford Energy Colloquia 2019
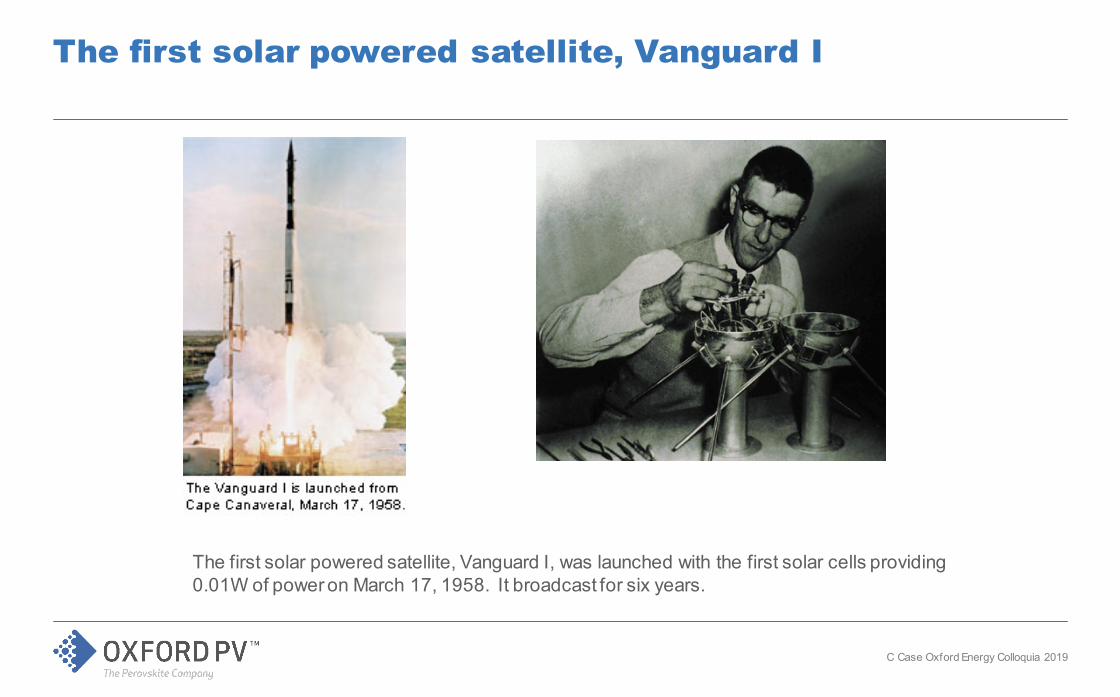
The first solar powered satellite, Vanguard I
The first solar powered satellite, Vanguard I, was launched with the first solar cells providing 0.01W of power on March 17, 1958. It broadcast for six years.
C Case Oxford Energy Colloquia 2019
Private & confidential 11
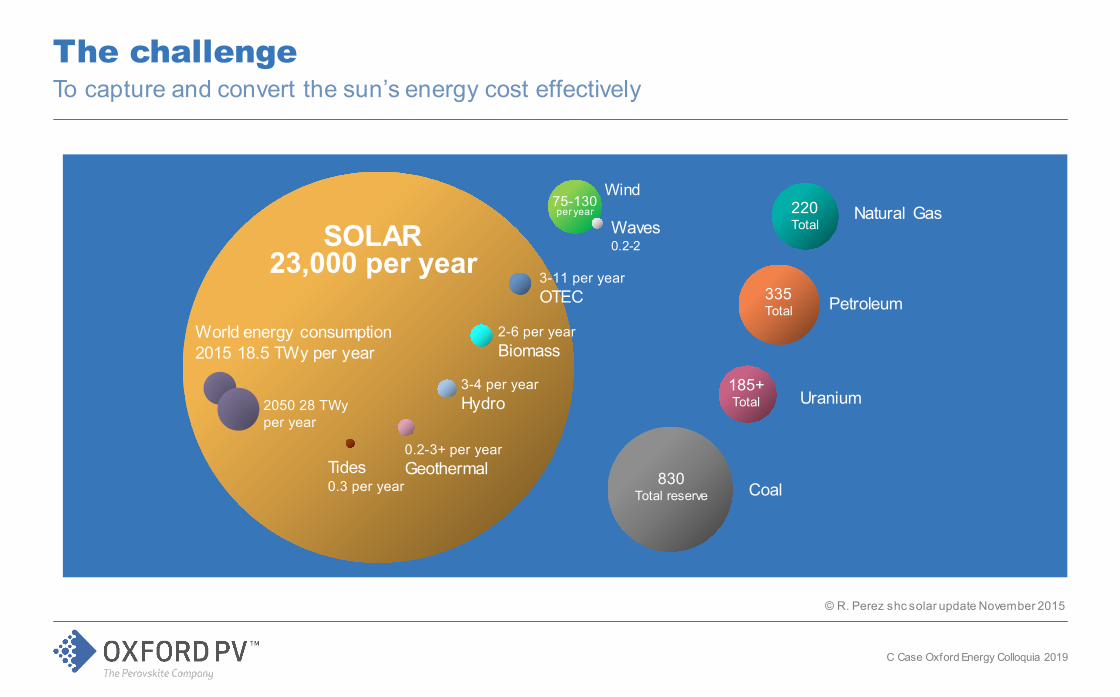
SOLAR23,000 per year
World energy consumption2015 18.5 TWy per year
Tides0.3 per year
0.2-3+ per yearGeothermal
3-4 per yearHydro
2-6 per yearBiomass
3-11 per yearOTEC
Coal
Uranium
Petroleum
Natural GasWind
Waves0.2-2
75-130per year 220
Total
335Total
185+Total
830Total reserve
2050 28 TWyper year
© R. Perez shc solar update November 2015
The challenge To capture and convert the sun’s energy cost effectively
C Case Oxford Energy Colloquia 2019
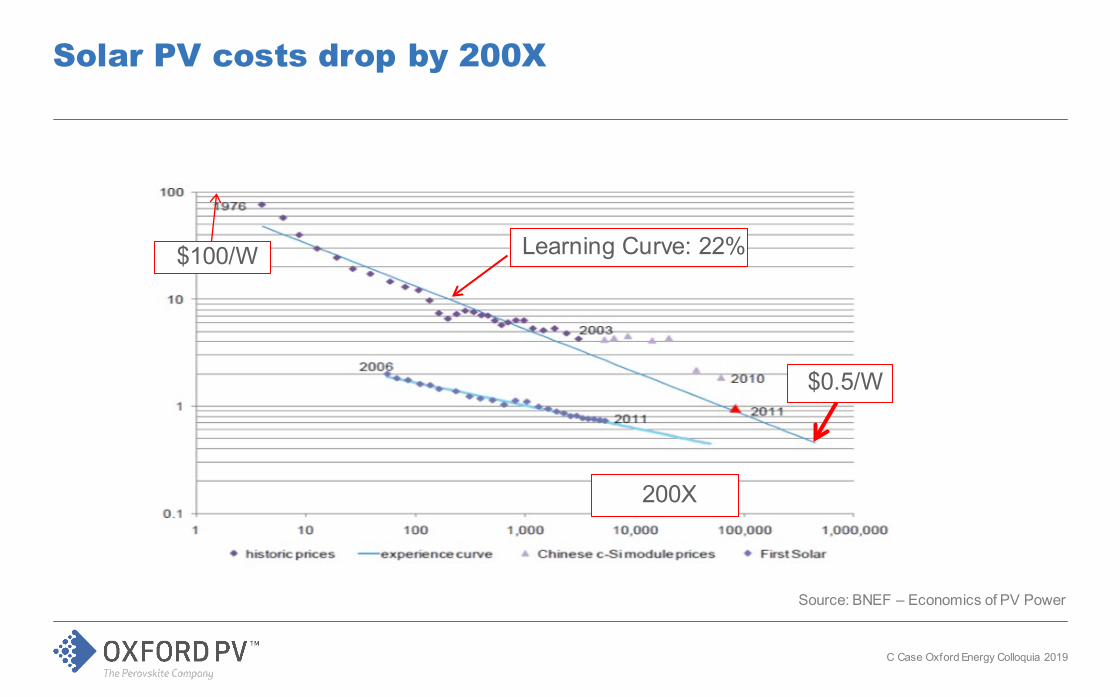
Solar PV costs drop by 200X
$100/W
$0.5/W
200X
Learning Curve: 22%
C Case Oxford Energy Colloquia 2019
Source: BNEF – Economics of PV Power
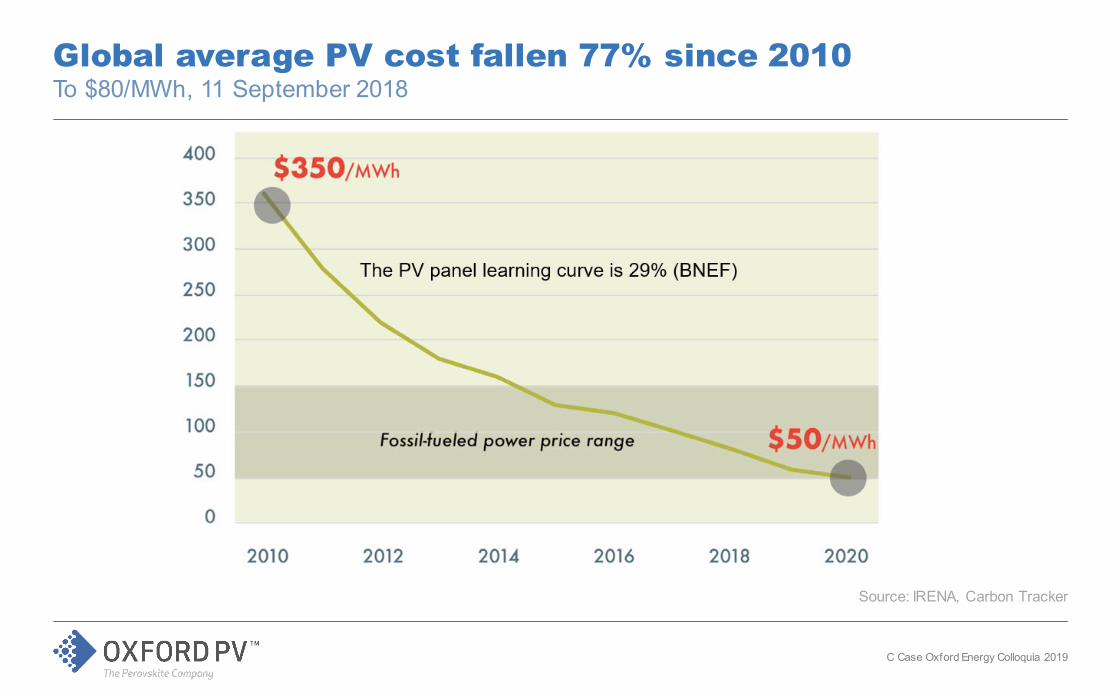
Global average PV cost fallen 77% since 2010To $80/MWh, 11 September 2018
Source: IRENA, Carbon Tracker
C Case Oxford Energy Colloquia 2019
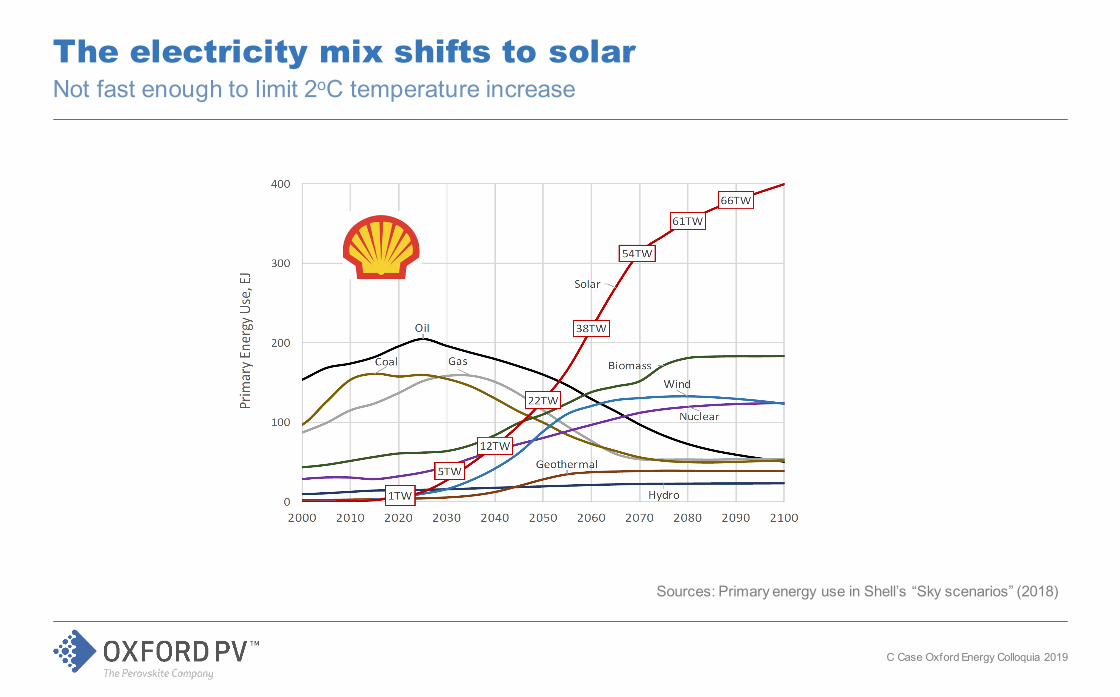
The electricity mix shifts to solarNot fast enough to limit 2oC temperature increase
Sources: Primary energy use in Shell’s “Sky scenarios” (2018)
C Case Oxford Energy Colloquia 2019
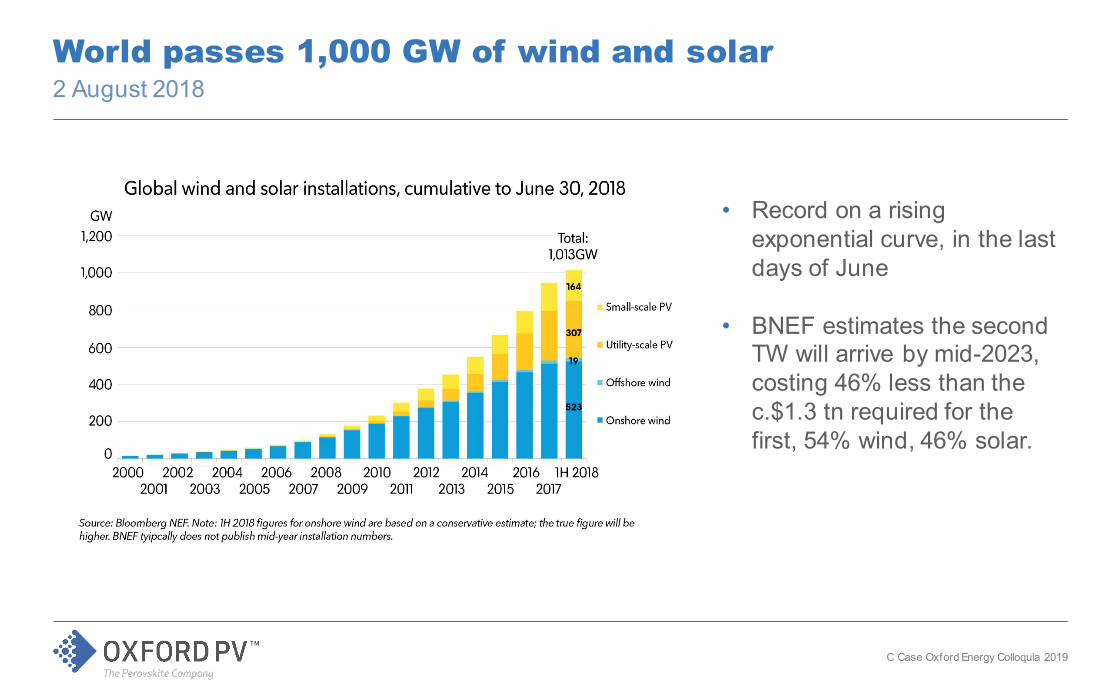
World passes 1,000 GW of wind and solar2 August 2018
• Record on a rising exponential curve, in the last days of June
• BNEF estimates the second TW will arrive by mid-2023, costing 46% less than the c.$1.3 tn required for the first, 54% wind, 46% solar.
C Case Oxford Energy Colloquia 2019
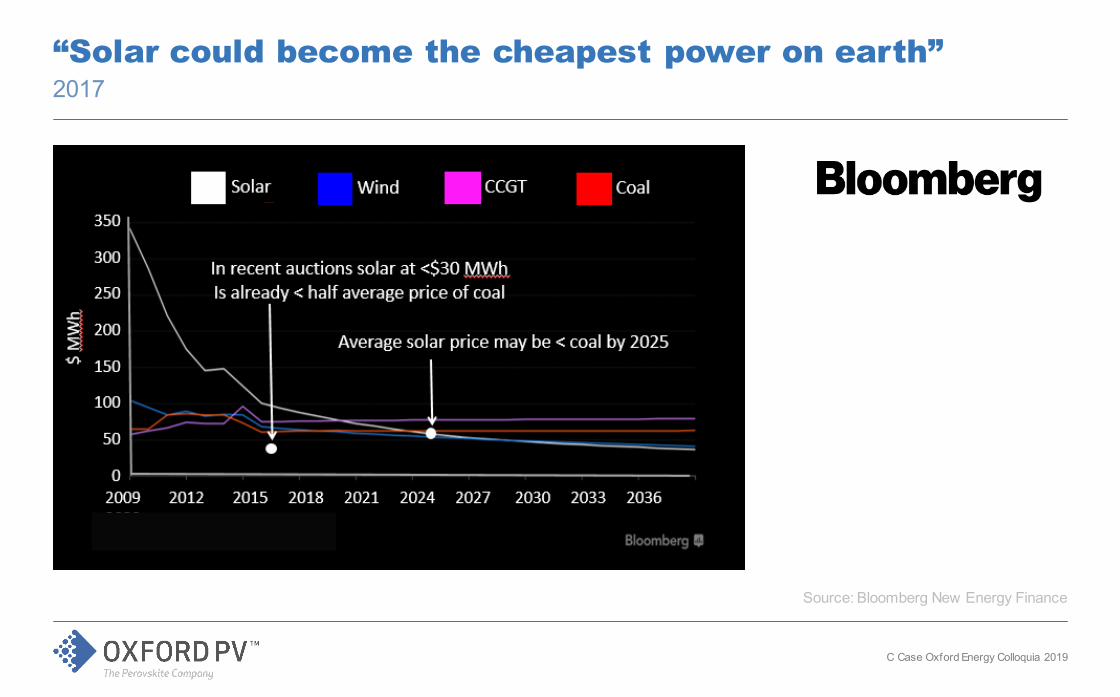
“Solar could become the cheapest power on earth” 2017
Source: Bloomberg New Energy Finance
C Case Oxford Energy Colloquia 2019
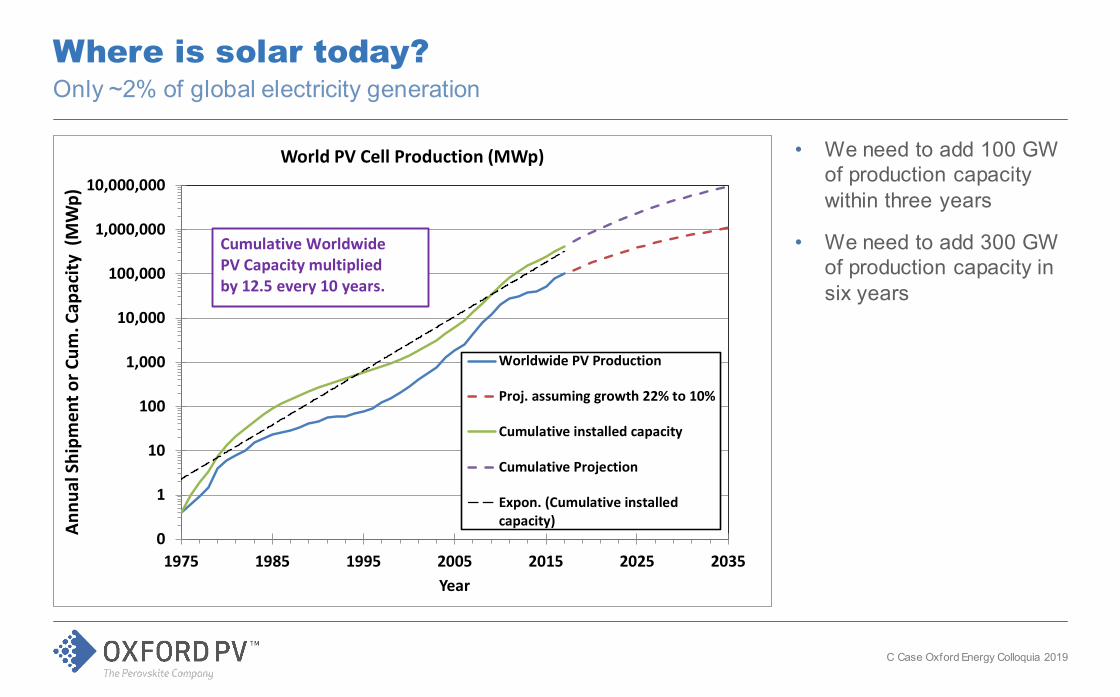
Where is solar today?Only ~2% of global electricity generation
0
1
10
100
1,000
10,000
100,000
1,000,000
10,000,000
1975 1985 1995 2005 2015 2025 2035
Annu
al S
hipm
ent o
r Cum
. Cap
acity
(M
Wp)
Year
World PV Cell Production (MWp)
Worldwide PV Production
Proj. assuming growth 22% to 10%
Cumulative installed capacity
Cumulative Projection
Expon. (Cumulative installedcapacity)
Cumulative Worldwide PV Capacity multiplied by 12.5 every 10 years.
• We need to add 100 GW of production capacity within three years
• We need to add 300 GW of production capacity in six years
C Case Oxford Energy Colloquia 2019
The future is all electric
C Case Oxford Energy Colloquia 2019
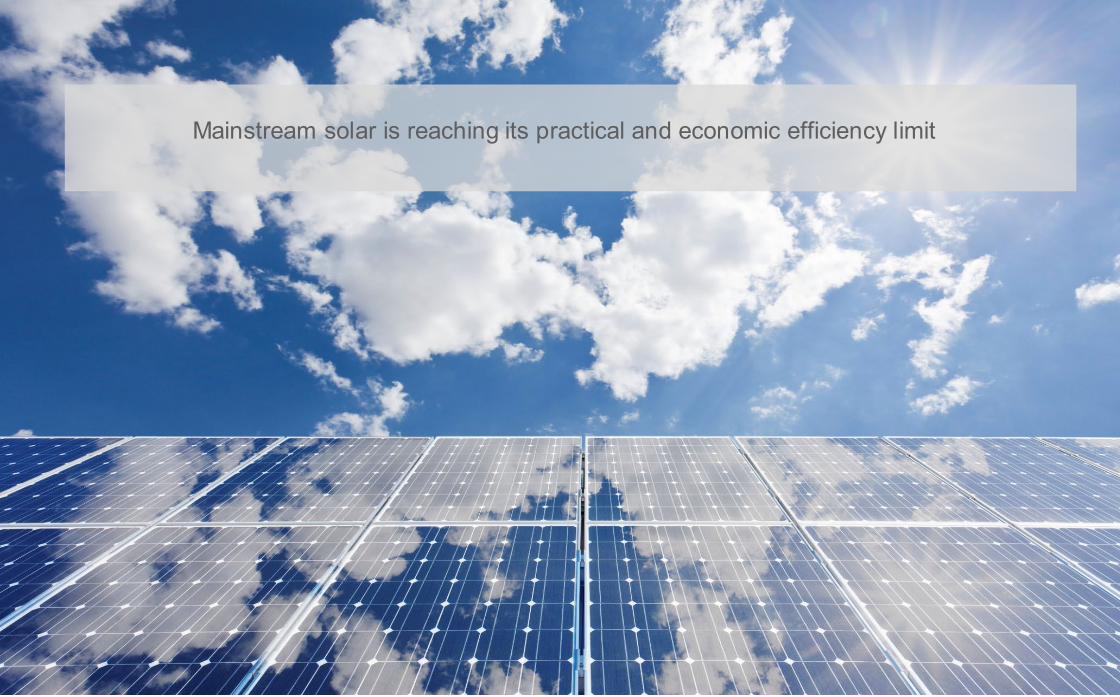
Mainstream solar is reaching its practical and economic efficiency limit
The opportunity for perovskite
C Case Oxford Energy Colloquia 2019
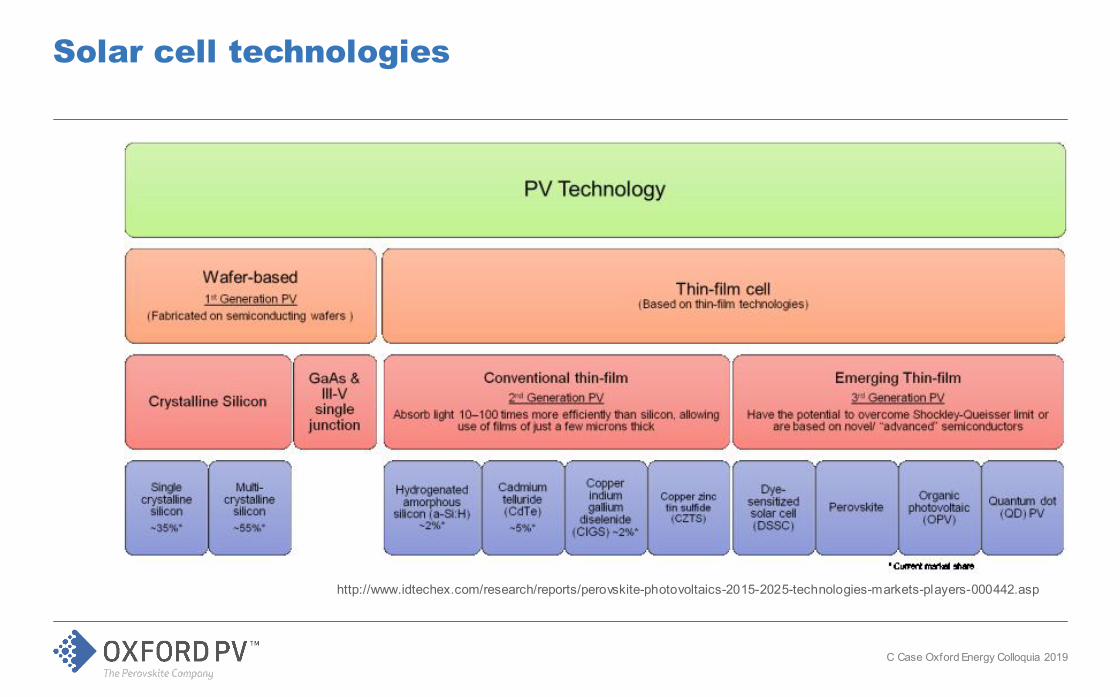
Solar cell technologies
http://www.idtechex.com/research/reports/perovskite-photovoltaics-2015-2025-technologies-markets-players-000442.asp
C Case Oxford Energy Colloquia 2019
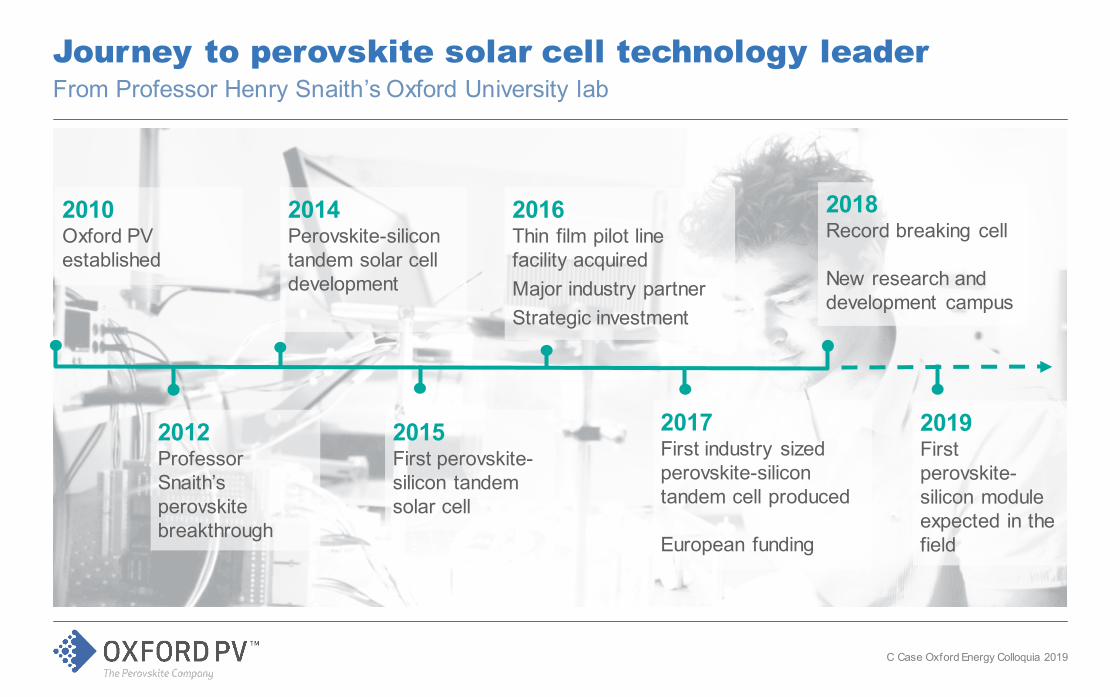
Journey to perovskite solar cell technology leaderFrom Professor Henry Snaith’s Oxford University lab
2010Oxford PV established
2012Professor Snaith’s perovskite breakthrough
2014Perovskite-silicon tandem solar cell development
2015First perovskite-silicon tandem solar cell
2016Thin film pilot line facility acquiredMajor industry partnerStrategic investment
2017First industry sized perovskite-silicon tandem cell produced
European funding
2018Record breaking cell
New research and development campus
2019First perovskite-silicon module expected in the field
C Case Oxford Energy Colloquia 2019
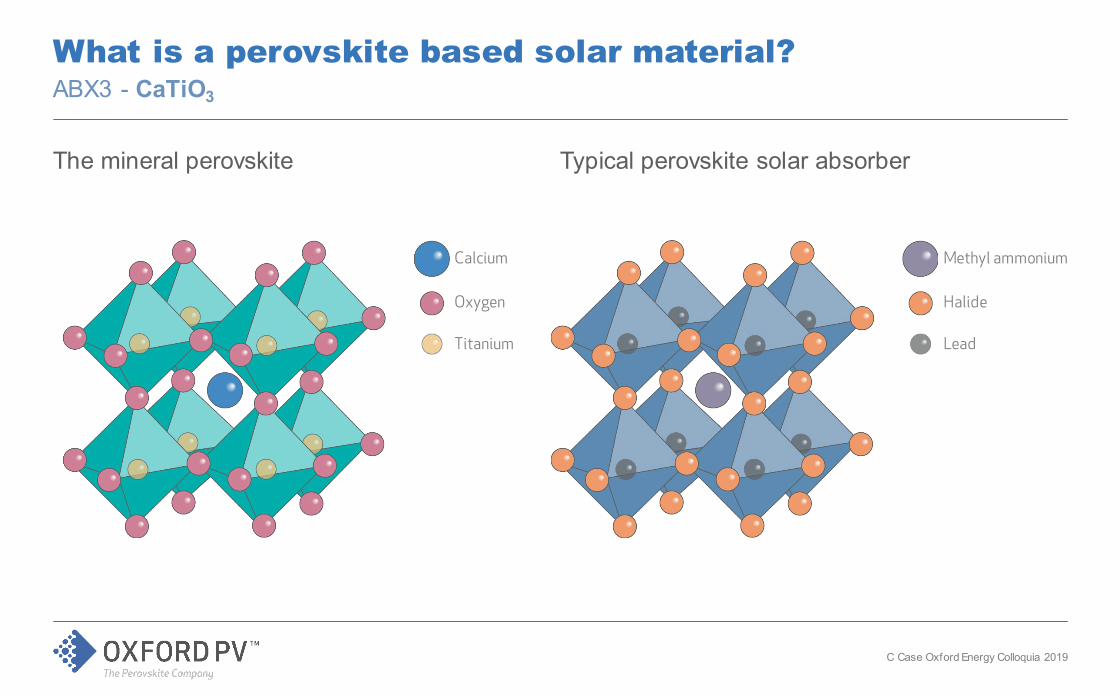
What is a perovskite based solar material?ABX3 - CaTiO3
The mineral perovskite Typical perovskite solar absorber
Titanium
Oxygen
Calcium
Lead
Halide
Methyl ammonium
C Case Oxford Energy Colloquia 2019
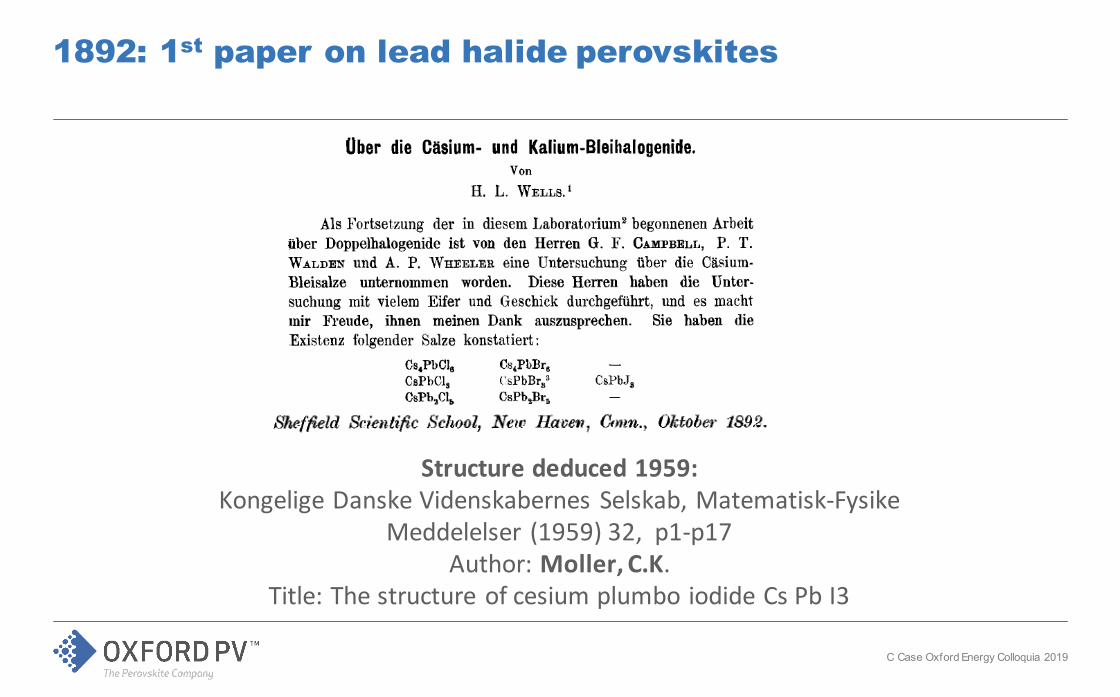
1892: 1st paper on lead halide perovskites
Structure deduced 1959:Kongelige Danske Videnskabernes Selskab, Matematisk-Fysike
Meddelelser (1959) 32, p1-p17Author: Moller, C.K.
Title: The structure of cesium plumbo iodide Cs Pb I3
C Case Oxford Energy Colloquia 2019
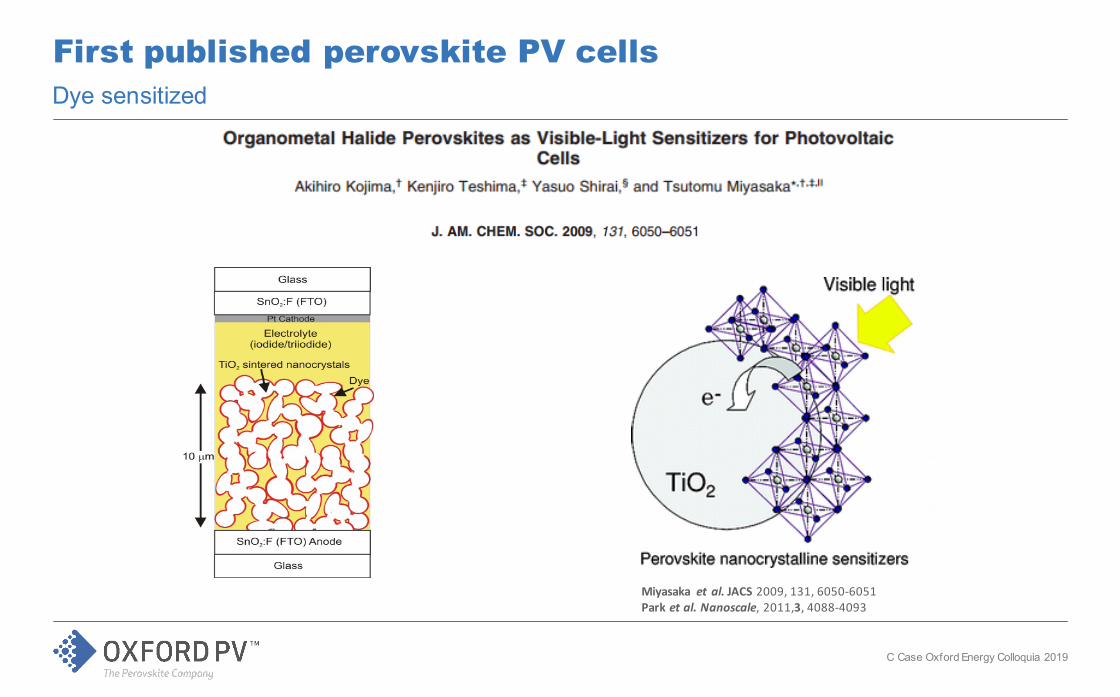
Miyasaka et al. JACS 2009, 131, 6050-6051Park et al. Nanoscale, 2011,3, 4088-4093
First published perovskite PV cellsDye sensitized
C Case Oxford Energy Colloquia 2019
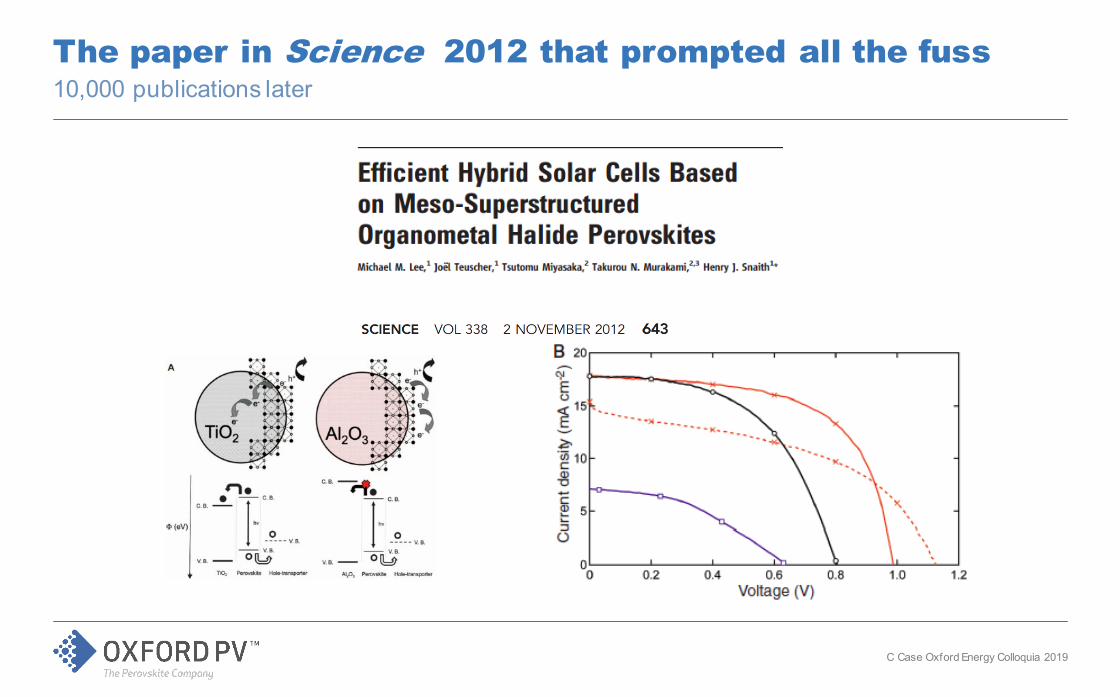
The paper in Science 2012 that prompted all the fuss10,000 publications later
C Case Oxford Energy Colloquia 2019
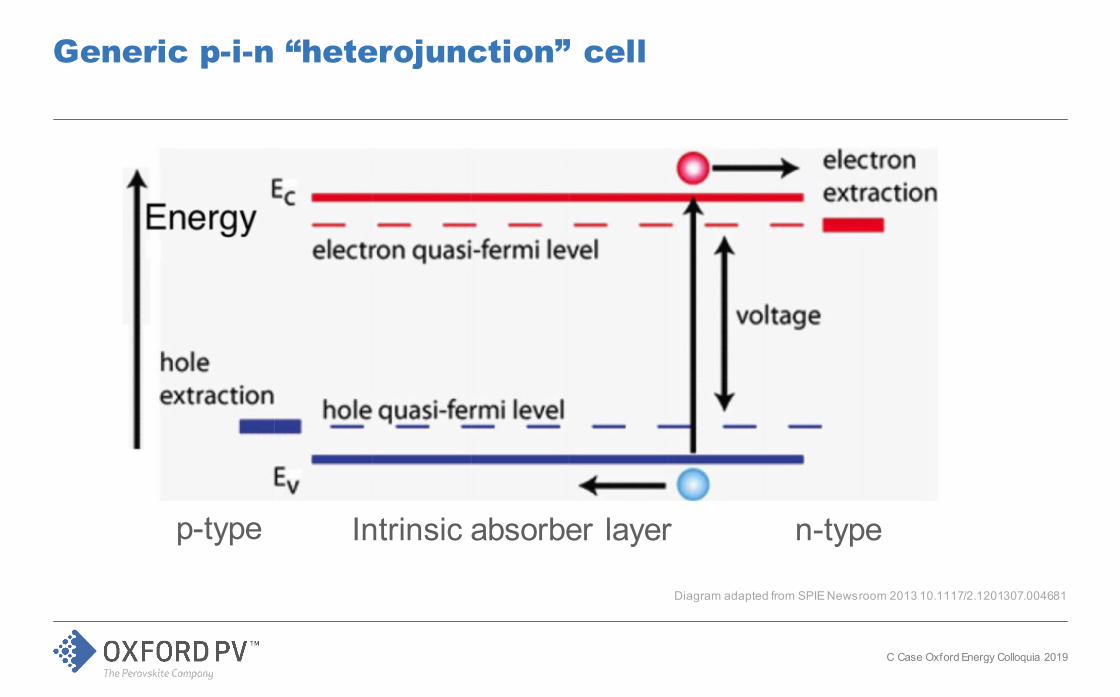
Generic p-i-n “heterojunction” cell
Diagram adapted from SPIE Newsroom 2013 10.1117/2.1201307.004681
Intrinsic absorber layerp-type n-type
C Case Oxford Energy Colloquia 2019
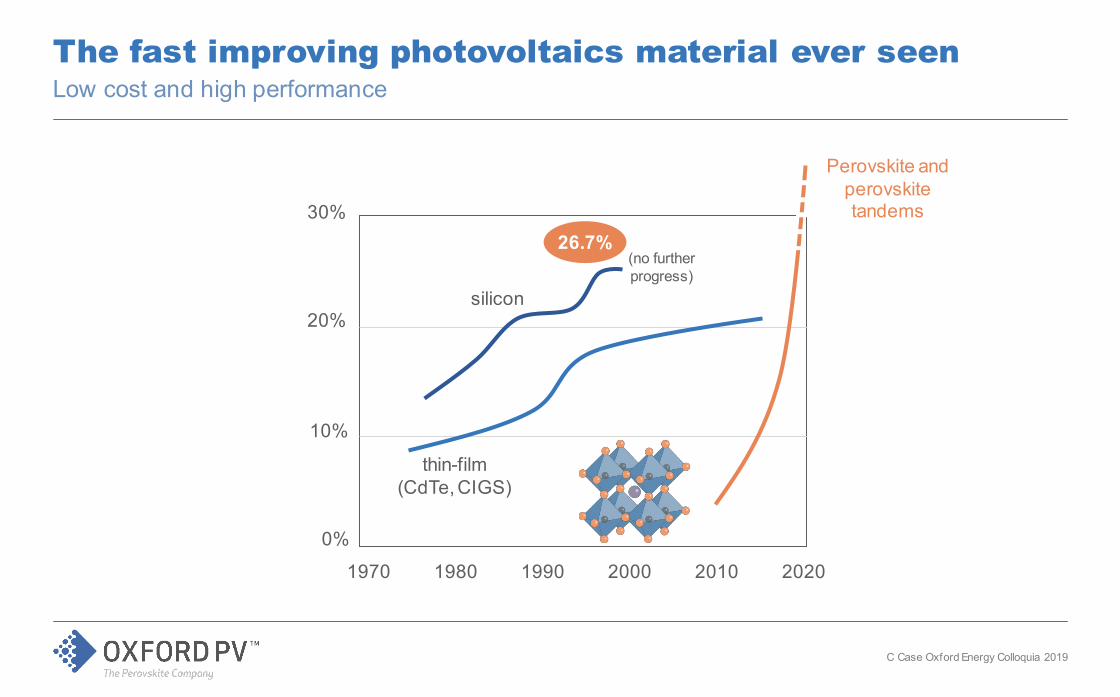
The fast improving photovoltaics material ever seen Low cost and high performance
1970 1980 1990 2000 2010 2020
0%
10%
20%
30%
Perovskite and perovskite tandems
silicon
thin-film(CdTe, CIGS)
(no further progress)
26.7%
C Case Oxford Energy Colloquia 2019
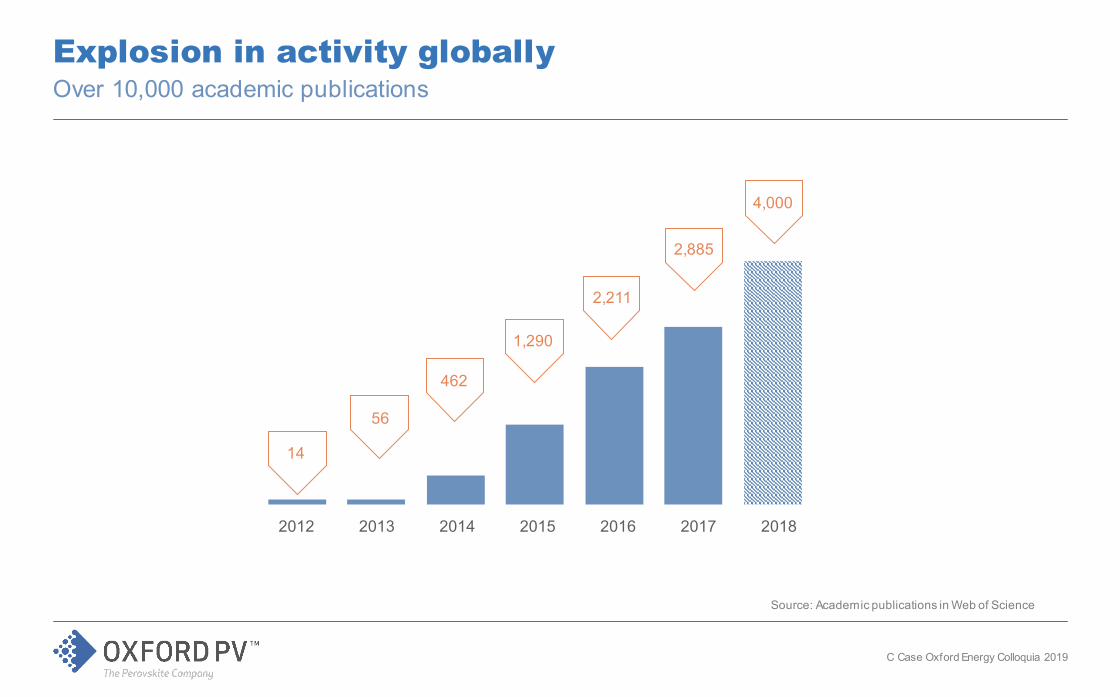
Explosion in activity globallyOver 10,000 academic publications
2013 201520142012 2016 20182017
14
56
462
1,290
2,211
2,885
4,000
Source: Academic publications in Web of Science
C Case Oxford Energy Colloquia 2019
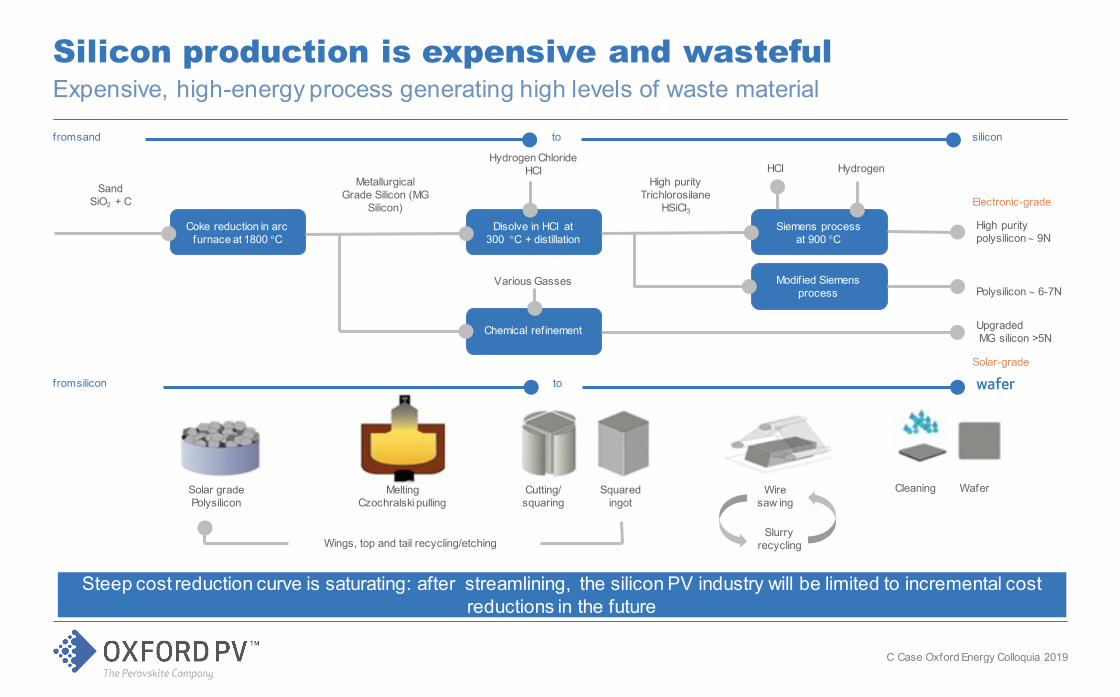
Silicon production is expensive and wastefulExpensive, high-energy process generating high levels of waste material
Coke reduction in arc furnace at 1800 °C
Disolve in HCI at 300 °C + distillation
Chemical refinement
Siemens processat 900 °C
Modif ied Siemens process
SandSiO2 + C
Metallurgical Grade Silicon (MG
Silicon)
Hydrogen ChlorideHCI HCI Hydrogen
High purity Trichlorosilane
HSiCl3High purity polysilicon ∼ 9N
Polysilicon ∼ 6-7N
UpgradedMG silicon >5N
Various Gasses
Electronic-grade
Solar-grade
Solar grade Polysilicon
Melting Czochralski pulling
Cutting/squaring
Squared ingot
Wire saw ing
Cleaning Wafer
Wings, top and tail recycling/etchingSlurry
recycling
from sand siliconto
from silicon waferto
Steep cost reduction curve is saturating: after streamlining, the silicon PV industry will be limited to incremental cost reductions in the future
C Case Oxford Energy Colloquia 2019
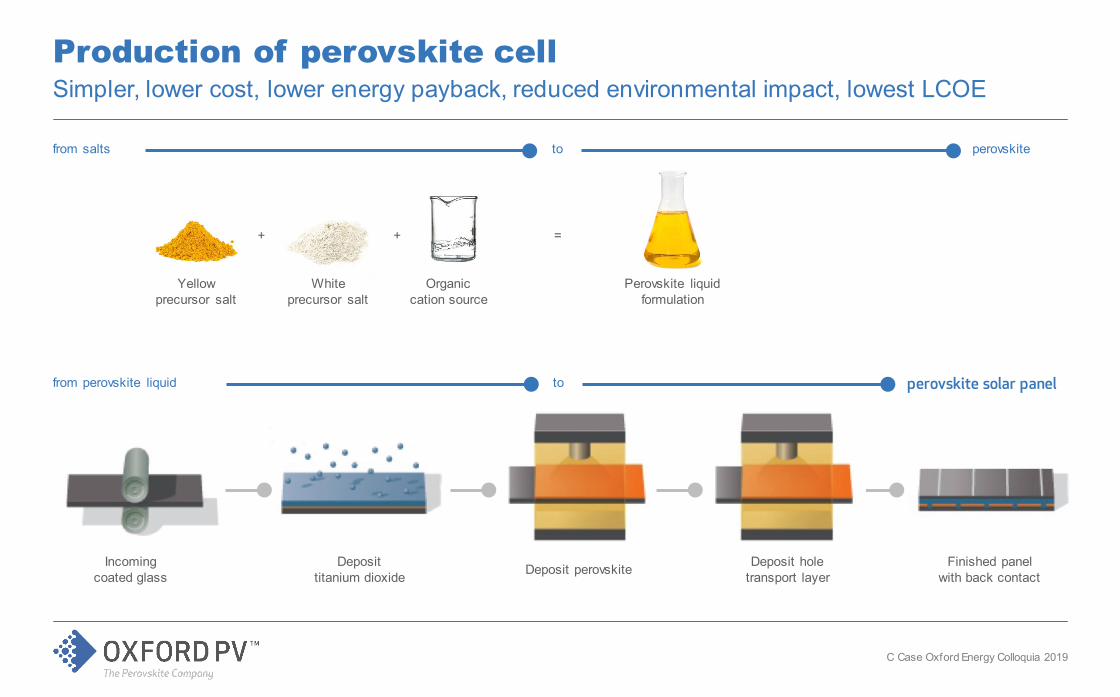
Production of perovskite cellSimpler, lower cost, lower energy payback, reduced environmental impact, lowest LCOE
Incoming coated glass
Deposit titanium dioxide Deposit perovskite Finished panel
with back contactDeposit hole
transport layer
+ + =
Yellow precursor salt
White precursor salt
Organic cation source
Perovskite liquid formulation
from salts perovskiteto
from perovskite liquid perovskite solar panelto
C Case Oxford Energy Colloquia 2019
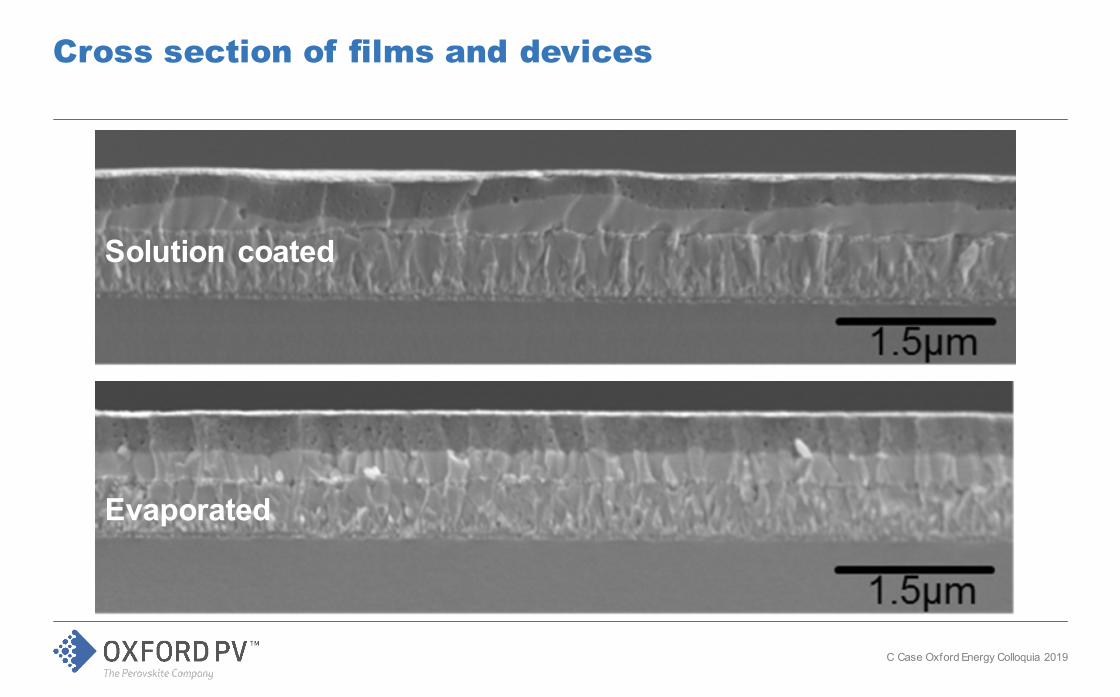
Cross section of films and devices
Evaporated
Solution coated
C Case Oxford Energy Colloquia 2019
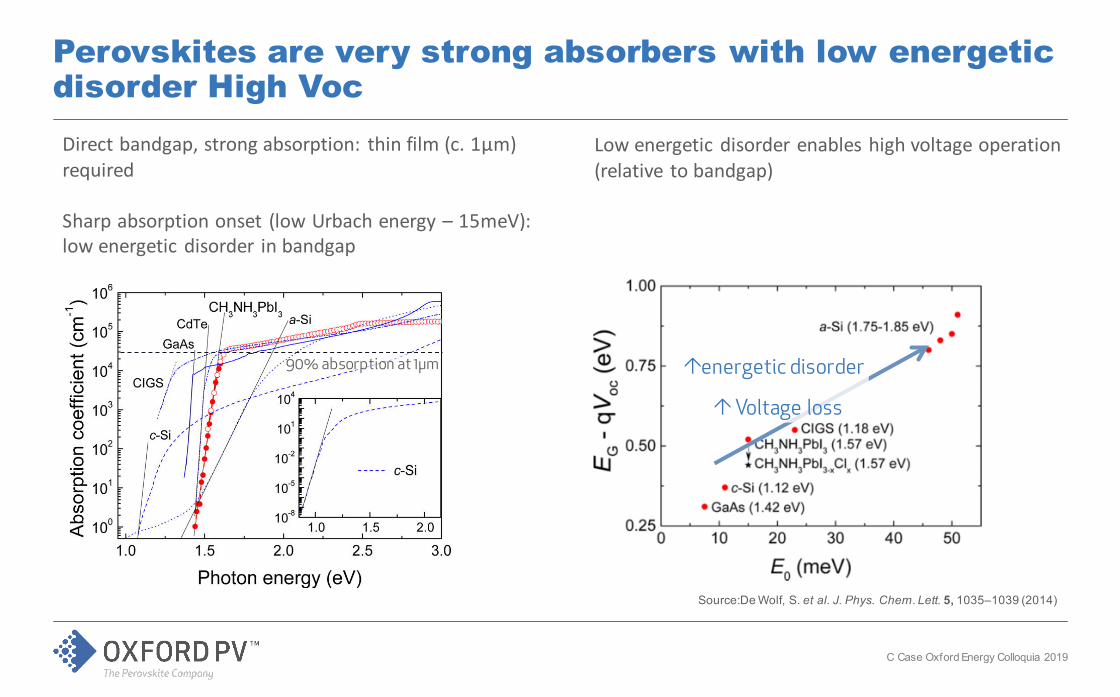
Perovskites are very strong absorbers with low energetic disorder High Voc
Direct bandgap, strong absorption: thin film (c. 1µm) required
Sharp absorption onset (low Urbach energy – 15meV): low energetic disorder in bandgap
(g)
90% absorption at 1µm
Source:De Wolf, S. et al. J. Phys. Chem. Lett. 5, 1035–1039 (2014)
↑energetic disorder
↑ Voltage loss
Low energetic disorder enables high voltage operation (relative to bandgap)
C Case Oxford Energy Colloquia 2019
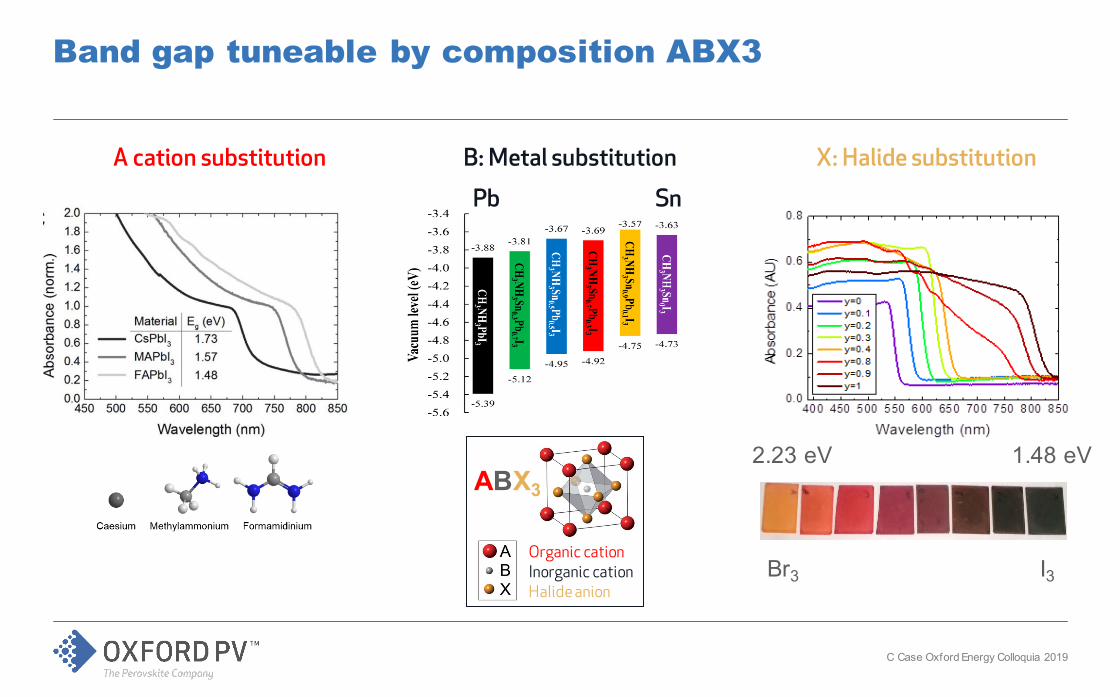
Band gap tuneable by composition ABX3
X: Halide substitutionA cation substitution
Br3
1.48 eV2.23 eV
I3
B: Metal substitution
ABX3
Organic cationInorganic cationHalide anion
Pb Sn
C Case Oxford Energy Colloquia 2019
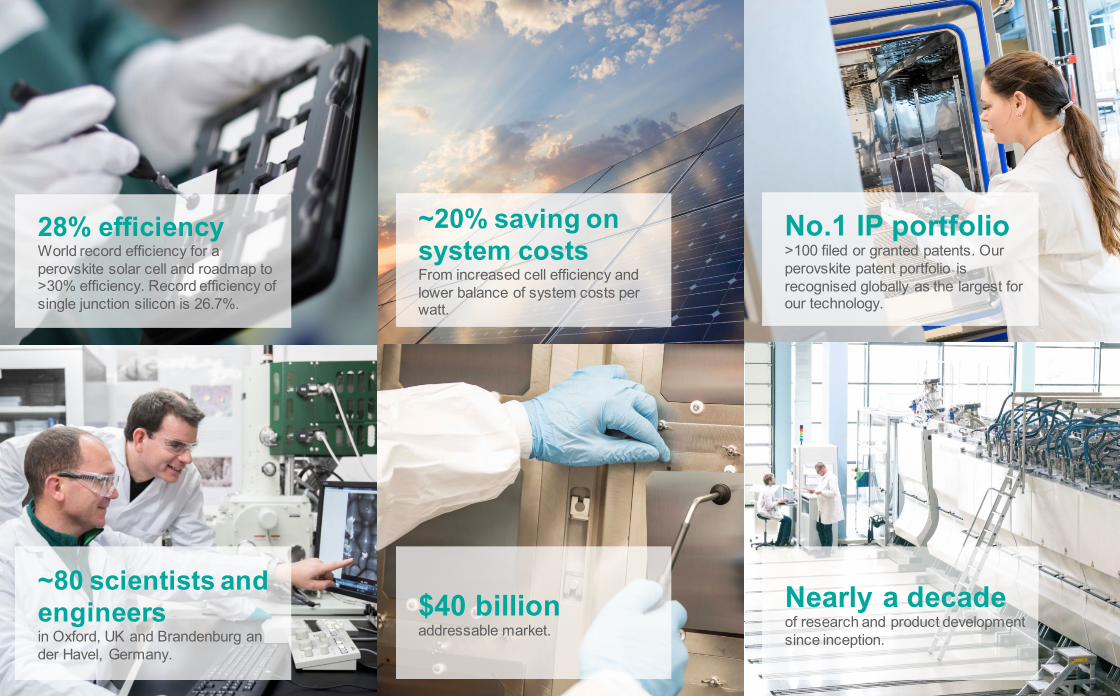
28% efficiencyWorld record efficiency for a perovskite solar cell and roadmap to >30% efficiency. Record efficiency of single junction silicon is 26.7%.
~20% saving on system costsFrom increased cell efficiency and lower balance of system costs per watt.
~80 scientists and engineers in Oxford, UK and Brandenburg an der Havel, Germany.
Nearly a decadeof research and product development since inception.
$40 billionaddressable market.
No.1 IP portfolio>100 filed or granted patents. Our perovskite patent portfolio is recognised globally as the largest for our technology.
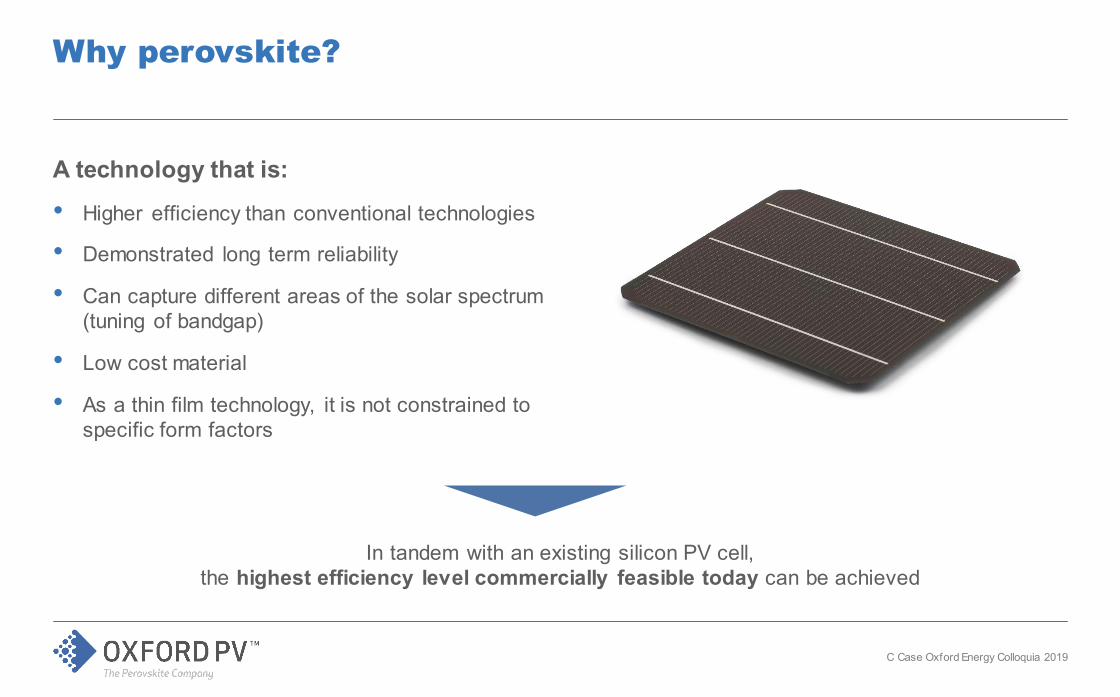
A technology that is:
• Higher efficiency than conventional technologies
• Demonstrated long term reliability
• Can capture different areas of the solar spectrum (tuning of bandgap)
• Low cost material
• As a thin film technology, it is not constrained to specific form factors
In tandem with an existing silicon PV cell, the highest efficiency level commercially feasible today can be achieved
Why perovskite?
C Case Oxford Energy Colloquia 2019
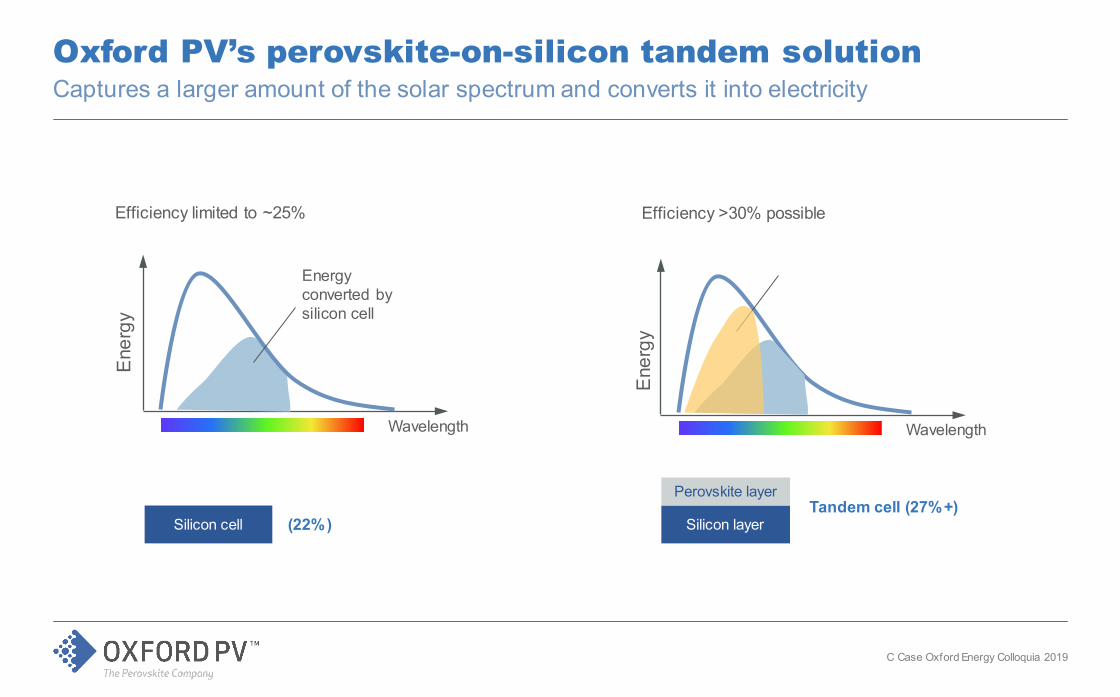
Oxford PV’s perovskite-on-silicon tandem solutionCaptures a larger amount of the solar spectrum and converts it into electricity
Energy converted by silicon cell
Wavelength
Silicon cell (22%)
Ene
rgy
Tandem cell (27%+)
Wavelength
Silicon layer
Perovskite layer
Ene
rgy
Efficiency >30% possibleEfficiency limited to ~25%
C Case Oxford Energy Colloquia 2019
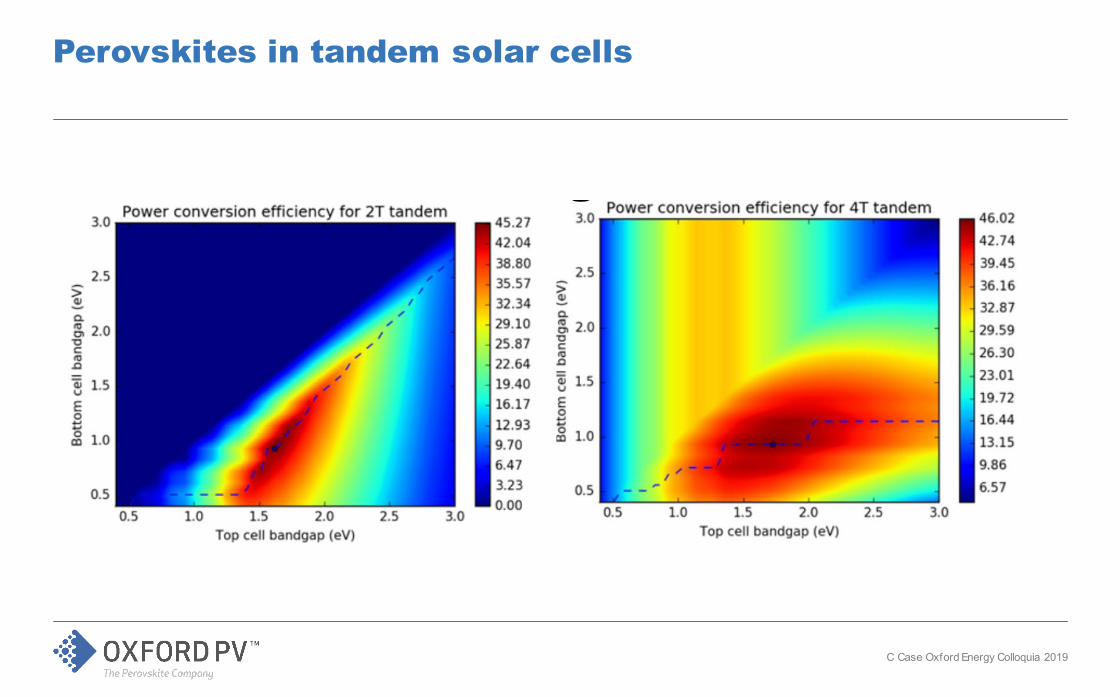
Perovskites in tandem solar cells
C Case Oxford Energy Colloquia 2019
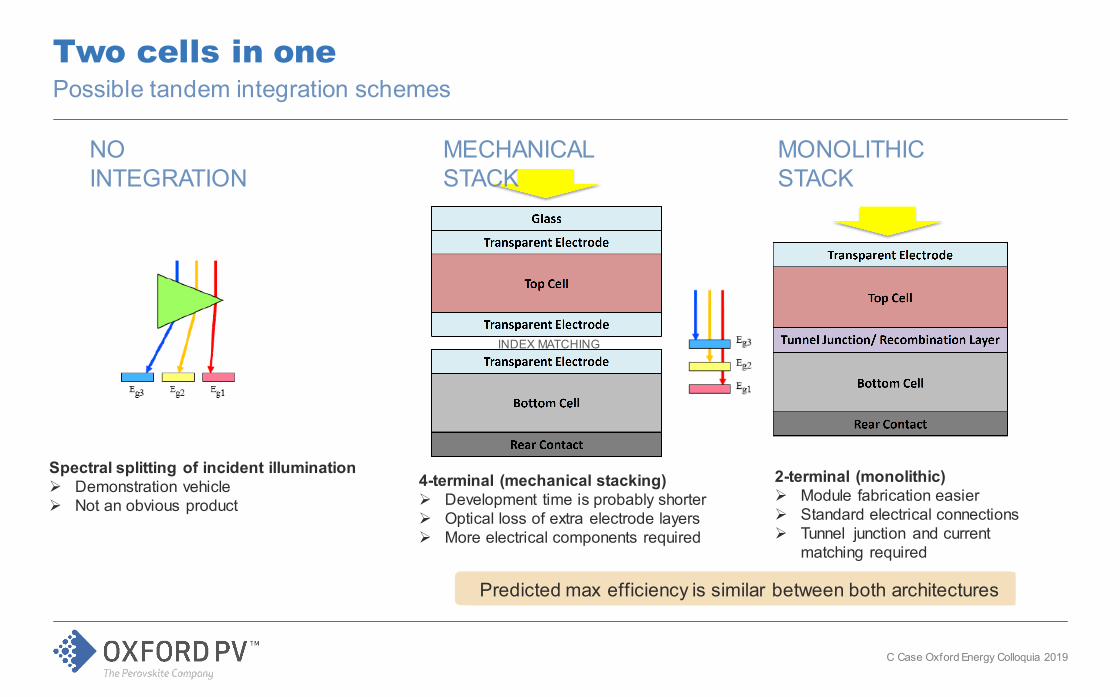
Possible tandem integration schemesTwo cells in one
4-terminal (mechanical stacking) Development time is probably shorter Optical loss of extra electrode layers More electrical components required
2-terminal (monolithic) Module fabrication easier Standard electrical connections Tunnel junction and current
matching required
NO INTEGRATION
Spectral splitting of incident illumination Demonstration vehicle Not an obvious product
MECHANICAL STACK
MONOLITHIC STACK
INDEX MATCHING
Predicted max efficiency is similar between both architectures
C Case Oxford Energy Colloquia 2019
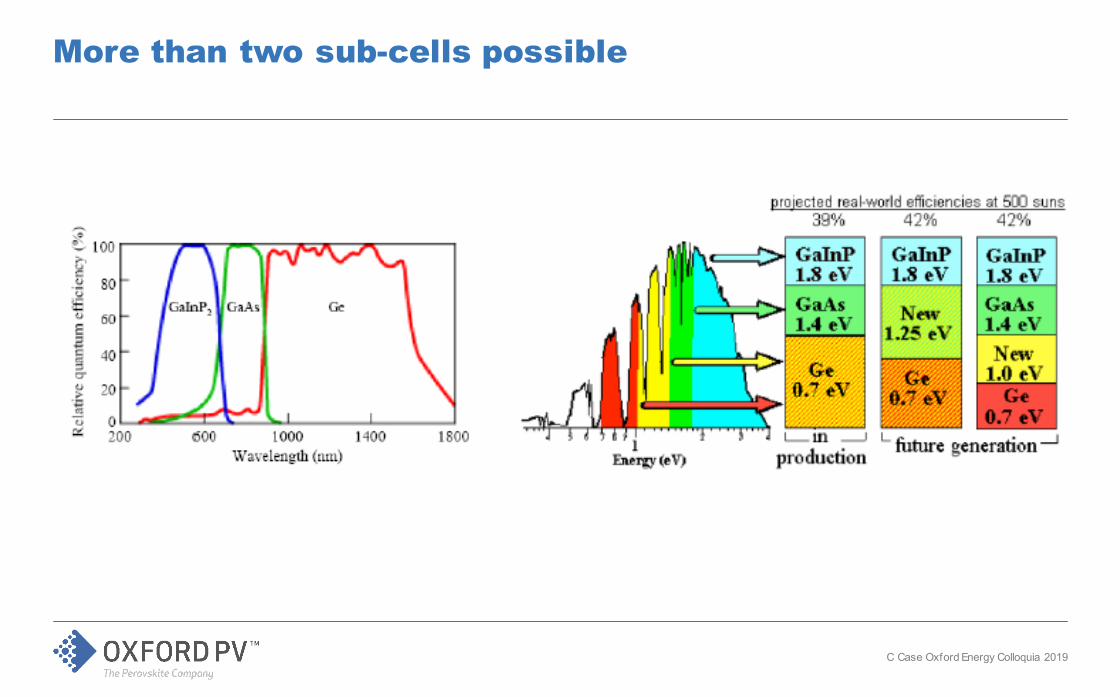
More than two sub-cells possible
C Case Oxford Energy Colloquia 2019
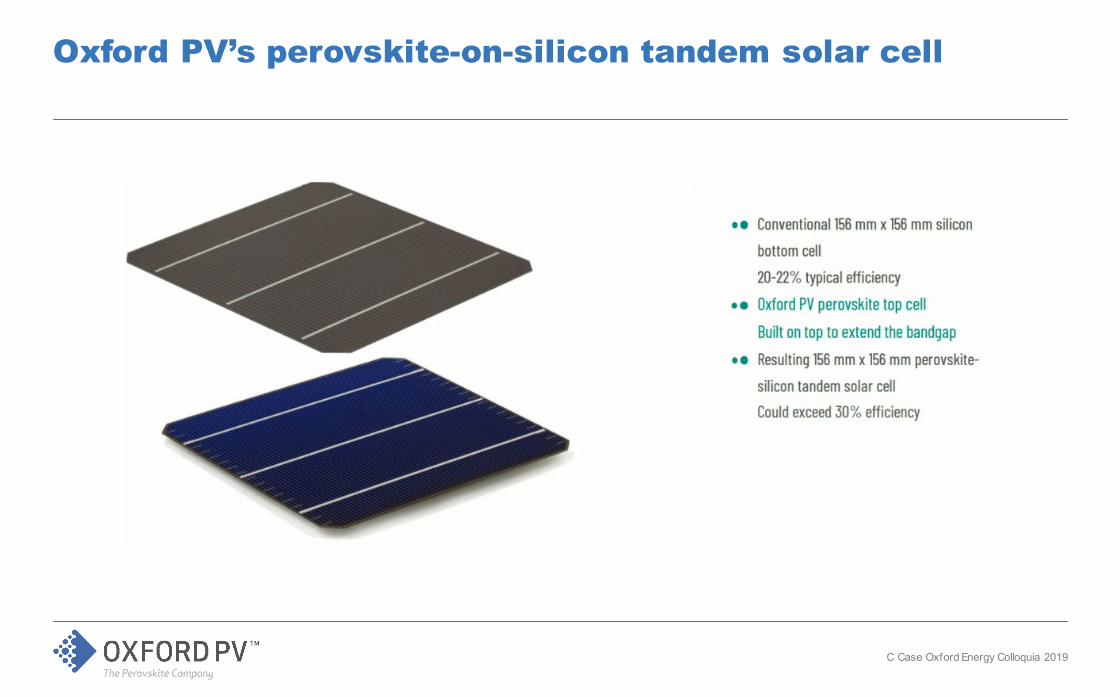
Oxford PV’s perovskite-on-silicon tandem solar cell
C Case Oxford Energy Colloquia 2019
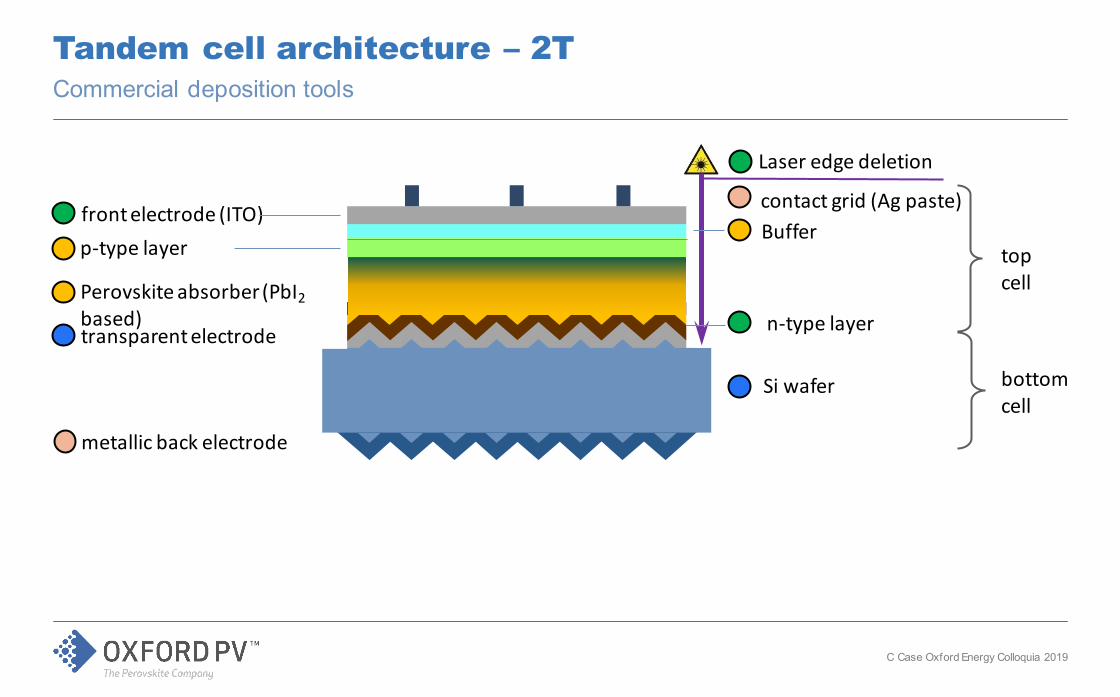
Tandem cell architecture – 2TCommercial deposition tools
contact grid (Ag paste)front electrode (ITO)Buffer
p-type layer
n-type layer
metallic back electrode
top cell
bottomcell
Si wafer
transparent electrode
Laser edge deletion
Perovskite absorber (PbI2based)
C Case Oxford Energy Colloquia 2019
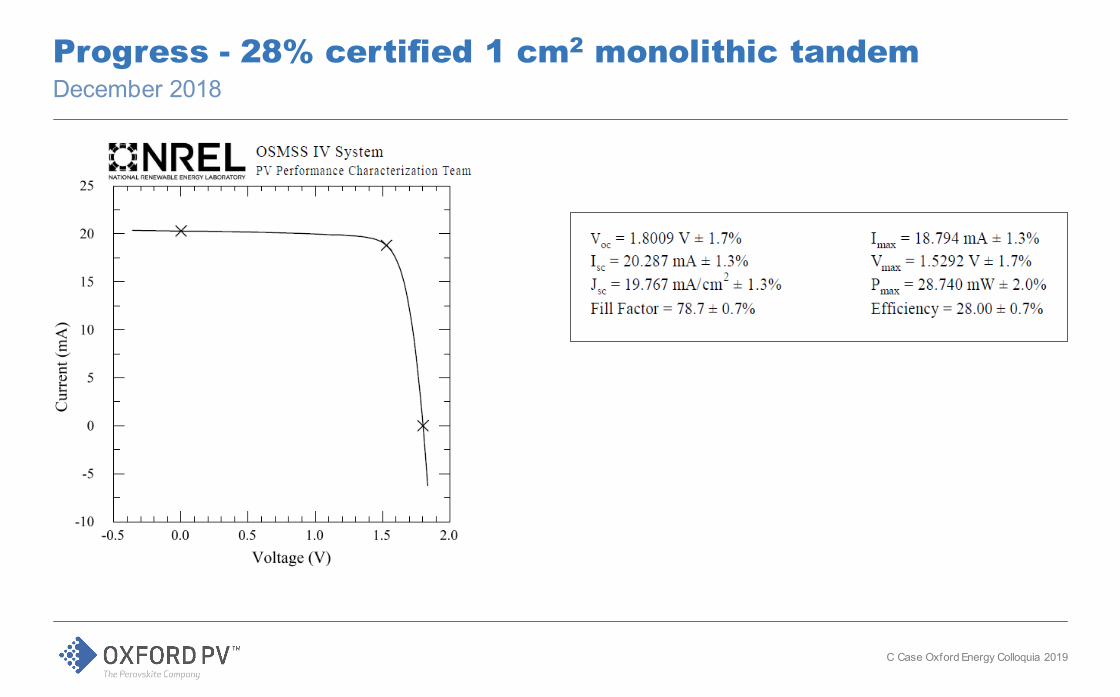
Progress - 28% certified 1 cm2 monolithic tandemDecember 2018
C Case Oxford Energy Colloquia 2019
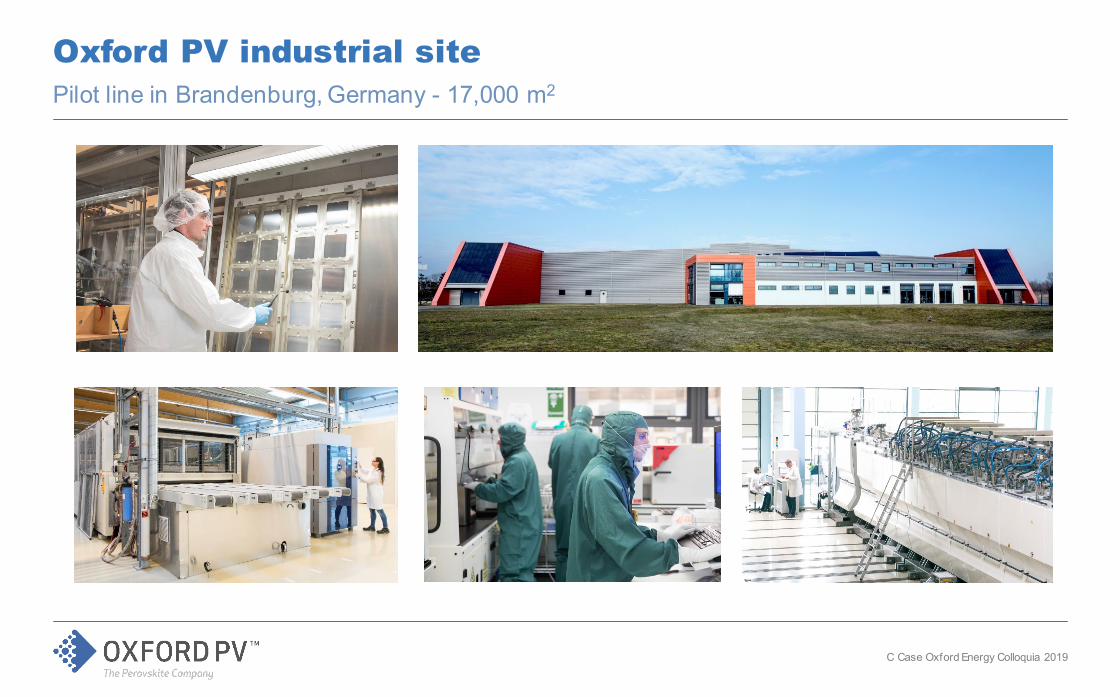
Oxford PV industrial sitePilot line in Brandenburg, Germany - 17,000 m2
C Case Oxford Energy Colloquia 2019
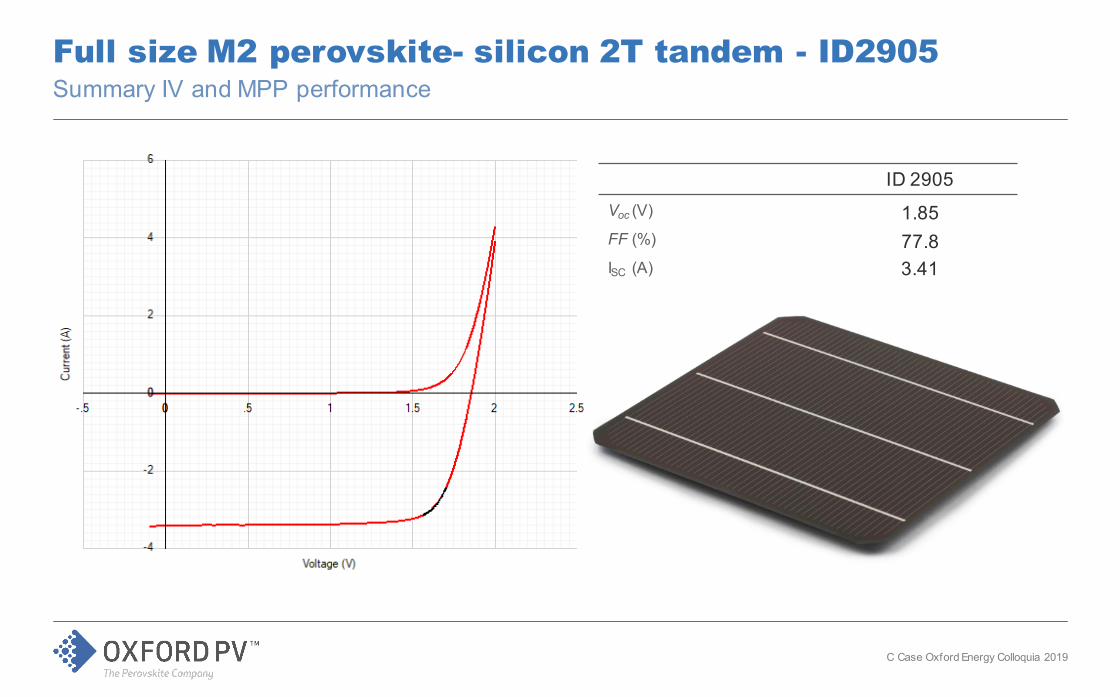
Full size M2 perovskite- silicon 2T tandem - ID2905Summary IV and MPP performance
ID 2905Voc (V) 1.85FF (%) 77.8ISC (A) 3.41
C Case Oxford Energy Colloquia 2019
Private & confidential 47
Costs - LCOE
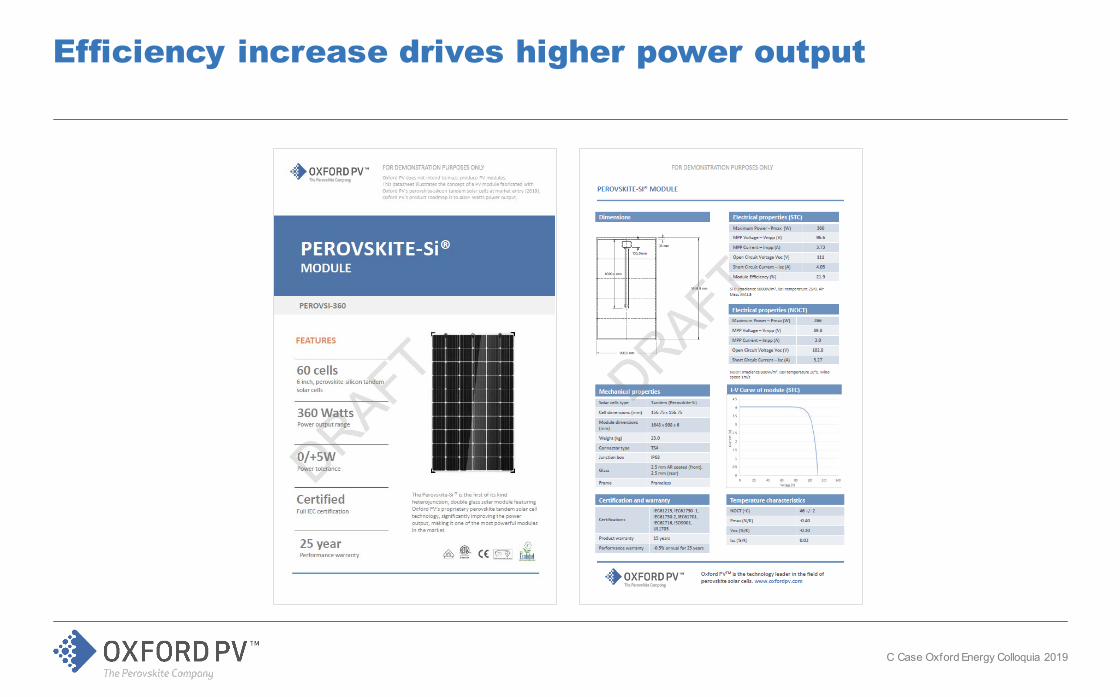
Efficiency increase drives higher power output
C Case Oxford Energy Colloquia 2019
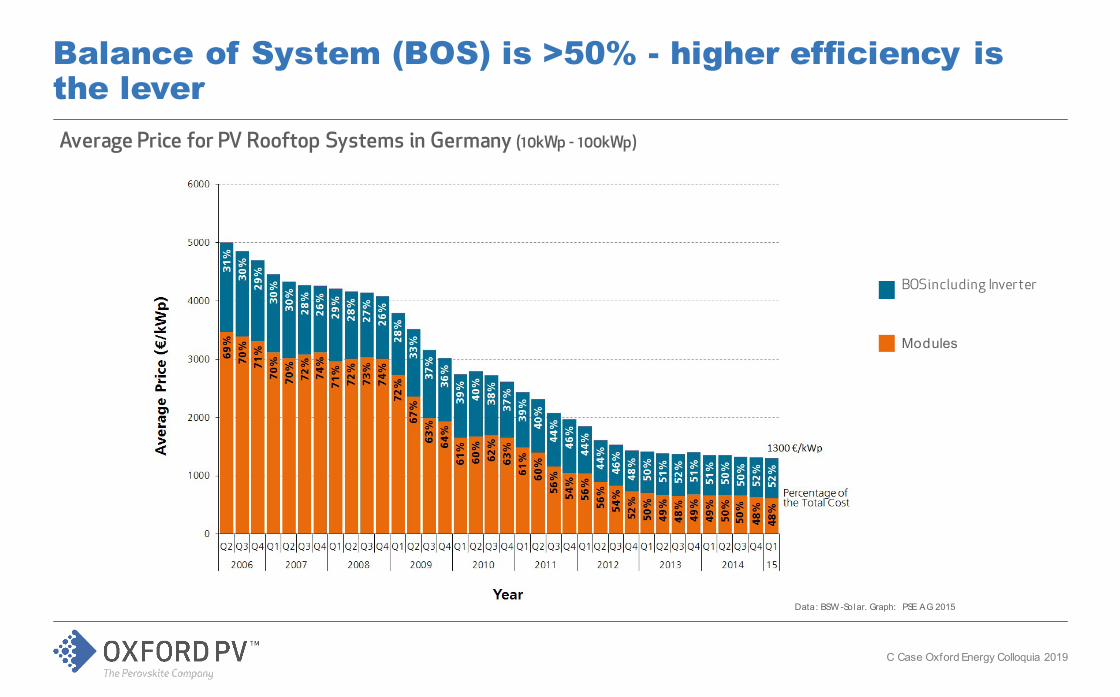
BOSincluding Inverter
Modules
Data: BSW -Solar. Graph: PSE AG 2015
Average Price for PV Rooftop Systems in Germany (10kWp - 100kWp)
Balance of System (BOS) is >50% - higher efficiency is the lever
C Case Oxford Energy Colloquia 2019
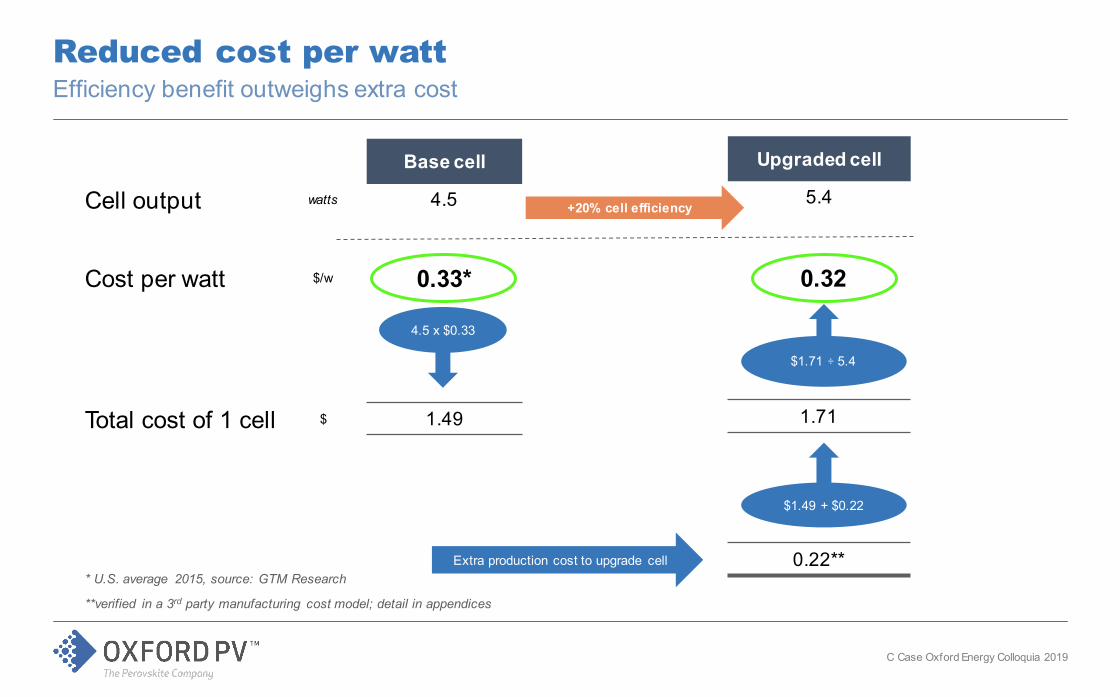
Reduced cost per wattEfficiency benefit outweighs extra cost
Base cell
Cell output watts 4.5
Cost per watt $/w 0.33*
Total cost of 1 cell $ 1.49
Upgraded cell
5.4
0.32
1.71
0.22**
4.5 x $0.33
$1.49 + $0.22
$1.71 ÷ 5.4
+20% cell efficiency
Extra production cost to upgrade cell
**verified in a 3rd party manufacturing cost model; detail in appendices
* U.S. average 2015, source: GTM Research
C Case Oxford Energy Colloquia 2019
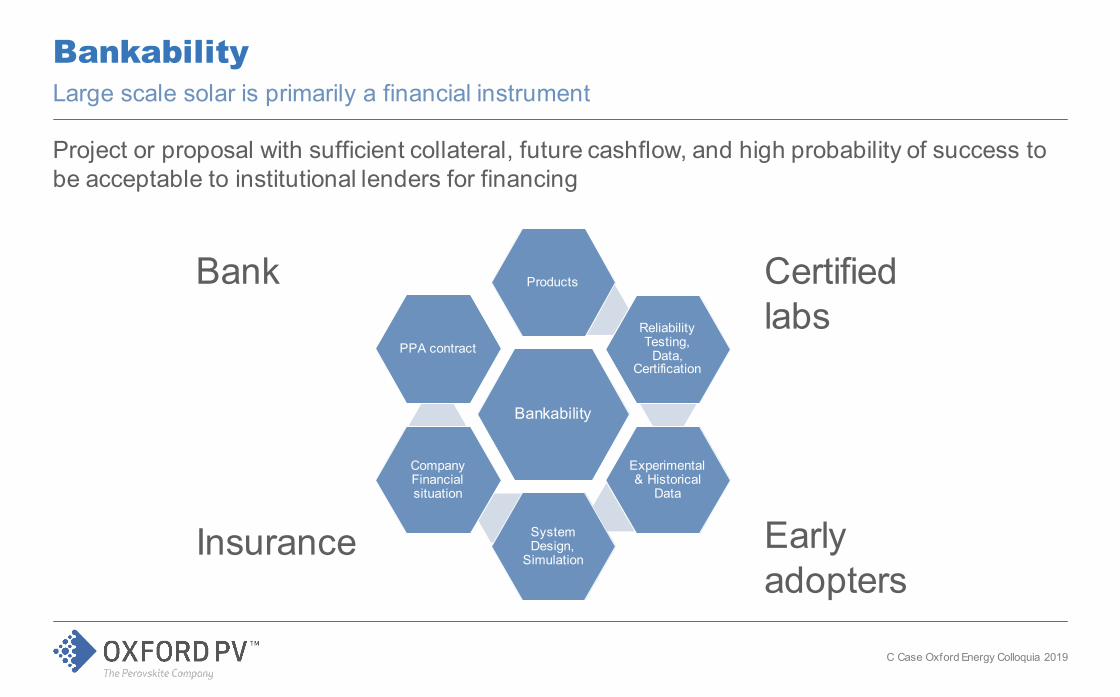
BankabilityLarge scale solar is primarily a financial instrument
Project or proposal with sufficient collateral, future cashflow, and high probability of success to be acceptable to institutional lenders for financing
Bankability
Products
Reliability Testing,
Data, Certification
Experimental & Historical
Data
System Design,
Simulation
Company Financial situation
PPA contract
Early adopters
Certified labs
Bank
Insurance
C Case Oxford Energy Colloquia 2019
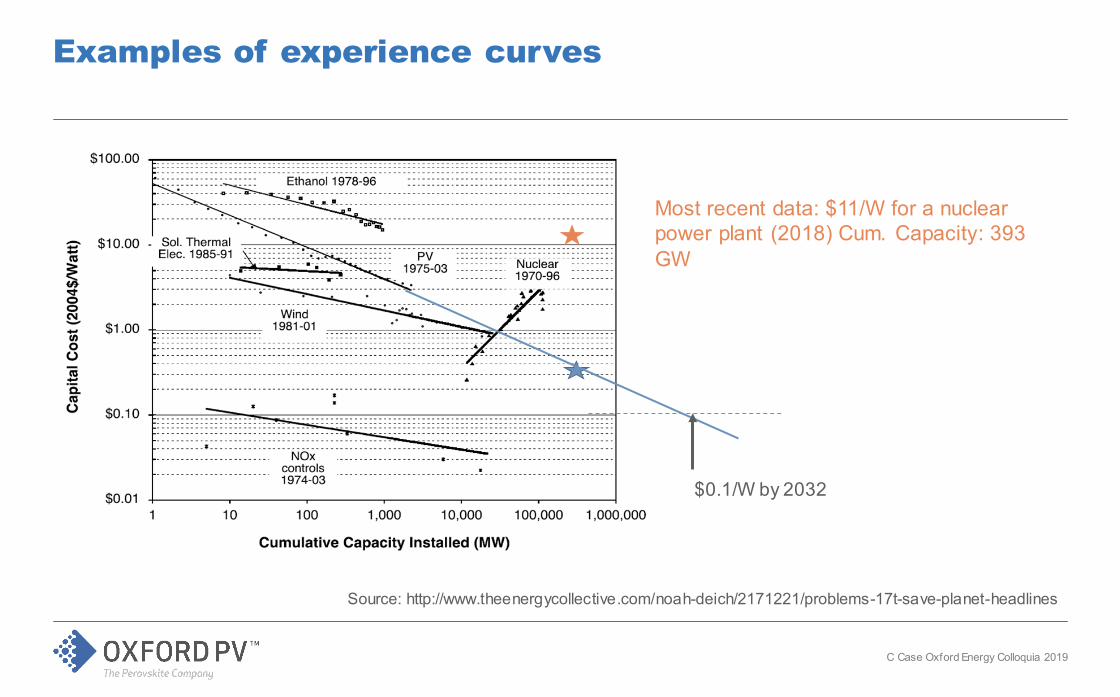
Examples of experience curves
Source: http://www.theenergycollective.com/noah-deich/2171221/problems-17t-save-planet-headlines
$0.1/W by 2032
Most recent data: $11/W for a nuclear power plant (2018) Cum. Capacity: 393 GW
C Case Oxford Energy Colloquia 2019
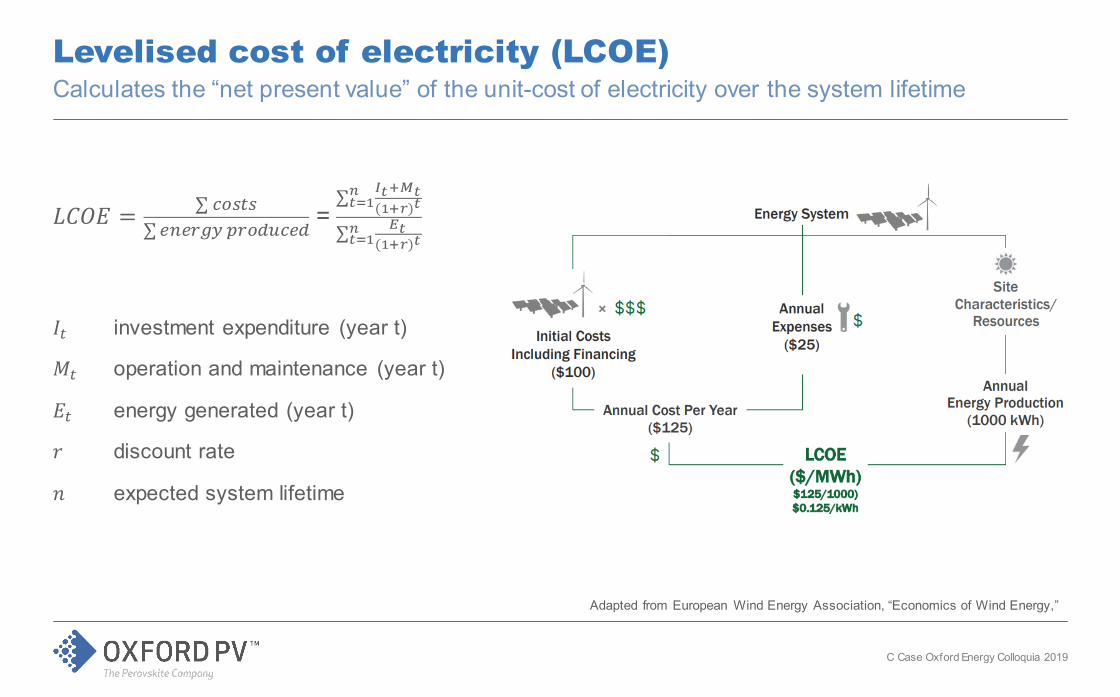
Levelised cost of electricity (LCOE)
𝐿𝐿𝐿𝐿𝐿𝐿𝐿𝐿 = ∑ 𝑐𝑐𝑐𝑐𝑐𝑐𝑐𝑐𝑐𝑐∑ 𝑒𝑒𝑒𝑒𝑒𝑒𝑒𝑒𝑒𝑒𝑒𝑒 𝑝𝑝𝑒𝑒𝑐𝑐𝑝𝑝𝑝𝑝𝑐𝑐𝑒𝑒𝑝𝑝 =
∑𝑡𝑡=1𝑛𝑛 𝐼𝐼𝑡𝑡+𝑀𝑀𝑡𝑡(1+𝑟𝑟)𝑡𝑡
∑𝑡𝑡=1𝑛𝑛 𝐸𝐸𝑡𝑡(1+𝑟𝑟)𝑡𝑡
𝐼𝐼𝑐𝑐 investment expenditure (year t)
𝑀𝑀𝑐𝑐 operation and maintenance (year t)
𝐿𝐿𝑐𝑐 energy generated (year t)
𝑟𝑟 discount rate
𝑛𝑛 expected system lifetime
Calculates the “net present value” of the unit-cost of electricity over the system lifetime
Adapted from European Wind Energy Association, “Economics of Wind Energy,”
C Case Oxford Energy Colloquia 2019
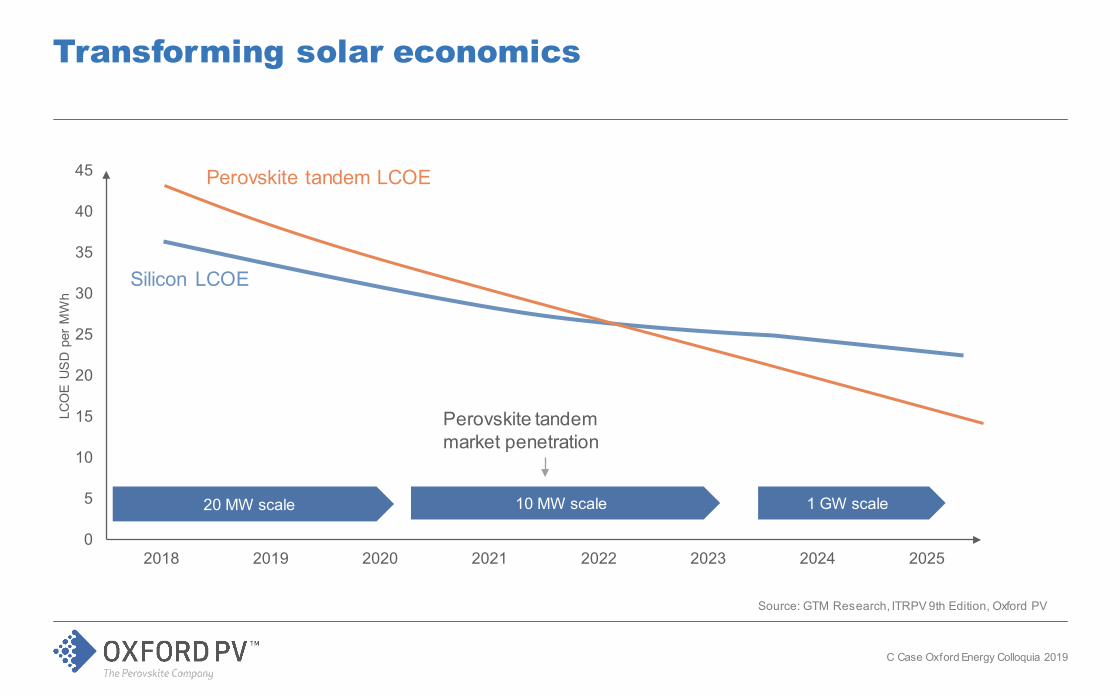
0
5
10
15
20
25
30
35
40
45
2018 2019 2020 2021 2022 2023 2024 2025
LCO
E U
SD
per
MW
h
Perovskite tandem market penetration
20 MW scale 10 MW scale 1 GW scale
Transforming solar economics
Source: GTM Research, ITRPV 9th Edition, Oxford PV
Perovskite tandem LCOE
Silicon LCOE
C Case Oxford Energy Colloquia 2019
Future – 2% - 20% - 100%
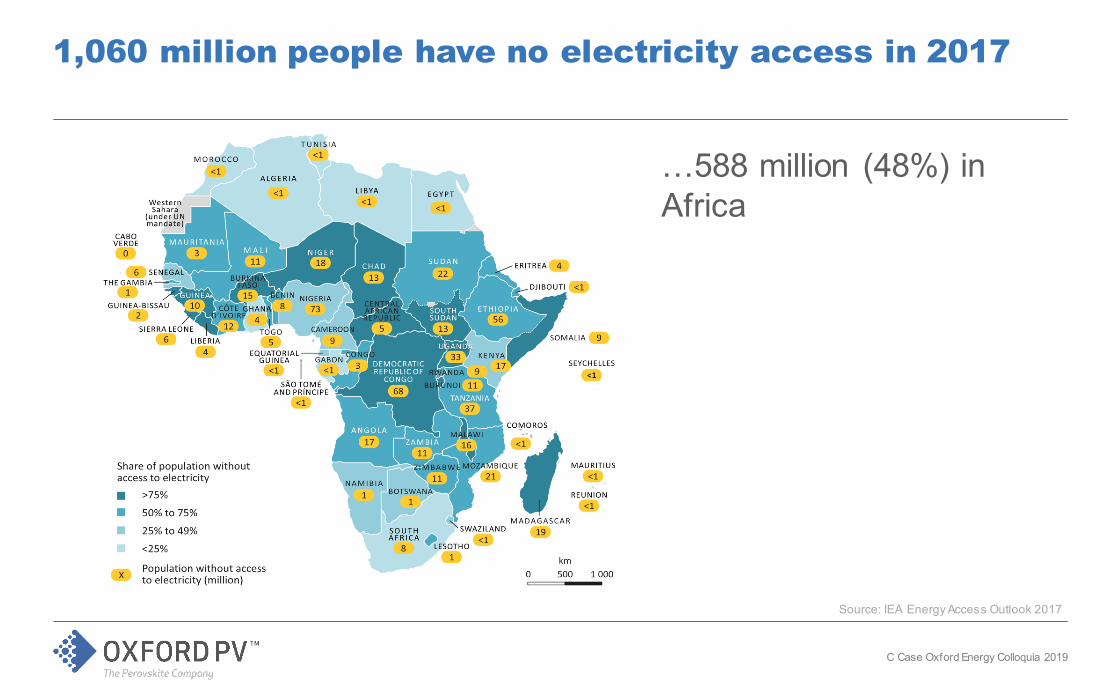
1,060 million people have no electricity access in 2017
Source: IEA Energy Access Outlook 2017
C Case Oxford Energy Colloquia 2019
…588 million (48%) in Africa

Thank you