Embed Size (px)
Citation preview
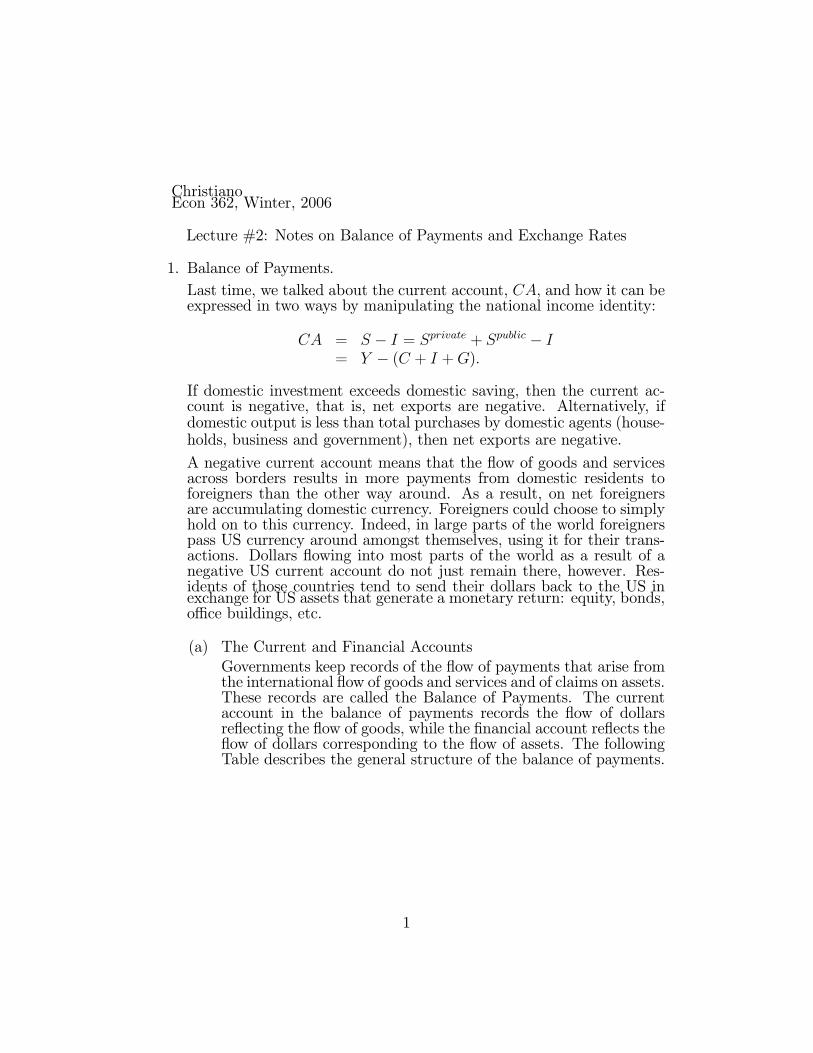
ChristianoEcon 362, Winter, 2006
Lecture #2: Notes on Balance of Payments and Exchange Rates
1. Balance of Payments.
Last time, we talked about the current account, CA, and how it can beexpressed in two ways by manipulating the national income identity:
CA = S − I = Sprivate + Spublic − I= Y − (C + I +G).
If domestic investment exceeds domestic saving, then the current ac-count is negative, that is, net exports are negative. Alternatively, ifdomestic output is less than total purchases by domestic agents (house-holds, business and government), then net exports are negative.
A negative current account means that the flow of goods and servicesacross borders results in more payments from domestic residents toforeigners than the other way around. As a result, on net foreignersare accumulating domestic currency. Foreigners could choose to simplyhold on to this currency. Indeed, in large parts of the world foreignerspass US currency around amongst themselves, using it for their trans-actions. Dollars flowing into most parts of the world as a result of anegative US current account do not just remain there, however. Res-idents of those countries tend to send their dollars back to the US inexchange for US assets that generate a monetary return: equity, bonds,office buildings, etc.
(a) The Current and Financial AccountsGovernments keep records of the flow of payments that arise fromthe international flow of goods and services and of claims on assets.These records are called the Balance of Payments. The currentaccount in the balance of payments records the flow of dollarsreflecting the flow of goods, while the financial account reflects theflow of dollars corresponding to the flow of assets. The followingTable describes the general structure of the balance of payments.
1

Balance of PaymentsCurrent Account
Credit Debit(1) Exports +
Merchandise and Services +Investment Income Received +
(2) Imports -Merchandise and Services -Investment Income Paid -
Financial Account(3) Increase in US Holdings -of Assets Located Abroad(“US Assets Held Abroad”)(4) Increase in Foreign Holdings +of Assets Located in US(“Foreign Assets Held in US”)
A ‘+’ indicates a positive number which corresponds to a paymentby foreigners to the US. A ‘-’ indicates a negative number, andcorresponds to a payment by US residents to foreigners. For ex-ample, suppose that in one year exports were zero, while importswere $100. No investment income flows across borders. Thus,there is an entry of 0 in the Exports row, and its two subcompo-nents. There is a -$100 in the Imports row and in the subcompo-nent that corresponds to Merchandise and Services. The currentaccount, which is exports minus imports, is -$100. The financialaccount records the flow of assets. The extra $100 accumulated byforeigners could be held in currency form, or in the form of foreignholdings of US bank deposits. Or, it could be exchanged for an-other US asset, one which generates earnings. Either way, there isan entry for $100 in the row corresponding to ‘Increase in ForeignHoldings of Assets Located in the US’. Sometimes this entry isabbreviated in the way indicated in parentheses. The abbrevia-tion is somewhat confusing, but it is the one that is adopted inofficial tables published by the US government. The phrase, ‘cur-rent account’, sometimes refers to the first part of the above table.At other times it is used to refer to a number. In this case, thenumber is the sum, (1) + (2). Similarly with the phrase, ‘financialaccount’. Sometimes it is used to refer to the second part of theabove table. At other times it is used to refer to a number. Inthis case, it refers to (3) + (4). Obviously, when the table is con-
2

structed correctly, the current account plus the financial accountmust sum to zero. In practice, since sources for the entries in thefinancial and current account differ, these two do not sum to zero.The difference is called ‘statistical discrepancy’. The statisticaldiscrepancy is usually quite large.The balance of payments in the previous example looks like this:
Balance of PaymentsCurrent Account
Credit Debit(1) Exports 0
Merchandise and Services 0Investment Income Received 0
(2) Imports -100Merchandise and Services -100Investment Income Paid 0
Financial Account(3) Increase in US Holdings 0of Assets Located Abroad(“US Assets Held Abroad”)(4) Increase in Foreign Holdings 100of Assets Located in US(“Foreign Assets Held in US”)
(b) Investment IncomeLet’s think about the ‘investment income’ terms in the currentaccount. Investment income received corresponds to earnings onassets (equity, bonds, buildings, etc.) held by domestic residentsthat are located abroad. We can illustrate this by thinking aboutthe world economy of the previous example in later years. Supposethat in later years merchandise exports and merchandise importsare both zero. Suppose that in the first year, the increase in foreignholdings of assets located in the US corresponds to holdings byforeigners of US government debt that pays 5% per year. Thus, inthe next year, the current account is −$5, corresponding to the $5in investment income paid. These $5 flowing abroad correspondto a $5 increase in foreign holdings of assets located in the US.Thus, the balance of payments in the next year looks like this:
3

Balance of PaymentsCurrent Account
Credit Debit(1) Exports 0
Merchandise and Services 0Investment Income Received 0
(2) Imports -5Merchandise and Services 0Investment Income Paid -5
Financial Account(3) Increase in US Holdings 0of Assets Located Abroad(“US Assets Held Abroad”)(4) Increase in Foreign Holdings 5of Assets Located in US(“Foreign Assets Held in US”)
Note, again, how the financial and current accounts sum to zero.Notice that eventually there must be a rise in net exports to payfor loan in the first year. Otherwise, the current account willtend to spiral off to minus infinity (think about why this wouldhappen).
(c) ExamplesThe lifecycle of a typical person can be used to illustrate the basicideas in balance of payments. Young people typical run currentaccount deficits: their ‘merchandise imports’ (i.e., purchases ofnew homes and consumer durables like cars and appliances) ex-ceed their ‘merchandise exports’ (i.e., sales of their services). As aresult of this negative current account, foreigners (i.e., banks) ac-cumulate claims (e.g., mortgages, car loans) on them, which theyhave to make payments on (i.e, investment income paid), whichadds to the current account deficit. As the person grows older,exports of merchandise increase and they start developing a mer-chandise trade surplus. Eventually the surplus exceeds the deficitin the current account from investment income paid, and the cur-rent account itself turns into a surplus. At this point, the personis starting to accumulate more claims on foreigners than the otherway around. Finally, in old age merchandise exports drop to zerowhen the household retires and income drops to zero. Although atthis point there is a huge deficit in net merchandise exports, the
4

current account might nevertheless still be in surplus. This wouldbe the case if the person’s investment income exceeded their mer-chandise imports. For a slightly more detailed treatment of theideas in this paragraph, see the first set of four figures attachedto these notes.This model of the dynamics of the current and financial accountis sometimes applied to countries. For example, the US was ayoung country in the middle of the 19th century when it beganits industrial revolution. Merchandise exports were very negativeand so was the current account. Foreigners accumulated claims onthe US quickly. In the late 19th century, the merchandise tradebalance started to go into surplus. However, the current accountwas still negative because investment income paid to foreignerswas large. In the middle 20th century, the US starts to own moreassets abroad than foreigners own in the US, so that net invest-ment income is flowing into the country. At that point, the USis able to have a merchandise trade deficit even with a positivecurrent account.The attached figures give a sense of the direction of the flow offinancial capital in the late 19th century. Note how the rich coun-tries then, Britain, France and Germany, experienced capital out-flows (see Figure 58). Domestic absorption in those countries -the amount of domestic output ‘absorbed’ by domestic consump-tion, investment and government spending - was less that whatwas produced. So, goods flowed abroad in the form of positive netexports. The financial counterpart of this is that these countriesaccumulated financial claims against the countries with which theyhad export surpluses. That is, these countries ‘experienced a cap-ital outflow’. The second set of figures (Figure 59) gives a sense ofwhich countries received those capital inflows: Australia, Sweden,Canada, Norway, US, and Italy. These countries absorbed moregoods than they produced and the used the capital inflows to payfor the difference. The bar chart in the third figure (Figure 60)gives a sense of the fraction of investment that was financed bycapital inflows in countries that received capital.1 That this is aninteresting statistic is motivated by rewriting the national incomeidentify:
I = S − CA.
When there is a capital inflow, then CA is negative. The left sideof the equality indicates how much financing is required. The rightside indicates the sources: S is domestic saving and −CA(> 0) isforeign ‘saving’ into domestic financial markets. So, the fraction
1These figures are taken from the IMF report available on the course website, with thematerial associated with lecture 1.
5

of investment financed by foreign saving when CA < 0 is −CA/I.The bar chart in the third set of graphs displays−CA/I for severaldifferent countries. Note that nearly 25 percent of Australia’sinvestment was financed by capital inflows in the period 1870-1914. In the case of Canada the figure is much higher, nearly 35percent.Figure 12-2, taken from the text, shows how the net foreign assetpositive of the US has moved with the persistently negative currentaccount over the past couple of decades. The negative currentaccount has caused the foreign asset position to fall.
2 Exchange Rates
(a) Definition: spot exchange rate, s = units of domestic currencyneeded to buy one unit of foreign currency. Appreciation: s ↓,Depreciation: s ↑ . This is the usual definition of s.See the first of the last two attached figures for a graph of theJapanese exchange rate, which emphasizes how volatile the ex-change rate is. Although when exchange rates are defined in theabstract (i.e., without reference to any two particular countries),s always means the domestic currency price of the foreign cur-rency, in practice exceptions are made for individual exchangerates. This is done when, as in the case of the Japanese-Dollar ex-change rate, the normal theoretical practice would involve workingwith tiny numbers. For example, the Japanese-Dollar exchangerate is around 0.008 in the late 1980s, if we use the normal theo-retical convention. To avoid having to talk about such difficult-to-verbalize numbers, in cases like this the exchange rate is defined asunits of the foreign currency per one unit of the domestic currency.This convention is followed in the case of the Japanese exchangerate. So, normally the Japanese exchange rate is presented as itis in the last attached figure.
(b) They move around a lot!
i. Example 1: US dollar, Japanese Yen2
During 1982-1985, the exchange rate was roughly s = 250yen per dollar, after which the dollar depreciated significantly.This is tough on foreigners exporting to the US. Consider a carmanufacturer whose costs of making one car is C = 2millionyen. Suppose the manufacturer was making 10% profits, i.e.,charging 2.2million = (1 + m)C, with m = 0.10. The pricein the US of the car is PUS = (1 + m)C/s = $8, 800. Now,
2Discussion taken from Backus and Roubini’s new book, to be found athttp://equity.stern.nyu.edu/˜nroubini/NOTES/CHAP7.HTM#topicx
6

in the (brief!) period, 1985-mid 1986, the dollar depreciated(Yen appreciated) to 150 yen per dollar. The manufacturerhas a couple of choices:
A. keep the profit margin unchanged and charge (1+m)C/s0 =$14, 667. In this case, the Japanese car maker can expectto lose a lot of market share in the US.
B. keep the US price unchanged. But, then Japanese rev-enues are $8,800×150 = 1.32million yen. This does noteven cover costs, and implies a negative profit margin, asthe following algebraic expression shows:
sPUS
C− 1 = m.
Both margins hurt the exporters. As it turned out, the Japaneseraised US prices only a little. This did not cost them muchmarket share because US automakers raised prices too. It didnot cost a lot in terms of profit margins because of two rea-sons. First, the Japanese found ways to cut costs. Second,they actually started out the period with very high profitmargins (perhaps as high as 50%) due to the effects of theappreciating dollar that preceded 1982.
7

Current Account (Youth) < 0 (balance on merchandise and services)Credit Debit
(1) Exports smallMerchandise and Services smallInvestment Income Received 0
(2) Imports bigMerchandise and Services bigInvestment Income Paid 0
Current Account (Older) < 0 (surplus on mechandise and services)Credit Debit
(1) Exports biggestMerchandise and Services biggestInvestment Income Received 0
(2) Imports 2 big’sMerchandise and Services bigInvestment Income Paid big
In Youth, households have small income, but big expenses. Their incomeis low because this is typical in early career. Expenses are high as theybuy a house, purchase furniture, car, higher education, etc. They have noinvestment income or earnings. When they become a little older their incomejumps, say, to ‘biggest’ > ’big’. They haven’t acquired any financial assets, sotheir investment income is still zero. But, the debts they undertook in youthare catching up to them, so investment income paid is high. Because incomefrom salaries (‘exports of services’) is higher than expenditures, householdshave a surplus on merchandise and services, but still a current account deficitbecause of the interest on debt that they owe.
6

Current Account (Middle Aged) >0Credit Debit
(1) Exports biggestMerchandise and Services biggestInvestment Income Received small
(2) Imports 2 big’sMerchandise and Services bigInvestment Income Paid small
Current Account (Retired) = 0 (big deficit on merchandise and services)Credit Debit
(1) Exports bigMerchandise and Services 0Investment Income Received big
(2) Imports bigMerchandise and Services bigInvestment Income Paid 0
When households move into middle age, they start to run a positivecurrent account. Part of household debt is paid off, and some assets havebeen accumulated, which are starting to generate income. Now there arejust surpluses. In retirement, the household earns zero on merchandise andservices exports but receives a lot on investment income. It still makes bigpurchases of merchandise and services, but pays out no investment income.This household has a zero current account, and a huge deficit on merchandiseand services. In practice, a retired household will actually run a negativecurrent account too, by consuming more than its investment income andrunning down its assets. This strategy has to be pursued with care. If youlive too long and run out of assets, you’ve got problems.
7


1975 1980 1985 1990 1995 2000 2005
3
4
5
6
7
8
9
10
11
x 10-3 Fig 1 - Theoretically 'Normal' Way to Represent Exchange Rate: US Dollar Price of One Japanese Yen
On Average, Dollar Price of Yen Has Gone Up. That is, US Dollar Has Depreciated
Since Mid 1990s, US Dollar has Appreciated

1975 1980 1985 1990 1995 2000 2005
100
150
200
250
300
350
Figure 2 - Customary Way to Present Japanese Exchange Rate: Yen per Dollar
Between December, 1975 and October, 1978, Dollar Fell 40 Percent
Between February 1985 and March 1988, Value of Dollar Fell 50 Percent