Embed Size (px)
Citation preview
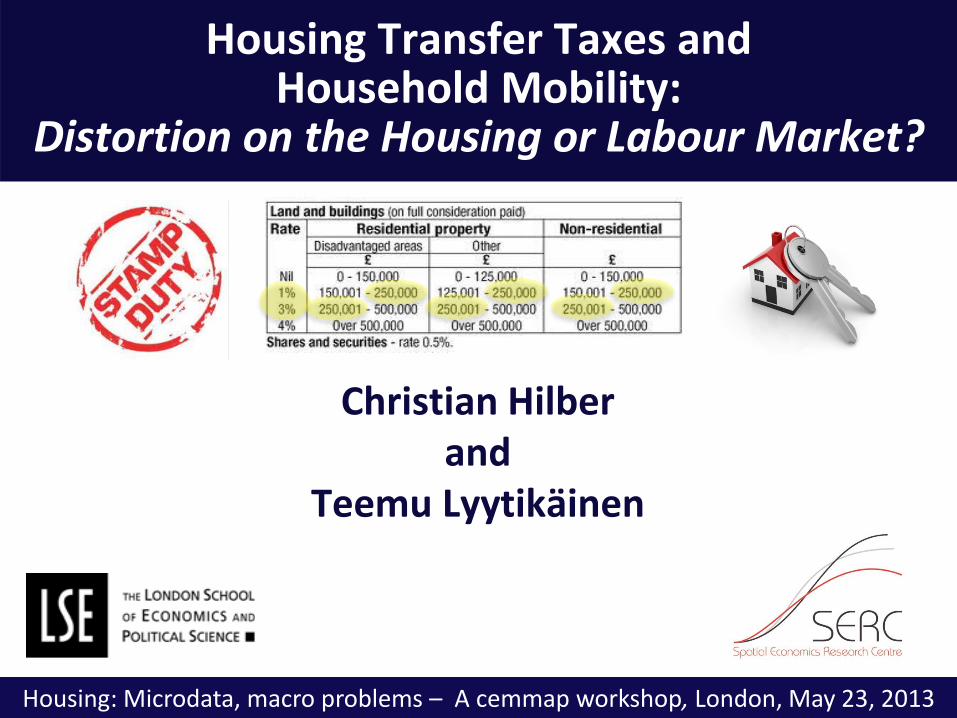
Housing Transfer Taxes and Household Mobility:
Distortion on the Housing or Labour Market?
Christian Hilber and
Teemu Lyytikäinen
Housing: Microdata, macro problems – A cemmap workshop, London, May 23, 2013

Overview
Look at long-term effect of UK stamp duty – a tax on real estate transfers payable by buyer – on actual household mobility Does tax induced increase in relocation costs reduce
mobility? By how much?
Does stamp duty affect housing- and job-related mobility differentially?
How? Use UK micro-data
Exploit discontinuous jump in the tax rate from 1 to 3% at the cut-off house value of £250k
Use this discontinuity to identify effect of stamp duty on mobility
2

Contents
3
1. Motivation
2. UK stamp duty system & theoretical predictions
3. Empirical strategy (RD)
4. Data
5. Evidence and Robustness (including analysis of bunching)
6. Conclusions

Contents
4
1. Motivation
2. UK stamp duty system & theoretical predictions
3. Empirical strategy (RD)
4. Data
5. Evidence and Robustness (including analysis of bunching)
6. Conclusions

Why should we care?
5
1. Taxes on real estate transactions are economically important
UK: 0 – 7% of HVs (generating £8 billion in 08/09)
Not just UK – Most European countries have very substantive tax rates (e.g. Spain: 7%)
US: 0 – 2.2% + local taxes
2. If stamp duty indeed reduces mobility, this can cause wasteful mismatch in housing and labor markets…
Intro/Motivation Setup/Theory Empirical Strategy Data Evidence/Robustness Conclusions & Implications

Mirrlees Review ‘Tax by Design‘ (2011):
6
“By discouraging mutually beneficial transactions, stamp duty ensures that properties are not held by the people who value them most. It creates a disincentive for people to move house, thereby leading to potential inflexibilities in the labour market and encouraging people to live […] in properties of a size and in a location that they may well not otherwise have chosen.”
Intro/Motivation Setup/Theory Empirical Strategy Data Evidence/Robustness Conclusions & Implications
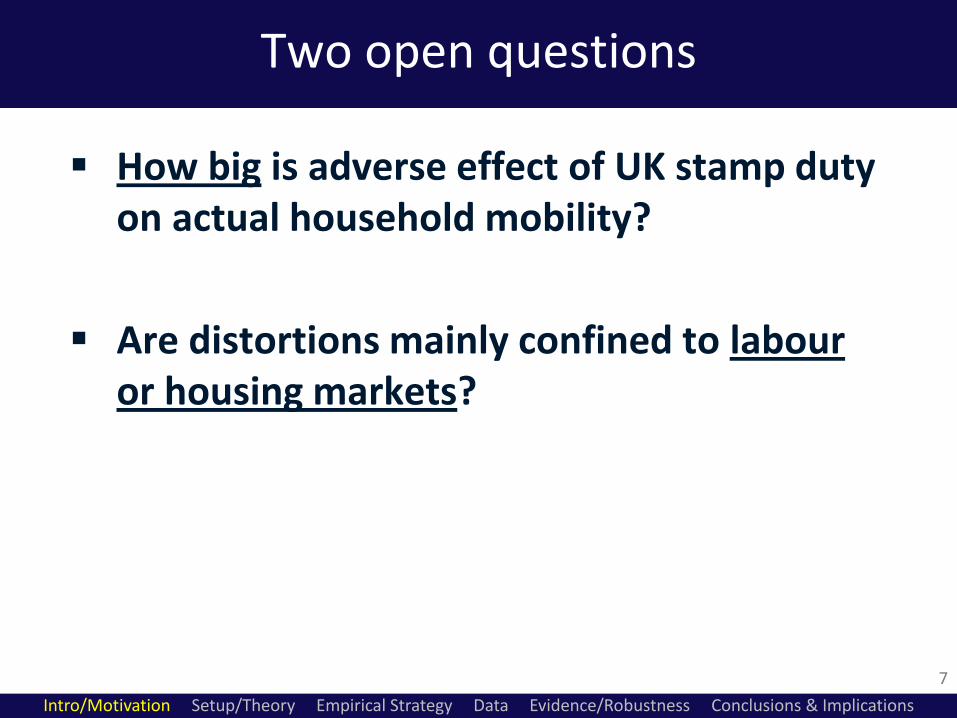
Two open questions
7
How big is adverse effect of UK stamp duty on actual household mobility?
Are distortions mainly confined to labour or housing markets?
Intro/Motivation Setup/Theory Empirical Strategy Data Evidence/Robustness Conclusions & Implications
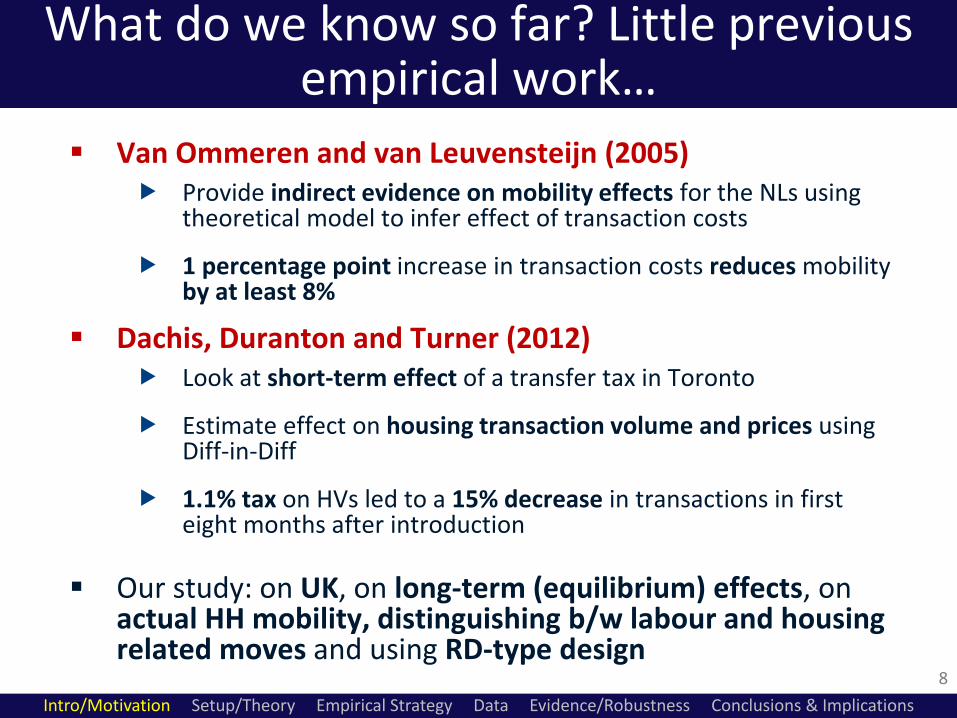
What do we know so far? Little previous empirical work…
8
Van Ommeren and van Leuvensteijn (2005) Provide indirect evidence on mobility effects for the NLs using
theoretical model to infer effect of transaction costs
1 percentage point increase in transaction costs reduces mobility by at least 8%
Dachis, Duranton and Turner (2012) Look at short-term effect of a transfer tax in Toronto
Estimate effect on housing transaction volume and prices using Diff-in-Diff
1.1% tax on HVs led to a 15% decrease in transactions in first eight months after introduction
Our study: on UK, on long-term (equilibrium) effects, on actual HH mobility, distinguishing b/w labour and housing related moves and using RD-type design
Intro/Motivation Setup/Theory Empirical Strategy Data Evidence/Robustness Conclusions & Implications

Basic idea: Exploit discontinuity in UK stamp duty tax rate…
Purchase price UK Stamp duty rate (during
our sample period)
Up to £125,000 0%
£125,001 to £250,000 1%
£250,001 to £500,000 3%
Over £500,000 to £1 million 4%
Over £1 million 5%
Our focus is on £250k cut-off for three reasons:
1. Tax jump is big: from £2500 to £7500!
2. Data reasonably dense around it
3. Hasn’t been affected by regional exemptions
Intro/Motivation Setup/Theory Empirical Strategy Data Evidence/Robustness Conclusions & Implications
9
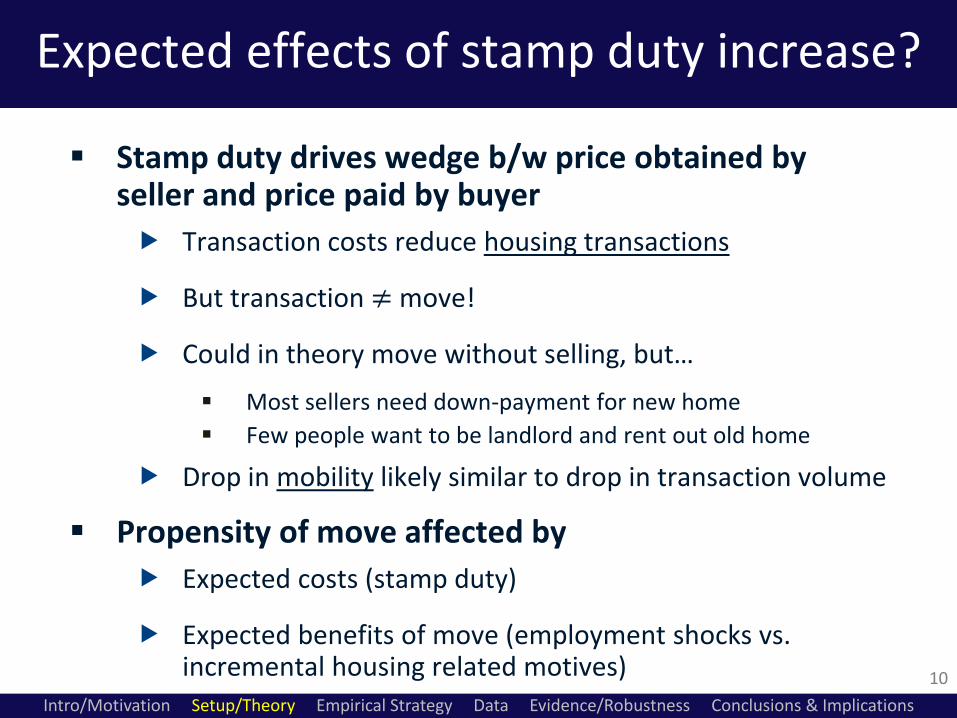
Expected effects of stamp duty increase?
10
Stamp duty drives wedge b/w price obtained by seller and price paid by buyer
Transaction costs reduce housing transactions
But transaction ≠ move!
Could in theory move without selling, but…
Most sellers need down-payment for new home
Few people want to be landlord and rent out old home
Drop in mobility likely similar to drop in transaction volume
Propensity of move affected by
Expected costs (stamp duty)
Expected benefits of move (employment shocks vs. incremental housing related motives)
Basic
economic
intuition
suggests…
Intro/Motivation Setup/Theory Empirical Strategy Data Evidence/Robustness Conclusions & Implications
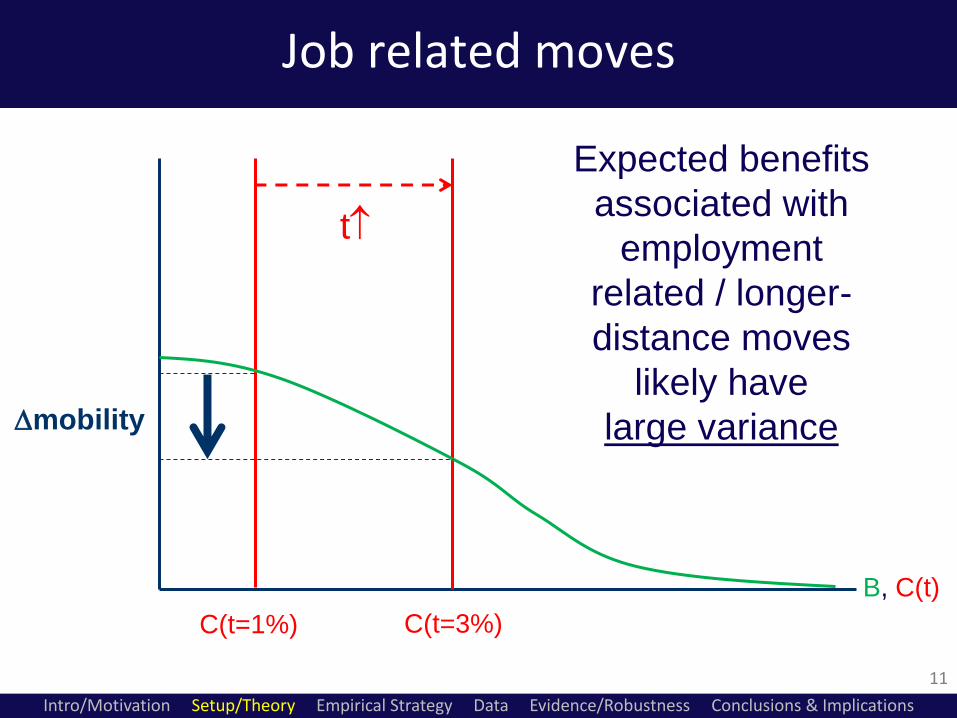
Job related moves
11
B, C(t)
C(t=1%) C(t=3%)
mobility
t
Expected benefits
associated with
employment
related / longer-
distance moves
likely have
large variance
Intro/Motivation Setup/Theory Empirical Strategy Data Evidence/Robustness Conclusions & Implications
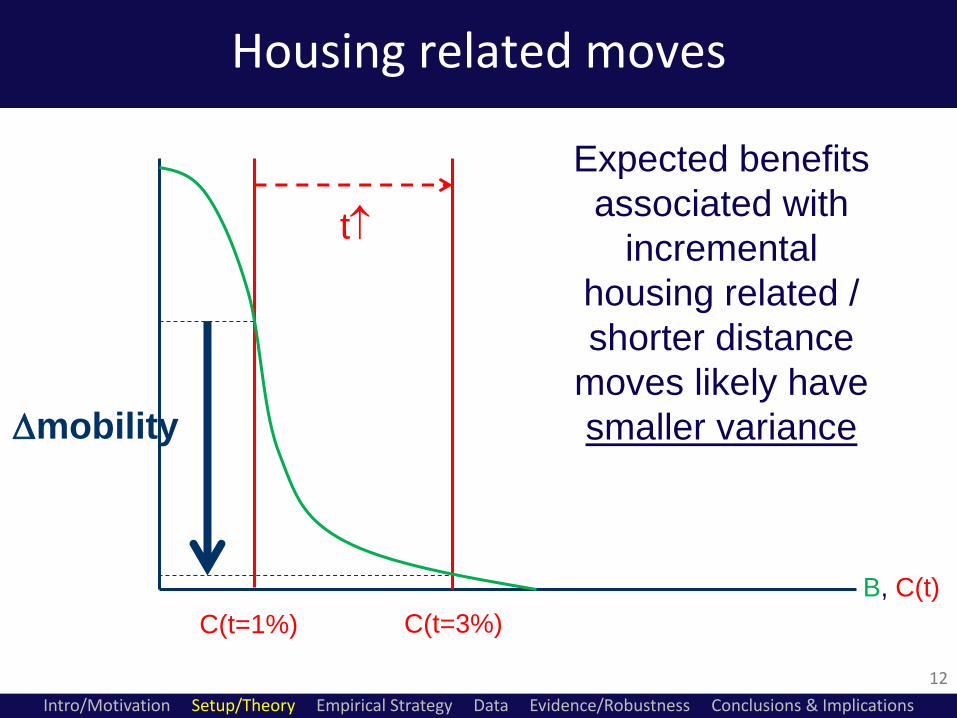
Housing related moves
12
B, C(t)
C(t=1%) C(t=3%)
mobility
t
Expected benefits
associated with
incremental
housing related /
shorter distance
moves likely have
smaller variance
Intro/Motivation Setup/Theory Empirical Strategy Data Evidence/Robustness Conclusions & Implications
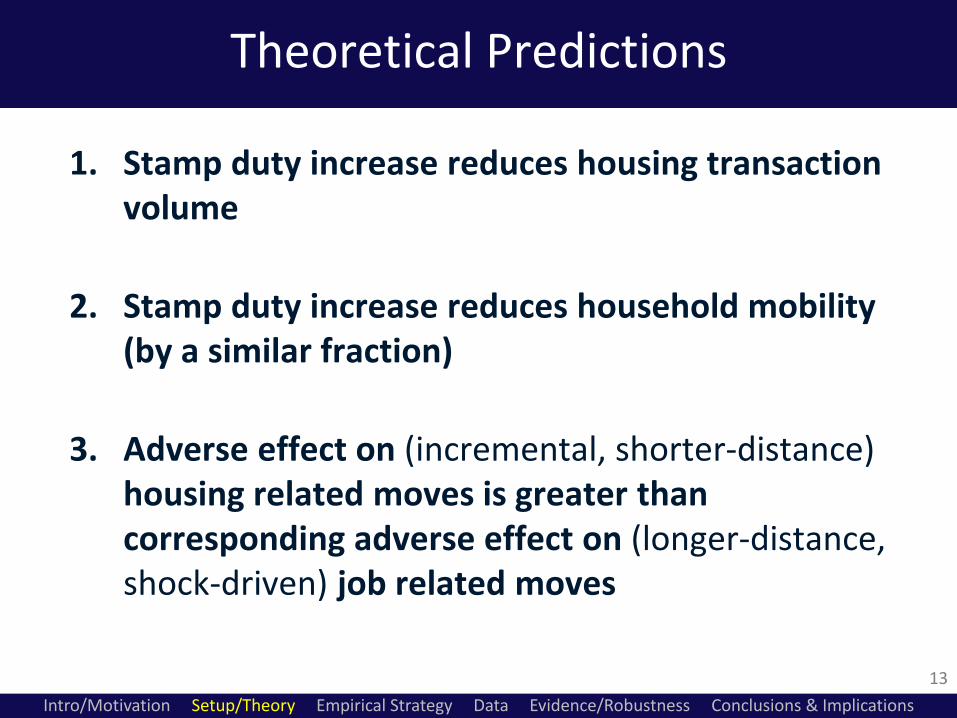
Theoretical Predictions
13
1. Stamp duty increase reduces housing transaction volume
2. Stamp duty increase reduces household mobility (by a similar fraction)
3. Adverse effect on (incremental, shorter-distance) housing related moves is greater than corresponding adverse effect on (longer-distance, shock-driven) job related moves
Intro/Motivation Setup/Theory Empirical Strategy Data Evidence/Robustness Conclusions & Implications
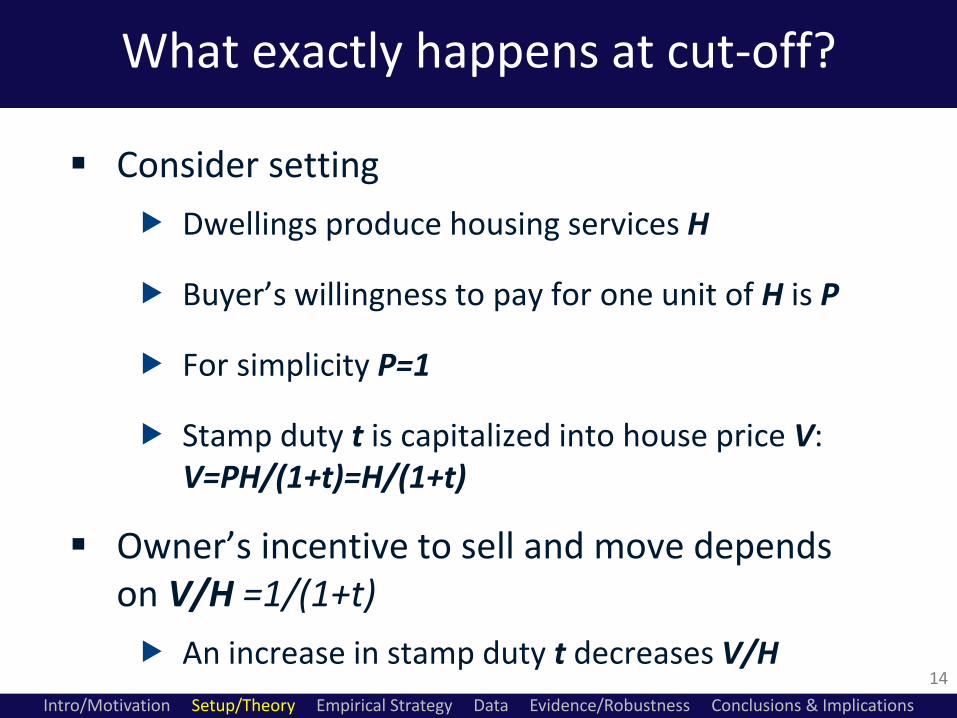
What exactly happens at cut-off?
14
Consider setting
Dwellings produce housing services H
Buyer’s willingness to pay for one unit of H is P
For simplicity P=1
Stamp duty t is capitalized into house price V: V=PH/(1+t)=H/(1+t)
Owner’s incentive to sell and move depends on V/H =1/(1+t)
An increase in stamp duty t decreases V/H
Intro/Motivation Setup/Theory Empirical Strategy Data Evidence/Robustness Conclusions & Implications
0.96
0.965
0.97
0.975
0.98
0.985
0.99
0.995
200,000
210,000
220,000
230,000
240,000
250,000
260,000
270,000
280,000
225,0
00
230,0
00
235,0
00
240,0
00
245,0
00
250,0
00
255,0
00
260,0
00
265,0
00
270,0
00
275,0
00
V/H
Pu
rch
as
e p
ric
e (
V)
Housing services (H)
V
V/H
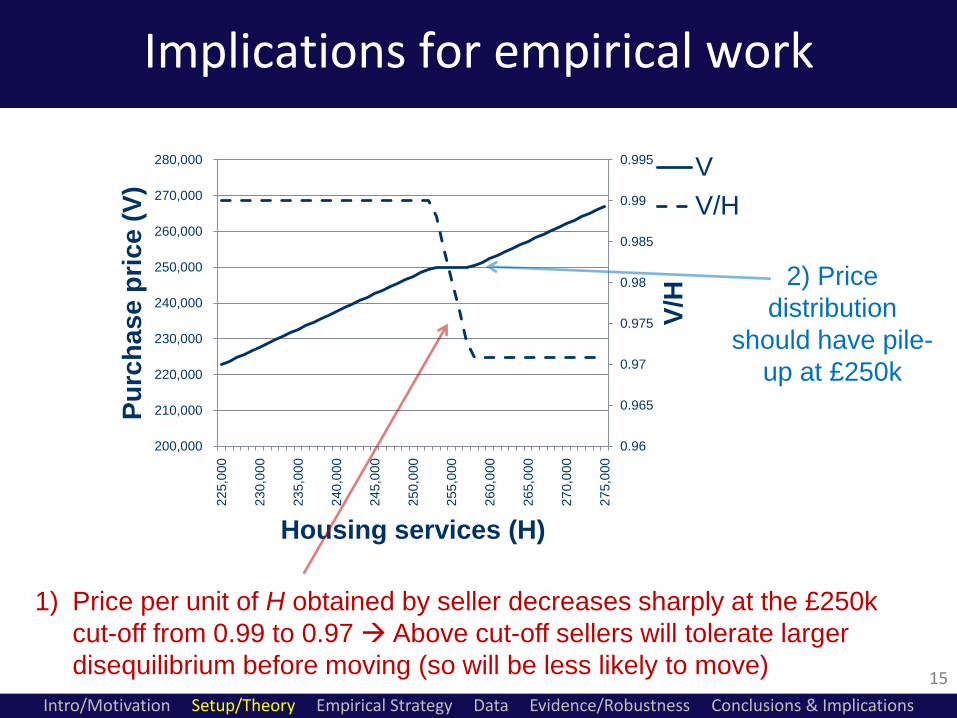
Implications for empirical work
15
1) Price per unit of H obtained by seller decreases sharply at the £250k
cut-off from 0.99 to 0.97 Above cut-off sellers will tolerate larger
disequilibrium before moving (so will be less likely to move)
2) Price
distribution
should have pile-
up at £250k
Intro/Motivation Setup/Theory Empirical Strategy Data Evidence/Robustness Conclusions & Implications
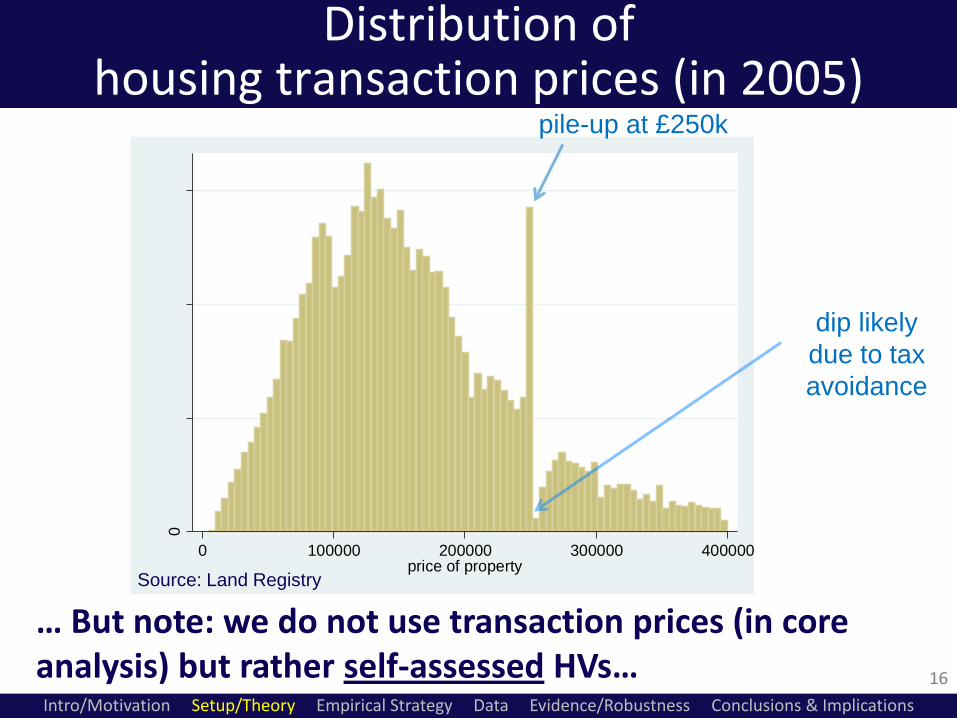
Distribution of housing transaction prices (in 2005)
0
2.0
e-0
64.0
e-0
66.0
e-0
6
De
nsity
0 100000 200000 300000 400000price of property
Source: Land Registry
Intro/Motivation Setup/Theory Empirical Strategy Data Evidence/Robustness Conclusions & Implications
pile-up at £250k
16
… But note: we do not use transaction prices (in core analysis) but rather self-assessed HVs…
dip likely
due to tax
avoidance
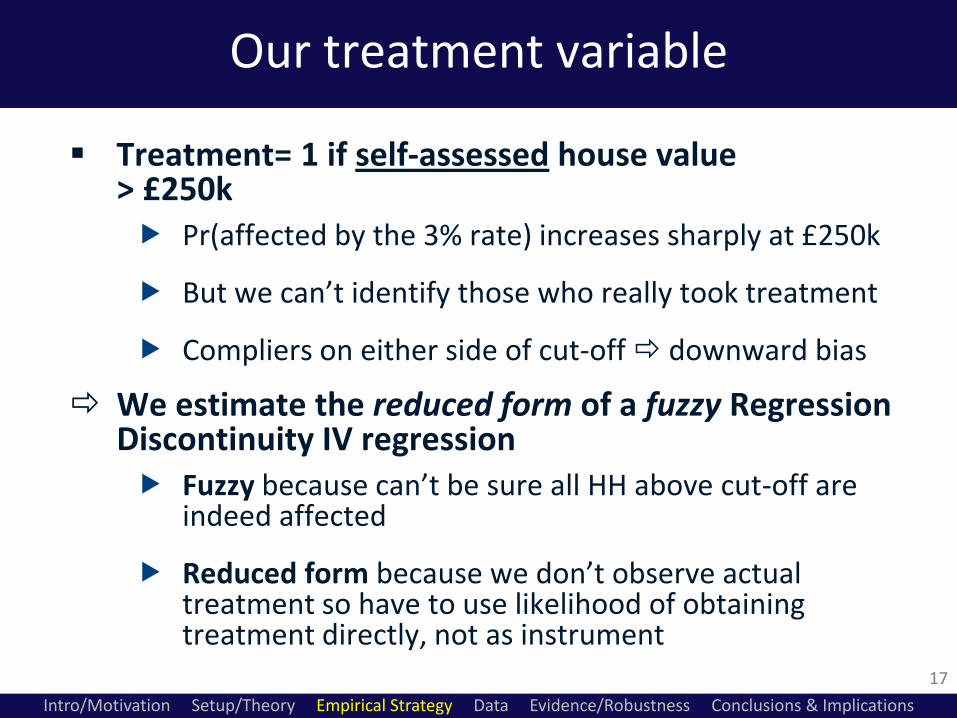
Our treatment variable
Treatment= 1 if self-assessed house value > £250k
Pr(affected by the 3% rate) increases sharply at £250k
But we can’t identify those who really took treatment
Compliers on either side of cut-off downward bias
We estimate the reduced form of a fuzzy Regression Discontinuity IV regression
Fuzzy because can’t be sure all HH above cut-off are indeed affected
Reduced form because we don’t observe actual treatment so have to use likelihood of obtaining treatment directly, not as instrument
Intro/Motivation Setup/Theory Empirical Strategy Data Evidence/Robustness Conclusions & Implications
17

Self assessed house values (in 2005)
People tend to report rounded values but no abnormal pile-up at £250k (unlike in transaction price distribution)
Supports validity of RD design (no precise manipulation of assignment variable)
0
.00
2.0
04
.00
6.0
08
Den
sity
0 100 200 300 400 500value of property: home owners
Intro/Motivation Setup/Theory Empirical Strategy Data Evidence/Robustness Conclusions & Implications
18
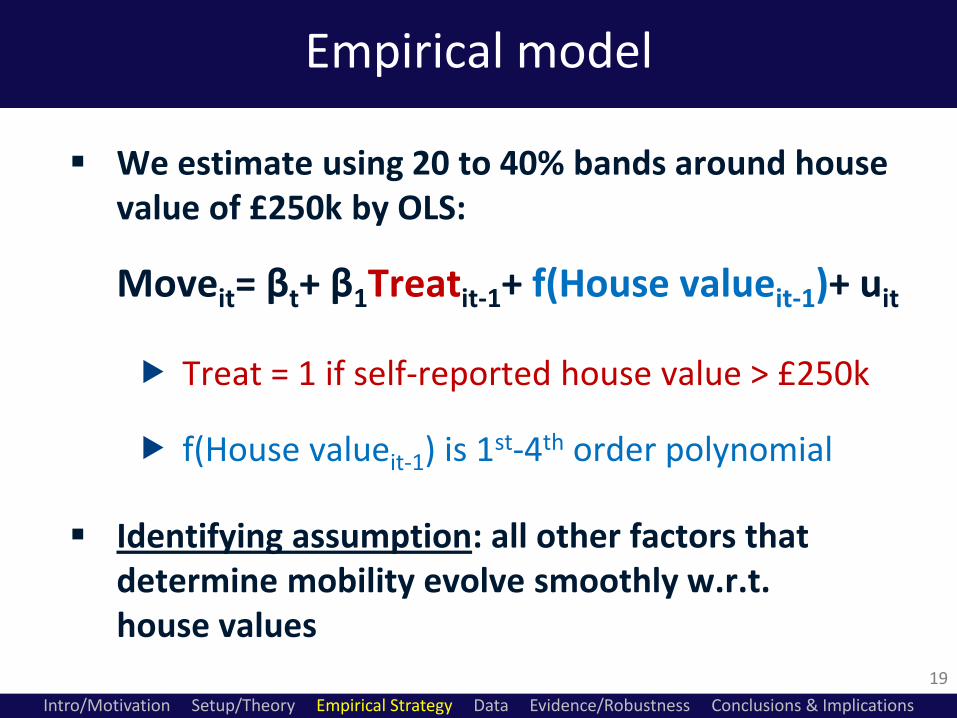
Empirical model
We estimate using 20 to 40% bands around house value of £250k by OLS:
Moveit= βt+ β1Treatit-1+ f(House valueit-1)+ uit
Treat = 1 if self-reported house value > £250k
f(House valueit-1) is 1st-4th order polynomial
Identifying assumption: all other factors that determine mobility evolve smoothly w.r.t. house values
Intro/Motivation Setup/Theory Empirical Strategy Data Evidence/Robustness Conclusions & Implications
19
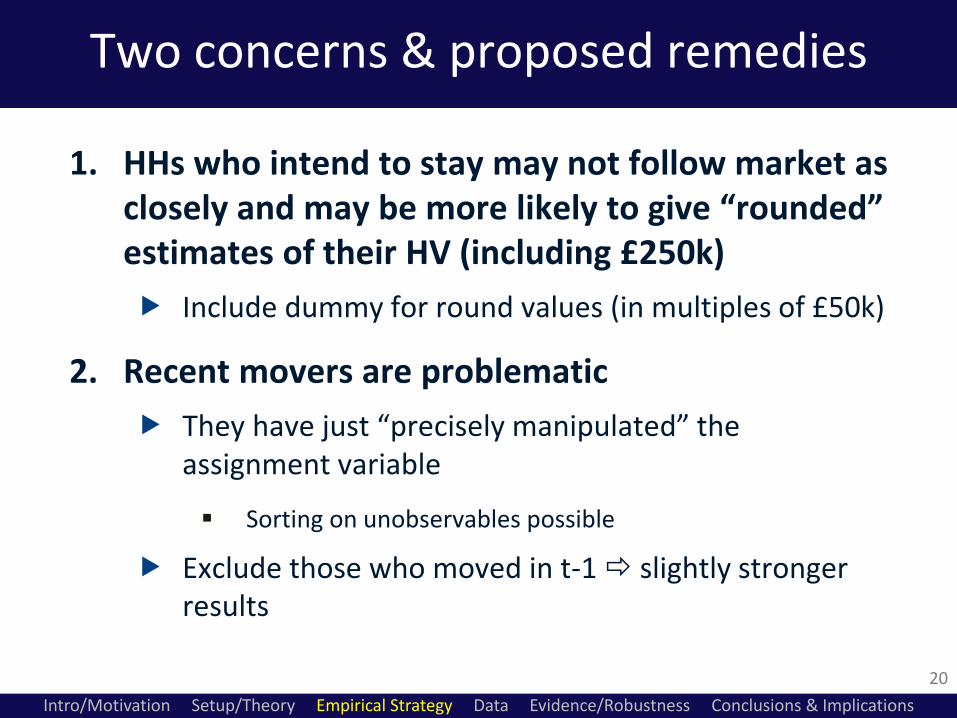
Two concerns & proposed remedies
20
1. HHs who intend to stay may not follow market as closely and may be more likely to give “rounded” estimates of their HV (including £250k)
Include dummy for round values (in multiples of £50k)
2. Recent movers are problematic
They have just “precisely manipulated” the assignment variable
Sorting on unobservables possible
Exclude those who moved in t-1 slightly stronger results
Intro/Motivation Setup/Theory Empirical Strategy Data Evidence/Robustness Conclusions & Implications

Data
British Household Panel Survey (BHPS) Roughly 10,000 HHs annually
Sample period: 2003 to 2008 (2003 = First year with new stamp duty system with stricter control on tax evasion)
Key variables Mover indicator (1/0): 1 if household moved between
interviews in t-1 and t
Self-assessed house values
Arguably, this is relevant HV measure for mobility decisions
Controls Age, kids, HH income, region dummies, GCE A-levels or
higher, bachelor degree or higher, year dummies, dummy for round HVs
Intro/Motivation Setup/Theory Empirical Strategy Data Evidence/Robustness Conclusions & Implications
21
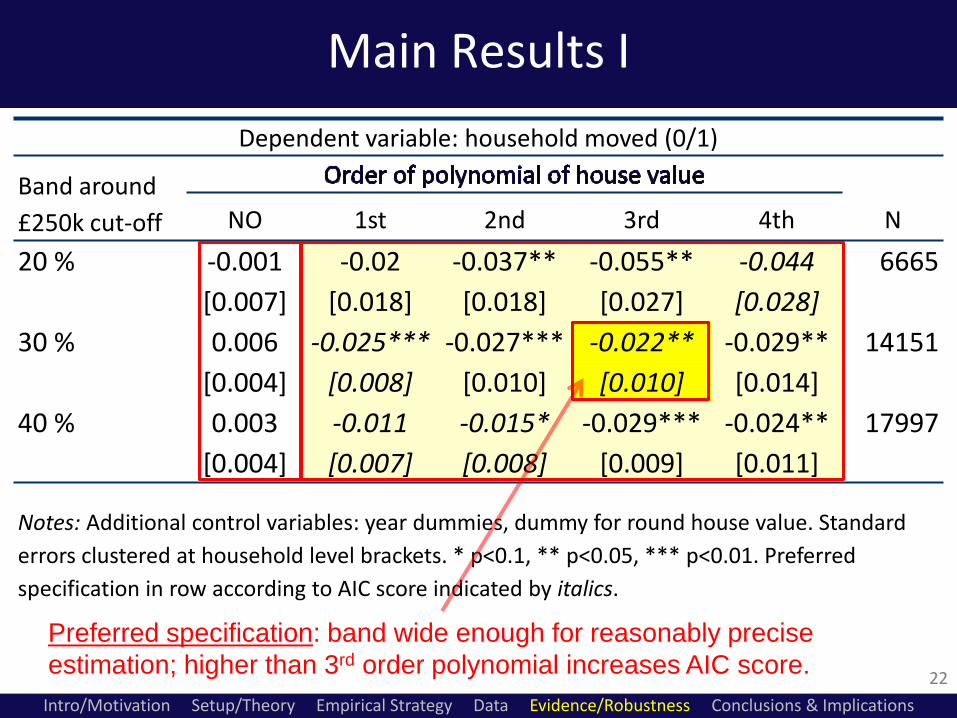
Main Results I
22
Dependent variable: household moved (0/1)
Band around
£250k cut-off
NO 1st 2nd 3rd 4th N
20 % -0.001 -0.02 -0.037** -0.055** -0.044 6665
[0.007] [0.018] [0.018] [0.027] [0.028]
30 % 0.006 -0.025*** -0.027*** -0.022** -0.029** 14151
[0.004] [0.008] [0.010] [0.010] [0.014]
40 % 0.003 -0.011 -0.015* -0.029*** -0.024** 17997
[0.004] [0.007] [0.008] [0.009] [0.011]
Notes: Additional control variables: year dummies, dummy for round house value. Standard
errors clustered at household level brackets. * p<0.1, ** p<0.05, *** p<0.01. Preferred
specification in row according to AIC score indicated by italics.
Preferred specification: band wide enough for reasonably precise
estimation; higher than 3rd order polynomial increases AIC score.
Intro/Motivation Setup/Theory Empirical Strategy Data Evidence/Robustness Conclusions & Implications
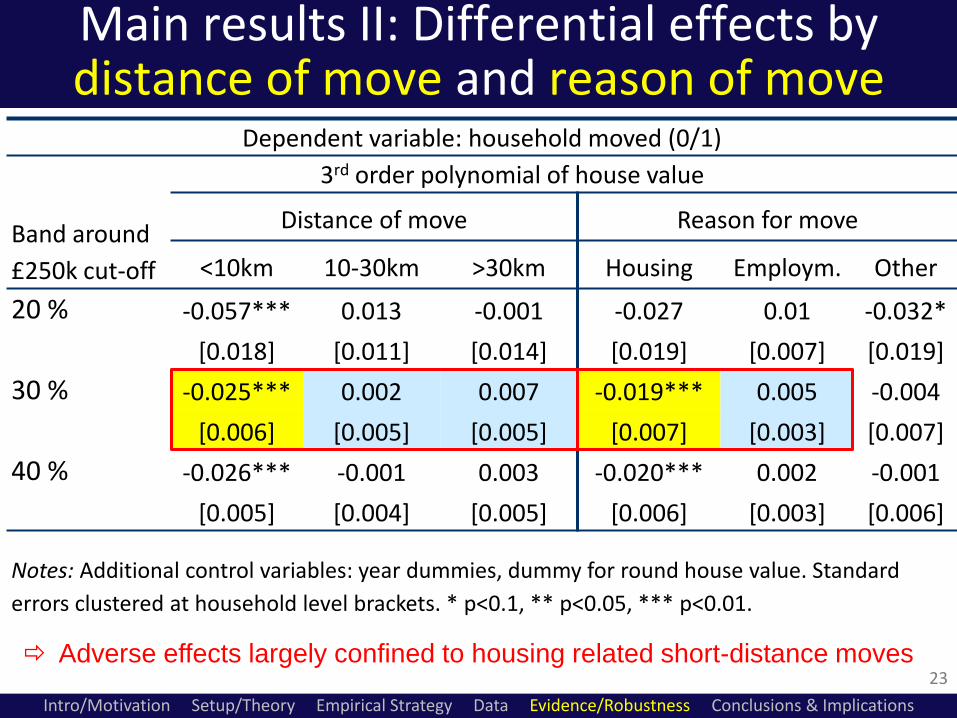
Main results II: Differential effects by distance of move and reason of move
23
Dependent variable: household moved (0/1)
Band around
£250k cut-off
3rd order polynomial of house value
Distance of move Reason for move
<10km 10-30km >30km Housing Employm. Other
20 % -0.057*** 0.013 -0.001 -0.027 0.01 -0.032*
[0.018] [0.011] [0.014] [0.019] [0.007] [0.019]
30 % -0.025*** 0.002 0.007 -0.019*** 0.005 -0.004
[0.006] [0.005] [0.005] [0.007] [0.003] [0.007]
40 % -0.026*** -0.001 0.003 -0.020*** 0.002 -0.001
[0.005] [0.004] [0.005] [0.006] [0.003] [0.006]
Notes: Additional control variables: year dummies, dummy for round house value. Standard
errors clustered at household level brackets. * p<0.1, ** p<0.05, *** p<0.01.
Intro/Motivation Setup/Theory Empirical Strategy Data Evidence/Robustness Conclusions & Implications
Adverse effects largely confined to housing related short-distance moves
Same
findings for
4th order
polynomial
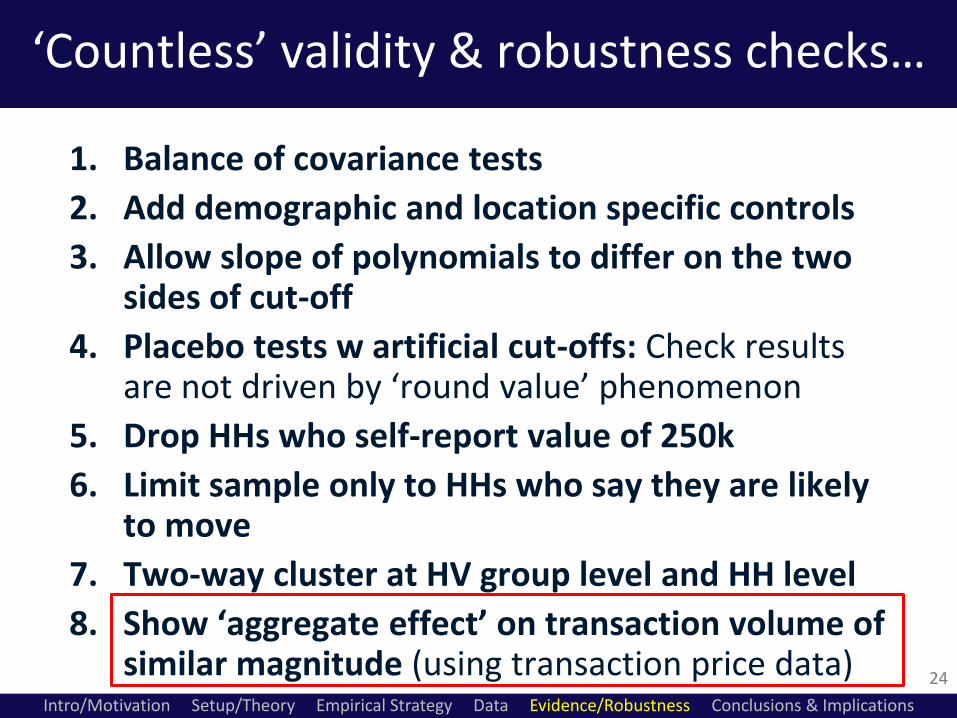
‘Countless’ validity & robustness checks…
24
1. Balance of covariance tests
2. Add demographic and location specific controls
3. Allow slope of polynomials to differ on the two sides of cut-off
4. Placebo tests w artificial cut-offs: Check results are not driven by ‘round value’ phenomenon
5. Drop HHs who self-report value of 250k
6. Limit sample only to HHs who say they are likely to move
7. Two-way cluster at HV group level and HH level
8. Show ‘aggregate effect’ on transaction volume of similar magnitude (using transaction price data)
Intro/Motivation Setup/Theory Empirical Strategy Data Evidence/Robustness Conclusions & Implications
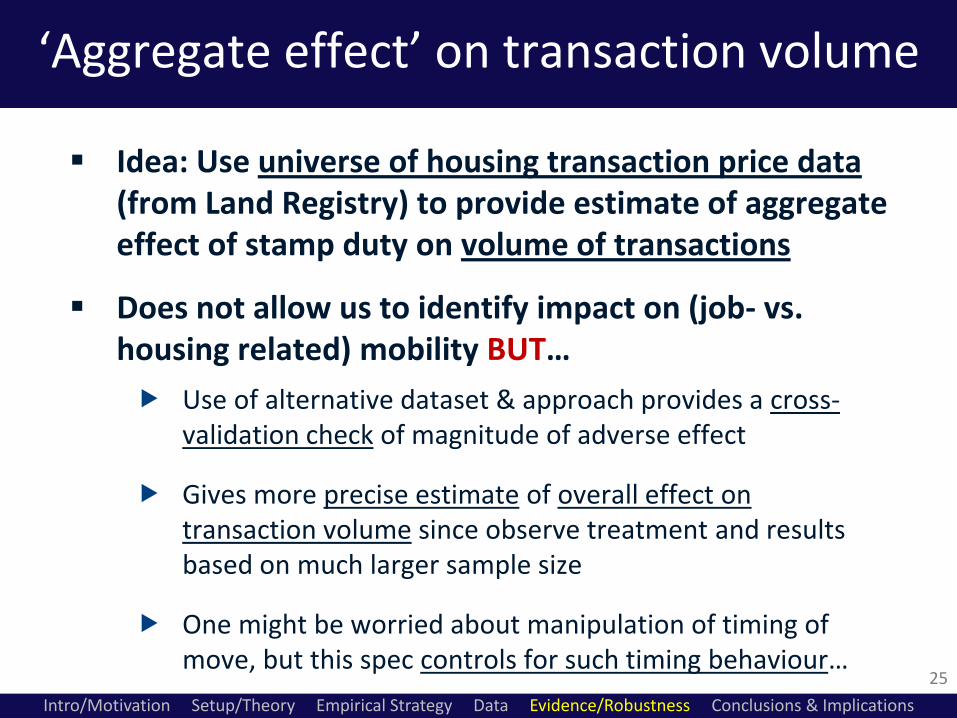
‘Aggregate effect’ on transaction volume
25
Idea: Use universe of housing transaction price data (from Land Registry) to provide estimate of aggregate effect of stamp duty on volume of transactions
Does not allow us to identify impact on (job- vs. housing related) mobility BUT…
Use of alternative dataset & approach provides a cross-validation check of magnitude of adverse effect
Gives more precise estimate of overall effect on transaction volume since observe treatment and results based on much larger sample size
One might be worried about manipulation of timing of move, but this spec controls for such timing behaviour…
Intro/Motivation Setup/Theory Empirical Strategy Data Evidence/Robustness Conclusions & Implications
use alternative
dataset and
approach
(following
literature on
“bunching”)
Assuming delta
mobility similar
to delta
transactions

Empirical model (following literature on ‘bunching’)
Basic idea: Control for bunching behaviour How? Limit sample to transaction prices b/w £150k and £350k,
create £5k wide bins & include controls for bunching
ln(Nit)= βt+ β1Treatjt+ ft(Pricejt)+ λ1 Bin240 + … + λ6 Bin265 + δ1Round50j
+ δ2AfterRound50 j + ujt
Njt … Number of transactions in bin j in year t
Treat = 1 if value of bin > £250k
f(Pricejt) is polynomial of upper bound of bin (shape of polynomial allowed to vary by year)
Control for (i) bins close to cut-off where bunching occurs, (ii) bins with round values, and (iii) bins immediately after round values
26
Intro/Motivation Setup/Theory Empirical Strategy Data Evidence/Robustness Conclusions & Implications
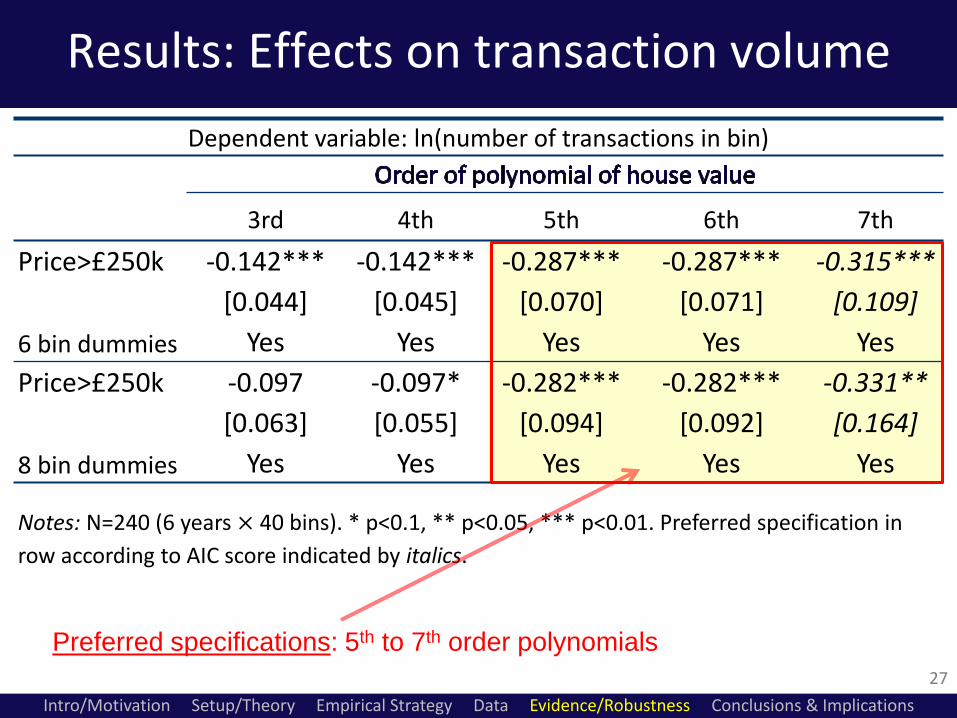
Results: Effects on transaction volume
27
Dependent variable: ln(number of transactions in bin)
3rd 4th 5th 6th 7th
Price>£250k -0.142*** -0.142*** -0.287*** -0.287*** -0.315***
[0.044] [0.045] [0.070] [0.071] [0.109]
6 bin dummies Yes Yes Yes Yes Yes
Price>£250k -0.097 -0.097* -0.282*** -0.282*** -0.331**
[0.063] [0.055] [0.094] [0.092] [0.164]
8 bin dummies Yes Yes Yes Yes Yes
Notes: N=240 (6 years × 40 bins). * p<0.1, ** p<0.05, *** p<0.01. Preferred specification in
row according to AIC score indicated by italics.
Preferred specifications: 5th to 7th order polynomials
Intro/Motivation Setup/Theory Empirical Strategy Data Evidence/Robustness Conclusions & Implications
Conclusions
The UK stamp duty has strong negative effect on actual household mobility 2%-point increase in stamp duty reduces annual rate of
mobility by 2-3 percentage points (~ 40% reduction in propensity to move)
Also find similar adverse effect on transaction volume (~ 30% reduction)
Naïve estimates fail to identify this effect
Effect confined to short-distance and non-job related moves
Implies potentially important welfare losses due to misallocation of housing (rather than labour market mismatch)
Intro/Motivation Setup/Theory Empirical Strategy Data Evidence/Robustness Conclusions & Implications
28

Q & A
Thank you!
Paper downloadable from: http://www.cemmap.ac.uk/forms/Housing%20Conference/
hilber_housingtransfertaxes.pdf
29
Intro/Motivation Setup/Theory Empirical Strategy Data Evidence/Robustness Conclusions & Implications