Embed Size (px)
Citation preview

Chris Baerveldt, Marijtje van Duijn, Lotte Vermeij, Dianne van Hemert
Ethnic Boundaries and Personal Choice
NOSMO, Nijmegen, November 25, 2005.

Research question
Do high school pupils socially discriminate between ethnic groups (in favor of their own)?

What is discrimination?
• Feelings• Prejudices• Negative interactions• Avoidance• Homogenous personal networks• …more than expected given
availability

Availability?
• Who is available?
• The limits of personal network life
• Availability in settings
• Discrimination as a personal characteristic: inclinations
• Classrooms, availability and inclinations

Specific research questions
1. Do pupils have more inter-ethnic relationships with fellow pupils than intra-ethnic relationships?
2. Can this difference be explained by the availability of inter-ethnic and intra-ethnic relationships?
3. Can the difference be explained by personal preferences of intra-ethnic over inter-ethnic relationships?

Data
• Project Baerveldt et al.: Dutch Social Behavior Study (1996)
• 881 MAVO 4 pupils (approx.. age 16) at 19 schools
• questionnaire with individual (pupil) and network variables
• school variables also available→ 19 school networks (with 41-102 actors)

Variables
• Network variables– 10 items on type of relation with other pupils
• Main pupil variables– ethnicity, acculturation– gender– importance friends at school, SES parents
• School variables– number of pupils, composition of year group

Who are your best friends in class?
(fill in codes of fellow pupils, when appropriate)
Other questions:-who do you avoid?-who helps you …?-with whom do you …?
Example network item

Figure 1: A classroom network, defined by friendship ties

Figure 2: Dutch MAVO-4 Students according to ethnic group
6%
5%
64%
17%
8%DutchMorocconTurkishSurinamseOthers

Table 1. Frequencies of ten types of relationships of pupils within the pupil’s network
Type of relationship Number of relationships in
percentages of total
0 1 2 3 4 ego avoids alter 35.0 15.5 10.6 8.7 30.1 ego misbehaves together with alter 68.3 18.1 5.9 3.3 4.4 ego calls alter a best friend 9.0 9.0 16.8 17.3 47.8 ego sees alter also outside school 17.2 29.5 23.6 14.8 14.9 ego compares school results first with alter 21.7 27.9 19.7 15.0 15.7 ego gives alter practical support 25.1 12.9 15.7 14.6 31.7 ego receives practical support from alter 24.7 13.1 13.4 14.7 34.2 ego gives alter emotional support 29.5 14.4 15.9 13.6 26.7 ego receives emotional support from alter 29.0 18.1 17.5 13.1 22.2 ego talks with alter about personal problems 30.7 27.9 20.9 10.0 10.5

Table 2: Emotional support received from fellow pupils, by ethnicity of the source (%).
pupils from the ethnic origins
Dutch Moroccan Turkish Surinamese Others
received support from pupils of different origins
Dutch (N=850) 79 24 11 21 47
Moroccan (N=62) 2 27 8 4 5
Turkish (N=75) 2 19 59 8 6
Surinamese (N=100) 3 8 8 44 12
Others (N=230) 13 22 14 23 30

Table 3: Emotional support received from fellow pupils, in percentages of the number of potential relationships (dyads)
per ethnic category
pupils from the ethnic origins
Dutch Moroccan Turkish Surinamese Others
received support from pupils with different origins
Dutch (N=850) 3.19 1.65 1.19 1.40 2.52
Moroccan (N=62) 1.25 7.36 4.98 2.08 2.58
Turkish (N=75) .47 2.49 13.55 1.70 1.72
Surinamese (N=100) 1.00 1.62 2.46 9.97 2.96
Others (N=230) 1.93 2.24 2.33 3.55 3.91

Figure 3: Discrimination by ethnicity, or by gender, or just an effect of reciprocity?

Assessing social discrimination (1)
• Need to control for – dependence in relations – pupil characteristics – school characteristics
• Analysis per network
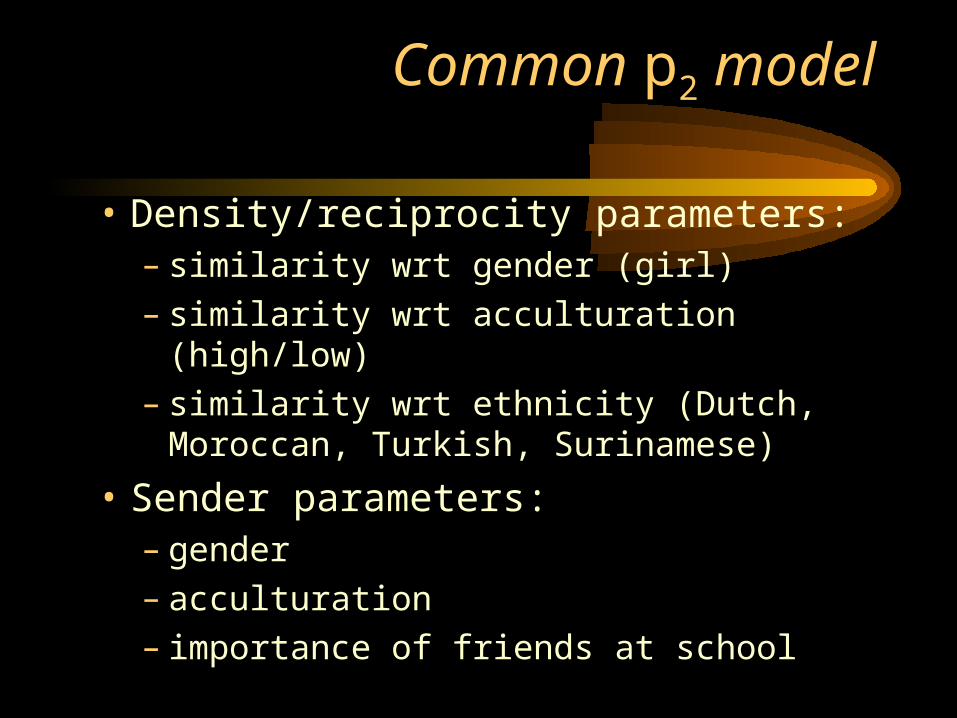
Common p2 model
• Density/reciprocity parameters:– similarity wrt gender (girl)– similarity wrt acculturation (high/low) – similarity wrt ethnicity (Dutch, Moroccan,
Turkish, Surinamese)
• Sender parameters:– gender – acculturation– importance of friends at school

19 networks in p2
Ad hoc method:• Obtain separate parameter estimates for all
schools• Perform meta analysis to
– Test whether estimates are different from zero – Test whether estimates vary over schools and
investigate importance of school characteristics• availability (number of pupils, % Dutch and male pupils) and
• average importance of friendship
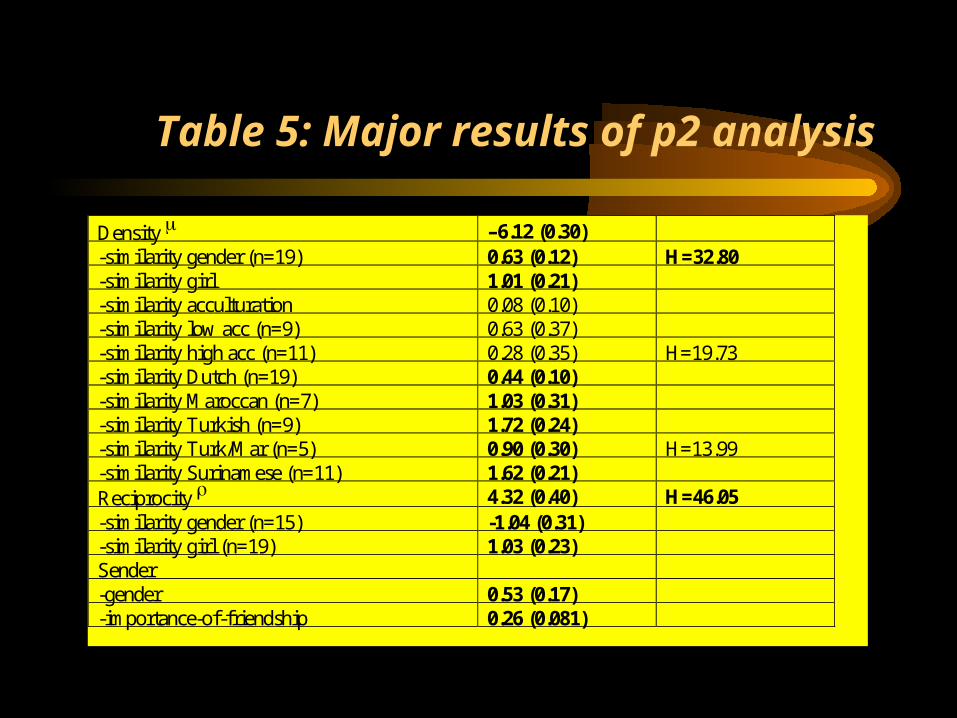
Table 5: Major results of p2 analysis
Density –6.12 (0.30)-similarity gender (n=19) 0.63 (0.12) H=32.80-similarity girl 1.01 (0.21)-similarity acculturation 0.08 (0.10)-similarity low acc (n=9) 0.63 (0.37)-similarity high acc (n=11) 0.28 (0.35) H=19.73-similarity Dutch (n=19) 0.44 (0.10)-similarity Maroccan (n=7) 1.03 (0.31)-similarity Turkish (n=9) 1.72 (0.24)-similarity Turk/Mar (n=5) 0.90 (0.30) H=13.99-similarity Surinamese (n=11) 1.62 (0.21)Reciprocity 4.32 (0.40) H=46.05-similarity gender (n=15) -1.04 (0.31)-similarity girl (n=19) 1.03 (0.23)Sender-gender 0.53 (0.17)-importance-of-friendship 0.26 (0.081)

P2 results-1
• Different from zero:– Similarity: , gender, girl, ethnicity (all)– Reciprocity: , gender, girl, ethnicity
(Turk.)– Sender: gender, importance of friendship,
acculturation (high)– Receiver: acculturation (high,low)
No similarity effects of acculturation Density and similarity effects stronger for girls

P2 results -2
• Some variation over schools
• % Dutch seems to be most important explanatory variable….

Conclusions
• More intra- than inter-ethnic relationships?– True for Dutch but not for minorities
• Differences explained by availability?– Yes for all categories: intra-ethnic relationships are still
more attractive when controlled for by availability
• Discrimination?– Weak but yes for all categories: differences remain
when controlled for by relevant characteristics of actors, dyads and networks.

Discussion
• Added value network approach?
– Information– Theory– Methodology– Only complete
networks!

The End


![[2.3] Horizon 2020 - Rolf Vermeij [3TU.Datacentrum Symposium 2014, Twente]](https://img.pdfslide.us/doc/110x75/5583755dd8b42a6d488b556a/23-horizon-2020-rolf-vermeij-3tudatacentrum-symposium-2014-twente.jpg)