Embed Size (px)
Citation preview
https://doi.org/10.1177/1745691617693393
Perspectives on Psychological Science 1 –23© The Author(s) 2017Reprints and permissions: sagepub.com/journalsPermissions.navDOI: 10.1177/1745691617693393www.psychologicalscience.org/PPS
The goal of scientific psychology is to understand human behavior. Historically this has meant being able both to explain behavior—that is, to accurately describe its causal underpinnings—and to predict behavior—that is, to accu-rately forecast behaviors that have not yet been observed. In practice, however, these two goals are rarely distin-guished. The understanding seems to be that the two are so deeply intertwined that there would be little point in distinguishing them, except perhaps as a philosophical exercise. According to this understanding, explanation necessarily facilitates prediction; the model that best approx-imates the mental processes that produce an observed behavior is also the one that best predicts future behav-ior. Under this assumption, if we can catalog the various causes of a set of behaviors, including all the moderating and mediating variables that govern when and to what extent they each influence behavior, then we could, at least in principle, measure all of the relevant variables for a set of people and thereby predict their future behavior with very high accuracy.
Unfortunately, although explanation and prediction may be philosophically compatible, there are good rea-sons to think that they are often in statistical and
pragmatic tension with one another. From a statistical standpoint, it is simply not true that the model that most closely approximates the data-generating process will in general be the most successful at predicting real-world outcomes (Hagerty & Srinivasan, 1991; Shmueli, 2010; Wu, Harris, & Mcauley, 2007). Due to a phenomenon known as overfitting that we discuss in detail later, a biased, psychologically implausible model can often sys-tematically outperform a mechanistically more accurate, but also more complex, model. More importantly, there is no guarantee that the phenomena routinely studied by psychologists will ultimately prove to be sufficiently sim-ple as to be well approximated by models that are com-prehensible to humans. It may well be that in many areas of psychology, scientists will ultimately have to choose between (a) developing complex models that can accu-rately predict outcomes of interest but fail to respect known psychological or neurobiological constraints and
693393 PPSXXX10.1177/1745691617693393Yarkoni, WestfallPrediction vs. Explanationresearch-article2017
Corresponding Author:Tal Yarkoni, Department of Psychology, The University of Texas at Austin, 108 E. Dean Keeton Stop A8000, Austin, TX 78712-1043 E-mail: [email protected]
Choosing Prediction Over Explanation in Psychology: Lessons From Machine Learning
Tal Yarkoni and Jacob WestfallUniversity of Texas at Austin
AbstractPsychology has historically been concerned, first and foremost, with explaining the causal mechanisms that give rise to behavior. Randomized, tightly controlled experiments are enshrined as the gold standard of psychological research, and there are endless investigations of the various mediating and moderating variables that govern various behaviors. We argue that psychology’s near-total focus on explaining the causes of behavior has led much of the field to be populated by research programs that provide intricate theories of psychological mechanism but that have little (or unknown) ability to predict future behaviors with any appreciable accuracy. We propose that principles and techniques from the field of machine learning can help psychology become a more predictive science. We review some of the fundamental concepts and tools of machine learning and point out examples where these concepts have been used to conduct interesting and important psychological research that focuses on predictive research questions. We suggest that an increased focus on prediction, rather than explanation, can ultimately lead us to greater understanding of behavior.
Keywordsprediction, explanation, machine learning
2 Yarkoni, Westfall
(b) building simple models that appear theoretically ele-gant but have very limited capacity to predict actual human behavior. Practically speaking, even in cases where a rela-tively simple explanatory model is waiting to be found, a researcher generally cannot know this ahead of time. She must therefore decide, on a case-by-case basis, whether to prioritize an explanation-focused strategy that seeks to identify abstract, generalizable principles or a prediction-focused strategy that agnostically tries to mimic the out-puts of the true data-generating process when given the same inputs, without caring how that goal is achieved.
We claim that this underappreciated tension between prediction and explanation has profound implications for how psychological science could be and should be con-ducted. If ideal explanatory science is not generally ideal predictive science, and vice versa, then researchers must make a conscious choice: to explain or to predict. His-torically, most of psychology has reflexively chosen an explanatory approach, without giving any serious con-sideration to a predictive approach. Our central argument is that, in a great many cases, research programs that emphasize prediction, and that treat explanation as a sec-ondary goal, would be more fruitful both in the short term and the long term. We believe that one of the big-gest reasons that psychologists have historically opted for explanation is that, in the not-so-distant past, the tools of successful predictive science were poorly understood and rarely deployed in most fields of social and biomedi-cal science. However, with the relatively recent revolu-tion in machine learning theory and methodology—in which prediction of unobserved data is treated as the gold standard of success and explanation is typically of little or no interest—as well as the increasing availability of large-scale datasets recording human behavior, this is no longer true. Not only is it now eminently feasible to move psychology closer toward a predictive science, but it is already possible to point to a number of success sto-ries from when behavioral scientists have chosen such a predictive approach.
The rest of this article is organized as follows. First, we review the typical explanatory approach as practiced by most of psychology, and we highlight some of the diffi-culties of this approach of which psychologists are becoming increasingly aware. These include the prob-lems of “p-hacking” (Simmons, Nelson, & Simonsohn, 2011) and the seeming inability of researchers to consis-tently replicate the results of prior experiments (Open Science Collaboration, 2015). Next, we introduce an alternative approach: research in which “success” is mea-sured not by the size of a theoretically privileged regres-sion coefficient or a model fit statistic but instead simply by the average difference between unobserved data (i.e., “out-of-sample” data that were not used to fit the model) and the model’s predictions for those data. We then
describe some of the most important principles and tools of modern predictive science, as practiced by the field of machine learning, and describe how these principles and tools could be profitably imported to psychology. Specifi-cally, we introduce the concepts of overfitting, cross-validation, and regularization, and we discuss the issue of sample size when rejecting hypotheses is not a primary goal of the research. Finally, we argue that a short-term focus on prediction can ultimately improve our ability to explain the causes of behavior in the long term. Thus, an emphasis on prediction can be viewed not as an oppo-nent of explanation but rather as a complementary goal that can ultimately increase theoretical understanding.
Current Practice in Psychology: Explanation Without Prediction
We assume the vast majority of our readers will already be convinced of the scientific value of explanatory mod-eling, so we will say little to reinforce this notion. Explan-atory science has allowed us to walk on the face of the moon, control or eradicate harmful diseases, and under-stand much about the molecular origins of life. No one would seriously argue that explanation should not be a goal of science. What we do argue is that psychology’s emphasis on explaining the causes of behavior has led to a near-exclusive focus on developing mechanistic models of cognition that hold theoretical appeal but rarely dis-play a meaningful capacity to predict future behavior.
There are two separate senses in which psychologists have been deficient when it comes to predicting behav-ior. First, research papers in psychology rarely take steps to verify that the models they propose are capable of predicting the behavioral outcomes they are purportedly modeling. Instead, research is typically evaluated based either on “goodness of fit” between the statistical model and the sample data or on whether the sizes and direc-tions of certain regression coefficients match what is implied by different theoretical perspectives. As we elab-orate below, such demonstrations provide no guarantee of predictive accuracy for out-of-sample data; indeed, in some cases, the pursuit of a good model fit or theory-congruent explanation can reduce the likelihood of gen-erating good predictions.
Second, there is mounting evidence from the ongoing replication crisis that the published results of many papers in psychology do not, in fact, hold up when the same experiments and analyses are independently con-ducted at a later date (Ebersole et al., 2015; Nosek & Lakens, 2014; Open Science Collaboration, 2015). Thus, models that are held up as good explanations of behav-ior in an initial sample routinely fail to accurately predict the same behaviors in future samples—even when the experimental procedures are closely matched. There is
Prediction vs. Explanation 3
increasingly broad agreement that this widespread repli-cation failure is largely due to “p-hacking” and other questionable research practices that have historically been prevalent in the field ( John, Loewenstein, & Prelec, 2012; Simmons et al., 2011).
Goodness of fit versus test error
To fit is to overfit. One might suppose that demon-strating the predictive validity of a model should be a relatively easy task. At face value, prediction seems to be baked into the very heart of what psychologists do. A large number of psychology articles prominently feature the word prediction in their titles—witness, for example, claims that “impulsivity predicts problem gambling in low SES [socioeconomic status] adolescent males” (Vitaro, Arseneault, & Tremblay, 1999), that “brain activity pre-dicts how well visual experiences will be remembered” (Brewer, Zhao, Desmond, Glover, & Gabrieli, 1998), or that “early gesture selectivity predicts later language learning” (Rowe & Goldin-Meadow, 2009), among hun-dreds of others. Such assertions reflect the intuitive idea that a vast range of statistical models are, in a sense, predictive models. For example, suppose we have an outcome variable y and two predictors X1 and X2, and we fit a regression model of the form:
yi = β0 + β1X1i + β2 X2i + εi. (1)
Estimating the parameters of this model (or “training” the model, in the terminology of machine learning) yields the equation:
yi = 1.6 + 0.35X1i + 0.62X2i. (2)
With this regression equation, one can readily gener-ate new predictions simply by plugging in the corre-sponding values of X1 and X2 for newly observed cases. When a researcher obtains a coefficient of determination of, say, b0, and thus reports that she is able to “predict” 50% of the variance in educational attainment using a set of personality and demographic predictors, she is implic-itly claiming that she would be able to make reasonably accurate predictions about the educational attainment of a random person drawn from the same underlying popu-lation. And if that isn’t prediction, then what is?
The problem lies in the inference that the parameter estimates obtained in the sample at hand—i.e., the values b0 = 1.6, b1 = 0.35, and b2 = 0.62—will perform compara-bly well when applied to other samples drawn from the same population. The R2 statistic used to assess the mod-el’s goodness of fit answers a slightly different question—namely, in repeated random samples similar to this one, if one fits a model with the form of equation 1 in each
new sample—each time estimating new values of b0, b1, and b2—what will be the average proportional reduction in the sum of squared errors? In other words, R2 does not estimate the performance of a specific equation 2 but rather of the more general equation 1.1 It turns out that the performance of equation 1 is virtually always an overly optimistic estimate of the performance of equation 2. The reason for this is that the values of b0, b1, and b2 estimated in any given sample are specifically selected so as to minimize the sum of squared errors in that particu-lar sample. Because the relationship between variables in any sample is always influenced in part by sampling or measurement error—which by definition is not shared with other data samples drawn from the same popula-tion—a fitted model will almost invariably produce overly optimistic results.
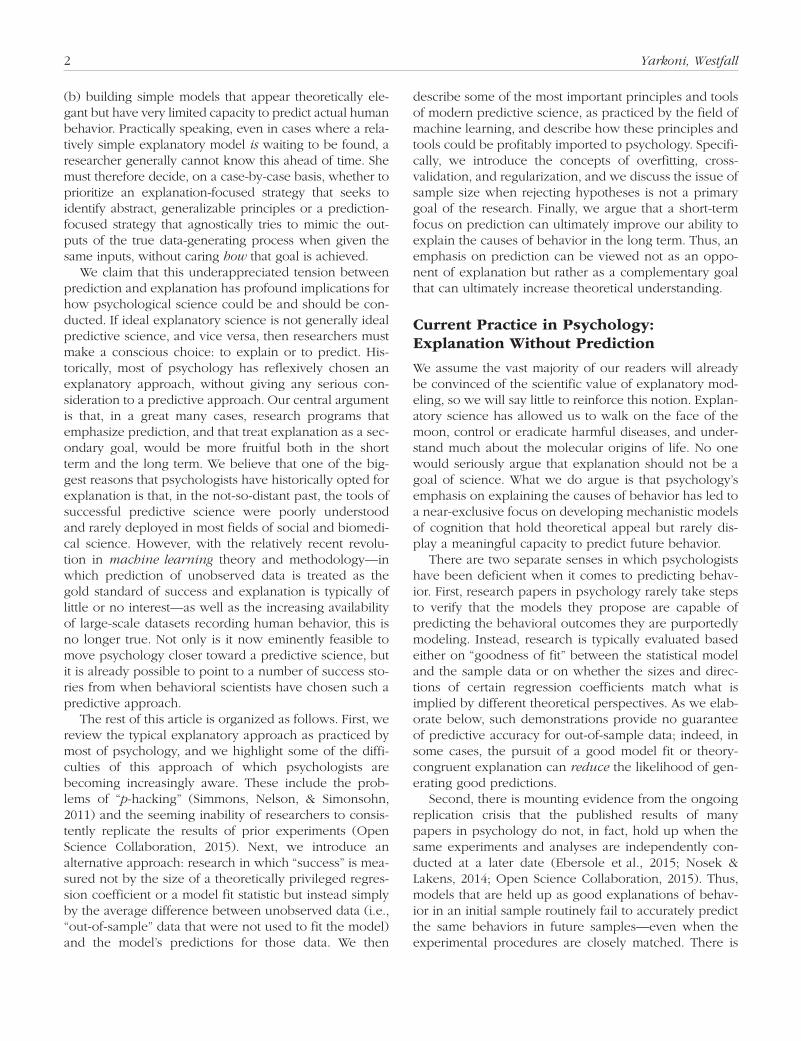
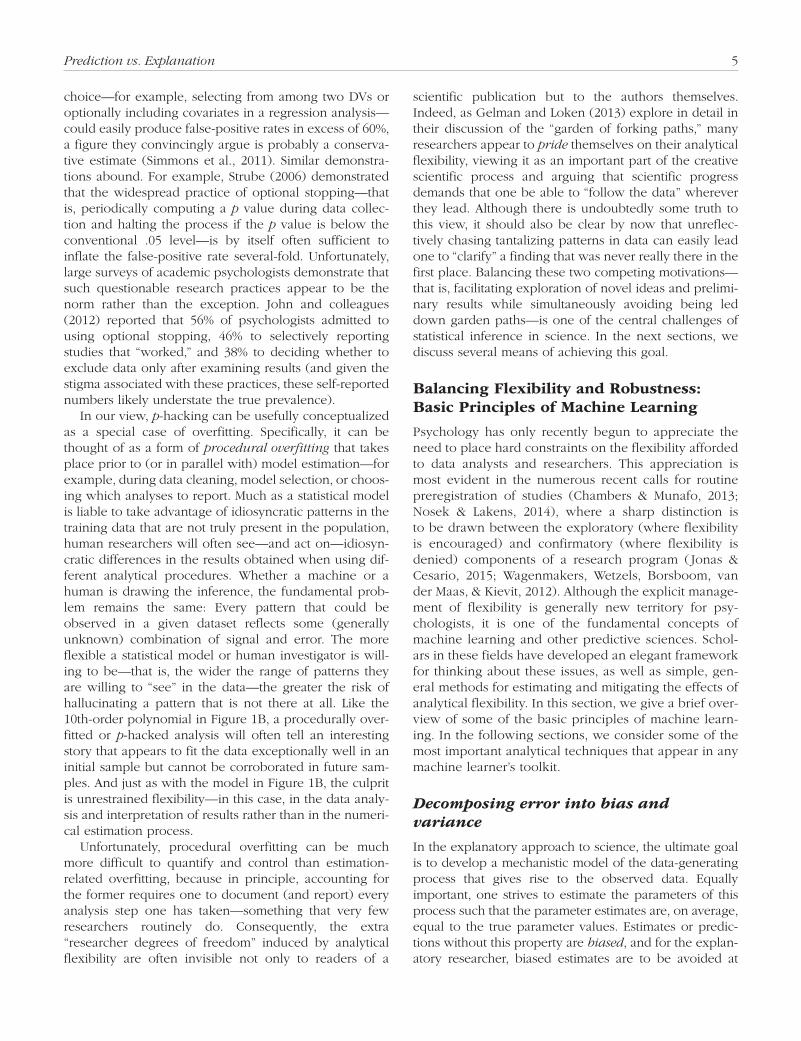
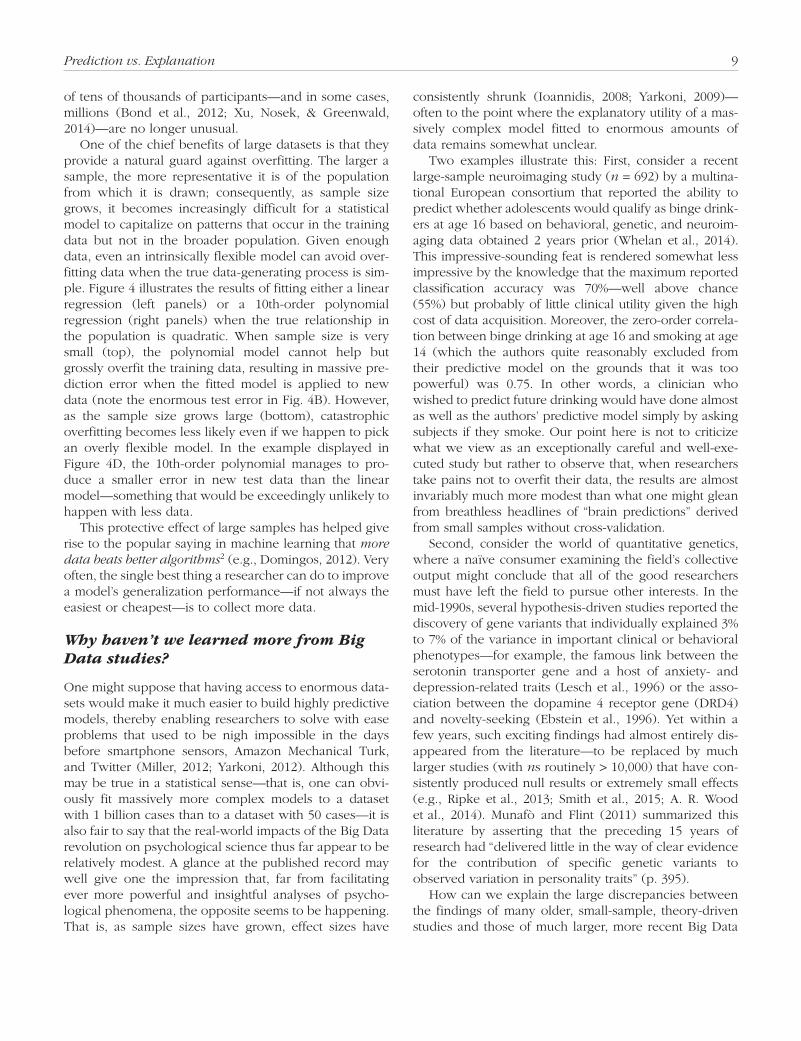
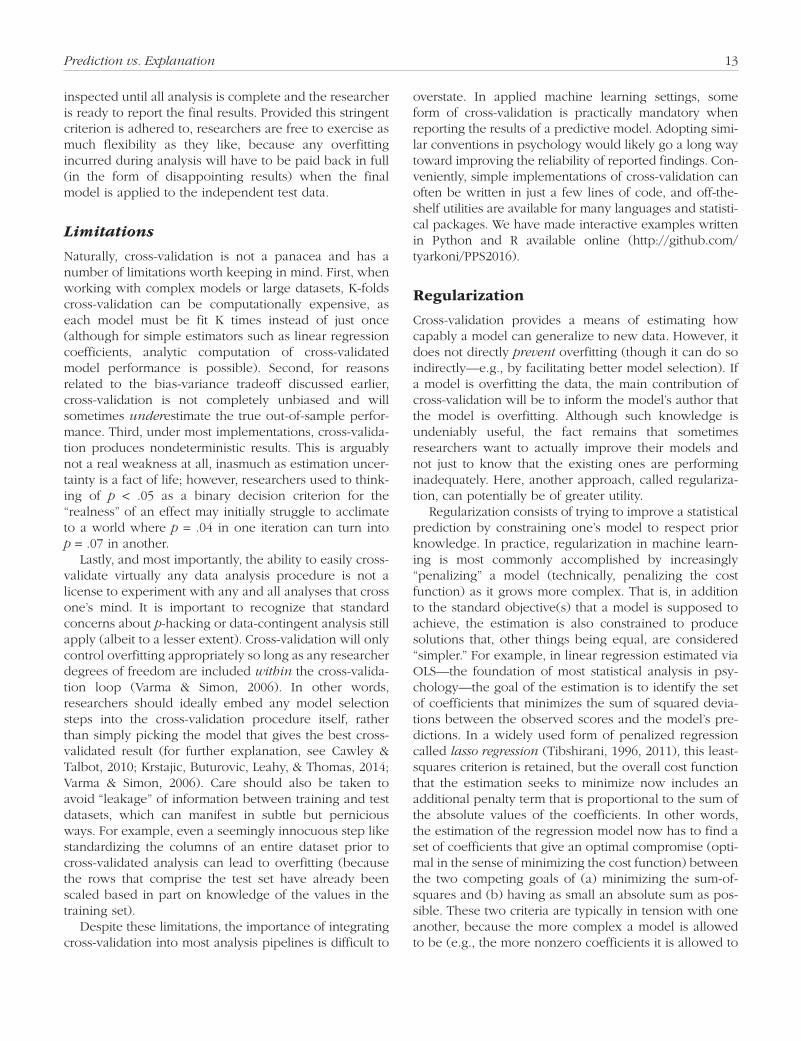
Figure 1 illustrates this principle by contrasting two models fit to the same data: a linear regression and a 10th-order polynomial regression. Note that even though the true effect in the population is linear (red line), the more complex polynomial model cannot help but cap-ture illusory trends in the data—effectively hallucinating patterns that exist only in the training sample and not in the population at large.
The tendency for statistical models to mistakenly fit sample-specific noise as if it were signal is commonly referred to as overfitting. Minimizing overfitting when training statistical models can be seen as one of the primary objectives of the field of machine learning (Domingos, 2012). To see why, recall that our standard goal in statisti-cal modeling is to develop a model that can capably gen-eralize to new observations similar, but not identical, to the ones we have sampled. We generally do not care very much about how well we can predict scores for the observations in our existing sample, since we already know what those scores are. In this sense, the prediction error that we compute when we fit a model on a particu-lar dataset is only a proxy for the quantity we truly care about, which is the error term that we would obtain if we were to apply our trained model to an entirely new set of observations sampled from the same population. We call this latter error term the test error, to distinguish it from the training error that we obtain when the model is first fitted (in psychology, model fit indicators are almost always reported strictly for the training sample). The test error will almost always be larger than the training error. Consequently, unless one has taken steps to prevent overfitting, it is difficult to have confidence that one’s model can generalize to new observations—no matter how well the model appears to do when its performance is evaluated on the same dataset used in training.
When are the problems of overfitting most and least pronounced? When predictors have strong effects and researchers fit relatively compact models in large
4 Yarkoni, Westfall
samples, overfitting is negligible. For example, with a sample size of 200 and 5 uncorrelated predictors, each correlated 0.4 with the dependent variable (DV), the average in-sample R2 is 0.32—a negligible increase both from its “true” or asymptotic value of 0.31 (i.e., equation 1) as well as from the average test or out-of-sample value of 0.30 (i.e., equation 2). But as the number of predictors increases and/or sample size and effect size drop, overfit-ting begins to increase—in some cases precipitously. For a particularly dramatic case, in a sample of N = 50 with 20 uncorrelated predictors, each correlated 0.1 with the DV, the observed (and overfitted) R2 value will, on aver-age, be 0.45, which certainly gives the impression that one could predict values of the DV rather successfully. However, the true value of R2 in this situation is only 0.07. Even worse, the average out-of-sample test value of R2 is only 0.02. Although the average value of the adjusted R2 statistic (see Note 1) will approximate the true value of 0.07, it still overstates the ability of the fitted model to predict future, out-of-sample DV values by more than a factor of 3. Clearly, then, one cannot trust estimates of model performance very far if those estimates are obtained by “testing” the model on the same data on which it was originally trained. Much better estimates of the out-of-sample predictive performance of a model are obtained using cross-validation, a technique that we dis-cuss in detail at a later point.
p-hacking as procedural overfitting. The example quantitative results we just reviewed might not seem unduly alarming to many psychologists. In many fields,
researchers rarely fit models containing more than three or four predictors, and severe problems arise primarily when the number of predictors is large relative to the number of subjects. However, it is important to remem-ber that our examples, which are based on comparing the average in-sample R2 to the out-of-sample test R2, only quantify overfitting that arises at the model estima-tion stage. That is, it assumes that researchers have been completely principled in setting up their analysis pipeline (the processing steps leading from the raw data to the final statistical results) and have not engaged in any flex-ible analysis practices. In reality, however, many overfit-ted findings predominantly reflect analytical procedures that are independent of, and often logically prior to, model estimation. In particular, there’s a well-recognized tendency for researchers, readers, reviewers, editors, and journalists alike to favor analysis procedures that produce “good” results—where a good result is one that is deemed more hypothesis-congruent, publication-worthy, soci-etally interesting, etc. (Bakker, van Dijk, & Wicherts, 2012; Dwan et al., 2008; Ferguson & Heene, 2012; Ioannidis, 2012). In recent years, the practice of flexibly selecting analytical procedures based in part on the qual-ity of the results they produce has come to be known as p-hacking (Simmons et al., 2011)—or, perhaps less ten-dentiously, data-contingent analysis (Gelman & Loken, 2013).
The impact of p-hacking on the production of overfit-ted or spurious results is difficult to overstate. In an influ-ential recent study, Simmons and colleagues demonstrated that even a moderate amount of flexibility in analysis
Fig. 1. Training and test error produced by fitting either a linear regression (left) or a 10th-order polynomial regression (right) when the true rela-tionship in the population (red line) is linear. In both cases, the test data (green) deviate more from the model’s predictions (blue line) than the training data (blue). However, the flexibility of the 10th-order polynomial model facilitates much greater overfitting, resulting in lower training error but much higher test error than the linear model. MSE = mean squared error.
Prediction vs. Explanation 5
choice—for example, selecting from among two DVs or optionally including covariates in a regression analysis—could easily produce false-positive rates in excess of 60%, a figure they convincingly argue is probably a conserva-tive estimate (Simmons et al., 2011). Similar demonstra-tions abound. For example, Strube (2006) demonstrated that the widespread practice of optional stopping—that is, periodically computing a p value during data collec-tion and halting the process if the p value is below the conventional .05 level—is by itself often sufficient to inflate the false-positive rate several-fold. Unfortunately, large surveys of academic psychologists demonstrate that such questionable research practices appear to be the norm rather than the exception. John and colleagues (2012) reported that 56% of psychologists admitted to using optional stopping, 46% to selectively reporting studies that “worked,” and 38% to deciding whether to exclude data only after examining results (and given the stigma associated with these practices, these self-reported numbers likely understate the true prevalence).
In our view, p-hacking can be usefully conceptualized as a special case of overfitting. Specifically, it can be thought of as a form of procedural overfitting that takes place prior to (or in parallel with) model estimation—for example, during data cleaning, model selection, or choos-ing which analyses to report. Much as a statistical model is liable to take advantage of idiosyncratic patterns in the training data that are not truly present in the population, human researchers will often see—and act on—idiosyn-cratic differences in the results obtained when using dif-ferent analytical procedures. Whether a machine or a human is drawing the inference, the fundamental prob-lem remains the same: Every pattern that could be observed in a given dataset reflects some (generally unknown) combination of signal and error. The more flexible a statistical model or human investigator is will-ing to be—that is, the wider the range of patterns they are willing to “see” in the data—the greater the risk of hallucinating a pattern that is not there at all. Like the 10th-order polynomial in Figure 1B, a procedurally over-fitted or p-hacked analysis will often tell an interesting story that appears to fit the data exceptionally well in an initial sample but cannot be corroborated in future sam-ples. And just as with the model in Figure 1B, the culprit is unrestrained flexibility—in this case, in the data analy-sis and interpretation of results rather than in the numeri-cal estimation process.
Unfortunately, procedural overfitting can be much more difficult to quantify and control than estimation-related overfitting, because in principle, accounting for the former requires one to document (and report) every analysis step one has taken—something that very few researchers routinely do. Consequently, the extra “researcher degrees of freedom” induced by analytical flexibility are often invisible not only to readers of a
scientific publication but to the authors themselves. Indeed, as Gelman and Loken (2013) explore in detail in their discussion of the “garden of forking paths,” many researchers appear to pride themselves on their analytical flexibility, viewing it as an important part of the creative scientific process and arguing that scientific progress demands that one be able to “follow the data” wherever they lead. Although there is undoubtedly some truth to this view, it should also be clear by now that unreflec-tively chasing tantalizing patterns in data can easily lead one to “clarify” a finding that was never really there in the first place. Balancing these two competing motivations—that is, facilitating exploration of novel ideas and prelimi-nary results while simultaneously avoiding being led down garden paths—is one of the central challenges of statistical inference in science. In the next sections, we discuss several means of achieving this goal.
Balancing Flexibility and Robustness: Basic Principles of Machine Learning
Psychology has only recently begun to appreciate the need to place hard constraints on the flexibility afforded to data analysts and researchers. This appreciation is most evident in the numerous recent calls for routine preregistration of studies (Chambers & Munafo, 2013; Nosek & Lakens, 2014), where a sharp distinction is to be drawn between the exploratory (where flexibility is encouraged) and confirmatory (where flexibility is denied) components of a research program ( Jonas & Cesario, 2015; Wagenmakers, Wetzels, Borsboom, van der Maas, & Kievit, 2012). Although the explicit manage-ment of flexibility is generally new territory for psy-chologists, it is one of the fundamental concepts of machine learning and other predictive sciences. Schol-ars in these fields have developed an elegant framework for thinking about these issues, as well as simple, gen-eral methods for estimating and mitigating the effects of analytical flexibility. In this section, we give a brief over-view of some of the basic principles of machine learn-ing. In the following sections, we consider some of the most important analytical techniques that appear in any machine learner’s toolkit.
Decomposing error into bias and variance
In the explanatory approach to science, the ultimate goal is to develop a mechanistic model of the data-generating process that gives rise to the observed data. Equally important, one strives to estimate the parameters of this process such that the parameter estimates are, on average, equal to the true parameter values. Estimates or predic-tions without this property are biased, and for the explan-atory researcher, biased estimates are to be avoided at
6 Yarkoni, Westfall
almost any cost. Indeed, to researchers trained in the psychometric tradition, the very term bias is practically synonymous with error, tending to connote general wrongness. But in the statistical learning literature, bias is defined in a narrower and much less offensive way. Spe-cifically, it refers to one particular kind of error: the ten-dency for a model to consistently produce answers that are wrong in a particular direction (e.g., estimates that are consistently too high). Bias can be contrasted with vari-ance, which refers to the extent to which a model’s fitted parameters will tend to deviate from their central tendency across different datasets.
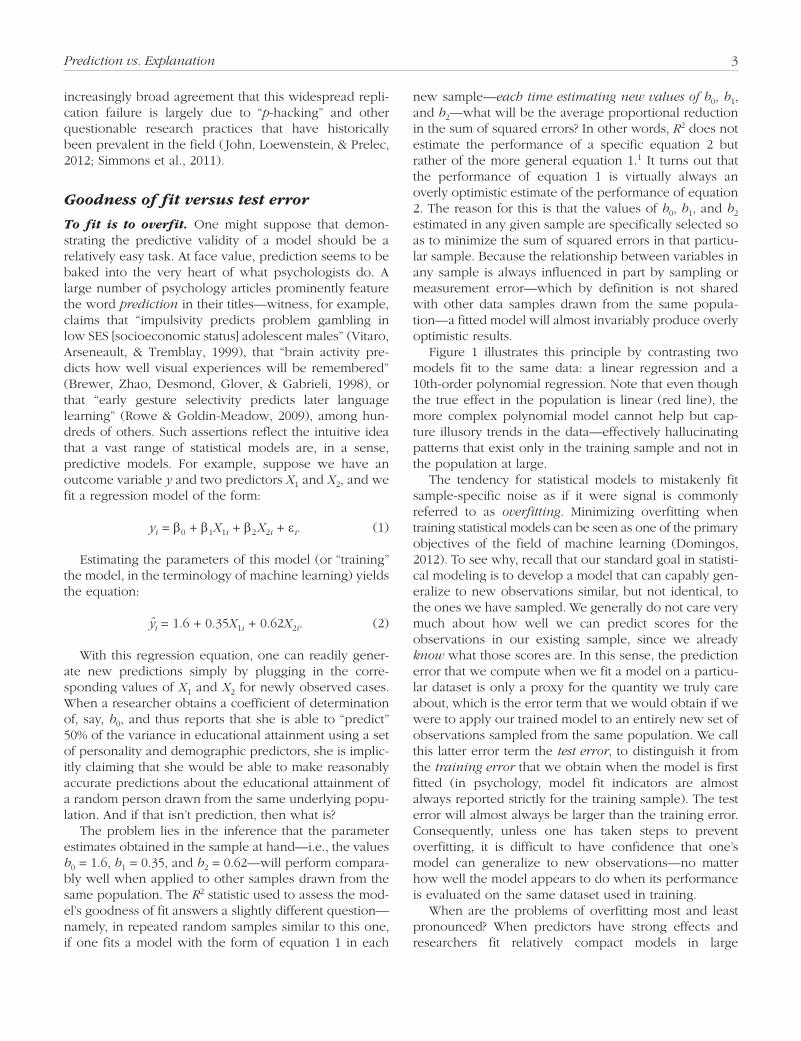
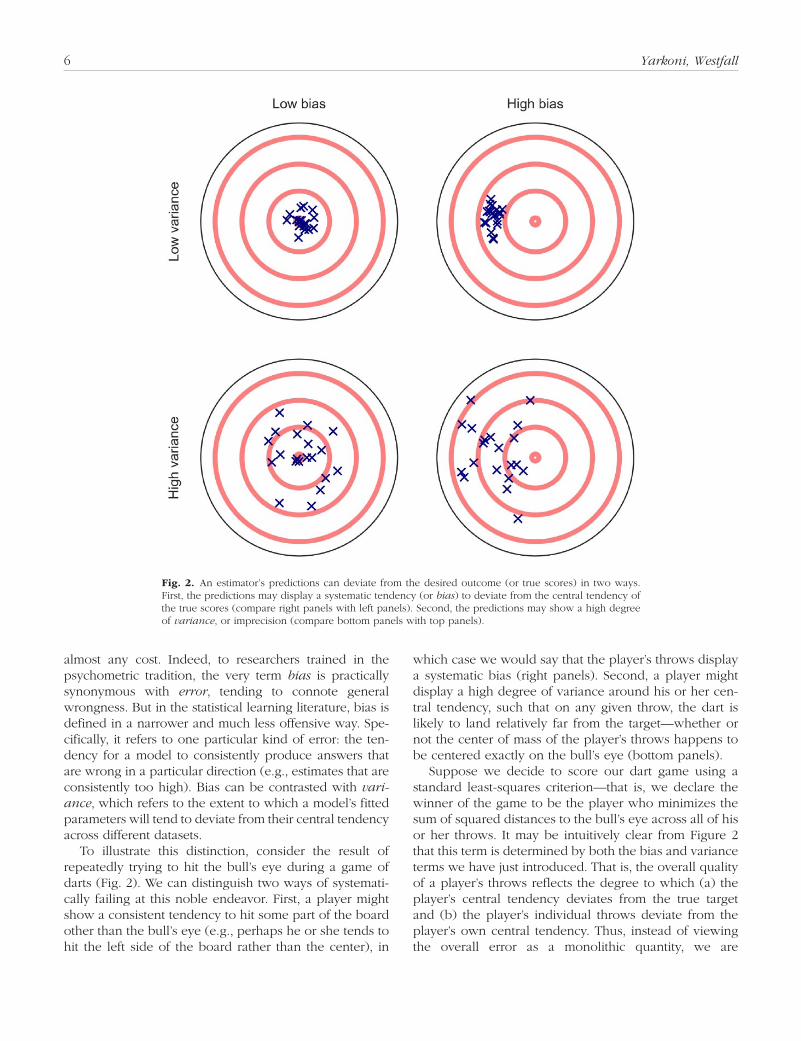
To illustrate this distinction, consider the result of repeatedly trying to hit the bull’s eye during a game of darts (Fig. 2). We can distinguish two ways of systemati-cally failing at this noble endeavor. First, a player might show a consistent tendency to hit some part of the board other than the bull’s eye (e.g., perhaps he or she tends to hit the left side of the board rather than the center), in
which case we would say that the player’s throws display a systematic bias (right panels). Second, a player might display a high degree of variance around his or her cen-tral tendency, such that on any given throw, the dart is likely to land relatively far from the target—whether or not the center of mass of the player’s throws happens to be centered exactly on the bull’s eye (bottom panels).
Suppose we decide to score our dart game using a standard least-squares criterion—that is, we declare the winner of the game to be the player who minimizes the sum of squared distances to the bull’s eye across all of his or her throws. It may be intuitively clear from Figure 2 that this term is determined by both the bias and variance terms we have just introduced. That is, the overall quality of a player’s throws reflects the degree to which (a) the player’s central tendency deviates from the true target and (b) the player’s individual throws deviate from the player’s own central tendency. Thus, instead of viewing the overall error as a monolithic quantity, we are
Fig. 2. An estimator’s predictions can deviate from the desired outcome (or true scores) in two ways. First, the predictions may display a systematic tendency (or bias) to deviate from the central tendency of the true scores (compare right panels with left panels). Second, the predictions may show a high degree of variance, or imprecision (compare bottom panels with top panels).
Prediction vs. Explanation 7
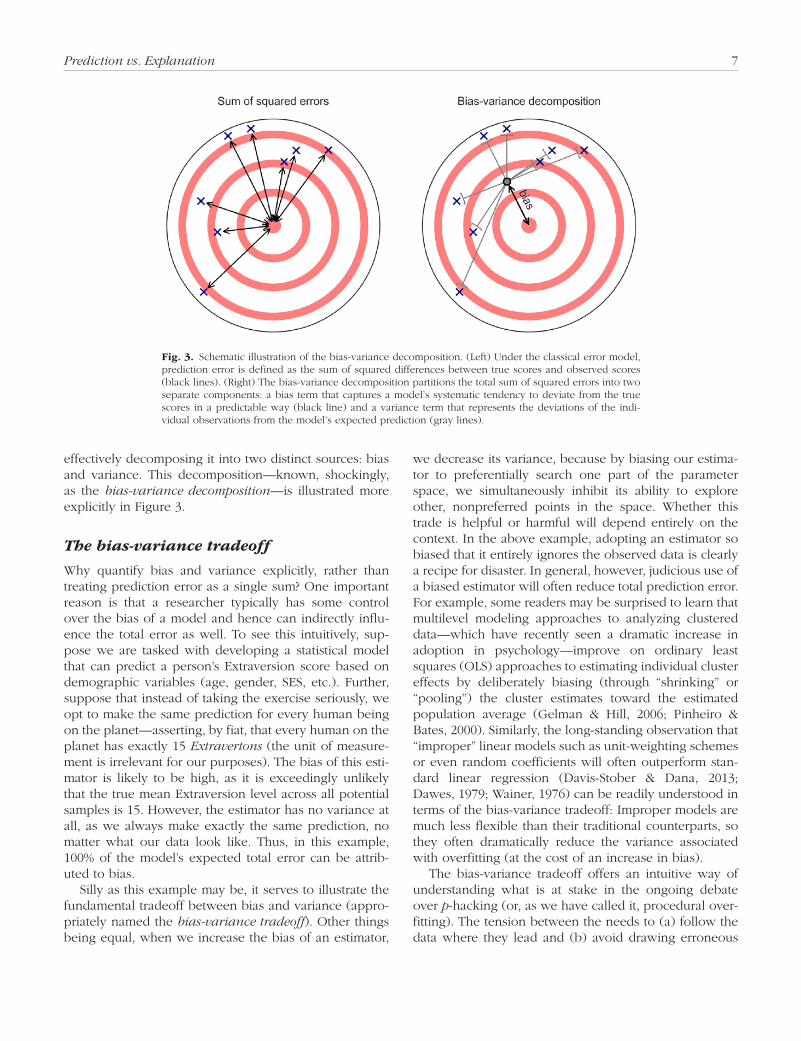
effectively decomposing it into two distinct sources: bias and variance. This decomposition—known, shockingly, as the bias-variance decomposition—is illustrated more explicitly in Figure 3.
The bias-variance tradeoff
Why quantify bias and variance explicitly, rather than treating prediction error as a single sum? One important reason is that a researcher typically has some control over the bias of a model and hence can indirectly influ-ence the total error as well. To see this intuitively, sup-pose we are tasked with developing a statistical model that can predict a person’s Extraversion score based on demographic variables (age, gender, SES, etc.). Further, suppose that instead of taking the exercise seriously, we opt to make the same prediction for every human being on the planet—asserting, by fiat, that every human on the planet has exactly 15 Extravertons (the unit of measure-ment is irrelevant for our purposes). The bias of this esti-mator is likely to be high, as it is exceedingly unlikely that the true mean Extraversion level across all potential samples is 15. However, the estimator has no variance at all, as we always make exactly the same prediction, no matter what our data look like. Thus, in this example, 100% of the model’s expected total error can be attrib-uted to bias.
Silly as this example may be, it serves to illustrate the fundamental tradeoff between bias and variance (appro-priately named the bias-variance tradeoff). Other things being equal, when we increase the bias of an estimator,
we decrease its variance, because by biasing our estima-tor to preferentially search one part of the parameter space, we simultaneously inhibit its ability to explore other, nonpreferred points in the space. Whether this trade is helpful or harmful will depend entirely on the context. In the above example, adopting an estimator so biased that it entirely ignores the observed data is clearly a recipe for disaster. In general, however, judicious use of a biased estimator will often reduce total prediction error. For example, some readers may be surprised to learn that multilevel modeling approaches to analyzing clustered data—which have recently seen a dramatic increase in adoption in psychology—improve on ordinary least squares (OLS) approaches to estimating individual cluster effects by deliberately biasing (through “shrinking” or “pooling”) the cluster estimates toward the estimated population average (Gelman & Hill, 2006; Pinheiro & Bates, 2000). Similarly, the long-standing observation that “improper” linear models such as unit-weighting schemes or even random coefficients will often outperform stan-dard linear regression (Davis-Stober & Dana, 2013; Dawes, 1979; Wainer, 1976) can be readily understood in terms of the bias-variance tradeoff: Improper models are much less flexible than their traditional counterparts, so they often dramatically reduce the variance associated with overfitting (at the cost of an increase in bias).
The bias-variance tradeoff offers an intuitive way of understanding what is at stake in the ongoing debate over p-hacking (or, as we have called it, procedural over-fitting). The tension between the needs to (a) follow the data where they lead and (b) avoid drawing erroneous
Fig. 3. Schematic illustration of the bias-variance decomposition. (Left) Under the classical error model, prediction error is defined as the sum of squared differences between true scores and observed scores (black lines). (Right) The bias-variance decomposition partitions the total sum of squared errors into two separate components: a bias term that captures a model’s systematic tendency to deviate from the true scores in a predictable way (black line) and a variance term that represents the deviations of the indi-vidual observations from the model’s expected prediction (gray lines).
8 Yarkoni, Westfall
inferences by capitalizing on researcher degrees of free-dom can be understood as a matter of researchers resid-ing at different positions along the bias-variance tradeoff. That is, one can construe a research strategy that favors liberal, flexible data analysis as a relatively low-bias but high-variance approach (i.e., almost any pattern in data can potentially be detected, at the cost of a high rate of spurious identifications) and an approach that favors strict adherence to a fixed set of procedures as a high-bias, low-variance approach (only a limited range of pat-terns can be identified, but the risk of pattern hallucination is low).
A principled approach to the tradeoff: Minimize prediction error
It would be nice if there were a single global solution to the bias-variance tradeoff and researchers could all agree to use the same set of optimal analytical approaches. Unfortunately, there is no free lunch (Wolpert & Macready, 1997): The bias-variance tradeoff is fundamental and unavoidable, and we all must decide how much bias we wish to trade for variance, or vice versa. The explanatory approach to the tradeoff prioritizes minimizing bias. How-ever, because the total prediction error is equal to the sum of bias and variance, this approach runs the risk of pro-ducing models that are essentially useless for prediction, due to the variance being far too large. Importantly, it is not just prediction for prediction’s sake that suffers. The utility of the theories under investigation also greatly diminishes, because operating under a high-variance regime implies that the models one derives from one’s data are highly unstable and can change dramatically given relatively small changes in the data. We argue that this is precisely the situation in which much of psychology is currently: Elaborate theories seemingly supported by statistical analysis in one dataset routinely fail to generalize to slightly different situations or even to new samples putatively drawn from the same underlying population.
In machine learning, by contrast, the primary goal is usually to predict future observations as accurately as possible—in other words, to minimize prediction error. Thus, the machine learning approach to the bias-variance tradeoff is clear: One should prefer whatever the ratio of bias to variance is that minimizes the expected prediction error for the problem at hand. In some cases, this may happen to coincide with the explanatory approach—that is, it may happen that the expected prediction error is minimized when bias is minimized. More commonly, however, prediction error will be minimized by a model that yields estimates or predictions that are, to some degree, biased.
Finding a model that minimizes the expected predic-tion error typically requires at least three things. First, one
must use datasets large enough to support training of statistical models that can make good predictions. Sec-ond, one must be able to accurately estimate prediction error, so as to objectively assess a model’s performance and determine when and how the model can be improved. Third, one must be able to exert control over the bias-variance tradeoff when appropriate, by using biased models that can push predictions toward areas of the parameter space that are more likely to contain the true parameter values. Although a full treatment of these issues is beyond the scope of this paper (for excellent full-length introductions, see Browne, 2000; Bunea et al., 2011; Domingos, 2012; McNeish, 2015; an authoritative, freely available textbook is Hastie, Tibshirani, & Friedman, 2009), even a cursory familiarity with core machine learn-ing concepts can, in our view, help psychological scien-tists substantially improve the predictive accuracy of their models. In the next sections, we discuss three common methodological practices that respectively help address the three requirements mentioned above: first, the routine use of very large datasets as a means of improving pre-dictive accuracy; second, the reliance on cross-validation to assess model performance; and third, the use of regu-larization as a way of biasing one’s predictions in desir-able ways.
The “Big” in Big Data
Overfitting and sample size
The term “Big Data” has attracted a good deal of atten-tion from behavioral scientists and neuroscientists in recent years (Bentley, O’Brien, & Brock, 2014; Horn & Toga, 2013). Precisely what Big Data means in the con-text of psychological science remains a matter of debate (Yarkoni, 2014). In the tech industry, the term is usually applied to datasets that are terabytes or even petabytes in size—several orders of magnitude larger than the datas-ets with which all but a few lucky (or perhaps, unlucky) psychologists work. A cynic would thus not be entirely remiss in suggesting that Big Data is, thus far, more of a buzzword than a legitimate paradigm shift in the analysis of psychological data.
Nonetheless, what should not be controversial is that the “Big” in Big Data is a good thing. Statisticians and methodologically inclined psychologists have been call-ing for the routine use of much larger samples for decades (Cohen, 1962, 1992), but until recently, there was little evidence to suggest that these calls were being heeded (Sedlmeier & Gigerenzer, 1989). Thanks to modern tech-nology, the tide now appears to be turning. The advent of online/mobile data collection, coupled with access to enormous archival datasets from social networks and other websites, means that studies based on sample sizes
Prediction vs. Explanation 9
of tens of thousands of participants—and in some cases, millions (Bond et al., 2012; Xu, Nosek, & Greenwald, 2014)—are no longer unusual.
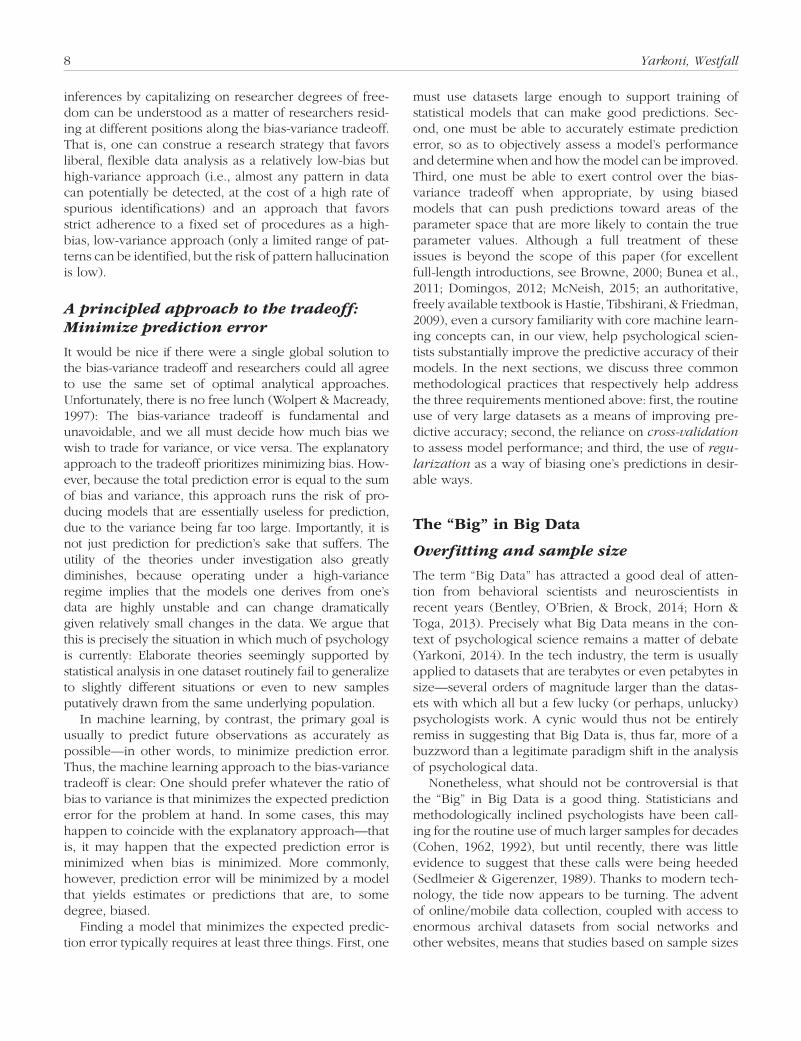
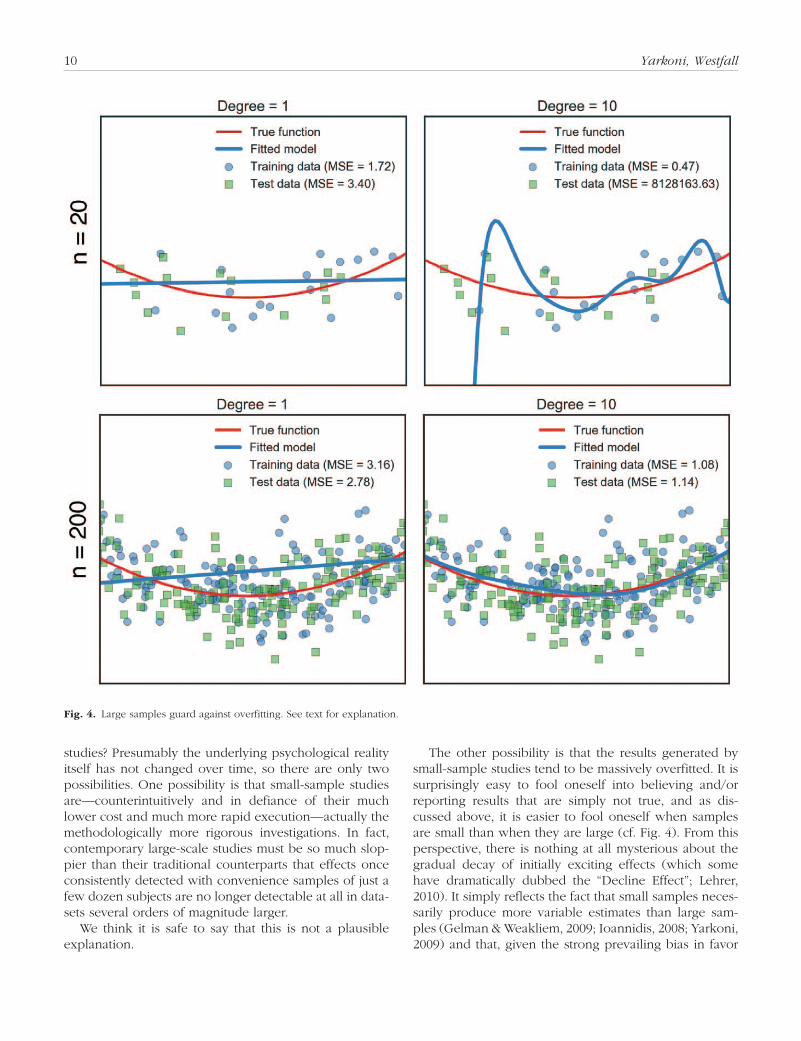
One of the chief benefits of large datasets is that they provide a natural guard against overfitting. The larger a sample, the more representative it is of the population from which it is drawn; consequently, as sample size grows, it becomes increasingly difficult for a statistical model to capitalize on patterns that occur in the training data but not in the broader population. Given enough data, even an intrinsically flexible model can avoid over-fitting data when the true data-generating process is sim-ple. Figure 4 illustrates the results of fitting either a linear regression (left panels) or a 10th-order polynomial regression (right panels) when the true relationship in the population is quadratic. When sample size is very small (top), the polynomial model cannot help but grossly overfit the training data, resulting in massive pre-diction error when the fitted model is applied to new data (note the enormous test error in Fig. 4B). However, as the sample size grows large (bottom), catastrophic overfitting becomes less likely even if we happen to pick an overly flexible model. In the example displayed in Figure 4D, the 10th-order polynomial manages to pro-duce a smaller error in new test data than the linear model—something that would be exceedingly unlikely to happen with less data.
This protective effect of large samples has helped give rise to the popular saying in machine learning that more data beats better algorithms2 (e.g., Domingos, 2012). Very often, the single best thing a researcher can do to improve a model’s generalization performance—if not always the easiest or cheapest—is to collect more data.
Why haven’t we learned more from Big Data studies?
One might suppose that having access to enormous data-sets would make it much easier to build highly predictive models, thereby enabling researchers to solve with ease problems that used to be nigh impossible in the days before smartphone sensors, Amazon Mechanical Turk, and Twitter (Miller, 2012; Yarkoni, 2012). Although this may be true in a statistical sense—that is, one can obvi-ously fit massively more complex models to a dataset with 1 billion cases than to a dataset with 50 cases—it is also fair to say that the real-world impacts of the Big Data revolution on psychological science thus far appear to be relatively modest. A glance at the published record may well give one the impression that, far from facilitating ever more powerful and insightful analyses of psycho-logical phenomena, the opposite seems to be happening. That is, as sample sizes have grown, effect sizes have
consistently shrunk (Ioannidis, 2008; Yarkoni, 2009)—often to the point where the explanatory utility of a mas-sively complex model fitted to enormous amounts of data remains somewhat unclear.
Two examples illustrate this: First, consider a recent large-sample neuroimaging study (n = 692) by a multina-tional European consortium that reported the ability to predict whether adolescents would qualify as binge drink-ers at age 16 based on behavioral, genetic, and neuroim-aging data obtained 2 years prior (Whelan et al., 2014). This impressive-sounding feat is rendered somewhat less impressive by the knowledge that the maximum reported classification accuracy was 70%—well above chance (55%) but probably of little clinical utility given the high cost of data acquisition. Moreover, the zero-order correla-tion between binge drinking at age 16 and smoking at age 14 (which the authors quite reasonably excluded from their predictive model on the grounds that it was too powerful) was 0.75. In other words, a clinician who wished to predict future drinking would have done almost as well as the authors’ predictive model simply by asking subjects if they smoke. Our point here is not to criticize what we view as an exceptionally careful and well-exe-cuted study but rather to observe that, when researchers take pains not to overfit their data, the results are almost invariably much more modest than what one might glean from breathless headlines of “brain predictions” derived from small samples without cross-validation.
Second, consider the world of quantitative genetics, where a naïve consumer examining the field’s collective output might conclude that all of the good researchers must have left the field to pursue other interests. In the mid-1990s, several hypothesis-driven studies reported the discovery of gene variants that individually explained 3% to 7% of the variance in important clinical or behavioral phenotypes—for example, the famous link between the serotonin transporter gene and a host of anxiety- and depression-related traits (Lesch et al., 1996) or the asso-ciation between the dopamine 4 receptor gene (DRD4) and novelty-seeking (Ebstein et al., 1996). Yet within a few years, such exciting findings had almost entirely dis-appeared from the literature—to be replaced by much larger studies (with ns routinely > 10,000) that have con-sistently produced null results or extremely small effects (e.g., Ripke et al., 2013; Smith et al., 2015; A. R. Wood et al., 2014). Munafò and Flint (2011) summarized this literature by asserting that the preceding 15 years of research had “delivered little in the way of clear evidence for the contribution of specific genetic variants to observed variation in personality traits” (p. 395).
How can we explain the large discrepancies between the findings of many older, small-sample, theory-driven studies and those of much larger, more recent Big Data
10 Yarkoni, Westfall
studies? Presumably the underlying psychological reality itself has not changed over time, so there are only two possibilities. One possibility is that small-sample studies are—counterintuitively and in defiance of their much lower cost and much more rapid execution—actually the methodologically more rigorous investigations. In fact, contemporary large-scale studies must be so much slop-pier than their traditional counterparts that effects once consistently detected with convenience samples of just a few dozen subjects are no longer detectable at all in data-sets several orders of magnitude larger.
We think it is safe to say that this is not a plausible explanation.
The other possibility is that the results generated by small-sample studies tend to be massively overfitted. It is surprisingly easy to fool oneself into believing and/or reporting results that are simply not true, and as dis-cussed above, it is easier to fool oneself when samples are small than when they are large (cf. Fig. 4). From this perspective, there is nothing at all mysterious about the gradual decay of initially exciting effects (which some have dramatically dubbed the “Decline Effect”; Lehrer, 2010). It simply reflects the fact that small samples neces-sarily produce more variable estimates than large sam-ples (Gelman & Weakliem, 2009; Ioannidis, 2008; Yarkoni, 2009) and that, given the strong prevailing bias in favor
Fig. 4. Large samples guard against overfitting. See text for explanation.
Prediction vs. Explanation 11
of positive, large, or otherwise “interesting” effects (Nosek, Spies, & Motyl, 2012), it is the larger effects that tend to get published. In other words, the reason effect sizes in many domains have shrunk is that they were never truly big to begin with, and it is only now that researchers are routinely collecting enormous datasets that we are finally in a position to appreciate that fact.3
The obvious implication is that, if we’re serious about producing replicable, reliable science, we should gener-ally favor small effects from large samples over large effects from small samples. (Of course, large effects from large samples are even better, on the rare occasions that we can obtain them.) In fact, in many cases, there is a serious debate to be had about whether it is scientifically useful to conduct small-sample research at all. In many domains, where data collection is costly and most research is conducted by small, independent labs, it is difficult to obtain anything but relatively small samples. Although there is a widespread belief that “anything is better than nothing” and that “we have to start some-where,” given the various problems we’ve reviewed—many of which would simply not have arisen in larger samples—we think this view warrants considerable skepticism.
One alternative to conducting small-sample research would be for researchers to participate in large, multilab, collaborative projects (Ebersole et al., 2015; Klein et al., 2014). Another would be to conduct novel analyses on some of the existing large datasets that are available to researchers, such as the Human Connectome Project (Van Essen et al., 2013) or 1000 Functional Connectomes (Biswal et al., 2010) datasets in functional magnetic reso-nance imaging (fMRI), lexical corpora such as the English Lexicon Project (Balota et al., 2007) or Lexique (New, Pallier, Brysbaert, & Ferrand, 2004) in psycholinguistics, or the American National Election Studies (ANES) data-base in political psychology (electionstudies.org), to name just a few. Such resources remain greatly underuti-lized in psychology, often under the assumption that the benefits of having complete experimental control over one’s study outweigh the enormous increase in estima-tion variance and associated risk of overfitting. But as we have shown above, the recent proliferation of modest effect sizes from large, expensive studies is not a sign that we have entered an era of incremental, uncreative psy-chological science; rather, it’s the mark of a field under-going a painful but important transition toward widespread adoption of truth-supporting procedures. From this perspective, the rapid introduction of Big Data approaches to many areas of psychology stands to pro-vide a much-needed corrective to decades of overfitted, high-profile results that have systematically distorted many researchers’ intuitions and expectations.
Cross-Validation
From independent replication to K-foldsTo ensure good predictive performance, one must have a way of objectively evaluating the performance of any models trained on one’s data—that is, of quantifying the out-of-sample prediction error. In machine learning, the most common—indeed, nearly universal—approach to estimating prediction error is cross-validation. Cross-validation refers to a family of techniques that involve training and testing a model on different samples of data (Browne, 2000; Shao, 1993). Although the explicit use of cross-validation to quantify generalization performance is largely absent from contemporary psychological science, the practice has deep roots in the field. As early as the late 1940s, psychologists in a variety of disciplines were strongly advocating the use of cross-validation or compa-rable analytical corrections as a means of combatting shrinkage in multiple regression (Kurtz, 1948; Mosier, 1951; Schmitt, Coyle, & Rauschenberger, 1977; Wherry, 1951, 1975). Mosier (1951) went so far as to observe that “if the combining weights of a set of predictors have been determined from the statistics of one sample, the effectiveness of the predictor-composite must be deter-mined on a separate, independent sample. This is the case whether the combining weights are multiple-regres-sion beta weights or item-analysis weights of one or zero” (p. 5; original italics).
The canonical example of cross-validation is, of course, the classical replication setup, where a model is trained on one dataset and then tested on a completely independent dataset. Indeed, independent replication has historically been psychologists’ favored method for establishing the validity or generality of a finding—albeit from a hypothesis-testing perspective rather than a pre-dictive-modeling perspective (i.e., the typical approach is to test whether the same qualitative pattern of results holds in two separate samples rather than to train a model in one sample and then test its quantitative predic-tions in a second sample). Unfortunately, independent replication is not always a scalable strategy for ensuring the reliability of a literature: At best, it requires the acqui-sition of large amounts of new data, which may be impractical and expensive; at worst, years or even decades may elapse before a finding is convincingly refuted or discredited, allowing considerable waste of scientific resources in the interim (Greenwald, 2012; Ioannidis, 2012).
Rather than resorting to the acquisition of new data, modern applications of cross-validation typically adopt alternative approaches that provide most of the benefit of true replication at no extra cost. The basic premise can
12 Yarkoni, Westfall
be captured in two simple insights. The first insight is that one can turn a single dataset into two nominally inde-pendent datasets rather easily: One simply has to ran-domly split the original dataset into two sets—a training dataset and a test dataset. The training half is used to fit the model, and the test half is subsequently used to quantify the test error of the trained model. The estimate from the test dataset will then more closely approximate the true out-of-sample performance of the model.4 Of course, this isn’t an ideal solution, because instead of doubling data collection costs, we’ve simply halved (roughly) our statistical efficiency. The reduction in over-fitting—obtained by ensuring that no single data point is used in both the training and evaluation of a model—now comes at the cost of a propensity to underfit, because the training sample is smaller, and hence the fitted model is not as stable as it would be with a larger sample (cf. Fig. 4).
Fortunately, this problem can be mostly ameliorated via a second insight—namely, that it is possible to effec-tively “recycle” one’s dataset. That is, instead of assigning each observation exclusively to either the training or the test datasets, one can do both, by repeating the cross-validation twice. In one “fold” of the analysis, one half of the data is used for training and the other half for testing; in a second fold, the datasets are reversed, and the train-ing set and test sets exchange roles. The overall model performance is then computed by averaging the test per-formance scores of the two folds, resulting in a single estimate that uses all of the data for both training and testing yet never uses any single data point for both. More generally, this approach is termed K-fold cross-validation, where K, the number of “folds,” can be any number between 2 and the number of observations in the full dataset (but is most commonly set to a value in the range of 3 to 10). When K is equal to the sample size n—so that the model is fit n times, each time predicting the score for only a single held-out subject—the proce-dure is commonly referred to as leave-one-out cross-validation (LOOCV).
Cross-validated model estimation
K-fold cross-validation is a simple but extremely powerful technique. It provides a minimally biased way of estimat-ing the true generalization performance of any model. In general, the overfitting observed when using the same data to both train and test a model will largely disappear when cross-validation is applied, and the cross-validated estimate of a model’s generalization performance will (on average) typically be very close to the true out-of-sample performance. Importantly, cross-validation can be applied to virtually any statistical estimation procedure, whereas analytical estimates (e.g., the Aikake Information Criterion,
or AIC; Vrieze, 2012) are only available for a restricted set of models under fairly idealized assumptions. Thus, cross-validation is particularly useful in cases when the com-plexity of a model is high relative to the amount of available data—as is common, for example, in many struc-tural equation modeling (SEM) applications. In such cases, it can come as a shock to discover that a model that appears to fit one’s data very well according to various goodness-of-fit indices can fare very poorly when tested out-of-sample (Browne, MacCallum, Kim, Andersen, & Glaser, 2002). Surprisingly (or, if one is cynically inclined, perhaps not surprisingly), explicit cross-validation of com-plex structural models remains almost entirely absent from the social science literature (Holbert & Stephenson, 2002).
Cross-validated model selection
Importantly, cross-validation approaches can help guard not only against overfitting that arises during model esti-mation but also against procedural overfitting or p-hacking. Recall that p-hacking occurs whenever a researcher decides to use one procedure rather than another based, at least in part, on knowledge of the respective outcomes. For example, a researcher might inspect her data, observe that scores are highly positive skewed, and then alter-nately try out log-transformation and winsorization of the data—ultimately retaining the former approach when it produces “better” results. The tension lies in the fact that, although the decision to choose from among multiple possible procedures based on their respective outcomes entails a certain amount of overfitting, it nevertheless seems reasonable to allow researchers to “follow the data” where they lead rather than blindly applying a predeter-mined set of procedures.
Judicious use of cross-validation during model selec-tion can, in principle, provide a compromise between these two positions. The simplest approach is to obtain a cross-validated estimate of model performance under each possible analysis approach (e.g., for log-transforma-tion versus winsorization of the data) and then select the approach that produces the best cross-validated results. This approach will reduce, though not outright eliminate (for reasons discussed below), overfitting. More sophisti-cated approaches involving nested cross-validation or alternative decision rules for selecting among cross-validated models are also available (for discussion, see Varma & Simon, 2006, as well as the online Python and R tutorials we have made available at http://github.com/tyarkoni/PPS2016).
Lastly, in cases where researchers are fortunate enough to have very large datasets with which to work, the stron-gest approach (though one that requires considerable self-discipline) is to set aside a subset of the full dataset as a true test sample. This hold-out dataset must not be
Prediction vs. Explanation 13
inspected until all analysis is complete and the researcher is ready to report the final results. Provided this stringent criterion is adhered to, researchers are free to exercise as much flexibility as they like, because any overfitting incurred during analysis will have to be paid back in full (in the form of disappointing results) when the final model is applied to the independent test data.
Limitations
Naturally, cross-validation is not a panacea and has a number of limitations worth keeping in mind. First, when working with complex models or large datasets, K-folds cross-validation can be computationally expensive, as each model must be fit K times instead of just once (although for simple estimators such as linear regression coefficients, analytic computation of cross-validated model performance is possible). Second, for reasons related to the bias-variance tradeoff discussed earlier, cross-validation is not completely unbiased and will sometimes underestimate the true out-of-sample perfor-mance. Third, under most implementations, cross-valida-tion produces nondeterministic results. This is arguably not a real weakness at all, inasmuch as estimation uncer-tainty is a fact of life; however, researchers used to think-ing of p < .05 as a binary decision criterion for the “realness” of an effect may initially struggle to acclimate to a world where p = .04 in one iteration can turn into p = .07 in another.
Lastly, and most importantly, the ability to easily cross-validate virtually any data analysis procedure is not a license to experiment with any and all analyses that cross one’s mind. It is important to recognize that standard concerns about p-hacking or data-contingent analysis still apply (albeit to a lesser extent). Cross-validation will only control overfitting appropriately so long as any researcher degrees of freedom are included within the cross-valida-tion loop (Varma & Simon, 2006). In other words, researchers should ideally embed any model selection steps into the cross-validation procedure itself, rather than simply picking the model that gives the best cross-validated result (for further explanation, see Cawley & Talbot, 2010; Krstajic, Buturovic, Leahy, & Thomas, 2014; Varma & Simon, 2006). Care should also be taken to avoid “leakage” of information between training and test datasets, which can manifest in subtle but pernicious ways. For example, even a seemingly innocuous step like standardizing the columns of an entire dataset prior to cross-validated analysis can lead to overfitting (because the rows that comprise the test set have already been scaled based in part on knowledge of the values in the training set).
Despite these limitations, the importance of integrating cross-validation into most analysis pipelines is difficult to
overstate. In applied machine learning settings, some form of cross-validation is practically mandatory when reporting the results of a predictive model. Adopting simi-lar conventions in psychology would likely go a long way toward improving the reliability of reported findings. Con-veniently, simple implementations of cross-validation can often be written in just a few lines of code, and off-the-shelf utilities are available for many languages and statisti-cal packages. We have made interactive examples written in Python and R available online (http://github.com/ tyarkoni/PPS2016).
Regularization
Cross-validation provides a means of estimating how capably a model can generalize to new data. However, it does not directly prevent overfitting (though it can do so indirectly—e.g., by facilitating better model selection). If a model is overfitting the data, the main contribution of cross-validation will be to inform the model’s author that the model is overfitting. Although such knowledge is undeniably useful, the fact remains that sometimes researchers want to actually improve their models and not just to know that the existing ones are performing inadequately. Here, another approach, called regulariza-tion, can potentially be of greater utility.
Regularization consists of trying to improve a statistical prediction by constraining one’s model to respect prior knowledge. In practice, regularization in machine learn-ing is most commonly accomplished by increasingly “penalizing” a model (technically, penalizing the cost function) as it grows more complex. That is, in addition to the standard objective(s) that a model is supposed to achieve, the estimation is also constrained to produce solutions that, other things being equal, are considered “simpler.” For example, in linear regression estimated via OLS—the foundation of most statistical analysis in psy-chology—the goal of the estimation is to identify the set of coefficients that minimizes the sum of squared devia-tions between the observed scores and the model’s pre-dictions. In a widely used form of penalized regression called lasso regression (Tibshirani, 1996, 2011), this least-squares criterion is retained, but the overall cost function that the estimation seeks to minimize now includes an additional penalty term that is proportional to the sum of the absolute values of the coefficients. In other words, the estimation of the regression model now has to find a set of coefficients that give an optimal compromise (opti-mal in the sense of minimizing the cost function) between the two competing goals of (a) minimizing the sum-of-squares and (b) having as small an absolute sum as pos-sible. These two criteria are typically in tension with one another, because the more complex a model is allowed to be (e.g., the more nonzero coefficients it is allowed to
14 Yarkoni, Westfall
retain), the more variance it can explain in the observed scores, but this implies a larger sum of absolute coeffi-cients. Thus, we once again see echoes of the bias-variance tradeoff discussed above: Relative to OLS, lasso regression produces intentionally biased coefficients.
To intuitively see how a penalized regression method like the lasso can help reduce overfitting, consider how the behavior of OLS is impacted by the addition of the aforementioned penalty parameter. In the traditional (unpenalized) setting, linear regression virtually always produces a nonzero coefficient for every term in the model—because there is always some small statistical association between every predictor and the outcome variable. In contrast, the lasso will tend to “shrink” small coefficients to zero, because the net benefit of including each additional term in the prediction equation is coun-terbalanced by an increase in the penalty term (i.e., the
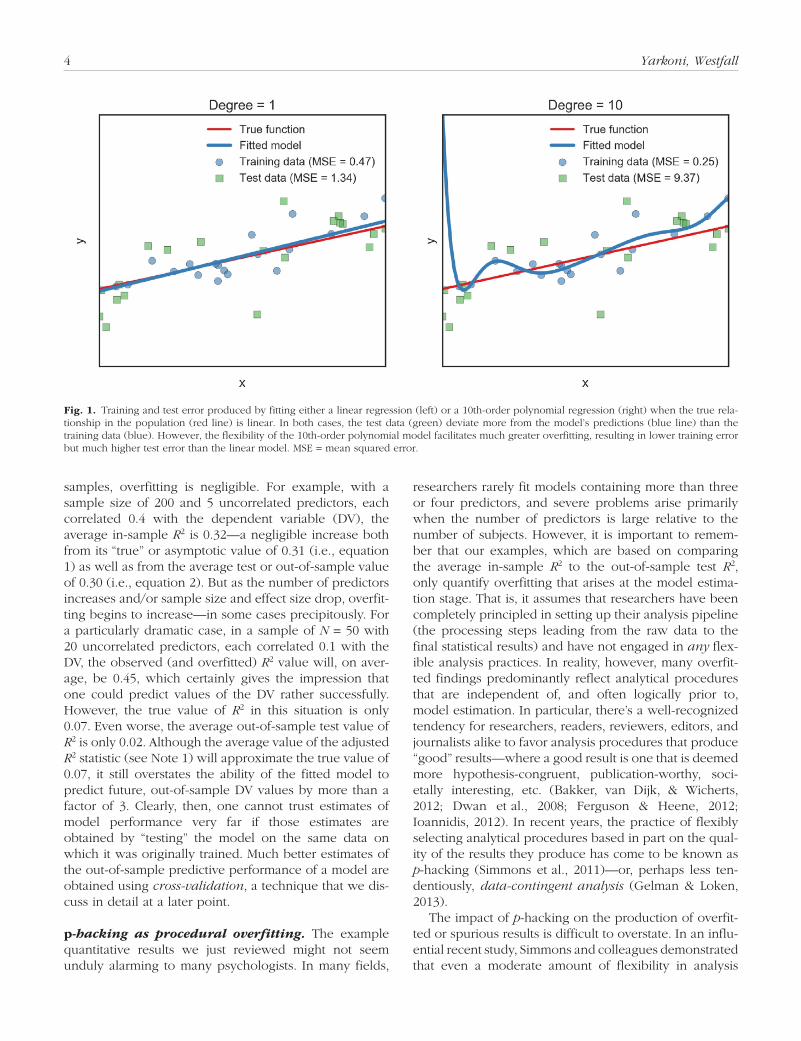
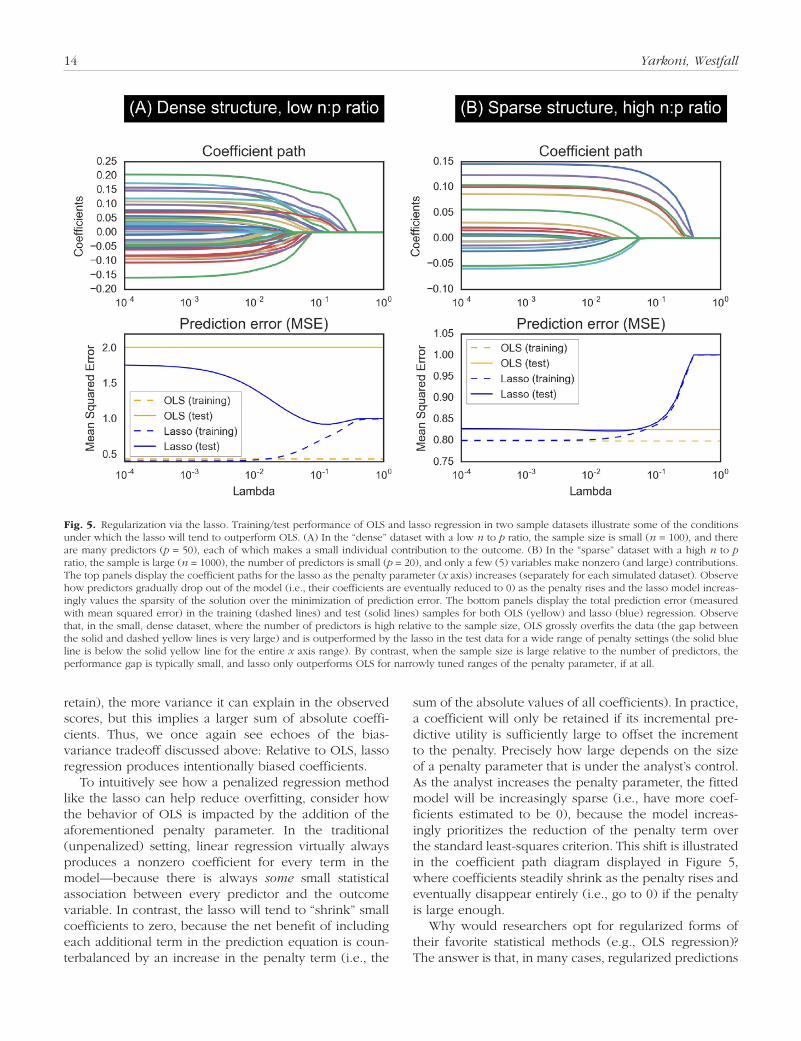
sum of the absolute values of all coefficients). In practice, a coefficient will only be retained if its incremental pre-dictive utility is sufficiently large to offset the increment to the penalty. Precisely how large depends on the size of a penalty parameter that is under the analyst’s control. As the analyst increases the penalty parameter, the fitted model will be increasingly sparse (i.e., have more coef-ficients estimated to be 0), because the model increas-ingly prioritizes the reduction of the penalty term over the standard least-squares criterion. This shift is illustrated in the coefficient path diagram displayed in Figure 5, where coefficients steadily shrink as the penalty rises and eventually disappear entirely (i.e., go to 0) if the penalty is large enough.
Why would researchers opt for regularized forms of their favorite statistical methods (e.g., OLS regression)? The answer is that, in many cases, regularized predictions
Fig. 5. Regularization via the lasso. Training/test performance of OLS and lasso regression in two sample datasets illustrate some of the conditions under which the lasso will tend to outperform OLS. (A) In the “dense” dataset with a low n to p ratio, the sample size is small (n = 100), and there are many predictors (p = 50), each of which makes a small individual contribution to the outcome. (B) In the “sparse” dataset with a high n to p ratio, the sample is large (n = 1000), the number of predictors is small (p = 20), and only a few (5) variables make nonzero (and large) contributions. The top panels display the coefficient paths for the lasso as the penalty parameter (x axis) increases (separately for each simulated dataset). Observe how predictors gradually drop out of the model (i.e., their coefficients are eventually reduced to 0) as the penalty rises and the lasso model increas-ingly values the sparsity of the solution over the minimization of prediction error. The bottom panels display the total prediction error (measured with mean squared error) in the training (dashed lines) and test (solid lines) samples for both OLS (yellow) and lasso (blue) regression. Observe that, in the small, dense dataset, where the number of predictors is high relative to the sample size, OLS grossly overfits the data (the gap between the solid and dashed yellow lines is very large) and is outperformed by the lasso in the test data for a wide range of penalty settings (the solid blue line is below the solid yellow line for the entire x axis range). By contrast, when the sample size is large relative to the number of predictors, the performance gap is typically small, and lasso only outperforms OLS for narrowly tuned ranges of the penalty parameter, if at all.
Prediction vs. Explanation 15
will generalize much better to new data. The biggest ben-efits are typically obtained when the number of potential predictors p is large relative to the sample size n—a situ-ation that is not uncommon in many areas of psychology (e.g., personality, developmental, educational, relation-ship research). Under such conditions, OLS tends to grossly overfit the training data, whereas a regularized approach like lasso regression will tend to perform much better for almost any reasonable value of the penalty parameter (e.g., Fig. 5A). The intuition for this is closely tied to the bias-variance tradeoff discussed earlier. When the number of available predictors is large relative to the number of observations, OLS regression will tend to overfit the data, because the odds are high that some of the many available predictors will happen to capture some variation in the training sample observations purely by chance. In other words, the variance of the solutions produced by OLS will be high (though the bias is low). The lasso, by contrast, is constrained to only retain coef-ficients with large values. By formally introducing bias in this way, the analyst is in effect telling the lasso regres-sion model to ignore small variations in the data and only pay attention to relatively strong patterns—which are, generally speaking, more likely to generalize to new samples.
Of course, as we noted earlier, there is no such thing as a free lunch. The downside of using a regularized method like lasso regression is that, under data-rich con-ditions, careful tuning of the penalty parameter may be required in order to obtain better out-of-sample perfor-mance. Worse, careless application can result in much higher out-of-sample prediction error (as is apparent, for instance, in Fig. 5B for very high values of the penalty parameter). Thus, our overarching point is not that researchers should always use regularized methods but that a thoughtful analyst should adapt her methods to the problem at hand. In some cases, OLS and other tradi-tional analysis tools in psychology will be perfectly ade-quate for the job; in other cases, application of traditional methods will result in catastrophically poor predictions that could have been easily avoided through application of common machine learning methods. Our argument is simply that psychologists should be sufficiently familiar with the latter methods to be able to apply them in cases where they are clearly indicated.
Psychology as a Predictive Science
Having introduced a number of core machine learning concepts and discussed their relation to traditional psy-chological approaches, we now turn to consider concrete applications. In this section, we review machine learning applications to psychological research that go beyond the simple (though important) observation that large
samples and routine cross-validation are critical in order to limit overfitting. We begin with applications that are relevant primarily to applied researchers and then con-sider ways in which machine learning can be used to inform and advance psychological theory. In interactive notebooks made available online (http://github.com/tyarkoni/PPS2016), we also provide sample Python and R code that illustrates the application of many of the meth-ods described throughout this paper.
Predicting for the sake of prediction
In much of psychology, researchers privilege theoretical understanding over concrete prediction. However, in many applied domains—for example, much of industrial-organizational psychology, educational psychology, and clinical psychology—achieving accurate prediction is often the primary stated goal of the research enterprise. For example, the finding that the personality trait of Con-scientiousness is robustly associated with better academic performance (Poropat, 2009) appears important in large part because it seems to offer the promise of improved educational outcomes. As Poropat (2009) observed in motivating a large meta-analysis of personality and aca-demic performance:
Apart from its theoretical value, there is considerable practical value in being able to statistically predict academic performance. Among the member countries of the Organisation for Economic Cooperation and Development (OECD), an average of 6.2% of gross domestic product is spent on educational activities, while the average young person in these countries will stay in education until the age of 22 (OECD, 2007). Clearly, the academic performance of students is highly valued within these advanced economies, such that any increments in understanding of academic performance have substantial implications. (p. 323)
Although we find such reasoning compelling in prin-ciple, as a practical matter, it is unclear what the actual implications are of observing a meta-analytic correlation of 0.19 between Conscientiousness and academic perfor-mance. A key problem is that very few studies in this lit-erature, or in other applied psychology domains, ever report cross-validated indices of predictive accuracy. Although we do not pretend to think that cross-validation alone is sufficient to bridge the gap between research study and real-world application, it is a critical step in the right direction. We suggest that applied psychologists should develop the habit of reporting cross-validated results alongside standard goodness-of-fit metrics or sta-tistical significance tests whenever possible—ideally in
16 Yarkoni, Westfall
predictively meaningful units (e.g., the proportion of mis-classified patients, or the average error in predicted class grade).
Using machine learning techniques instrumentally
Machine learning concepts and techniques can often increase the efficiency and reproducibility of a research-er’s analysis pipeline even when they do not appreciably alter the end result. A common use case occurs when researchers seek to demonstrate the reliability of a par-ticular measure by appealing to its convergence with other measures and/or its consistency across different raters. In such cases, a demonstration that a variable can be accurately predicted out-of-sample using any number of other available variables can achieve essentially the same ends much more efficiently. For example, Du, Tao, and Martinez (2014) proposed that, in addition to the six “basic” facial emotional expressions of happiness, sur-prise, sadness, anger, fear, and disgust (Ekman, 1992), human beings can reliably produce and detect additional compound expressions. After having 230 participants produce 15 such expressions (e.g., happily surprised, happily disgusted, sadly fearful, etc.), Du et al. used 10-fold cross-validated kernel discriminant analysis to demonstrate that these expressions could be discrimi-nated from one another with approximately 75% accu-racy, lending credence to the idea that facial expressions of compound emotions can indeed convey information about more complex emotional states than have typically been considered in the literature. Although a similar con-clusion could presumably be achieved by obtaining rat-ings from human subjects, the use of an automated classifier is considerably more efficient, reproducible, and extensible (e.g., one would not have to recruit new raters when new photos were added to the stimulus set).
The same approach can also be profitably applied in cases where manual efforts would be hopelessly imprac-tical. For example, Yarkoni, Ashar, and Wager (2015) studied how individual differences in the personality trait of Agreeableness modulate people’s responses to appeals for charitable donation. To maximize statistical power and support more generalizable conclusions ( Judd, Westfall, & Kenny, 2016; Westfall, Kenny, & Judd, 2014), the authors opted to dynamically generate every stimulus at presentation time by combining constituent elements into a never-before-seen composite. This decision intro-duced an analytical challenge, however: Because each stimulus was only ever seen by a single subject on a single trial, how could the stimuli be reliably normed? The author solved the problem by using machine learn-ing techniques to predict the expected rating of each composite stimulus based on the mean ratings of the
constituent elements. Cross-validated analyses demon-strated good predictive accuracy, enabling the authors to use the resulting norms in their subsequent analyses. Needless to say, obtaining human ratings for nearly 5,000 different stimuli would have been considerably more challenging.
Evaluating model performance using consensus metrics
One attractive feature of predictive accuracy as a criterion for evaluating models is that it can serve as a common metric for comparing the performance of radically different, nonnested statistical models. A somewhat tradi-tional way to compare nonnested models is to rely on the Aikake Information Criterion (AIC) or Bayesian Information Criterion (BIC), but these are subject to a variety of somewhat complicated assumptions (Burnham & Anderson, 2004; Vrieze, 2012) and in any case can only be computed for models that have a tractable likelihood function, which is not the case for many commonly used machine learning algorithms (e.g., random forests). A focus on predictive accuracy can provide a simple, gen-eral solution that largely sidesteps such issues. We believe most researchers can agree that a good model should be able to accurately predict new observations—and, other things being equal, better models should generate better predictions.
An emphasis on predictive accuracy measures has played a central role in facilitating rapid progress in machine learning (Donoho, 2015). Many machine learn-ing researchers now evaluate their models primarily by assessing their performance on large “gold standard” datasets (e.g., the ImageNet database in computer vision; Deng et al., 2009). Importantly, the presence of consen-sus metrics for model evaluation has not led researchers to abdicate theoretically motivated work in favor of brute force computation or trial-and-error experimentation. To the contrary, most major breakthroughs in prediction accuracy over the past decade—particularly in the area of deep learning—can be traced directly to important new computational or theoretical insights (for review, see LeCun, Bengio, & Hinton, 2015; Schmidhuber, 2015). We believe that many fields in psychology would benefit from a similar approach. Indeed, a similar trend is already evident in some domains; for example, the development of large psycholinguistic databases such as the English Lexicon Project (Balota et al., 2007) has provided researchers with a powerful and widely used benchmark for evaluating new measures and models (e.g., Brysbaert & New, 2009; Yarkoni, Balota, & Yap, 2008). And just as in machine learning, the production of new models that explain ever more variance in behavioral tasks like word naming has been guided by, and reciprocally informs,
Prediction vs. Explanation 17
psycholinguistic theory (e.g., Baayen, Milin, Đurdevic, Hendrix, & Marelli, 2011; Perry, Ziegler, & Zorzi, 2010; Yap, Balota, Sibley, & Ratcliff, 2012).
Increasing interpretability
Machine learning algorithms are sometimes pejoratively described as “black box” approaches that can produce good predictions but are virtually impossible to under-stand. Although it is true that the representations learned by many state-of-the-art machine learning approaches—most notably “deep” artificial neural networks (LeCun et al., 2015)—can be impenetrable to human compre-hension (but see Zeiler & Fergus, 2014), this is a property of specific approaches or implementations and not a fea-ture of predictive models in general. To the contrary, researchers who value interpretability over predictive accuracy can directly benefit from machine learning approaches in at least five ways.
First, as we discussed above, many machine learning algorithms provide explicit control over the complexity of the fitted model—for example, by varying the penalty parameter in lasso regression (cf. Fig. 5)—thus allowing researchers to deliberately seek out simpler solutions than traditional techniques like OLS would produce (at the potential cost of reduced predictive power). Second, some classes of learning algorithms are intrinsically interpreta-ble. For example, a class of algorithms called decision trees generate simple conditional rules (e.g., “if gender is Female and age is greater than 42, then predict a value of 1”) that are much easier to understand intuitively than the continuous-valued prediction equations generated by regression approaches (Apté & Weiss, 1997).
Third, a prediction-focused approach often makes it easier to quantify and appreciate the uncertainty sur-rounding any given interpretation of one’s data. Statisti-cians regularly caution scientists that regression coefficients cannot be assigned straightforward interpre-tations. For example, we and others have demonstrated that under typical measurement conditions, statistical sig-nificance patterns observed in fitted regression models are often very unstable and can produce highly mislead-ing conclusions (Shear & Zumbo, 2013; Westfall & Yarkoni, 2016). Although a focus on prediction cannot solve such problems, it will often lead to better calibrated (and generally more careful) interpretation of results, as researchers will observe that very different types of mod-els (e.g., lasso regression vs. support vector regression vs. random forests) can routinely produce comparably good predictions even when model interpretations are very different—highlighting the uncertainty in the model selection and suggesting that the solutions produced by any particular model should be viewed with a healthy degree of skepticism.
Fourth, although it is true that the contributions of individual predictors can be hard to interpret in complex predictive models, a relatively common and often very informative technique is to compare a model’s predictive performance when different sets of predictive features are included. This practice is closely related to that of hierar-chical regression on sets of variables (Cohen, Cohen, West, & Aiken, 2013), which may be more familiar to psychologists. For example, suppose one seeks to under-stand which factors predict binge drinking in adoles-cents, as in a study discussed earlier (Whelan et al., 2014). There are literally thousands of potentially informative—but densely intercorrelated—demographic, dispositional, behavioral, genetic, and neurobiological variables one could investigate. However, by comparing a “full” model that contains the full set of predictive features with partial models that iteratively omit all variables related to, say, brain structure, personality, or personal history, one can potentially gain valuable insights into the relative contri-butions of different factors (e.g., Whelan et al., 2014, showed that personal history alone is considerably more useful for predicting binge drinking than biological vari-ables, though the latter make a small incremental contri-bution). Such an approach is also arguably a more accurate reflection of the true causal graphs in most areas of psychology, which are typically dense and populated by many small influences (the so-called “crud factor” in psychology; Meehl, 1990).
Lastly, a prediction-focused perspective can help gain a deeper understanding of the general structure of one’s data. For example, suppose one is interested in the rela-tionship between personality and language use (Fast & Funder, 2008; Pennebaker & King, 1999; Yarkoni, 2010). The traditional way to approach this question would be to ask which language variables are associated with spe-cific traits (e.g., Do Extraverts use socialization-related words more often?). However, a complementary question that should perhaps be asked first is, What kind of param-eter space are we operating in? That is, is the language/personality space sparse, so that a relatively small num-ber of language variables account for the bulk of the explainable effects of personality on language? Or is it dense, with hundreds, or even thousands, of distinct but very small contributions? And can the space be ade-quately modeled by considering just the (additive) main effects of the predictors, or must one consider potentially very complex higher order interactions in order to gener-ate adequate predictions?
Such questions may have important implications for both theoretical understanding and study design but are not easily addressed using classical statistical approaches. By contrast, the relative performance of different kinds of machine learning algorithms can potentially provide important insights into the nature of the data. For instance,
18 Yarkoni, Westfall
if lasso regression outperforms ridge regression (a tech-nique similar to lasso regression but that does not place the same emphasis on sparseness), then one might con-jecture that the underlying causal graph is relatively sparse. If generalized additive models, support vector machines, or random forests outperform standard regres-sion models, then there may be relatively large low-order (e.g., two-way) interactions or other nonlinearities that the machine learning methods implicitly capture but that regression does not (Breiman, 2001a; Friedman, 2001; S. Wood, 2006). And if very complex deep learning archi-tectures perform much better than virtually all other models—as is increasingly the case in many psychology-related domains such as computer vision and natural lan-guage processing (LeCun et al., 2015)—one may want to consider the possibility that simpler, more interpretable models are simply not adequate for explaining the phe-nomenon of interest.
Asking predictive questions
Perhaps the biggest benefits of a prediction oriented within psychology are likely to be realized when psy-chologists start asking research questions that are natu-rally amenable to predictive analysis. Doing so requires setting aside, at least some of the time, deeply ingrained preoccupations with identifying the underlying causal mechanisms that are mostly likely to have given rise to some data—in other words, choosing complex predic-tion-focused models over simpler, theoretically elegant models. Although this may initially sound like a radical prescription, we argue that, often, only a slight shift in perspective is required. In many cases, a traditional research question is already arguably more naturally addressed using a predictive approach. In other cases, a research question can be relatively easily reformulated into a form amenable to predictive analysis. We consider two published examples of such predictive research questions.
Inferring personality from online media. A grow-ing literature in personality has focused on the question of whether it is possible to infer a person’s personality from his or her social media footprint—for example, his or her Facebook profile (Back et al., 2010; Gosling, Augustine, Vazire, Holtzman, & Gaddis, 2011), personal blog or website (Vazire & Gosling, 2004; Yarkoni, 2010), musical preferences (Rawlings & Ciancarelli, 1997; Rentfrow & Gosling, 2003), and so on. This question has tradition-ally been addressed by testing for statistically significant associations between personality dimensions and other variables. For example, Back et al. (2010) found that observer ratings of Facebook profiles were correlated with the target individuals’ actual self-reported personalities but
not with the targets’ ideal self-ratings; the authors con-cluded that Facebook profiles reflect people’s real selves and not self-idealizations.
Although such an approach is informative, it is not necessarily the most sensitive way to address what appears to be an inherently predictive question. If one wants to know if personality can be discerned from pub-licly available digital records, or if some traits are easier to predict than others, one should ideally build a predic-tive model that has as its primary goal the successful prediction of the outcome in question. The extent to which one is able to predict that outcome when leverag-ing all available information can often provide valuable insights. For example, in a massive study involving over 58,000 Facebook users who completed a variety of psy-chometric questionnaires, Kosinski, Stillwell, and Graepel (2013) sought to predict stable individual differences from the “Likes” displayed on participants’ profile pages (an average of 170 Likes per person). Using cross-validated linear and logistic regression models, the authors were able to predict the Big Five personality traits with varying accuracy (cross-validated correlation coefficients ranged from 0.29 for Conscientiousness to 0.43 for Openness to Experience). In addition to unambiguously demonstrating that personality can be reliably inferred from online foot-prints, a major advantage of the Kosinski et al. study is its ability to provide good comparative estimates of how well different traits can be predicted using multivariate predic-tive models—information that cannot be easily extracted from the simple bivariate associations and p values typi-cally reported in psychology.
Inferring implicit recognition of subjectively unfa-miliar stimuli. The outcomes of criminal investiga-tions and judicial proceedings often hinge on whether a suspect or witness can remember particular people or objects, such as those from a crime scene. Yet eyewit-nesses frequently misremember events (Loftus & Palmer, 1996), and suspects may be motivated to respond falsely. A question of considerable theoretical and practical sig-nificance is whether the human mind/brain encodes a trace of the true events one has witnessed, even when the person is unable or unwilling to correctly report this recognition. Extracting such knowledge using behavioral methods is a daunting proposition, but a tantalizing pos-sibility is that brain imaging technology such as fMRI might be able to help identify otherwise inaccessible rep-resentations of true events.
To test this possibility, Rissman, Greely, and Wagner (2010) had 20 participants study a set of faces and then, after a 1-hour delay, complete a recognition task during fMRI scanning. The authors used a regularized logistic regression model in which each participant’s distributed fMRI activation patterns on each trial were used to
Prediction vs. Explanation 19
predict both the subjective recognition ratings given by participants and the objective (old vs. new) status of each presented face, with the predictive accuracy of the model assessed using LOOCV. They found that although the brain data could be used to predict participants’ subjec-tive recognition ratings with very high (up to 90%) accu-racy, it could not predict the objective old versus new status of faces consistently above chance levels. These results are important not only for their theoretical interest but also because they call into question the legal admis-sibility of using brain data to demonstrate that a suspect does or does not recognize some person or object. Although the Rissman et al. study certainly does not rep-resent the final word on the matter (e.g., the sample size was relatively small, so the predictive model may have been underpowered), it provides an elegant proof-of-concept of the utility of a predictive approach in address-ing questions of basic interest to many cognitive neuroscientists and cognitive psychologists. We antici-pate that similar applications will become increasingly widespread in the coming years.
Conclusion
In an influential statistics paper, Breiman (2001b) argued that there are two cultures in statistical modeling. The vast majority of statisticians belong to the “data modeling culture,” in which data are assumed to arise from a par-ticular data-generating process, and the primary goal is to estimate the true parameters of this process. By contrast, a minority of statisticians (and most machine learning researchers) belong to the “algorithmic modeling cul-ture,” in which the data are assumed to be the result of some unknown and possibly unknowable process and the primary goal is to find an algorithm that results in the same outputs as this process given the same inputs. These two cultures align quite closely with what we have called the explanation-focused and prediction-focused approaches to science, respectively. Our argument has been that psychologists stand to gain a lot by relaxing their emphasis on identifying the causal mechanisms governing behavior and focusing to a greater extent on predictive accuracy.
We hasten to emphasize that we are arguing for a rela-tive redistribution of psychologists’ energies and not for an outright abandonment of efforts to mechanistically explain human behavior. In our discussion of explana-tion and prediction, we have emphasized the differences between the two approaches in order to make it clear what shifting toward a more predictive psychology would entail and what benefits such a shift would provide. We readily acknowledge, however, that prediction-focused approaches are not appropriate for all research questions in psychology. In particular, well-designed, high-powered,
randomized, controlled experiments are, and should remain, the gold standard for drawing causal conclusions about the way the human mind operates. More generally, we are not suggesting that psychologists (save perhaps those working in applied settings) should view predic-tion as an end unto itself, to be prioritized ahead of explanation. Rather, our contention is that researchers’ failure to take prediction seriously is a direct contributor to many of the problems observed in explanatory psy-chology in recent years. Thus, we argue that even in cases where causal explanation is (appropriately) the primary objective, machine learning concepts and meth-ods can still provide invaluable benefits when used instrumentally—by minimizing p-hacking, increasing research efficiency, facilitating evaluation of model per-formance, and increasing interpretability.
Ultimately, the new machine learning approaches working their way into psychology should be seen as opportunities, not threats. As with any major advance in methodology, psychological scientists should work to make sure they are equipped to apply a mix of classical and new methods to their research as needed. There is no denying that in many cases, a focus on prediction will reveal major holes in an otherwise elegant explanatory story, and many well-known findings—some with seem-ingly large effect sizes—will likely fail to survive rigorous cross-validated analysis in large samples. But those explanatory models that successfully capture important aspects of human psychology should be much more likely to survive such tests—and will emerge with stron-ger empirical support as a result. What we will hopefully then be left with are models that can demonstrably do something foundational to the study of psychology: reli-ably predict human behavior.
Declaration of Conflicting Interests
The authors declared that they had no conflicts of interest with respect to their authorship or the publication of this article.
Funding
This research was funded by the National Institute of Mental Health NIH Grant R01MH096906.
Notes
1. In fact, it is well known that R2 is a biased estimator even of the performance of equation 1. Adjustments to the R2 statistic that correct for this bias do exist and are sometimes applied, but we note that even these adjusted R2 statistics still estimate the performance of equation 1 and not equation 2. This dis-tinction is illustrated a little more concretely at the end of this subsection.2. Note that this is a heuristic and not a law. There are plenty of situations where a poorly chosen model will perform terribly no matter how much data it is fed.
20 Yarkoni, Westfall
3. Note that we use the term Big Data here to refer to datasets that are “long” rather than “wide.” The critical element in reduc-ing overfitting is the number of observations relative to the number of predictors. Datasets that include thousands of vari-ables but have relatively few cases are, if anything, even more susceptible to overfitting.4. It is important to note that, when evaluating the test perfor-mance of a fitted model, one must apply the exact fitted model—for example, the specific regression equation obtained from the training dataset—to the test dataset. We have occasionally reviewed manuscripts in which the authors report that they “cross-validated” their analyses when in fact they have simply fitted the same model a second time in a new dataset. The latter approach is not cross-validation and does little to mitigate overfitting.
References
Apté, C., & Weiss, S. (1997). Data mining with decision trees and decision rules. Future Generation Computer Systems, 13, 197–210. doi:10.1016/S0167-739X(97)00021-6
Baayen, R. H., Milin, P., Đurdevic, D. F., Hendrix, P., & Marelli, M. (2011). An amorphous model for morphological process-ing in visual comprehension based on naive discriminative learning. Psychological Review, 118, 438–481. doi:10.1037/a0023851
Back, M. D., Stopfer, J. M., Vazire, S., Gaddis, S., Schmukle, S. C., Egloff, B., & Gosling, S. D. (2010). Facebook profiles reflect actual personality, not self-idealization. Psychological Science, 21, 372–374. doi:10.1177/0956797609360756
Bakker, M., van Dijk, A., & Wicherts, J. M. (2012). The rules of the game called psychological science. Perspectives on Psychological Science, 7, 543–554. doi:10.1177/1745691612459060
Balota, D. A., Yap, M. J., Hutchison, K. A., Cortese, M. J., Kessler, B., Loftis, B., . . . Treiman, R. (2007). The English Lexicon Project. Behavior Research Methods, 39, 445–459. doi:10.3758/BF03193014
Bentley, R. A., O’Brien, M. J., & Brock, W. A. (2014). Mapping collective behavior in the big-data era. Behavioral & Brain Sciences, 37, 63–76. doi:10.1017/S0140525X13000289
Biswal, B. B., Mennes, M., Zuo, X.- N., Gohel, S., Kelly, C., Smith, S. M., . . . Milham, M. P. (2010). Toward discovery sci-ence of human brain function. Proceedings of the National Academy of Sciences, USA, 107, 4734–4739. doi:10.1073/pnas.0911855107
Bond, R. M., Fariss, C. J., Jones, J. J., Kramer, A. D. I., Marlow, C., Settle, J. E., & Fowler, J. H. (2012). A 61-million-person experiment in social influence and political mobilization. Nature, 489, 295–298. doi:10.1038/nature11421
Breiman, L. (2001a). Random forests. Machine Learning, 45, 5–32. doi:10.1023/A:1010933404324
Breiman, L. (2001b). Statistical modeling: The two cultures. Statistical Science, 16, 199–215.
Brewer, J. B., Zhao, Z., Desmond, J. E., Glover, G. H., & Gabrieli, J. D. E. (1998). Making memories: Brain activity that predicts how well visual experience will be remembered. Science, 281, 1185–1187. doi:10.1126/science.281.5380.1185
Browne, M. W. (2000). Cross-validation methods. Journal of Mathematical Psychology, 44, 108–132. doi:10.1006/jmps.1999.1279
Browne, M. W., MacCallum, R. C., Kim, C.- T., Andersen, B. L., & Glaser, R. (2002). When fit indices and residu-als are incompatible. Psychological Methods, 7, 403–421. doi:10.1037/1082-989X.7.4.403
Brysbaert, M., & New, B. (2009). Moving beyond Kucera and Francis: A critical evaluation of current word frequency norms and the introduction of a new and improved word frequency measure for American English. Behavior Research Methods, 41, 977–990. doi:10.3758/BRM.41.4.977
Bunea, F., She, Y., Ombao, H., Gongvatana, A., Devlin, K., & Cohen, R. (2011). Penalized least squares regression meth-ods and applications to neuroimaging. NeuroImage, 55, 1519–1527. doi:10.1016/j.neuroimage.2010.12.028
Burnham, K. P., & Anderson, D. R. (2004). Multimodel infer-ence understanding AIC and BIC in model selection. Soci-ological Methods & Research, 33, 261–304. doi:10.1177/ 0049124104268644
Cawley, G. C., & Talbot, N. L. C. (2010). On over-fitting in model selection and subsequent selection bias in perfor-mance evaluation. Journal of Machine Learning Research, 11, 2079–2107.
Chambers, C., & Munafo, M. (2013, June 5). Trust in science would be improved by study pre-registration. The Guardian. Retrieved from https://www.theguardian.com/science/blog/ 2013/jun/05/trust-in-science-study-pre-registration
Cohen, J. (1962). The statistical power of abnormal-social psy-chological research: A review. The Journal of Abnormal and Social Psychology, 65, 145–153. doi:10.1037/h0045186
Cohen, J. (1992). A power primer. Psychological Bulletin, 112, 155–159. doi:10.1037/0033-2909.112.1.155
Cohen, J., Cohen, P., West, S. G., & Aiken, L. S. (2013). Applied multiple regression/correlation analysis for the behavioral sciences. Abingdon, United Kingdom: Routledge.
Davis-Stober, C. P., & Dana, J. (2013). Comparing the accuracy of experimental estimates to guessing: A new perspective on replication and the “crisis of confidence” in psychology. Behavior Research Methods, 46, 1–14. doi:10.3758/s13428-013-0342-1
Dawes, R. M. (1979). The robust beauty of improper linear models in decision making. American Psychologist, 34, 571–582. doi:10.1037/0003-066X.34.7.571
Deng, J., Dong, W., Socher, R., Li, L.- J., Li, K., & Fei-Fei, L. (2009). ImageNet: A large-scale hierarchical image data-base. In IEEE Conference on Computer Vision and Pattern Recognition, 2009 (CVPR 2009) (pp. 248–255). New York, NY: Institute of Electrical and Electronics Engineers. doi:10 .1109/CVPR.2009.5206848
Domingos, P. (2012). A few useful things to know about machine learning. Communication of the ACM, 55(10), 78–87. doi:10.1145/2347736.2347755
Donoho, D. (2015, September). 50 years of data science. Paper presented at the Tukey Centennial workshop, Princeton, NJ.
Du, S., Tao, Y., & Martinez, A. M. (2014). Compound facial expressions of emotion. Proceedings of the National Academy of Sciences, USA, 111, E1454–E1462. doi:10.1073/pnas.1322355111
Dwan, K., Altman, D. G., Arnaiz, J. A., Bloom, J., Chan, A.- W., Cronin, E., . . . Williamson, P. R. (2008). Systematic review of the empirical evidence of study publication bias and
Prediction vs. Explanation 21
outcome reporting bias. PLoS ONE, 3(8), e3081. doi:10.1371/journal.pone.0003081
Ebersole, C. R., Atherton, O. E., Belanger, A. L., Skulborstad, H. M., Adams, R. B., Allen, J., . . . Nosek, B. A. (2015). Many labs 3: Evaluating participant pool quality across the aca-demic semester via replication. Retrieved from osf.io/ct89g
Ebstein, R. P., Novick, O., Umansky, R., Priel, B., Osher, Y., Blaine, D., . . . Belmaker, R. H. (1996). Dopamine D4 receptor (D4DR) exon III polymorphism associated with the human personality trait of novelty seeking. Nature Genetics, 12, 78–80. doi:10.1038/ng0196-78
Ekman, P. (1992). An argument for basic emotions. Cognition and Emotion, 6, 169–200. doi:10.1080/02699939208411068
Fast, L. A., & Funder, D. C. (2008). Personality as manifest in word use: Correlations with self-report, acquaintance report, and behavior. Journal of Personality and Social Psychology, 94, 334–346. doi:10.1037/0022-3514.94.2.334
Ferguson, C. J., & Heene, M. (2012). A vast graveyard of undead theories publication bias and psychological science’s aver-sion to the null. Perspectives on Psychological Science, 7, 555–561. doi:10.1177/1745691612459059
Friedman, J. H. (2001). Greedy function approximation: A gra-dient boosting machine. The Annals of Statistics, 29, 1189–1232.
Gelman, A., & Hill, J. (2006). Data analysis using regression and multilevel/hierarchical models (1st ed.). Cambridge, UK: Cambridge University Press.
Gelman, A., & Loken, E. (2013). The garden of forking paths: Why multiple comparisons can be a problem, even when there is no “fishing expedition” or “p-hacking” and the research hypothesis was posited ahead of time. Retrieved from http://www.stat.columbia.edu/~gelman/research/unpublished/ p_hacking.pdf
Gelman, A., & Weakliem, D. (2009). Of beauty, sex and power: Too little attention has been paid to the statistical challenges in estimating small effects. American Scientist, 97, 310–316.
Gosling, S. D., Augustine, A. A., Vazire, S., Holtzman, N., & Gaddis, S. (2011). Manifestations of personality in online social networks: Self-reported Facebook-related behav-iors and observable profile information. Cyberpsychology, Behavior, and Social Networking, 14, 483–488. doi:10.1089/cyber.2010.0087
Greenwald, A. G. (2012). There is nothing so theoretical as a good method. Perspectives on Psychological Science, 7, 99–108. doi:10.1177/1745691611434210
Hagerty, M. R., & Srinivasan, V. (1991). Comparing the pre-dictive powers of alternative multiple regression models. Psychometrika, 56, 77–85. doi:10.1007/BF02294587
Hastie, T., Tibshirani, R., & Friedman, J. (2009). The elements of statistical learning. New York, NY: Springer. Retrieved from http://link.springer.com/10.1007/978-0-387-84858-7
Holbert, R. L., & Stephenson, M. T. (2002). Structural equa-tion modeling in the communication sciences, 1995–2000. Human Communication Research, 28, 531–551. doi:10.1111/j.1468-2958.2002.tb00822.x
Horn, J. D. V., & Toga, A. W. (2013). Human neuroimaging as a “Big Data” science. Brain Imaging and Behavior, 8, 323–331. doi:10.1007/s11682-013-9255-y
Ioannidis, J. P. A. (2008). Why most discovered true associa-tions are inflated. Epidemiology, 19, 640–648. doi:10.1097/EDE.0b013e31818131e7
Ioannidis, J. P. A. (2012). Why science is not necessarily self-correcting. Perspectives on Psychological Science, 7, 645–654. doi:10.1177/1745691612464056
John, L. K., Loewenstein, G., & Prelec, D. (2012). Measuring the prevalence of questionable research practices with incen-tives for truth telling. Psychological Science, 23, 524–532. doi:10.1177/0956797611430953
Jonas, K. J., & Cesario, J. (2015). How can preregistration contrib-ute to research in our field? Comprehensive Results in Social Psychology, 1, 1–7. doi:10.1080/23743603.2015.1070611
Judd, C. M., Westfall, J., & Kenny, D. A. (2016). Experiments with more than one random factor: Designs, analytic mod-els, and statistical power. Annual Review of Psychology, 68, 601–625.
Klein, R. A., Ratliff, K. A., Vianello, M., Adams, R. B., Jr., Bahník, Š., Bernstein, M. J., . . . Nosek, B. A. (2014). Investigating variation in replicability: A “many labs” replication proj-ect. Social Psychology, 45, 142–152. doi:10.1027/1864-9335/a000178
Kosinski, M., Stillwell, D., & Graepel, T. (2013). Private traits and attributes are predictable from digital records of human behavior. Proceedings of the National Academy of Sciences, USA, 110, 5802–5805. doi:10.1073/pnas.1218772110
Krstajic, D., Buturovic, L. J., Leahy, D. E., & Thomas, S. (2014). Cross-validation pitfalls when selecting and assessing regres-sion and classification models. Journal of Cheminformatics, 6, 1–15. doi:10.1186/1758-2946-6-10
Kurtz, A. K. (1948). A research test of the Rorschach Test. Personnel Psychology, 1, 41–51. doi:10.1111/j.1744-6570.1948.tb01292.x
LeCun, Y., Bengio, Y., & Hinton, G. (2015). Deep learning. Nature, 521, 436–444. doi:10.1038/nature14539
Lehrer, J. (2010, December 13). The truth wears off. The New Yorker. Retrieved from http://www.newyorker.com/maga zine/2010/12/13/the-truth-wears-off
Lesch, K.- P., Bengel, D., Heils, A., Sabol, S. Z., Greenberg, B. D., Petri, S., . . . Murphy, D. L. (1996). Association of anxiety-related traits with a polymorphism in the serotonin transporter gene regulatory region. Science, 274, 1527–1531. doi:10.1126/science.274.5292.1527
Loftus, E. F., & Palmer, J. C. (1996). Eyewitness testimony. In Introducing psychological research (pp. 305–309). London, UK: Macmillan Education. Retrieved from http://link .springer.com/chapter/10.1007/978-1-349-24483-6_46
McNeish, D. M. (2015). Using lasso for predictor selection and to assuage overfitting: A method long overlooked in behav-ioral sciences. Multivariate Behavioral Research, 50, 471–484. doi:10.1080/00273171.2015.1036965
Meehl, P. E. (1990). Why summaries of research on psycho-logical theories are often uninterpretable. Psychological Reports, 66, 195–244. doi:10.2466/pr0.1990.66.1.195
Miller, G. (2012). The smartphone psychology manifesto. Perspectives on Psychological Science, 7, 221–237. doi:10. 1177/1745691612441215
Mosier, C. I. (1951). The need and means of cross validation. I. Problems and designs of cross-validation. Edu cational
22 Yarkoni, Westfall
and Psychological Measurement, 11, 5–11. doi:10.1177/ 001316445101100101
Munafò, M. R., & Flint, J. (2011). Dissecting the genetic archi-tecture of human personality. Trends in Cognitive Sciences, 15, 395–400. doi:10.1016/j.tics.2011.07.007
New, B., Pallier, C., Brysbaert, M., & Ferrand, L. (2004). Lexique 2: A new French lexical database. Behavior Research Methods, Instruments, & Computers, 36, 516–524. doi:10.3758/BF03195598
Nosek, B. A., & Lakens, D. (2014). Registered reports: A method to increase the credibility of published results. Social Psychology, 45, 137–141. doi:10.1027/1864-9335/a000192
Nosek, B. A., Spies, J. R., & Motyl, M. (2012). Scientific Utopia II. Restructuring incentives and practices to promote truth over publishability. Perspectives on Psychological Science, 7, 615–631. doi:10.1177/1745691612459058
Open Science Collaboration. (2015). Estimating the repro-ducibility of psychological science. Science, 349(6251), aac4716. doi:10.1126/science.aac4716
Pennebaker, J. W., & King, L. A. (1999). Linguistic styles: Language use as an individual difference. Journal of Personality and Social Psychology, 77, 1296–1312. doi:10. 1037/0022-3514.77.6.1296
Perry, C., Ziegler, J. C., & Zorzi, M. (2010). Beyond single syl-lables: Large-scale modeling of reading aloud with the Connectionist Dual Process (CDP++) model. Cognitive Psychology, 61, 106–151. doi:10.1016/j.cogpsych.2010.04.001
Pinheiro, J., & Bates, D. (2000). Mixed-effects models in S and S-PLUS. New York, NY: Springer.
Poropat, A. E. (2009). A meta-analysis of the five-factor model of personality and academic performance. Psychological Bulletin, 135, 322–338. doi:10.1037/a0014996
Rawlings, D., & Ciancarelli, V. (1997). Music preference and the Five-Factor Model of the NEO Personality Inventory. Psychology of Music, 25, 120–132. doi:10.1177/ 0305735697252003
Rentfrow, P. J., & Gosling, S. D. (2003). The do re mi’s of every-day life: The structure and personality correlates of music preferences. Journal of Personality and Social Psychology, 84, 1236–1256. doi:10.1037/0022-3514.84.6.1236
Ripke, S., Wray, N. R., Lewis, C. M., Hamilton, S. P., Weissman, M. M., Breen, G., . . . Sullivan, P. F. (2013). A mega-analysis of genome-wide association studies for major depressive disorder. Molecular Psychiatry, 18, 497–511. doi:10.1038/mp.2012.21
Rissman, J., Greely, H. T., & Wagner, A. D. (2010). Detecting individual memories through the neural decoding of mem-ory states and past experience. Proceedings of the National Academy of Sciences, USA, 107, 9849–9854. doi:10.1073/pnas.1001028107
Rowe, M. L., & Goldin-Meadow, S. (2009). Early gesture selec-tively predicts later language learning. Developmental Science, 12, 182–187. doi:10.1111/j.1467-7687.2008.00764.x
Schmidhuber, J. (2015). Deep learning in neural networks: An overview. Neural Networks, 61, 85–117. doi:10.1016/j .neunet.2014.09.003
Schmitt, N., Coyle, B. W., & Rauschenberger, J. (1977). A Monte Carlo evaluation of three formula estimates of cross-validated multiple correlation. Psychological Bulletin, 84, 751–758. doi:10.1037/0033-2909.84.4.751
Sedlmeier, P., & Gigerenzer, G. (1989). Do studies of statistical power have an effect on the power of studies? Psychological Bulletin, 105, 309–316. doi:10.1037/0033-2909.105.2.309
Shao, J. (1993). Linear model selection by cross-validation. Journal of the American Statistical Association, 88, 486–494. doi:10.1080/01621459.1993.10476299
Shear, B. R., & Zumbo, B. D. (2013). False positives in mul-tiple regression unanticipated consequences of measure-ment error in the predictor variables. Educational and Psychological Measurement, 73, 733–756. doi:10.1177/ 0013164413487738
Shmueli, G. (2010). To explain or to predict? Statistical Science, 25, 289–310.
Simmons, J. P., Nelson, L. D., & Simonsohn, U. (2011). False-positive psychology undisclosed flexibility in data collection and analy-sis allows presenting anything as significant. Psychological Science, 22, 1359–1366. doi:10.1177/0956797611417632
Smith, D. J., Escott-Price, V., Davies, G., Bailey, M. E. S., Colodro-Conde, L., Ward, J., . . . O’Donovan, M. C. (2016). Genome-wide analysis of over 106,000 individuals identi-fies 9 neuroticism-associated loci. Molecular Psychiatry, 21, 749–757.
Strube, M. J. (2006). SNOOP: A program for demonstrating the consequences of premature and repeated null hypothesis testing. Behavior Research Methods, 38, 24–27. doi:10.3758/BF03192746
Tibshirani, R. (1996). Regression shrinkage and selection via the lasso. Journal of the Royal Statistical Society: Series B (Methodological), 58, 267–288.
Tibshirani, R. (2011). Regression shrinkage and selection via the lasso: A retrospective. Journal of the Royal Statistical Society: Series B (Statistical Methodology), 73, 273–282. doi:10.1111/j.1467-9868.2011.00771.x
Van Essen, D. C., Smith, S. M., Barch, D. M., Behrens, T. E. J., Yacoub, E., & Ugurbil, K. (2013). The WU-Minn Human Connectome Project: An overview. NeuroImage, 80, 62–79. doi:10.1016/j.neuroimage.2013.05.041
Varma, S., & Simon, R. (2006). Bias in error estimation when using cross-validation for model selection. BMC Bioinformatics, 7(1), 91. doi:10.1186/1471-2105-7-91
Vazire, S., & Gosling, S. D. (2004). e-Perceptions: Personality impressions based on personal websites. Journal of Personality and Social Psychology, 87, 123–132. doi:10.1037/ 0022-3514.87.1.123
Vitaro, F., Arseneault, L., & Tremblay, R. E. (1999). Impulsivity predicts problem gambling in low SES ado-lescent males. Addiction, 94, 565–575. doi:10.1046/j.1360-0443.1999.94456511.x
Vrieze, S. I. (2012). Model selection and psychological theory: A discussion of the differences between the Akaike information criterion (AIC) and the Bayesian information criterion (BIC). Psychological Methods, 17, 228–243. doi:10.1037/a0027127
Wagenmakers, E.- J., Wetzels, R., Borsboom, D., van der Maas, H. L. J., & Kievit, R. A. (2012). An agenda for purely con-firmatory research. Perspectives on Psychological Science, 7, 632–638. doi:10.1177/1745691612463078
Wainer, H. (1976). Estimating coefficients in linear models: It don’t make no nevermind. Psychological Bulletin, 83, 213–217. doi:10.1037/0033-2909.83.2.213
Prediction vs. Explanation 23
Westfall, J., Kenny, D. A., & Judd, C. M. (2014). Statistical power and optimal design in experiments in which sam-ples of participants respond to samples of stimuli. Journal of Experimental Psychology: General, 143, 2020–2045. doi:10.1037/xge0000014
Westfall, J., & Yarkoni, T. (2016). Statistically controlling for confounding constructs is harder than you think. Manuscript submitted for publication.
Whelan, R., Watts, R., Orr, C. A., Althoff, R. R., Artiges, E., Banaschewski, T., . . . the IMAGEN Consortium. (2014). Neuropsychosocial profiles of current and future adoles-cent alcohol misusers. Nature, 512, 185–189. doi:10.1038/nature13402
Wherry, R. J. (1951). IV. Comparison of cross-validation with statistical inference of betas and multiple R from a single sample. Educational and Psychological Measurement, 11, 23–28. doi:10.1177/001316445101100104
Wherry, R. J. (1975). Underprediction from overfitting: 45 years of shrinkage. Personnel Psychology, 28, 1–18. doi:10.1111/j.1744-6570.1975.tb00387.x
Wolpert, D. H., & Macready, W. G. (1997). No free lunch theo-rems for optimization. IEEE Transactions on Evolutionary Computation, 1, 67–82. doi:10.1109/4235.585893
Wood, A. R., Esko, T., Yang, J., Vedantam, S., Pers, T. H., Gustafsson, S., . . . Frayling, T. M. (2014). Defining the role of common variation in the genomic and biological architecture of adult human height. Nature Genetics, 46, 1173–1186. doi:10.1038/ng.3097
Wood, S. (2006). Generalized additive models: An introduction with R (1st ed.). Boca Raton, FL: Chapman & Hall/CRC.
Wu, S., Harris, T. J., & Mcauley, K. B. (2007). The use of sim-plified or misspecified models: Linear case. The Canadian Journal of Chemical Engineering, 85, 386–398. doi:10.1002/cjce.5450850401
Xu, K., Nosek, B., & Greenwald, A. G. (2014). Data from the Race Implicit Association Test on the Project Implicit
demo website. Journal of Open Psychology Data, 2(1), e3. doi:10.5334/jopd.ac
Yap, M. J., Balota, D. A., Sibley, D. E., & Ratcliff, R. (2012). Individual differences in visual word recognition: Insights from the English Lexicon Project. Journal of Experimental Psychology: Human Perception and Performance, 38, 53–79. doi:10.1037/a0024177
Yarkoni, T. (2009). Big correlations in little studies: Inflated fMRI correlations reflect low statistical power—Commentary on Vul et al. (2009). Perspectives on Psychological Science, 4, 294–298. doi:10.1111/j.1745-6924.2009.01127.x
Yarkoni, T. (2010). Personality in 100,000 words: A large-scale analysis of personality and word use among blog-gers. Journal of Research in Personality, 44, 363–373. doi:10.1016/j.jrp.2010.04.001
Yarkoni, T. (2012). Psychoinformatics new horizons at the interface of the psychological and computing sciences. Current Directions in Psychological Science, 21, 391–397. doi:10.1177/0963721412457362
Yarkoni, T. (2014). Big Data, n. A kind of black magic. Retrieved from http://www.talyarkoni.org/blog/2014/05/19/big-data-n-a-kind-of-black-magic/
Yarkoni, T., Ashar, Y. K., & Wager, T. D. (2015). Interactions between donor Agreeableness and recipient characteristics in predicting charitable donation and positive social evalu-ation. PeerJ, 3, e1089. doi:10.7717/peerj.1089
Yarkoni, T., Balota, D., & Yap, M. (2008). Moving beyond Coltheart’s N: A new measure of orthographic similarity. Psychonomic Bulletin & Review, 15, 971–979. doi:10.3758/PBR.15.5.971
Zeiler, M. D., & Fergus, R. (2014). Visualizing and under-standing convolutional networks. In D. Fleet, T. Pajdla, B. Schiele, & T. Tuytelaars (Eds.), Computer vision—ECCV 2014 (pp. 818–833): Springer International Publishing. Retrieved from http://link.springer.com/chapter/ 10.1007/978-3-319-10590-1_53