Embed Size (px)
Citation preview

A presentation by Prof. Thomas Plenborg, Jens Overgaard Knudsen and Simon Vesterby Kold
Choice of comparable firms for multiple valuation
1

Agenda
2
1 Comparable firm selection for multiple valuation
2 Our idea
3 How did we test it and how does it work?
4 Questions

Who are we and what is the background of our project?
Professor at Department of Accounting and Auditing, CBS
Global Finance Graduate at Novo Nordisk A/S
Cand.merc.fir from CBS in 2015
Financial Analyst at Novo A/S
Cand.merc.fir from CBS in 2015
Thomas Plenborg Jens Overgaard Knudsen Simon Kold
Desired outcome:
₊ Help analysts and investors in improving valuation accuracy
3

Derivation of multiples from the present value relation
For simplicity, consider a firm which has a constant growth rate and discount factor forever.
FCFFWACCt gr
FCFFEV−
=
De grD
MVE−
=
P/E
P/B
EV/EBIT
EV/EBITDA
EV/SALES inEBITDAmRTRROICgr
gROICDEPR
FCFFWACC
FCFF arg)%1()1(1×−×−××
−
−
)%1()1(1DEPR
FCFFWACC
FCFF RTRROICgr
gROIC−×−××
−
−
)1(1 TRROICgr
gROIC
FCFFWACC
FCFF −××−
−
ROEgrgROE
De
D 1×
−−
De
D
grgROE
−−
Ideal peer-group companies for multiple valuation purposes should be truly identical on the basis of these properties - But how can we identify such firms?
4

5
Two obvious approaches for comparable firm selection: Industry affiliation and fundamentals
Industry Affiliation Fundamentals
Rat
iona
le fo
r the
ap
proa
ch
Theoretical difficulties in defining “an industry”
Industry classes are subjectively defined and subjectively chosen
Companies within the same industry class can be very different from each other
Dra
wba
cks
Companies within the same industry are subject to similar market characteristics
Companies within the same industry tend to produce similar products, leading to similarities of their supply and demand curves
Easy to use and widely applied in practice
Current fundamentals can be used to approximate future profitability, growth and risk
Independent of subjectively defined industry classes
Can incorporate, in principle, an infinite amount of peers
Used for comparable firm selection in a range of empirical studies , including combinations with industry
Which fundamentals are best at projecting future levels of profitability, growth and risk?
Gathering fundamental data for a lot of companies can be a cumbersome process
Most fundamental approaches are only capable of using 2-3 proxies

Illustration of the issue All firms in the sample
Previous attempts at the fundamental approach
We know that the levels of multiples are determined by profitability, growth and risk
Previous studies show that identifying comparable firms based on fundamentals may be a useful alternative to industry classification
However, in these studies, peers are selected in the intersection of the most similar firms in terms of proxies for profitability, growth and risk
This creates an issue
6
The 14% closest firms in terms of ROE
Of these firms, the 14% closest firms in terms of size
Adding a third or fourth variable would further reduce the number of peers
In effect, this restrains the approach to only being able to use two proxies for profitability, growth and risk
Consequence
The intersection of the two (leaving only 2% of the sample)

Agenda
7
1 Comparable firm selection for multiple valuation
2 Our idea
3 How did we test it and how does it work?
4 Questions

The Idea: -Sum of Rank Differences (SARD)
8
SARD proposition
Characteristics of the SARD model
Our method selects comparable firms based on the least sum of absolute rank differences across a range of variables which are
expected to affect multiples
If a potential peer has a low SARD value, the approach suggests that the potential peer and the target firm share similarities with respect to the chosen variables.
If these variables are useful proxies of the drivers of the multiple, then the identified peers and the target firm should also be traded at similar prices.
We propose a method where peers are selected on the basis of fundamentals and which allow for more than just one or two fundamental value drivers
𝑆𝑆𝑆𝑆𝑆𝑆𝐷𝐷𝑖𝑖,𝑗𝑗 = |𝑟𝑟𝑋𝑋,𝑖𝑖 − 𝑟𝑟𝑋𝑋,𝑗𝑗| + |𝑟𝑟𝑌𝑌,𝑖𝑖 − 𝑟𝑟𝑌𝑌,𝑗𝑗| + ⋯+ |𝑟𝑟𝑍𝑍,𝑖𝑖 − 𝑟𝑟𝑍𝑍,𝑗𝑗|
where SARD is the sum of absolute rank difference between firm i and firm j, rx,i is the rank of firm i in terms of variable x, rx,j is the rank of firm j in terms of variable x … and so forth.

9
A 5-step implementation guide to the SARD approach
Select base sample
1
Estimate relevant value drivers
2
Convert into ranks
3
Calculate rank difference (“Penalty points”)
4
Find the firms with the lowest SARD
5

A 5-step implementation guide to the SARD approach
• Construct a sample from which to select peer-group from. Could be:
- A large sample (like our empirical study where we use S&P 1500)
- A qualitative selected sample (e.g. subjective perception of industry affiliation)
• Select and calculate relevant value drivers. Our tests include: - Return on equity (profitability) - Net debt/EBIT (risk) - Size (risk and different levels of multiples) - Forecasted EPS growth t+2 (growth) - EBIT-margin (relevant for EV/sales
multiples)
• Practitioner implementation: Consider manuel adjustments, NTM ratios, industry-specific ratios etc ?
10
Select base sample
Estimate relevant value drivers
2
1

ROE Size
(bn. $) rROE rsize
Abbott Labs 10% 67 9 6 Coca-Cola 22% 185 6 3 Estee Lauder 34% 31 1 9
General Mills 24% 35 4 8 Johnson & Johnson
23% 280 5 1 Kellogg Co 20% 24 7 10 Mondelez 7% 69 10 5 Pepsico 31% 146 2 4 Procter & Gamble
17% 204 8 2 Reynolds America
30% 66 3 7
• Transform all value drivers into ranks • Enables you to combine value drivers regardless of scale • Possibility of assigning weights to value drivers
11
Implementation tip
Convert into ranks
3 A 5-step implementation guide to the SARD approach

• Calculate the difference in ranks between each firm in the base sample and the firm subject to the valuation
• Repeat for each
value driver
• The rank differences in the table is based on ROE
Calculate rank difference (“Penalty points”)
4 A 5-step implementation guide to the SARD approach
Abbott Labs Coca-Cola Estee Lauder General
Mills Abbott Labs n/a |9-6|+|6-3|=6 |9-1|+|6-9|=11
Coca-Cola n/a |6-1|+|3-9|=11
Estee Lauder n/a
General Mills
Johnson & Johnson
Kellogg Co Mondelez Pepsico
Procter & Gamble
Reynolds America

• Calculate the sum of absolute rank differences across the value drivers
• Identify the firms with the least sum of absolute rank differences
• Decide on a cut-off (i.e. number of firms to include as peers). In the example below we use six as cut-off (i.e. select six peers)
Peer
Abbott Labs
Coca-Cola
Estee Lauder
General M
ills
Johnson &
Johnson
Kellogg Co
Mondelez
Pepsico
Procter &
Gam
ble
Reynolds Am
erica
1
Mondelez (2)
Procter & Gamble
(3)
General Mills (4)
Reynolds America
(2) Coca-Cola (3) General
Mills (5) Abbott Labs
(2) Reynolds
America (4) Coca-
Cola (3) General Mills
(2)
2
Procter & Gamble
(5)
Johnson & Johnson
(3)
Reynolds America
(4)
Estee Lauder
(4)
Procter & Gamble
(4)
Abbott Labs (6)
Procter & Gamble
(5) Coca-Cola (5)
Johnson &
Johnson (4)
Pepsico (4)
3 Kellogg Co (6)
Pepsico (5) Pepsico
(6) Kellogg Co (5)
Pepsico (6)
Reynolds America
(7) Coca-Cola (6) General Mills
(6) Mondelez
(5) Estee Lauder
(4)
4 Coca-Cola
(6) Abbott Labs (6)
Kellogg Co (7)
Pepsico (6)
General Mills (8)
Estee Lauder (7)
Kellogg Co (8)
Estee Lauder (6)
Abbott Labs (5)
Coca-Cola (7)
5 General
Mills (7)
Mondelez (6)
Abbott Labs (11)
Abbott Labs (7)
Reynolds America (8)
Mondelez (8)
Reynolds America (9)
Johnson & Johnson (6)
Pepsico (8) Abbott Labs (7)
6 Reynolds America
(7)
Reynolds America
(7)
Coca-Cola (11)
Coca-Cola (7)
Abbott Labs (9)
Coca-Cola (8)
Pepsico (9)
Procter & Gamble
(8)
Kellogg Co (9) Kellogg Co (7)
Find the firms with the lowest SARD
5 A 5-step implementation guide to the SARD approach

Agenda
14
1 Comparable firm selection for multiple valuation
2 Our idea
3 How did we test it and how does it work?
4 Questions

Random example from S&P 1500: Six peers selected for IFF on the basis of SARD
Peers Industry EV/EBIT ROE Debt/EBIT Size
KB Home Consumer Durables & Apparel 7.3 23% 2.3 3,175
Beckman Coulter Inc Health Care Equip. & Services 13.2 23% 2.0 3,354
Pioneer Natural Resources Co Energy 12.6 22% 3.6 3,878
McCormick & Co Inc Food, Beverage & Tobacco 16.9 24% 2.0 4,593
TCF Financial Corp Banks 12.4 23% 4.5 3,601
Knight-Ridder Inc. Media 12.8 20% 2.6 5,777
15
Firm being valued Industry EV/EBIT ROE Debt/EBIT Size International Flavors & Fragrances (IFF)
Materials 12.9 23% 2.7 3,356
11.8 12.9
Actual EV/EBIT of IIF
Prediction of the EV/EBIT multiple (harmonic mean
of peers)
8%
Valuation error │(11.8-12.9)/12.9│

A distinct pattern: Combining fundamentals seems to work
Absolute percentage errors and ranks (brackets) of valuations based on each selection method
Industry ROE ROE Debt/EBIT
ROE Debt/EBIT Size
ROE Debt/EBIT Size Growth
ROE Debt/EBIT Size Growth EBIT-margin
Median 0.255 (4) 0.292 (6) 0.260 (5) 0.250 (3) 0.228 (2) 0.222 (1) Mean 0.341 (3) 0.390 (6) 0.351 (5) 0.343 (4) 0.309 (2) 0.307 (1) IQ 0.330 (3) 0.364 (6) 0.335 (5) 0.330 (4) 0.297 (2) 0.291 (1)
Median 0.407 (2) 0.531 (6) 0.504 (5) 0.477 (4) 0.470 (3) 0.254 (1) Mean 0.576 (2) 0.761 (6) 0.720 (5) 0.693 (4) 0.671 (3) 0.360 (1) IQ 0.463 (2) 0.499 (6) 0.483 (5) 0.480 (3) 0.481 (4) 0.332 (1)
Median 0.349 (6) 0.298 (5) 0.283 (4) 0.275 (3) 0.241 (2) 0.240 (1) Mean 0.444 (6) 0.377 (5) 0.360 (4) 0.348 (3) 0.316 (2) 0.313 (1) IQ 0.416 (6) 0.352 (5) 0.347 (4) 0.335 (3) 0.312 (1) 0.313 (2)
Median 0.286 (5) 0.297 (6) 0.286 (4) 0.279 (3) 0.244 (2) 0.240 (1) Mean 0.382 (6) 0.375 (5) 0.363 (4) 0.354 (3) 0.325 (2) 0.325 (1) IQ 0.380 (6) 0.352 (5) 0.347 (4) 0.340 (3) 0.321 (1) 0.321 (2)
16
EV/EBIT
EV/Sales
P/B
P/E

The pattern remains intra-industry
Absolute percentage errors and ranks (brackets) of valuations based on each selection method
Industry ROE (same industry)
ROE Debt/EBIT (s.industry)
ROE Debt/EBIT Size (s.industry)
ROE Debt/EBIT Size Growth (s.industry)
ROE Debt/EBIT Size Growth EBIT-% (s.industry)
Median 0.255 (6) 0.244 (5) 0.219 (4) 0.215 (3) 0.206 (2) 0.203 (1) Mean 0.341 (6) 0.321 (5) 0.295 (4) 0.290 (3) 0.279 (2) 0.275 (1) IQ 0.330 (6) 0.311 (5) 0.296 (4) 0.292 (3) 0.280 (2) 0.279 (1)
Median 0.407 (6) 0.380 (5) 0.364 (4) 0.344 (3) 0.338 (2) 0.271 (1) Mean 0.576 (6) 0.537 (5) 0.514 (4) 0.492 (3) 0.483 (2) 0.369 (1) IQ 0.463 (6) 0.452 (5) 0.439 (4) 0.426 (3) 0.423 (2) 0.357 (1)
Median 0.349 (6) 0.247 (4) 0.249 (5) 0.243 (3) 0.240 (1) 0.241 (2) Mean 0.444 (6) 0.318 (4) 0.322 (5) 0.312 (3) 0.310 (2) 0.307 (1) IQ 0.416 (6) 0.317 (4) 0.319 (5) 0.311 (3) 0.310 (2) 0.304 (1)
Median 0.286 (6) 0.247 (5) 0.244 (4) 0.241 (3) 0.228 (2) 0.225 (1) Mean 0.382 (6) 0.322 (5) 0.322 (4) 0.320 (3) 0.307 (2) 0.306 (1) IQ 0.380 (6) 0.319 (3) 0.327 (4) 0.331 (5) 0.316 (2) 0.311 (1)
17
EV/EBIT
EV/Sales
P/B
P/E

Robustness checks
Robustness checks performed in this study
18
Number of firms in peer group
Across time
Across size

Number of firms in peer group
EV/Sales
19
• The ranking of selection methods remain stable across various numbers of peers • Incrementally increasing accuracy when peers are added • Similar results for all evaluated multiples
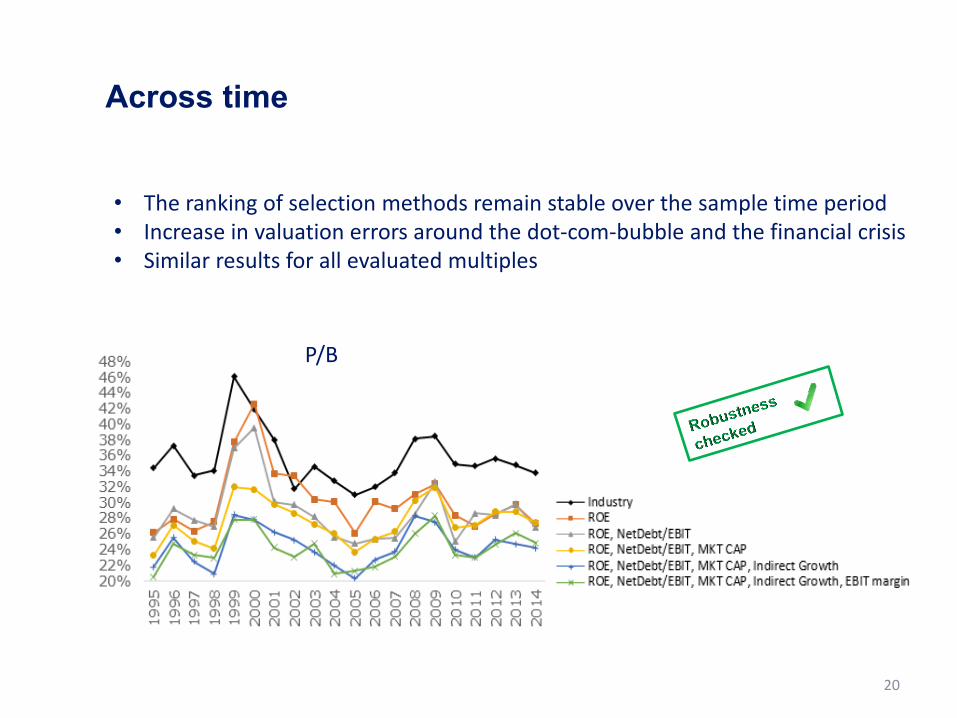
Across time
P/B
20
• The ranking of selection methods remain stable over the sample time period • Increase in valuation errors around the dot-com-bubble and the financial crisis • Similar results for all evaluated multiples

Industry ROE ROE Debt/EBIT
ROE Debt/EBIT Size
ROE Debt/EBIT Size Growth
ROE Debt/EBIT Size Growth EBIT-margin
P/B:
S&P 500 0.326 (6) 0.256 (4) 0.273 (5) 0.222 (3) 0.221 (2) 0.210 (1)
S&P 400 0.367 (6) 0.256 (5) 0.234 (4) 0.204 (2) 0.217 (3) 0.199 (1)
S&P 600 0.343 (6) 0.278 (5) 0.260 (4) 0.259 (3) 0.213 (2) 0.200 (1)
21
Across size
• The ranking of selection methods remain stable over the sample time period • Seems to be less estimation error in S&P 500 compared to the other two indices • Similar results for all evaluated multiples
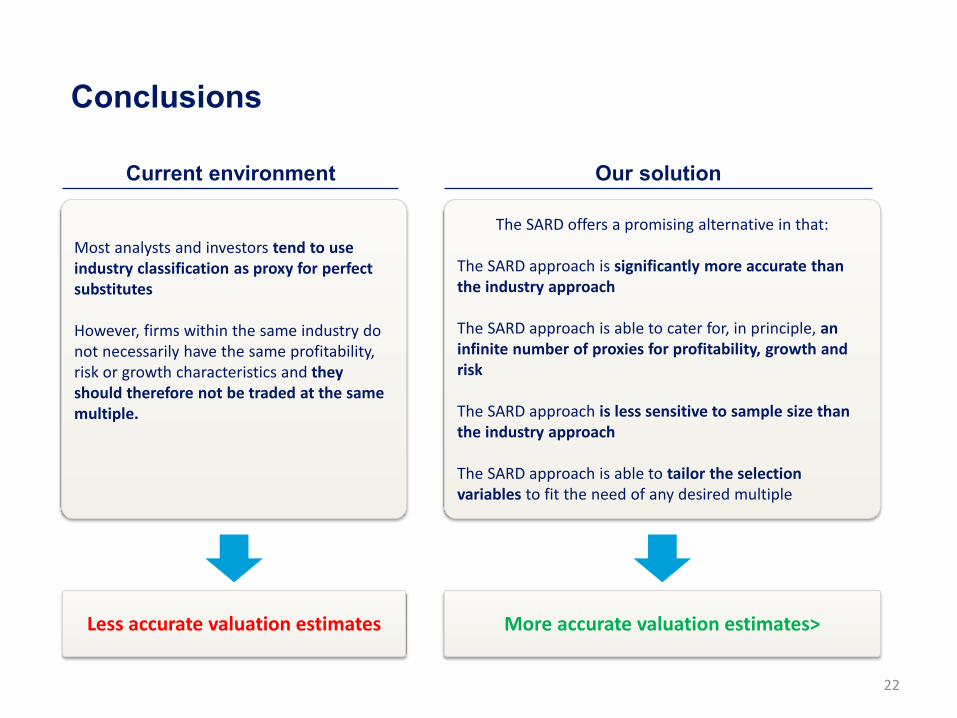
Conclusions
22
Most analysts and investors tend to use industry classification as proxy for perfect substitutes However, firms within the same industry do not necessarily have the same profitability, risk or growth characteristics and they should therefore not be traded at the same multiple.
Current environment
Less accurate valuation estimates
The SARD offers a promising alternative in that: The SARD approach is significantly more accurate than the industry approach The SARD approach is able to cater for, in principle, an infinite number of proxies for profitability, growth and risk The SARD approach is less sensitive to sample size than the industry approach The SARD approach is able to tailor the selection variables to fit the need of any desired multiple
Our solution
More accurate valuation estimates>

Agenda
23
1 Comparable firm selection for multiple valuation
2 Our idea
3 How did we test it and how does it work?
4 Questions