Embed Size (px)
Citation preview

ORIGINAL ARTICLE
Chloride transport and the resulting corrosion of steel barsin alkali activated slag concretes
Qianmin Ma . Sreejith V. Nanukuttan .
P. A. Muhammed Basheer . Yun Bai .
Changhui Yang
Received: 29 June 2015 / Accepted: 23 November 2015 / Published online: 18 December 2015
� The Author(s) 2015. This article is published with open access at Springerlink.com
Abstract As the relative performance of alkali
activated slag (AAS) concretes in comparison to
portland cement (PC) counterparts for chloride trans-
port and resulting corrosion of steel bars is not clear,
an investigation was carried out and the results are
reported in this paper. The effect of alkali concentra-
tion and modulus of sodium silicate solution used in
AAS was studied. Chloride transport and corrosion
properties were assessed with the help of electrical
resistivity, non-steady state chloride diffusivity, onset
of corrosion, rate of corrosion and pore solution
chemistry. It was found that: (i) although chloride
content at surface was higher for the AAS concretes,
they had lower chloride diffusivity than PC concrete;
(ii) pore structure, ionic exchange and interaction
effect of hydrates strongly influenced the chloride
transport in the AAS concretes; (iii) steel corrosion
resistance of the AAS concretes was comparable to
that of PC concrete under intermittent chloride
ponding regime, with the exception of 6 % Na2O
and Ms of 1.5; (iv) the corrosion behaviour of the
AAS concretes was significantly influenced by ionic
exchange, carbonation and sulphide concentration;
(v) the increase of alkali concentration of the activator
generally increased the resistance of AAS concretes to
chloride transport and reduced its resulting corrosion,
and a value of 1.5 was found to be an optimum
modulus for the activator for improving the chloride
transport and the corrosion resistance.
Keywords Alkali activated slag � Chloridediffusivity � pH profile � Bulk electrical resistivity �Pore solution chemistry � Rate of corrosion
1 Introduction
It is widely recognised that an alternative to portland
cement (PC) is highly desirable to reduce the high
Q. Ma � S. V. Nanukuttan (&)
School of Planning, Architecture and Civil Engineering,
Queen’s University Belfast, University Road,
BT7 1NN Northern Ireland, UK
e-mail: [email protected]
Q. Ma
Faculty of Civil Engineering and Mechanics, Kunming
University of Science and Technology, Jingming South
Road, 650500 Kunming, China
P. A. M. Basheer
School of Civil Engineering, University of Leeds,
England LS2 9JT, UK
Y. Bai
Department of Civil, Environmental & Geomatic
Engineering, University College London, Gower Street,
London WC1E 6BT, UK
C. Yang
College of Material Science and Engineering, Chongqing
University, 174 Shapingba Main Street,
Chongqing 400044, China
Materials and Structures (2016) 49:3663–3677
DOI 10.1617/s11527-015-0747-7

carbon footprint of concrete and 100 % of its
replacement with alkali activated slag (AAS) is a
new environmentally friendly option that could satisfy
the strength and durability requirements [1]. However,
the physical and durability characteristics of AAS
concretes depend on both the physical and chemical
characteristics of the slag and the type of activator
used [1]. It is known that when sodium silicate solution
is used as the activator, the alkali concentration
(Na2O %) and the modulus of the activator (silica
modulus, Ms) influence some of the properties of
concrete [1]. It has been reported that AAS concretes
have a different pore solution composition compared
to that of PC [2]. As pore solution composition has a
significant influence on chloride transport and result-
ing corrosion [3, 4], it is essential to understand the
influence of the pore solution of AAS concretes on
both these characteristics of reinforced concrete so
that any potential shortcoming in knowledge for AAS
concretes could be addressed.
During the exposure of concrete to a chloride
environment, ionic exchanges may significantly influ-
ence the diffusion of chloride ions into the concrete
mainly from the following aspects:
I. Apart from diffusion of chloride ions from
external environment into the concrete, cations
accompanying the chloride ions, such as sodium
ions, will diffuse into the concrete [5]. Together
with the cations originally present in the pore
solution of the concrete, they may form a counter
electrical field to drag further ingress of chlorides
as the mobility of cations is smaller than that of
anions [5–7];
II. Ions originally present in the pore solution may
also diffuse out to the external environment as a
result of the chemical concentration gradient and
electro-neutrality constraints [5]. The outward
diffusion of hydroxyl ions will empty the sites for
chlorides to enter into the concrete to re-occupy
the empty sites, thus increasing the amount of
chlorides in concrete, especially in the near
surface zone [5];
III. Hydrated cement may react with both chlorides
and the accompanying cations to slow down
further ingress of chlorides [4, 6]. The orientation
and the degree of such interactions are signifi-
cantly influenced by the surface charge of the
hydrated cement (strongly related to the
composition of pore solution) and the alkalinity
of pore solution [8, 9].
As stated previously, AAS has a different pore
solution chemistry compared to that of PC. Therefore,
the influence of pore solution chemistry on chloride
diffusion could be different in the case of AAS
compared to PC.
Most research on the chloride resistance of AAS in
the past was carried out by using ASTM C 1202 test
method [10–12]. Although the results have shown that
the AAS had lower charge passed compared to the PC
counterpart, it is questionable to use the accelerated
electrical test method to evaluate chloride resistance of
AAS due to the influence of different pore solution
chemistry on the current flow during the accelerated
test [1]. Therefore, it is necessary to use a test method
similar to that of real chloride exposure environment
to study chloride transport in AAS concretes.
Presence of sulphides in pore solution of concrete
can significantly reduce the redox potential of the pore
solution. Redox potential measurement is a reflection
of oxidation and reduction activities [13]. The reduc-
tion of the redox potential is a result of the increase of
reduction atmosphere, which would protect the
embedded steel from its oxidation to a certain extent
to reduce the corrosion rate of the steel. Besides, the
oxidation of chemically reduced sulphides would form
elemental sulphur to deposit in the pores of the
damaged passive film allowing the corroded steel to
regain passivation [14]. However, Shoesmith et al.
[14] suggested that sulphides also play a role to break
down the passive film on the surface of steel and then
the corrosion of the steel would be initiated. Sulphides
are rich in slag, which is why the redox potential of
slag cement can be lower than -400 mV compared to
PC, which is normally between 200 and 300 mV [15].
Therefore, it could be anticipated that the corrosion
behaviour of the steel in AAS would be different from
that in PC. Thus, the main aim of the study reported in
this paper was to establish the role of the pore solution
of AAS on both the chloride transport and chloride
induced corrosion in an experiment that is as close as
possible to natural exposure conditions.
Holloway and Sykes [16] and Gomez et al. [17]
have studied chloride induced corrosion behaviour of
steel embedded in AAS concretes and found that
corrosion rate was favourable compared to the PC
counterpart. Holloway and Sykes [16] have simulated
3664 Materials and Structures (2016) 49:3663–3677

corrosion using internal chlorides, i.e., introduced into
the matrix during mixing, whereas Gomez et al. [17]
have used continuous immersion. Therefore, in order
to have a full picture of the application of AAS
concretes to all types of chloride exposures, a severe
exposure environment of wetting/drying (chloride
ponding) was used in this study. Such a testing regime
will simulate the chloride exposures of marine
concrete structures under splash and tidal zones and
traffic structures under de-icing salt treatment.
Besides, due to the influence of the different pore
solution chemistry on the electrochemical process, it is
also questionable to use an electrochemical method for
corrosion rate assessment. Therefore, gravimetric
mass loss measurement was used alongside with
electrochemical methods to quantify the corrosion rate
in this research.
2 Experimental programme
A programme of investigation was developed with the
objectives of studying: (i) the chloride transport in
various AAS concretes; (ii) the subsequent physical
and chemical changes to the pore structure and the
pore solution; and (iii) the initiation and the propaga-
tion of corrosion of embedded steel when these
concretes were exposed to an intermittent chloride
ponding environment. Full details of the experimental
programme shall be given in sub-sections below, but a
summary of the experimental variables and the tests
shall be given next.
Twelve AAS concretes with alkali concentrations
(Na2O % of mass of slag) of 4, 6, 8 and modulus (Ms)
of sodium silicate solution activator of 0.75, 1.00,
1.50, 2.00 were studied. Non-steady state chloride
diffusion of these concretes was investigated by using
NT BUILD 443 non-steady state chloride diffusion
test method [18]. Corrosion of the embedded steel bars
was quantified by measuring their gravimetric mass
loss after the cyclic chloride ponding test regime. Pore
structure and pore solution composition of the con-
cretes were studied in an attempt to explain the
physical and chemical changes that occur during the
chloride transport and the corrosion. Effects of
Na2O % and Ms on the chloride transport and the
corrosion behaviour of the concretes were also
investigated.
2.1 Materials
Ground granulated blast-furnace slag (GGBS) con-
firming to BS EN 15167-1:2006 [19] was used to
manufacture all the AAS concretes. The GGBS was
supplied by Civil and Marine Ltd., UK. Class 42.5 N
PC (CEM-I) conforming to BS EN 197-1: 2000 [20],
from Quinn Group Ltd., Northern Ireland, UK was
used to manufacture the PC control concrete. The
chemical compositions and physical properties of both
GGBS and PC are reported in Table 1.
Sodium silicate solution (or commonly known as
water glass, WG) with Na2O % of 12.45 and SiO2 %
of 43.60, which is commercially available as ‘Crystal
0503’ from Charles Tennant and Co. (NI) Ltd., UK
was used as the activator for GGBS. Industrial grade
sodium hydroxide powder with a purity of 99 %
supplied by Charles Tennant and Co. (NI) Ltd., UK
was used to adjust the Ms to the required values.
A barium based retarder ‘YP-1’� [21] was used in
the AAS concretes to delay the setting time. The
retarder was dry-blended with GGBS before mixing.
A polycarboxylic polymer based superplasticiser
(commercially known as CHEMCRETE HP3 and
manufactured by Larsen, Northern Ireland, UK) with a
water content of 40 % was used in the PC concrete
mix. The water content of the superplasticiser was
taken into account whilst determining the mixing
water content.
Crushed basalt from local sources in Northern
Ireland with size fractions of 20 mm and 10 mm
combined in a ratio of 1:1 was used as the coarse
aggregate. Natural sand with fineness modulus of 2.53
was used as the fine aggregate. Properties of both the
fine and coarse aggregates are reported in Table 2.
Water from the mains water supply was used to mix
and cure concretes.
2.2 Mix proportions
Twelve AAS concretes mixes with Na2O % of 4, 6,
and 8 and Ms of WG of 0.75, 1.00, 1.50 and 2.00 were
investigated in this research. The total binder content,
which is the sum of GGBS and solid component of the
WG, was kept constant at 400 kg/m3 for all mixes. The
water/binder (W/B) ratio was constant at 0.47 for all
the AAS concretes. The water content in the WG was
taken into account while determining the mixing water
Materials and Structures (2016) 49:3663–3677 3665

content. The retarder was added at a dosage of 0.3 %
of the mass of GGBS. This dosage of the retarder was
found to result in acceptable levels of the setting times
of the AAS mixes.
For the purpose of comparison, one PC concrete
mix was manufactured with the total binder content as
that of the AAS concretes. A W/B ratio of 0.42 was
determined for the PC concrete to guarantee its
performance in exposure classes XS3 and XD3 as
defined in BS EN 206-1:2000 [22]. The use of the
superplasticiser of 0.4 % of mass of the cement
allowed the PC concrete to just achieve the minimum
value of the slump class of S2 (50 mm) specified in BS
EN 206-1:2000 [22]. It may be noted that the W/B
ratio of the AAS concretes was 0.47, not the same as
that used for the PC mix. This was essential to ensure
that the AAS concretes met the slump requirement. A
reduction of W/B ratio to 0.42 for AAS concretes to
match with that of PC concrete was found to result in
harsh mixes which are not workable. The impact of
this on the strength and other properties studied in this
research is highlighted in the discussion of results later
on in this paper.
The last aspect of the mix design was the ratio of
fine aggregate content to total aggregate content. This
was kept at 36 % for both the AAS and the PC
concretes. Several trials were carried out before
arriving at these mix proportions to ensure that the
resulting concretes satisfied the specifications for both
the exposure classes and the slump class considered.
2.3 Preparation of samples
Six 250 9 250 9 110 mm blocks (three with embed-
ded steel bars while the other three had no steel) and
nine 100 9 100 9 100 mm cubes for each mix were
cast for the tests to be detailed in Sect. 2.4. Figure 1
shows the concrete blocks with embedded steel bars.
Also shown in this figure are the stainless steel bars
(hereafter referred to as electrodes) used for measuring
the electrical resistivity of the concretes during the
cycling ponding/drying regime. The top bar served as
the anode and the three bottom bars together acted as
the cathode for electrochemical corrosion measure-
ments. Before embedding the steel bars, they were
cleaned first with a wire brush and then with a dry
Table 1 Chemical
compositions and physical
properties of the GGBS and
the PC
Chemical composition (%) Physical properties
GGBS PC GGBS PC
CaO 39.4 61.3 Specific surface area (m2/kg) 527 386
SiO2 34.3 23.0
Al2O3 15.0 6.15 Specific gravity (g/cm3) 2.90 3.16
MgO 8.00 1.80
Sulfide 0.80 –
SO3 – 2.50
TiO2 0.70 –
MnO 0.50 –
Na2O 0.45 0.22
Fe2O3 0.40 2.95
K2O 0.38 0.68
Cl 0.02 0.01
Loss on ignition 0.05 1.40
Table 2 Specific gravity
under saturated surface dry
(S. S. D.) condition and 1-h
water absorption of the
aggregates
Specific gravity (S. S. D.) 1-h water absorption (%)
20 mm coarse aggregate 2.69 3.44
10 mm coarse aggregate 2.80 2.12
Fine aggregate 2.73 0.75
3666 Materials and Structures (2016) 49:3663–3677

cleaning cloth to remove any rust and debris, at which
stage they were weighed.
As shown in Fig. 1, the stainless steel electrodes
were embedded at four different depths, viz. 15, 25, 35
and 45 mm, from the ponding surface in a staggered
arrangement to facilitate the distribution of both
coarse and fine aggregates around the electrodes.
The electrodes were sleeved for the whole length with
a heat-shrink tube except for a middle region of
50 mm before embedding in the blocks so that any
change in electrical resistance measured from the pair
of electrodes would be due to the changes in the
middle region.
Both the blocks and the cubes were cast by
following the procedure given in BS 1881-125:1986
[23]. After mixing, the fresh concrete was transferred
into the moulds in two layers. Each layer was
compacted by placing the moulds on a vibrating
table until no air bubbles appeared on the surface of
the concrete. The surface of the concrete was finished
by a metal float. After casting, moulds were covered
with thin polythene sheets to minimise evaporation of
water from the surface of concrete. Approximately 1 h
after the concrete surface became stiff, the moulds
were covered with a layer of previously wetted hessian
and then covered with a layer of polythene sheet. The
samples were stored in this condition for 3 days. The
hessian was maintained in moisture condition at every
6 h. At the end of this period, the concrete specimens
were demoulded, wrapped in wet hessian and plastic
bags and stored in a constant temperature room at
20 ± 1 �C for 91 days. The hessian was checked for
the moisture condition at every 2 weeks and rewetted
if needed.
The whole procedure of sample preparing
described above was kept same for both the AAS
and the PC concretes.
2.4 Test procedures
2.4.1 Slump and compressive strength
The slump test specified in BS EN 12350-2:2009 [24]
was carried out on the fresh concretes and the results
are presented in Table 3. The compressive strength
test according to BS EN 12390-3:2009 [25] was
carried out on the 100 mm cubes at 3, 28 and 91 days
of age. The compressive strength results reported in
Table 3 are the average values from three cubes.
2.4.2 Chloride diffusivity
In order to understand chloride transport in the AAS
concretes similar to the real exposure environment,
non-steady state chloride diffusion test in accordance
with NT BUILD 443 [18] was carried out on the
concretes. One day before the test age of 91 days,
three cores of diameter 100 mm per mix were cored
from the three 250 9 250 9 110 mm concrete blocks
containing no steel bars. A slice with a thickness of
50 mm from the casting surface (trowel finished face)
was cut off, the rest was kept for carrying out the test.
The vacuum saturation regime similar to that of NT
BUILD 492 [26] was used to precondition the cores. In
NT BUILD 492 after the application of the vacuum,
saturated Ca(OH)2 solution is introduced into the
container. However, it was considered that this is
likely to lead to leaching of ions from the samples.
Stainless steel electrodes for electrical resistance measurement
A set of electrodes consists of two parallel stainless steel bars at the depths of 15mm, 25mm, 35mm and 45mm, respectively
cathode
Cyclic chloride ponding/drying with 0.55M NaCl solution
Steel bars: top one as the anode while bottom three together as the
Fig. 1 Diagrammatic representation of the concrete block for the corrosion tests
Materials and Structures (2016) 49:3663–3677 3667

Therefore, in this research, after the application of the
vacuum, the vacuum was released, samples were
wrapped in deionised water saturated hessian and
placed back in the container. The vacuum was again
applied. The purpose of this change in saturation
regime was to prevent calcium hydroxide solution
used for saturation affecting the pore solution chem-
istry of the concrete samples as well as to minimise the
loss of ions from the concrete samples. After condi-
tioning to a surface-dry condition, an epoxy resin was
applied onto the surfaces of the specimens in three
layers except the test surface (mould finish surface).
When the epoxy coating was dry, the cores were
immersed for 3 months in a NaCl solution for which
the concentration was 165 g/l (&2.82 M). After the
immersion, the cores were profile ground to obtain
concrete dust from different depths at an increment of
3 mm up to a depth of 30 mm from the exposed
surface. The total chloride content of the dust samples
was determined in accordance with RILEM TC
178-TMC recommendations [27] using pre-calibrated
potentiometric titration method. Meanwhile, the con-
crete dust was dissolved in deionised water in
accordance with RILEM TC 178-TMC recommenda-
tions [28] to measure pH value of the suspension.
Chloride diffusivity and chloride content at the surface
of the concrete samples were determined by using
Fick’s second law of diffusion, as described in NT
BUILD 443 [18].
2.4.3 Corrosion of the embedded steel bars
One month before the test age of 91 days, the three
concrete blocks with the embedded steel bars (see
Fig. 1) were conditioned at a constant temperature of
23(± 3) �C and relative humidity of around 55 % for
a duration of 2 weeks. The epoxy resin was applied
onto all of the surfaces of the blocks in three layers
except the ponding surface and the surface opposite to
the ponding surface. The blocks were then stored at the
above condition for another 2 weeks. During the
whole conditioning and testing periods, the blocks
were supported by two timber strips with thickness of
above 13 mm to allow air flow under the blocks.
Approximately 200 ml of NaCl solution with concen-
tration of 0.55 M (&31.85 g/l) was used to pond the
blocks for 1 day followed by 6 days for drying. This
cycle of intermittent chloride intermittent ponding was
continued until the end of the test (250 ? days).
Before each ponding cycle, the electrical resistance of
the concrete cover was measured at the depths of 15,
25, 35 and 45 mm from the surface of the concrete
block with the help of embedded stainless steel
electrodes shown in Fig. 1. At the end of the test, the
blocks were split opened, the anodic steel bars were
taken out, scrubbed with wire brush, wiped with a dry
cloth and weighed to determine the mass loss caused
by the corrosion. The corrosion rate (mm/year) of the
steel bars was calculated using the following equation:
Table 3 Slump and
compressive strength
(± standard deviation) of
the concretes (retarder of
0.3 % by mass of slag was
used for AAS mixes while
superplasticiser of 0.5 % by
mass of cement was used
for PC mix)
Mix No. (Na2O %-Ms) Slump (mm) Compressive strength (MPa)
3d 28d 91d
4 %-0.75 55 22.3 ± 0.1 44.7 ± 0.2 46.4 ± 1.0
4 %-1.00 55 21.8 ± 0.1 46.7 ± 1.0 55.6 ± 0.6
4 %-1.50 55 1.7 ± 0.0 49.5 ± 0.2 52.6 ± 2.3
4 %-2.00 55 1.4 ± 0.0 33.3 ± 0.4 44.1 ± 0.1
6 %-0.75 65 31.7 ± 0.7 47.3 ± 0.0 51.8 ± 2.4
6 %-1.00 65 37.3 ± 0.2 53.6 ± 0.0 59.1 ± 0.8
6 %-1.50 65 20.3 ± 0.7 60.8 ± 0.1 67.4 ± 2.6
6 %-2.00 75 8.0 ± 0.0 59.6 ± 0.2 68.7 ± 2.1
8 %-0.75 70 32.3 ± 0.0 51.9 ± 0.1 56.2 ± 0.2
8 %-1.00 105 32.7 ± 2.4 53.6 ± 0.1 67.1 ± 0.6
8 %-1.50 145 34.1 ± 0.7 59.3 ± 3.2 70.5 ± 2.5
8 %-2.00 180 11.7 ± 0.2 55.4 ± 0.2 65.0 ± 0.8
PC 50 35.4 ± 1.2 58.9 ± 1.8 66.3 ± 2.3
3668 Materials and Structures (2016) 49:3663–3677

corrosion ratemm
year
� �¼ 1000 � m
A � t � qð1Þ
where m is the mass loss in gram, q is the density of
steel of 7.87 g/cm3, A is the complete surface area of
the steel attacked by corrosion in mm2 and t is the test
duration in year.
2.4.4 Pore solution expression and bulk electrical
resistivity
One day before the test age of 91 days, cores with
diameter of 60 mm were cut from the
250 9 250 9 110 mm concrete blocks containing
no steel bars. A slice with a thickness of 10 mm from
the casting surface (trowel finished face) was cut off.
The pre-saturation procedure described in Sect. 2.4.2
was carried out on the cores. The pore solution within
the cores was extracted by using a specialist pore fluid
expression device when the cores were subjected to
pressures up to 300 tonnes. Once the solution was
collected, pH and conductivity of the solution were
measured immediately by using a pH meter and a
conductivity meter, respectively. The concentration of
Na?, Ca2?, Mg2?, Al3?, Si4? and S2- in the solution
was analysed subsequently by using an inductively
coupled plasma-optical emission mass spectrometer
(ICP-MS) technique. The concentration of Na? and
S2- is discussed in this paper due to their specific
relevance to the topic of this paper. However, the full
data on the concentration of the other ions are
available somewhere else [29].
Before the non-steady state chloride diffusion test,
the bulk electrical resistivity of the cores was deter-
mined by using a method described in the Chlortest
report [30], which is considered to indicate the pore
structure of the concrete.
3 Results and discussion
3.1 Slump and compressive strength
The slump values of the concretes show that all the
mixes had a slump value greater than 50 mm. The
principle of mix design for the AAS concretes
consisted of using a fixed W/B ratio whilst meeting
the minimum slump requirement for their use in
chloride environments, such as S2 specified in BS
8500-1:2006 [31] for marine environments. The mix
design for the PC reference concrete also followed the
same principle. Therefore, it can be seen that the
slump results of all the 13 mixes met the minimum
requirement for S2 slump class, which is 50 mm.
It is also found that the slump values of the AAS
concretes increased with the increase of Na2O %. This
is in agreement with the results reported by Allahverdi
et al. [32] and Karahan and Yakupoglu [33]. The
plasticising effect provided by Na2O component is
considered to be responsible for this [32].
Ms had no significant influence on the slump of the
AAS concretes until Na2O % was increased to 8 %,
and the slump increased with the increase of Ms when
Na2O % was 8 %. With the increase of Ms, the
increase of SiO2 component in WG increases the
viscosity of WG and then decreases the slump of AAS
concrete. However, total liquid content in AAS
concrete (WG ? NaOH ? additional water) also
increases with the increase of Ms to increase the
slump of AAS concrete. When a high Na2O % was
applied, with the increase of Ms, the increase rate of
total liquid content was significantly higher than that
of SiO2 component, which, consequently, results in
the increase of the slump of the AAS concretes.
The compressive strength of the concretes at the
ages of 3, 28 and 91 days of age reported in Table 2
shows that the presence of the retarder had some
detrimental effect on compressive strength in the case
of AAS concretes, particularly at the age of 3d. The
mix design for the PC reference concrete was to meet
the requirement for XS3 and XD3 exposure environ-
ments specified in BS EN 206-1:2000 [22]. From the
compressive strength results at the age of 28 days it
can be seen that not all the AAS concretes achieved the
required strength of 58 MPa for the two exposure
classes. However, most of the AAS concretes met the
strength requirement of 50 MPa for the exposure
classes XS1, XD1 and XD2. It should be noted that the
W/B ratio used for the AAS concretes (0.47) was
higher than that for the PC concrete (0.42). Therefore,
an improved compressive strength could be expected
if a lower W/B ratio was used for the AAS concretes.
However, this would require the development of a
superplasticiser that works with AAS to improve the
workability.
The increase of Na2O % generally increased the
compressive strength of the AAS concretes, which is
in agreement with the results reported by the others
Materials and Structures (2016) 49:3663–3677 3669

[12, 34]. The amount of C-S-H generated in AAS
increases with the increase of Na2O % [35]. This may
be responsible for the increased compressive strength.
The AAS concretes with Ms of 1.50 generally
obtained the highest compressive strength, which has a
good agreement with the results reported previously
[34, 36]. This could be attributed in that the best
hydration of AAS is usually obtained when Ms is
around 1.50 [34, 36].
3.2 Chloride diffusivity, pore structure
and binding
The non-steady state chloride diffusion coefficient
(Dnssd) of the AAS concretes is compared with that of
the PC concrete in Fig. 2. Here it can be seen that the
Dnssd of the former was much lower than of the latter
despite the higher W/B ratio used in the former. This
suggests that the AAS concretes offer better resistance
to chloride ingress. In the paragraph below a detailed
assessment of the data is carried out and an explana-
tion is provided for this observation.
The bulk electrical resistivity of the concretes was
measured in an attempt to indicate the pore structure of
the concretes and to further explain theDnssd results. It
is known that electrical resistivity measurements are
significantly influenced by the pore solution conduc-
tivity of the concrete and, therefore, the bulk resistivity
alone cannot be used to represent the pore structure of
concretes [37, 38]. Consequently, the pore solution
conductivity of the concretes was also measured and
its reciprocal (pore solution resistivity) was plotted
alongside the bulk electrical resistivity, as presented in
Fig. 3. This figure shows that the AAS concretes had
lower pore solution resistivity than the PC concrete
owing to the highly ionic nature of the former.
Therefore, according to the model proposed by
Whittington et al. [39], the reason for the higher bulk
resistivity of the AAS concretes, which is in agreement
with the results reported by Rodriguez et al. [11],
could be attributed to their denser tortuous pore
structure and/or their lower conductive binder matrix.
When the pore solution is highly ionic and conductive
(i.e. poorly resistive), the conductivity of binder
matrix will be insignificant (under normal circum-
stances). This suggests that there would be more ionic
flow taking place through the pore solution and the
binder plays an insignificant role in the overall
electrical resistivity. In Fig. 2, despite the AAS
concretes being less resistive compared to the PC
counterpart (as per Fig. 3), they exhibited lower
chloride diffusivity. This can happen only if the pore
structure is very dense and tortuous [10, 11]. That is, it
can be inferred that the relative better chloride
diffusivity of AAS concrete is the result of their
improved microstructure of the solid phases.
C-S-H (type I), C-A-S-H and hydrotalcite are the
main hydration products in AAS [40] and they have
much potential to bind alkali cations [41, 42].
Substantial amount of Na? had been introduced into
the AAS concretes at the beginning of the mixing (for
instance, Puertas et al. [2] report that the concentration
of Na?was 60,000 ppm in the AAS paste at the age of
3 h when WG with Na2O % of 4 was used). However,
after 3 months of curing, a dramatic reduction in the
0
2
4
6
8
10
12
Dns
sd(×
10-1
2 m2 /s
)
Fig. 2 Non-steady state chloride diffusion coefficients of the
concretes
0
50
100
150
200
250
300
350
0
50
100
150
200
250
300
350Po
re s
olut
ion
resis
tivity
(Ω· c
m)
Bul
k el
ectr
ical
res
istiv
ity ( Ω
·m)
bulk electrical resistivity pore solution resistivity
Fig. 3 Bulk and pore solution electrical resistivity of the
concretes
3670 Materials and Structures (2016) 49:3663–3677

concentration of free Na? was observed in the AAS
concretes, as reported in Table 4. This would suggest
that during the transport of chlorides, there is a
potential for significant binding of the accompanying
sodium cations by the hydrates to occur in the AAS
concretes. Such binding could retard the further
ingress of chlorides in such concretes and reduce their
chloride diffusivity [6]. The lower pH for the AAS
concretes (refer to Table 4) could also have enhanced
their chloride binding capacity due to a competition in
absorption between Cl- and OH- [9], which also
could reduce the Dnssd.
However, it is observed in Fig. 4 that the total
chloride content at the surface of the AAS concretes
was higher than that of the PC concrete. It is
considered that the greater ionic exchange between
Cl- and OH- could be the reason for this. Figure 5
presents pH profiles of the concretes after the chloride
diffusion test. It is clear to see that the pH values
decreased dramatically in the near surface zone of the
AAS concretes. Outward diffusions of alkali materials
from the concrete into the chloride source solution
during the test could be the reason for the pH
reduction, where OH- is considered to be the main
contributor [43]. When such outward diffusion occurs
in PC concrete, Ca(OH)2 would dissolve in the pore
solution to buffer its alkalinity [44]. This explains the
reason for a constant pH value in the PC concrete at
different depths. However, Ca(OH)2 is not one of the
hydration products of AAS. Without the buffering
effect, the loss of alkalinity would be more severe in
the case of the AAS concretes, particularly in the near
surface zone. As a result, it can be considered that
more chlorides penetrated into the near surface zone of
the AAS concretes to take the sites originally occupied
by OH-. Besides, any possible chloride binding
provided by hydration products of the AAS concretes,
such as C-S-H (I), C-A-S-H and hydrotalcite, could
also increase the amount of chlorides at the surface of
such concretes.
Table 4 pH, conductivity and composition of the pore solution of the concretes after 3 months of curing and chloride contents of the
concretes at anodic steel bar level after the corrosion test (% by mass of concrete sample)
Mix no.
(Na2O %-Ms)
pH Conductivity
(mS/cm)
Concentration of ions (ppm) Cl
Na S Total Water soluble
4 %-0.75 11.7 16.8 2154 2458 0.45 0.31
4 %-1.00 11.9 16.7 4740 1953 0.44 0.21
4 %-1.50 10.5 18.6 58.96 3786 0.45 0.19
4 %-2.00 9.9 16.5 121.2 4348 0.54 0.20
6 %-0.75 11.9 30.5 96.26 5661 0.40 0.19
6 %-1.00 11.9 28.9 69.19 6210 0.34 0.17
6 %-1.50 11.4 41.0 42.81 6245 0.28 0.16
6 %-2.00 9.9 36.6 18.20 6292 0.34 0.20
8 %-0.75 12.4 33.3 202.0 664.0 0.45 0.15
8 %-1.00 12.2 40.7 244.0 590.0 0.46 0.20
8 %-1.50 10.8 25.5 185.3 618.3 0.45 0.23
8 %-2.00 11.9 48.6 64.34 608.0 0.44 0.26
PC 12.5 10.4 1234 329.6 0.41 0.20
0
0.5
1
1.5
2
2.5
Chl
orid
e (%
of c
oncr
ete
sam
ple)
Fig. 4 Mathematically determined surface chloride concentra-
tion of the concretes
Materials and Structures (2016) 49:3663–3677 3671

The Dnssd of the AAS concretes decreased with the
increase of Na2O % from 4 to 8, as shown in Fig. 6. As
reported by Al-Otaibi [12] and Karahan and Yaku-
poglu [33], porosity of AAS is reduced with the
increase of Na2O %. This could be one of the primary
reasons for the reduction in Dnssd with the increase of
Na2O % for the AAS concretes. Besides, hydration
degree of AAS increases with the increase of Na2O %
[35]. As a result, more hydration products would be
formed in the AAS with a higher Na2O %, increasing
the binding capacity of either/both chlorides and/or
their accompanying sodium cations. This could also
have contributed to the reduction of Dnssd in AAS
concretes with the increase of Na2O %.
Ms around 1.50 is optimum for the hydration of
AAS [34, 36]. As a result, the reduced porosity and
enhanced binding capacity of AAS with Ms around
1.50 could be the reasons for the lowestDnssd provided
by the AAS concretes with Ms of 1.50, as shown in
Fig. 7.
3.3 Corrosion of the embedded steel
As discussed previously, the AAS concretes may have
better pore structure than the PC concrete. Conse-
quently, the former had lower chloride diffusivity.
From Table 4 it can be seen that although the duration
(a)
(b)
10
10.5
11
11.5
12
12.5
13
3 6 9 12 15 18 21 24 27 30
pH
Depth (mm)
4%-0.754%-1.004%-1.50
4%-2.00PC
10
10.5
11
11.5
12
12.5
13
3 6 9 12 15 18 21 24 27 30
pH
Depth (mm)
6%-0.756%-1.006%-1.50
6%-2.00PC
(c)
10
10.5
11
11.5
12
12.5
13
3 6 9 12 15 18 21 24 27 30
pH
Depth (mm)
8%-0.758%-1.008%-1.50
8%-2.00PC
Fig. 5 pH profiles after 3 months of chloride immersion
0
1
2
3
4
5
6
7
8
4 5 6 7 8
Dns
sd(×
10- 1
2 m2 /s
)
Na2O%
Ms=0.75
Ms=1.00
Ms=1.50
Ms=2.00
Fig. 6 Effect of Na2O % on the non-steady state chloride
diffusion coefficient
0
1
2
3
4
5
6
7
8
0.5 1 1.5 2
Dns
sd(×
10-1
2 m2 /s
)
Ms
Na2O%=4
Na2O%=6
Na2O%=8
Fig. 7 Effect of Ms on the non-steady state chloride diffusion
coefficient
3672 Materials and Structures (2016) 49:3663–3677
of intermittent chloride ponding was much longer for
the AAS concretes (427–588 days), compared to the
PC concrete (245 days), both total and water soluble
chloride contents at the anodic steel bar level were
generally comparable between the AAS and the PC
concretes at the end of the chloride ponding regime.
Similarly, their resistance to the ingress of the other
aggressive substances such as water and O2 may also
be favourable and a low corrosion rate of the
embedded steel bars was anticipated. However, the
corrosion rate of the steel bars in the AAS concretes
was not significantly lower than that of the PC
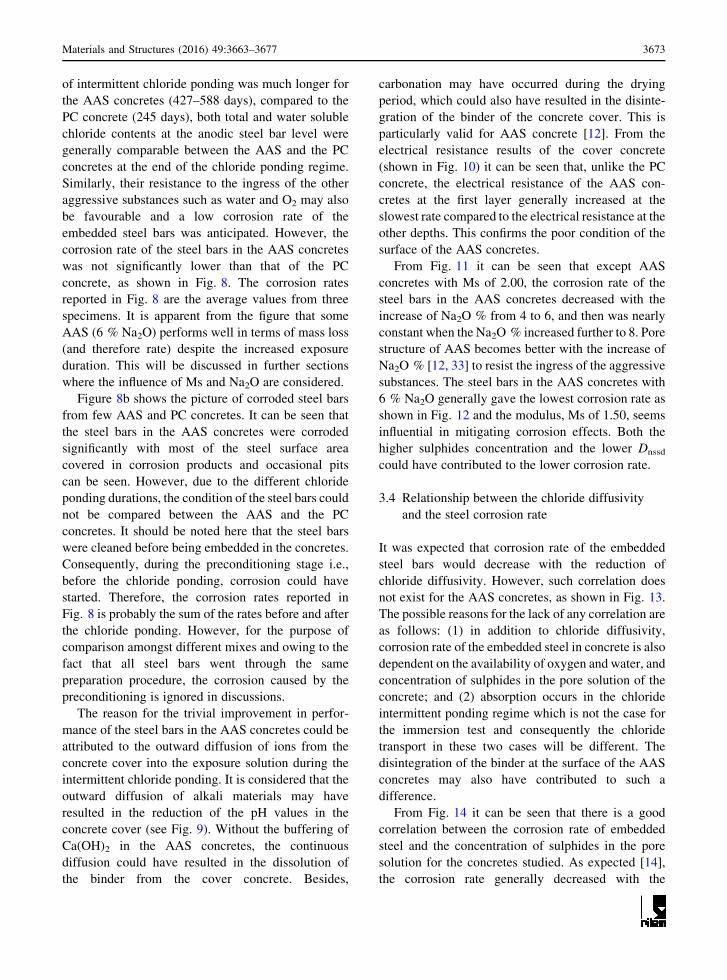
concrete, as shown in Fig. 8. The corrosion rates
reported in Fig. 8 are the average values from three
specimens. It is apparent from the figure that some
AAS (6 % Na2O) performs well in terms of mass loss
(and therefore rate) despite the increased exposure
duration. This will be discussed in further sections
where the influence of Ms and Na2O are considered.
Figure 8b shows the picture of corroded steel bars
from few AAS and PC concretes. It can be seen that
the steel bars in the AAS concretes were corroded
significantly with most of the steel surface area
covered in corrosion products and occasional pits
can be seen. However, due to the different chloride
ponding durations, the condition of the steel bars could
not be compared between the AAS and the PC
concretes. It should be noted here that the steel bars
were cleaned before being embedded in the concretes.
Consequently, during the preconditioning stage i.e.,
before the chloride ponding, corrosion could have
started. Therefore, the corrosion rates reported in
Fig. 8 is probably the sum of the rates before and after
the chloride ponding. However, for the purpose of
comparison amongst different mixes and owing to the
fact that all steel bars went through the same
preparation procedure, the corrosion caused by the
preconditioning is ignored in discussions.
The reason for the trivial improvement in perfor-
mance of the steel bars in the AAS concretes could be
attributed to the outward diffusion of ions from the
concrete cover into the exposure solution during the
intermittent chloride ponding. It is considered that the
outward diffusion of alkali materials may have
resulted in the reduction of the pH values in the
concrete cover (see Fig. 9). Without the buffering of
Ca(OH)2 in the AAS concretes, the continuous
diffusion could have resulted in the dissolution of
the binder from the cover concrete. Besides,
carbonation may have occurred during the drying
period, which could also have resulted in the disinte-
gration of the binder of the concrete cover. This is
particularly valid for AAS concrete [12]. From the
electrical resistance results of the cover concrete
(shown in Fig. 10) it can be seen that, unlike the PC
concrete, the electrical resistance of the AAS con-
cretes at the first layer generally increased at the
slowest rate compared to the electrical resistance at the
other depths. This confirms the poor condition of the
surface of the AAS concretes.
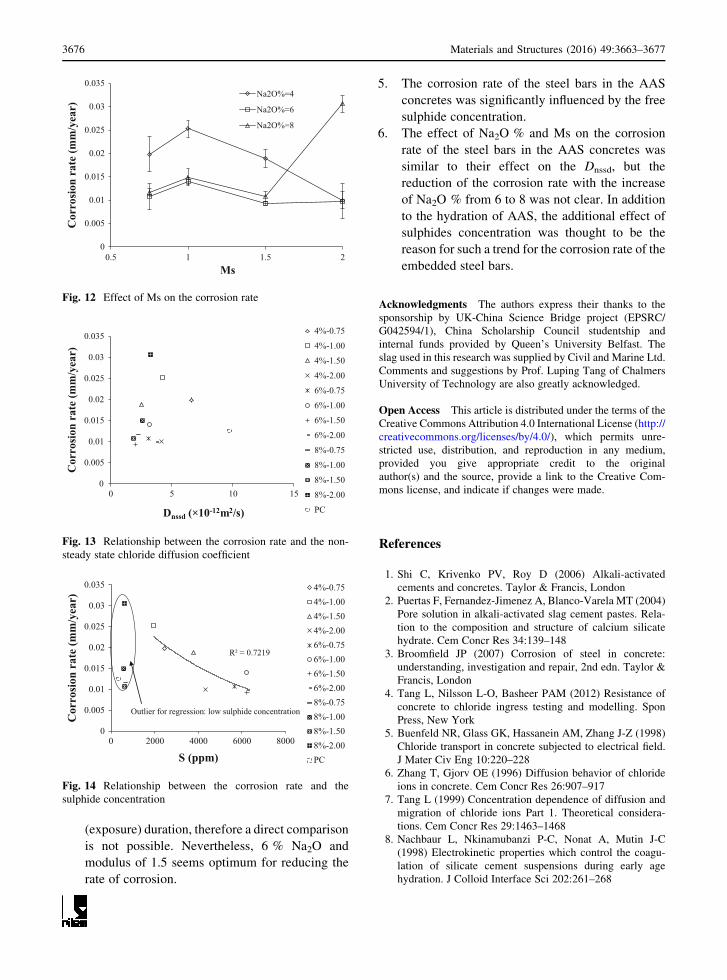
From Fig. 11 it can be seen that except AAS
concretes with Ms of 2.00, the corrosion rate of the
steel bars in the AAS concretes decreased with the
increase of Na2O % from 4 to 6, and then was nearly
constant when the Na2O % increased further to 8. Pore
structure of AAS becomes better with the increase of
Na2O % [12, 33] to resist the ingress of the aggressive
substances. The steel bars in the AAS concretes with
6 % Na2O generally gave the lowest corrosion rate as
shown in Fig. 12 and the modulus, Ms of 1.50, seems
influential in mitigating corrosion effects. Both the
higher sulphides concentration and the lower Dnssd
could have contributed to the lower corrosion rate.
3.4 Relationship between the chloride diffusivity
and the steel corrosion rate
It was expected that corrosion rate of the embedded
steel bars would decrease with the reduction of
chloride diffusivity. However, such correlation does
not exist for the AAS concretes, as shown in Fig. 13.
The possible reasons for the lack of any correlation are
as follows: (1) in addition to chloride diffusivity,
corrosion rate of the embedded steel in concrete is also
dependent on the availability of oxygen and water, and
concentration of sulphides in the pore solution of the
concrete; and (2) absorption occurs in the chloride
intermittent ponding regime which is not the case for
the immersion test and consequently the chloride
transport in these two cases will be different. The
disintegration of the binder at the surface of the AAS
concretes may also have contributed to such a
difference.
From Fig. 14 it can be seen that there is a good
correlation between the corrosion rate of embedded
steel and the concentration of sulphides in the pore
solution for the concretes studied. As expected [14],
the corrosion rate generally decreased with the
Materials and Structures (2016) 49:3663–3677 3673
increase of the concentration of sulphides due to the
reducing environment provided by sulphides.
4 Conclusion
On the basis of the mixes studied and test methods
applied for the characterisation of chloride transport
and its resulting corrosion of the steel bars in the AAS
concretes, the following conclusions have been drawn:
1. The AAS concretes had higher total chloride
content at the surface than that of the PC concrete.
Greater ionic exchange between the chlorides and
the hydroxyl ions and the possibly enhanced
chloride binding at the surface of the AAS
concretes have been identified as the possible
reasons.
2. Compared to the PC concrete, the AAS concretes
were found to have lower chloride diffusivity. The
better pore structure, the possibly stronger inter-
action between hydration products and the accom-
panying sodium cations and the improved
chloride binding for the AAS concretes are
considered to be the reason for this.
3. The non-steady state diffusion coefficient, Dnssd,
of the AAS concretes was found to be influenced
(a) corrosion rate
0
0.005
0.01
0.015
0.02
0.025
0.03
0.035
Cor
rosi
on r
ate
(mm
/yea
r)
(b) Corrosion of the anodic steel bar (top left is PC concrete and the other ones are AAS concretes)
Fig. 8 Corrosion rates
calculated from the
gravimetric mass loss of
steel and corrosion of the
anodic steel bars at the end
of the exposure regime
3674 Materials and Structures (2016) 49:3663–3677

by both Na2O % and Ms. An increase in Na2O %
from 4 to 8 resulted in a decrease in Dnssd. Ms of
1.50 proved to be the optimum to give the lowest
Dnssd. This is in agreement with their effect on the
hydration of AAS.
4. The corrosion rate of the steel bars in the AAS
concretes was comparable to that observed in the
PC concrete under the intermittent chloride
ponding regime. It should be noted that AAS
concretes were subjected to longer ponding
10
10.5
11
11.5
12
12.5
13
3 6 9 12 15 20 25 30 35 40 45
pH
Depth (mm)
4%-0.754%-1.004%-1.504%-2.006%-0.756%-1.006%-1.506%-2.008%-0.758%-1.008%-1.508%-2.00PC
Location of anodic steel
Fig. 9 pH profiles determined at the end of the chloride
ponding exposure regime
0
0.5
1
1.5
2
2.5
3
0 100 200 300 400 500Ele
ctri
cal r
esis
tanc
e ra
tio
(Rt/R
0)
Time (days)
4%-0.75
15mm 25mm35mm 45mm
0
0.5
1
1.5
2
2.5
3
0 100 200 300 400 500Ele
ctri
al r
esis
tanc
e ra
tio
(Rt/R
0)
Time (days)
4%-1.00
15mm 25mm35mm 45mm
0
0.5
1
1.5
2
2.5
0 100 200 300 400 500Ele
ctri
cal r
esis
tanc
e ra
tio
(Rt/R
0)
Time (days)
4%-1.50
15mm 25mm35mm 45mm 0
0.5
1
1.5
2
2.5
3
0 100 200 300 400 500 600Ele
ctri
cal r
esis
tanc
e ra
tio
(Rt/R
0)Time (days)
4%-2.00
15mm 25mm35mm 45mm
0
0.5
1
1.5
2
2.5
3
0 200 400 600 800
Ele
ctri
cal r
esis
tanc
e ra
tio
(Rt/R
0)
Time (days)
6%-0.75
15mm 25mm35mm 45mm
0
0.5
1
1.5
2
2.5
0 200 400 600 800Ele
ctri
cal r
esis
tanc
e ra
tio
(Rt/R
0)
Time (days)
6%-1.00
15mm 25mm35mm 45mm
00.5
11.5
22.5
33.5
0 100 200 300 400 500 600Ele
ctri
cal r
esis
tanc
e ra
tio
(Rt/R
0)
Time (days)
6%-1.50
15mm 25mm35mm 45mm
00.5
11.5
22.5
33.5
0 100 200 300 400 500 600Ele
ctri
cal r
esis
tanc
e ra
tio
(Rt/R
0)
Time (days)
6%-2.00
15mm 25mm35mm 45mm
00.5
11.5
22.5
3
0 100 200 300 400 500 600
Ele
ctri
cal r
esis
tanc
e ra
tio
(Rt/R
0)
Time (days)
8%-0.75
15mm 25mm35mm 45mm 0
1
2
3
4
5
0 100 200 300 400 500 600
Ele
ctri
cal r
esis
tanc
e ra
tio
(Rt/R
0)
Time (days)
8%-1.00
15mm 25mm35mm 45mm 0
0.51
1.52
2.53
0 100 200 300 400 500 600
Ele
ctri
cal r
esis
tanc
e ra
tio
(Rt/R
0)
Time (days)
8%-1.50
15mm 25mm35mm 45mm 0
0.51
1.52
2.53
0 100 200 300 400 500
Ele
ctri
cal r
esis
tanc
e ra
tio
(Rt/R
0)
Time (days)
8%-2.00
15mm 25mm35mm 45mm
0
1
2
0 50 100 150 200 250 300
0.5
1.5
Ele
ctri
cal r
esis
tanc
e ra
tio
(Rt/R
0)
Time (days)
PC
15mm 25mm35mm 45mm
Fig. 10 Change in the ratio of electrical resistance during chloride ponding test (R(t,x) is the resistance at any time ‘t’ for each depth (x),
R0 is the resistance at time ‘0’ for the depth of 45 mm)
0
0.005
0.01
0.015
0.02
0.025
0.03
0.035
4 5 6 7 8
Cor
rosi
on r
ate
(mm
/yea
r)Na2O%
Ms=0.75
Ms=1.00
Ms=1.50
Ms=2.00
Fig. 11 Effect of Na2O % on the corrosion rate
Materials and Structures (2016) 49:3663–3677 3675
(exposure) duration, therefore a direct comparison
is not possible. Nevertheless, 6 % Na2O and
modulus of 1.5 seems optimum for reducing the
rate of corrosion.
5. The corrosion rate of the steel bars in the AAS
concretes was significantly influenced by the free
sulphide concentration.
6. The effect of Na2O % and Ms on the corrosion
rate of the steel bars in the AAS concretes was
similar to their effect on the Dnssd, but the
reduction of the corrosion rate with the increase
of Na2O % from 6 to 8 was not clear. In addition
to the hydration of AAS, the additional effect of
sulphides concentration was thought to be the
reason for such a trend for the corrosion rate of the
embedded steel bars.
Acknowledgments The authors express their thanks to the
sponsorship by UK-China Science Bridge project (EPSRC/
G042594/1), China Scholarship Council studentship and
internal funds provided by Queen’s University Belfast. The
slag used in this research was supplied by Civil and Marine Ltd.
Comments and suggestions by Prof. Luping Tang of Chalmers
University of Technology are also greatly acknowledged.
Open Access This article is distributed under the terms of the
Creative Commons Attribution 4.0 International License (http://
creativecommons.org/licenses/by/4.0/), which permits unre-
stricted use, distribution, and reproduction in any medium,
provided you give appropriate credit to the original
author(s) and the source, provide a link to the Creative Com-
mons license, and indicate if changes were made.
References
1. Shi C, Krivenko PV, Roy D (2006) Alkali-activated
cements and concretes. Taylor & Francis, London
2. Puertas F, Fernandez-Jimenez A, Blanco-Varela MT (2004)
Pore solution in alkali-activated slag cement pastes. Rela-
tion to the composition and structure of calcium silicate
hydrate. Cem Concr Res 34:139–148
3. Broomfield JP (2007) Corrosion of steel in concrete:
understanding, investigation and repair, 2nd edn. Taylor &
Francis, London
4. Tang L, Nilsson L-O, Basheer PAM (2012) Resistance of
concrete to chloride ingress testing and modelling. Spon
Press, New York
5. Buenfeld NR, Glass GK, Hassanein AM, Zhang J-Z (1998)
Chloride transport in concrete subjected to electrical field.
J Mater Civ Eng 10:220–228
6. Zhang T, Gjorv OE (1996) Diffusion behavior of chloride
ions in concrete. Cem Concr Res 26:907–917
7. Tang L (1999) Concentration dependence of diffusion and
migration of chloride ions Part 1. Theoretical considera-
tions. Cem Concr Res 29:1463–1468
8. Nachbaur L, Nkinamubanzi P-C, Nonat A, Mutin J-C
(1998) Electrokinetic properties which control the coagu-
lation of silicate cement suspensions during early age
hydration. J Colloid Interface Sci 202:261–268
0
0.005
0.01
0.015
0.02
0.025
0.03
0.035
0.5 1 1.5 2
Cor
rosi
on r
ate
(mm
/yea
r)
Ms
Na2O%=4
Na2O%=6
Na2O%=8
Fig. 12 Effect of Ms on the corrosion rate
0
0.005
0.01
0.015
0.02
0.025
0.03
0.035
0 5 10 15
Cor
rosi
on r
ate
(mm
/yea
r)
Dnssd (×10-12m2/s)
4%-0.75
4%-1.00
4%-1.50
4%-2.00
6%-0.75
6%-1.00
6%-1.50
6%-2.00
8%-0.75
8%-1.00
8%-1.50
8%-2.00
PC
Fig. 13 Relationship between the corrosion rate and the non-
steady state chloride diffusion coefficient
R² = 0.7219
0
0.005
0.01
0.015
0.02
0.025
0.03
0.035
0 2000 4000 6000 8000
Cor
rosi
on r
ate
(mm
/yea
r)
S (ppm)
4%-0.754%-1.004%-1.504%-2.006%-0.756%-1.006%-1.506%-2.008%-0.758%-1.008%-1.508%-2.00PC
Outlier for regression: low sulphide concentration
Fig. 14 Relationship between the corrosion rate and the
sulphide concentration
3676 Materials and Structures (2016) 49:3663–3677

9. Tritthart J (1989) Chloride binding in cement II. The
influence of the hydroxide concentration in the pore solution
of hardened cement paste on chloride binding. Cem Concr
Res 19:683–691
10. Shi C (1996) Strength, pore structure and permeability of
alkali-activated slag mortars. Cem Concr Res
26:1789–1799
11. Rodriguez E, Bernal S, Gutierrez de Gutierrez R, Puertas F
(2008) Alternative concrete based on alkali-activated slag.
Mater de Constr 58(291):53–67
12. Al-Otaibi S (2008) Durability of concrete incorporating
GGBS activated by water-glass. Constr Build Mater
22(10):2059–2067
13. Schuring J, Schulz HD, Fischer WR, Bottcher J, Duijnisveld
W (1999) Redox, fundamentals, processes and applications.
Springer, New York
14. Shoesmith DW, Taylor P, Bailey MG, Ikeda B (1978)
Electrochemical behaviour of iron in alkaline sulphide
solutions. Electrochim Acta 23:903–916
15. Glasser FP (1991) Chemical, mineralogical, and
microstructural changes occurring in hydrated slag-cement
blends. Mater Sci Concr II:41–81
16. Holloway M, Sykes JM (2005) Studies of the corrosion of
mild steel in alkali-activated slag cement mortars with
sodium chloride admixtures by a galvanostatic pulse
method. Corros Sci 47(12):3097–3110
17. Gomez RT, Aperador W, Vera E, Mejıa de Gutierrez R,
Ortiz C (2010) Study of steel corrosion embedded in AAS
concrete under chlorides. Dyna 77(164):52–59
18. NT BUILD 443 (1995) Concrete, hardened: accelerated
chloride penetration
19. BS EN 15167-1 (2006) Ground granulated blast furnace
slag for use in concrete, mortar and grout—Part 1 Defini-
tions, specifications and conformity criteria
20. BS EN 197-1 (2000) Cement—Part 1: Composition, spec-
ifications and conformity criteria for common cements
21. Yang C, Pu X (1993) Retarder of alkali activated slag,
Chinese patent, 91108316.2
22. BS EN 206-1 (2000) Concrete —Part 1: Specification,
performance, production and conformity
23. BS 1881-125 (1986) Testing concrete —Part 125: Methods
for mixing and sampling fresh concrete in the laboratory
24. BS EN 12350-2 (2009) Testing fresh concrete Part 2:
Slump-test
25. BS EN 12350-3 (2009) Testing hardened concrete Part 3:
Compressive strength of test specimens
26. NT BUILD 492 (1999) Concrete, mortar and cement-based
repair materials: chloride migration coefficient from non-
steady-state migration experiments
27. RILEM TC 178-TMC (2002) Testing and modelling chlo-
ride penetration in concrete’ analysis of total chloride con-
tent in concrete Recommendation. Mater Struct 35:583–585
28. RILEM TC 178-TMC (2002) Testing and modelling chlo-
ride penetration in concrete’ analysis of water soluble
chloride content in concrete recommendation. Mater Struct
35:586–588
29. Ma Q (2013) Chloride transport and chloride induced cor-
rosion of steel reinforcement in sodium silicate solution
activated slag concrete, Ph.D thesis, Queen’s University
Belfast, U. K
30. Tang L (2005) Guideline for practical use of methods for
testing the resistance of concrete to chloride ingress,
Chlortest Report
31. BS 8500-1 (2006) Concrete—complementary British
Standard to BS EN 206-1—part 1: method of specifying and
guidance for the specifier
32. Allahverdi A, Shaverdi B, Najafi KE (2010) Influence of
sodium oxide on properties of fresh and hardened paste of
alkali-activated blast-furnace slag. Int J Civil Eng
8(4):304–314
33. Karahan O, Yakupoglu A (2011) Resistance of alkali-acti-
vated slag mortar to abrasion and fire. Adv Cem Res
23(6):289–297
34. Krizan D, Zivanovic B (2002) Effects of dosage and mod-
ulus of water glass on early hydration of alkali-slag cements.
Cem Concr Res 32(8):1181–1188
35. Neto AMA, Cincotto MA, Repette W (2008) Drying and
autogenous shrinkage of pastes and mortars with activated
slag cement. Cem Concr Res 38(4):565–574
36. Bernal SA, Provis JL, Rose V, de Mejıa Gutierrez R (2011)
Evolution of binder structure in sodium silicate-activated
slag-metakaolin blends. Cem Concr Compos 33(1):46–54
37. Basheer PAM, Gilleece PRV, Long AE, Mc Carter WJ
(2002) Monitoring electrical resistance of concretes con-
taining alternative cementitious materials to assess their
resistance to chloride penetration. Cem Concr Compos
24(5):437–449
38. Polder RB, Peelen WHA (2002) Characterisation of chlo-
ride transport and reinforcement corrosion in concrte under
cyclicwetting and drying by electrical resistivity. Cem
Concr Compos 24(5):427–435
39. Whittington HW, McCarter J, Forde MC (1981) The con-
duction of electricity through concrete. Mag Concr Res
33(114):48–60
40. Wang SD, Scrivener KL (1995) Hydration products of alkali
activated slag cement. Cem Concr Res 25(3):561–571
41. Hong S-Y, Glasser FP (2002) Alkali sorption by C-S-H and
C-A-S-H gels: Part II. Role of alumina. Cem Concr Res
32:1101–1111
42. Chen W, Brouwers HJH (2011) A method for predicting the
alkali concentrations in pore solution of hydrated slag
cement paste. J Mater Sci 46:3622–3631
43. Castellote M, Andrade C, Alonso C (2000) Phenomeno-
logical mass-balance-based model of migration tests in
stationary conditions application to non-steady-state tests.
Cem Concr Res 30(12):1885–1893
44. Page CL (1975) Mechanism of corrosion protection in
reinforced concrete marine structures. Nature 258:514–515
Materials and Structures (2016) 49:3663–3677 3677