Embed Size (px)
Citation preview
Modern Physiognomy: An Investigation on PredictingPersonality Traits and Intelligence from the Human Face
Rizhen Qin1, Wei Gao1, Huarong Xu3, Zhanyi Hu1,2*
1 National Laboratory of Pattern Recognition, Institute of Automation,Chinese Academy of Sciences, Beijing, 100190, China 2 CAS Center forExcellence in Brain Science and Intelligent Technology, Institute ofAutomation, Chinese Academy of Sciences, Beijing, 100190, China 3Department of Computer Science and Technology, Xiamen University ofTechnology, Xiamen, Fujian Province, 361024, China
Abstract
The human behavior of evaluating other individuals with respect to their personalitytraits and intelligence by evaluating their faces plays a crucial role in human relations.These trait judgments might influence important social outcomes in our lives such aselections and court sentences. Previous studies have reported that human can makevalid inferences for at least four personality traits. In addition, some studies havedemonstrated that facial trait evaluation can be learned using machine learningmethods accurately. In this work, we experimentally explore whether self-reportedpersonality traits and intelligence can be predicted reliably from a facial image. Morespecifically, the prediction problem is separately cast in two parts: a classification taskand a regression task. A facial structural feature is constructed from the relationsamong facial salient points, and an appearance feature is built by five texturedescriptors. In addition, a minutia-based fingerprint feature from a fingerprint image isalso explored. The classification results show that the personality traits“Rule-consciousness” and “Vigilance” can be predicted reliably, and that the traits offemales can be predicted more accurately than those of male. However, the regressionexperiments show that it is difficult to predict scores for individual personality traitsand intelligence. The residual plots and the correlation results indicate no evident linearcorrelation between the measured scores and the predicted scores. Both theclassification and the regression results reveal that “Rule-consciousness” and “Tension”can be reliably predicted from the facial features, while “Social boldness” gets the worstprediction results. However, for the median values of the traits, the fitting performancelooks better. Finally the classification and regression results show that it is difficult, ifnot impossible, to predict intelligence from either the facial features or the fingerprintfeature, a finding that is in agreement with previous studies.
Introduction
Even as long ago as the ancient Chinese, Egyptian and Greek civilizations, people hadtried to establish a relationship between facial morphological features and anindividual’s personality traits [1]. Modern psychological studies have revealed that
1/27
arX
iv:1
604.
0749
9v1
[cs
.CV
] 2
6 A
pr 2
016

people tend to evaluate others on their appearance and then proceed to interact withthem based on these first impressions. Currently, it has been well established that facesplay a central role in people’s everyday assessments of other people [2].
Automatic facial evaluation is a human mechanism that evolved through the processof assessing facial cues. There is the truth behind first impressions: it was shown thathumans can make valid inferences for at least four personality traits (Agreeableness,Conscientiousness, Extraversion and Dominance) from facial features [3, 4]. In [5],Wolffhechel et al. studied the relationship between self-reported personality traits andfirst impressions and found that some personality traits could be predicted from faces toa certain extent. The results of [6] showed that the people could accurately evaluate theintelligence of males by viewing their faces.
To simulate human communicative behaviors, [7, 8] used machine learning methodsto construct an automatic trait predictor based on facial structural descriptors andappearance descriptors. They found that all the analyzed personality traits could bepredicted accurately. As the behaviors used by humans to evaluate personality traitscontain some commonalities, these behaviors can also be simulated by machine learningmethods.
Currently, the following two points hold: First, some self-reported personality traitsand intelligence can be evaluated to a certain extent by humans based on facial features.Second, the commonalities existing in the evaluation behavior of the human can bemined by machine learning methods. In [5, 6], the relationships between the facialfeatures and self-reported personality traits or measured intelligence were studied.However, their findings were mostly negative; little correlation was found between facialfeatures and personality traits or measured intelligence.
In this work, we further explore whether self-reported personality traits andmeasured intelligence can be predicted from the facial features by gathering moresamples, extracting more diverse features, and adopting more classification andregression rules. To represent the characteristics of the facial images, we construct astructural feature according to the description in [7] and construct an appearancefeature using five textural descriptors: HOG [10], LBP [11], Gabor [12], Gist [13] andSIFT [14]. For these extracted features to be more informative for facial representation,the facial images are preprocessed by segmentation and cropping to remove irrelevantinformation such as the background, hair and clothes. In addition, an image pyramid isbuilt for each face image to form a multi-scale high-dimensional representation. In ourwork, we also perform experiments to study the relationships between the fingerprintfeature and self-reported personality traits as well as measured intelligence to seewhether we could obtain consistent results for both the facial image and the fingerprintimage.
The above three types of features are used as the sample representations for thepersonality traits prediction in this work, and the prediction problem is cast separatelyas both a classification task and a regression task, where a bank of classification andregression methods are systematically investigated. To construct the classification labelsand the regression targets, the personality traits scores and the measured intelligencescores are converted into appropriate values first, and then, a variety of criteria are usedto evaluate the experimental results.
Our experiments show that some personality traits are related to the tested facialcharacteristics and can be predicted from those facial features fairly reliably, while someother personality traits may largely depend on the social environment; little correlationseems to exist between them and facial characteristics. We find the predictability of thepersonality traits tends to be more reliable based on the appearance feature rather thanon the structural feature or the fingerprint feature. As for the measured intelligence,neither the facial features nor the fingerprint feature provide any reliable prediction for
2/27

either males or females. In our work, the results of the regression experiments show noevident linear correlation between the predicted scores and the measured scores of thepersonality traits and intelligence, so it is difficult, if not impossible, to predict theirprecise scores. However, the prediction performance of the median scores of thepersonality traits and the high scores of the intelligence is relatively better.
Related Work
In [1], McNeill reported that humans have tried to establish relationships between facialmorphological features and individual personality traits since very ancient civilizationssuch as those in ancient China, Egypt and Greece. At present, psychological studiesshow that faces play an important role in people’s everyday assessments of otherpeople [2]. Humans perform trait judgements from faces unconsciously, and thisunconscious behavior can sometimes decisively affect the results of important socialevents such as elections [15,16] or court sentences [17].
In [18], Oostehof and Todorov developed a 2D model to identify the basic underlyingdimensions of human facial traits evaluation. The authors used the PrincipalComponent Analysis (PCA) technique on the linguistic judgement of the traits andidentified two fundamental dimensions: Valence and Dominance. The authors of [19, 20]studied the human tendency to evaluate others on their faces and identified someimportant facial features that generate first impressions. In addition, they showed thathumans can make valid inferences for at least four personality traits (Agreeableness,Conscientiousness, Extraversion, and Dominance) from facial features.
Automatic evaluation of faces is a human mechanism that evolved from the need toquickly assess potential threats-an evolution that has shaped the saliency of facialcues [7]. In [5], Wolffhechel et al. studied the relationship between self-reportedpersonality traits and first impressions. Their results revealed that some personalitytraits could be inferred from faces to a certain extent. In addition, they found that, onaverage, people assess a given face in a highly similar manner. In [6], the authors usedfacial photographs of 40 men and 40 women to test the relationship between measuredIQ and perceived intelligence. They found that people were able to accurately evaluatethe intelligence of men by viewing their facial photographs, but not the intelligence ofwomen.
As stated above, humans can accurately evaluate the personality traits andintelligence of other people to some extent by viewing their faces; therefore, someresearchers have investigated whether the trait evaluations performed by humans can belearned automatically by computers. In [7], Rojas et al. designed a computationalsystem and used the geometrical information contained in a small number of facialpoints to train the model. Their results suggested that facial traits evaluation can belearned by machine learning methods. In [8], Rojas et al. carried out furtherexperiments to determine whether facial appearance or facial structural information ismore useful for facial traits evaluation. They used a classification framework to evaluateboth the structural and appearance information and found that the appearanceinformation was more strongly related to the prediction capability.
Recently, some researchers have investigated whether self-reported personality traitsand measured intelligence could be evaluated accurately based on facial characteristics.In [5], Wolffhechel et al. used a normative self-reported questionnaire (Cubiks In-depthPersonality Questionnaire, CIPQ 2.0) to measure participants’ personality traits. At thesame time, they applied an appearance model to extract both textural and shapeinformation inside the facial boundary. The results (using various nonlinear approaches)revealed that the correlation was not strong enough for a stable prediction. In [6], theauthors tested the relationship between measured intelligence and facial shape, but
3/27

could establish no correlation between facial morphological features and intelligence asmeasured with an IQ test.
In this work, we further investigate the predictability of personality traits from facialimages by gathering more samples, extracting more diverse features, and adopting moreclassification and regression rules. The subsequent sections will elaborate on the 4 keycomponents of our work: data acquisition, feature extraction, classification, andregression.
Materials
Ethics Statement
The Institutional Review Board of the Institute of Automation of the Chinese Academyof Sciences has approved this research. The participants were asked to give verbalinformed consent to participate in the research and no data were collected until thisconsent was obtained. The consent is thereby documented by the recording of the data.This was in accordance with the guidelines of the Ethics Committee, Ministry of Healthof the People’s Republic of China which state that written consent is only required ifbiological samples are collected, which was not the case in this study. In addition, thedata for the measured intelligence, the self-reported personality traits and thefingerprint images were analyzed anonymously.
Photographs
Facial photographs of 186 students (94 men and 92 women) from the College ofComputer And Information Engineering and School of Business, Xiamen University ofTechnology, China, were used as stimuli. The participants were asked to sit in front of awhite background and were photographed with a digital camera, a Canon 5D Mark III.The participants were requested to show a neutral, non-smiling expression and avoidfacial cosmetics, jewelry, and other decorations. In addition, we also used a fingerprintsampler to collect fingerprint images from the participants’ thumbs.
Personality Measurements
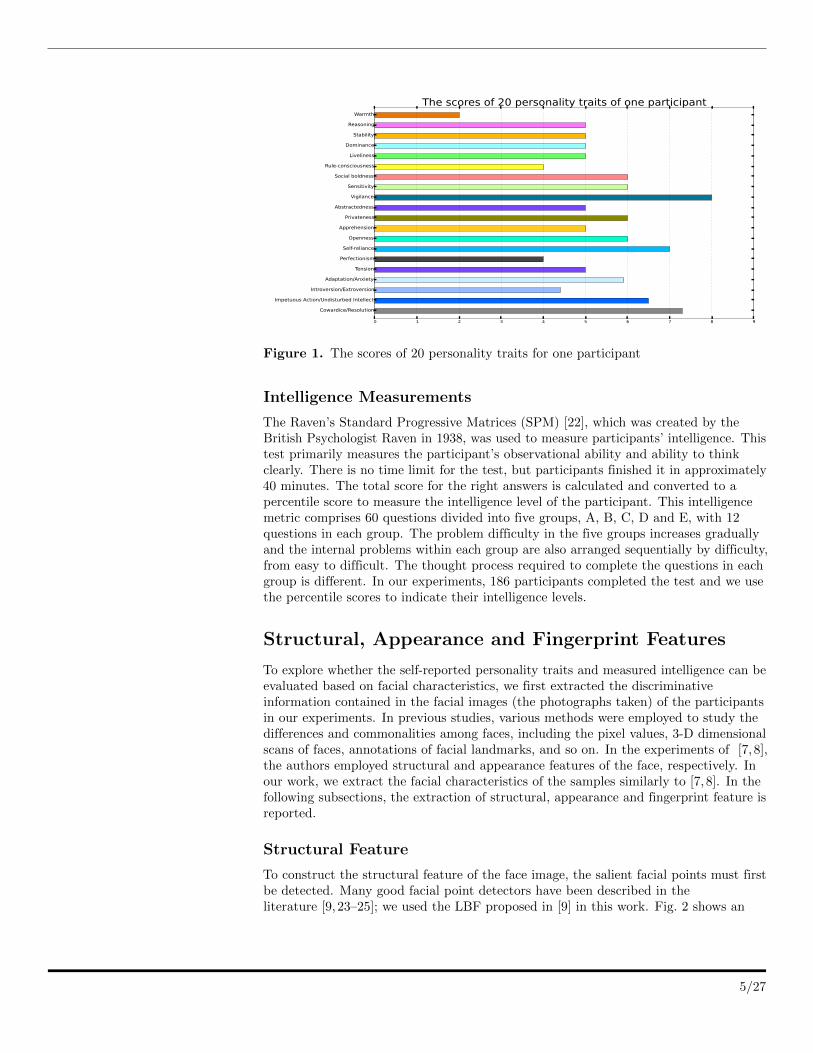
To measure the personality traits of the participants, each was instructed to fill out aCattell Sixteen Personality Factors Questionnaire (16PF) [21] which is a normativeself-report questionnaire that scores 16 personality traits. This questionnaire wascompiled by Prof. Cattell, who was engaged in Personality Psychology research formany years. In contrast to other similar tests, the 16PF can capture more personalitytraits at the same time. Completing the questionnaire required approximately 40minutes. The traits measured by 16PF are Warmth, Reasoning, Emotional stability,Dominance, Liveliness, Rule-consciousness, Social boldness, Sensitivity, Vigilance,Abstractedness, Privateness, Apprehension, Openness to change, Self-reliance,Perfectionism and Tension. For each personality trait, a score ranging from 1 to 10 wasassessed by the commercial software developed by Beijing Normal University EducationTraining Center according to the responses of each participant on the questionnaire.Note that Prof. Cattell performed a second-order factor analysis based on these sixteenpersonality factors and acquired the following four second-order factors:Adaptation/Anxiety, Introversion/Extroversion, Impetuous Action/UndisturbedIntellect, and Cowardice/Resolution. In our experiments, we use these 20 traits todescribe the personality of each participant. Fig. 1 shows an example of the 20personality trait scores for one participant.
4/27
0 1 2 3 4 5 6 7 8 9
Cowardice/Resolution
Impetuous Action/Undisturbed Intellect
Introversion/Extroversion
Adaptation/Anxiety
Tension
Perfectionism
Self-reliance
Openness
Apprehension
Privateness
Abstractedness
Vigilance
Sensitivity
Social boldness
Rule-consciousness
Liveliness
Dominance
Stability
Reasoning
Warmth
The scores of 20 personality traits of one participant
Figure 1. The scores of 20 personality traits for one participant
Intelligence Measurements
The Raven’s Standard Progressive Matrices (SPM) [22], which was created by theBritish Psychologist Raven in 1938, was used to measure participants’ intelligence. Thistest primarily measures the participant’s observational ability and ability to thinkclearly. There is no time limit for the test, but participants finished it in approximately40 minutes. The total score for the right answers is calculated and converted to apercentile score to measure the intelligence level of the participant. This intelligencemetric comprises 60 questions divided into five groups, A, B, C, D and E, with 12questions in each group. The problem difficulty in the five groups increases graduallyand the internal problems within each group are also arranged sequentially by difficulty,from easy to difficult. The thought process required to complete the questions in eachgroup is different. In our experiments, 186 participants completed the test and we usethe percentile scores to indicate their intelligence levels.
Structural, Appearance and Fingerprint Features
To explore whether the self-reported personality traits and measured intelligence can beevaluated based on facial characteristics, we first extracted the discriminativeinformation contained in the facial images (the photographs taken) of the participantsin our experiments. In previous studies, various methods were employed to study thedifferences and commonalities among faces, including the pixel values, 3-D dimensionalscans of faces, annotations of facial landmarks, and so on. In the experiments of [7, 8],the authors employed structural and appearance features of the face, respectively. Inour work, we extract the facial characteristics of the samples similarly to [7, 8]. In thefollowing subsections, the extraction of structural, appearance and fingerprint feature isreported.
Structural Feature
To construct the structural feature of the face image, the salient facial points must firstbe detected. Many good facial point detectors have been described in theliterature [9, 23–25]; we used the LBF proposed in [9] in this work. Fig. 2 shows an
5/27
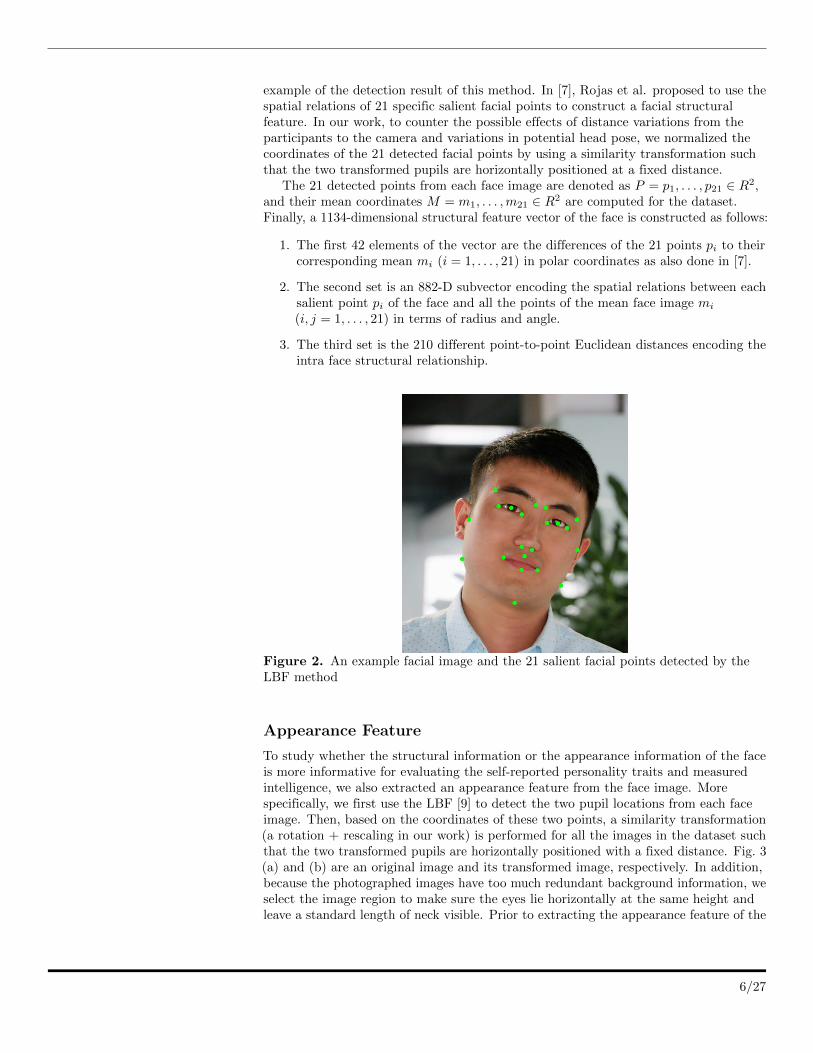
example of the detection result of this method. In [7], Rojas et al. proposed to use thespatial relations of 21 specific salient facial points to construct a facial structuralfeature. In our work, to counter the possible effects of distance variations from theparticipants to the camera and variations in potential head pose, we normalized thecoordinates of the 21 detected facial points by using a similarity transformation suchthat the two transformed pupils are horizontally positioned at a fixed distance.
The 21 detected points from each face image are denoted as P = p1, . . . , p21 ∈ R2,and their mean coordinates M = m1, . . . ,m21 ∈ R2 are computed for the dataset.Finally, a 1134-dimensional structural feature vector of the face is constructed as follows:
1. The first 42 elements of the vector are the differences of the 21 points pi to theircorresponding mean mi (i = 1, . . . , 21) in polar coordinates as also done in [7].
2. The second set is an 882-D subvector encoding the spatial relations between eachsalient point pi of the face and all the points of the mean face image mi
(i, j = 1, . . . , 21) in terms of radius and angle.
3. The third set is the 210 different point-to-point Euclidean distances encoding theintra face structural relationship.
Figure 2. An example facial image and the 21 salient facial points detected by theLBF method
Appearance Feature
To study whether the structural information or the appearance information of the faceis more informative for evaluating the self-reported personality traits and measuredintelligence, we also extracted an appearance feature from the face image. Morespecifically, we first use the LBF [9] to detect the two pupil locations from each faceimage. Then, based on the coordinates of these two points, a similarity transformation(a rotation + rescaling in our work) is performed for all the images in the dataset suchthat the two transformed pupils are horizontally positioned with a fixed distance. Fig. 3(a) and (b) are an original image and its transformed image, respectively. In addition,because the photographed images have too much redundant background information, weselect the image region to make sure the eyes lie horizontally at the same height andleave a standard length of neck visible. Prior to extracting the appearance feature of the
6/27

facial images, the structural variations need to be standardized. In this work, thelocations of the 21 salient points for each face were warped to their corresponding meanvalues to remove the shape variations.
In facial analysis, researchers usually crop the image to remove irrelevantinformation such as the background, hair and clothing. In this work, the sample imagesare also cropped using the following steps (see Fig. 4). First, the two pupils areconnected by a line segment AB, then a downwardly perpendicular segment MC isdrawn where MC=1/2 AB and M is the midpoint of AB. Finally, the cropped region isa square with each side = 2AB and centered at C. Fig. 3 (c) shows an example of acropped image. In addition, to further reduce the background influence, we manuallysegmented the facial images based on the contour of the face with Adobe Photoshop.Fig. 3 (d) shows an example of a manually segmented image.
(a) (b) (c) (d)
Figure 3. Results at different preprocessing stages: (a) the original image, (b) theimage after the similarity transformation, (c) the cropped image, and (d) the manuallysegmented image
Figure 4. An illustration of the cropping proceduce for an image
In the study of facial recognition, a face image pyramid is usually built to extractsuitable appearance features such as LBP [26], SIFT [27,28], and Gist [29,30]. In thiswork, we extract not only global information but also local details from the face imagesat different scales. In addition, because we had few samples and dimensionalityreduction of high dimensional representations usually can achieve better performancethan a direct low-dimensional representation [31], we also built an image pyramid foreach facial image before extracting its appearance feature in this work. The scaleparameter we used in our experiments is 1.5. Fig. 5 shows an example of the face imagepyramid.
In previous studies of facial recognition and face verification [31], the features thatare both discriminative for inter-person differentiation and invariant to intra-personvariations are always employed. Recently, some handcrafted features have been designedand achieved good performance. In this work, we use five different descriptors to
7/27

Figure 5. An example face image pyramid
represent facial information. Four are local descriptors (HOG [10], LBP [11], Gabor [12],and SIFT [14]), and one is a global descriptor (Gist [13]). For the Gabor and Gistdescriptors, we used the implementation from the authors’ home page; for the HOG,LBP and SIFT, we used an implementation of the open source library VLFeat [32].When extracting the SIFT feature, we sorted all SIFT descriptors according to theirscale values such that different images use the same number of descriptors to constructa fixed-length feature vector. Our final appearance feature is a concatenation of theresults of the above five descriptors.
Fingerprint Feature
Minutia-based fingerprint representation is widely used in fingerprint image matching.In this work, we also used a minutia-based representation for our fingerprint images.For each image, we selected 16 minutiae (determined by the number of minutiae) andused their locations and orientations to construct the fingerprint feature vector. Fig. 6shows three sample fingerprint images with detected minutiae.
Figure 6. The fingerprint images and their detected minutiae and orientation
Experiments and Results
In this section, we performed our experiments using the constructed dataset and discussthe results. As described in the preceding sections, we obtained the followinginformation:
1. The structural feature of the facial image for each sample
2. The appearance feature of the face image for each sample
3. The minutia-based feature of the fingerprint image for each sample
4. The discrete scores of 20 self-reported personality traits for each sample
5. The measured intelligence score for each sample.
8/27

To investigate whether the self-reported personality traits and measured intelligencecan be evaluated from the facial features and the fingerprint feature, we conductedclassification and regression experiments, respectively. Considering that there are largedifferences in facial composition between men and women, we performed theexperiments for men and women separately.
The Classification Experiments
In our classification experiments, because the score on each personality trait measuredby the 16PF is a discrete figure ranging from 1 to 10, we first binarized the personalitytraits by setting the highest 5 as the “have trait” class and the lowest 5 as the “do nothave trait” class. Similarly, for the measured intelligence, we set the percentile scoresless than or equal to 75% to one category and the scores greater than 75% to anothercategory to balance the number of the samples in the two categories.
In this work, we use a bank of classifiers to study whether the self-reportedpersonality traits and the measured intelligence can be predicted from the facialfeatures accurately. Five widely used discriminative classification methods are selectedto perform the experiments. They are Parzen Window [33], Decision Tree [34],K-Nearest Neighbor (KNN) [34], Naive Bayes [35] and Random Forest [36]. For KNN, kis set to 5 following the suggestion in [8]. The implementations used for theseclassification methods are off-the-shelf routines from PRTools [37].
Because our samples are not large, for each classifier used in our work, the accuracyis estimated with an N-fold cross-validation scheme and the training is repeated thirtytimes to obtain reliable standard deviations. We randomly divided the dataset into 10non-overlapped subsets. Nine subsets were used for training while the remaining subsetwas used for testing. In our work, we used several criteria to evaluate the performanceof each classification method. In addition to the classification accuracy, the confidenceinterval for a 95% confidence level is also computed to attest the reliability of theseresults, as follows:
I = 1.96 · σ/√N (1)
where σ is the standard deviation of the results, and N is the number of repetitionsusing the cross validation framework.
As described above, we extracted two types of facial features from the face image. Inthe subsequent subsections, these features are used to train the classification models topredict the class labels of the personality traits and the measured intelligence,respectively.
A Discussion of the Structural Feature Our structural feature has 1134dimensions which is far more than the number of acquired samples; therefore, PCA wasused to reduce the feature dimensionality. For any dimensionality reduction methods,choosing a suitable way to reduce the dimensions is a crucial issue. In our experiments,the dimensions of the original features are reduced to 5, 10, 15, 20, 25, 30, 35, 40 and 50gradually, then the features of these different dimensions are used to train the fiveclassifiers, respectively, to empirically determine the most appropriate featuredimensions.
As shown in Fig. 7, the classification accuracy on the personality traits varies withrespect to the reduced feature dimension. However, a clear variation trend does notexist for a specific classification method across all the personality traits. To select thedimension with the best performance for all the personality traits for a givenclassification method, we designed a dimension selection strategy as shown inAlgorithm 1. For measured intelligence, because the problem is rather simple, we simply
9/27

choose the dimension with the highest accuracy for a given classification method. Notethat we also conduct experiments for both genders separately.
Our feature dimension selection procedure for a given classification method is shownin Algorithm 1:
Algorithm 1 Feature dimension selection procedure
Require: For a given classification method:1: Compute the classification accuracy for all the personality traits under different
dimensions, denoted as:
mji (i = 1, . . . , 20; j = 5, 10, 15, 20, 25, 30, 35, 40, 50) (2)
where i is the index of personality traits, and j is the reduced dimension index ofthe feature vector.
2: Find the maximal value of {mji} for each personality trait as follows:
Mi = maxj=5,10,...,50
mji (i = 1, . . . , 20) (3)
3: Normalize mji by Mi:
mji =
mji
Mi(4)
4: Sum the normalized accuracy mji of all the 20 personality traits with respect to a
specific dimension:
Nj =
20∑i=1
mij (5)
5: Find the maximum among {Nj} whose corresponding dimension is the optimal one.
With the structural feature under the determined optimal dimension, we measuredthe classification accuracy of each classification method. Table 1 and Table 2 show theperformance for all the five classification rules with respect to all the personality traitsand intelligence (the optimal feature dimension of the five methods is shown in Table 4).To attest to the reliability of these results, the confidence interval is computed andshown in parenthesis. Note that the accuracy values for “Rule-consciousness” and“Vigilance” are well beyond chance levels for all the classification methods for bothgenders. In contrast, except for a few personality traits such as “Stability”, “Liveliness”and “Introversion/Extroversion”, other traits show near-chance predictability levels. Infact, the accuracy of some classification methods for these traits is below 50%. Theabove results suggest that the personality traits “Rule-consciousness” and “Vigilance”are more related to facial morphological characteristics and that this relevance can alsobe recognized more accurately.
Note that the prediction accuracies for most of the personality traits for women areclearly higher than for men. However, the accuracies for the traits “Privateness” and“Apprehension” for women are lower than those for men. Thus, these two traits may bemore related to men’s facial features. These results suggest that due to the largedifferences in facial composition between men and women, some personality traits canbe predicted from men’s facial images more accurately while other traits can bepredicted from women’s facial images more accurately.
As for the measured intelligence, the results in Table 2 show that, for men, all fiveclassification methods achieve only near-chance prediction levels while, for women, themethods achieve only slightly higher than chance levels. This suggests that the
10/27

The dimensionality of the feature vector0 10 20 30 40 50 60
30
40
50
60
70
80
90
ParzenTreeKNNNaivebRandomforest
Rule-consciousness
The dimensionality of the feature vector0 10 20 30 40 50 60
30
40
50
60
70
80
90
ParzenTreeKNNNaivebRandomforest
Liveliness
Figure 7. The classification accuracy of “Rule-consciousness” and “Liveliness” underdifferent feature dimensions
Table 1. Mean accuracy and the confidence interval (in parentheses) of the five classification rules for the20 traits with respect to males and females.
Male-Structural featureTrait Warm Reas Stab Domin Live Cons Soci Sens Vigil Abst
Parzen 52.87(2.6) 55.18(1.5) 65.79(2.2) 55.61(1.4) 67.43(2.1) 81.56(1.7) 56.61(1.2) 39.18(1.8) 72.64(2.3) 63.36(1.1)DTree 48.60(3.5) 53.68(4.5) 60.69(2.6) 54.01(2.3) 56.08(2.2) 71.14(2.4) 44.78(3.0) 53.33(2.7) 59.17(2.3) 49.90(2.6)KNN 58.40(1.5) 49.94(3.2) 60.49(2.0) 50.83(2.3) 65.74(1.1) 80.13(1.6) 53.75(1.8) 38.63(2.6) 69.57(0.7) 62.04(0.7)NaiveB 43.35(2.5) 52.78(2.3) 64.75(1.8) 54.88(4.0) 69.85(1.5) 77.04(1.1) 46.28(1.0) 42.36(2.3) 68.57(1.5) 52.89(1.9)RF 52.50(2.4) 54.10(2.1) 64.79(2.3) 54.31(3.0) 63.81(1.7) 81.54(1.8) 48.28(2.5) 47.06(2.1) 72.00(1.9) 57.75(2.1)
Trait Priv Appr Open Reli Perf Tens Adap Intro Impet CowaParzen 66.93(1.4) 65.47(1.2) 39.60(3.1) 53.36(1.7) 56.90(1.6) 63.65(1.3) 59.53(2.0) 67.36(1.1) 55.21(1.3) 52.90(1.3)DTree 56.68(2.3) 51.99(2.6) 49.64(2.2) 50.82(2.0) 56.32(2.2) 52.21(2.4) 56.31(2.1) 55.61(1.1) 55.13(2.2) 51.58(2.3)KNN 66.50(1.8) 61.42(1.3) 46.44(2.0) 52.14(2.3) 51.47(2.6) 58.93(1.9) 53.88(2.1) 60.69(1.2) 57.92(1.7) 48.60(2.7)NaiveB 54.94(2.4) 62.62(2.5) 50.74(2.8) 48.76(1.7) 53.76(2.6) 49.92(2.3) 52.50(1.1) 59.17(1.7) 49.89(2.1) 47.36(2.3)RF 64.18(1.6) 65.78(2.1) 56.68(2.5) 52.07(2.1) 53.17(2.4) 57.47(2.1) 51.71(1.8) 62.47(1.5) 51.99(2.5) 51.89(2.1)
Female-Structural featureTrait Warm Reas Stab Domin Live Cons Soci Sens Vigil Abst
Parzen 54.22(1.3) 51.78(2.6) 70.00(2.3) 70.67(1.1) 76.67(1.3) 82.22(2.1) 44.11(1.6) 56.89(1.1) 82.22(1.5) 69.22(1.3)DTree 49.67(2.1) 53.89(2.9) 59.33(3.3) 56.67(2.9) 65.33(1.5) 67.44(3.0) 45.56(2.6) 52.11(2.9) 69.78(2.2) 55.89(2.8)KNN 49.78(3.0) 48.78(4.0) 68.00(2.7) 67.78(1.7) 75.33(1.3) 81.44(1.3) 61.11(1.8) 53.67(2.3) 80.78(1.3) 67.44(1.4)NaiveB 55.33(2.7) 60.89(1.9) 62.22(2.0) 73.67(1.6) 69.56(1.7) 77.22(1.7) 48.33(2.1) 49.22(1.5) 69.89(1.2) 64.00(1.5)RF 55.89(1.7) 54.33(2.1) 67.89(1.6) 70.56(2.5) 74.11(1.4) 82.22(2.3) 49.67(2.3) 57.22(2.1) 81.56(1.6) 65.89(2.1)
Trait Priv Appr Open Reli Perf Tens Adap Intro Impet CowaParzen 54.11(1.4) 53.78(2.4) 60.11(1.7) 60.56(1.2) 58.11(1.0) 54.44(1.3) 66.56(1.5) 65.44(1.3) 75.56(2.2) 71.11(1.8)DTree 46.11(2.4) 52.11(1.7) 50.22(2.8) 46.22(1.8) 53.00(2.9) 56.11(2.2) 58.11(2.1) 51.33(1.8) 63.44(3.6) 60.11(3.0)KNN 50.00(2.0) 53.33(1.5) 57.89(2.0) 57.11(1.6) 54.56(2.3) 49.11(2.3) 64.78(2.7) 63.89(1.2) 73.67(2.6) 70.00(2.7)NaiveB 47.67(2.4) 58.22(1.6) 59.22(1.7) 52.78(1.7) 54.11(3.0) 52.44(2.7) 62.56(2.1) 57.78(1.5) 66.22(1.5) 66.33(2.4)RF 50.67(2.1) 57.22(2.3) 55.22(1.9) 58.00(1.5) 60.22(2.3) 54.11(2.1) 56.11(2.4) 64.89(1.7) 49.44(2.3) 47.11(2.5)
structural feature is not well suited for classifying measured intelligence.There are some facts and research findings that can help interpret the above results.
In the psychological field, researchers have performed numerous comparativeexperiments among large numbers of twins and found that approximately 50% of ahuman’s personality traits are affected by genetics. Some personality traits dependlargely on genetic qualities and can be little influenced by practice or life experiences,while some other personality traits mainly depend on the social environment. At thesame time, biological studies demonstrate that humans’ facial characteristics are to a
11/27
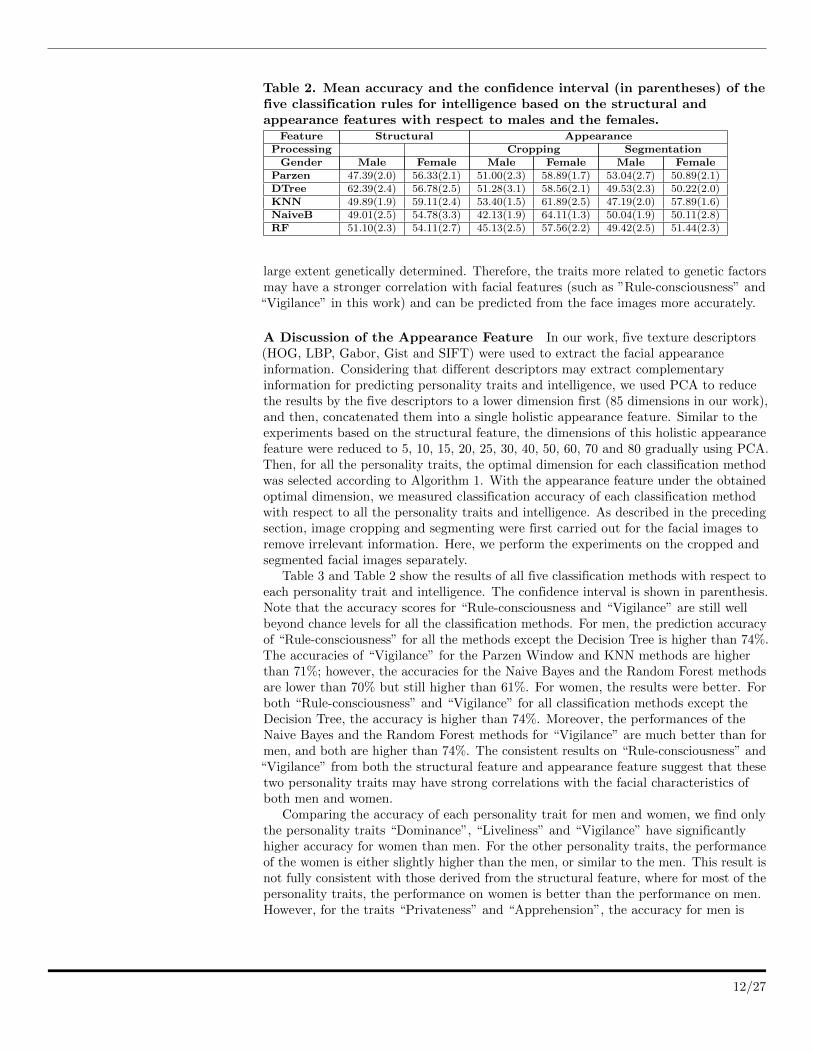
Table 2. Mean accuracy and the confidence interval (in parentheses) of thefive classification rules for intelligence based on the structural andappearance features with respect to males and the females.
Feature Structural AppearanceProcessing Cropping SegmentationGender Male Female Male Female Male Female
Parzen 47.39(2.0) 56.33(2.1) 51.00(2.3) 58.89(1.7) 53.04(2.7) 50.89(2.1)DTree 62.39(2.4) 56.78(2.5) 51.28(3.1) 58.56(2.1) 49.53(2.3) 50.22(2.0)KNN 49.89(1.9) 59.11(2.4) 53.40(1.5) 61.89(2.5) 47.19(2.0) 57.89(1.6)NaiveB 49.01(2.5) 54.78(3.3) 42.13(1.9) 64.11(1.3) 50.04(1.9) 50.11(2.8)RF 51.10(2.3) 54.11(2.7) 45.13(2.5) 57.56(2.2) 49.42(2.5) 51.44(2.3)
large extent genetically determined. Therefore, the traits more related to genetic factorsmay have a stronger correlation with facial features (such as ”Rule-consciousness” and“Vigilance” in this work) and can be predicted from the face images more accurately.
A Discussion of the Appearance Feature In our work, five texture descriptors(HOG, LBP, Gabor, Gist and SIFT) were used to extract the facial appearanceinformation. Considering that different descriptors may extract complementaryinformation for predicting personality traits and intelligence, we used PCA to reducethe results by the five descriptors to a lower dimension first (85 dimensions in our work),and then, concatenated them into a single holistic appearance feature. Similar to theexperiments based on the structural feature, the dimensions of this holistic appearancefeature were reduced to 5, 10, 15, 20, 25, 30, 40, 50, 60, 70 and 80 gradually using PCA.Then, for all the personality traits, the optimal dimension for each classification methodwas selected according to Algorithm 1. With the appearance feature under the obtainedoptimal dimension, we measured classification accuracy of each classification methodwith respect to all the personality traits and intelligence. As described in the precedingsection, image cropping and segmenting were first carried out for the facial images toremove irrelevant information. Here, we perform the experiments on the cropped andsegmented facial images separately.
Table 3 and Table 2 show the results of all five classification methods with respect toeach personality trait and intelligence. The confidence interval is shown in parenthesis.Note that the accuracy scores for “Rule-consciousness and “Vigilance” are still wellbeyond chance levels for all the classification methods. For men, the prediction accuracyof “Rule-consciousness” for all the methods except the Decision Tree is higher than 74%.The accuracies of “Vigilance” for the Parzen Window and KNN methods are higherthan 71%; however, the accuracies for the Naive Bayes and the Random Forest methodsare lower than 70% but still higher than 61%. For women, the results were better. Forboth “Rule-consciousness” and “Vigilance” for all classification methods except theDecision Tree, the accuracy is higher than 74%. Moreover, the performances of theNaive Bayes and the Random Forest methods for “Vigilance” are much better than formen, and both are higher than 74%. The consistent results on “Rule-consciousness” and“Vigilance” from both the structural feature and appearance feature suggest that thesetwo personality traits may have strong correlations with the facial characteristics ofboth men and women.
Comparing the accuracy of each personality trait for men and women, we find onlythe personality traits “Dominance”, “Liveliness” and “Vigilance” have significantlyhigher accuracy for women than men. For the other personality traits, the performanceof the women is either slightly higher than the men, or similar to the men. This result isnot fully consistent with those derived from the structural feature, where for most of thepersonality traits, the performance on women is better than the performance on men.However, for the traits “Privateness” and “Apprehension”, the accuracy for men is
12/27
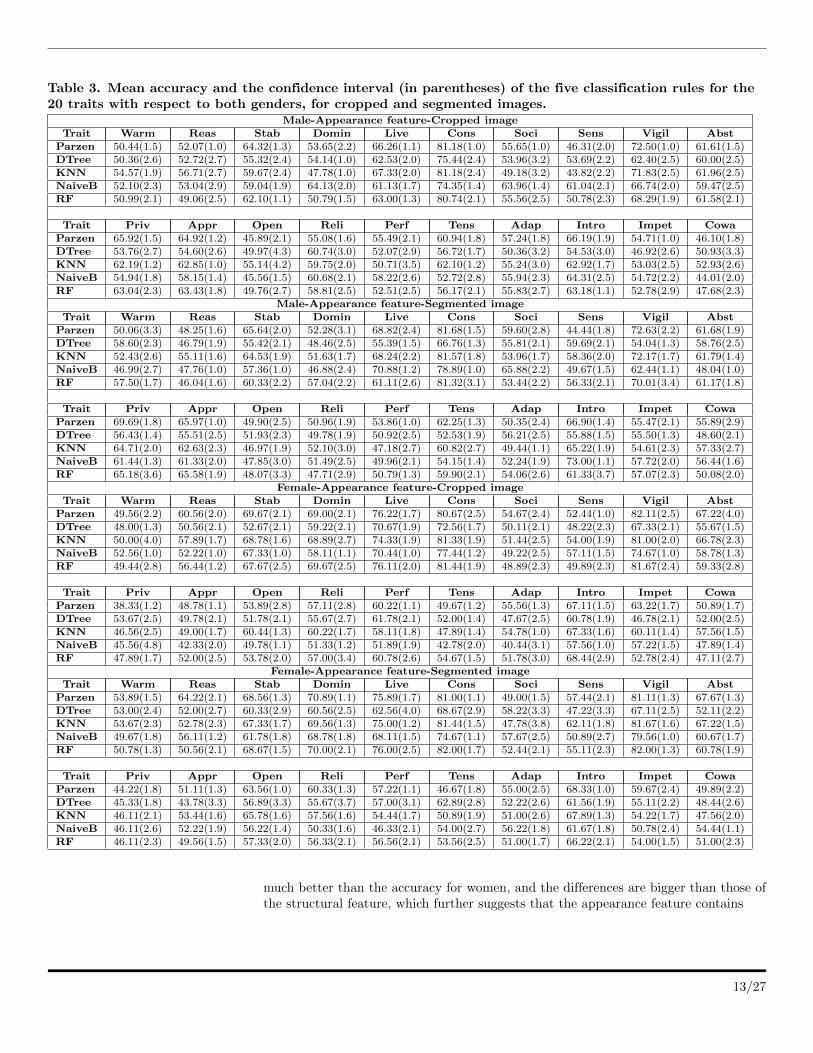
Table 3. Mean accuracy and the confidence interval (in parentheses) of the five classification rules for the20 traits with respect to both genders, for cropped and segmented images.
Male-Appearance feature-Cropped imageTrait Warm Reas Stab Domin Live Cons Soci Sens Vigil Abst
Parzen 50.44(1.5) 52.07(1.0) 64.32(1.3) 53.65(2.2) 66.26(1.1) 81.18(1.0) 55.65(1.0) 46.31(2.0) 72.50(1.0) 61.61(1.5)DTree 50.36(2.6) 52.72(2.7) 55.32(2.4) 54.14(1.0) 62.53(2.0) 75.44(2.4) 53.96(3.2) 53.69(2.2) 62.40(2.5) 60.00(2.5)KNN 54.57(1.9) 56.71(2.7) 59.67(2.4) 47.78(1.0) 67.33(2.0) 81.18(2.4) 49.18(3.2) 43.82(2.2) 71.83(2.5) 61.96(2.5)NaiveB 52.10(2.3) 53.04(2.9) 59.04(1.9) 64.13(2.0) 61.13(1.7) 74.35(1.4) 63.96(1.4) 61.04(2.1) 66.74(2.0) 59.47(2.5)RF 50.99(2.1) 49.06(2.5) 62.10(1.1) 50.79(1.5) 63.00(1.3) 80.74(2.1) 55.56(2.5) 50.78(2.3) 68.29(1.9) 61.58(2.1)
Trait Priv Appr Open Reli Perf Tens Adap Intro Impet CowaParzen 65.92(1.5) 64.92(1.2) 45.89(2.1) 55.08(1.6) 55.49(2.1) 60.94(1.8) 57.24(1.8) 66.19(1.9) 54.71(1.0) 46.10(1.8)DTree 53.76(2.7) 54.60(2.6) 49.97(4.3) 60.74(3.0) 52.07(2.9) 56.72(1.7) 50.36(3.2) 54.53(3.0) 46.92(2.6) 50.93(3.3)KNN 62.19(1.2) 62.85(1.0) 55.14(4.2) 59.75(2.0) 50.71(3.5) 62.10(1.2) 55.24(3.0) 62.92(1.7) 53.03(2.5) 52.93(2.6)NaiveB 54.94(1.8) 58.15(1.4) 45.56(1.5) 60.68(2.1) 58.22(2.6) 52.72(2.8) 55.94(2.3) 64.31(2.5) 54.72(2.2) 44.01(2.0)RF 63.04(2.3) 63.43(1.8) 49.76(2.7) 58.81(2.5) 52.51(2.5) 56.17(2.1) 55.83(2.7) 63.18(1.1) 52.78(2.9) 47.68(2.3)
Male-Appearance feature-Segmented imageTrait Warm Reas Stab Domin Live Cons Soci Sens Vigil Abst
Parzen 50.06(3.3) 48.25(1.6) 65.64(2.0) 52.28(3.1) 68.82(2.4) 81.68(1.5) 59.60(2.8) 44.44(1.8) 72.63(2.2) 61.68(1.9)DTree 58.60(2.3) 46.79(1.9) 55.42(2.1) 48.46(2.5) 55.39(1.5) 66.76(1.3) 55.81(2.1) 59.69(2.1) 54.04(1.3) 58.76(2.5)KNN 52.43(2.6) 55.11(1.6) 64.53(1.9) 51.63(1.7) 68.24(2.2) 81.57(1.8) 53.96(1.7) 58.36(2.0) 72.17(1.7) 61.79(1.4)NaiveB 46.99(2.7) 47.76(1.0) 57.36(1.0) 46.88(2.4) 70.88(1.2) 78.89(1.0) 65.88(2.2) 49.67(1.5) 62.44(1.1) 48.04(1.0)RF 57.50(1.7) 46.04(1.6) 60.33(2.2) 57.04(2.2) 61.11(2.6) 81.32(3.1) 53.44(2.2) 56.33(2.1) 70.01(3.4) 61.17(1.8)
Trait Priv Appr Open Reli Perf Tens Adap Intro Impet CowaParzen 69.69(1.8) 65.97(1.0) 49.90(2.5) 50.96(1.9) 53.86(1.0) 62.25(1.3) 50.35(2.4) 66.90(1.4) 55.47(2.1) 55.89(2.9)DTree 56.43(1.4) 55.51(2.5) 51.93(2.3) 49.78(1.9) 50.92(2.5) 52.53(1.9) 56.21(2.5) 55.88(1.5) 55.50(1.3) 48.60(2.1)KNN 64.71(2.0) 62.63(2.3) 46.97(1.9) 52.10(3.0) 47.18(2.7) 60.82(2.7) 49.44(1.1) 65.22(1.9) 54.61(2.3) 57.33(2.7)NaiveB 61.44(1.3) 61.33(2.0) 47.85(3.0) 51.49(2.5) 49.96(2.1) 54.15(1.4) 52.24(1.9) 73.00(1.1) 57.72(2.0) 56.44(1.6)RF 65.18(3.6) 65.58(1.9) 48.07(3.3) 47.71(2.9) 50.79(1.3) 59.90(2.1) 54.06(2.6) 61.33(3.7) 57.07(2.3) 50.08(2.0)
Female-Appearance feature-Cropped imageTrait Warm Reas Stab Domin Live Cons Soci Sens Vigil Abst
Parzen 49.56(2.2) 60.56(2.0) 69.67(2.1) 69.00(2.1) 76.22(1.7) 80.67(2.5) 54.67(2.4) 52.44(1.0) 82.11(2.5) 67.22(4.0)DTree 48.00(1.3) 50.56(2.1) 52.67(2.1) 59.22(2.1) 70.67(1.9) 72.56(1.7) 50.11(2.1) 48.22(2.3) 67.33(2.1) 55.67(1.5)KNN 50.00(4.0) 57.89(1.7) 68.78(1.6) 68.89(2.7) 74.33(1.9) 81.33(1.9) 51.44(2.5) 54.00(1.9) 81.00(2.0) 66.78(2.3)NaiveB 52.56(1.0) 52.22(1.0) 67.33(1.0) 58.11(1.1) 70.44(1.0) 77.44(1.2) 49.22(2.5) 57.11(1.5) 74.67(1.0) 58.78(1.3)RF 49.44(2.8) 56.44(1.2) 67.67(2.5) 69.67(2.5) 76.11(2.0) 81.44(1.9) 48.89(2.3) 49.89(2.3) 81.67(2.4) 59.33(2.8)
Trait Priv Appr Open Reli Perf Tens Adap Intro Impet CowaParzen 38.33(1.2) 48.78(1.1) 53.89(2.8) 57.11(2.8) 60.22(1.1) 49.67(1.2) 55.56(1.3) 67.11(1.5) 63.22(1.7) 50.89(1.7)DTree 53.67(2.5) 49.78(2.1) 51.78(2.1) 55.67(2.7) 61.78(2.1) 52.00(1.4) 47.67(2.5) 60.78(1.9) 46.78(2.1) 52.00(2.5)KNN 46.56(2.5) 49.00(1.7) 60.44(1.3) 60.22(1.7) 58.11(1.8) 47.89(1.4) 54.78(1.0) 67.33(1.6) 60.11(1.4) 57.56(1.5)NaiveB 45.56(4.8) 42.33(2.0) 49.78(1.1) 51.33(1.2) 51.89(1.9) 42.78(2.0) 40.44(3.1) 57.56(1.0) 57.22(1.5) 47.89(1.4)RF 47.89(1.7) 52.00(2.5) 53.78(2.0) 57.00(3.4) 60.78(2.6) 54.67(1.5) 51.78(3.0) 68.44(2.9) 52.78(2.4) 47.11(2.7)
Female-Appearance feature-Segmented imageTrait Warm Reas Stab Domin Live Cons Soci Sens Vigil Abst
Parzen 53.89(1.5) 64.22(2.1) 68.56(1.3) 70.89(1.1) 75.89(1.7) 81.00(1.1) 49.00(1.5) 57.44(2.1) 81.11(1.3) 67.67(1.3)DTree 53.00(2.4) 52.00(2.7) 60.33(2.9) 60.56(2.5) 62.56(4.0) 68.67(2.9) 58.22(3.3) 47.22(3.3) 67.11(2.5) 52.11(2.2)KNN 53.67(2.3) 52.78(2.3) 67.33(1.7) 69.56(1.3) 75.00(1.2) 81.44(1.5) 47.78(3.8) 62.11(1.8) 81.67(1.6) 67.22(1.5)NaiveB 49.67(1.8) 56.11(1.2) 61.78(1.8) 68.78(1.8) 68.11(1.5) 74.67(1.1) 57.67(2.5) 50.89(2.7) 79.56(1.0) 60.67(1.7)RF 50.78(1.3) 50.56(2.1) 68.67(1.5) 70.00(2.1) 76.00(2.5) 82.00(1.7) 52.44(2.1) 55.11(2.3) 82.00(1.3) 60.78(1.9)
Trait Priv Appr Open Reli Perf Tens Adap Intro Impet CowaParzen 44.22(1.8) 51.11(1.3) 63.56(1.0) 60.33(1.3) 57.22(1.1) 46.67(1.8) 55.00(2.5) 68.33(1.0) 59.67(2.4) 49.89(2.2)DTree 45.33(1.8) 43.78(3.3) 56.89(3.3) 55.67(3.7) 57.00(3.1) 62.89(2.8) 52.22(2.6) 61.56(1.9) 55.11(2.2) 48.44(2.6)KNN 46.11(2.1) 53.44(1.6) 65.78(1.6) 57.56(1.6) 54.44(1.7) 50.89(1.9) 51.00(2.6) 67.89(1.3) 54.22(1.7) 47.56(2.0)NaiveB 46.11(2.6) 52.22(1.9) 56.22(1.4) 50.33(1.6) 46.33(2.1) 54.00(2.7) 56.22(1.8) 61.67(1.8) 50.78(2.4) 54.44(1.1)RF 46.11(2.3) 49.56(1.5) 57.33(2.0) 56.33(2.1) 56.56(2.1) 53.56(2.5) 51.00(1.7) 66.22(2.1) 54.00(1.5) 51.00(2.3)
much better than the accuracy for women, and the differences are bigger than those ofthe structural feature, which further suggests that the appearance feature contains
13/27
richer information in predicting these two traits for men.For measured intelligence, for both men and women, the classification accuracy is
only slightly beyond the level of chance, and for some classification rules, the results areeven below 50% for men. Again, we find the accuracy for women is better than theaccuracy for men. This difference is particularly evident for the cropped images.Considering the near-chance level predictions on measured intelligence from thestructural and appearance features, we can conclude that predicting measuredintelligence from facial features is difficult, if not impossible, even though the predictionaccuracy for women is slightly better than for men.
Comparing the classification results of the structural and appearance features, wefind the appearance feature generally performs slightly better than the structuralfeature. This suggests that there is a stronger correlation between the appearancefeature and the personality traits, which is consistent with the conclusion in [8]. Toextract the discriminative facial appearance feature, we cropped and segmented the faceimage, respectively. Then, we obtained the classification accuracy of the appearancefeature on each personality trait for these two types of images. The results in Table 3show that the segmentation process is more suitable for this classification problem thanthe cropping process.Remark 1 : We also used the detection results from each of the five texture detectorsas the appearance feature to conduct the classifications respectively, and theclassification results of the five different features with respect to the personality traitsand intelligence are shown in S1 Fig and S2 Fig. The general conclusion is that theresults of these five different appearance features are similar to those of our holisticappearance feature reported in this section.
A Comparison between the Structural and the Appearance Features Here,we compare the performance of the structural and the appearance features for all thepersonality traits and for measured intelligence. For each of the two types of features,we select the classification method that obtained the best results for most of thepersonality traits for this feature according to Algorithm 2. Note that becausesegmentation processing achieves better results than the cropping procedure inconstructing the appearance feature, the best classification method for all thepersonality traits was chosen based on the segmented images.
The best classification method selection procedure for all the personality traits isshown in Algorithm 2:
Algorithm 2 Selecting the best classification method for all the personality traits.
Require: For a given feature type:1: Compare the accuracy of the five classification methods with respect to a specific
personality trait and mark the maximal one among them;2: For each classification method, count the number of personality traits with the
highest classification accuracy;3: The classification method with the maximum counted number is regarded as the
best classification method for the current feature.
In this work, given a feature type and a classification method, we can determine theoptimal dimension of this feature type for this method using Algorithm 1. Then, usingAlgorithm 2, we can choose the best method for a given feature type. Table 4 lists theclassification results for the men (the second column) and the women (the sixthcolumn), where the best method for a given feature type is marked by a checkmark(“√
”). For a given method and a given feature type, the optimal feature dimension isshown in the third and seventh column.
14/27

Table 4. The optimal dimension of the feature vector for the classification and regression methods with thebest prediction performance for the three types of features, respectively. The best method for each type offeature is marked by a checkmark (“
√”).
Gender Male FemaleFeaturetype
Classificationmethods
Featuredimension
Regressionmethods
Featuredimension
Classificationmethods
Featuredimension
Regressionmethods
Featuredimension
Parzen (√) 30 Linear 2 Parzen (
√) 30 Linear 2
DTree 30 Ridge 2 DTree 15 Ridge 2Structural KNN 20 Lasso 2 KNN 30 Lasso 2
NaiveB 5 Pinv 2 NavieB 30 Pinv 2RF 20 KNN 2 RF 20 KNN 10
SVM (√) 5 SVM (
√) 5
Parzen (√) 5 Linear 2 Parzen (
√) 15 Linear 2
DTree 20 Ridge 2 DTree 5 Ridge 2Appearance KNN 10 Lasso 20 KNN 10 Lasso (
√) 15
NaiveB 5 Pinv 2 NavieB 5 Pinv 2RF 20 KNN 30 RF 30 KNN 2
SVM (√) 5 SVM 20
Parzen (√) 5 Linear 2 Parzen (
√) 20 Linear 2
DTree 25 Ridge 2 DTree 5 Ridge 2Fingerprint KNN 2 Lasso 2 KNN 30 Lasso 2
NaiveB 2 Pinv 2 NavieB 2 Pinv 2RF 20 KNN 20 RF 20 KNN 20
SVM (√) 2 SVM (
√) 5
Fig. 8 shows the classification results of the above two types of features for all thepersonality traits and measured intelligence. The performance of these two types offeatures is generally similar. However, for traits such as “Adaptation/Anxiety”, theperformance of the structural feature is better, while for other traits such as“Openness”, the performance of the appearance feature is better. Therefore, these twotypes of features might contain complementary information for predicting thepersonality traits and intelligence. To test this, each type of feature was reduced to 400dimensions (mainly determined by the number of samples); then, the 2 reduced featureswere concatenated into a single new feature, which is itself dimensionally reduced andused for the classification. The classification results of the new feature are shown inFig. 8. Unfortunately, the classification results based on this fused feature are no betterthan those obtained by the individual features.Remark 2 : In all the above experiments, for a given feature type, we used Algorithm 1to select the optimal feature dimension for all the classification methods with respect toall the personality traits. It is understandable that for some personality traits, theselected dimension may not be the best one. Given a personality trait and feature type,different classification methods may have different optimal dimensions. S1 Table, S2Table and S3 Table are the classification results of personality traits by differentmethods under different corresponding optimal dimension (marked in parenthesis) for agiven feature type. Although some variations exist, the general conclusion of S1 Table,S2 Table and S3 Table are similar to Tables 1, 2, 3 and 4.
The Regression Experiments
In the regression experiments, because the score of each personality trait measured bythe 16PF is a discrete figure ranging from 1 to 10, and the score of the intelligencemeasured by the Raven’s SPM is a percentile value, we directly set these values as theregression targets.
We used six widely used regression methods to investigate whether the self-reported
15/27

Warm Reas Stab Domi Live Cons Soci Sens Vigi Absr Priv Appr Open Reli Perf Tens Adap Intr Impe Cowa IQ
The 20 personality traits0
20
40
60
80
100
Accuracy(%)
The classification results of the three features for the menStructural FeatureAppearance FeatureFused New Feature
Warm Reas Stab Domi Live Cons Soci Sens Vigi Absr Priv Appr Open Reli Perf Tens Adap Intr Impe Cowa IQ
The 20 personality traits0
20
40
60
80
100
Accuracy(%
)The classification results of the three features for the women
Structural FeatureAppearance FeatureFused New Feature
Figure 8. The classification results of the structural feature, the appearance featureand the fused new feature for all the personality traits and for measured intelligencewith respect to both genders. The confidence interval is marked by “I” at the top ofeach bar.
personality traits and measured intelligence can be evaluated from facial featuresaccurately: Linear Regression [38], Ridge Regression [39], Lasso Regression [40],Pseudo-Inverse Regression, K-Nearest Neighbor (KNN) Regression and Support VectorRegression [41]. In our experiments, we used the Radial Basis Function as the kernel ofthe SVM, and parameter k is set to 5 for the KNN regression following the suggestionin [8]. As for the other parameters of these approaches, they are set empirically bytesting many candidate values and choosing the best one for the final experiments. Theimplementations for these regression methods are off-the-shelf routines fromPRTools [37].
For the regression experiments, becasue our sample number is not large, theregression error is estimated with a 10-fold cross-validation scheme, and the training isrepeated thirty times to obtain reliable standard deviations. We adopted several criteriato evaluate the performance of each regression method, including the Root Mean SquareError (RMSE) in Eq. (6) and the Pearson Correlation Coefficient in Eq. (7).
RMSE =
√∑ni=1(Xi − Yi)2
n(6)
16/27
r =
∑ni=1(Xi − X)(Yi − Y )√∑n
i=1(Xi − X)2√∑n
i=1(Yi − Y )2(7)
where in both (6) and (7), Xi is the self-reported score, Yi is the predicted score, X andY are the mean scores of the samples, and n is the number of samples.
We also used the residual plots to measure the correlations between the predictedscores and the measured scores of the personality traits and intelligence. When thepoints representing the residual errors are located randomly around the zero line, itmeans the predicted scores and the self-reported scores have a significant linearcorrelation.
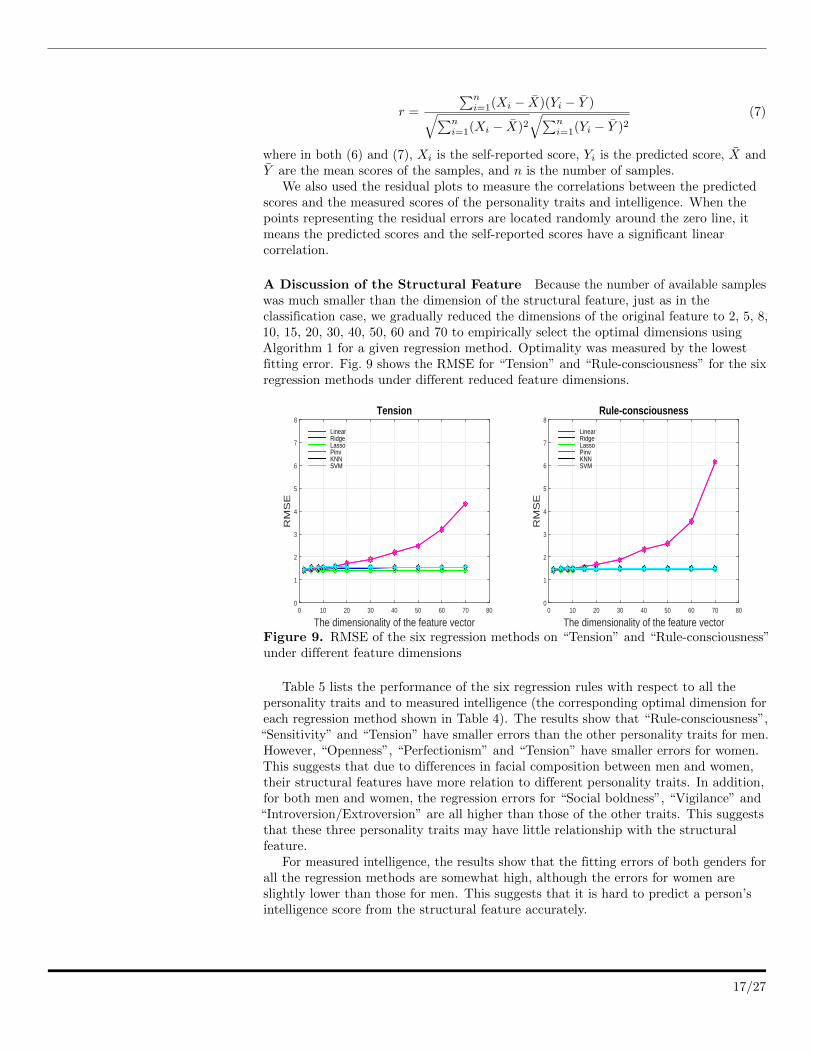
A Discussion of the Structural Feature Because the number of available sampleswas much smaller than the dimension of the structural feature, just as in theclassification case, we gradually reduced the dimensions of the original feature to 2, 5, 8,10, 15, 20, 30, 40, 50, 60 and 70 to empirically select the optimal dimensions usingAlgorithm 1 for a given regression method. Optimality was measured by the lowestfitting error. Fig. 9 shows the RMSE for “Tension” and “Rule-consciousness” for the sixregression methods under different reduced feature dimensions.
The dimensionality of the feature vector0 10 20 30 40 50 60 70 80
RM
SE
0
1
2
3
4
5
6
7
8
LinearRidgeLassoPinvKNNSVM
Tension
The dimensionality of the feature vector0 10 20 30 40 50 60 70 80
RM
SE
0
1
2
3
4
5
6
7
8
LinearRidgeLassoPinvKNNSVM
Rule-consciousness
Figure 9. RMSE of the six regression methods on “Tension” and “Rule-consciousness”under different feature dimensions
Table 5 lists the performance of the six regression rules with respect to all thepersonality traits and to measured intelligence (the corresponding optimal dimension foreach regression method shown in Table 4). The results show that “Rule-consciousness”,“Sensitivity” and “Tension” have smaller errors than the other personality traits for men.However, “Openness”, “Perfectionism” and “Tension” have smaller errors for women.This suggests that due to differences in facial composition between men and women,their structural features have more relation to different personality traits. In addition,for both men and women, the regression errors for “Social boldness”, “Vigilance” and“Introversion/Extroversion” are all higher than those of the other traits. This suggeststhat these three personality traits may have little relationship with the structuralfeature.
For measured intelligence, the results show that the fitting errors of both genders forall the regression methods are somewhat high, although the errors for women areslightly lower than those for men. This suggests that it is hard to predict a person’sintelligence score from the structural feature accurately.
17/27

Table 5. RMSE of the six regression rules for the 20 traits and intelligence with respect to males andfemales.
Male-Structural featureTrait Warm Reas Stab Domin Live Cons Soci Sens Vigil Abst IntellLinear 1.9683 1.5059 1.8419 1.5304 1.8368 1.4050 1.9373 1.4058 2.0528 1.6105 0.2116Ridge 1.9412 1.4919 1.8238 1.5236 1.8299 1.4083 1.9692 1.3845 2.0330 1.6055 0.2103Lasso 1.9411 1.4918 1.8236 1.5235 1.8297 1.4081 1.9690 1.3844 2.0327 1.6053 0.2103Pinv 1.9683 1.5059 1.8419 1.5304 1.8368 1.4050 1.9373 1.4058 2.0528 1.6105 0.2116KNN 2.1717 1.5705 2.0207 1.6627 1.8760 1.4532 1.9639 1.5255 2.0855 1.6625 0.2271SVM 1.9704 1.5077 1.8102 1.5107 1.8065 1.3932 1.9607 1.3824 2.0011 1.5873 0.2236
Trait Priv Appr Open Reli Perf Tens Adap Intro Impet CowaLinear 1.4441 1.7811 1.4294 1.6628 1.4033 1.4005 1.6576 2.0461 1.6096 1.6110Ridge 1.4286 1.7883 1.4150 1.6550 1.4409 1.3967 1.6811 2.0628 1.5846 1.5943Lasso 1.4285 1.7881 1.4148 1.6548 1.4408 1.3966 1.6809 2.0626 1.5845 1.5942Pinv 1.4441 1.7811 1.4294 1.6628 1.4033 1.4005 1.6576 2.0461 1.6096 1.6110KNN 1.5666 1.8167 1.5315 1.7662 1.5233 1.4593 1.6738 2.1074 1.7287 1.8137SVM 1.4197 1.7730 1.4023 1.6493 1.4385 1.3897 1.6626 2.0450 1.5948 1.5762
Female-Structural featureTrait Warm Reas Stab Domin Live Cons Soci Sens Vigil Abst IntellLinear 2.0534 1.5901 1.8515 1.6636 1.9460 1.5113 2.1618 1.6292 2.2623 1.6221 0.1854Ridge 2.0269 1.5726 1.8319 1.6502 1.9409 1.5052 2.1399 1.6120 2.2429 1.6130 0.1838Lasso 2.0263 1.5723 1.8314 1.6494 1.9402 1.5049 2.1391 1.6116 2.2423 1.6126 0.1837Pinv 2.0534 1.5901 1.8515 1.6636 1.9460 1.5113 2.1618 1.6292 2.2623 1.6221 0.1854KNN 2.2021 1.6723 1.8707 1.7566 2.0518 1.6512 2.2533 1.7938 2.4738 1.7497 0.1961SVM 2.0286 1.5685 1.8261 1.6380 1.9648 1.4934 2.1144 1.6046 2.2304 1.6232 0.2062
Trait Priv Appr Open Reli Perf Tens Adap Intro Impet CowaLinear 1.6611 1.9787 1.3263 1.5307 1.2845 1.4736 1.8542 2.2282 1.6534 1.5225Ridge 1.6687 1.9476 1.3260 1.5158 1.2817 1.4547 1.8356 2.2005 1.6352 1.5104Lasso 1.6683 1.9469 1.3257 1.5154 1.2814 1.4540 1.8350 2.1997 1.6347 1.5100Pinv 1.6611 1.9787 1.3263 1.5307 1.2845 1.4736 1.8542 2.2282 1.6534 1.5225KNN 1.8246 2.0567 1.4598 1.7150 1.3726 1.6486 1.9588 2.3796 1.7225 1.5613SVM 1.6550 1.9420 1.3232 1.5043 1.2977 1.4308 1.8350 2.1990 1.6248 1.4951
To observe the correlation between the self-reported scores and the predicted scoresof the personality traits and measured intelligence, we draw the residual plots for all theregression approaches. Because our sample number is small, we once again used thecross-validation and repeated-experiment strategies to alleviate the problem. Theresidual plots on different personality traits are generally similar. As an example,Fig. 10 shows the residual plots of “Intelligence” and “Tension” for both men andwomen, respectively.
Our general conclusion on these residual plots is that the linear correlations betweenthe measured scores and the predicted scores of the personality traits and intelligenceare not strong. More specifically, we find that for all the personality traits, thepredicted scores of most of the samples are concentrated in several median values. Thus,the regression errors of the median values are small while the errors at both ends arelarger. In our work, we also calculate the Pearson Correlation Coefficient between themeasured scores and the predicted scores of the personality traits and intelligence, butthe correlations are not strong either (r < 0.20, p < 0.01).
For some personality traits, humans do not favor a clear-cut choice in general. Forexample, people often remark that he or she is a bit sensitive or somewhat domineering.Besides as our samples are not large, and most scores for the personality traits are 4, 5and 6 (note that this result could stem from the bias that our samples are collegestudents), the regression models trained on our dataset are more suitable for theprediction of the median scores. Because the observational and reasoning ability ofundergraduates generally measure higher on intelligence tests (most of the intelligence
18/27

0.2 0.3 0.4 0.5 0.6 0.7 0.8 0.9 1.0−0.8−0.6−0.4−0.2
0.00.20.40.60.8
Res
idua
l Val
ue
Linear Regressionlinearr
0.2 0.3 0.4 0.5 0.6 0.7 0.8 0.9 1.0−0.8−0.6−0.4−0.2
0.00.20.40.60.8 Ridge Regression
Ridger
0.2 0.3 0.4 0.5 0.6 0.7 0.8 0.9 1.0−0.8−0.6−0.4−0.2
0.00.20.40.60.8 Lasso Regression
Lassor
0.2 0.3 0.4 0.5 0.6 0.7 0.8 0.9 1.0The score of the Intelligence
−0.8−0.6−0.4−0.2
0.00.20.40.60.8
Res
idua
l Val
ue
Pseudo-inv RegressionPinvr
0.2 0.3 0.4 0.5 0.6 0.7 0.8 0.9 1.0The score of the Intelligence
−0.8−0.6−0.4−0.2
0.00.20.40.60.8 KNN Regression
KNNr
0.2 0.3 0.4 0.5 0.6 0.7 0.8 0.9 1.0The score of the Intelligence
−0.8−0.6−0.4−0.2
0.00.20.40.60.8 SVM Regression
SVMr
(a)
0.2 0.3 0.4 0.5 0.6 0.7 0.8 0.9 1.0−0.8
−0.6
−0.4
−0.2
0.0
0.2
0.4
0.6
0.8
Resid
ual V
alue
Linear Regressionlinearr
0.2 0.3 0.4 0.5 0.6 0.7 0.8 0.9 1.0−0.8
−0.6
−0.4
−0.2
0.0
0.2
0.4
0.6
0.8 Ridge RegressionRidger
0.2 0.3 0.4 0.5 0.6 0.7 0.8 0.9 1.0−0.8
−0.6
−0.4
−0.2
0.0
0.2
0.4
0.6
0.8 Lasso RegressionLassor
0.2 0.3 0.4 0.5 0.6 0.7 0.8 0.9 1.0The score of the Intelligence
−0.8
−0.6
−0.4
−0.2
0.0
0.2
0.4
0.6
0.8
Resid
ual V
alue
Pseudo-inv RegressionPinvr
0.2 0.3 0.4 0.5 0.6 0.7 0.8 0.9 1.0The score of the Intelligence
−0.8
−0.6
−0.4
−0.2
0.0
0.2
0.4
0.6
0.8 KNN RegressionKNNr
0.2 0.3 0.4 0.5 0.6 0.7 0.8 0.9 1.0The score of the Intelligence
−0.8
−0.6
−0.4
−0.2
0.0
0.2
0.4
0.6
0.8 SVM RegressionSVMr
(b)
2 3 4 5 6 7 8 9 10
−4
−2
0
2
4
Res
idua
l Val
ue
Linear Regressionlinearr
2 3 4 5 6 7 8 9 10
−4
−2
0
2
4
Ridge RegressionRidger
2 3 4 5 6 7 8 9 10
−4
−2
0
2
4
Lasso RegressionLassor
2 3 4 5 6 7 8 9 10The score of the personality trait
−4
−2
0
2
4
Res
idua
l Val
ue
Pseudo-inv RegressionPinvr
2 3 4 5 6 7 8 9 10The score of the personality trait
−4
−2
0
2
4
KNN RegressionKNNr
2 3 4 5 6 7 8 9 10The score of the personality trait
−4
−2
0
2
4
SVM RegressionSVMr
(c)
2 3 4 5 6 7 8 9 10
−4
−2
0
2
4
Res
idua
l Val
ue
Linear Regressionlinearr
2 3 4 5 6 7 8 9 10
−4
−2
0
2
4
Ridge RegressionRidger
2 3 4 5 6 7 8 9 10
−4
−2
0
2
4
Lasso RegressionLassor
2 3 4 5 6 7 8 9 10The score of the personality trait
−4
−2
0
2
4
Res
idua
l Val
ue
Pseudo-inv RegressionPinvr
2 3 4 5 6 7 8 9 10The score of the personality trait
−4
−2
0
2
4
KNN RegressionKNNr
2 3 4 5 6 7 8 9 10The score of the personality trait
−4
−2
0
2
4
SVM RegressionSVMr
(d)
Figure 10. The residual plots for the six regresion methods. The images are as follows:(a) the results on “Intelligence” for men; (b) the results on “Intelligence” for women; (c)the results on “Tension” for men; (d) the results on “Tension” for women.
scores were located in the upper-value intervals), the residual plots also indicate thatthe prediction performance of the regression models is better for higher scores.
A Discussion of the Appearance Feature The experiment using the appearancefeature was similar to that for the structural feature. The dimensions of the appearancefeature were gradually reduced to 2, 5, 8, 10, 15, 20, 30, 40, 50, 60 and 70 using PCA toselect the optimal dimensionality for a given regression method by Algorithm 1. Then,we measured the regression error for each regression method. Here, we performed theexperiments on the cropped and segmented face images separately. Table 4 shows theobtained optimal dimension for each one of the six regression methods. Table 6 and 7show the results of the six regression methods with respect to each personality trait andintelligence. The conclusions are similar to those obtained for the structural feature.The results show that “Rule-consciousness”, “Sensitivity” and “Tension” have smallerfitting errors for men, while “Openness”, “Perfectionism” and “Tension” have smallerfitting errors for women, and the fitting errors of “Social boldness”, “Vigilance” and“Introversion/Extroversion” are all higher than the other personality traits for bothgenders.
In addition, it can be seen that the appearance feature performs similarly to thestructural feature for these six regression methods. This suggests that the structuralfeature and the appearance feature do not differ much in terms of regression forpredicting the personality traits and measured intelligence. For measured intelligencepredicted from the appearance feature, the regression error for women is slightly lowerthan that for men. By comparing the errors of the experiments for the cropped andsegmented face images, we find that segmentation can achieve a better prediction thancropping, which shows once again that image segmentation is more effective thancropping for removing irrelevant information.
For the segmented face images, we drew the residual plots for all the regression
19/27

Table 6. RMSE of the six regression rules for the 20 traits and intelligence with respect to men with forboth cropped and segmented images.
Male-Appearance feature-Cropped imageTrait Warm Reas Stab Domin Live Cons Soci Sens Vigil Abst IntellLinear 1.9720 1.4870 1.8338 1.5306 1.8423 1.4203 1.9450 1.4124 2.0527 1.6098 0.2113Ridge 1.9569 1.4835 1.8175 1.5225 1.8197 1.4001 1.9430 1.3913 2.0125 1.5897 0.2113Lasso 1.9323 1.4686 1.7986 1.5224 1.8080 1.4060 1.9607 1.3827 1.9851 1.5692 0.2086Pinv 1.9720 1.4870 1.8338 1.5306 1.8423 1.4203 1.9450 1.4124 2.0527 1.6098 0.2113KNN 2.2203 1.5943 1.8184 1.4861 1.8738 1.4628 2.0958 1.5001 2.1509 1.7177 0.2310SVM 1.9721 1.5066 1.8078 1.5134 1.8073 1.3903 1.9568 1.3795 1.9895 1.5793 0.2234
Trait Priv Appr Open Reli Perf Tens Adap Intro Impet CowaLinear 1.4358 1.7777 1.4137 1.6693 1.4342 1.4210 1.6638 2.0376 1.6168 1.6157Ridge 1.4211 1.7668 1.4024 1.6500 1.4387 1.3980 1.6614 2.0290 1.5999 1.5937Lasso 1.4294 1.7661 1.3773 1.6651 1.4373 1.4015 1.6719 2.0489 1.5902 1.5560Pinv 1.4358 1.7777 1.4137 1.6693 1.4342 1.4210 1.6638 2.0376 1.6168 1.6157KNN 1.5759 1.9320 1.4653 1.7591 1.4309 1.4263 1.6842 2.1113 1.6730 1.7619SVM 1.4231 1.7696 1.4038 1.6549 1.4355 1.3961 1.6632 2.0322 1.5992 1.5796
Male-Appearance feature-Segmented imageTrait Warm Reas Stab Domin Live Cons Soci Sens Vigil Abst IntellLinear 2.0066 1.5233 1.8399 1.5184 1.8613 1.4258 1.9211 1.4107 2.0525 1.6133 0.2129Ridge 1.9858 1.5047 1.8335 1.5103 1.8443 1.4229 1.9073 1.3998 2.0275 1.5998 0.2105Lasso 1.9456 1.5274 1.8334 1.4970 1.8408 1.4340 1.9285 1.3790 2.0174 1.5767 0.2102Pinv 2.0066 1.5233 1.8399 1.5184 1.8613 1.4258 1.9211 1.4107 2.0525 1.6133 0.2129KNN 2.2533 1.6686 2.0146 1.4626 2.0315 1.5216 1.9593 1.4321 2.2757 1.6744 0.2301SVM 1.9679 1.4996 1.8152 1.5193 1.8112 1.3991 1.9554 1.3845 2.0119 1.5772 0.2232
Trait Priv Appr Open Reli Perf Tens Adap Intro Impet CowaLinear 1.4391 1.8125 1.4250 1.6813 1.4638 1.4131 1.6948 2.0419 1.6262 1.6208Ridge 1.4225 1.7916 1.4173 1.6745 1.4485 1.4016 1.6786 2.0267 1.6146 1.6062Lasso 1.4418 1.7904 1.4037 1.6776 1.4464 1.3992 1.6772 2.0294 1.5578 1.5883Pinv 1.4391 1.8125 1.4250 1.6813 1.4638 1.4131 1.6948 2.0419 1.6262 1.6208KNN 1.5218 1.8522 1.4793 1.7392 1.3996 1.4389 1.7217 2.1808 1.7117 1.5860SVM 1.4126 1.7702 1.3940 1.6567 1.4425 1.3979 1.6619 2.0475 1.5983 1.5814
approaches with respect to each personality trait and to measured intelligence toobserve the correlation between their measured scores and the predicted scores.Generally speaking, the residual errors are not located randomly around the zero line,which suggests that there is no obvious linear correlation between the measured scoresand the predicted scores of the personality traits and intelligence; it is particularly hardto predict precise scores for intelligence. In addition, the Pearson Correlation Coefficientbetween the measured score and the predicted score of personality traits and that ofintelligence also agrees with the nonlinear correlation conclusions of the residual plots.However, similar to the results for the structural feature, the fitting errors of the medianscores of the appearance feature are relatively small for the personality traits, and theerrors when predicting the intelligence on high scores are also smaller than those whenpredicting the intelligence on low scores.Remark 3 : We also used the detection result from each one of the five texturedetectors as an appearance feature to conduct the regression separately. The regressionresults of the five different features with respect to the personality traits andintelligence are shown in S3 Fig and S4 Fig. The general conclusion is that the resultsof these five different appearance features are similar to those of our holistic appearancefeature in this section.
A Comparison between the Structural and the Appearance FeaturesSimilar to the classification experiments, we also compared the performance of thestructural feature and the appearance feature for all the personality traits and
20/27
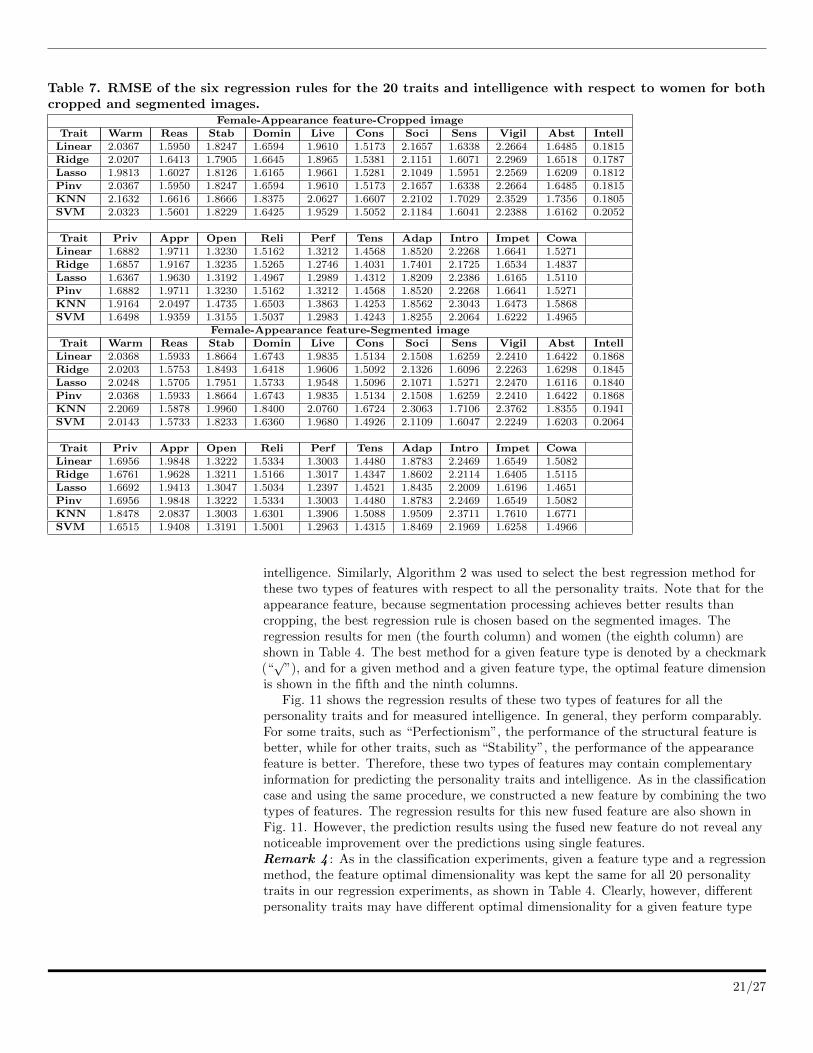
Table 7. RMSE of the six regression rules for the 20 traits and intelligence with respect to women for bothcropped and segmented images.
Female-Appearance feature-Cropped imageTrait Warm Reas Stab Domin Live Cons Soci Sens Vigil Abst IntellLinear 2.0367 1.5950 1.8247 1.6594 1.9610 1.5173 2.1657 1.6338 2.2664 1.6485 0.1815Ridge 2.0207 1.6413 1.7905 1.6645 1.8965 1.5381 2.1151 1.6071 2.2969 1.6518 0.1787Lasso 1.9813 1.6027 1.8126 1.6165 1.9661 1.5281 2.1049 1.5951 2.2569 1.6209 0.1812Pinv 2.0367 1.5950 1.8247 1.6594 1.9610 1.5173 2.1657 1.6338 2.2664 1.6485 0.1815KNN 2.1632 1.6616 1.8666 1.8375 2.0627 1.6607 2.2102 1.7029 2.3529 1.7356 0.1805SVM 2.0323 1.5601 1.8229 1.6425 1.9529 1.5052 2.1184 1.6041 2.2388 1.6162 0.2052
Trait Priv Appr Open Reli Perf Tens Adap Intro Impet CowaLinear 1.6882 1.9711 1.3230 1.5162 1.3212 1.4568 1.8520 2.2268 1.6641 1.5271Ridge 1.6857 1.9167 1.3235 1.5265 1.2746 1.4031 1.7401 2.1725 1.6534 1.4837Lasso 1.6367 1.9630 1.3192 1.4967 1.2989 1.4312 1.8209 2.2386 1.6165 1.5110Pinv 1.6882 1.9711 1.3230 1.5162 1.3212 1.4568 1.8520 2.2268 1.6641 1.5271KNN 1.9164 2.0497 1.4735 1.6503 1.3863 1.4253 1.8562 2.3043 1.6473 1.5868SVM 1.6498 1.9359 1.3155 1.5037 1.2983 1.4243 1.8255 2.2064 1.6222 1.4965
Female-Appearance feature-Segmented imageTrait Warm Reas Stab Domin Live Cons Soci Sens Vigil Abst IntellLinear 2.0368 1.5933 1.8664 1.6743 1.9835 1.5134 2.1508 1.6259 2.2410 1.6422 0.1868Ridge 2.0203 1.5753 1.8493 1.6418 1.9606 1.5092 2.1326 1.6096 2.2263 1.6298 0.1845Lasso 2.0248 1.5705 1.7951 1.5733 1.9548 1.5096 2.1071 1.5271 2.2470 1.6116 0.1840Pinv 2.0368 1.5933 1.8664 1.6743 1.9835 1.5134 2.1508 1.6259 2.2410 1.6422 0.1868KNN 2.2069 1.5878 1.9960 1.8400 2.0760 1.6724 2.3063 1.7106 2.3762 1.8355 0.1941SVM 2.0143 1.5733 1.8233 1.6360 1.9680 1.4926 2.1109 1.6047 2.2249 1.6203 0.2064
Trait Priv Appr Open Reli Perf Tens Adap Intro Impet CowaLinear 1.6956 1.9848 1.3222 1.5334 1.3003 1.4480 1.8783 2.2469 1.6549 1.5082Ridge 1.6761 1.9628 1.3211 1.5166 1.3017 1.4347 1.8602 2.2114 1.6405 1.5115Lasso 1.6692 1.9413 1.3047 1.5034 1.2397 1.4521 1.8435 2.2009 1.6196 1.4651Pinv 1.6956 1.9848 1.3222 1.5334 1.3003 1.4480 1.8783 2.2469 1.6549 1.5082KNN 1.8478 2.0837 1.3003 1.6301 1.3906 1.5088 1.9509 2.3711 1.7610 1.6771SVM 1.6515 1.9408 1.3191 1.5001 1.2963 1.4315 1.8469 2.1969 1.6258 1.4966
intelligence. Similarly, Algorithm 2 was used to select the best regression method forthese two types of features with respect to all the personality traits. Note that for theappearance feature, because segmentation processing achieves better results thancropping, the best regression rule is chosen based on the segmented images. Theregression results for men (the fourth column) and women (the eighth column) areshown in Table 4. The best method for a given feature type is denoted by a checkmark(“√
”), and for a given method and a given feature type, the optimal feature dimensionis shown in the fifth and the ninth columns.
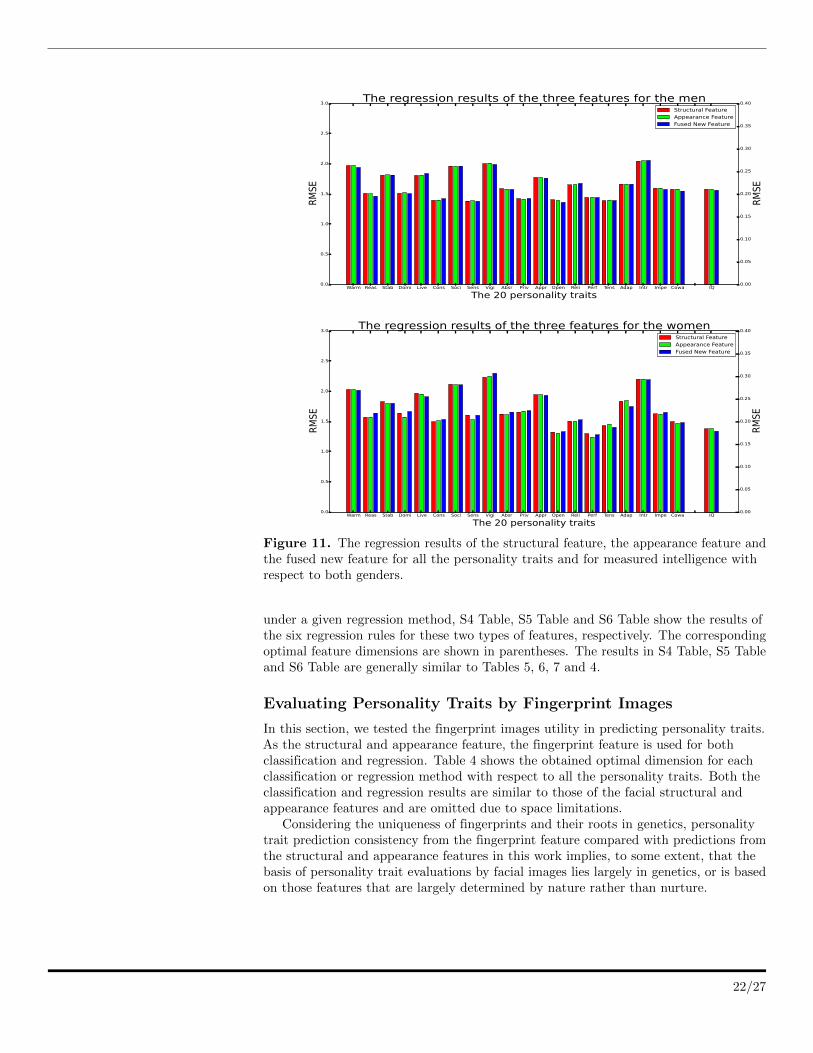
Fig. 11 shows the regression results of these two types of features for all thepersonality traits and for measured intelligence. In general, they perform comparably.For some traits, such as “Perfectionism”, the performance of the structural feature isbetter, while for other traits, such as “Stability”, the performance of the appearancefeature is better. Therefore, these two types of features may contain complementaryinformation for predicting the personality traits and intelligence. As in the classificationcase and using the same procedure, we constructed a new feature by combining the twotypes of features. The regression results for this new fused feature are also shown inFig. 11. However, the prediction results using the fused new feature do not reveal anynoticeable improvement over the predictions using single features.Remark 4 : As in the classification experiments, given a feature type and a regressionmethod, the feature optimal dimensionality was kept the same for all 20 personalitytraits in our regression experiments, as shown in Table 4. Clearly, however, differentpersonality traits may have different optimal dimensionality for a given feature type
21/27
Warm Reas Stab Domi Live Cons Soci Sens Vigi Absr Priv Appr Open Reli Perf Tens Adap Intr Impe Cowa IQ
The 20 personality traits0.0
0.5
1.0
1.5
2.0
2.5
3.0
RMSE
The regression results of the three features for the men
0.00
0.05
0.10
0.15
0.20
0.25
0.30
0.35
0.40
RMSE
Structural FeatureAppearance FeatureFused New Feature
Warm Reas Stab Domi Live Cons Soci Sens Vigi Absr Priv Appr Open Reli Perf Tens Adap Intr Impe Cowa IQ
The 20 personality traits0.0
0.5
1.0
1.5
2.0
2.5
3.0
RMSE
The regression results of the three features for the women
0.00
0.05
0.10
0.15
0.20
0.25
0.30
0.35
0.40
RMSE
Structural FeatureAppearance FeatureFused New Feature
Figure 11. The regression results of the structural feature, the appearance feature andthe fused new feature for all the personality traits and for measured intelligence withrespect to both genders.
under a given regression method, S4 Table, S5 Table and S6 Table show the results ofthe six regression rules for these two types of features, respectively. The correspondingoptimal feature dimensions are shown in parentheses. The results in S4 Table, S5 Tableand S6 Table are generally similar to Tables 5, 6, 7 and 4.
Evaluating Personality Traits by Fingerprint Images
In this section, we tested the fingerprint images utility in predicting personality traits.As the structural and appearance feature, the fingerprint feature is used for bothclassification and regression. Table 4 shows the obtained optimal dimension for eachclassification or regression method with respect to all the personality traits. Both theclassification and regression results are similar to those of the facial structural andappearance features and are omitted due to space limitations.
Considering the uniqueness of fingerprints and their roots in genetics, personalitytrait prediction consistency from the fingerprint feature compared with predictions fromthe structural and appearance features in this work implies, to some extent, that thebasis of personality trait evaluations by facial images lies largely in genetics, or is basedon those features that are largely determined by nature rather than nurture.
22/27

Conclusion
In this paper, we investigated whether self-reported personality traits and measuredintelligence could be predicted from facial morphometric features or a fingerprintfeature. To represent the characteristics of the face images and the fingerprint images,three types of features were extracted. We detected 21 facial salient points using theLBF method to construct the structural feature. After employing image cropping andsegmentation techniques to remove irrelevant information, the appearance feature wasobtained by fusing the results of five texture descriptors. The fingerprint feature wasextracted based on the minutiae contained in the fingerprint images. The evaluation ofpersonality traits was assessed by both classification and regression, in which fiveclassification rules and six regression rules are applied to train the models for the threetypes of features, respectively. Finally, the classification accuracy and the regressionfitness were analyzed.
The results of the classification experiments show that our three extracted types offeatures are most related to the personality traits ”Rule-consciousness” and “Vigilance”,which can be predicted well beyond chance levels for both genders. These two traitsmay be genetically determined and could be little influenced by the social environment.Generally speaking, the personality traits of females can be predicted more accuratelythrough machine learning methods than male. However, a stronger correlation existsbetween facial features and the personality traits “Privateness” and “Apprehension” formen. Our results also suggest that compared with the structural feature, theappearance feature contains more usable information when predicting personality traits.We found that predicting the intelligence level from any of these three types of featuresis difficult, although women’s facial features appear to be more closely related tomeasured intelligence than men’s.
The results of the regression experiments show that predicting exact scores for thepersonality traits or intelligence is more difficult than classifying them into a binarycategory. Due to the difference in facial composition between men and women, theirfacial features are related to different personality traits. In addition, the regressionerrors of the traits “Social boldness”, “Vigilance” and “Introversion/Extroversion” areall too high for all the three types of features, suggesting that these three traits mayhave little correlation to the facial features. Generally speaking, when predicting theprecise scores for the personality traits or for measured intelligence, the three types offeatures perform similarly. However, similar to the classification experiments, thecorrelations between intelligence and the features are weak; therefore, it is difficult topredict intelligence scores reliably. The results of the residual plots indicate no evidencefor linear correlation between the predicted scores and the measured scores of thepersonality traits or intelligence, and the Pearson Correlation Coefficients confirm thisobserved weak correlation. However, we find that for predicting median scores of thepersonality traits and high scores of intelligence, the fitting performance is relativelybetter.
In both the classification experiments and regression experiments, the results showthat for the appearance feature, the performance on segmented images is better thanthat on cropped images, which suggests that segmentation processing is more effectiveat removing irrelevant information.
In this study, we use handcrafted textural descriptors to extract facial features froma single frontal face image and used typical machine learning methods to train themodels. However, there are limits in our work in exploring accurate correlations betweenfacial features and personality traits as well as intelligence. For example, a handcraftedfeature proven useful for face recognition does not necessarily mean that feature is alsomore informative for predicting personality traits.In future work, we plan to use thecurrently widely used deep networks and deep learning to learn suitable features. In
23/27

addition, we plan to pursue how to exploit 3D face features in our future work.
Supporting Information
S1 Fig The classification results of the five classification rules based on all the fiveappearance features for all the personality traits and intelligence with respect to men.
S2 Fig The classification results of the five classification rules based on all the fiveappearance features for all the personality traits and intelligence with respect to women.
S3 Fig RMSE of the six regression rules based on all the five appearance features forall the personality traits and intelligence with respect to men.
S4 Fig RMSE of the six regression rules based on all the five appearance features forall the personality traits and intelligence with respect to women.
S1 Table Mean accuracy of the five classification rules based on the structuralfeature for the 20 traits with respect to men and women.
S2 Table Mean accuracy of the five classification rules based on the appearancefeature for the 20 traits with respect to genders, images cropping and segmenting.
S3 Table Mean accuracy of the five classification rules based on the two types offeatures for intelligence with respect to men and women.
S4 Table RMSE of the six regression rules based on the structural feature for the 20traits with respect to men and women.
S5 Table RMSE of the six regression rules based on the appearance feature for the 20traits with respect to genders, image cropping or segmenting.
S6 Table RMSE of the six regression rules based on the two types of features forintelligence with respect to men and women.
Acknowledgments
We are grateful for all the students of Xiamen University of Technology in China whoparticipated in this study. This work was supported by the Strategic Priority ResearchProgram of the CAS (XDB02070002) and National Natural Science Foundation ofChina (61421004, 61333015).
Author Contributions
Conceived and designed the experiments: ZYH, WG. Performed the experiments: RZQ,WG, HRX. Analyzed the data: RZQ, WG, HRX. Contributedreagents/materials/analysis/tools: RZQ, WG, HRX. Wrote the paper: RZQ, ZYH.
24/27

References
1. McNeill D. The face: a natural history. Back Bay Books; 2000.
2. Todorov A, Said CP, Engell AD, Oosterhof NN. Understanding evaluation offaces on social dimensions. Trends in cognitive sciences. 2008;12(12):455–460.
3. Carney DR, Colvin CR, Hall JA. A thin slice perspective on the accuracy of firstimpressions. Journal of Research in Personality. 2007;41(5):1054–1072.
4. Kramer RS, King JE, Ward R. Identifying personality from the static,nonexpressive face in humans and chimpanzees: evidence of a shared system forsignaling personality. Evolution and Human Behavior. 2011;32(3):179–185.
5. Wolffhechel K, Fagertun J, Jacobsen UP, Majewski W, Hemmingsen AS, LarsenCL, et al. Interpretation of Appearance: The Effect of Facial Features on FirstImpressions and Personality. 2014;.
6. Kleisner K, Chvatalova V, Flegr J. Perceived intelligence is associated withmeasured intelligence in men but not women. PloS one. 2014;9(3):e81237.
7. Rojas Q, Masip D, Todorov A, Vitria J, et al. Automatic point-based facial traitjudgments evaluation. In: Computer Vision and Pattern Recognition (CVPR),2010 IEEE Conference on. IEEE; 2010. p. 2715–2720.
8. Rojas M, Masip D, Todorov A, Vitria J, et al. Automatic prediction of facialtrait judgments: Appearance vs. structural models. PloS one. 2011;6(8):1–12.
9. Ren S, Cao X, Wei Y, Sun J. Face alignment at 3000 fps via regressing localbinary features. In: Computer Vision and Pattern Recognition (CVPR), 2014IEEE Conference on. IEEE; 2014. p. 1685–1692.
10. Dalal N, Triggs B. Histograms of oriented gradients for human detection. In:Computer Vision and Pattern Recognition, 2005. CVPR 2005. IEEE ComputerSociety Conference on. vol. 1. IEEE; 2005. p. 886–893.
11. Ahonen T, Hadid A, Pietikainen M. Face description with local binary patterns:Application to face recognition. Pattern Analysis and Machine Intelligence, IEEETransactions on. 2006;28(12):2037–2041.
12. Liu C, Wechsler H. Gabor feature based classification using the enhanced fisherlinear discriminant model for face recognition. Image processing, IEEETransactions on. 2002;11(4):467–476.
13. Oliva A, Torralba A. Modeling the shape of the scene: A holistic representationof the spatial envelope. International journal of computer vision.2001;42(3):145–175.
14. Lowe DG. Distinctive image features from scale-invariant keypoints.International journal of computer vision. 2004;60(2):91–110.
15. Ballew CC, Todorov A. Predicting political elections from rapid and unreflectiveface judgments. Proceedings of the National Academy of Sciences.2007;104(46):17948–17953.
16. Little AC, Burriss RP, Jones BC, Roberts SC. Facial appearance affects votingdecisions. Evolution and Human Behavior. 2007;28(1):18–27.
25/27

17. Blair IV, Judd CM, Chapleau KM. The influence of Afrocentric facial features incriminal sentencing. Psychological Science. 2004;15(10):674–679.
18. Oosterhof NN, Todorov A. The functional basis of face evaluation. Proceedingsof the National Academy of Sciences. 2008;105(32):11087–11092.
19. Carre JM, McCormick CM, Mondloch CJ. Facial structure is a reliable cue ofaggressive behavior. Psychological Science. 2009;20(10):1194–1198.
20. Haselhuhn MP, Wong EM. Bad to the bone: facial structure predicts unethicalbehaviour. Proceedings of the Royal Society of London B: Biological Sciences.2012;279(1728):571–576.
21. Karson S, O’Dell JW. A guide to the clinical use of the 16 PF. 1976;.
22. Kaplan R, Saccuzzo D. Standardized tests in education, civil service, and themilitary. Psychological testing: Principles, applications, and. 2009;(7):325–327.
23. Milborrow S, Nicolls F. Locating facial features with an extended active shapemodel. In: Computer Vision–ECCV 2008. Springer; 2008. p. 504–513.
24. Matthews I, Baker S. Active appearance models revisited. International Journalof Computer Vision. 2004;60(2):135–164.
25. Cristinacce D, Cootes TF. Feature Detection and Tracking with ConstrainedLocal Models. In: BMVC. vol. 1. Citeseer; 2006. p. 3.
26. Chan CH, Kittler J, Messer K. Multi-scale local binary pattern histograms forface recognition. Springer; 2007.
27. Guillaumin M, Mensink T, Verbeek J, Schmid C. Automatic face naming withcaption-based supervision. In: Computer Vision and Pattern Recognition, 2008.CVPR 2008. IEEE Conference on. IEEE; 2008. p. 1–8.
28. Guillaumin M, Verbeek J, Schmid C. Is that you? Metric learning approaches forface identification. In: Computer Vision, 2009 IEEE 12th InternationalConference on. IEEE; 2009. p. 498–505.
29. Douze M, Jegou H, Sandhawalia H, Amsaleg L, Schmid C. Evaluation of gistdescriptors for web-scale image search. In: Proceedings of the ACM InternationalConference on Image and Video Retrieval. ACM; 2009. p. 19.
30. Siagian C, Itti L. Rapid biologically-inspired scene classification using featuresshared with visual attention. Pattern Analysis and Machine Intelligence, IEEETransactions on. 2007;29(2):300–312.
31. Chen D, Cao X, Wen F, Sun J. Blessing of dimensionality: High-dimensionalfeature and its efficient compression for face verification. In: Computer Visionand Pattern Recognition (CVPR), 2013 IEEE Conference on. IEEE; 2013. p.3025–3032.
32. Vedaldi A, Fulkerson B. VLFeat: An Open and Portable Library of ComputerVision Algorithms; 2008. http://www.vlfeat.org/.
33. Parzen E. On estimation of a probability density function and mode. The annalsof mathematical statistics. 1962;p. 1065–1076.
34. Duda RO, Hart PE, Stork DG. Pattern classification. John Wiley & Sons; 2012.
26/27

35. Rish I. An empirical study of the naive Bayes classifier. In: IJCAI 2001 workshopon empirical methods in artificial intelligence. vol. 3. IBM New York; 2001. p.41–46.
36. Breiman L. Random forests. Machine learning. 2001;45(1):5–32.
37. Prtools: The matlab toolbox for pattern recognition. Website.Http://www.prtools.org/, Accessed July 2011.
38. Draper NR, Smith H, Pownell E. Applied regression analysis. vol. 3. Wiley NewYork; 1966.
39. Tikhonov A. Solutions of ill-posed problems;.
40. Tibshirani R. Regression shrinkage and selection via the lasso. Journal of theRoyal Statistical Society Series B (Methodological). 1996;p. 267–288.
41. Cortes C, Vapnik V. Support-vector networks. Machine learning.1995;20(3):273–297.
27/27


![IEEE TRANSACTIONS ON AUTOMATIC CONTROL, VOL. 55, …lsc.amss.ac.cn/~jif/paper/[J73].pdfAcademy of Sciences, Beijing 100190, China (e-mail: litao@amss.ac.cn; jif@iss.ac.cn). Color versions](https://img.pdfslide.us/doc/110x75/60734d8bff5dd113f451f086/ieee-transactions-on-automatic-control-vol-55-lscamssaccnjifpaperj73pdf.jpg)


![1 2 Chinese Academy of Sciences, Beijing 100190, …Due to the circularization effect of gravitational radia-tion [19], ones may expect that the binary black hole sys-tems are always](https://img.pdfslide.us/doc/110x75/5e900e27adcfbf38442a4d6b/1-2-chinese-academy-of-sciences-beijing-100190-due-to-the-circularization-eiect.jpg)


![arXiv:1601.07646v1 [math.RT] 28 Jan 2016 · 55 Zhongguancun Dong Lu Beijing 100190, ... Preface Symmetry is an important phenomenon in the natural world. Lie algebra is not purely](https://img.pdfslide.us/doc/110x75/5f0482187e708231d40e5137/arxiv160107646v1-mathrt-28-jan-2016-55-zhongguancun-dong-lu-beijing-100190.jpg)