Embed Size (px)
Citation preview
THIS REPORT CONTAINS ASSESSMENTS OF COMMODITY AND TRADE ISSUES MADE BY
USDA STAFF AND NOT NECESSARILY STATEMENTS OF OFFICIAL U.S. GOVERNMENT
POLICY
Date:
GAIN Report Number:
Approved By:
Prepared By:
Report Highlights:
On March 28, 2016, the government announced an end to the floor price for corn. The resulting fall in
corn prices following this announcement is still rippling throughout China’s agricultural sector. MY
2016/17 corn production is forecast to fall, while wheat and rice production are expected to remain
strong. Imports of feed ingredients, such as sorghum, barley, and DDGS, will be the most immediate
casualty of this policy change.
Andrew Anderson-Sprecher and James JI
Bruce Zanin
China’s Decision to End Corn Floor Price Shakes Grain and
Feed Market
Grain and Feed Annual
China - Peoples Republic of
CH16027
4/8/2016
Required Report - public distribution
Executive Summary
2016 is shaping up to be a pivotal year in Chinese agricultural policy. On March 28, 2016, Liu Xiannan,
Director of the Economy and Trade Office of the National Development and Reform Commission
(NDRC), announced that the temporary reserve policy in Northeastern provinces and Inner Mongolia
will be replaced by a new mechanism of “marketized purchases” (市场化收购). Unspecified new
subsidies will be created to help support corn farmers. This surprise announcement came after planting
started and leaves growers and traders guessing on what will happen next.
The government has now abandoned price support policies for all commodities except wheat and rice.
The government says it will retain and “improve” support price policies for wheat and rice, but these
grains face the same challenges as corn. Mounting surpluses, pressure from cheaper imports, and
concerns about lagging productivity and environmental deterioration are forcing China to overhaul the
agricultural subsidy model that developed over the past decade.
MY 2016/17 corn production is forecast at 218 million metric tons (MMT) based on average yields and
three percent decline in acreage. The corn planting season has already begun. According to contacts in
northeast China, most farmers have already made planting decisions and cannot easily change plans
based on the cancellation of the temporary reserve program. MY 2016/17 corn consumption is forecast
at 225 MMT, up seven MMT as lower corn prices and subsidies to corn processors boost feed and
industrial demand. MY 2016/17 corn imports are forecast at 1 MMT, 1.5 MMT lower than MY
2015/16, as falling corn prices will make imports less attractive.
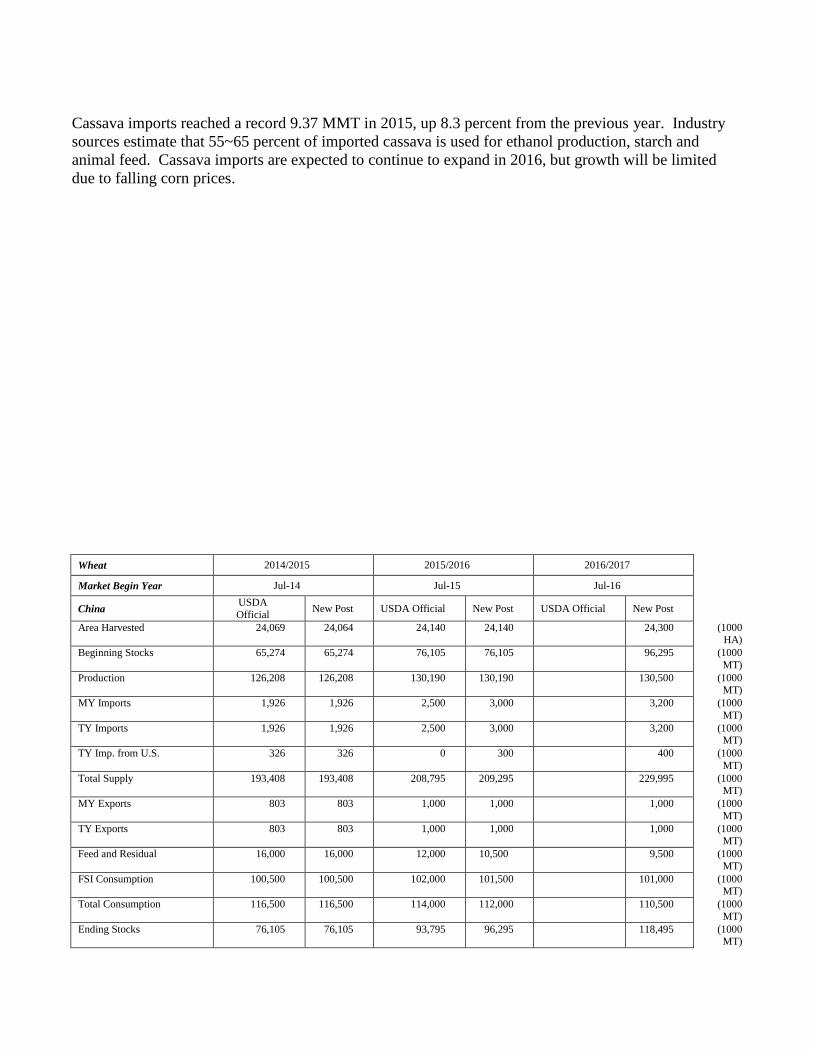
MY 2016/17 wheat production is forecast to increase slightly to 130.5 MMT on slightly higher acreage
and average yields as attractive prices encourage production. Wheat total consumption in MY 2016/17
is forecast to decrease to 110.5 MMT due to falling feed wheat usage and weak demand for food and
industrial use. MY 2016/17 wheat imports are forecast at 3.2 MMT, up 200,000 metric tons (MT) from
MY 2015/16 on higher demand for premium quality wheat for making high and low gluten flour.
MY 2016/17 rough rice production is forecast to remain flat at 208.3 MMT. MY 2016/17 rice
consumption is forecast at 147.4 MMT, down 600,000 MT as Chinese consumers are eating more meat
and dairy and eating less rice, wheat and other staple grain. Higher rice prices have also hurt industrial
and feed demand. Rice imports are forecast to remain stable in MY 2016/17. Domestic rice prices
continue to stay far above international prices due to China’s floor price, sustaining demand for
imported (and smuggled) rice.
Imports of barley, sorghum and distillers dried grains with solubles (DDGS) for feed increased rapidly
after 2012 as a result of high domestic corn prices. This trend is reversing now that corn prices are
falling. MY 2016/17 sorghum and barley imports are forecast to fall to 5 MMT and 6 MMT
respectively as falling corn prices reduces demand for imported feed ingredients. Estimated MY
2015/16 sorghum and barley imports are also lowered to 6 MMT and 6.9 MMT respectively as traders
are already responding to falling corn prices by reducing imports.
The government is working openly and behind the scenes to accelerate these trends and reduce
competition for domestic corn. The Ministry of Commerce (MOFCOM) is currently conducting an
antidumping (AD) and countervailing duty (CVD) investigation against DDGS originating from the
United States. A preliminary determination in the AD CVD case is expected sometime this summer,
after which MOFCOM may impose preliminary duties. The timing of the decision is subject to change.
DDGS imports fell 39 percent in February 2016 from the month before as importers worry about
potential duties.
According to industry sources, the government is also trying to discourage sorghum imports through
customs inspections. Importers have already experienced delays in clearing customs for sorghum
imported from the United States. CIQ offices in coastal provinces are privately warning local importers
to limit sorghum imports and that there will be increased inspections and delays. Many traders report
that they are reducing sorghum purchases in response to government warnings and pressure.
Policy
2016 is shaping up to be a pivotal year in Chinese agricultural policy. On March 28, 2016, Liu Xiannan,
Director of the Economy and Trade Office of the NDRC, announced that the temporary reserve policy in
Northeastern provinces and Inner Mongolia will be replaced by a new mechanism of “marketized
purchases” (市场化收购). Unspecified new subsidies will be created to help support corn farmers. This
surprise announcement came after planting started and leaves growers and traders guessing on what will
happen next. The estimates in this report are based on what limited information was available at the
time of writing, and may change significantly over the next few months as the government releases more
information.
While the announcement was a surprise, the tensions that led to the change have been visibly growing.
The support price system for corn, wheat and rice has resulted in excessive stocks, unsustainable
farming practices, suppressed demand, and a growing financial burden on the government. It also
artificially elevated domestic grain prices as much as 30% above the CIF price of imported grain,
creating a strong incentive to import rather than purchase domestic grains.
Now that the floor price has been halted and corn prices are falling, the government, including Sino
Grain, will need to reassess the value of their corn stocks. A 600 RMB per MT write down on corn
stocks would result in a paper loss of over $10 billion. The total cost is likely to be even higher as this
does not account for storage costs, estimated at RMB 60 billion by one Chinese government economist
in a recent speech. Some corn stocks may have lost their entire value as they are too deteriorated to sell.
There reportedly was strong opposition in parts of the government to making drastic changes to farm
support policies. Many farmers have become dependent on high government support prices to stay
profitable. The overall economy in northeast China is currently struggling, limiting job opportunities in
urban areas. Given these challenges, the cancelling of the corn floor price in the northeast can be seen
as a bold reform.
The government has now abandoned price support policies for all commodities except wheat and rice.
The government says it will retain and “improve” support price policies for wheat and rice, but these
grains face the same challenges as corn. Mounting surpluses, pressure from cheaper imports, and
concerns about lagging productivity and environmental deterioration are forcing China to overhaul the
agricultural subsidy model that developed over the past decade.
Wheat
Production
MY 2016/17 wheat production is forecast to increase slightly to 130.5 MMT on slightly higher acreage
and average yields as attractive prices encourage production. The NDRC announced in October 2015
that the minimum purchase price for wheat will remain unchanged in 2016 at RMB 2,360 per MT. In
contrast, the government has removed support prices for cotton and rapeseed, cut the corn support price
in fall 2015 and announced on March 28, 2016 that the corn temporary reserve system will end this
spring. A small percentage of corn farmers are expected to switch to wheat this seeding season because
of the guaranteed high price. Estimated MY2014/15 production is unchanged at 130.2 MMT.
Wheat prices have remained relatively stable compared to other crops. The market price fluctuated
around RMB 2,400 per MT in 2015 before the new crop season, just above the floor price. MY 2015/16
wheat yields averaged between 5.37~5.42 MT per Hectare (Ha) according to recent industry surveys in
Jiangsu, Henan and Anhui province. The surveys also found that the average cost of production for
wheat was RMB 7,125 per Ha based on limited or no mechanized equipment.
Consumption Wheat total consumption in MY 2016/17 is forecast to decrease to 110.5 MMT due to falling feed wheat
usage and weak demand for food and industrial use. Estimated MY 2015/16 total wheat consumption is
revised lower two MMT to 112 MMT due to these same trends.
MY 2016/17 wheat feed consumption is forecast at 9.5 MMT, down 1 million from post’s revised MY
2015/16 estimate as wheat is increasingly economically uncompetitive as a feed ingredient. Estimated
MY 2015/16 wheat feed use is cut to 10.5 MMT. The 2015 corn floor price was cut by 11 percent in
November 2015. Corn prices proceeded to fall as low as RMB 1,710 per MT from an average RMB
2,200 per MT. The recent cancellation of the temporary reserve system in the northeast will drive corn
prices even lower. Wheat feed use in China has been limited over the past two years by the widening
price gap between wheat and corn. Alternative feed ingredients, such as distillers dried grains with or
without solubles (DDGS), barley and sorghum have replaced wheat and corn feed usage due to their
significant cost advantage. High levels of corn stocks are expected to keep driving corn prices further
below wheat prices, which will limit wheat feed use in the near future.
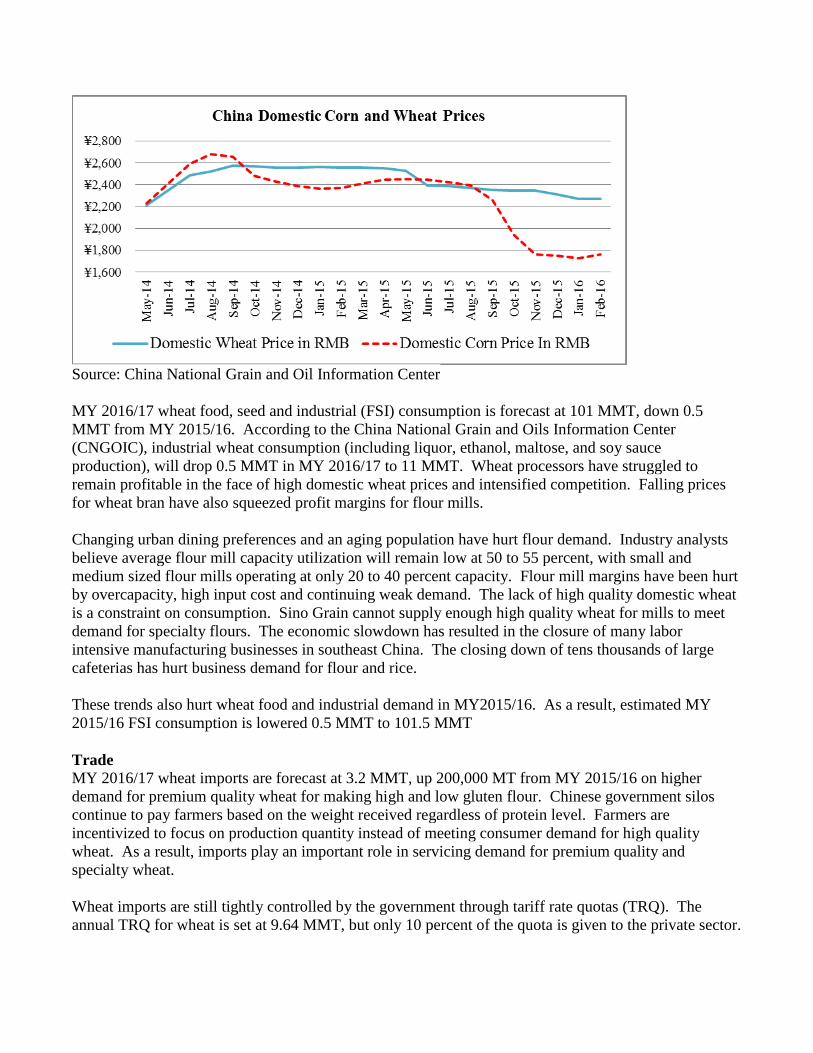
Source: China National Grain and Oil Information Center
MY 2016/17 wheat food, seed and industrial (FSI) consumption is forecast at 101 MMT, down 0.5
MMT from MY 2015/16. According to the China National Grain and Oils Information Center
(CNGOIC), industrial wheat consumption (including liquor, ethanol, maltose, and soy sauce
production), will drop 0.5 MMT in MY 2016/17 to 11 MMT. Wheat processors have struggled to
remain profitable in the face of high domestic wheat prices and intensified competition. Falling prices
for wheat bran have also squeezed profit margins for flour mills.
Changing urban dining preferences and an aging population have hurt flour demand. Industry analysts
believe average flour mill capacity utilization will remain low at 50 to 55 percent, with small and
medium sized flour mills operating at only 20 to 40 percent capacity. Flour mill margins have been hurt
by overcapacity, high input cost and continuing weak demand. The lack of high quality domestic wheat
is a constraint on consumption. Sino Grain cannot supply enough high quality wheat for mills to meet
demand for specialty flours. The economic slowdown has resulted in the closure of many labor
intensive manufacturing businesses in southeast China. The closing down of tens thousands of large
cafeterias has hurt business demand for flour and rice.
These trends also hurt wheat food and industrial demand in MY2015/16. As a result, estimated MY
2015/16 FSI consumption is lowered 0.5 MMT to 101.5 MMT
Trade MY 2016/17 wheat imports are forecast at 3.2 MMT, up 200,000 MT from MY 2015/16 on higher
demand for premium quality wheat for making high and low gluten flour. Chinese government silos
continue to pay farmers based on the weight received regardless of protein level. Farmers are
incentivized to focus on production quantity instead of meeting consumer demand for high quality
wheat. As a result, imports play an important role in servicing demand for premium quality and
specialty wheat.
Wheat imports are still tightly controlled by the government through tariff rate quotas (TRQ). The
annual TRQ for wheat is set at 9.64 MMT, but only 10 percent of the quota is given to the private sector.
In some years the government has used public sector quotas to import wheat for feed use, but it is not
expected to do so in 2016 or 2017 due to high wheat and corn stocks.
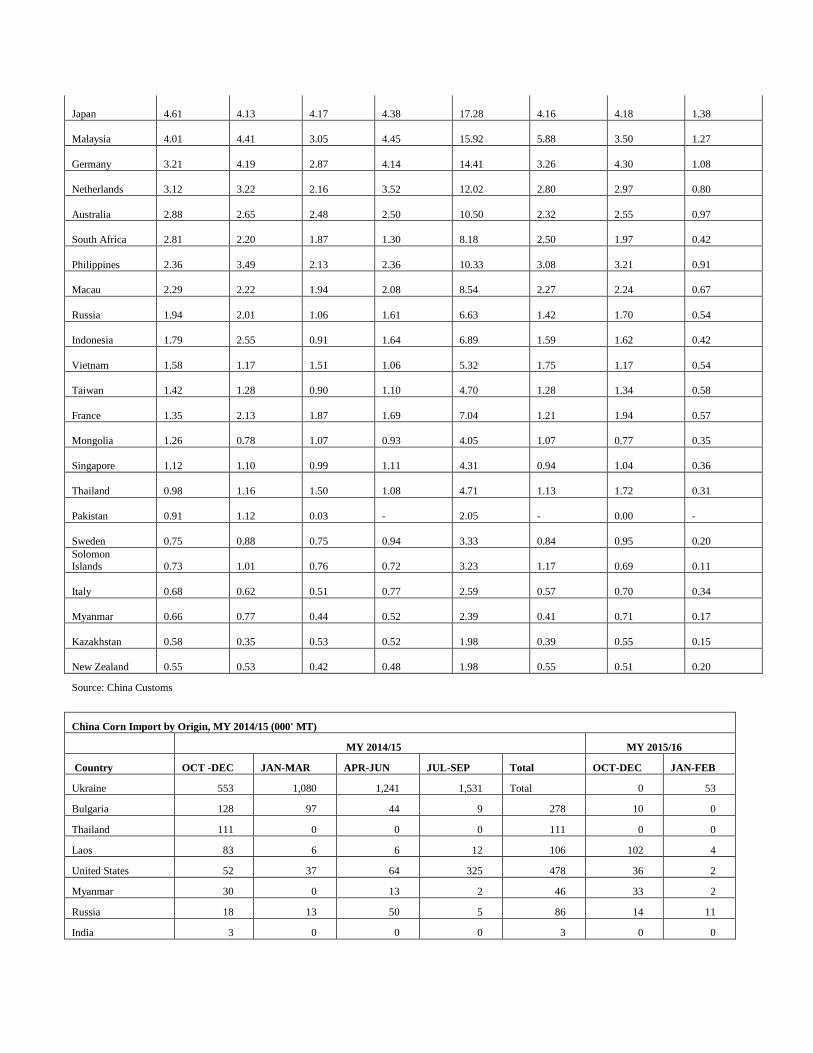
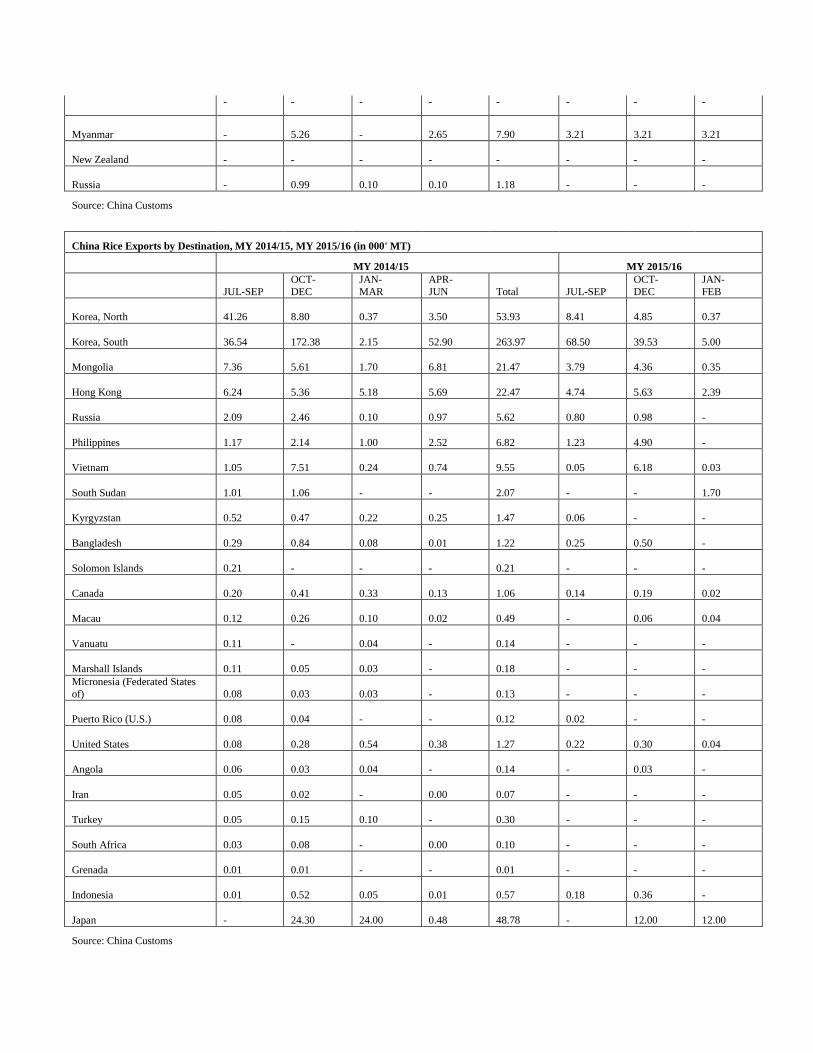
Estimated MY 2015/16 wheat imports are revised up 500,000 MT to 3 MMT on import trends. Exports
are forecast to remain stable at one MMT in MY 2016/17. Traditional export destinations include North
Korea, South Korea, and Hong Kong.
Marketing The government intervenes in the wheat market by purchasing and storing wheat whenever the market
price falls below the government set floor price. In most years, a substantial portion of domestically
produced wheat is purchased and stored by Sino Grain, a state owned company that manages grain and
edible oil reserves, or by grain companies commissioned to purchase on its behalf. The government
announces a floor price each fall before the seeding season to guide price expectations. The minimum
procurement price for non-durum wheat in 2016 is set at 2,360 RMB, unchanged from 2015. This
equals roughly $10.05 per bushel at current exchange rates, compared to an average season farm price of
$4.80 to $5.20 per bushel in the United States in MY 2015/16. Sino Grain is reported to have purchased
20.8 MMT of wheat at the floor price from the 2015 crop. The floor price system has exerted heavy
financial pressure on government finances. The government announced that it will continue the floor
price policy for wheat and rice with unspecified “improvements” during its 2016-2020 five-year plan as
it wants to maintain self-sufficiency goals in these basic food grains.
Stocks Wheat stocks are forecast to increase by 22.2 MMT in MY2016/17 to 118.5 MMT due to falling
consumption and forecast record production driven by high support prices. Estimated MY 2015/16
ending stocks are raised 2.5 MMT to 96.3 MMT due to high production and falling feed use.
Corn
Production
MY 2016/17 corn production is forecast at 218 MMT based on average yields and a decline in acreage.
On March 28, 2016, Liu Xiannan, Director of the Economy and Trade Office of the National
Development and Reform Commission (NDRC), announced that the temporary reserve program in
Northeastern provinces and Inner Mongolia will be replaced by a new mechanism of “marketized
purchases” (市场化收购). The government did not disclose any details on how the “marketized
purchases” would operate after the cancellation of the floor price in these regions. Other officials
suggested that enterprises designated by the government may receive subsidies to purchase corn if
farmers have difficulty selling their grain. On March 29, 2016 the new crop future price “CORN-1701”
plunged to RMB 1,425 per MT ($ 5.5 per bushel) from RMB 1,590 ($6.21 per bushel) in the Dalian
Commodity Exchange market. Unspecified new subsidies will be created by provincial governments in
corn-producing regions to help support farmers’ incomes.
Overall MY2016/17 acreage is forecast to fall 3 percent. The corn planting season has already begun.
According to contacts in northeast China, most farmers have already made planting decisions and
cannot easily change plans based on the cancellation of the temporary reserve program. Some corn
farmers will have already planned on reducing MY2016/17 corn acreage following the government’s
announcement in September 2015 that it would cut the 2015 support prices for corn to RMB 2,000 per
MT from a peak of RMB 2,250 in 2014. Reform of the corn market was promised in the Chinese
Communist Party’s “No. 1 Document” in January 2016. Some farmers have responded to the policy
change by trying to renegotiate land rental rates which are commonly RMB 500 per mu (15mu = 1 Ha)
or more in northeastern provinces. Contacts report that land rents are already dropping 35 to 40 percent
compared to last year. This will allow larger farms to stay viable even with sharply lower corn prices,
but smaller farmers will struggle. Corn acreage could fall more next year if corn farmers see lower
profits this year. MY 2015/16 production is estimated unchanged at 224.6 MMT.
Feed and Residual
MY 2016/17 feed and residual is forecast at 158 MMT, up 4 MMT from MY 2015/16. China is the
second largest consumer of corn after the United States, but consumption has been restrained by high
prices in recent years. The reduced corn floor price has allowed prices to fall to RMB 1550~1650 per
MT outside the northeast region. As old corn is auctioned from reserves, prices could fall enough to give
feed mills an incentive to switch back to corn from sorghum, barley and DDGS. Lower quality corn
from reserves will reportedly be heavily discounted. With the cancelation of the corn floor price, corn
prices may drop even lower in MY 2016/17. The government subsidizes transportation costs to
encourage feed mills in the south to purchase domestic corn.
Estimated MY 2015/16 feed and residual is raised two MMT to 154 MMT. The elimination of corn
floor price is causing corn prices to fall, which will boost corn feed use in the remaining second half of
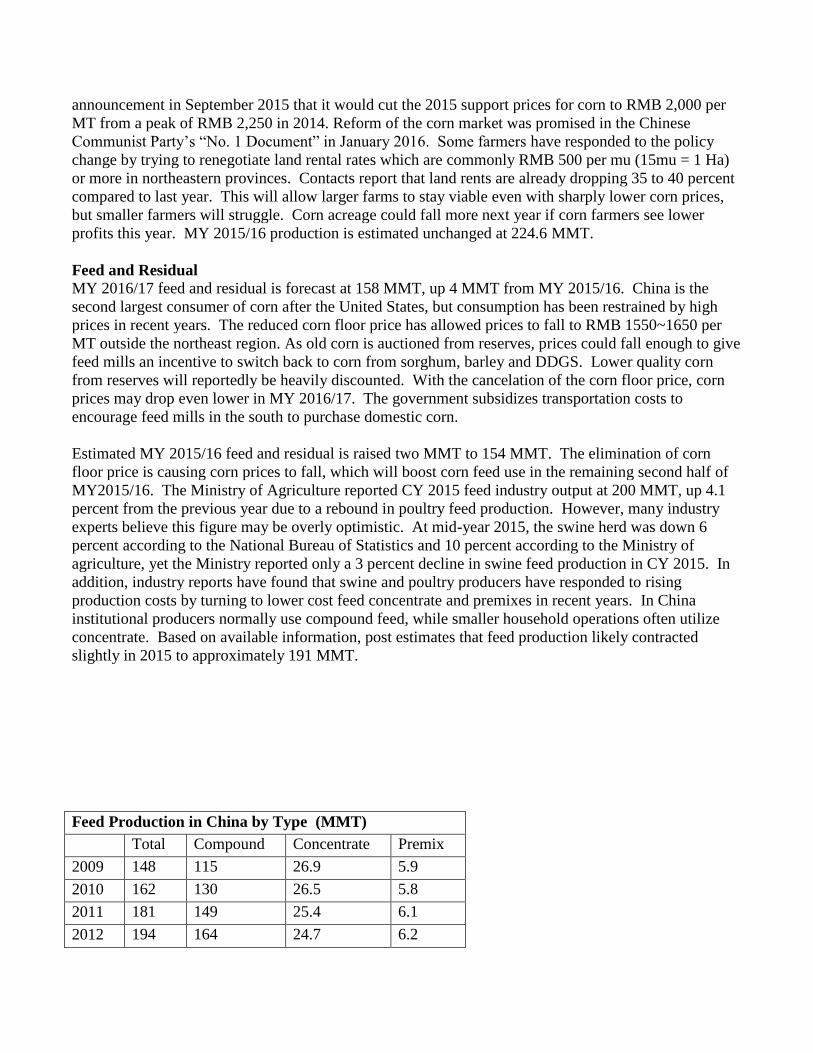
MY2015/16. The Ministry of Agriculture reported CY 2015 feed industry output at 200 MMT, up 4.1
percent from the previous year due to a rebound in poultry feed production. However, many industry
experts believe this figure may be overly optimistic. At mid-year 2015, the swine herd was down 6
percent according to the National Bureau of Statistics and 10 percent according to the Ministry of
agriculture, yet the Ministry reported only a 3 percent decline in swine feed production in CY 2015. In
addition, industry reports have found that swine and poultry producers have responded to rising
production costs by turning to lower cost feed concentrate and premixes in recent years. In China
institutional producers normally use compound feed, while smaller household operations often utilize
concentrate. Based on available information, post estimates that feed production likely contracted
slightly in 2015 to approximately 191 MMT.
Feed Production in China by Type (MMT)
Total Compound Concentrate Premix
2009 148 115 26.9 5.9
2010 162 130 26.5 5.8
2011 181 149 25.4 6.1
2012 194 164 24.7 6.2
2013 193 163 24 6.3
2014 192 161 24 6.3
2015 200 168 25.1 6.9
Source: Ministry of Agriculture
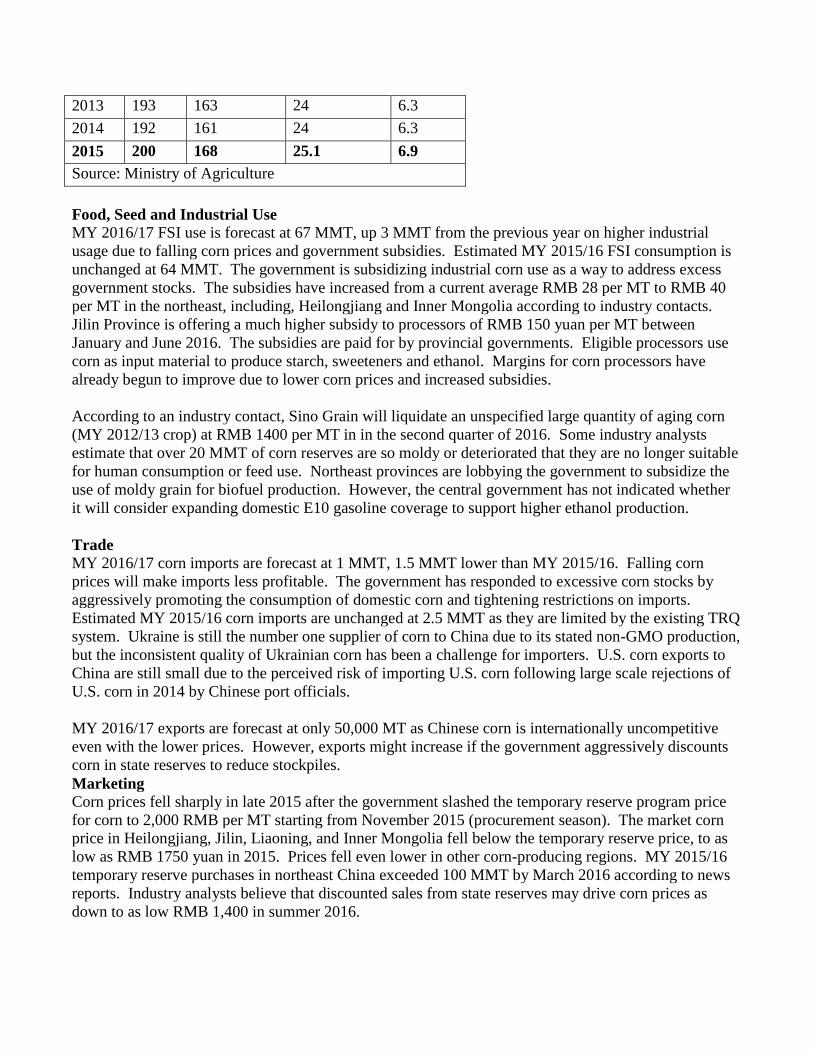
Food, Seed and Industrial Use
MY 2016/17 FSI use is forecast at 67 MMT, up 3 MMT from the previous year on higher industrial
usage due to falling corn prices and government subsidies. Estimated MY 2015/16 FSI consumption is
unchanged at 64 MMT. The government is subsidizing industrial corn use as a way to address excess
government stocks. The subsidies have increased from a current average RMB 28 per MT to RMB 40
per MT in the northeast, including, Heilongjiang and Inner Mongolia according to industry contacts.
Jilin Province is offering a much higher subsidy to processors of RMB 150 yuan per MT between
January and June 2016. The subsidies are paid for by provincial governments. Eligible processors use
corn as input material to produce starch, sweeteners and ethanol. Margins for corn processors have
already begun to improve due to lower corn prices and increased subsidies.
According to an industry contact, Sino Grain will liquidate an unspecified large quantity of aging corn
(MY 2012/13 crop) at RMB 1400 per MT in in the second quarter of 2016. Some industry analysts
estimate that over 20 MMT of corn reserves are so moldy or deteriorated that they are no longer suitable
for human consumption or feed use. Northeast provinces are lobbying the government to subsidize the
use of moldy grain for biofuel production. However, the central government has not indicated whether
it will consider expanding domestic E10 gasoline coverage to support higher ethanol production.
Trade MY 2016/17 corn imports are forecast at 1 MMT, 1.5 MMT lower than MY 2015/16. Falling corn
prices will make imports less profitable. The government has responded to excessive corn stocks by
aggressively promoting the consumption of domestic corn and tightening restrictions on imports.
Estimated MY 2015/16 corn imports are unchanged at 2.5 MMT as they are limited by the existing TRQ
system. Ukraine is still the number one supplier of corn to China due to its stated non-GMO production,
but the inconsistent quality of Ukrainian corn has been a challenge for importers. U.S. corn exports to
China are still small due to the perceived risk of importing U.S. corn following large scale rejections of
U.S. corn in 2014 by Chinese port officials.
MY 2016/17 exports are forecast at only 50,000 MT as Chinese corn is internationally uncompetitive
even with the lower prices. However, exports might increase if the government aggressively discounts
corn in state reserves to reduce stockpiles.
Marketing
Corn prices fell sharply in late 2015 after the government slashed the temporary reserve program price
for corn to 2,000 RMB per MT starting from November 2015 (procurement season). The market corn
price in Heilongjiang, Jilin, Liaoning, and Inner Mongolia fell below the temporary reserve price, to as
low as RMB 1750 yuan in 2015. Prices fell even lower in other corn-producing regions. MY 2015/16
temporary reserve purchases in northeast China exceeded 100 MMT by March 2016 according to news
reports. Industry analysts believe that discounted sales from state reserves may drive corn prices as
down to as low RMB 1,400 in summer 2016.
Stocks
MY 2016/17 stock forecasted at 103.4 MMT, down six MMT from MY 2015/16. Falling corn prices
and government subsidies to corn processors for buying domestic corn are expected to increase
consumption. If this drop is realized, it would be the first time that China’s corn stocks have decreased
in the last six years. Estimated MY 2015/16 corn stocks are lowered two MMT to 109.49 MMT. As
discussed above, the sudden drop in corn prices in the middle of MY2015/16 is expected to help
increase consumption and slow growth in stocks.
Rice
Production
MY 2016/17 rough rice production is forecast to remain flat at 208.3 MMT. The government continues
to prioritize and support rice production as part of its food security strategy as reiterated in the
Communist Party’s 2016 “No. 1 Document.” On February 2nd
, 2016, the government announced the
new rice floor prices for MY 2016/17. The floor price was lowered 1.5 percent for early indica rice
from RMB 2670 to RMB 2660 per MT. The floor price for mid-early indica and japonica rice was kept
at RMB 2760 and RMB 3100 respectively. By the end of February 2016, government MY2015/16 rice
procurement at minimum prices had reached a record of 32 MMT, including 2 MMT of early indica, 10
MMT of mid-late indica and 20 MMT of japonica rice across nine provinces. Estimated MY 2015/16
rice production is unchanged at 208.2 MMT.
Consumption
MY 2016/17 consumption is forecast at 147.4 MMT, down 600,000 MT from the revised MY 2015/16
estimate due to changing consumer behavior and the economic slowdown. Chinese consumers are
eating more meat and dairy and eating less rice, wheat and other staple grain. At the same time, rice
purchases by company cafeterias have been impacted by the closure of many labor intensive factories in
southern China. Use of rice in feed is expected to drop as well as smaller sized producers are going out
of business and large feed mills focus on other feed ingredients to minimize costs. These same factors
are causing rice consumption to stay flat in MY 2015/16. As a result, estimated MY 2015/16
consumption is revised down 2.3 MMT to 148 MMT, unchanged from MY2014/15.
Trade
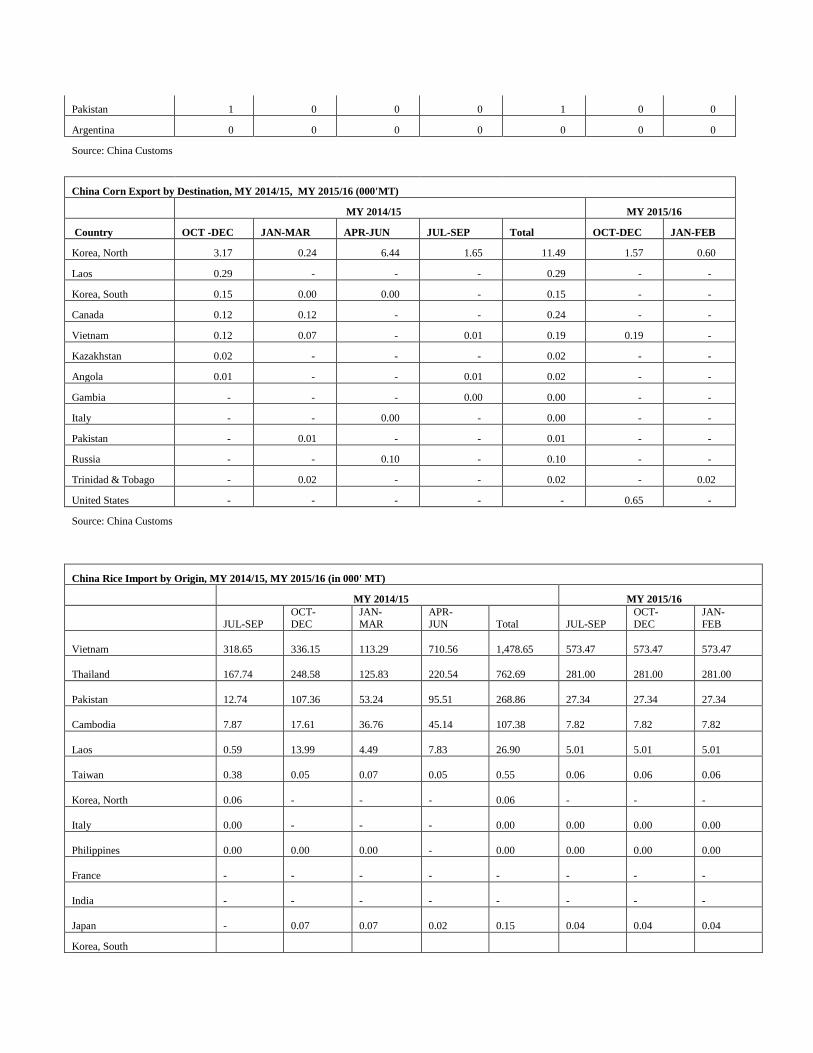
Rice imports are forecast to remain steady at five MMT in MY 2016/17. Estimated MY 2015/16 rice
imports are unchanged at 5 MMT. Low international rice prices and high support prices in China have
resulted in a large and consistent gap between domestic rice prices and prices in regional exporters, such
as Thailand and Vietnam. According to trade statistics, Thai 100% B rice averaged $382 per MT in fall
2015, while Chinese domestically produced rice of the same class averaged $440 to $450 per MT.
Vietnam 10 percent broken rice averaged $365 per MT in fall 2015, while domestically produced rice of
the same class sold at $405 to $417 MT.
In addition, Chinese rice processors are increasingly seeking high quality imported rice as the quality of
rice from state reserves can be inconsistent.
Both these trends have contributed to strong import demand. However, the government continues to
tightly monitor and control rice imports as part of its food security strategy to maintain self-sufficiency
in this politically sensitive crop. The government has tightened TRQ controls in an attempt to protect
domestic farmers from cheaper imports, including preventing the TRQ for japonica rice to be used to
import less expensive indica rice.
These conflicting pressures have made rice smuggling profitable in southwest China. Industry analysts
and contacts estimate that 1.2 to 1.5 MMT of rice were smuggled from Southeast Asian countries into
China in 2015. The central government has responded by carrying out targeted crackdowns on rice (and
sugar) smuggling in Yunnan, Guangxi and Guizhou provinces with assistance from local border
inspectors. The government publicized seizures of smuggled rice and claimed these operations have
significantly reduced rice smuggling. However, the large price gap makes halting smuggling a difficult
and long term challenge.
Marketing
The government continues to provide a floor price for domestic rice in major producing provinces. The
floor price system for rice is not likely to change significantly in the near term as maintaining self-
sufficiency in rice continues to be a high priority for the government. According to industry contacts
and reports, middle and late indica rice purchases under the program totaled 10.2 MMT and early indica
purchases totaled 2.1 MMT in MY 2015/16. Japonica rice purchases at minimum price totaled 20.1
MMT. Together, purchases of rice at minimum prices totaled 32 MMT, less than 16 percent of rice
produced, but 43 percent of rice procured by all kinds of enterprises.
Stocks
MY 2016/17 rice ending stocks are forecast at 52.9 MMT, up 2.9 MMT from MY 2015/16 as production
remains at record levels and import demand remains strong due to high support prices. Estimated MY
2015/16 ending stocks are raised 2.2 MMT to 50 MMT due to a lack of growth in demand.
Barley
Production
China’s MY 2016/17 barley production is forecast at 2 MMT, up 200,000 MT from MY 2015/16 due to
slightly higher acreage. A small portion of corn farmers are expected to switch to alternative crops such
as barley, sorghum, potatoes, and fodder crops as a result of lower corn prices and a crop adjustment
program launched by agricultural officials this year. Estimated MY 2015/16 barley production is raised
100,000 MT to 1.8 MMT based on stronger barley production estimates by CNGOIC.
Barley is only subsidized in a few provinces and it does not have a floor price. In most regions where
barley is grown, producers favor corn or wheat production over barley. With government reducing
subsidies to corn, this will cause some farmers to reconsider planting barley. A campaign to reduce corn
planting in marginal production regions will encourage planting alternative crops like barley over the
next few years.
Trade
MY 2016/17 imports are forecast at 6 MMT, down 900,000 MT from MY 2015/16 as falling corn prices
make barley less competitive as a feed ingredient. Estimated MY 2015/16 imports are also lowered
600,000 MT to 6.9 MMT due to the cancelation of the corn floor price. Falling corn prices have made
feed mills reconsider using corn rather than other feed substitute like sorghum and barley.
Beer production is expected to expand in the medium and long term as China continues to develop and
urbanize, which will expand the market for malting barley imports. China has no import quotas for
barley and the tariff is only three percent. Before 2012, the majority of imported barley was used for
brewing. Imports of barley for feed increased rapidly along with other feed substitutes such as sorghum,
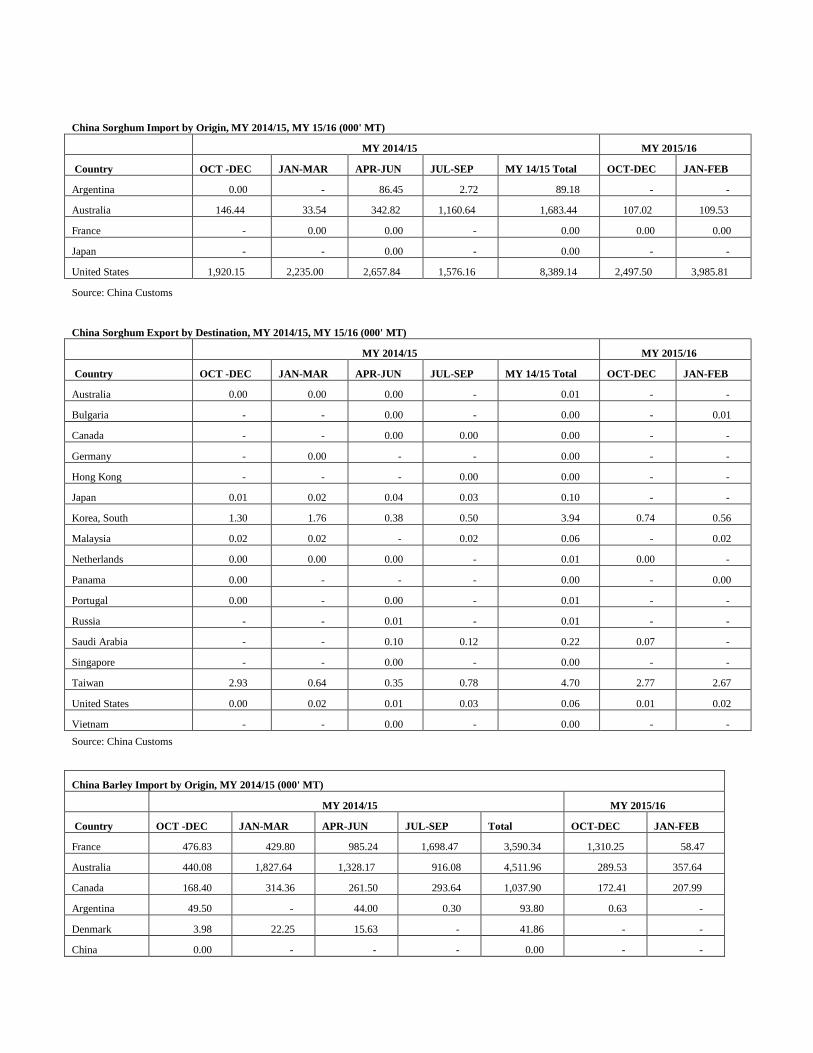
DDGs after 2012 as a result of high domestic corn prices. Australia and France are China’s largest
suppliers, accounting for 42 percent and 41 percent of imports in 2015 respectively.
Consumption
Barley consumption is forecast at 8.2 MMT in MY 2016/17, down 400,000 MT from MY 2015/16 due
to lower feed use and lower beer sales. Estimated MY 2015/16 barley consumption is lowered 700,000
MT to 8.6 MMT as falling corn prices slash feed demand and beer sales slow.
China is the world’s largest beer producer and consumer. Beer consumption has reached 34.7 liters per
capita, slightly over the world average of 33 liters per capita based on industry statistics. However, the
current economic slowdown is reducing household income and hurting beer consumption. Beer
production dropped 5.5 percent in 2015 to 51.81 MMT. Beer consumption is expected to remain weak
this year, but should recover and continue to grow in the medium term.
Sorghum
Production
MY 2016/17 sorghum production is forecast to expand slightly to 3.1 MMT, up 100,000 MT from MY
2015/16 on expanded acreage. A small portion of corn farmers are expected to switch to alternative
crops such as barley and sorghum as a result of the temporary reserve program for corn ending this year.
Industry analysts estimated in March 2016 that the average margin on sorghum was RMB 790 per mu
excluding land and labor costs, while the margin on corn production was RMB 725 per mu excluding
land and labor. Based on their estimated costs and corn prices after the recent policy change the profit
margin on corn would fall to RMB 425 per mu excluding land and labor. While this calculation would
suggest corn farmers would quickly switch to sorghum, only a small portion of them are expected to do
so. The market for corn is larger and more developed than sorghum markets, making corn easier to sell.
In addition, transportation costs make sorghum produced in the northeast uncompetitive in southern
China.
Estimated MY 2015/16 sorghum production is raised 100,000 MT to three MMT based on higher
estimated yields by CNGOIC.
Consumption
MY 2016/17 sorghum total consumption is forecast at 8.26 MMT, one MMT lower than in MY 2015/16
as falling corn prices hurt feed demand for sorghum. Feed mills are reacting to lower corn prices by
reducing usage of alternative ingredients such as sorghum. If the government starts to aggressively
discount its excess corn reserves as expected, more feed mills will start to switch to corn. Estimated MY
2015/16 sorghum consumption is lowered 750,000 MT to 9.25 MMT on lower feed demand. Feed mills
are still using imported sorghum from their stock, but sorghum feed use is expected to drop significantly
in the remaining six months of MY 2015/16.
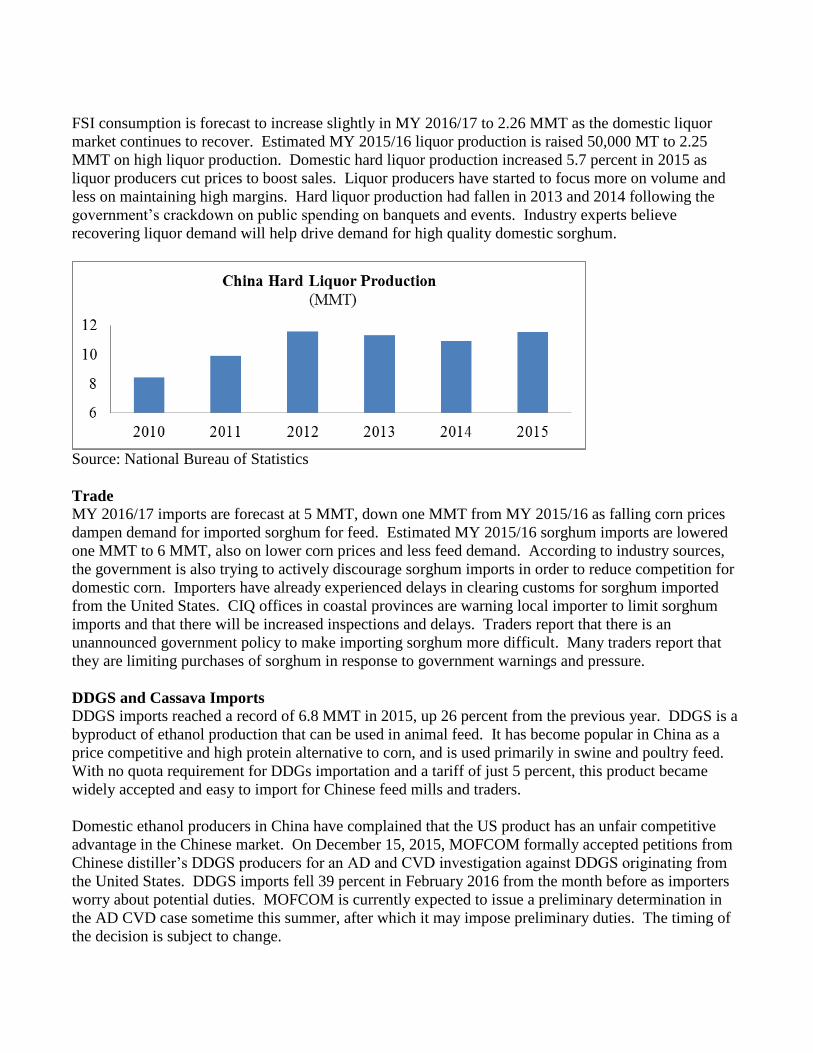
FSI consumption is forecast to increase slightly in MY 2016/17 to 2.26 MMT as the domestic liquor
market continues to recover. Estimated MY 2015/16 liquor production is raised 50,000 MT to 2.25
MMT on high liquor production. Domestic hard liquor production increased 5.7 percent in 2015 as
liquor producers cut prices to boost sales. Liquor producers have started to focus more on volume and
less on maintaining high margins. Hard liquor production had fallen in 2013 and 2014 following the
government’s crackdown on public spending on banquets and events. Industry experts believe
recovering liquor demand will help drive demand for high quality domestic sorghum.
Source: National Bureau of Statistics
Trade
MY 2016/17 imports are forecast at 5 MMT, down one MMT from MY 2015/16 as falling corn prices
dampen demand for imported sorghum for feed. Estimated MY 2015/16 sorghum imports are lowered
one MMT to 6 MMT, also on lower corn prices and less feed demand. According to industry sources,
the government is also trying to actively discourage sorghum imports in order to reduce competition for
domestic corn. Importers have already experienced delays in clearing customs for sorghum imported
from the United States. CIQ offices in coastal provinces are warning local importer to limit sorghum
imports and that there will be increased inspections and delays. Traders report that there is an
unannounced government policy to make importing sorghum more difficult. Many traders report that
they are limiting purchases of sorghum in response to government warnings and pressure.
DDGS and Cassava Imports
DDGS imports reached a record of 6.8 MMT in 2015, up 26 percent from the previous year. DDGS is a
byproduct of ethanol production that can be used in animal feed. It has become popular in China as a
price competitive and high protein alternative to corn, and is used primarily in swine and poultry feed.
With no quota requirement for DDGs importation and a tariff of just 5 percent, this product became
widely accepted and easy to import for Chinese feed mills and traders.
Domestic ethanol producers in China have complained that the US product has an unfair competitive
advantage in the Chinese market. On December 15, 2015, MOFCOM formally accepted petitions from
Chinese distiller’s DDGS producers for an AD and CVD investigation against DDGS originating from
the United States. DDGS imports fell 39 percent in February 2016 from the month before as importers
worry about potential duties. MOFCOM is currently expected to issue a preliminary determination in
the AD CVD case sometime this summer, after which it may impose preliminary duties. The timing of
the decision is subject to change.
Cassava imports reached a record 9.37 MMT in 2015, up 8.3 percent from the previous year. Industry
sources estimate that 55~65 percent of imported cassava is used for ethanol production, starch and
animal feed. Cassava imports are expected to continue to expand in 2016, but growth will be limited
due to falling corn prices.
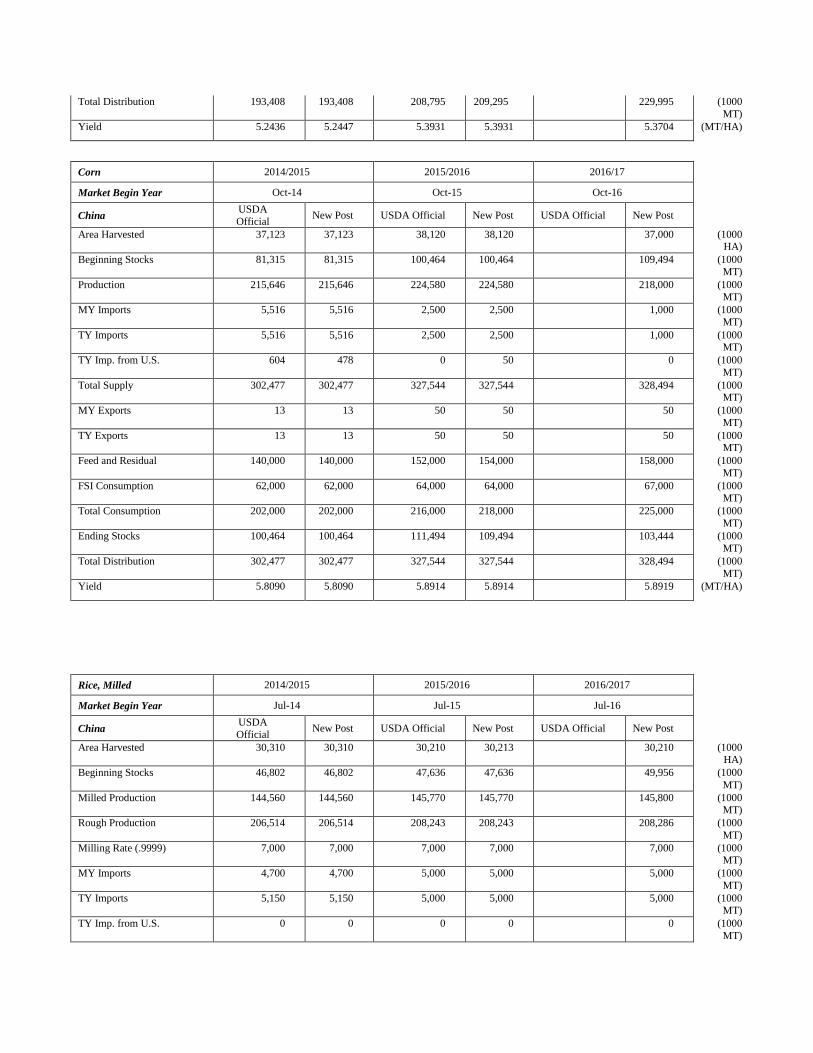
Wheat 2014/2015 2015/2016 2016/2017
Market Begin Year Jul-14 Jul-15 Jul-16
China USDA
Official New Post USDA Official New Post USDA Official New Post
Area Harvested 24,069 24,064 24,140 24,140 24,300 (1000 HA)
Beginning Stocks 65,274 65,274 76,105 76,105 96,295 (1000
MT)
Production 126,208 126,208 130,190 130,190 130,500 (1000 MT)
MY Imports 1,926 1,926 2,500 3,000 3,200 (1000
MT)
TY Imports 1,926 1,926 2,500 3,000 3,200 (1000 MT)
TY Imp. from U.S. 326 326 0 300 400 (1000
MT)
Total Supply 193,408 193,408 208,795 209,295 229,995 (1000 MT)
MY Exports 803 803 1,000 1,000 1,000 (1000
MT)
TY Exports 803 803 1,000 1,000 1,000 (1000 MT)
Feed and Residual 16,000 16,000 12,000 10,500 9,500 (1000
MT)
FSI Consumption 100,500 100,500 102,000 101,500 101,000 (1000 MT)
Total Consumption 116,500 116,500 114,000 112,000 110,500 (1000
MT)
Ending Stocks 76,105 76,105 93,795 96,295 118,495 (1000 MT)
Total Distribution 193,408 193,408 208,795 209,295 229,995 (1000
MT)
Yield 5.2436 5.2447 5.3931 5.3931 5.3704 (MT/HA)
Corn 2014/2015 2015/2016 2016/17
Market Begin Year Oct-14 Oct-15 Oct-16
China USDA
Official New Post USDA Official New Post USDA Official New Post
Area Harvested 37,123 37,123 38,120 38,120 37,000 (1000 HA)
Beginning Stocks 81,315 81,315 100,464 100,464 109,494 (1000
MT)
Production 215,646 215,646 224,580 224,580 218,000 (1000 MT)
MY Imports 5,516 5,516 2,500 2,500 1,000 (1000
MT)
TY Imports 5,516 5,516 2,500 2,500 1,000 (1000 MT)
TY Imp. from U.S. 604 478 0 50 0 (1000
MT)
Total Supply 302,477 302,477 327,544 327,544 328,494 (1000 MT)
MY Exports 13 13 50 50 50 (1000
MT)
TY Exports 13 13 50 50 50 (1000 MT)
Feed and Residual 140,000 140,000 152,000 154,000 158,000 (1000
MT)
FSI Consumption 62,000 62,000 64,000 64,000 67,000 (1000 MT)
Total Consumption 202,000 202,000 216,000 218,000 225,000 (1000
MT)
Ending Stocks 100,464 100,464 111,494 109,494 103,444 (1000
MT)
Total Distribution 302,477 302,477 327,544 327,544 328,494 (1000
MT)
Yield 5.8090 5.8090 5.8914 5.8914 5.8919 (MT/HA)
Rice, Milled 2014/2015 2015/2016 2016/2017
Market Begin Year Jul-14 Jul-15 Jul-16
China USDA
Official New Post USDA Official New Post USDA Official New Post
Area Harvested 30,310 30,310 30,210 30,213 30,210 (1000 HA)
Beginning Stocks 46,802 46,802 47,636 47,636 49,956 (1000
MT)
Milled Production 144,560 144,560 145,770 145,770 145,800 (1000 MT)
Rough Production 206,514 206,514 208,243 208,243 208,286 (1000
MT)
Milling Rate (.9999) 7,000 7,000 7,000 7,000 7,000 (1000 MT)
MY Imports 4,700 4,700 5,000 5,000 5,000 (1000
MT)
TY Imports 5,150 5,150 5,000 5,000 5,000 (1000
MT)
TY Imp. from U.S. 0 0 0 0 0 (1000
MT)
Total Supply 196,062 196,062 198,406 198,406 200,756 (1000
MT)
MY Exports 426 426 350 450 450 (1000
MT)
TY Exports 262 300 350 450 450 (1000
MT)
Consumption and
Residual
148,000 148,000 150,300 148,000 147,400 (1000
MT)
Ending Stocks 47,636 47,636 47,756 49,956 52,906 (1000
MT)
Total Distribution 196,062 196,062 198,406 198,406 200,756 (1000
MT)
Yield (Rough) 6.8134 6.8134 6.8932 6.8932 6.8946 (MT/HA)
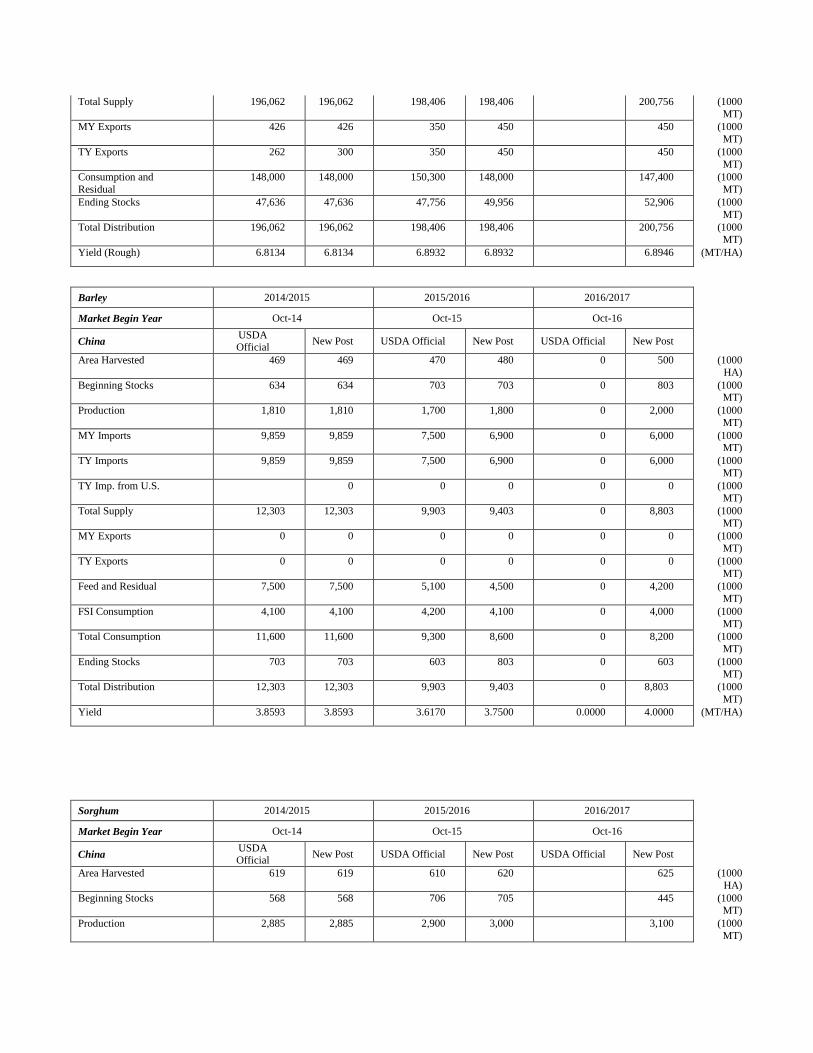
Barley 2014/2015 2015/2016 2016/2017
Market Begin Year Oct-14 Oct-15 Oct-16
China USDA Official
New Post USDA Official New Post USDA Official New Post
Area Harvested 469 469 470 480 0 500 (1000
HA)
Beginning Stocks 634 634 703 703 0 803 (1000 MT)
Production 1,810 1,810 1,700 1,800 0 2,000 (1000
MT)
MY Imports 9,859 9,859 7,500 6,900 0 6,000 (1000 MT)
TY Imports 9,859 9,859 7,500 6,900 0 6,000 (1000
MT)
TY Imp. from U.S. 0 0 0 0 0 (1000 MT)
Total Supply 12,303 12,303 9,903 9,403 0 8,803 (1000
MT)
MY Exports 0 0 0 0 0 0 (1000
MT)
TY Exports 0 0 0 0 0 0 (1000
MT)
Feed and Residual 7,500 7,500 5,100 4,500 0 4,200 (1000
MT)
FSI Consumption 4,100 4,100 4,200 4,100 0 4,000 (1000
MT)
Total Consumption 11,600 11,600 9,300 8,600 0 8,200 (1000
MT)
Ending Stocks 703 703 603 803 0 603 (1000
MT)
Total Distribution 12,303 12,303 9,903 9,403 0 8,803 (1000
MT)
Yield 3.8593 3.8593 3.6170 3.7500 0.0000 4.0000 (MT/HA)
Sorghum 2014/2015 2015/2016 2016/2017
Market Begin Year Oct-14 Oct-15 Oct-16
China USDA Official
New Post USDA Official New Post USDA Official New Post
Area Harvested 619 619 610 620 625 (1000
HA)
Beginning Stocks 568 568 706 705 445 (1000
MT)
Production 2,885 2,885 2,900 3,000 3,100 (1000
MT)
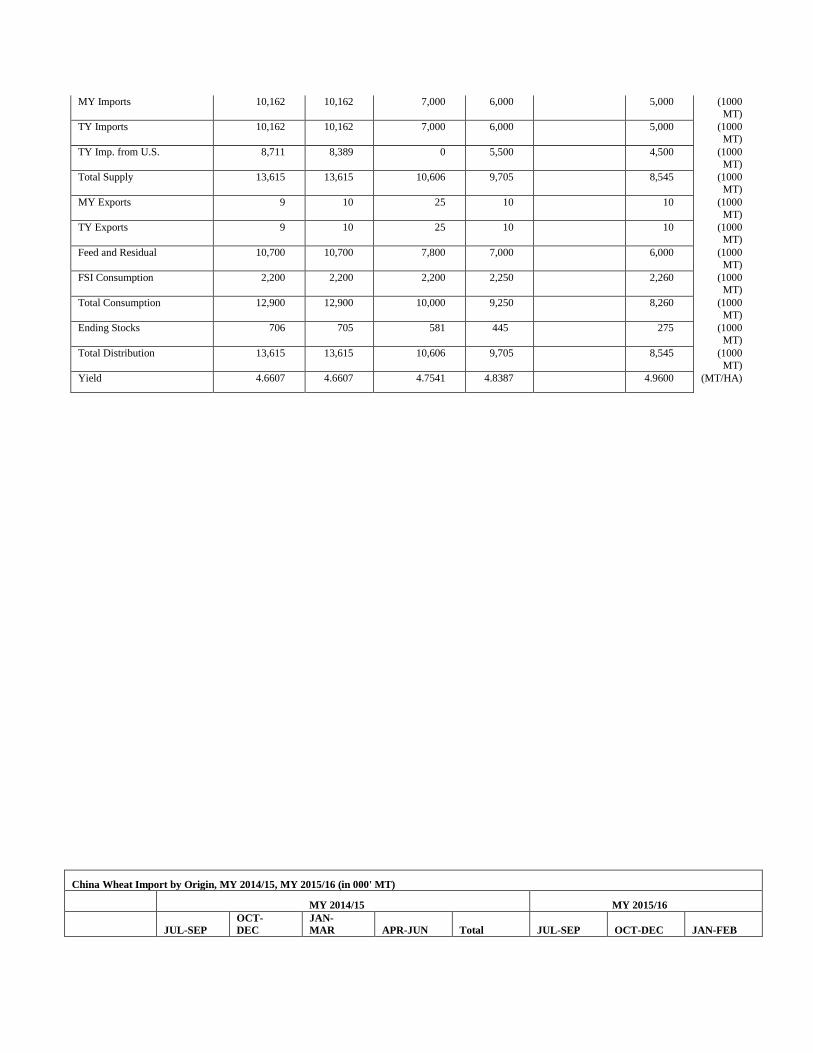
MY Imports 10,162 10,162 7,000 6,000 5,000 (1000
MT)
TY Imports 10,162 10,162 7,000 6,000 5,000 (1000
MT)
TY Imp. from U.S. 8,711 8,389 0 5,500 4,500 (1000
MT)
Total Supply 13,615 13,615 10,606 9,705 8,545 (1000
MT)
MY Exports 9 10 25 10 10 (1000
MT)
TY Exports 9 10 25 10 10 (1000
MT)
Feed and Residual 10,700 10,700 7,800 7,000 6,000 (1000
MT)
FSI Consumption 2,200 2,200 2,200 2,250 2,260 (1000
MT)
Total Consumption 12,900 12,900 10,000 9,250 8,260 (1000
MT)
Ending Stocks 706 705 581 445 275 (1000
MT)
Total Distribution 13,615 13,615 10,606 9,705 8,545 (1000
MT)
Yield 4.6607 4.6607 4.7541 4.8387 4.9600 (MT/HA)
China Wheat Import by Origin, MY 2014/15, MY 2015/16 (in 000' MT)
MY 2014/15 MY 2015/16
JUL-SEP
OCT-
DEC
JAN-
MAR APR-JUN Total JUL-SEP OCT-DEC JAN-FEB
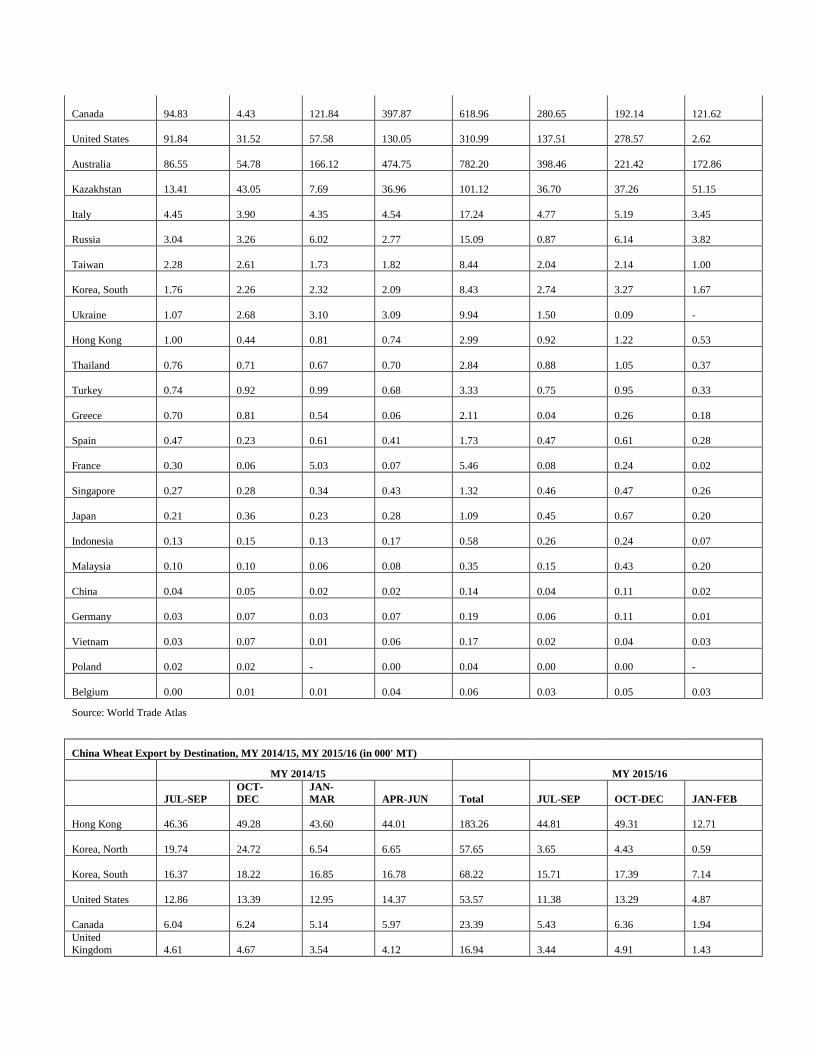
Canada
94.83
4.43
121.84
397.87
618.96
280.65
192.14
121.62
United States
91.84
31.52
57.58
130.05
310.99
137.51
278.57
2.62
Australia
86.55
54.78
166.12
474.75
782.20
398.46
221.42
172.86
Kazakhstan
13.41
43.05
7.69
36.96
101.12
36.70
37.26
51.15
Italy
4.45
3.90
4.35
4.54
17.24
4.77
5.19
3.45
Russia
3.04
3.26
6.02
2.77
15.09
0.87
6.14
3.82
Taiwan
2.28
2.61
1.73
1.82
8.44
2.04
2.14
1.00
Korea, South
1.76
2.26
2.32
2.09
8.43
2.74
3.27
1.67
Ukraine
1.07
2.68
3.10
3.09
9.94
1.50
0.09
-
Hong Kong
1.00
0.44
0.81
0.74
2.99
0.92
1.22
0.53
Thailand
0.76
0.71
0.67
0.70
2.84
0.88
1.05
0.37
Turkey
0.74
0.92
0.99
0.68
3.33
0.75
0.95
0.33
Greece
0.70
0.81
0.54
0.06
2.11
0.04
0.26
0.18
Spain
0.47
0.23
0.61
0.41
1.73
0.47
0.61
0.28
France 0.30
0.06
5.03
0.07
5.46
0.08
0.24
0.02
Singapore
0.27
0.28
0.34
0.43
1.32
0.46
0.47
0.26
Japan 0.21
0.36
0.23
0.28
1.09
0.45
0.67
0.20
Indonesia
0.13
0.15
0.13
0.17
0.58
0.26
0.24
0.07
Malaysia 0.10
0.10
0.06
0.08
0.35
0.15
0.43
0.20
China
0.04
0.05
0.02
0.02
0.14
0.04
0.11
0.02
Germany 0.03
0.07
0.03
0.07
0.19
0.06
0.11
0.01
Vietnam
0.03
0.07
0.01
0.06
0.17
0.02
0.04
0.03
Poland 0.02
0.02
-
0.00
0.04
0.00
0.00
-
Belgium
0.00
0.01
0.01
0.04
0.06
0.03
0.05
0.03
Source: World Trade Atlas
China Wheat Export by Destination, MY 2014/15, MY 2015/16 (in 000' MT)
MY 2014/15 MY 2015/16
JUL-SEP
OCT-
DEC
JAN-
MAR APR-JUN Total JUL-SEP OCT-DEC JAN-FEB
Hong Kong 46.36
49.28
43.60
44.01
183.26
44.81
49.31
12.71
Korea, North
19.74
24.72
6.54
6.65
57.65
3.65
4.43
0.59
Korea, South 16.37
18.22
16.85
16.78
68.22
15.71
17.39
7.14
United States
12.86
13.39
12.95
14.37
53.57
11.38
13.29
4.87
Canada 6.04
6.24
5.14
5.97
23.39
5.43
6.36
1.94
United
Kingdom
4.61
4.67
3.54
4.12
16.94
3.44
4.91
1.43
Japan
4.61
4.13
4.17
4.38
17.28
4.16
4.18
1.38
Malaysia
4.01
4.41
3.05
4.45
15.92
5.88
3.50
1.27
Germany
3.21
4.19
2.87
4.14
14.41
3.26
4.30
1.08
Netherlands
3.12
3.22
2.16
3.52
12.02
2.80
2.97
0.80
Australia
2.88
2.65
2.48
2.50
10.50
2.32
2.55
0.97
South Africa
2.81
2.20
1.87
1.30
8.18
2.50
1.97
0.42
Philippines
2.36
3.49
2.13
2.36
10.33
3.08
3.21
0.91
Macau
2.29
2.22
1.94
2.08
8.54
2.27
2.24
0.67
Russia
1.94
2.01
1.06
1.61
6.63
1.42
1.70
0.54
Indonesia
1.79
2.55
0.91
1.64
6.89
1.59
1.62
0.42
Vietnam
1.58
1.17
1.51
1.06
5.32
1.75
1.17
0.54
Taiwan
1.42
1.28
0.90
1.10
4.70
1.28
1.34
0.58
France
1.35
2.13
1.87
1.69
7.04
1.21
1.94
0.57
Mongolia
1.26
0.78
1.07
0.93
4.05
1.07
0.77
0.35
Singapore 1.12
1.10
0.99
1.11
4.31
0.94
1.04
0.36
Thailand
0.98
1.16
1.50
1.08
4.71
1.13
1.72
0.31
Pakistan 0.91
1.12
0.03
-
2.05
-
0.00
-
Sweden
0.75
0.88
0.75
0.94
3.33
0.84
0.95
0.20
Solomon Islands
0.73
1.01
0.76
0.72
3.23
1.17
0.69
0.11
Italy
0.68
0.62
0.51
0.77
2.59
0.57
0.70
0.34
Myanmar 0.66
0.77
0.44
0.52
2.39
0.41
0.71
0.17
Kazakhstan
0.58
0.35
0.53
0.52
1.98
0.39
0.55
0.15
New Zealand 0.55
0.53
0.42
0.48
1.98
0.55
0.51
0.20
Source: China Customs
China Corn Import by Origin, MY 2014/15 (000' MT)
MY 2014/15 MY 2015/16
Country OCT -DEC JAN-MAR APR-JUN JUL-SEP Total OCT-DEC JAN-FEB
Ukraine 553 1,080 1,241 1,531 Total 0 53
Bulgaria 128 97 44 9 278 10 0
Thailand 111 0 0 0 111 0 0
Laos 83 6 6 12 106 102 4
United States 52 37 64 325 478 36 2
Myanmar 30 0 13 2 46 33 2
Russia 18 13 50 5 86 14 11
India 3 0 0 0 3 0 0
Pakistan 1 0 0 0 1 0 0
Argentina 0 0 0 0 0 0 0
Source: China Customs
China Corn Export by Destination, MY 2014/15, MY 2015/16 (000'MT)
MY 2014/15 MY 2015/16
Country OCT -DEC JAN-MAR APR-JUN JUL-SEP Total OCT-DEC JAN-FEB
Korea, North 3.17 0.24 6.44 1.65 11.49 1.57 0.60
Laos 0.29 - - - 0.29 - -
Korea, South 0.15 0.00 0.00 - 0.15 - -
Canada 0.12 0.12 - - 0.24 - -
Vietnam 0.12 0.07 - 0.01 0.19 0.19 -
Kazakhstan 0.02 - - - 0.02 - -
Angola 0.01 - - 0.01 0.02 - -
Gambia - - - 0.00 0.00 - -
Italy - - 0.00 - 0.00 - -
Pakistan - 0.01 - - 0.01 - -
Russia - - 0.10 - 0.10 - -
Trinidad & Tobago - 0.02 - - 0.02 - 0.02
United States - - - - - 0.65 -
Source: China Customs
China Rice Import by Origin, MY 2014/15, MY 2015/16 (in 000' MT)
MY 2014/15 MY 2015/16
JUL-SEP OCT-DEC
JAN-MAR
APR-JUN Total JUL-SEP
OCT-DEC
JAN-FEB
Vietnam
318.65
336.15
113.29
710.56
1,478.65
573.47
573.47
573.47
Thailand 167.74
248.58
125.83
220.54
762.69
281.00
281.00
281.00
Pakistan
12.74
107.36
53.24
95.51
268.86
27.34
27.34
27.34
Cambodia 7.87
17.61
36.76
45.14
107.38
7.82
7.82
7.82
Laos
0.59
13.99
4.49
7.83
26.90
5.01
5.01
5.01
Taiwan 0.38
0.05
0.07
0.05
0.55
0.06
0.06
0.06
Korea, North
0.06
-
-
-
0.06
-
-
-
Italy 0.00
-
-
-
0.00
0.00
0.00
0.00
Philippines
0.00
0.00
0.00
-
0.00
0.00
0.00
0.00
France -
-
-
-
-
-
-
-
India
-
-
-
-
-
-
-
-
Japan
-
0.07
0.07
0.02
0.15
0.04
0.04
0.04
Korea, South
- - - - - - - -
Myanmar
-
5.26
-
2.65
7.90
3.21
3.21
3.21
New Zealand -
-
-
-
-
-
-
-
Russia
-
0.99
0.10
0.10
1.18
-
-
-
Source: China Customs
China Rice Exports by Destination, MY 2014/15, MY 2015/16 (in 000' MT)
MY 2014/15 MY 2015/16
JUL-SEP
OCT-
DEC
JAN-
MAR
APR-
JUN Total JUL-SEP
OCT-
DEC
JAN-
FEB
Korea, North 41.26
8.80
0.37
3.50
53.93
8.41
4.85
0.37
Korea, South
36.54
172.38
2.15
52.90
263.97
68.50
39.53
5.00
Mongolia 7.36
5.61
1.70
6.81
21.47
3.79
4.36
0.35
Hong Kong
6.24
5.36
5.18
5.69
22.47
4.74
5.63
2.39
Russia 2.09
2.46
0.10
0.97
5.62
0.80
0.98
-
Philippines
1.17
2.14
1.00
2.52
6.82
1.23
4.90
-
Vietnam 1.05
7.51
0.24
0.74
9.55
0.05
6.18
0.03
South Sudan
1.01
1.06
-
-
2.07
-
-
1.70
Kyrgyzstan 0.52
0.47
0.22
0.25
1.47
0.06
-
-
Bangladesh
0.29
0.84
0.08
0.01
1.22
0.25
0.50
-
Solomon Islands
0.21
-
-
-
0.21
-
-
-
Canada
0.20
0.41
0.33
0.13
1.06
0.14
0.19
0.02
Macau
0.12
0.26
0.10
0.02
0.49
-
0.06
0.04
Vanuatu
0.11
-
0.04
-
0.14
-
-
-
Marshall Islands
0.11
0.05
0.03
-
0.18
-
-
-
Micronesia (Federated States
of)
0.08
0.03
0.03
-
0.13
-
-
-
Puerto Rico (U.S.)
0.08
0.04
-
-
0.12
0.02
-
-
United States
0.08
0.28
0.54
0.38
1.27
0.22
0.30
0.04
Angola
0.06
0.03
0.04
-
0.14
-
0.03
-
Iran
0.05
0.02
-
0.00
0.07
-
-
-
Turkey
0.05
0.15
0.10
-
0.30
-
-
-
South Africa
0.03
0.08
-
0.00
0.10
-
-
-
Grenada
0.01
0.01
-
-
0.01
-
-
-
Indonesia 0.01
0.52
0.05
0.01
0.57
0.18
0.36
-
Japan
-
24.30
24.00
0.48
48.78
-
12.00
12.00
Source: China Customs
China Sorghum Import by Origin, MY 2014/15, MY 15/16 (000' MT)
MY 2014/15 MY 2015/16
Country OCT -DEC JAN-MAR APR-JUN JUL-SEP MY 14/15 Total OCT-DEC JAN-FEB
Argentina 0.00 - 86.45 2.72 89.18 - -
Australia 146.44 33.54 342.82 1,160.64 1,683.44 107.02 109.53
France - 0.00 0.00 - 0.00 0.00 0.00
Japan - - 0.00 - 0.00 - -
United States 1,920.15 2,235.00 2,657.84 1,576.16 8,389.14 2,497.50 3,985.81
Source: China Customs
China Sorghum Export by Destination, MY 2014/15, MY 15/16 (000' MT)
MY 2014/15 MY 2015/16
Country OCT -DEC JAN-MAR APR-JUN JUL-SEP MY 14/15 Total OCT-DEC JAN-FEB
Australia 0.00 0.00 0.00 - 0.01 - -
Bulgaria - - 0.00 - 0.00 - 0.01
Canada - - 0.00 0.00 0.00 - -
Germany - 0.00 - - 0.00 - -
Hong Kong - - - 0.00 0.00 - -
Japan 0.01 0.02 0.04 0.03 0.10 - -
Korea, South 1.30 1.76 0.38 0.50 3.94 0.74 0.56
Malaysia 0.02 0.02 - 0.02 0.06 - 0.02
Netherlands 0.00 0.00 0.00 - 0.01 0.00 -
Panama 0.00 - - - 0.00 - 0.00
Portugal 0.00 - 0.00 - 0.01 - -
Russia - - 0.01 - 0.01 - -
Saudi Arabia - - 0.10 0.12 0.22 0.07 -
Singapore - - 0.00 - 0.00 - -
Taiwan 2.93 0.64 0.35 0.78 4.70 2.77 2.67
United States 0.00 0.02 0.01 0.03 0.06 0.01 0.02
Vietnam - - 0.00 - 0.00 - -
Source: China Customs
China Barley Import by Origin, MY 2014/15 (000' MT)
MY 2014/15 MY 2015/16
Country OCT -DEC JAN-MAR APR-JUN JUL-SEP Total OCT-DEC JAN-FEB
France 476.83 429.80 985.24 1,698.47 3,590.34 1,310.25 58.47
Australia 440.08 1,827.64 1,328.17 916.08 4,511.96 289.53 357.64
Canada 168.40 314.36 261.50 293.64 1,037.90 172.41 207.99
Argentina 49.50 - 44.00 0.30 93.80 0.63 -
Denmark 3.98 22.25 15.63 - 41.86 - -
China 0.00 - - - 0.00 - -
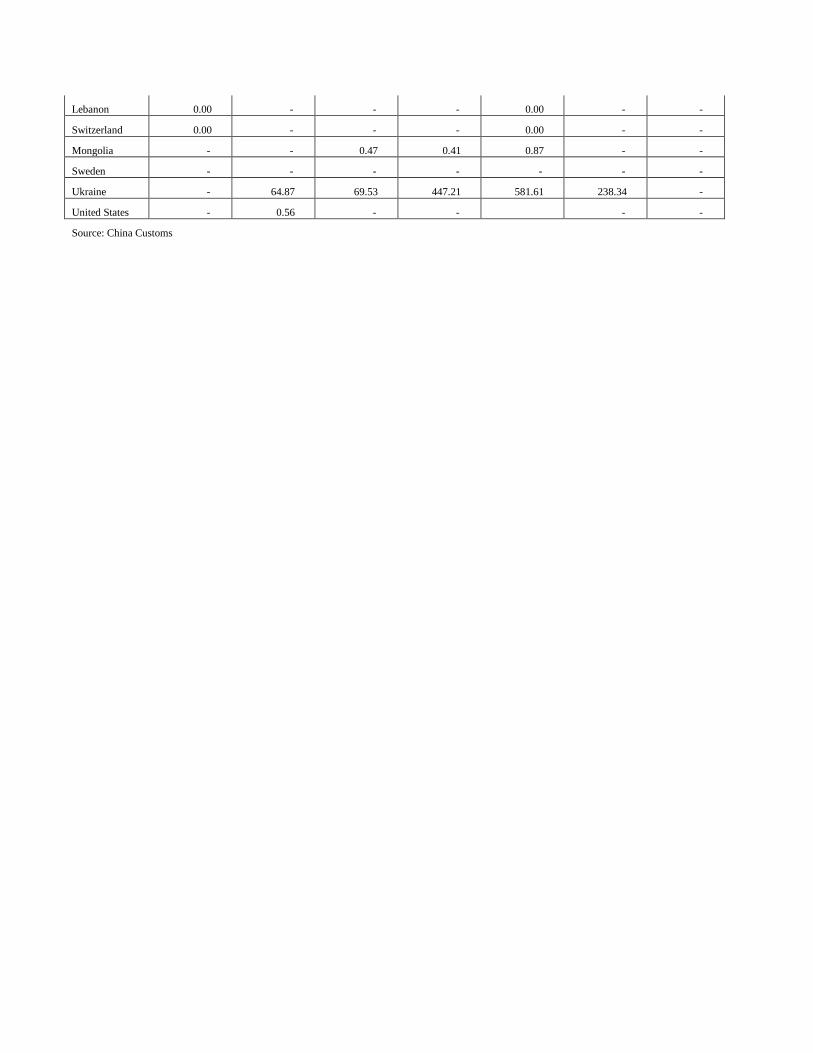
Lebanon 0.00 - - - 0.00 - -
Switzerland 0.00 - - - 0.00 - -
Mongolia - - 0.47 0.41 0.87 - -
Sweden - - - - - - -
Ukraine - 64.87 69.53 447.21 581.61 238.34 -
United States - 0.56 - - - -
Source: China Customs