Embed Size (px)
Citation preview
Donald [email protected]
August 12, 2019
China Research
China -- Ongoing Hong Kong Negatives; Currency Down
Donald [email protected]
310.473.40518/12/2019
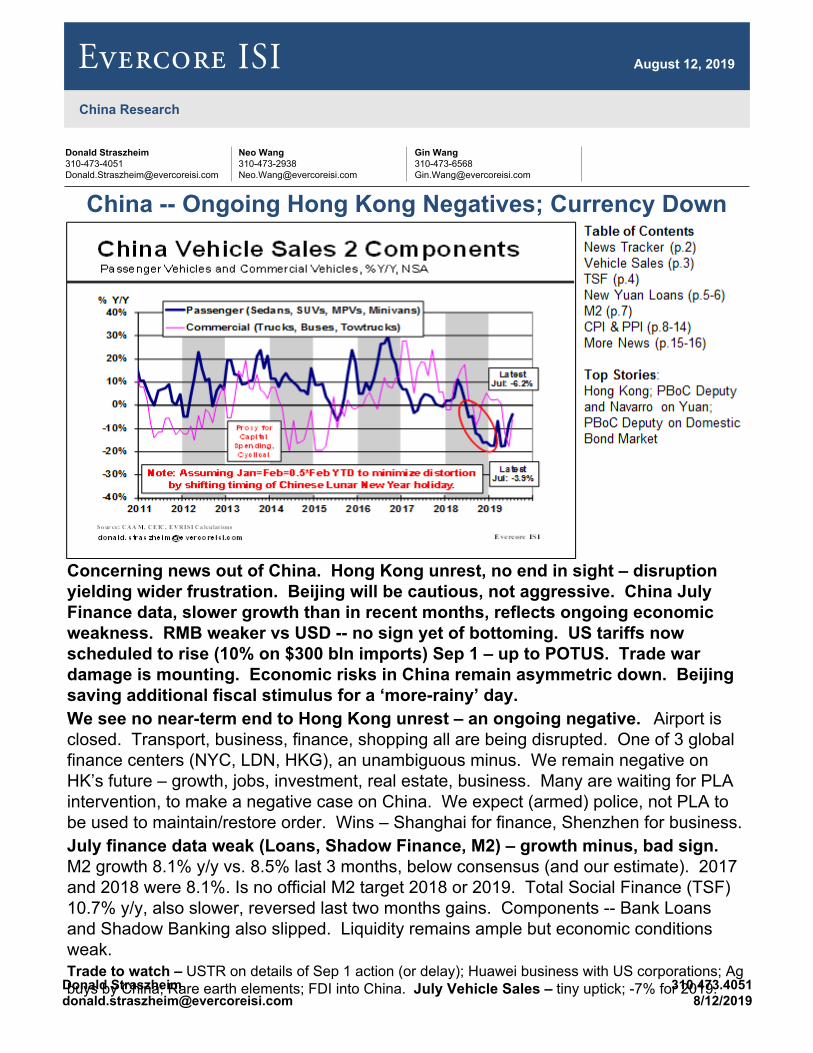
Concerning news out of China. Hong Kong unrest, no end in sight – disruption yielding wider frustration. Beijing will be cautious, not aggressive. China July Finance data, slower growth than in recent months, reflects ongoing economic weakness. RMB weaker vs USD -- no sign yet of bottoming. US tariffs now scheduled to rise (10% on $300 bln imports) Sep 1 – up to POTUS. Trade war damage is mounting. Economic risks in China remain asymmetric down. Beijing saving additional fiscal stimulus for a ‘more-rainy’ day.We see no near-term end to Hong Kong unrest – an ongoing negative. Airport is closed. Transport, business, finance, shopping all are being disrupted. One of 3 global finance centers (NYC, LDN, HKG), an unambiguous minus. We remain negative on HK’s future – growth, jobs, investment, real estate, business. Many are waiting for PLA intervention, to make a negative case on China. We expect (armed) police, not PLA to be used to maintain/restore order. Wins – Shanghai for finance, Shenzhen for business. July finance data weak (Loans, Shadow Finance, M2) – growth minus, bad sign. M2 growth 8.1% y/y vs. 8.5% last 3 months, below consensus (and our estimate). 2017 and 2018 were 8.1%. Is no official M2 target 2018 or 2019. Total Social Finance (TSF) 10.7% y/y, also slower, reversed last two months gains. Components -- Bank Loans and Shadow Banking also slipped. Liquidity remains ample but economic conditions weak.Trade to watch – USTR on details of Sep 1 action (or delay); Huawei business with US corporations; Ag buys by China; Rare earth elements; FDI into China. July Vehicle Sales – tiny uptick; -7% for 2019.
News Tracker – Aug 12, 20192EVERCORE ISI China Research
Donald [email protected]
310.473.40518/12/2019
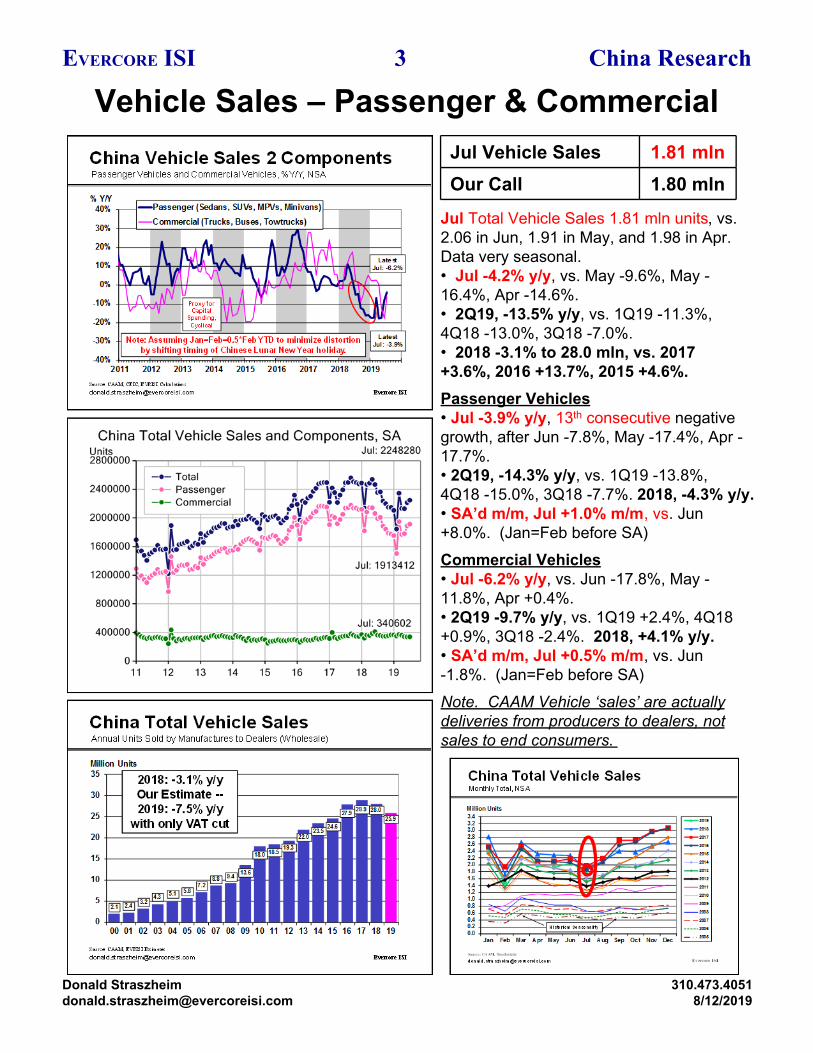
Jul Total Vehicle Sales 1.81 mln units, vs. 2.06 in Jun, 1.91 in May, and 1.98 in Apr. Data very seasonal.• Jul -4.2% y/y, vs. May -9.6%, May -16.4%, Apr -14.6%.• 2Q19, -13.5% y/y, vs. 1Q19 -11.3%, 4Q18 -13.0%, 3Q18 -7.0%.• 2018 -3.1% to 28.0 mln, vs. 2017 +3.6%, 2016 +13.7%, 2015 +4.6%. Passenger Vehicles• Jul -3.9% y/y, 13th consecutive negative growth, after Jun -7.8%, May -17.4%, Apr -17.7%. • 2Q19, -14.3% y/y, vs. 1Q19 -13.8%, 4Q18 -15.0%, 3Q18 -7.7%. 2018, -4.3% y/y.• SA’d m/m, Jul +1.0% m/m, vs. Jun +8.0%. (Jan=Feb before SA)Commercial Vehicles• Jul -6.2% y/y, vs. Jun -17.8%, May -11.8%, Apr +0.4%.• 2Q19 -9.7% y/y, vs. 1Q19 +2.4%, 4Q18 +0.9%, 3Q18 -2.4%. 2018, +4.1% y/y.• SA’d m/m, Jul +0.5% m/m, vs. Jun -1.8%. (Jan=Feb before SA)Note. CAAM Vehicle ‘sales’ are actually deliveries from producers to dealers, not sales to end consumers.
Jul Vehicle Sales 1.81 mlnOur Call 1.80 mln
Vehicle Sales – Passenger & Commercial3EVERCORE ISI China Research
Donald [email protected]
310.473.40518/12/2019
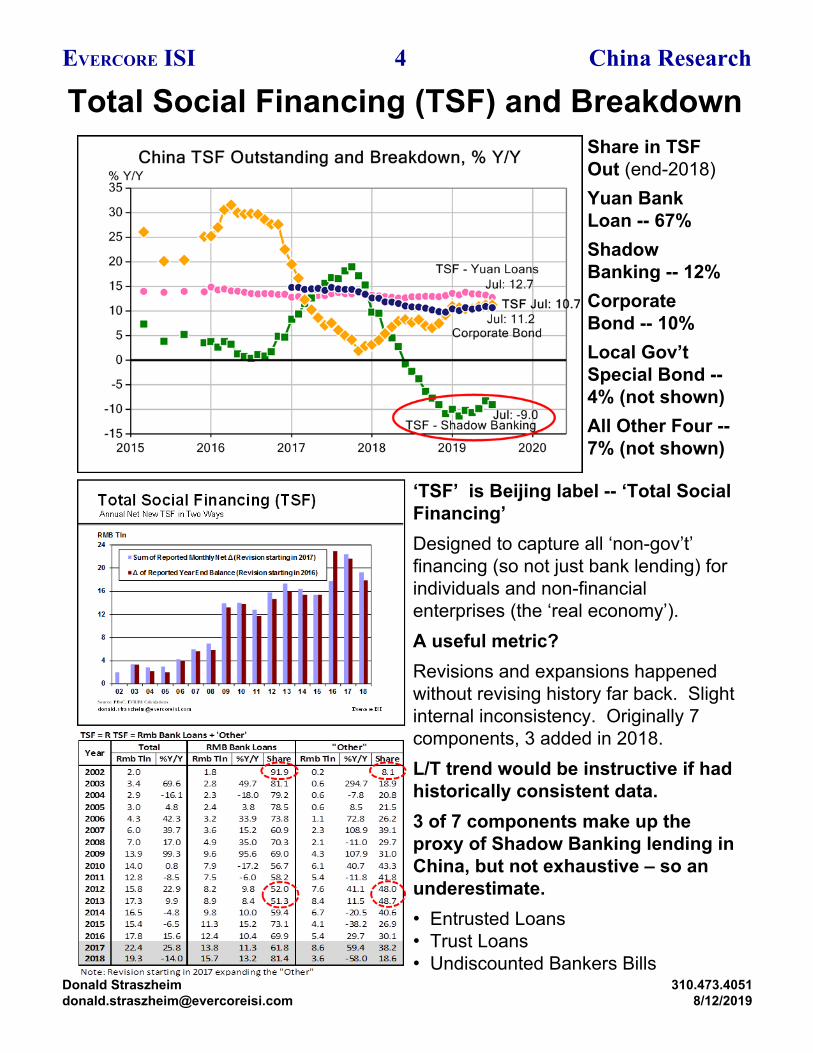
Total Social Financing (TSF) and Breakdown
‘TSF’ is Beijing label -- ‘Total Social Financing’Designed to capture all ‘non-gov’t’ financing (so not just bank lending) for individuals and non-financial enterprises (the ‘real economy’).A useful metric? Revisions and expansions happened without revising history far back. Slight internal inconsistency. Originally 7 components, 3 added in 2018.L/T trend would be instructive if had historically consistent data.3 of 7 components make up the proxy of Shadow Banking lending in China, but not exhaustive – so an underestimate. • Entrusted Loans• Trust Loans• Undiscounted Bankers Bills
Share in TSF Out (end-2018)Yuan Bank Loan -- 67%Shadow Banking -- 12%Corporate Bond -- 10%Local Gov’t Special Bond -- 4% (not shown)All Other Four -- 7% (not shown)
4EVERCORE ISI China Research
Donald [email protected]
310.473.40518/12/2019
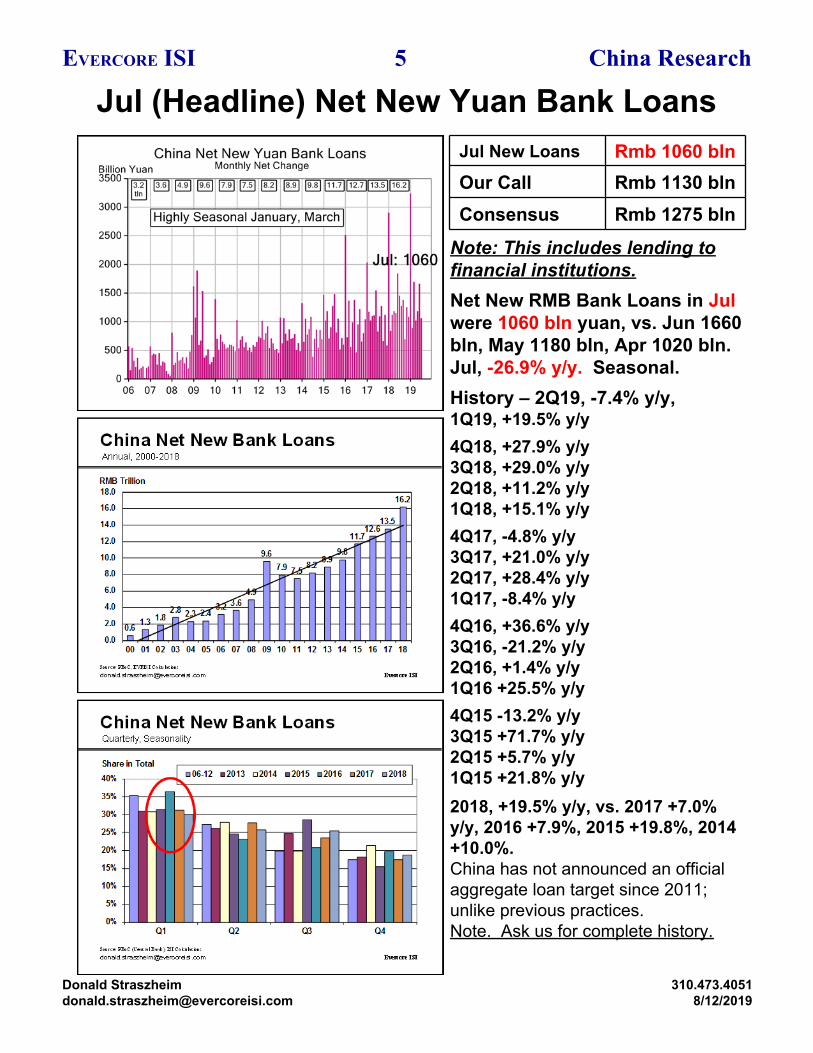
Note: This includes lending to financial institutions.Net New RMB Bank Loans in Jul were 1060 bln yuan, vs. Jun 1660 bln, May 1180 bln, Apr 1020 bln. Jul, -26.9% y/y. Seasonal.History – 2Q19, -7.4% y/y, 1Q19, +19.5% y/y4Q18, +27.9% y/y3Q18, +29.0% y/y2Q18, +11.2% y/y1Q18, +15.1% y/y4Q17, -4.8% y/y3Q17, +21.0% y/y2Q17, +28.4% y/y1Q17, -8.4% y/y4Q16, +36.6% y/y3Q16, -21.2% y/y2Q16, +1.4% y/y1Q16 +25.5% y/y 4Q15 -13.2% y/y3Q15 +71.7% y/y2Q15 +5.7% y/y1Q15 +21.8% y/y2018, +19.5% y/y, vs. 2017 +7.0% y/y, 2016 +7.9%, 2015 +19.8%, 2014 +10.0%.China has not announced an official aggregate loan target since 2011; unlike previous practices. Note. Ask us for complete history.
Jul (Headline) Net New Yuan Bank LoansJul New Loans Rmb 1060 blnOur Call Rmb 1130 blnConsensus Rmb 1275 bln
5EVERCORE ISI China Research
Donald [email protected]
310.473.40518/12/2019
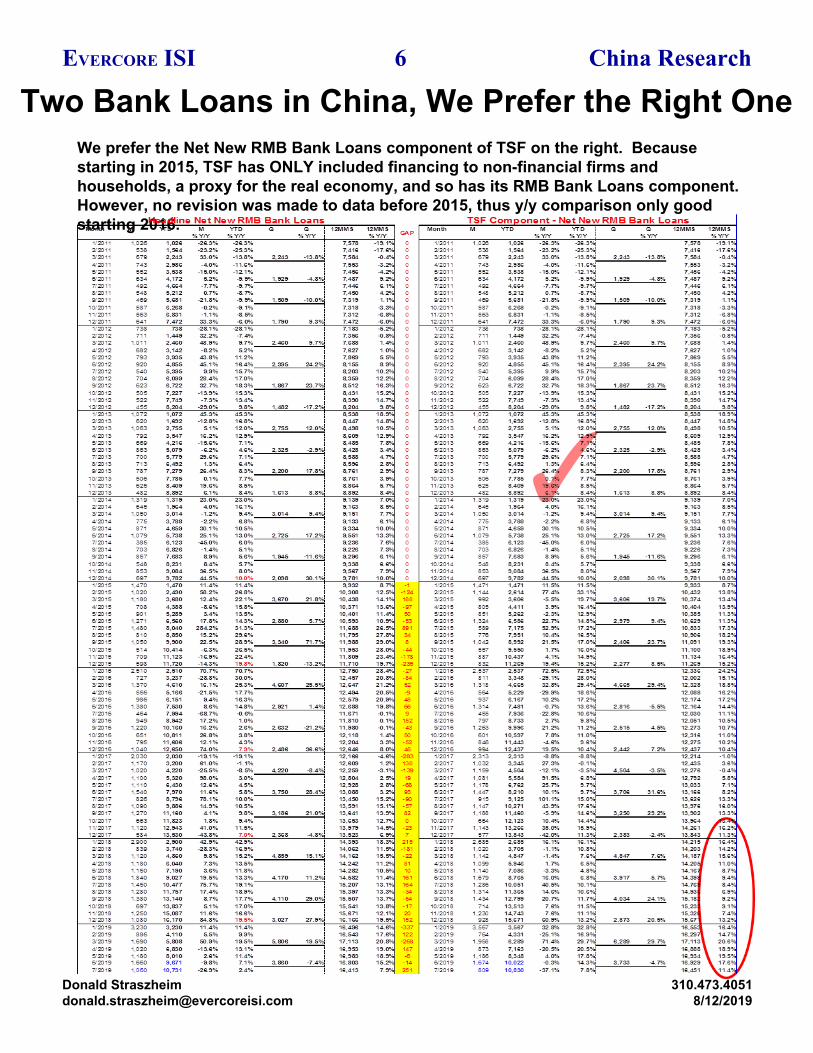
Two Bank Loans in China, We Prefer the Right OneWe prefer the Net New RMB Bank Loans component of TSF on the right. Because starting in 2015, TSF has ONLY included financing to non-financial firms and households, a proxy for the real economy, and so has its RMB Bank Loans component. However, no revision was made to data before 2015, thus y/y comparison only good starting 2016.
6EVERCORE ISI China Research
Donald [email protected]
310.473.40518/12/2019
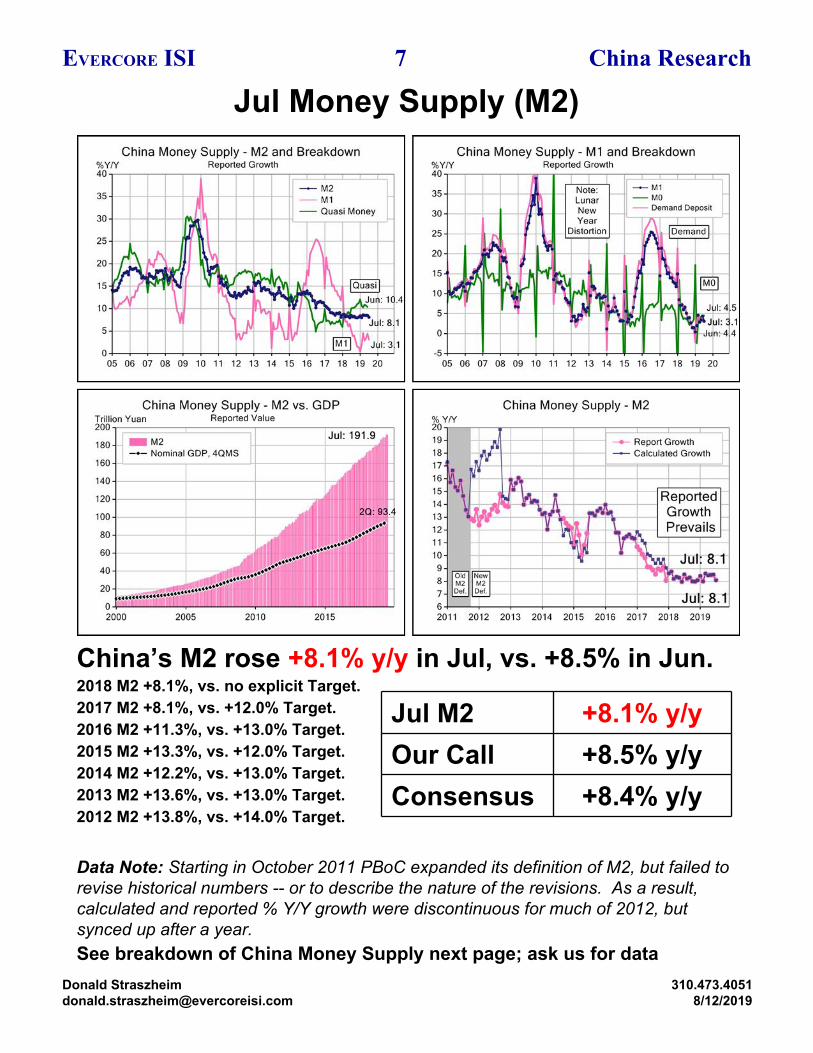
China’s M2 rose +8.1% y/y in Jul, vs. +8.5% in Jun.2018 M2 +8.1%, vs. no explicit Target.2017 M2 +8.1%, vs. +12.0% Target.2016 M2 +11.3%, vs. +13.0% Target.2015 M2 +13.3%, vs. +12.0% Target.2014 M2 +12.2%, vs. +13.0% Target.2013 M2 +13.6%, vs. +13.0% Target.2012 M2 +13.8%, vs. +14.0% Target.
Data Note: Starting in October 2011 PBoC expanded its definition of M2, but failed to revise historical numbers -- or to describe the nature of the revisions. As a result, calculated and reported % Y/Y growth were discontinuous for much of 2012, but synced up after a year.See breakdown of China Money Supply next page; ask us for data
Jul Money Supply (M2)
Jul M2 +8.1% y/yOur Call +8.5% y/yConsensus +8.4% y/y
7EVERCORE ISI China Research
Donald [email protected]
310.473.40518/12/2019
Jul CPI at +2.8% Y/Y
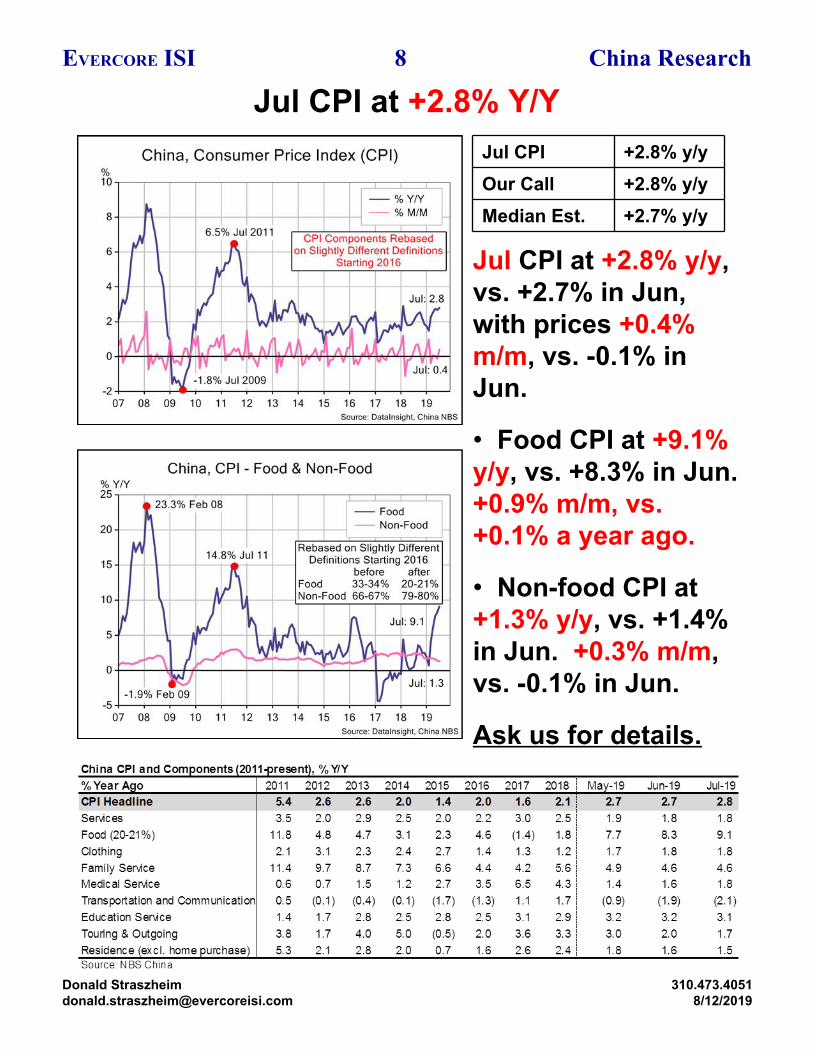
Jul CPI at +2.8% y/y, vs. +2.7% in Jun, with prices +0.4% m/m, vs. -0.1% in Jun.
• Food CPI at +9.1% y/y, vs. +8.3% in Jun. +0.9% m/m, vs. +0.1% a year ago.
• Non-food CPI at +1.3% y/y, vs. +1.4% in Jun. +0.3% m/m, vs. -0.1% in Jun.
Ask us for details.
Jul CPI +2.8% y/yOur Call +2.8% y/yMedian Est. +2.7% y/y
8EVERCORE ISI China Research
Donald [email protected]
310.473.40518/12/2019
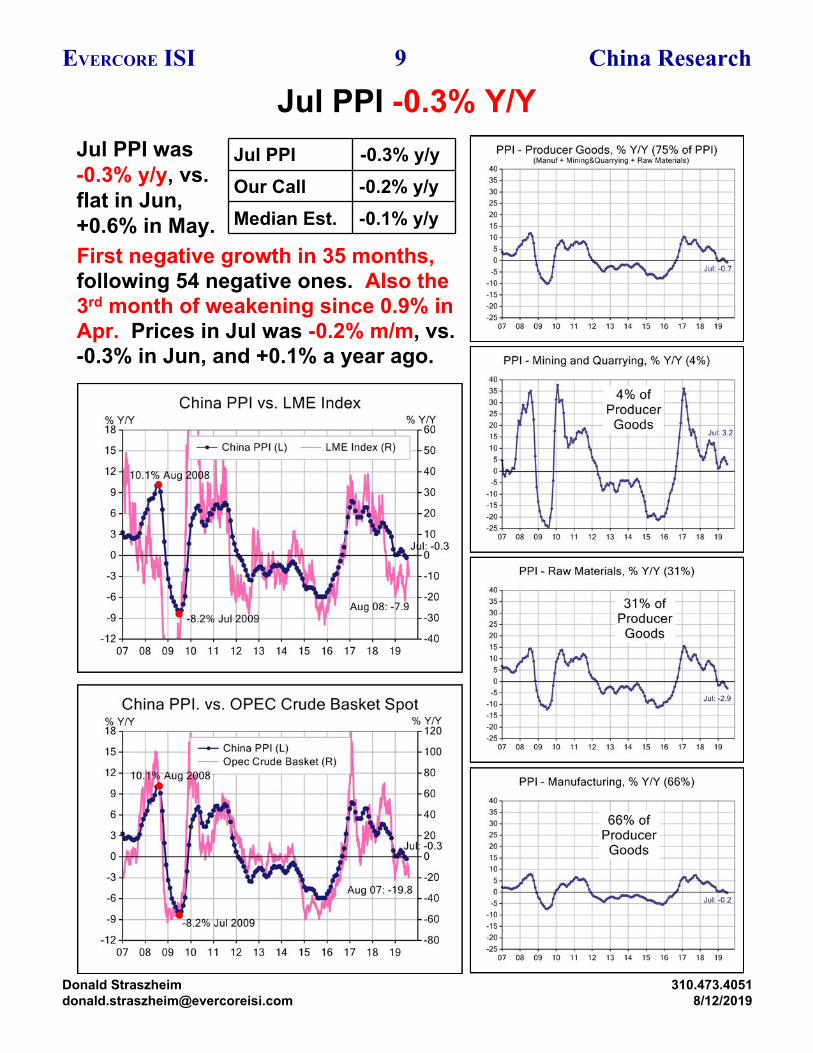
Jul PPI was -0.3% y/y, vs. flat in Jun, +0.6% in May.
Jul PPI -0.3% Y/YJul PPI -0.3% y/yOur Call -0.2% y/yMedian Est. -0.1% y/y
First negative growth in 35 months, following 54 negative ones. Also the 3rd month of weakening since 0.9% in Apr. Prices in Jul was -0.2% m/m, vs. -0.3% in Jun, and +0.1% a year ago.
9EVERCORE ISI China Research
Donald [email protected]
310.473.40518/12/2019
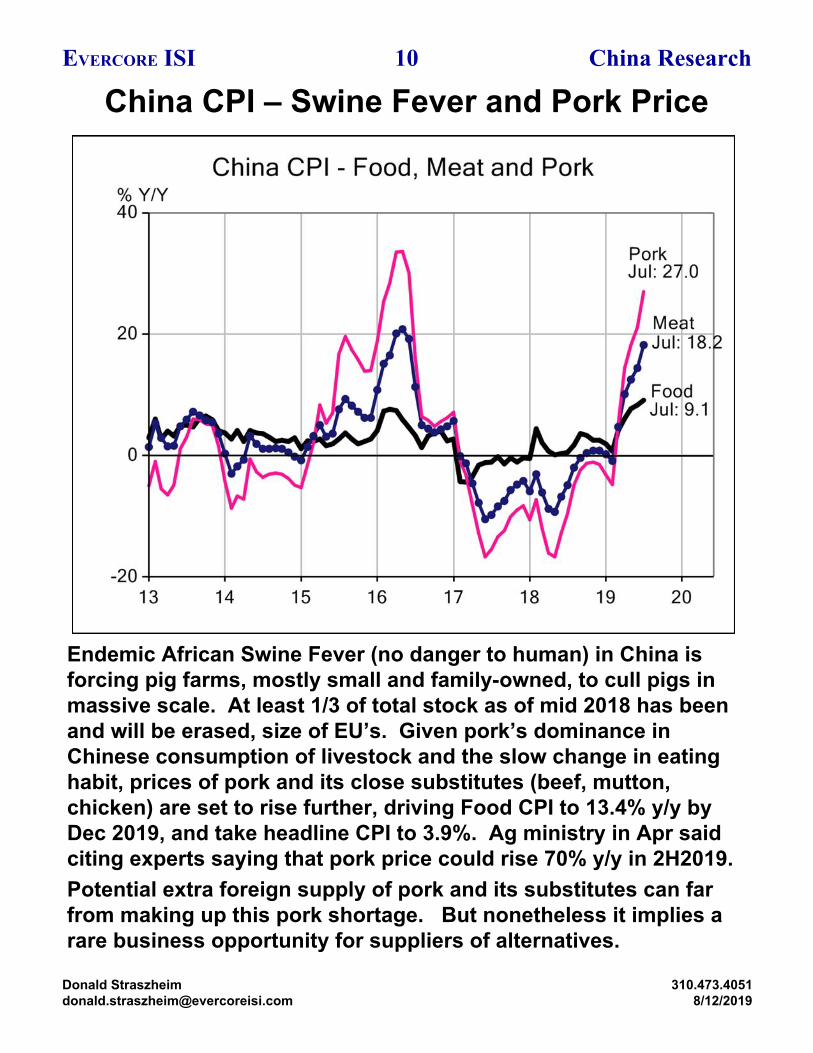
China CPI – Swine Fever and Pork Price
Endemic African Swine Fever (no danger to human) in China is forcing pig farms, mostly small and family-owned, to cull pigs in massive scale. At least 1/3 of total stock as of mid 2018 has been and will be erased, size of EU’s. Given pork’s dominance in Chinese consumption of livestock and the slow change in eating habit, prices of pork and its close substitutes (beef, mutton, chicken) are set to rise further, driving Food CPI to 13.4% y/y by Dec 2019, and take headline CPI to 3.9%. Ag ministry in Apr said citing experts saying that pork price could rise 70% y/y in 2H2019.Potential extra foreign supply of pork and its substitutes can far from making up this pork shortage. But nonetheless it implies a rare business opportunity for suppliers of alternatives.
10EVERCORE ISI China Research
Donald [email protected]
310.473.40518/12/2019
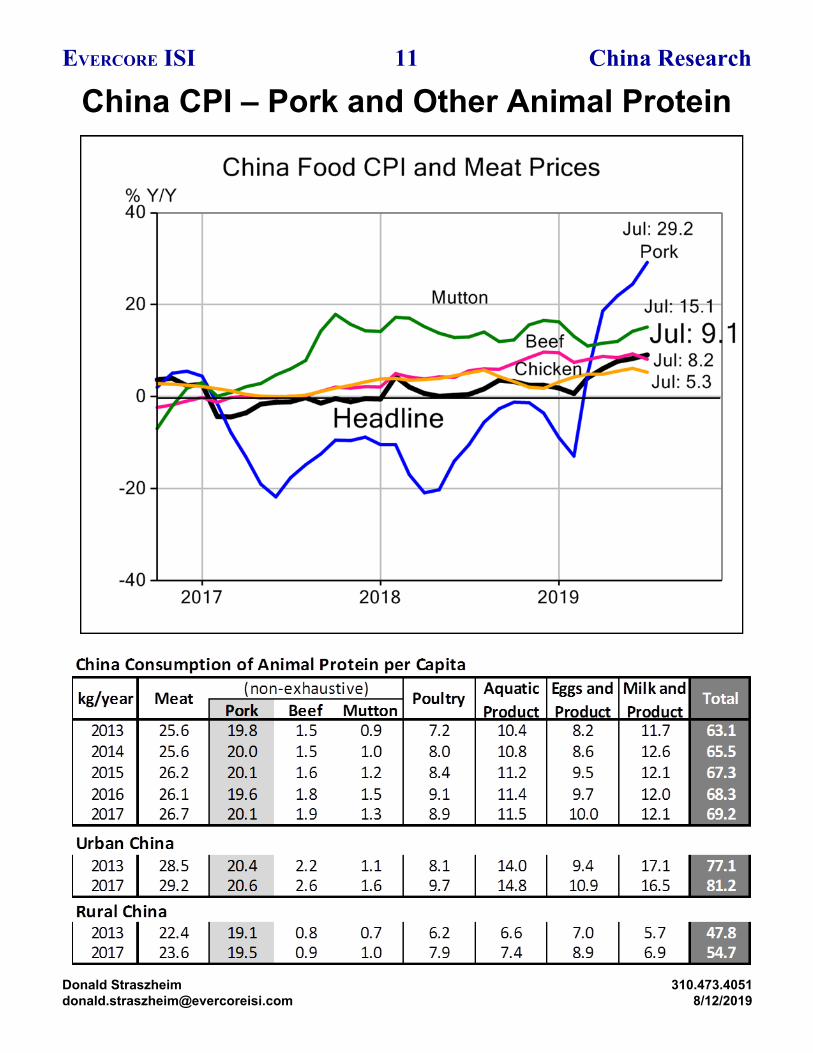
China CPI – Pork and Other Animal Protein11EVERCORE ISI China Research
Donald [email protected]
310.473.40518/12/2019
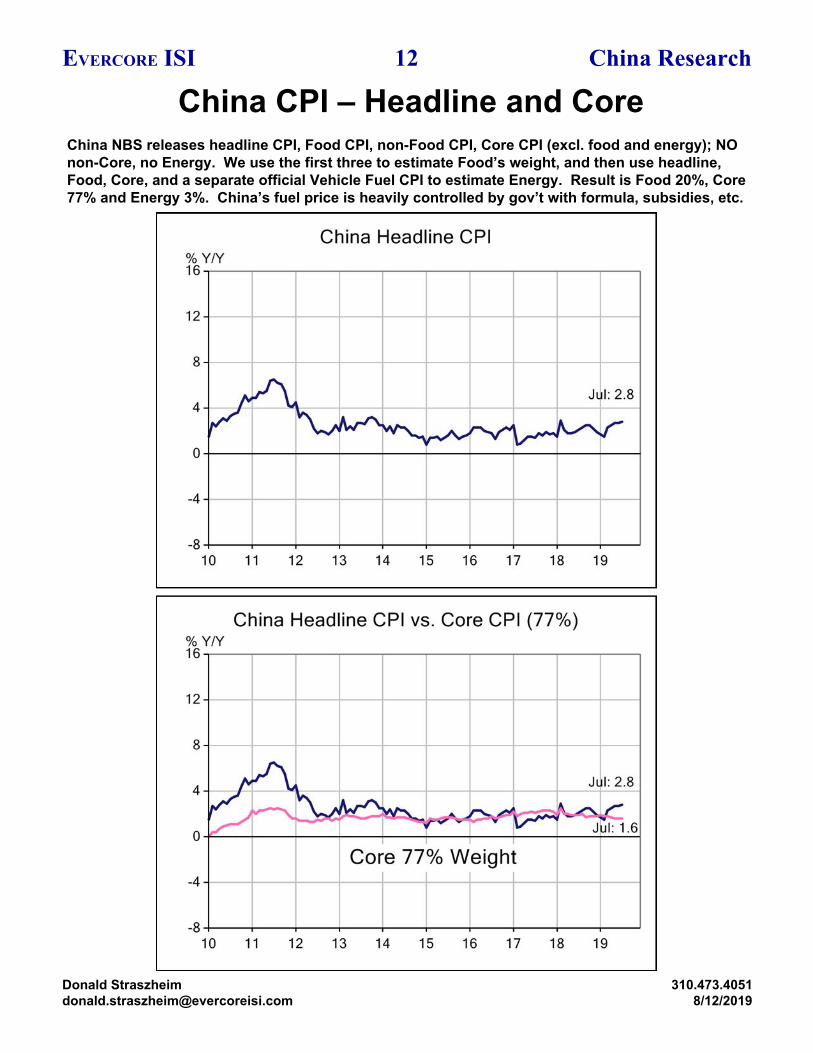
China CPI – Headline and CoreChina NBS releases headline CPI, Food CPI, non-Food CPI, Core CPI (excl. food and energy); NO non-Core, no Energy. We use the first three to estimate Food’s weight, and then use headline, Food, Core, and a separate official Vehicle Fuel CPI to estimate Energy. Result is Food 20%, Core 77% and Energy 3%. China’s fuel price is heavily controlled by gov’t with formula, subsidies, etc.
12EVERCORE ISI China Research
Donald [email protected]
310.473.40518/12/2019
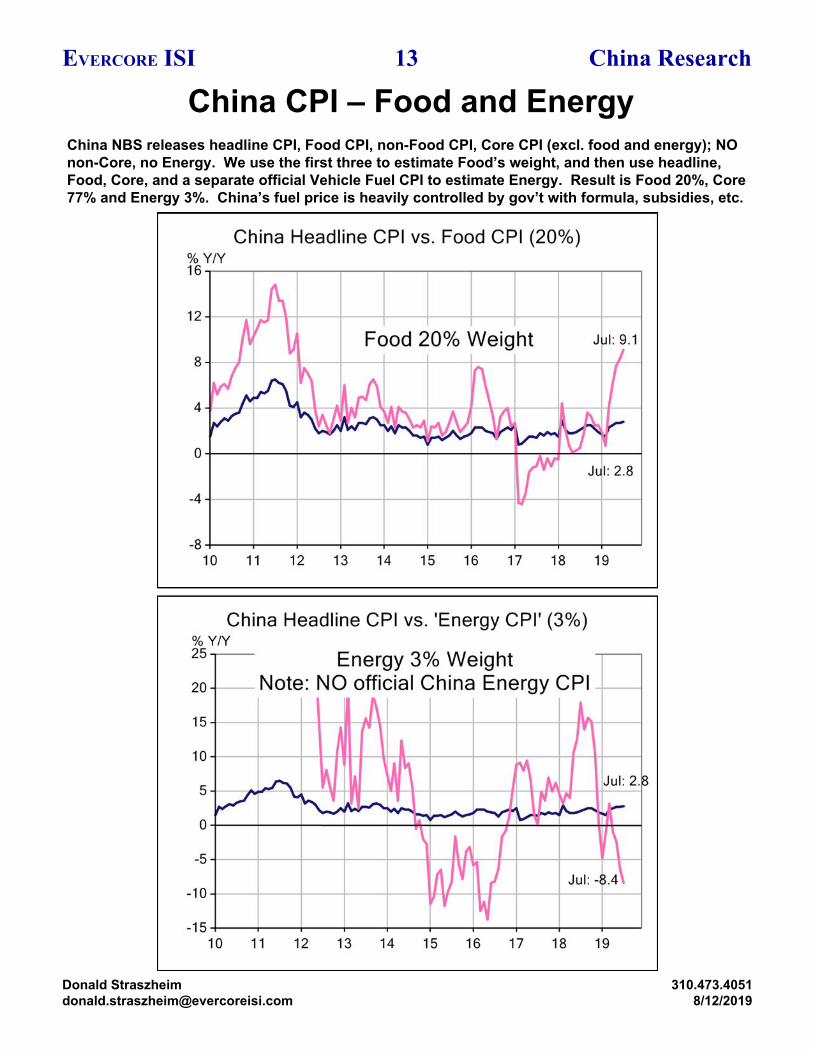
China CPI – Food and EnergyChina NBS releases headline CPI, Food CPI, non-Food CPI, Core CPI (excl. food and energy); NO non-Core, no Energy. We use the first three to estimate Food’s weight, and then use headline, Food, Core, and a separate official Vehicle Fuel CPI to estimate Energy. Result is Food 20%, Core 77% and Energy 3%. China’s fuel price is heavily controlled by gov’t with formula, subsidies, etc.
13EVERCORE ISI China Research
Donald [email protected]
310.473.40518/12/2019
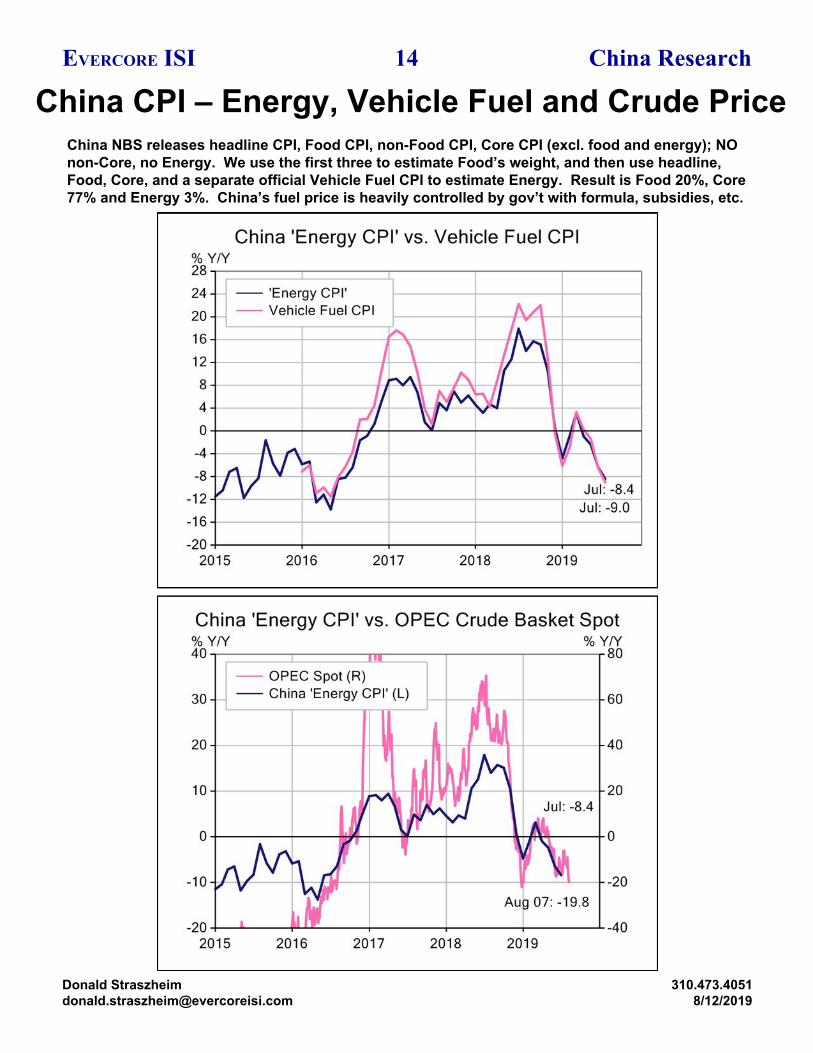
China CPI – Energy, Vehicle Fuel and Crude PriceChina NBS releases headline CPI, Food CPI, non-Food CPI, Core CPI (excl. food and energy); NO non-Core, no Energy. We use the first three to estimate Food’s weight, and then use headline, Food, Core, and a separate official Vehicle Fuel CPI to estimate Energy. Result is Food 20%, Core 77% and Energy 3%. China’s fuel price is heavily controlled by gov’t with formula, subsidies, etc.
14EVERCORE ISI China Research
Donald [email protected]
310.473.40518/12/2019
News Tracker – Aug 9, 2019 -- 115EVERCORE ISI China Research
Donald [email protected]
310.473.40518/12/2019
News Tracker – Aug 9, 2019 -- 216EVERCORE ISI China Research
Donald [email protected]
310.473.40518/12/2019
General DisclosuresThis report is approved and/or distributed by Evercore Group L.L.C. (“Evercore Group”), a U.S. licensed broker-dealer regulated by the Financial Industry Regulatory Authority (“FINRA”) and by Evercore ISI International Limited (“ISI UK”), which is authorised and regulated in the United Kingdom by the Financial Conduct Authority. The institutional sales, trading and research businesses of Evercore Group and ISI UK collectively operate under the global marketing brand name Evercore ISI ("Evercore ISI"). Both Evercore Group and ISI UK are subsidiaries of Evercore Inc. ("Evercore"). The trademarks, logos and service marks shown on this report are registered trademarks of Evercore Inc.
This report is provided for informational purposes only. It is not to be construed as an offer to buy or sell or a solicitation of an offer to buy or sell any financial instruments or to participate in any particular trading strategy in any jurisdiction. The information and opinions in this report were prepared by registered employees of Evercore ISI. The information herein is believed by Evercore ISI to be reliable and has been obtained from public sources believed to be reliable, but Evercore ISI makes no representation as to the accuracy or completeness of such information. Opinions, estimates and projections in this report constitute the current judgment of the author as of the date of this report. They do not necessarily reflect the opinions of Evercore and are subject to change without notice. In addition, opinions, estimates and projections in this report may differ from or be contrary to those expressed by other business areas or groups of Evercore and its affiliates. Evercore ISI has no obligation to update, modify or amend this report or to otherwise notify a reader thereof in the event that any matter stated herein, or any opinion, projection, forecast or estimate set forth herein, changes or subsequently becomes inaccurate. Facts and views in Evercore ISI research reports and notes have not been reviewed by, and may not reflect information known to, professionals in other Evercore affiliates or business areas, including investment banking personnel.
Evercore ISI does not provide individually tailored investment advice in research reports. This report has been prepared without regard to the particular investments and circumstances of the recipient. The financial instruments discussed in this report may not suitable for all investors and investors must make their own investment decisions using their own independent advisors as they believe necessary and based upon their specific financial situations and investment objectives. Securities and other financial instruments discussed in this report, or recommended or offered by Evercore ISI, are not insured by the Federal Deposit Insurance Corporation and are not deposits of or other obligations of any insured depository institution. If a financial instrument is denominated in a currency other than an investor’s currency, a change in exchange rates may adversely affect the price or value of, or the income derived from the financial instrument, and such investor effectively assumes such currency risk. In addition, income from an investment may fluctuate and the price or value of financial instruments described in this report, either directly or indirectly, may rise or fall. Estimates of future performance are based on assumptions that may not be realized. Furthermore, past performance is not necessarily indicative of future performance.
Evercore ISI salespeople, traders and other professionals may provide oral or written market commentary or trading strategies to our clients that reflect opinions that are contrary to the opinions expressed in this research. Our asset management affiliates and investing businesses may make investment decisions that are inconsistent with the recommendations or views expressed in this research.
Electronic research is simultaneously available to all clients. This report is provided to Evercore ISI clients and may not be redistributed, retransmitted or disclosed, in whole or in part, or in any form or manner, without the express written consent of Evercore ISI. Receipt and review of this research report constitutes your agreement not to redistribute, retransmit, or disclose to others the contents, opinions, conclusion or information contained in this report (including any investment recommendations, estimates or target prices) without first obtaining express permission from Evercore ISI.
This report is not intended for distribution to, or use by any person or entity in any jurisdiction or country where such distribution or use would be contrary to local law or regulation.
For investors in the UK: In making this report available, Evercore makes no recommendation to buy, sell or otherwise deal in any securities or investments whatsoever and you should neither rely or act upon, directly or indirectly, any of the information contained in this report in respect of any such investment activity. This report is being directed at or distributed to, (a) persons who fall within the definition of Investment Professionals (set out in Article 19(5) of the Financial Services and Markets Act 2000 (Financial Promotion) Order 2005 (the “Order”)); (b) persons falling within the definition of high net worth companies, unincorporated associations, etc. (set out in Article 49(2) of the Order); (c) other persons to whom it may otherwise lawfully be communicated (all such persons together being referred to as “relevant persons”). This report must not be acted on or relied on by persons who are not relevant persons.
Applicable current disclosures regarding the subject companies covered in this report are available at the offices of Evercore ISI, and can be obtained by writing to Evercore Group L.L.C., Attn. Compliance, 666 Fifth Avenue, 11th Floor, New York, NY 10103.
In compliance with the European Securities and Markets Authority's Market Abuse Regulation, a list of all Evercore ISI recommendations disseminated in the preceding 12 months for the subject companies herein, may be found at the following site: https://evercoreisi.mediasterling.com/disclosure.
© 2019. Evercore Group L.L.C. All rights reserved.