Embed Size (px)
Citation preview

April 3, 2014
IMPORTANT DISCLOSURES, INCLUDING ANY REQUIRED RESEARCH CERTIFICATIONS, ARE PROVIDED AT THE END OF THIS REPORT. Designed by Eight, Powered by EFA
HONG KONG OIL & GAS - OVERALL
China oil and gas spotlight As demand for natural gas in China continues to rise, domestic natural gas production would need to grow at a faster pace to help reduce the country’s reliance on imported gas.
Figure 1: Share price performance - Big 3 oil companies
Figure 2: Share price performance - Oilfield services companies
-30%
-20%
-10%
0%
10%
20%
30%
40%
Jan
-14
Jan
-14
Jan
-14
Jan
-14
Jan
-14
Feb-1
4
Feb-1
4
Feb-1
4
Feb-1
4
Mar-
14
Mar-
14
Mar-
14
Mar-
14
Ap
r-14
Anton SPT Petro-king
SOURCES: CIMB, BLOOMBERG SOURCES: CIMB BLOOMBERG
Sinopec is leading the new gas production, with promising gas fields in the Ordos basin and Sichuan. We believe oilfield services companies are best positioned in this early stage of production ramp up, with Petro-king as our preferred pick (Add rating and target price of HK$5.2). The overall sector remains an Overweight.
China still high reliance on gas imports According to the National Energy Administration (NEA), China’s 2014 apparent consumption of natural gas is estimated at 193bcm, +14.5% yoy. As domestic production (conventional and unconventional) would only contribute approx. 130bcm, imported gas will have to meet 33% of the domestic demand, thus making it an important source of natural gas for China’s growing appetite. In addition, the construction of four new importing pipelines by 2020 indicates China’s further reliance on imported gas going forward.
Sinopec gas production ramp up Sinopec North China’s Daniudi gas field recorded natural gas production of 1bcm in 1Q14, accounting for 25.1% of its full-year target. The Daniudi gas field shows promising production potential, and has become the fourth largest gas field in China. The new DPS-38 gas well has been in production for 196 days, with cumulative gas production of 20.1m cubic metres, while a single testing horizontal well had achieved the highest unobstructed gas flow, with a daily flow of 588,680 cubic metres.
Oilfield services still a better play at this stage With Sinopec taking charge of the production of tight gas at Daniudi and shale gas in Sichuan, in our opinion, the oilfield services sector is best positioned to benefit at this early stage. Our preferred pick is Petro-king which has the highest exposure to Sinopec, at both Daniudi and Sichuan, among its peers.
Sources: CIMB. COMPANY REPORTS
Notes from the Field
—————————————————————————————————————————
Jimmy WONG T (852) 2532 1125 E [email protected]
Toby SHEK T (852) 2532 1119 E [email protected]
-25%
-20%
-15%
-10%
-5%
0%
5%
10%
15%
Jan
-14
Jan
-14
Jan
-14
Jan
-14
Jan
-14
Feb-1
4
Feb-1
4
Feb-1
4
Feb-1
4
Mar-
14
Mar-
14
Mar-
14
Mar-
14
Ap
r-14
PetroChina Sinopec CNOOC

OIL & GAS - OVERALL
April 3, 2014
2
Figure 3: Sector Comparisons
Price Target Price
(local curr) (local curr) CY13 CY14 CY13 CY14 CY13 CY14 CY13 CY14
Integrated
Petrochina 857 HK ADD 8.59 10.00 221,010 9.7 9.6 8.1% 1.1 1.0 11.6% 11.4% 4.6% 4.7%
Sinopec 386 HK ADD 6.95 8.40 97,385 9.6 8.9 7.9% 1.1 1.1 12.1% 12.5% 4.3% 4.5%
Reliance Industries RIL IN REDUCE 958 850 51,702 13.1 12.2 1.3% 1.6 1.4 13.1% 12.4% 1.0% 1.0%
PTT PTT TB HOLD 307 321 27,074 9.3 8.3 0.6% 1.3 1.2 15.7% 14.6% 4.2% 4.8%
Oil & Natural Gas ONGC IN HOLD 330 290 47,136 11.1 9.4 3.5% 1.7 1.6 16.6% 17.5% 3.1% 3.5%
Average - simple 10.6 9.7 4.3% 1.4 1.3 14% 14% 3.5% 3.7%
E&P
CNOOC Limited 883 HK HOLD 11.8 13.6 68,033 7.5 6.9 2.6% 1.2 1.1 17.1% 17.1% 4.8% 3.9%
Kunlun Energy 135 HK HOLD 13.3 14.1 13,820 15.6 13.6 13.3% 2.1 1.9 14.5% 14.6% 2.3% 2.7%
PTT E&P PTTEP TB ADD 159.0 183.0 19,489.6 10.9 9.1 0.0 1.6 1.5 17.3% 17.0% 3.8% 4.4%
MIE Holdings Corp 1555 HK NON RATED 1.4 n.a. 492 8.7 10.0 -31.3% 0.8 0.7 9.2% 7.4% 0.9% 2.1%
Horizon Oil HZN AU ADD 0.3 0.5 373 26.1 11.2 92.9% 1.61 1.24 6.8% 12.4% 0.0% 0.0%
Maverick MAD AU ADD 0.4 0.6 160 33.3 12.6 67.2% 1.29 1.08 4.6% 9.5% 0.0% 0.0%
Senex Energy SXY AU ADD 0.7 1.2 768 16.5 13.2 37.8% 1.76 1.54 11.9% 12.5% 0.0% 0.0%
Sundance Energy SEA AU ADD 1.0 1.4 470 17.9 7.0 na 1.92 1.37 10.0% 22.6% 0.0% 0.0%
Tlou Energy TOU AU ADD 0.3 0.6 45 na na na 1.04 0.61 -14.7% -7.1% 0.0% 0.0%
Cairn India CAIR IN ADD 345.1 400.0 10,991 5.8 6.3 -7.5% 1.22 1.06 23.6% 18.3% 3.4% 3.2%
Oil India OINL IN ADD 491.0 530.0 4,928 8.3 7.7 -2.1% 1.45 1.34 18.3% 18.0% 6.1% 6.1%
Average - simple 15.1 9.8 19.4% 1.5 1.2 10.8% 12.9% 1.9% 2.0%
Refiners
Thai oil TOP TB ADD 52.8 71.0 3,323 8.0 9.4 4.9% 1.19 1.11 16.2% 12.2% 4.6% 4.8%
SK Innovation 096770 KS ADD 120,000.0 159,000.0 10,501 15.4 12.4 10.8% 0.70 0.67 4.4% 5.6% 2.7% 2.7%
S-Oil Corp 010950 KS ADD 61,000.0 78,000.0 6,500 22.0 13.1 13.9% 1.28 1.19 5.6% 9.5% 2.2% 3.7%
GS Holdings Corp 078930 KS ADD 48,350.0 60,000.0 4,252 11.9 9.2 4.7% 0.68 0.64 5.6% 7.3% 2.5% 2.9%
Formosa Petrochemical 6505 TT REDUCE 77.4 72.0 24,310 29.4 26.4 128.5% 3.13 2.99 11.5% 11.6% 2.0% 2.3%
PTT Global Chemical PTTGC TB ADD 73.0 96.0 10,163 10.0 8.7 8.0% 1.38 1.29 15.2% 15.2% 4.6% 5.2%
Bharat Petroleum BPCL IN ADD 449.0 475.0 5,420 11.5 10.1 19.8% 1.54 1.41 14.7% 14.8% 2.6% 2.7%
Hindustan Petroleum HPCL IN ADD 307.6 300.0 1,739 9.4 6.8 41.1% 0.78 0.71 8.6% 11.0% 2.8% 2.8%
Average - simple 14.7 12.0 29.0% 1.3 1.3 10.2% 10.9% 3.0% 3.4%
China Oil Services
Termbray Petro-king Oilfield Services Ltd2178 HK ADD 3.1 5.2 435 15.5 10.3 26.1% 1.5 1.4 13.1% 13.9% 1.3% 1.9%
Anton Oilfield Services 3337 HK REDUCE 5.1 3.5 1,453 23.1 21.5 20.7% 4.0 3.6 18.0% 17.7% 1.5% 1.6%
SPT Energy Group 1251 HK ADD 4.3 5.2 857 17.7 14.5 27.6% 3.0 2.6 17.6% 19.3% 1.4% 1.7%
China Oilfield Services Limited 2883 HK NON RATED 19.4 n.a. 13,042 10.0 9.2 6.0% 1.6 1.4 17.3% 16.1% 2.8% 3.0%
Average - simple 16.5 13.9 20.1% 2.5 2.2 16.5% 16.7% 1.7% 2.1%
Regional Oil Services
Wah Seong Corp WSC MK ADD 1.9 2.7 449 34.1 10.9 33.5% 1.43 2.47 5.4% 16.6% 2.7% 3.7%
Dialog Group DLG MK ADD 3.8 3.6 2,809 38.3 27.9 25.4% 7.99 6.86 23.0% 26.8% 0.9% 1.0%
Perisai Petroleum PPT MK ADD 1.6 2.5 514 21.7 17.6 21.3% 1.72 2.17 10.8% 11.4% 0.0% 0.0%
Average - simple 31.3 18.8 26.7% 3.7 3.8 13.1% 18.2% 1.2% 1.5%
P/BV (x) Dividend Yield (%)Recurring ROE (%)Company
Bloomberg
TickerRecom. Mkt Cap (US$m)
Core P/E (x) 3-year EPS
CAGR (%)
SOURCES: CIMB, BLOOMBERG
Calculations are performed using EFA™ Monthly Interpolated Annualisation and Aggregation algorithms to December year ends
OIL & GAS - OVERALL
April 3, 2014
3
News headlines 1. NEWS HEADLINES OF THE WEEK
Sinopec completed the transfer of its marketing segment to Sinopec Sales Co Ltd (National Business Daily) – 2 April 2014
Sinopec announced on 1 April 2014 that the ownership, management and control of the assets under the marketing and distribution segment of Sinopec has been transferred to Sinopec Sales Co. Ltd. According to the National Business Daily, the market is speculating that Sinopec may set up a research institute on its non-fuel business, but the news has not been officially verified by Sinopec. Regarding the injection of the marketing segment into Sinopec Sales, Sinopec refused to comment on the scale of business after the restructuring. People familiar with the matter believe that more numbers could be disclosed after finishing the appraisal work on all the sales and marketing assets in June.
News link
Sinopec sets 2014 goal for Yuanba project start-up (Zacks.com) – 1 April 2014
Sinopec intends to start producing from the Yuanba sour gas field in China’s south western Sichuan province by the end of 2014. Drilling at Yuanba field, still seen as a conventional resource, was largely carried out at a depth of 7,500 metres. The Yuanlu-7 well on the field tested 1.2 million cubic meters of gas per day, while another well Yuanlu-5 drilled in the same area, flowed 1.5m cm/d. Then, the Yuanba-21 well flowed 507,000 cm/d. As of year-end 2012, the company had drilled 69 wells, of which 25–30% could generate gas flows adequate for commercial development. The processing plant to be built at Yuanba is likely to produce 3.4 billion cubic meters of gas per year and is scheduled for completion by the end of 2014. This amount is equal to 18% of Sinopec’s total output of about 18.7 billion cubic meters in 2013.
News link
PetroChina plans to open its basins in Xinjiang to private capital (Upstreamonline) – 31 March 2014
In response to the government’s direction of mixed ownership in SOEs, PetroChina plans to invite private investors to invest in its basins in Northwest China and the Xinjiang area. The basins include the Tarim basin, Turpan-Hami basin and Junggar basin. PetroChina said the plan will not involve any bidding process, but negotiations will be carried with potential investors on a 1-on-1 basis while maintaining ownership diversity.
News link
PetroChina to Exploit Oil, Gas in Mexico (Menafn.com/China5e) – 31 March 2014
A top executive from PetroChina Company Limited revealed that the Chinese oil and gas producer would be awarded the oil and gas exploitation right in Mexico in the future. The Mexican energy reform approved last December ended the 75-year monopoly by local oil giant Pemex, aiming to lure foreign and private investment amounting to billions of US dollars through public bidding. PetroChina is ready to participate in Mexican oil and gas projects, considering that Mexico is one of its important target markets. No further details are available.
News link

OIL & GAS - OVERALL
April 3, 2014
4
Husky Energy delivers production at the Liwan gas project (Market Watch) – 30 March 2014
Husky Energy and CNOOC Limited have commenced first production at the landmark Liwan Gas Project in the South China Sea. The Liwan 3-1 field has started production, with initial natural gas sales expected to be approximately 250 million cubic feet per day (mmcf/day) gross and increasing to approximately 300 mmcf/day in the second half of 2014. Initial sales of condensates and natural gas liquids from Liwan 3-1 are expected to be approximately 10,000 to 14,000 barrels of oil equivalent per day (boe/day) gross.
News link
Hilong completes the acquisition of Texas Internal Pipe Coating LLC (ACNNewswire) – 31 March 2014
Hilong announced that the Group has successfully acquired all the equity shares of Texas Internal Pipe Coating LLC ("TIPC") with the purchase agreement signed on 14 February 2014 and the acquisition completed on 26 March 2014. TIPC is a company with the main business of OCTG coating services with the capability of providing coating services for pipes with internal diameters from 2" to 12.75" at the current coating capacity of one million meters. Mr. Zhang Jun, Chairman and Chief Executive Officer of Hilong, said, "The transaction represents Hilong's another successful move in marching into the North American market after the establishment of the coating plant in Canada in 2013. The acquisition will significantly expand the Group's coating services capacity.”
News link
Rising expectation of crude oil futures trading in Shanghai: pending final approval from senior management (Takungpao) - 1 April 2014
Crude oil, an important strategic resource, may have its futures listed on the Shanghai Futures Exchange this year. “The futures exchange is currently undergoing the testing phase, while the transaction rules and guidelines have already been drafted. We are just pending the final approval from senior management and the most crucial issue for crude oil futures is whether it can link up with the international market”, according to people close to the Shanghai Futures Exchange.
News link
Daniudi gas field’s cumulative gas production exceeded 18.8bcm (Sinopecnews) – 3 April 2014
As of 31 March 2014, Sinopec North China’s Daniudi gas field recorded natural gas production of 1.0033bcm in 1Q14, accounting for 25.08% of the full-year target. The Daniudi gas field has become the fourth largest gas field in China with cumulative production exceeding 18.8bcm since commencement in 2005.
News link
OIL & GAS - OVERALL
April 3, 2014
5
Daniudi gas field unobstructed gas production reached 20m cubic meters in DPS-38 well (Sinopecnews) – 2 April 2014
Daniudi DPS-38 gas well, which has been in production for 196 days, achieved a cumulative gas production of 20.06m cubic meters. The DPS-38 well, a single testing horizontal well, achieved the highest unobstructed gas flow with a daily flow of 588,680 cubic meters.
News link
China PX plant protests spill over into Guangzhou (Plasticstoday) – 1 April 2014
Protests against the construction of a paraxylene (PX) plant in Maoming city in China's Guangdong province on Sunday (30 March 2014) have spread to the provincial capital of Guangzhou. Several hundred protesters gathered in solidarity with residents of Maoming in their opposition to the plant and to denounce police brutality in quelling the demonstration over the weekend.
News link
Natural gas import reliance is on an increasing trend (China5e) - 3 April 2014
It is estimated that the apparent consumption of natural gas in 2014 will reach 193bcm, representing 14.5% yoy growth. Domestic natural gas production, coal to gas and CBM will contribute roughly 130bcm. Therefore, imports will remain an important source to meet the growing demand for natural gas in China. Apart from that, the political conflicts between Russia and Ukraine, as well as the construction of four new pipelines by 2020 may alter the picture of natural gas development in China.
News link

OIL & GAS - OVERALL
April 3, 2014
6
2. OIL AND GAS STOCKS PERFORMANCE
Figure 4: 1 week absolute performance Figure 5: 3 months absolute performance
Title:
Source:
Please fill in the values above to have them entered in your report
-20% -10% 0% 10% 20% 30%
Sinopec Shanghai
Petro-king
Karoon Gas
BPCL
CNOOC
ONGC
SK Innovation
Origin Energy
Santos
TonenGeneral
Sinopec
SKPB
Oil Search
PTT Global Chemical
Thai Oil
Woodside
HPCL
Fuji Oil
PetroChina
Showa Shell
PTT
Cairn India
JX Holdings
Idemitsu
PTT E&P
Oil India
Citic Res
Awe
Kunlun Energy
Beach Energy
Cosmo Oil
Inpex
Reliance
COSL
Sinopec Kantons
Anton
SPT
Title:
Source:
Please fill in the values above to have them entered in your report
-60% -40% -20% 0% 20% 40%
Karoon Gas
Petro-king
CNOOC
Fuji Oil
COSL
SK Innovation
Sinopec Shanghai
Showa Shell
Idemitsu
Santos
JX Holdings
PTT Global Chemical
SKPB
TonenGeneral
Sinopec Kantons
Cosmo Oil
SPT
Thai Oil
Kunlun Energy
Woodside
Citic Res
Origin Energy
PetroChina
Inpex
PTT E&P
Oil Search
Oil India
Cairn India
Anton
Reliance
Sinopec
PTT
Awe
ONGC
Beach Energy
HPCL
BPCL
SOURCES: CIMB, BLOOMBERG SOURCES: CIMB, BLOOMBERG

OIL & GAS - OVERALL
April 3, 2014
7
Figure 6: 6 months absolute performance Figure 7: YTD absolute performance
Title:
Source:
Please fill in the values above to have them entered in your report
-100% -50% 0% 50% 100%
Idemitsu
Karoon Gas
Sinopec Shanghai
CNOOC
Fuji Oil
Petro-king
SK Innovation
Thai Oil
Santos
Showa Shell
PTT E&P
COSL
PTT
Citic Res
PTT Global Chemical
Anton
PetroChina
Oil Search
Origin Energy
TonenGeneral
Woodside
JX Holdings
Cairn India
Oil India
SPT
Sinopec
Reliance
Cosmo Oil
Kunlun Energy
Inpex
ONGC
Awe
Sinopec Kantons
Beach Energy
BPCL
HPCL
Title:
Source:
Please fill in the values above to have them entered in your report
-60% -40% -20% 0% 20% 40%
Karoon Gas
Petro-king
COSL
CNOOC
Fuji Oil
SK Innovation
Sinopec Shanghai
Showa Shell
Idemitsu
Santos
PTT Global Chemical
JX Holdings
Thai Oil
TonenGeneral
SPT
PTT E&P
Cosmo Oil
Sinopec Kantons
Kunlun Energy
Woodside
Oil India
Citic Res
PetroChina
Origin Energy
Inpex
Oil Search
SKPB
Reliance
Cairn India
PTT
Anton
Sinopec
ONGC
Awe
Beach Energy
BPCL
HPCL
SOURCES: CIMB, BLOOMBERG SOURCES: CIMB, BLOOMBERG

OIL & GAS - OVERALL
April 3, 2014
8
3. INTERNATIONAL OIL PRICES AND SPREADS
Figure 8: Brent crude oil price Figure 9: Dubai crude oil price
Title:
Source:
20
40
60
80
100
120
140
160
Jul-07
Oct-07
Jan-0
8
Apr-
08
Jul-08
Oct-08
Jan-0
9
Apr-
09
Jul-09
Oct-09
Jan-1
0
Apr-
10
Jul-10
Oct-10
Jan-1
1
Apr-
11
Jul-11
Oct-11
Jan-1
2
Apr-
12
Jul-12
Oct-12
Jan-1
3
Apr-
13
Jul-13
Oct-13
Jan-1
4
US$/bbl
Brent
Title:
Source:
20
40
60
80
100
120
140
160
Jul-07
Oct-07
Jan-0
8
Apr-
08
Jul-08
Oct-08
Jan-0
9
Apr-
09
Jul-09
Oct-09
Jan-1
0
Apr-
10
Jul-10
Oct-10
Jan-1
1
Apr-
11
Jul-11
Oct-11
Jan-1
2
Apr-
12
Jul-12
Oct-12
Jan-1
3
Apr-
13
Jul-13
Oct-13
Jan-1
4
US$/bbl
Dubai
SOURCES: CIMB, BLOOMBERG SOURCES: CIMB, BLOOMBERG
Figure 10: WTI crude oil price Figure 11: Oil price forward curve
Title:
Source:
20
40
60
80
100
120
140
160
Jul-07
Oct-07
Jan-0
8
Apr-
08
Jul-08
Oct-08
Jan-0
9
Apr-
09
Jul-09
Oct-09
Jan-1
0
Apr-
10
Jul-10
Oct-10
Jan-1
1
Apr-
11
Jul-11
Oct-11
Jan-1
2
Apr-
12
Jul-12
Oct-12
Jan-1
3
Apr-
13
Jul-13
Oct-13
Jan-1
4
US$/bbl
WTI
Title:
Source:
70
75
80
85
90
95
100
105
110
May-
14
Aug-1
4
Nov-
14
Feb
-15
May-
15
Aug-1
5
Nov-
15
Feb
-16
May-
16
Aug-1
6
Nov-
16
Feb
-17
May-
17
Aug-1
7
Nov-
17
Feb
-18
May-
18
Aug-1
8
Nov-
18
Feb
-19
May-
19
Aug-1
9
Nov-
19
Feb
-20
US$/bbl
Brent forward cruve WTI forward curve
SOURCES: CIMB, BLOOMBERG SOURCES: CIMB, BLOOMBERG
Figure 12: Brent oil forward premium/(discount) Figure 13: Crude oil spreads
Title:
Source:
(10)
(5)
-
5
10
15
Jul-07
Oct-07
Jan-0
8
Apr-
08
Jul-08
Oct-08
Jan-0
9
Apr-
09
Jul-09
Oct-09
Jan-1
0
Apr-
10
Jul-10
Oct-10
Jan-1
1
Apr-
11
Jul-11
Oct-11
Jan-1
2
Apr-
12
Jul-12
Oct-12
Jan-1
3
Apr-
13
Jul-13
Oct-13
Jan-1
4
US$/bbl
Brent 3m forward premium/(discount) Brent 6m forward premium/(discount)
Title:
Source:
(30)
(20)
(10)
-
10
20
30
40
Jul-07
Oct-07
Jan-0
8
Apr-
08
Jul-08
Oct-08
Jan-0
9
Apr-
09
Jul-09
Oct-09
Jan-1
0
Apr-
10
Jul-10
Oct-10
Jan-1
1
Apr-
11
Jul-11
Oct-11
Jan-1
2
Apr-
12
Jul-12
Oct-12
Jan-1
3
Apr-
13
Jul-13
Oct-13
Jan-1
4
US$/bbl
Brent-WTI Brent Dubai WTI-Dubai
SOURCES: CIMB, BLOOMBERG SOURCES: CIMB, BLOOMBERG

OIL & GAS - OVERALL
April 3, 2014
9
4. REFINING MARGINS
Figure 14: China gross refining margin Figure 15: China gasoline and diesel price trend
Title:
Source:
Please fill in the values above to have them entered in your report
(15)
(10)
(5)
-
5
10
15
Jan-1
0
Mar-
10
May-
10
Jul-10
Sep-1
0
Nov-
10
Jan-1
1
Mar-
11
May-
11
Jul-11
Sep-1
1
Nov-
11
Jan-1
2
Mar-
12
May-
12
Jul-12
Sep-1
2
Nov-
12
Jan-1
3
Mar-
13
May-
13
Jul-13
Sep-1
3
Nov-
13
Jan-1
4
Mar-
14
US$/bbl
China gross refining margin Quarterly average
Title:
Source:
Please fill in the values above to have them entered in your report
7,000
7,200
7,400
7,600
7,800
8,000
8,200
8,400
8,600
8,800
9,000
4,400
4,500
4,600
4,700
4,800
4,900
5,000
5,100
5,200
5,300
Jan-1
3Ja
n-1
3Ja
n-1
3F
eb-1
3F
eb-1
3M
ar-
13
Mar-
13
Apr-
13
Apr-
13
May-
13
May-
13
Jun-1
3Ju
n-1
3Ju
l-13
Jul-13
Jul-13
Aug-1
3A
ug-1
3S
ep-1
3S
ep-1
3O
ct-13
Oct-13
Nov-
13N
ov-
13D
ec-
13D
ec-
13D
ec-
13Ja
n-1
4Ja
n-1
4F
eb-1
4F
eb-1
4M
ar-
14
Mar-
14
Rmb/tonneRmb/tonne
Crude moving avg (LHS) - Rmb/tonne Gasoline (RHS) Diesel (RHS)
SOURCES: CIMB, BLOOMBERG SOURCES: CIMB, BLOOMBERG
Figure 16: Rotterdam Brent simple cracking margin Figure 17: Crude oil Gulf Coast 321 crack spread
Title:
Source:
Please fill in the values above to have them entered in your report
-6
-4
-2
0
2
4
6
8
10
12
14
16
Jan-0
8
Apr-
08
Jul-08
Oct-08
Jan-0
9
Apr-
09
Jul-09
Oct-09
Jan-1
0
Apr-
10
Jul-10
Oct-10
Jan-1
1
Apr-
11
Jul-11
Oct-11
Jan-1
2
Apr-
12
Jul-12
Oct-12
Jan-1
3
Apr-
13
Jul-13
Oct-13
Jan-1
4
US$/bbl
Rotterdam Brent simple cracking margin
Title:
Source:
-10
-5
0
5
10
15
20
Feb
-10
Apr-
10
Jun-1
0
Aug-1
0
Oct-10
Dec-
10
Feb
-11
Apr-
11
Jun-1
1
Aug-1
1
Oct-11
Dec-
11
Feb
-12
Apr-
12
Jun-1
2
Aug-1
2
Oct-12
Dec-
12
Feb
-13
Apr-
13
Jun-1
3
Aug-1
3
Oct-13
Dec-
13
Feb
-14
US$/bbl
Crude oil Gulf Coast 321 crack spread
SOURCES: CIMB, Reuters SOURCES: CIMB, BLOOMBERG
Figure 18: Singapore simple gross refining margin Figure 19: Singapore complex gross refining margin
Title:
Source:
Please fill in the values above to have them entered in your report
-5
-3
-1
1
3
5
7
9
11
13
15
Mar-
11
May-
11
Jul-11
Sep-1
1
Nov-
11
Jan-1
2
Mar-
12
May-
12
Jul-12
Sep-1
2
Nov-
12
Jan-1
3
Mar-
13
May-
13
Jul-13
Sep-1
3
Nov-
13
Jan-1
4
Mar-
14
US$/bbl
Singapore simple gross refining margin
Title:
Source:
Please fill in the values above to have them entered in your report
0
2
4
6
8
10
12
14
16
18
20
Mar-
11
May-
11
Jul-11
Sep-1
1
Nov-
11
Jan-1
2
Mar-
12
May-
12
Jul-12
Sep-1
2
Nov-
12
Jan-1
3
Mar-
13
May-
13
Jul-13
Sep-1
3
Nov-
13
Jan-1
4
Mar-
14
US$/bbl
Singapore complex gross refining margin
SOURCES: CIMB, REUTERS SOURCES: CIMB, REUTERS

OIL & GAS - OVERALL
April 3, 2014
10
5. INVENTORIES
Figure 20: US DOE crude oil total inventory (incl. strategic petroleum reserve)
Figure 21: US DOE crude oil inventory (excl. strategic petroleum reserve)
Title:
Source:
1,000
1,020
1,040
1,060
1,080
1,100
1,120
Jan-1
1
Mar-
11
May-
11
Jul-11
Sep-1
1
Nov-
11
Jan-1
2
Mar-
12
May-
12
Jul-12
Sep-1
2
Nov-
12
Jan-1
3
Mar-
13
May-
13
Jul-13
Sep-1
3
Nov-
13
Jan-1
4
Mar-
14
mmbbl
US DOE crude oil total inventory (incl. strategic petroleum reserve)
Title:
Source:
300
320
340
360
380
400
420
Jan-1
1
Mar-
11
May-
11
Jul-11
Sep-1
1
Nov-
11
Jan-1
2
Mar-
12
May-
12
Jul-12
Sep-1
2
Nov-
12
Jan-1
3
Mar-
13
May-
13
Jul-13
Sep-1
3
Nov-
13
Jan-1
4
Mar-
14
mmbbl
US DOE crude oil inventory (excl. strategic petroleum reserve)
SOURCES: CIMB, BLOOMBERG SOURCES: CIMB, BLOOMBERG
Figure 22: US DOE motor gasoline inventory Figure 23: US DOE distillate fuel oil inventory
Title:
Source:
180
190
200
210
220
230
240
250
Jan-1
1
Mar-
11
May-
11
Jul-11
Sep-1
1
Nov-
11
Jan-1
2
Mar-
12
May-
12
Jul-12
Sep-1
2
Nov-
12
Jan-1
3
Mar-
13
May-
13
Jul-13
Sep-1
3
Nov-
13
Jan-1
4
Mar-
14
mmbbl
US DOE motor gasoline inventory
Title:
Source:
80
90
100
110
120
130
140
150
160
170
180
Jan-1
1
Mar-
11
May-
11
Jul-11
Sep-1
1
Nov-
11
Jan-1
2
Mar-
12
May-
12
Jul-12
Sep-1
2
Nov-
12
Jan-1
3
Mar-
13
May-
13
Jul-13
Sep-1
3
Nov-
13
Jan-1
4
Mar-
14
mmbbl
US DOE distillate fuel oil inventory
SOURCES: CIMB, BLOOMBERG SOURCES: CIMB, BLOOMBERG

OIL & GAS - OVERALL
April 3, 2014
11
6. PRODUCTION, IMPORTS AND EXPORTS
Figure 24: China crude oil production, net import and apparent consumption
Figure 25: China natural gas production, net import and apparent consumption
Title:
Source:
-20%
-15%
-10%
-5%
0%
5%
10%
15%
20%
25%
30%
35%
-
5
10
15
20
25
30
35
40
45
50
Jan-0
7
May-
07
Sep-0
7
Jan-0
8
May-
08
Sep-0
8
Jan-0
9
May-
09
Sep-0
9
Jan-1
0
May-
10
Sep-1
0
Jan-1
1
May-
11
Sep-1
1
Jan-1
2
May-
12
Sep-1
2
Jan-1
3
May-
13
Sep-1
3
Jan-1
4
m tonnes
China crude oil production Net import
Apparent consumption YoY%
Title:
Source:
-15%
-10%
-5%
0%
5%
10%
15%
20%
25%
30%
35%
40%
(2)
-
2
4
6
8
10
12
14
16
18
20
Jan-0
9
Apr-
09
Jul-09
Oct-09
Jan-1
0
Apr-
10
Jul-10
Oct-10
Jan-1
1
Apr-
11
Jul-11
Oct-11
Jan-1
2
Apr-
12
Jul-12
Oct-12
Jan-1
3
Apr-
13
Jul-13
Oct-13
Jan-1
4
bcm
China natural gas production Net import
Apparent consumption YoY%
SOURCES: CIMB, WIND SOURCES: CIMB, WIND
Figure 26: China pipeline natural gas import Figure 27: China LNG import
Title:
Source:
-
0.5
1.0
1.5
2.0
2.5
3.0
Jan-1
0
Mar-
10
May-
10
Jul-10
Sep-1
0
Nov-
10
Jan-1
1
Mar-
11
May-
11
Jul-11
Sep-1
1
Nov-
11
Jan-1
2
Mar-
12
May-
12
Jul-12
Sep-1
2
Nov-
12
Jan-1
3
Mar-
13
May-
13
Jul-13
Sep-1
3
Nov-
13
Jan-1
4
bcm
China pipeline natural gas import
Title:
Source:
-
0.5
1.0
1.5
2.0
2.5
3.0
3.5
4.0
Jan-1
0
Mar-
10
May-
10
Jul-10
Sep-1
0
Nov-
10
Jan-1
1
Mar-
11
May-
11
Jul-11
Sep-1
1
Nov-
11
Jan-1
2
Mar-
12
May-
12
Jul-12
Sep-1
2
Nov-
12
Jan-1
3
Mar-
13
May-
13
Jul-13
Sep-1
3
Nov-
13
Jan-1
4
bcm
China LNG import
SOURCES: CIMB, WIND SOURCES: CIMB, WIND
Figure 28: China crude oil processed volume and growth Figure 29: China refined product production and growth
Title:
Source:
-15%
-10%
-5%
0%
5%
10%
15%
20%
25%
30%
35%
-
5
10
15
20
25
30
35
40
45
50
Jan-0
7
May-
07
Sep-0
7
Jan-0
8
May-
08
Sep-0
8
Jan-0
9
May-
09
Sep-0
9
Jan-1
0
May-
10
Sep-1
0
Jan-1
1
May-
11
Sep-1
1
Jan-1
2
May-
12
Sep-1
2
Jan-1
3
May-
13
Sep-1
3
Jan-1
4
m tonnes
Crude oil processed YoY%
Title:
Source:
-15%
-10%
-5%
0%
5%
10%
15%
20%
25%
30%
-
5
10
15
20
25
30
Jan-0
7
May-
07
Sep-0
7
Jan-0
8
May-
08
Sep-0
8
Jan-0
9
May-
09
Sep-0
9
Jan-1
0
May-
10
Sep-1
0
Jan-1
1
May-
11
Sep-1
1
Jan-1
2
May-
12
Sep-1
2
Jan-1
3
May-
13
Sep-1
3
Jan-1
4
m tonnes
Gasoline production Diesel production
Kerosene production Refined product production growth
SOURCES: CIMB, WIND SOURCES: CIMB, WIND

OIL & GAS - OVERALL
April 3, 2014
12
7. VALUATION CHARTS
Figure 30: PetroChina - 12 months forward P/E band (HK$) Figure 31: PetroChina - Forward PE chart (x)
Title:
Source:
Please fill in the values above to have them entered in your report
0
5
10
15
20
25
Apr-
00
Oct-00
Apr-
01
Oct-01
Apr-
02
Oct-02
Apr-
03
Oct-03
Apr-
04
Oct-04
Apr-
05
Oct-05
Apr-
06
Oct-06
Apr-
07
Oct-07
Apr-
08
Oct-08
Apr-
09
Oct-09
Apr-
10
Oct-10
Apr-
11
Oct-11
Apr-
12
Oct-12
Apr-
13
Oct-13
Petrochina (857 HK) 3x 8x 15x 20x
Title:
Source:
Please fill in the values above to have them entered in your report
-
5.00
10.00
15.00
20.00
25.00
30.00
35.00
Apr-
00
Oct-00
Apr-
01
Oct-01
Apr-
02
Oct-02
Apr-
03
Oct-03
Apr-
04
Oct-04
Apr-
05
Oct-05
Apr-
06
Oct-06
Apr-
07
Oct-07
Apr-
08
Oct-08
Apr-
09
Oct-09
Apr-
10
Oct-10
Apr-
11
Oct-11
Apr-
12
Oct-12
Apr-
13
Oct-13
Forward PE +1SD -1SD Mean
SOURCES: CIMB, BLOOMBERG SOURCES: CIMB, BLOOMBERG
Figure 32: PetroChina - 12 months forward P/BV band (HK$) Figure 33: PetroChina - Forward P/BV chart (x)
Title:
Source:
Please fill in the values above to have them entered in your report
0
2
4
6
8
10
12
14
16
18
20
Apr-
00
Oct-00
Apr-
01
Oct-01
Apr-
02
Oct-02
Apr-
03
Oct-03
Apr-
04
Oct-04
Apr-
05
Oct-05
Apr-
06
Oct-06
Apr-
07
Oct-07
Apr-
08
Oct-08
Apr-
09
Oct-09
Apr-
10
Oct-10
Apr-
11
Oct-11
Apr-
12
Oct-12
Apr-
13
Oct-13
Petrochina (857 HK) 0.5x 1x 1.5x 2x
Title:
Source:
Please fill in the values above to have them entered in your report
-
0.50
1.00
1.50
2.00
2.50
3.00
3.50
4.00
4.50
5.00
Apr-
00
Oct-00
Apr-
01
Oct-01
Apr-
02
Oct-02
Apr-
03
Oct-03
Apr-
04
Oct-04
Apr-
05
Oct-05
Apr-
06
Oct-06
Apr-
07
Oct-07
Apr-
08
Oct-08
Apr-
09
Oct-09
Apr-
10
Oct-10
Apr-
11
Oct-11
Apr-
12
Oct-12
Apr-
13
Oct-13
Forward PB +1SD -1SD Mean
SOURCES: CIMB, BLOOMBERG SOURCES: CIMB, BLOOMBERG

OIL & GAS - OVERALL
April 3, 2014
13
Figure 34: Sinopec - 12 months forward P/E band (HK$) Figure 35: Sinopec - Forward P/E chart (x)
Title:
Source:
Please fill in the values above to have them entered in your report
0
2
4
6
8
10
12
14
16
18
Oct-00
Apr-
01
Oct-01
Apr-
02
Oct-02
Apr-
03
Oct-03
Apr-
04
Oct-04
Apr-
05
Oct-05
Apr-
06
Oct-06
Apr-
07
Oct-07
Apr-
08
Oct-08
Apr-
09
Oct-09
Apr-
10
Oct-10
Apr-
11
Oct-11
Apr-
12
Oct-12
Apr-
13
Oct-13
Sinopec (386 HK) 3x 8x 15x 20x
Title:
Source:
Please fill in the values above to have them entered in your report
-
5.00
10.00
15.00
20.00
25.00
30.00
35.00
40.00
45.00
50.00
Oct-00
Apr-
01
Oct-01
Apr-
02
Oct-02
Apr-
03
Oct-03
Apr-
04
Oct-04
Apr-
05
Oct-05
Apr-
06
Oct-06
Apr-
07
Oct-07
Apr-
08
Oct-08
Apr-
09
Oct-09
Apr-
10
Oct-10
Apr-
11
Oct-11
Apr-
12
Oct-12
Apr-
13
Oct-13
Forward PE +1SD -1SD Mean
SOURCES: CIMB, BLOOMBERG SOURCES: CIMB, BLOOMBERG
Figure 36: Sinopec - 12 months forward P/BV band (HK$) Figure 37: Sinopec - Forward P/BV chart (x)
Title:
Source:
Please fill in the values above to have them entered in your report
0
2
4
6
8
10
12
14
Oct-00
Apr-
01
Oct-01
Apr-
02
Oct-02
Apr-
03
Oct-03
Apr-
04
Oct-04
Apr-
05
Oct-05
Apr-
06
Oct-06
Apr-
07
Oct-07
Apr-
08
Oct-08
Apr-
09
Oct-09
Apr-
10
Oct-10
Apr-
11
Oct-11
Apr-
12
Oct-12
Apr-
13
Oct-13
Sinopec (386 HK) 0.5x 1x 1.5x 2x
Title:
Source:
Please fill in the values above to have them entered in your report
-
0.50
1.00
1.50
2.00
2.50
3.00
3.50
4.00
4.50
Oct-00
Apr-
01
Oct-01
Apr-
02
Oct-02
Apr-
03
Oct-03
Apr-
04
Oct-04
Apr-
05
Oct-05
Apr-
06
Oct-06
Apr-
07
Oct-07
Apr-
08
Oct-08
Apr-
09
Oct-09
Apr-
10
Oct-10
Apr-
11
Oct-11
Apr-
12
Oct-12
Apr-
13
Oct-13
Forward PB +1SD -1SD Mean
SOURCES: CIMB, BLOOMBERG SOURCES: CIMB, BLOOMBERG
OIL & GAS - OVERALL
April 3, 2014
14
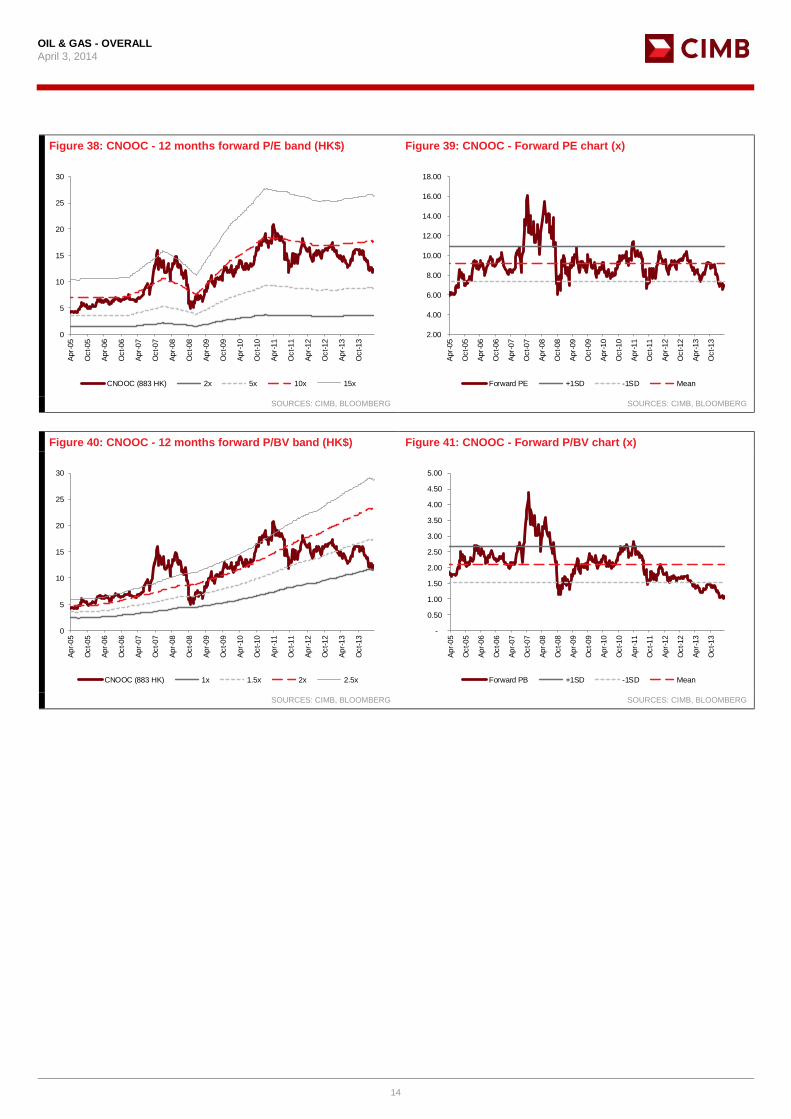
Figure 38: CNOOC - 12 months forward P/E band (HK$) Figure 39: CNOOC - Forward PE chart (x)
Title:
Source:
Please fill in the values above to have them entered in your report
0
5
10
15
20
25
30
Apr-
05
Oct-05
Apr-
06
Oct-06
Apr-
07
Oct-07
Apr-
08
Oct-08
Apr-
09
Oct-09
Apr-
10
Oct-10
Apr-
11
Oct-11
Apr-
12
Oct-12
Apr-
13
Oct-13
CNOOC (883 HK) 2x 5x 10x 15x
Title:
Source:
Please fill in the values above to have them entered in your report
2.00
4.00
6.00
8.00
10.00
12.00
14.00
16.00
18.00
Apr-
05
Oct-05
Apr-
06
Oct-06
Apr-
07
Oct-07
Apr-
08
Oct-08
Apr-
09
Oct-09
Apr-
10
Oct-10
Apr-
11
Oct-11
Apr-
12
Oct-12
Apr-
13
Oct-13
Forward PE +1SD -1SD Mean
SOURCES: CIMB, BLOOMBERG SOURCES: CIMB, BLOOMBERG
Figure 40: CNOOC - 12 months forward P/BV band (HK$) Figure 41: CNOOC - Forward P/BV chart (x)
Title:
Source:
Please fill in the values above to have them entered in your report
0
5
10
15
20
25
30
Apr-
05
Oct-05
Apr-
06
Oct-06
Apr-
07
Oct-07
Apr-
08
Oct-08
Apr-
09
Oct-09
Apr-
10
Oct-10
Apr-
11
Oct-11
Apr-
12
Oct-12
Apr-
13
Oct-13
CNOOC (883 HK) 1x 1.5x 2x 2.5x
Title:
Source:
Please fill in the values above to have them entered in your report
-
0.50
1.00
1.50
2.00
2.50
3.00
3.50
4.00
4.50
5.00
Apr-
05
Oct-05
Apr-
06
Oct-06
Apr-
07
Oct-07
Apr-
08
Oct-08
Apr-
09
Oct-09
Apr-
10
Oct-10
Apr-
11
Oct-11
Apr-
12
Oct-12
Apr-
13
Oct-13
Forward PB +1SD -1SD Mean
SOURCES: CIMB, BLOOMBERG SOURCES: CIMB, BLOOMBERG

OIL & GAS - OVERALL
April 3, 2014
15
Figure 42: Anton - 12 months forward P/E band (HK$) Figure 43: Anton - Forward P/E chart (x)
Title:
Source:
Please fill in the values above to have them entered in your report
0
1
2
3
4
5
6
7
8
Dec-
07
Jun-0
8
Dec-
08
Jun-0
9
Dec-
09
Jun-1
0
Dec-
10
Jun-1
1
Dec-
11
Jun-1
2
Dec-
12
Jun-1
3
Dec-
13
Anton (3337 HK) 3x 8x 15x 20x
Title:
Source:
Please fill in the values above to have them entered in your report
-
10.00
20.00
30.00
40.00
50.00
60.00
70.00
80.00
Dec-
07
Jun-0
8
Dec-
08
Jun-0
9
Dec-
09
Jun-1
0
Dec-
10
Jun-1
1
Dec-
11
Jun-1
2
Dec-
12
Jun-1
3
Dec-
13
Forward PE +1SD -1SD Mean
SOURCES: CIMB, BLOOMBERG SOURCES: CIMB, BLOOMBERG
Figure 44: Anton - 12 months forward P/BV band (HK$) Figure 45: Anton - Forward P/BV chart (x)
Title:
Source:
Please fill in the values above to have them entered in your report
0
1
2
3
4
5
6
7
8
Dec-
07
Jun-0
8
Dec-
08
Jun-0
9
Dec-
09
Jun-1
0
Dec-
10
Jun-1
1
Dec-
11
Jun-1
2
Dec-
12
Jun-1
3
Dec-
13
Anton (3337 HK) 0.5x 1x 2x 3x
Title:
Source:
Please fill in the values above to have them entered in your report
-
1.00
2.00
3.00
4.00
5.00
6.00
Dec-
07
Jun-0
8
Dec-
08
Jun-0
9
Dec-
09
Jun-1
0
Dec-
10
Jun-1
1
Dec-
11
Jun-1
2
Dec-
12
Jun-1
3
Dec-
13
Forward PB +1SD -1SD Mean
SOURCES: CIMB, BLOOMBERG SOURCES: CIMB, BLOOMBERG

OIL & GAS - OVERALL
April 3, 2014
16
Figure 46: SPT - 12 months forward P/E band (HK$) Figure 47: SPT - forward P/E chart (x)
Title:
Source:
Please fill in the values above to have them entered in your report
0
1
2
3
4
5
6
Dec-
11
Jan-1
2
Feb
-12
Mar-
12
Apr-
12
May-
12
Jun-1
2
Jul-12
Aug-1
2
Sep-1
2
Oct-12
Nov-
12
Dec-
12
Jan-1
3
Feb
-13
Mar-
13
Apr-
13
May-
13
Jun-1
3
Jul-13
Aug-1
3
Sep-1
3
Oct-13
Nov-
13
Dec-
13
Jan-1
4
Feb
-14
Mar-
14
SPT (1251 HK) (HK$/sh) 5x 8x 10x 15x
Title:
Source:
Please fill in the values above to have them entered in your report
-
2.00
4.00
6.00
8.00
10.00
12.00
14.00
16.00
18.00
20.00
Dec-
11
Jan-1
2
Feb
-12
Mar-
12
Apr-
12
May-
12
Jun-1
2
Jul-12
Aug-1
2
Sep-1
2
Oct-12
Nov-
12
Dec-
12
Jan-1
3
Feb
-13
Mar-
13
Apr-
13
May-
13
Jun-1
3
Jul-13
Aug-1
3
Sep-1
3
Oct-13
Nov-
13
Dec-
13
Jan-1
4
Feb
-14
Mar-
14
Forward P/E +1SD -1SD Mean
SOURCES: CIMB, BLOOMBERG SOURCES: CIMB, BLOOMBERG
Figure 48: SPT - 12 months forward P/BV band (HK$) Figure 49: SPT - forward P/BV chart (x)
Title:
Source:
Please fill in the values above to have them entered in your report
0
1
2
3
4
5
6
Dec-
11
Jan-1
2
Feb
-12
Mar-
12
Apr-
12
May-
12
Jun-1
2
Jul-12
Aug-1
2
Sep-1
2
Oct-12
Nov-
12
Dec-
12
Jan-1
3
Feb
-13
Mar-
13
Apr-
13
May-
13
Jun-1
3
Jul-13
Aug-1
3
Sep-1
3
Oct-13
Nov-
13
Dec-
13
Jan-1
4
Feb
-14
Mar-
14
SPT (1251 HK) (HK$/sh) 0.5x 1x 2x 3x
Title:
Source:
Please fill in the values above to have them entered in your report
-
0.50
1.00
1.50
2.00
2.50
3.00
3.50
Dec-
11
Jan-1
2
Feb
-12
Mar-
12
Apr-
12
May-
12
Jun-1
2
Jul-12
Aug-1
2
Sep-1
2
Oct-12
Nov-
12
Dec-
12
Jan-1
3
Feb
-13
Mar-
13
Apr-
13
May-
13
Jun-1
3
Jul-13
Aug-1
3
Sep-1
3
Oct-13
Nov-
13
Dec-
13
Jan-1
4
Feb
-14
Mar-
14
Forward P/BV +1SD -1SD Mean
SOURCES: CIMB, BLOOMBERG SOURCES: CIMB, BLOOMBERG
OIL & GAS - OVERALL
April 3, 2014
17
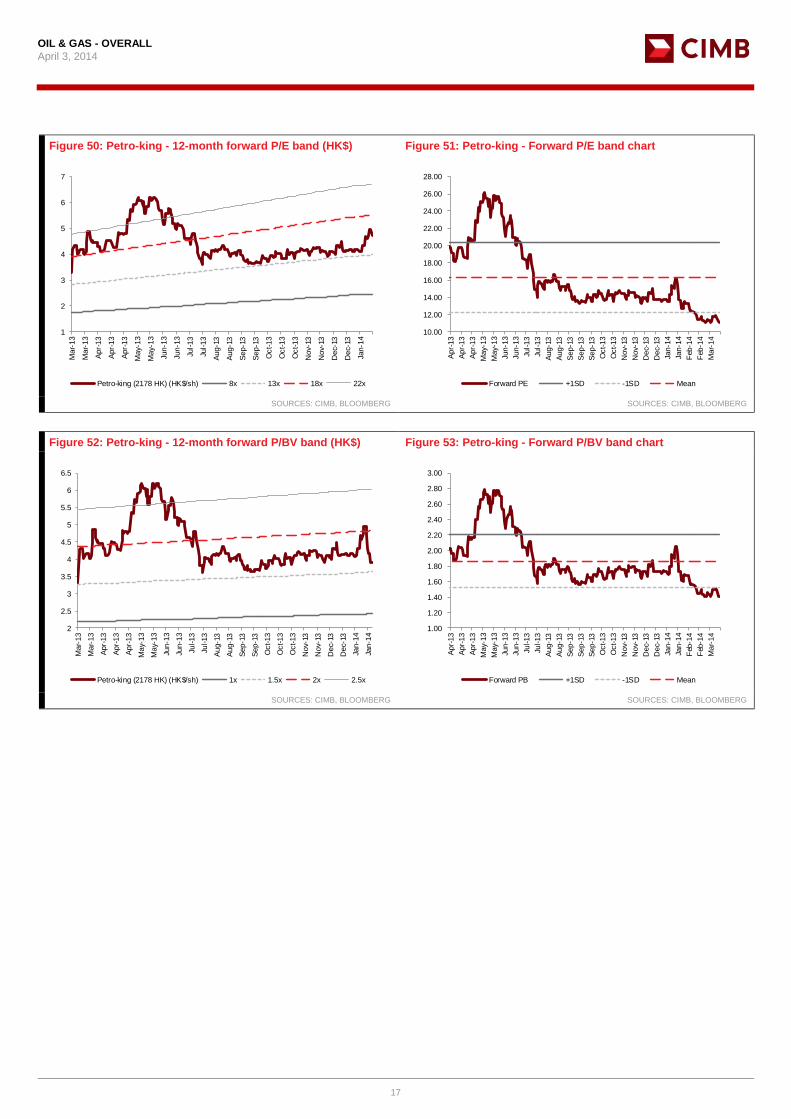
Figure 50: Petro-king - 12-month forward P/E band (HK$) Figure 51: Petro-king - Forward P/E band chart
Title:
Source:
Please fill in the values above to have them entered in your report
1
2
3
4
5
6
7
Mar-
13
Mar-
13
Apr-
13
Apr-
13
Apr-
13
May-
13
May-
13
Jun-1
3
Jun-1
3
Jul-13
Jul-13
Aug-1
3
Aug-1
3
Sep-1
3
Sep-1
3
Oct-13
Oct-13
Oct-13
Nov-
13
Nov-
13
Dec-
13
Dec-
13
Jan-1
4
Petro-king (2178 HK) (HK$/sh) 8x 13x 18x 22x
Title:
Source:
Please fill in the values above to have them entered in your report
10.00
12.00
14.00
16.00
18.00
20.00
22.00
24.00
26.00
28.00
Apr-
13
Apr-
13
Apr-
13
May-
13
May-
13
Jun-1
3
Jun-1
3
Jul-13
Jul-13
Aug-1
3
Aug-1
3
Sep-1
3
Sep-1
3
Sep-1
3
Oct-13
Oct-13
Nov-
13
Nov-
13
Dec-
13
Dec-
13
Jan-1
4
Jan-1
4
Feb
-14
Feb
-14
Mar-
14
Forward PE +1SD -1SD Mean
SOURCES: CIMB, BLOOMBERG SOURCES: CIMB, BLOOMBERG
Figure 52: Petro-king - 12-month forward P/BV band (HK$) Figure 53: Petro-king - Forward P/BV band chart
Title:
Source:
Please fill in the values above to have them entered in your report
2
2.5
3
3.5
4
4.5
5
5.5
6
6.5
Mar-
13
Mar-
13
Apr-
13
Apr-
13
Apr-
13
May-
13
May-
13
Jun-1
3
Jun-1
3
Jul-13
Jul-13
Aug-1
3
Aug-1
3
Sep-1
3
Sep-1
3
Oct-13
Oct-13
Oct-13
Nov-
13
Nov-
13
Dec-
13
Dec-
13
Jan-1
4
Jan-1
4
Petro-king (2178 HK) (HK$/sh) 1x 1.5x 2x 2.5x
Title:
Source:
Please fill in the values above to have them entered in your report
1.00
1.20
1.40
1.60
1.80
2.00
2.20
2.40
2.60
2.80
3.00
Apr-
13
Apr-
13
Apr-
13
May-
13
May-
13
Jun-1
3
Jun-1
3
Jul-13
Jul-13
Aug-1
3
Aug-1
3
Sep-1
3
Sep-1
3
Sep-1
3
Oct-13
Oct-13
Nov-
13
Nov-
13
Dec-
13
Dec-
13
Jan-1
4
Jan-1
4
Feb
-14
Feb
-14
Mar-
14
Forward PB +1SD -1SD Mean
SOURCES: CIMB, BLOOMBERG SOURCES: CIMB, BLOOMBERG

OIL & GAS - OVERALL
April 3, 2014
18
DISCLAIMER
This report is not directed to, or intended for distribution to or use by, any person or entity who is a citizen or resident of or located in any locality, state, country or other jurisdiction where such distribution, publication, availability or use would be contrary to law or regulation.
By accepting this report, the recipient hereof represents and warrants that he is entitled to receive such report in accordance with the restrictions set forth below and agrees to be bound by the limitations contained herein (including the “Restrictions on Distributions” set out below). Any failure to comply with these limitations may constitute a violation of law. This publication is being supplied to you strictly on the basis that it will remain confidential. No part of this report may be (i) copied, photocopied, duplicated, stored or reproduced in any form by any means or (ii) redistributed or passed on, directly or indirectly, to any other person in whole or in part, for any purpose without the prior written consent of CIMB.
Unless otherwise specified, this report is based upon sources which CIMB considers to be reasonable. Such sources will, unless otherwise specified, for market data, be market data and prices available from the main stock exchange or market where the relevant security is listed, or, where appropriate, any other market. Information on the accounts and business of company(ies) will generally be based on published statements of the company(ies), information disseminated by regulatory information services, other publicly available information and information resulting from our research.
Whilst every effort is made to ensure that statements of facts made in this report are accurate, all estimates, projections, forecasts, expressions of opinion and other subjective judgments contained in this report are based on assumptions considered to be reasonable as of the date of the document in which they are contained and must not be construed as a representation that the matters referred to therein will occur. Past performance is not a reliable indicator of future performance. The value of investments may go down as well as up and those investing may, depending on the investments in question, lose more than the initial investment. No report shall constitute an offer or an invitation by or on behalf of CIMB or its affiliates to any person to buy or sell any investments.
CIMB, its affiliates and related companies, their directors, associates, connected parties and/or employees may own or have positions in securities of the company(ies) covered in this research report or any securities related thereto and may from time to time add to or dispose of, or may be materially interested in, any such securities. Further, CIMB, its affiliates and its related companies do and seek to do business with the company(ies) covered in this research report and may from time to time act as market maker or have assumed an underwriting commitment in securities of such company(ies), may sell them to or buy them from customers on a principal basis and may also perform or seek to perform significant investment banking, advisory, underwriting or placement services for or relating to such company(ies) as well as solicit such investment, advisory or other services from any entity mentioned in this report.
CIMB or its affiliates may enter into an agreement with the company(ies) covered in this report relating to the production of research reports. CIMB may disclose the contents of this report to the company(ies) covered by it and may have amended the contents of this report following such disclosure.
The analyst responsible for the production of this report hereby certifies that the views expressed herein accurately and exclusively reflect his or her personal views and opinions about any and all of the issuers or securities analysed in this report and were prepared independently and autonomously. No part of the compensation of the analyst(s) was, is, or will be directly or indirectly related to the inclusion of specific recommendations(s) or view(s) in this report. CIMB prohibits the analyst(s) who prepared this research report from receiving any compensation, incentive or bonus based on specific investment banking transactions or for providing a specific recommendation for, or view of, a particular company. Information barriers and other arrangements may be established where necessary to prevent conflicts of interests arising. However, the analyst(s) may receive compensation that is based on his/their coverage of company(ies) in the performance of his/their duties or the performance of his/their recommendations and the research personnel involved in the preparation of this report may also participate in the solicitation of the businesses as described above. In reviewing this research report, an investor should be aware that any or all of the foregoing, among other things, may give rise to real or potential conflicts of interest. Additional information is, subject to the duties of confidentiality, available on request.
Reports relating to a specific geographical area are produced by the corresponding CIMB entity as listed in the table below. The term “CIMB” shall denote, where appropriate, the relevant entity distributing or disseminating the report in the particular jurisdiction referenced below, or, in every other case, CIMB Group Holdings Berhad ("CIMBGH") and its affiliates, subsidiaries and related companies.
Country CIMB Entity Regulated by
Australia CIMB Securities (Australia) Limited Australian Securities & Investments Commission
Hong Kong CIMB Securities Limited Securities and Futures Commission Hong Kong
Indonesia PT CIMB Securities Indonesia Financial Services Authority of Indonesia
India CIMB Securities (India) Private Limited Securities and Exchange Board of India (SEBI)
Malaysia CIMB Investment Bank Berhad Securities Commission Malaysia
Singapore CIMB Research Pte. Ltd. Monetary Authority of Singapore
South Korea CIMB Securities Limited, Korea Branch Financial Services Commission and Financial Supervisory Service
Taiwan CIMB Securities Limited, Taiwan Branch Financial Supervisory Commission
Thailand CIMB Securities (Thailand) Co. Ltd. Securities and Exchange Commission Thailand
(i) As of April 2, 2014, CIMB has a proprietary position in the securities (which may include but not limited to shares, warrants, call warrants and/or any other derivatives) in the following company or companies covered or recommended in this report:
(a) CNOOC Limited, PetroChina Co Ltd, Wah Seong Corp
(ii) As of April 3, 2014, the analyst(s) who prepared this report, has / have an interest in the securities (which may include but not limited to shares, warrants, call warrants and/or any other derivatives) in the following company or companies covered or recommended in this report:
(a) -
The information contained in this research report is prepared from data believed to be correct and reliable at the time of issue of this report. CIMB may or may not issue regular reports on the subject matter of this report at any frequency and may cease to do so or change the periodicity of reports at any time. CIMB is under no obligation to update this report in the event of a material change to the information contained in this report. This report does not purport to contain all the information that a prospective investor may require. CIMB or any of its affiliates does not make any guarantee, representation or warranty, express or implied, as to the adequacy, accuracy, completeness, reliability or fairness of any such information and opinion contained in this report. Neither CIMB nor any of its affiliates nor its related persons shall be liable in any manner whatsoever for any consequences (including but not limited to any direct, indirect or consequential losses, loss of profits and damages) of any reliance thereon or usage thereof.
This report is general in nature and has been prepared for information purposes only. It is intended for circulation amongst CIMB and its affiliates’ clients generally and does not have regard to the specific investment objectives, financial situation and the particular needs of any specific person who may receive this report. The information and opinions in this report are not and should not be construed or considered as an offer, recommendation or solicitation to buy or sell the subject securities, related investments or other financial instruments thereof.
Investors are advised to make their own independent evaluation of the information contained in this research report, consider their own individual investment objectives, financial situation and particular needs and consult their own professional and financial advisers as to the legal, business, financial, tax and other aspects before participating in any transaction in respect of the securities of company(ies) covered in this research report. The securities of such company(ies) may not be eligible for sale in all jurisdictions or to all categories of investors.
Australia: Despite anything in this report to the contrary, this research is provided in Australia by CIMB Securities (Australia) Limited (“CSAL”) (ABN 84 002 768 701, AFS Licence number 240 530). CSAL is a Market Participant of ASX Ltd, a Clearing Participant of ASX Clear Pty Ltd, a Settlement Participant of ASX Settlement Pty Ltd, and, a participant of Chi X Australia Pty Ltd. This research is only available in Australia to persons who are “wholesale clients” (within the meaning of the Corporations Act 2001 (Cth)) and is supplied solely for the use of such wholesale clients and shall not be distributed or passed on to any other person. This research has been prepared without taking into account the objectives, financial situation or needs of the individual recipient.
France: Only qualified investors within the meaning of French law shall have access to this report. This report shall not be considered as an offer to subscribe to, or used in connection with, any offer for subscription or sale or marketing or direct or indirect distribution of financial instruments and it is not intended as a solicitation for the purchase of any financial instrument.
Hong Kong: This report is issued and distributed in Hong Kong by CIMB Securities Limited (“CHK”) which is licensed in Hong Kong by the Securities and Futures Commission for Type 1 (dealing in securities), Type 4 (advising on securities) and Type 6 (advising on corporate finance) activities. Any investors wishing to purchase or otherwise deal in the securities

OIL & GAS - OVERALL
April 3, 2014
19
covered in this report should contact the Head of Sales at CIMB Securities Limited. The views and opinions in this research report are our own as of the date hereof and are subject to change. If the Financial Services and Markets Act of the United Kingdom or the rules of the Financial Conduct Authority apply to a recipient, our obligations owed to such recipient therein are unaffected. CHK has no obligation to update its opinion or the information in this research report.
This publication is strictly confidential and is for private circulation only to clients of CHK. This publication is being supplied to you strictly on the basis that it will remain confidential. No part of this material may be (i) copied, photocopied, duplicated, stored or reproduced in any form by any means or (ii) redistributed or passed on, directly or indirectly, to any other person in whole or in part, for any purpose without the prior written consent of CHK. Unless permitted to do so by the securities laws of Hong Kong, no person may issue or have in its possession for the purposes of issue, whether in Hong Kong or elsewhere, any advertisement, invitation or document relating to the securities covered in this report, which is directed at, or the contents of which are likely to be accessed or read by, the public in Hong Kong (except if permitted to do so under the securities laws of Hong Kong).
India: This report is issued and distributed in India by CIMB Securities (India) Private Limited (“CIMB India”) which is registered with SEBI as a stock-broker under the Securities and Exchange Board of India (Stock Brokers and Sub-Brokers) Regulations, 1992 and in accordance with the provisions of Regulation 4 (g) of the Securities and Exchange Board of India (Investment Advisers) Regulations, 2013, CIMB India is not required to seek registration with SEBI as an Investment Adviser.
The research analysts, strategists or economists principally responsible for the preparation of this research report are segregated from the other activities of CIMB India and they have received compensation based upon various factors, including quality, accuracy and value of research, firm profitability or revenues, client feedback and competitive factors. Research analysts', strategists' or economists' compensation is not linked to investment banking or capital markets transactions performed or proposed to be performed by CIMB India or its affiliates.
Indonesia: This report is issued and distributed by PT CIMB Securities Indonesia (“CIMBI”). The views and opinions in this research report are our own as of the date hereof and are subject to change. If the Financial Services and Markets Act of the United Kingdom or the rules of the Financial Conduct Authority apply to a recipient, our obligations owed to such recipient therein are unaffected. CIMBI has no obligation to update its opinion or the information in this research report.
This publication is strictly confidential and is for private circulation only to clients of CIMBI. This publication is being supplied to you strictly on the basis that it will remain confidential. No part of this material may be (i) copied, photocopied, duplicated, stored or reproduced in any form by any means or (ii) redistributed or passed on, directly or indirectly, to any other person in whole or in part, for any purpose without the prior written consent of CIMBI. Neither this report nor any copy hereof may be distributed in Indonesia or to any Indonesian citizens wherever they are domiciled or to Indonesia residents except in compliance with applicable Indonesian capital market laws and regulations.
Malaysia: This report is issued and distributed by CIMB Investment Bank Berhad (“CIMB”). The views and opinions in this research report are our own as of the date hereof and are subject to change. If the Financial Services and Markets Act of the United Kingdom or the rules of the Financial Conduct Authority apply to a recipient, our obligations owed to such recipient therein are unaffected. CIMB has no obligation to update its opinion or the information in this research report.
This publication is strictly confidential and is for private circulation only to clients of CIMB. This publication is being supplied to you strictly on the basis that it will remain confidential. No part of this material may be (i) copied, photocopied, duplicated, stored or reproduced in any form by any means or (ii) redistributed or passed on, directly or indirectly, to any other person in whole or in part, for any purpose without the prior written consent of CIMB.
New Zealand: In New Zealand, this report is for distribution only to persons whose principal business is the investment of money or who, in the course of, and for the purposes of their business, habitually invest money pursuant to Section 3(2)(a)(ii) of the Securities Act 1978.
Singapore: This report is issued and distributed by CIMB Research Pte Ltd (“CIMBR”). Recipients of this report are to contact CIMBR in Singapore in respect of any matters arising from, or in connection with, this report. The views and opinions in this research report are our own as of the date hereof and are subject to change. If the Financial Services and Markets Act of the United Kingdom or the rules of the Financial Conduct Authority apply to a recipient, our obligations owed to such recipient therein are unaffected. CIMBR has no obligation to update its opinion or the information in this research report.
This publication is strictly confidential and is for private circulation only. If the recipient of this research report is not an accredited investor, expert investor or institutional investor, CIMBR accepts legal responsibility for the contents of the report without any disclaimer limiting or otherwise curtailing such legal responsibility. This publication is being supplied to you strictly on the basis that it will remain confidential. No part of this material may be (i) copied, photocopied, duplicated, stored or reproduced in any form by any means or (ii) redistributed or passed on, directly or indirectly, to any other person in whole or in part, for any purpose without the prior written consent of CIMBR..
As of April 2, 2014, CIMBR does not have a proprietary position in the recommended securities in this report.
South Korea: This report is issued and distributed in South Korea by CIMB Securities Limited, Korea Branch ("CIMB Korea") which is licensed as a cash equity broker, and regulated by the Financial Services Commission and Financial Supervisory Service of Korea.
The views and opinions in this research report are our own as of the date hereof and are subject to change, and this report shall not be considered as an offer to subscribe to, or used in connection with, any offer for subscription or sale or marketing or direct or indirect distribution of financial investment instruments and it is not intended as a solicitation for the purchase of any financial investment instrument.
This publication is strictly confidential and is for private circulation only, and no part of this material may be (i) copied, photocopied, duplicated, stored or reproduced in any form by any means or (ii) redistributed or passed on, directly or indirectly, to any other person in whole or in part, for any purpose without the prior written consent of CIMB Korea.
Sweden: This report contains only marketing information and has not been approved by the Swedish Financial Supervisory Authority. The distribution of this report is not an offer to sell to any person in Sweden or a solicitation to any person in Sweden to buy any instruments described herein and may not be forwarded to the public in Sweden.
Taiwan: This research report is not an offer or marketing of foreign securities in Taiwan. The securities as referred to in this research report have not been and will not be registered with the Financial Supervisory Commission of the Republic of China pursuant to relevant securities laws and regulations and may not be offered or sold within the Republic of China through a public offering or in circumstances which constitutes an offer or a placement within the meaning of the Securities and Exchange Law of the Republic of China that requires a registration or approval of the Financial Supervisory Commission of the Republic of China.
Thailand: This report is issued and distributed by CIMB Securities (Thailand) Company Limited (CIMBS). The views and opinions in this research report are our own as of the date hereof and are subject to change. If the Financial Services and Markets Act of the United Kingdom or the rules of the Financial Conduct Authority apply to a recipient, our obligations owed to such recipient therein are unaffected. CIMBS has no obligation to update its opinion or the information in this research report.
This publication is strictly confidential and is for private circulation only to clients of CIMBS. This publication is being supplied to you strictly on the basis that it will remain confidential. No part of this material may be (i) copied, photocopied, duplicated, stored or reproduced in any form by any means or (ii) redistributed or passed on, directly or indirectly, to any other person in whole or in part, for any purpose without the prior written consent of CIMBS.
Corporate Governance Report:
The disclosure of the survey result of the Thai Institute of Directors Association (“IOD”) regarding corporate governance is made pursuant to the policy of the Office of the Securities and Exchange Commission. The survey of the IOD is based on the information of a company listed on the Stock Exchange of Thailand and the Market for Alternative Investment disclosed to the public and able to be accessed by a general public investor. The result, therefore, is from the perspective of a third party. It is not an evaluation of operation and is not based on inside information.
The survey result is as of the date appearing in the Corporate Governance Report of Thai Listed Companies. As a result, the survey result may be changed after that date. CIMBS does not confirm nor certify the accuracy of such survey result.
Score Range: 90 – 100 80 – 89 70 – 79 Below 70 or No Survey Result Description: Excellent Very Good Good N/A
United Arab Emirates: The distributor of this report has not been approved or licensed by the UAE Central Bank or any other relevant licensing authorities or governmental agencies in the United Arab Emirates. This report is strictly private and confidential and has not been reviewed by, deposited or registered with UAE Central Bank or any other licensing authority or governmental agencies in the United Arab Emirates. This report is being issued outside the United Arab Emirates to a limited number of institutional investors and must not be provided to any person other than the original recipient and may not be reproduced or used for any other purpose. Further, the information contained in this report is not intended to lead to the sale of investments under any subscription agreement or the conclusion of any other contract of whatsoever nature within the territory of the United Arab Emirates.
United Kingdom and Europe: In the United Kingdom and European Economic Area, this report is being disseminated by CIMB Securities (UK) Limited (“CIMB UK”). CIMB UK is authorised and regulated by the Financial Conduct Authority and its registered office is at 27 Knightsbridge, London, SW1X 7YB. This report is for distribution only to, and is solely directed at, selected persons on the basis that those persons: (a) are persons that are eligible counterparties and professional clients of CIMB UK; (b) have professional experience in
OIL & GAS - OVERALL
April 3, 2014
20
matters relating to investments falling within Article 19(5) of the Financial Services and Markets Act 2000 (Financial Promotion) Order 2005 (as amended, the “Order”); (c) are persons falling within Article 49 (2) (a) to (d) (“high net worth companies, unincorporated associations etc”) of the Order; (d) are outside the United Kingdom; or (e) are persons to whom an invitation or inducement to engage in investment activity (within the meaning of section 21 of the Financial Services and Markets Act 2000) in connection with any investments to which this report relates may otherwise lawfully be communicated or caused to be communicated (all such persons together being referred to as “relevant persons”). This report is directed only at relevant persons and must not be acted on or relied on by persons who are not relevant persons. Any investment or investment activity to which this report relates is available only to relevant persons and will be engaged in only with relevant persons.
Only where this report is labelled as non-independent, it does not provide an impartial or objective assessment of the subject matter and does not constitute independent "investment research" under the applicable rules of the Financial Conduct Authority in the UK. Consequently, any such non-independent report will not have been prepared in accordance with legal requirements designed to promote the independence of investment research and will not subject to any prohibition on dealing ahead of the dissemination of investment research.
United States: This research report is distributed in the United States of America by CIMB Securities (USA) Inc, a U.S.-registered broker-dealer and a related company of CIMB Research Pte Ltd, CIMB Investment Bank Berhad, PT CIMB Securities Indonesia, CIMB Securities (Thailand) Co. Ltd, CIMB Securities Limited, CIMB Securities (Australia) Limited, CIMB Securities (India) Private Limited, and is distributed solely to persons who qualify as "U.S. Institutional Investors" as defined in Rule 15a-6 under the Securities and Exchange Act of 1934. This communication is only for Institutional Investors whose ordinary business activities involve investing in shares, bonds and associated securities and/or derivative securities and who have professional experience in such investments. Any person who is not a U.S. Institutional Investor or Major Institutional Investor must not rely on this communication. The delivery of this research report to any person in the United States of America is not a recommendation to effect any transactions in the securities discussed herein, or an endorsement of any opinion expressed herein. CIMB Securities (USA) Inc, is a FINRA/SIPC member and takes responsibility for the content of this report. For further information or to place an order in any of the above-mentioned securities please contact a registered representative of CIMB Securities (USA) Inc.
Other jurisdictions: In any other jurisdictions, except if otherwise restricted by laws or regulations, this report is only for distribution to professional, institutional or sophisticated investors as defined in the laws and regulations of such jurisdictions.
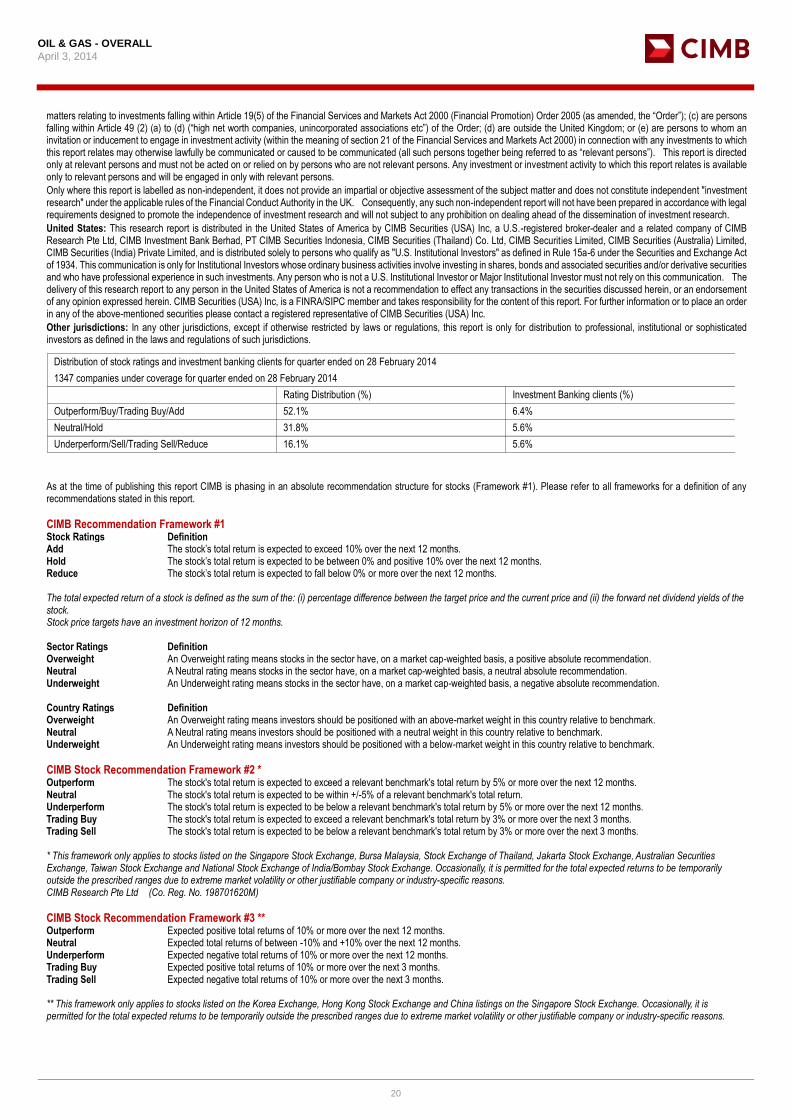
Rating Distribution (%) Investment Banking clients (%)
Outperform/Buy/Trading Buy/Add 52.1% 6.4%
Neutral/Hold 31.8% 5.6%
Underperform/Sell/Trading Sell/Reduce 16.1% 5.6%
Distribution of stock ratings and investment banking clients for quarter ended on 28 February 2014
1347 companies under coverage for quarter ended on 28 February 2014
As at the time of publishing this report CIMB is phasing in an absolute recommendation structure for stocks (Framework #1). Please refer to all frameworks for a definition of any recommendations stated in this report.
CIMB Recommendation Framework #1 Stock Ratings Definition Add The stock’s total return is expected to exceed 10% over the next 12 months. Hold The stock’s total return is expected to be between 0% and positive 10% over the next 12 months. Reduce The stock’s total return is expected to fall below 0% or more over the next 12 months. The total expected return of a stock is defined as the sum of the: (i) percentage difference between the target price and the current price and (ii) the forward net dividend yields of the stock. Stock price targets have an investment horizon of 12 months. Sector Ratings Definition Overweight An Overweight rating means stocks in the sector have, on a market cap-weighted basis, a positive absolute recommendation. Neutral A Neutral rating means stocks in the sector have, on a market cap-weighted basis, a neutral absolute recommendation. Underweight An Underweight rating means stocks in the sector have, on a market cap-weighted basis, a negative absolute recommendation. Country Ratings Definition Overweight An Overweight rating means investors should be positioned with an above-market weight in this country relative to benchmark. Neutral A Neutral rating means investors should be positioned with a neutral weight in this country relative to benchmark. Underweight An Underweight rating means investors should be positioned with a below-market weight in this country relative to benchmark.
CIMB Stock Recommendation Framework #2 * Outperform The stock's total return is expected to exceed a relevant benchmark's total return by 5% or more over the next 12 months. Neutral The stock's total return is expected to be within +/-5% of a relevant benchmark's total return. Underperform The stock's total return is expected to be below a relevant benchmark's total return by 5% or more over the next 12 months. Trading Buy The stock's total return is expected to exceed a relevant benchmark's total return by 3% or more over the next 3 months. Trading Sell The stock's total return is expected to be below a relevant benchmark's total return by 3% or more over the next 3 months. * This framework only applies to stocks listed on the Singapore Stock Exchange, Bursa Malaysia, Stock Exchange of Thailand, Jakarta Stock Exchange, Australian Securities Exchange, Taiwan Stock Exchange and National Stock Exchange of India/Bombay Stock Exchange. Occasionally, it is permitted for the total expected returns to be temporarily outside the prescribed ranges due to extreme market volatility or other justifiable company or industry-specific reasons. CIMB Research Pte Ltd (Co. Reg. No. 198701620M)
CIMB Stock Recommendation Framework #3 ** Outperform Expected positive total returns of 10% or more over the next 12 months. Neutral Expected total returns of between -10% and +10% over the next 12 months. Underperform Expected negative total returns of 10% or more over the next 12 months. Trading Buy Expected positive total returns of 10% or more over the next 3 months. Trading Sell Expected negative total returns of 10% or more over the next 3 months. ** This framework only applies to stocks listed on the Korea Exchange, Hong Kong Stock Exchange and China listings on the Singapore Stock Exchange. Occasionally, it is permitted for the total expected returns to be temporarily outside the prescribed ranges due to extreme market volatility or other justifiable company or industry-specific reasons.

OIL & GAS - OVERALL
April 3, 2014
21
Corporate Governance Report of Thai Listed Companies (CGR). CG Rating by the Thai Institute of Directors Association (IOD) in 2013. AAV – Good, ADVANC - Excellent, AMATA - Very Good, ANAN – Good, AOT - Excellent, AP - Very Good, BANPU - Excellent , BAY - Excellent , BBL - Excellent, BCH – Good, BCP - Excellent, BEC - Very Good, BGH - not available, BJC – Very Good, BH - Very Good, BIGC - Very Good, BTS - Excellent, CCET – Very Good, CENTEL – Very Good, CK - Excellent, CPALL - Very Good, CPF – Excellent, CPN - Excellent, DELTA - Very Good, DTAC - Excellent, EGCO – Excellent, GLOBAL - Good, GLOW - Very Good, GRAMMY – Excellent, HANA - Excellent, HEMRAJ - Excellent, HMPRO - Very Good, INTUCH – Excellent, ITD – Very Good, IVL - Excellent, JAS – Very Good, KAMART – not available, KBANK - Excellent, KKP – Excellent, KTB - Excellent, LH - Very Good, LPN - Excellent, MAJOR – Very Good, MAKRO – Very Good, MCOT - Excellent, MINT - Excellent, PS - Excellent, PSL - Excellent, PTT - Excellent, PTTGC - Excellent, PTTEP - Excellent, QH - Excellent, RATCH - Excellent, ROBINS - Excellent, RS – Excellent, SAMART – Excellent, SC – Excellent, SCB - Excellent, SCC - Excellent, SCCC - Very Good, SIRI – Very Good, SPALI - Excellent, STA - Good, STEC - Very Good, TCAP - Excellent, THAI - Excellent, THCOM – Excellent, TICON – Very Good, TISCO - Excellent, TMB - Excellent, TOP - Excellent, TRUE - Excellent, TTW – Excellent, TUF - Very Good, VGI – Excellent, WORK – Good.