Embed Size (px)
Citation preview
1
Highlights of this month’s edition U.S. Trade with China: Exports to China improving, shoring up overall U.S. exports;
more technology-intensive products; debates in Washington about currency manipulation Sector Spotlight Oil & Gas: China becomes world’s leading oil importer; China’s
overseas oil production set to double by 2015; death of Chavez exposes risks of China’s energy-backed loans
China’s Economy: Zhou Xiaochuan to remain at PBOC and new Finance Minister appointed; business subdued but exports up in January; ongoing concerns about the reliability of China’s GDP statistics; first drop in net FDI since 2009; major intervention by the PBOC to stem inflation
The U.S. Balance of Trade with China The U.S. trade deficit in goods with China in January 2013 was $27 billion, $1.7 billion
higher than at the same point a year earlier. At this rate, the bilateral trade deficit will set a new record. However, the rise in the U.S. trade deficit with China is slower than a year ago, when the deficit increased by nearly $3 billion in January year-on-year. Exports to China in January grew by 12.1 percent over the previous year, compared to 4.4 percent in 2011-2012. Even as export growth accelerated, the rise in imports from China dampened. Trade with China continues to outpace U.S. trade with the world, which registered much
slower growth in January 2013 than a year ago. At this rate, China continues to supplant other U.S. trade partners in importance.
U.S. Trade Growth in January, with China and with the World (Year-on-year growth %)
Source: U.S. Census Bureau, Exports, Imports and Trade Balance by Country, Monthly totals,
1985-present (Washington, DC: U.S. Department of Commerce, Foreign Trade Division, March 2013). http://www.census.gov/foreign-trade/statistics/country
Top Exports and Imports Continuing the trend from the end of 2012, agricultural products were by far the top performing U.S. export to China in January, accounting for a quarter of all exports. However, the strongest gains in January over a year ago were in transportation equipment and computer electronic products, which grew by 29 percent and 25 percent respectively, far outpacing the 12.1 percent growth in total exports.
Exports Imports Exports Imports
2011-2012 4.4% 9.6% 7.6% 7.6%
2012-2013 12.1% 8.1% 2.2% -1.0%
Trade with China Trade with the World
Monthly Summary of U.S.-China Trade Data March 8, 2013

2
Computer and electronics products, as well as electrical equipment, exhibited the strongest growth among top U.S. imports from China. Apparel and miscellaneous manufactures declined. Bilateral trade continues to become more technology-intensive.
Top Exports and Imports through January 2013
(in US$ millions)
Source: U.S. Census Bureau, NAICS database (Washington, DC: U.S. Department of Commerce, Foreign Trade
Division, March 2013). http://censtats.census.gov/cgi-bin/naic3_6/naicCty.pl.
Recent Debates in Washington about Terms of Trade and Currency Manipulation Debate in Washington has focused increasingly on China’s impact on the U.S. economy. Lawrence Edwards and Robert Z. Lawrence of the Peterson Institute for International Economics released a new paper in late February arguing that growth in emerging markets, including China, has brought net benefits to the U.S. economy The authors acknowledge that the U.S. trade deficit with emerging markets has increased, and unfair barriers to U.S. exports in emerging markets remain. But in their view, the U.S. economy has not been
impacted in a serious way. For example, according to the authors, jobs lost in the United States are largely due to productivity gains, and may even be offset by trade with emerging countries. Further, the U.S. terms of trade – the price of exportable goods over the price of importable goods – have in fact improved, so that the United States can purchase a larger quantity of imports with the same quantity of exports.1
Meanwhile, others have called for much tougher action to address the United States’ imbalanced trade relationship with emerging markets. In December 2012, C. Fred Bergsten, also an economist at Peterson, co-authored one of the most comprehensive studies to date on currency manipulation and its impact on the United States. It posits that currency manipulation has cost the United States up to five million jobs and increased its trade deficit by up to $500 billion per year. China is singled out in the report as the most egregious
currency manipulator. The study recommends that the U.S. government take various measures against currency manipulators, including: (1) countervailing currency intervention; (2) a new tax on the earnings of dollar assets acquired by intervening countries with incontrovertible currencies; and (3) countervailing duties.2 On January 31, the Economic
1 Lawrence Edwards & Robert Z. Lawrence, “Rising Tide: Is Growth in Emerging Economies Good for the United
States?” Peterson Institute for International Economics (February 2013). 2 “C. Fred Bergsten & Joseph E. Gagnon, “Currency Manipulation, the US Economy, and Global Economic Order,”
The Peterson Institute for International Economics Policy Brief 12-25 (December 2012). Retrieved from http://www.iie.com/publications/interstitial.cfm?ResearchID=2302.
U.S. Top-Five Exports to China U.S. Top-Five Imports from China
Exports
Share of
total
(%)
Change
over
Jan'12
(%) Imports
Share of
total
(%)
Change
over
Jan'12
(%)
Monthly (January 2013)
Agricultural Products 2,298.8 24.5% 10.5% Computer and Electronic Products 13,139.2 35.3% 15.8%
Transportation Equipment 1,221.5 13.0% 29.2% Miscellaneous Manufactured Commodities 3,011.3 8.1% -2.5%
Computer and Electronic Products 1,094.1 11.7% 24.9% Apparel and Accessories 2,811.6 7.6% -2.7%
Chemicals 961.2 10.2% -14.4% Electrical Equipment,Appliances, and Components 2,618.9 7.0% 13.8%
Waste and Scrap 709.4 7.6% -9.7% Leather and Allied Products 2,406.1 6.5% 4.9%
Other 3,099.6 33.0% - Other 13,184.9 35.5% -
Total 9,384.6 100.0% Total 37,172.0 100.0%
Monthly (January 2013)
3
Policy Institute also issued a report warning that China’s booming auto parts sector could soon cost the United States over a million jobs.3
In early February, Sherrod Brown (D-OH), a member of the Senate Finance Committee, reinitiated earlier efforts to enact a bill that would label China as a currency manipulator. Representative Tim Ryan (D-OH) said in a February 14 interview that he would also reintroduce a bill calling on Commerce to pursue countervailing duty cases to counteract the “unfair subsidy” implicit in China’s currency manipulation.4 These efforts arose at the February 14 nomination hearing of incoming Treasury Secretary Jack Lew, who was asked by Brown and his Finance Committee colleague Bob Casey (D-PA) what the Treasury planned to do about China’s currency manipulation. Lew noted the Obama administration’s position on China on key issues, including currency manipulation, while emphasizing that China’s currency has appreciated markedly since its switch to a managed float in 2005. He said that the administration would pursue the currency issue through the G-7 and G-20.5 Sector Spotlight Advanced Technology Products
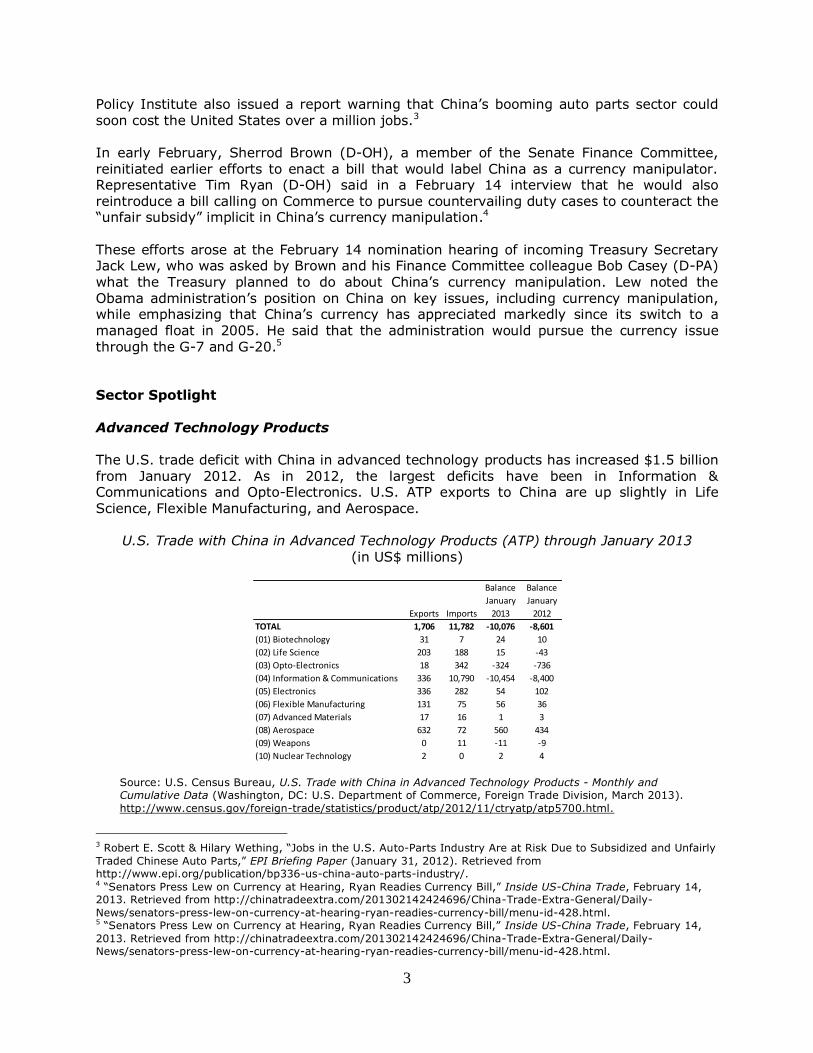
The U.S. trade deficit with China in advanced technology products has increased $1.5 billion from January 2012. As in 2012, the largest deficits have been in Information & Communications and Opto-Electronics. U.S. ATP exports to China are up slightly in Life Science, Flexible Manufacturing, and Aerospace.
U.S. Trade with China in Advanced Technology Products (ATP) through January 2013
(in US$ millions)
Source: U.S. Census Bureau, U.S. Trade with China in Advanced Technology Products - Monthly and Cumulative Data (Washington, DC: U.S. Department of Commerce, Foreign Trade Division, March 2013).
http://www.census.gov/foreign-trade/statistics/product/atp/2012/11/ctryatp/atp5700.html.
3 Robert E. Scott & Hilary Wething, “Jobs in the U.S. Auto-Parts Industry Are at Risk Due to Subsidized and Unfairly
Traded Chinese Auto Parts,” EPI Briefing Paper (January 31, 2012). Retrieved from
http://www.epi.org/publication/bp336-us-china-auto-parts-industry/. 4 “Senators Press Lew on Currency at Hearing, Ryan Readies Currency Bill,” Inside US-China Trade, February 14, 2013. Retrieved from http://chinatradeextra.com/201302142424696/China-Trade-Extra-General/Daily-
News/senators-press-lew-on-currency-at-hearing-ryan-readies-currency-bill/menu-id-428.html. 5 “Senators Press Lew on Currency at Hearing, Ryan Readies Currency Bill,” Inside US-China Trade, February 14,
2013. Retrieved from http://chinatradeextra.com/201302142424696/China-Trade-Extra-General/Daily-News/senators-press-lew-on-currency-at-hearing-ryan-readies-currency-bill/menu-id-428.html.
Exports Imports
Balance
January
2013
Balance
January
2012
TOTAL 1,706 11,782 -10,076 -8,601
(01) Biotechnology 31 7 24 10
(02) Life Science 203 188 15 -43
(03) Opto-Electronics 18 342 -324 -736
(04) Information & Communications 336 10,790 -10,454 -8,400
(05) Electronics 336 282 54 102
(06) Flexible Manufacturing 131 75 56 36
(07) Advanced Materials 17 16 1 3
(08) Aerospace 632 72 560 434
(09) Weapons 0 11 -11 -9
(10) Nuclear Technology 2 0 2 4
4
The Oil & Gas Sector In early March, new figures showed that in December 2012, China overtook the United
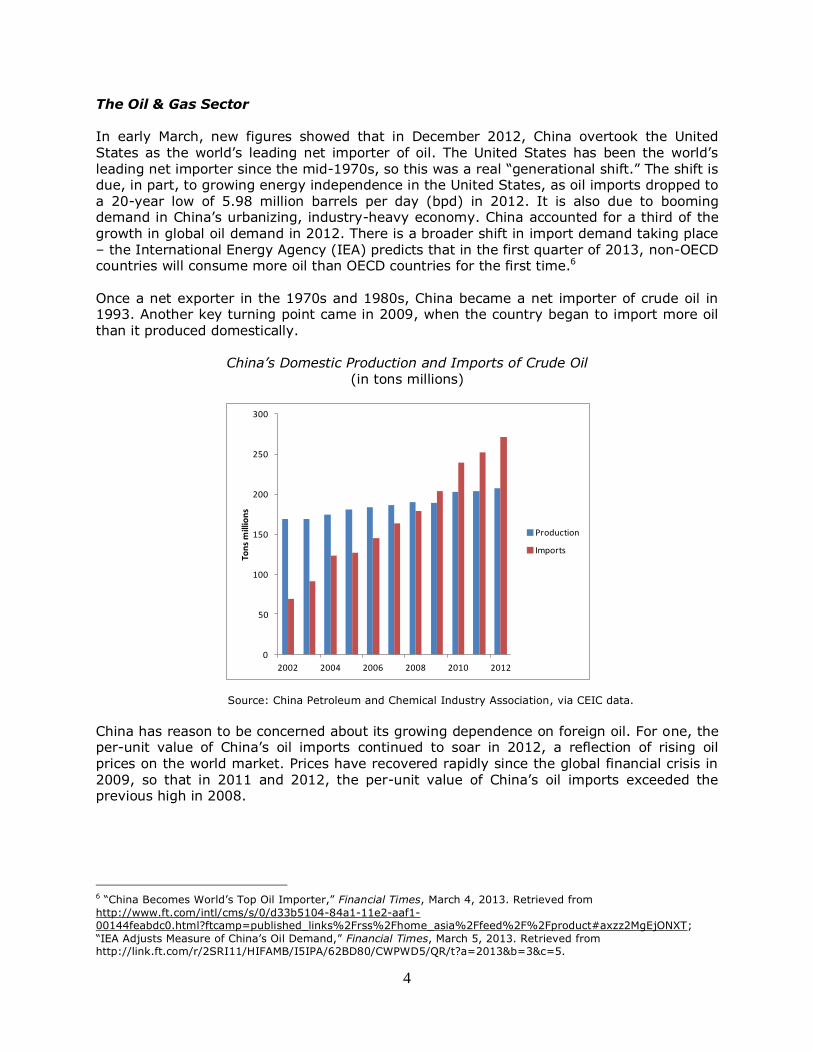
States as the world’s leading net importer of oil. The United States has been the world’s leading net importer since the mid-1970s, so this was a real “generational shift.” The shift is due, in part, to growing energy independence in the United States, as oil imports dropped to a 20-year low of 5.98 million barrels per day (bpd) in 2012. It is also due to booming demand in China’s urbanizing, industry-heavy economy. China accounted for a third of the growth in global oil demand in 2012. There is a broader shift in import demand taking place – the International Energy Agency (IEA) predicts that in the first quarter of 2013, non-OECD countries will consume more oil than OECD countries for the first time.6 Once a net exporter in the 1970s and 1980s, China became a net importer of crude oil in 1993. Another key turning point came in 2009, when the country began to import more oil than it produced domestically.
China’s Domestic Production and Imports of Crude Oil (in tons millions)
Source: China Petroleum and Chemical Industry Association, via CEIC data.
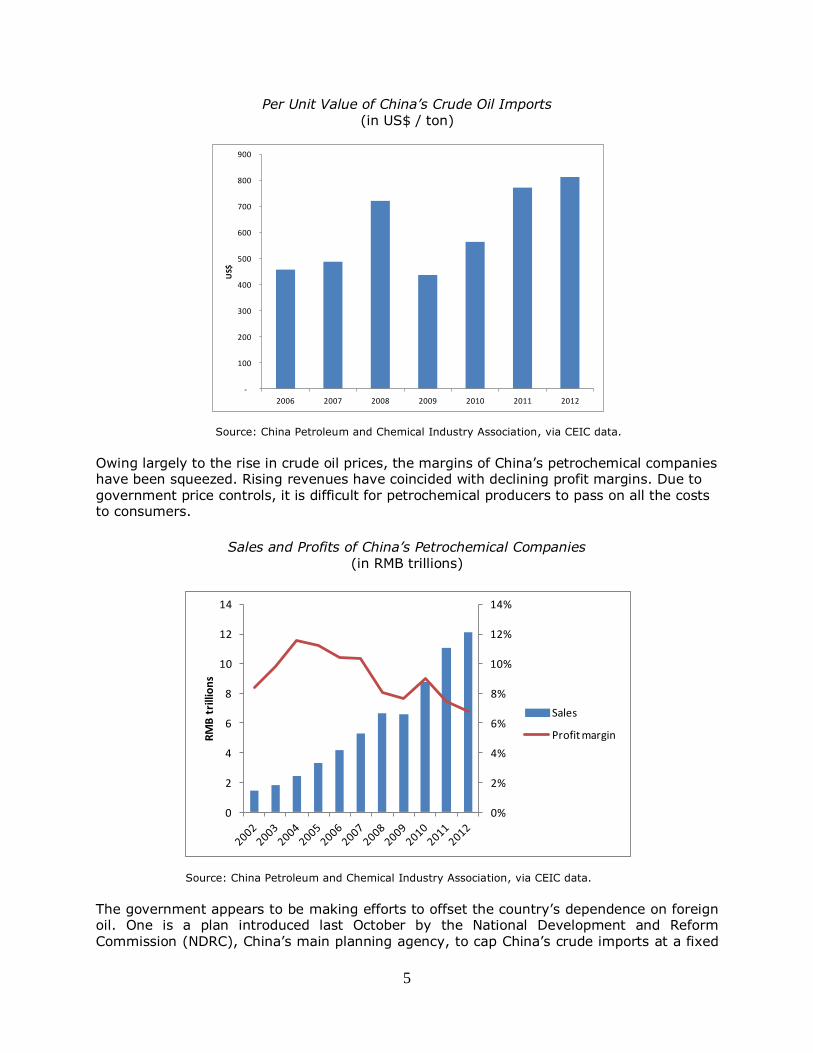
China has reason to be concerned about its growing dependence on foreign oil. For one, the per-unit value of China’s oil imports continued to soar in 2012, a reflection of rising oil prices on the world market. Prices have recovered rapidly since the global financial crisis in
2009, so that in 2011 and 2012, the per-unit value of China’s oil imports exceeded the previous high in 2008.
6 “China Becomes World’s Top Oil Importer,” Financial Times, March 4, 2013. Retrieved from
http://www.ft.com/intl/cms/s/0/d33b5104-84a1-11e2-aaf1-00144feabdc0.html?ftcamp=published_links%2Frss%2Fhome_asia%2Ffeed%2F%2Fproduct#axzz2MgEjONXT;
“IEA Adjusts Measure of China’s Oil Demand,” Financial Times, March 5, 2013. Retrieved from http://link.ft.com/r/2SRI11/HIFAMB/I5IPA/62BD80/CWPWD5/QR/t?a=2013&b=3&c=5.
0
50
100
150
200
250
300
2002 2004 2006 2008 2010 2012
Ton
s m
illio
ns
Production
Imports
5
Per Unit Value of China’s Crude Oil Imports (in US$ / ton)
Source: China Petroleum and Chemical Industry Association, via CEIC data.
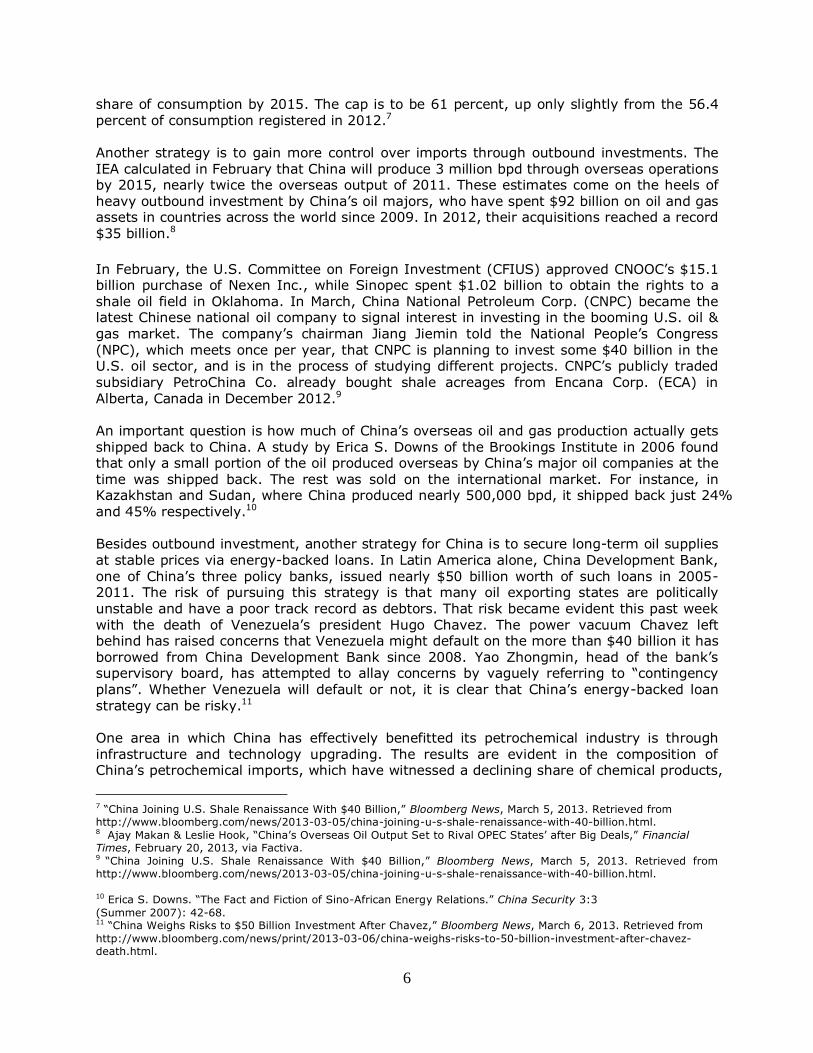
Owing largely to the rise in crude oil prices, the margins of China’s petrochemical companies have been squeezed. Rising revenues have coincided with declining profit margins. Due to government price controls, it is difficult for petrochemical producers to pass on all the costs to consumers.
Sales and Profits of China’s Petrochemical Companies
(in RMB trillions)
Source: China Petroleum and Chemical Industry Association, via CEIC data.
The government appears to be making efforts to offset the country’s dependence on foreign oil. One is a plan introduced last October by the National Development and Reform Commission (NDRC), China’s main planning agency, to cap China’s crude imports at a fixed
-
100
200
300
400
500
600
700
800
900
2006 2007 2008 2009 2010 2011 2012
US$
0%
2%
4%
6%
8%
10%
12%
14%
0
2
4
6
8
10
12
14
RM
B t
rilli
on
s
Sales
Profit margin
6
share of consumption by 2015. The cap is to be 61 percent, up only slightly from the 56.4 percent of consumption registered in 2012.7
Another strategy is to gain more control over imports through outbound investments. The IEA calculated in February that China will produce 3 million bpd through overseas operations by 2015, nearly twice the overseas output of 2011. These estimates come on the heels of heavy outbound investment by China’s oil majors, who have spent $92 billion on oil and gas assets in countries across the world since 2009. In 2012, their acquisitions reached a record $35 billion.8 In February, the U.S. Committee on Foreign Investment (CFIUS) approved CNOOC’s $15.1 billion purchase of Nexen Inc., while Sinopec spent $1.02 billion to obtain the rights to a shale oil field in Oklahoma. In March, China National Petroleum Corp. (CNPC) became the latest Chinese national oil company to signal interest in investing in the booming U.S. oil & gas market. The company’s chairman Jiang Jiemin told the National People’s Congress (NPC), which meets once per year, that CNPC is planning to invest some $40 billion in the U.S. oil sector, and is in the process of studying different projects. CNPC’s publicly traded subsidiary PetroChina Co. already bought shale acreages from Encana Corp. (ECA) in Alberta, Canada in December 2012.9 An important question is how much of China’s overseas oil and gas production actually gets shipped back to China. A study by Erica S. Downs of the Brookings Institute in 2006 found that only a small portion of the oil produced overseas by China’s major oil companies at the time was shipped back. The rest was sold on the international market. For instance, in Kazakhstan and Sudan, where China produced nearly 500,000 bpd, it shipped back just 24% and 45% respectively.10 Besides outbound investment, another strategy for China is to secure long-term oil supplies at stable prices via energy-backed loans. In Latin America alone, China Development Bank,
one of China’s three policy banks, issued nearly $50 billion worth of such loans in 2005-2011. The risk of pursuing this strategy is that many oil exporting states are politically unstable and have a poor track record as debtors. That risk became evident this past week with the death of Venezuela’s president Hugo Chavez. The power vacuum Chavez left behind has raised concerns that Venezuela might default on the more than $40 billion it has borrowed from China Development Bank since 2008. Yao Zhongmin, head of the bank’s supervisory board, has attempted to allay concerns by vaguely referring to “contingency plans”. Whether Venezuela will default or not, it is clear that China’s energy-backed loan strategy can be risky.11 One area in which China has effectively benefitted its petrochemical industry is through infrastructure and technology upgrading. The results are evident in the composition of China’s petrochemical imports, which have witnessed a declining share of chemical products,
7 “China Joining U.S. Shale Renaissance With $40 Billion,” Bloomberg News, March 5, 2013. Retrieved from http://www.bloomberg.com/news/2013-03-05/china-joining-u-s-shale-renaissance-with-40-billion.html. 8 Ajay Makan & Leslie Hook, “China’s Overseas Oil Output Set to Rival OPEC States’ after Big Deals,” Financial Times, February 20, 2013, via Factiva. 9 “China Joining U.S. Shale Renaissance With $40 Billion,” Bloomberg News, March 5, 2013. Retrieved from
http://www.bloomberg.com/news/2013-03-05/china-joining-u-s-shale-renaissance-with-40-billion.html.
10 Erica S. Downs. “The Fact and Fiction of Sino-African Energy Relations.” China Security 3:3
(Summer 2007): 42-68. 11 “China Weighs Risks to $50 Billion Investment After Chavez,” Bloomberg News, March 6, 2013. Retrieved from
http://www.bloomberg.com/news/print/2013-03-06/china-weighs-risks-to-50-billion-investment-after-chavez-death.html.
7
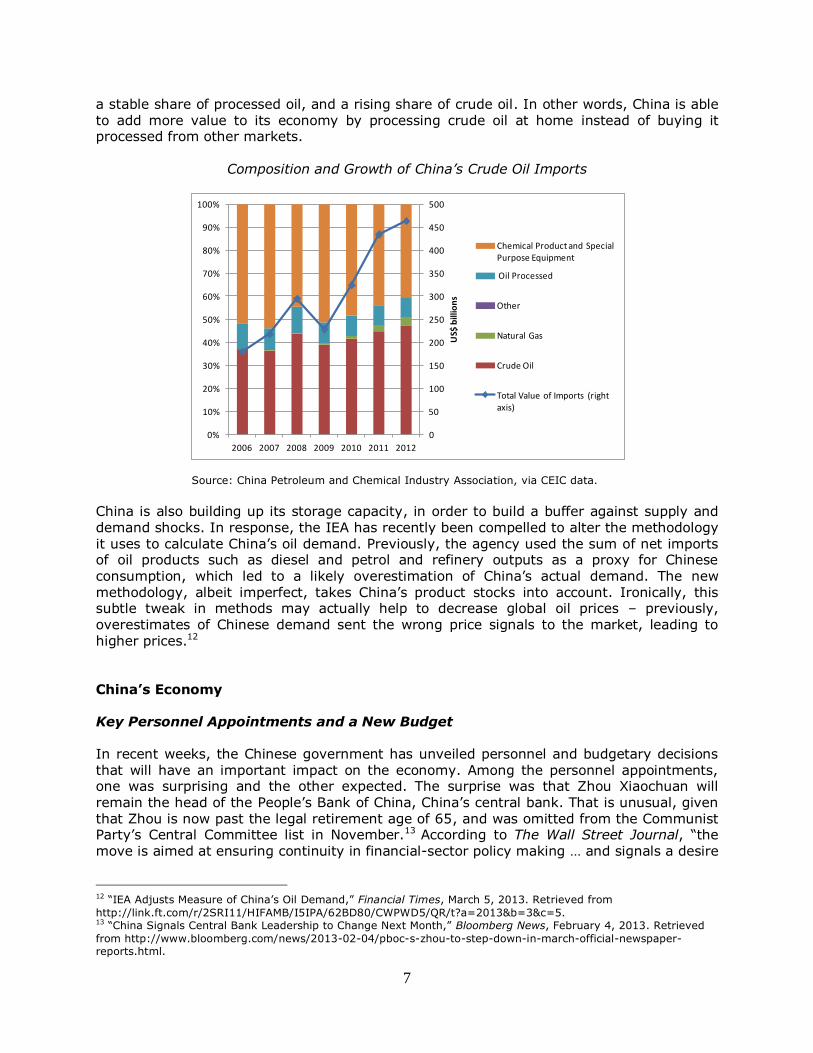
a stable share of processed oil, and a rising share of crude oil. In other words, China is able to add more value to its economy by processing crude oil at home instead of buying it processed from other markets.
Composition and Growth of China’s Crude Oil Imports
Source: China Petroleum and Chemical Industry Association, via CEIC data.
China is also building up its storage capacity, in order to build a buffer against supply and demand shocks. In response, the IEA has recently been compelled to alter the methodology it uses to calculate China’s oil demand. Previously, the agency used the sum of net imports of oil products such as diesel and petrol and refinery outputs as a proxy for Chinese
consumption, which led to a likely overestimation of China’s actual demand. The new methodology, albeit imperfect, takes China’s product stocks into account. Ironically, this subtle tweak in methods may actually help to decrease global oil prices – previously, overestimates of Chinese demand sent the wrong price signals to the market, leading to higher prices.12
China’s Economy Key Personnel Appointments and a New Budget In recent weeks, the Chinese government has unveiled personnel and budgetary decisions
that will have an important impact on the economy. Among the personnel appointments, one was surprising and the other expected. The surprise was that Zhou Xiaochuan will remain the head of the People’s Bank of China, China’s central bank. That is unusual, given that Zhou is now past the legal retirement age of 65, and was omitted from the Communist Party’s Central Committee list in November.13 According to The Wall Street Journal, “the move is aimed at ensuring continuity in financial-sector policy making … and signals a desire
12 “IEA Adjusts Measure of China’s Oil Demand,” Financial Times, March 5, 2013. Retrieved from
http://link.ft.com/r/2SRI11/HIFAMB/I5IPA/62BD80/CWPWD5/QR/t?a=2013&b=3&c=5. 13 “China Signals Central Bank Leadership to Change Next Month,” Bloomberg News, February 4, 2013. Retrieved
from http://www.bloomberg.com/news/2013-02-04/pboc-s-zhou-to-step-down-in-march-official-newspaper-reports.html.
0
50
100
150
200
250
300
350
400
450
500
0%
10%
20%
30%
40%
50%
60%
70%
80%
90%
100%
2006 2007 2008 2009 2010 2011 2012U
S$ b
illio
ns
Chemical Product and Special Purpose Equipment
Oil Processed
Other
Natural Gas
Crude Oil
Total Value of Imports (right axis)

8
to stay on course with the kind of financial reforms Mr. Zhou has pushed, including a more flexible yuan.”14
A less surprising personnel appointment was Lou Jiwei as China’s new Minister of Finance. In 2007, Lou had moved from his position as Vice Minister of Finance to take over as chairman of the newly established sovereign wealth fund, China Investment Corporation. Lou has now essentially returned to his old employer. He also secured a seat on the Party's Central Committee in November.15The appointment reinforces the “revolving door” between Chinese government posts and strategic state-owned entities in the financial and corporate sector. At the March Party Congress, the government also released new budget proposals for the coming fiscal year. Overall government spending will increase 10 percent to $2.2 trillion, with a notable increase of 10.7 percent in defense spending.16 The new budget proposals came amid unusual warnings by Wen Jiabao, China’s outgoing premier, that the annual growth target of 7.5 percent may not be met this year. Wen’s views were reinforced by the NDRC, which warned that the economy will now expand at a slower pace than it has over the past decade.17 Questions about the Reliability of China’s 2012 GDP Data
In recent weeks, new questions have arisen over China’s 2012 GDP data. The most controversial opinion is that China’s real GDP growth rate for 2012 was just 5.5 percent, as opposed to the official figure of 7.8 percent. That revised figure was put forward by Stephen Green, a renowned China economist at Standard Chartered Bank, who argues that inflation in China’s booming service sector was not sufficiently factored into official inflation measures.18
Another concern was that China’s provinces continue to exaggerate their GDP figures. In 2012, the total GDP of China’s 31 provinces added up to RMB 5.7 trillion more than the GDP figures published by the central government’s National Bureau of Statistic.19 That differential was equivalent to the entire output of Guangdong, China’s wealthiest province.20 Alternative indicators – or “proxies” – of economic activity also exhibited inconsistencies with China’s official GDP growth figures. UBS AG found slow movements of goods through ports in late 2012, while Standard Chartered noted low electricity production in the third quarter of 2012. Official retail sales were also found to be far higher than those at U.S. store
14 Lingling Wei & Bob Davis, “World News: China Central Bank Chief to Keep Post,” The Wall Street Journal Asia, February 25, 2013, via Factiva. 15 Daniel Ren, "Reformist Wealth Fund Boss Lou Jiwei Next Finance Minister," South China Morning Post, March 1, 2013. Retrieved from http://www.scmp.com/news/china/article/1163974/reformist-wealth-fund-boss-lou-jiwei-
next-finance-minister. 16 “China unveils 10.7% rise in defense spending,” The Japan Times, March 5, 2013. Retrieved from
http://www.japantimes.co.jp/news/2013/03/06/asia-pacific/china-budget-stresses-social-well-being-over-growth-
defense-spending-slightly-lower/#.UTky9hzU_oI. 17 “Wen Issues China Growth Warning,” Financial Times, March 5, 2013. Retrieved from http://www.ft.com/intl/cms/s/0/87ec8acc-8534-11e2-891d-00144feabdc0.html#axzz2Ma93vY51. 18 Eve Cary, “The Curious Case of China’s GDP Figures,” The Diplomat, March 5, 2013. 19 Ibid. 20 Didi Kirsten Tatlow, “The Phantom Province in China’s Economy,” New York Times, February 6, 2013, http://rendezvous.blogs.nytimes.com/2013/02/06/the-phantom-province-in-chinas-economy/.

9
outlets, like KFC and Nike. That view was confirmed by the China Beige Book, a new and independent survey conducted once every three months with retailers across China.21
Even China’s customs data has come under scrutiny. Economists from banks including UBS AG and Australia & New Zealand Banking Group Ltd recently expressed skepticism about the surprising rebound in China’s exports in December 2012. The skepticism prompted China’s General Administration of Customs and Ministry of Commerce to justify the jump as a response to exporters who hurried shipments before a waiver of inspection fees expired at the end of that month. 22 Weak Business Confidence in Early 2013 As analysts await the publication of China’s GDP figures for the first quarter of 2013, due out in early April, business surveys illustrate a lack of confidence in the economy. In February, the HSBC Purchasing Managers’ Index (PMI) for manufacturing ended an upward trajectory that had lasted from September to January. The drop in the HSBC PMI converged with the sober outlook in the PMI of the China Federation of Logistics and Purchasing. Notably, the deteriorating business outlook also carried over into the more dynamic service sector.
Purchasing Managers’ Index through January 2013: HSBC and CFLP PMI compared
(<50 = contraction, >50 = expansion) Manufacturing PMI Non-Manufacturing (Services) PMI
Source: China’s National Bureau of Statistics, via CEIC data; HSBC Purchasing Managers’ Index.
http://www.hsbc.com/1/2/emerging-markets/em-index/purchasing-managers-index.
21 Tom Orlik, “What the Unofficial Numbers Say About China’s Economy,” Wall Street Journal, February 22, 2013.
Retrieved from http://blogs.wsj.com/chinarealtime/2013/02/22/what-the-unofficial-numbers-say-about-chinas-economy/; “China’s January Data Gap Vexes Economists,” Bloomberg News, February 6, 2013. Retrieved from
http://www.bloomberg.com/news/2013-02-05/china-s-january-data-gap-vexes-economists.html. 22 “China Eclipses U.S. as Biggest Trading Nation,” Bloomberg News, February 10, 2013. Retrieved from
http://www.bloomberg.com/news/2013-02-09/china-passes-u-s-to-become-the-world-s-biggest-trading-nation.html.
45
50
55
60
Jan Feb Mar Apr May Jun Jul Aug Sep Oct Nov Dec Jan Feb
45
50
55
60
Jan Feb Mar Apr May Jun Jul Aug Sep Oct Nov Dec Jan Feb
CFLP
HSBC

10
CFLP Purchasing Managers’ Index: New Orders and Export Orders in the Manufacturing Sector
(<50 = contraction, >50 = expansion)
Source: China Federation of Logistics and Purchasing, via CEIC data.
A Potential Shift in China’s Export- and Investment-Driven Growth Model In 2012, China surpassed the United States to become the world’s biggest trading nation, with $3.87 trillion in total goods trade.23 China’s rise as the world’s leading trader of goods represents an important shift in international markets; as recently as 2006, the United
States was the larger trading partner for 127 countries, versus just 70 for China; five years later, it was the inverse, with 124 countries for China, and just 76 for the United States.24 In a sign of its growing influence, China held a preparatory meeting with Japan and South Korea in late February to begin laying the groundwork for a trilateral free trade agreement, in parallel to the U.S. efforts to forge a Transpacific Partnership (TPP) with these same
countries.25 At the same time, there are signs that the era of China’s export-led growth is coming to an end. China’s export-to-GDP ratio has held steady since 2010, at around 30 percent of GDP. What is more, China’s current account surplus continued to decline as a share of GDP in 2012, despite a slight rebound in the current account value over 2011.
23 “China Eclipses U.S. as Biggest Trading Nation,” Bloomberg News, February 10, 2013. Retrieved from
http://www.bloomberg.com/news/2013-02-09/china-passes-u-s-to-become-the-world-s-biggest-trading-nation.html. 24 Joe McDonald, “China Rejects Status as World’s Biggest Trader,” Associated Press, February 19, 2013. Retrieved from http://news.yahoo.com/china-rejects-status-worlds-biggest-trader-073008241--finance.html. 25 “China, Japan, Korea to Hold Meeting to Prepare for Trilateral Negotiatons,” Inside US-China Trade, February 19, 2013.
25
30
35
40
45
50
55
60
65
70
2/2005 2/2006 2/2007 2/2008 2/2009 2/2010 2/2011 2/2012 2/2013
New Orders
New Export Orders

11
China’s Current Account Surplus (in US$ billions)
Source: State Administration of Foreign Exchange, via CEIC data.
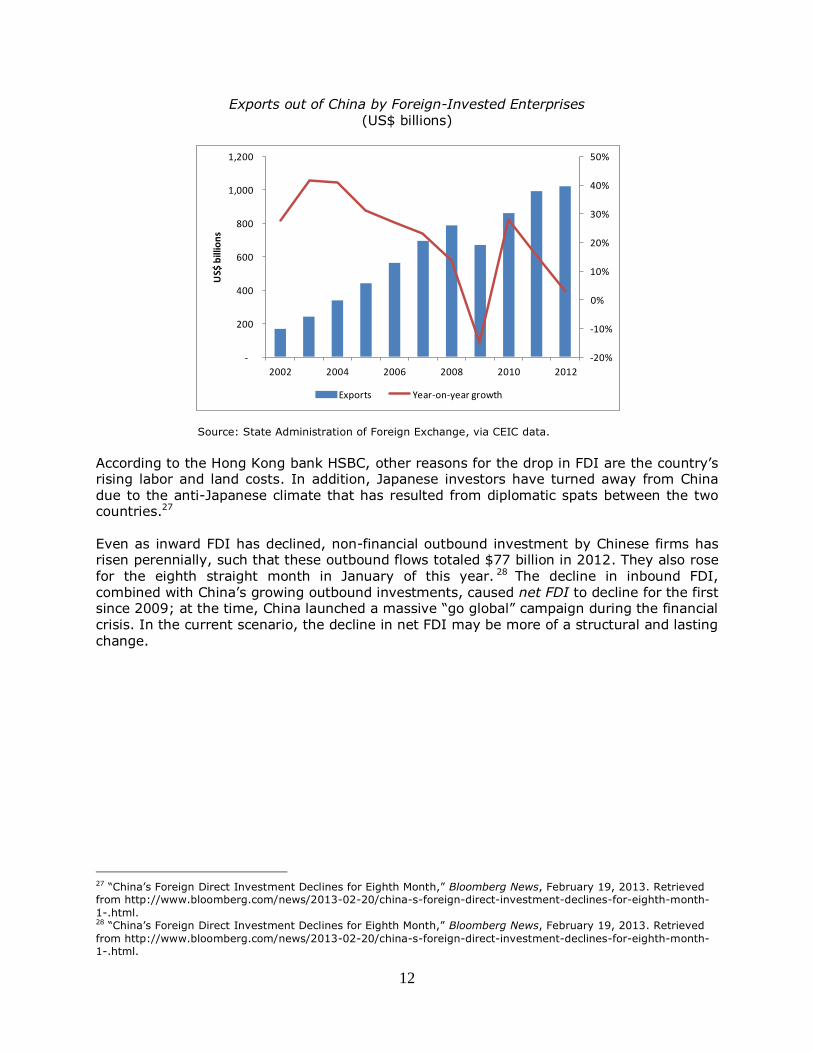
China’s slow but visible decline as an export hub is also affecting the foreign direct investment flowing into the country. While fixed asset investment in China remains extremely high at nearly half of GDP, the share of foreign capital in those investments is declining. In 2012, inbound FDI in China was lower than in 2011, reversing the gains made since the financial crisis in 2009. In January, inbound FDI also dropped 7.3 percent from a year earlier, such that FDI has declined in 14 of the past 15 months, the longest streak
since the financial crisis. Meanwhile, some long-time investors in China, such as Metro AG, Germany’s biggest retailer, have stated their intention to exit the country.26 There are some signs that the decline in inbound FDI is tied to slowing exports out of China. Last year, exports by foreign-invested enterprises in China grew by just 2 percent year-on-year, compared to nearly 30 percent in 2010.
26 “China’s Foreign Direct Investment Declines for Eighth Month,” Bloomberg News, February 19, 2013. Retrieved
from http://www.bloomberg.com/news/2013-02-20/china-s-foreign-direct-investment-declines-for-eighth-month-1-.html.
0.0%
2.0%
4.0%
6.0%
8.0%
10.0%
12.0%
0
50
100
150
200
250
300
350
400
450
2002 2004 2006 2008 2010 2012
Shar
e o
f G
DP
(%
)
US$
bill
ion
s
Current account (left axis) Current account as share of GDP (right axis)
12
Exports out of China by Foreign-Invested Enterprises (US$ billions)
Source: State Administration of Foreign Exchange, via CEIC data.
According to the Hong Kong bank HSBC, other reasons for the drop in FDI are the country’s rising labor and land costs. In addition, Japanese investors have turned away from China due to the anti-Japanese climate that has resulted from diplomatic spats between the two countries.27 Even as inward FDI has declined, non-financial outbound investment by Chinese firms has risen perennially, such that these outbound flows totaled $77 billion in 2012. They also rose
for the eighth straight month in January of this year. 28 The decline in inbound FDI, combined with China’s growing outbound investments, caused net FDI to decline for the first since 2009; at the time, China launched a massive “go global” campaign during the financial crisis. In the current scenario, the decline in net FDI may be more of a structural and lasting change.
27 “China’s Foreign Direct Investment Declines for Eighth Month,” Bloomberg News, February 19, 2013. Retrieved from http://www.bloomberg.com/news/2013-02-20/china-s-foreign-direct-investment-declines-for-eighth-month-
1-.html. 28 “China’s Foreign Direct Investment Declines for Eighth Month,” Bloomberg News, February 19, 2013. Retrieved
from http://www.bloomberg.com/news/2013-02-20/china-s-foreign-direct-investment-declines-for-eighth-month-1-.html.
-20%
-10%
0%
10%
20%
30%
40%
50%
-
200
400
600
800
1,000
1,200
2002 2004 2006 2008 2010 2012
US$
bill
ion
s
Exports Year-on-year growth

13
China’s Foreign Direct Investment, Inbound and Outbound (in US$ billions)
Source: Ministry of Commerce, via CEIC data.
Recent Developments in China’s Currency and Monetary Policy In 2011, foreigners were permitted for the first time to trade in yuan and settle direct investments on the Mainland using the yuan, while China-based companies were allowed to use the currency for business outside the Mainland. In 2012, Beijing eased the yuan’s trading band against the dollar for the first time in five years – allowing the currency to
fluctuate more broadly. 29 The government also piloted freer currency movements in Guangdong province’s Qianhai business zone beginning in June, and released rules in December for companies that incorporate in the area to borrow yuan loans from Hong Kong banks with interest rates and tenors to be fixed independently.30 At the annual Party congress this March, the deputy governor of the People's Bank of China
signaled that the central bank may introduce more reforms to enhance the flexibility of the yuan's exchange rate, as well as removing the remaining barriers to a cross-border currency trading zone, within the first half of this year. These statements were reinforced by Zhang Ping, the head of the National Development and Reform Commission (NDRC), China’s top economic planning agency, who stated that China's currency trading pilot program was progressing smoothly.31
29 Angelo Young, “China’s Yuan: Can It Challenge the Dollar?” The Diplomat, February 27, 2013. Retrieved from http://thediplomat.com/pacific-money/2013/02/27/chinas-yuan-can-it-challenge-the-
dollar/?utm_source=feedburner&utm_medium=feed&utm_campaign=Feed%3A+the-
diplomat+%28The+Diplomat+RSS%29. 30 “China Central Bank Eyes Reform, More Flexible Yuan in 2013,” Reuters, March 6, 2013. Retrieved from http://www.foxbusiness.com/news/2013/03/06/china-central-bank-eyes-reform-more-flexible-yuan-in-
2013/#ixzz2MmYIL0Rz. 31 “China Central Bank Eyes Reform, More Flexible Yuan in 2013,” Reuters, March 6, 2013. Retrieved from
http://www.foxbusiness.com/news/2013/03/06/china-central-bank-eyes-reform-more-flexible-yuan-in-2013/#ixzz2MmYIL0Rz.
-100
-50
0
50
100
150
2008 2009 2010 2011 2012
US$
bill
ion
s Non-Financial Outbound
Inbound
Net FDI
14
Nearly a fifth of China’s trade is now invoiced in yuan. On February 25, the Chicago Mercantile Exchange announced that it would join Hong Kong Exchanges and Clearing Limited and start trading futures denominated in yuan under contracts of up to three years,
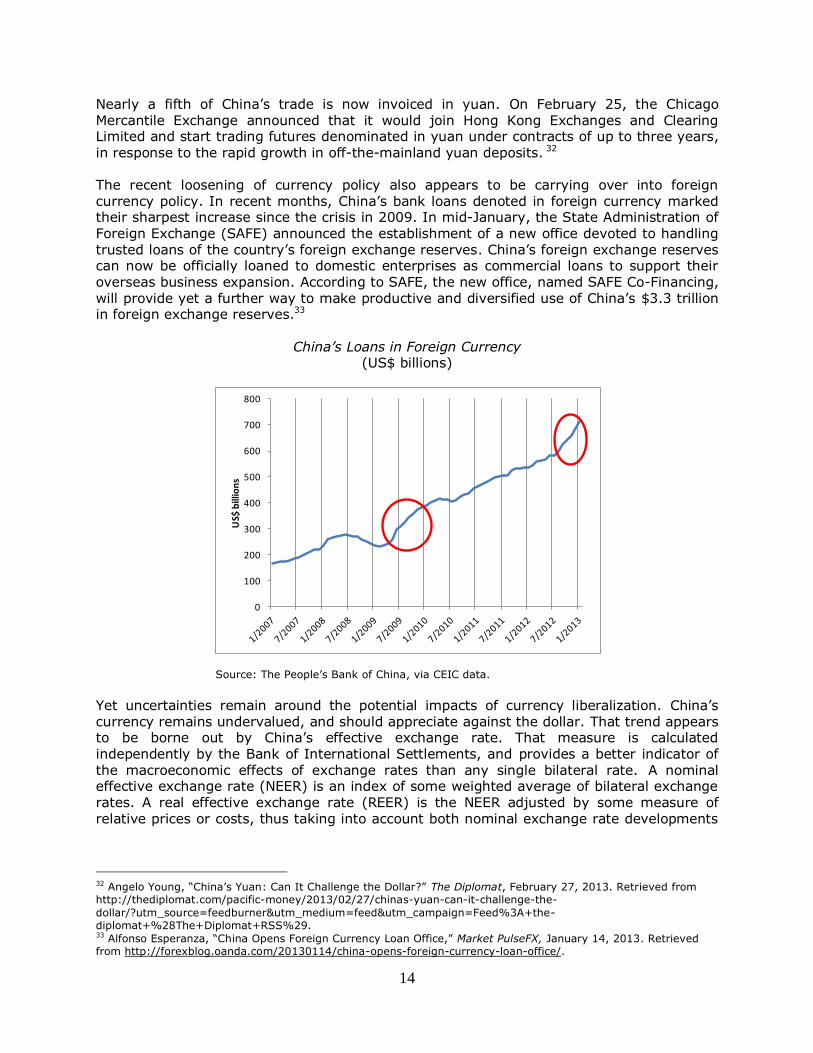
in response to the rapid growth in off-the-mainland yuan deposits. 32 The recent loosening of currency policy also appears to be carrying over into foreign currency policy. In recent months, China’s bank loans denoted in foreign currency marked their sharpest increase since the crisis in 2009. In mid-January, the State Administration of Foreign Exchange (SAFE) announced the establishment of a new office devoted to handling trusted loans of the country’s foreign exchange reserves. China’s foreign exchange reserves can now be officially loaned to domestic enterprises as commercial loans to support their overseas business expansion. According to SAFE, the new office, named SAFE Co-Financing, will provide yet a further way to make productive and diversified use of China’s $3.3 trillion in foreign exchange reserves.33
China’s Loans in Foreign Currency (US$ billions)
Source: The People’s Bank of China, via CEIC data.
Yet uncertainties remain around the potential impacts of currency liberalization. China’s currency remains undervalued, and should appreciate against the dollar. That trend appears to be borne out by China’s effective exchange rate. That measure is calculated independently by the Bank of International Settlements, and provides a better indicator of
the macroeconomic effects of exchange rates than any single bilateral rate. A nominal effective exchange rate (NEER) is an index of some weighted average of bilateral exchange rates. A real effective exchange rate (REER) is the NEER adjusted by some measure of relative prices or costs, thus taking into account both nominal exchange rate developments
32 Angelo Young, “China’s Yuan: Can It Challenge the Dollar?” The Diplomat, February 27, 2013. Retrieved from http://thediplomat.com/pacific-money/2013/02/27/chinas-yuan-can-it-challenge-the-
dollar/?utm_source=feedburner&utm_medium=feed&utm_campaign=Feed%3A+the-diplomat+%28The+Diplomat+RSS%29. 33 Alfonso Esperanza, “China Opens Foreign Currency Loan Office,” Market PulseFX, January 14, 2013. Retrieved from http://forexblog.oanda.com/20130114/china-opens-foreign-currency-loan-office/.
0
100
200
300
400
500
600
700
800
US$
bill
ion
s
15
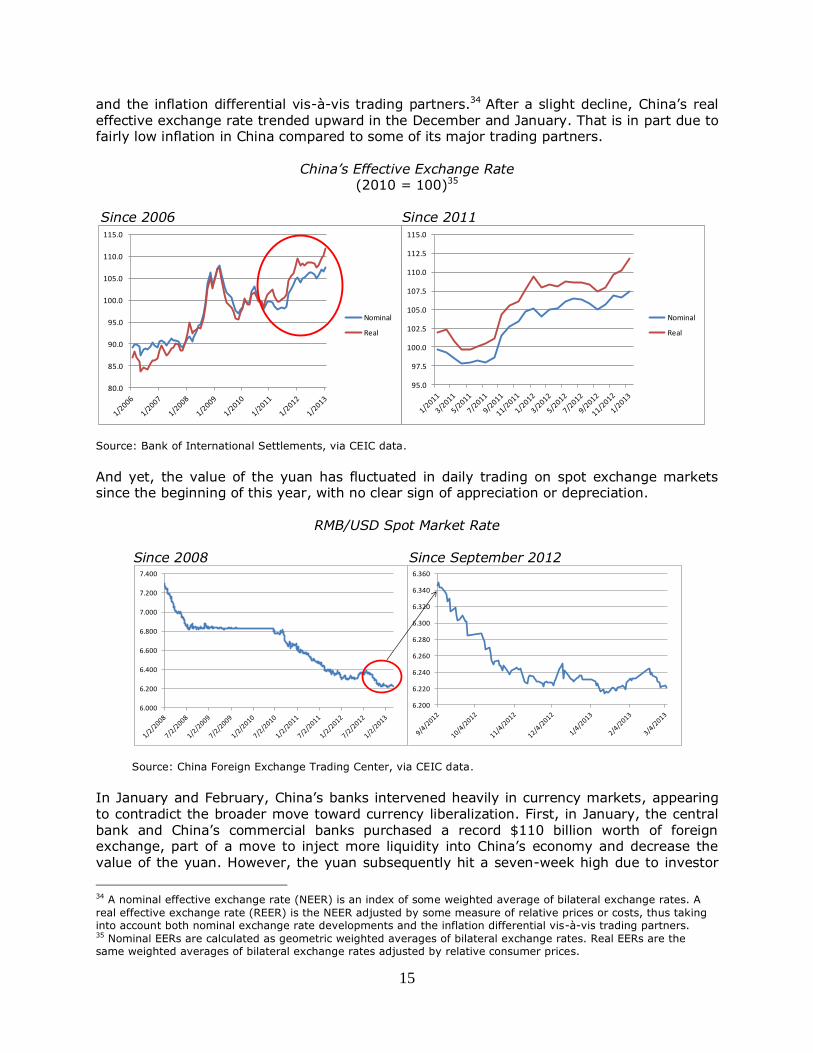
and the inflation differential vis-à-vis trading partners.34 After a slight decline, China’s real effective exchange rate trended upward in the December and January. That is in part due to fairly low inflation in China compared to some of its major trading partners.
China’s Effective Exchange Rate
(2010 = 100)35 Since 2006 Since 2011
Source: Bank of International Settlements, via CEIC data.
And yet, the value of the yuan has fluctuated in daily trading on spot exchange markets since the beginning of this year, with no clear sign of appreciation or depreciation.
RMB/USD Spot Market Rate Since 2008 Since September 2012
Source: China Foreign Exchange Trading Center, via CEIC data.
In January and February, China’s banks intervened heavily in currency markets, appearing to contradict the broader move toward currency liberalization. First, in January, the central bank and China’s commercial banks purchased a record $110 billion worth of foreign exchange, part of a move to inject more liquidity into China’s economy and decrease the value of the yuan. However, the yuan subsequently hit a seven-week high due to investor
34 A nominal effective exchange rate (NEER) is an index of some weighted average of bilateral exchange rates. A
real effective exchange rate (REER) is the NEER adjusted by some measure of relative prices or costs, thus taking into account both nominal exchange rate developments and the inflation differential vis-à-vis trading partners. 35 Nominal EERs are calculated as geometric weighted averages of bilateral exchange rates. Real EERs are the same weighted averages of bilateral exchange rates adjusted by relative consumer prices.
80.0
85.0
90.0
95.0
100.0
105.0
110.0
115.0
Nominal
Real
95.0
97.5
100.0
102.5
105.0
107.5
110.0
112.5
115.0
Nominal
Real
6.200
6.220
6.240
6.260
6.280
6.300
6.320
6.340
6.360
6.000
6.200
6.400
6.600
6.800
7.000
7.200
7.400

16
optimism that the added liquidity would boost China’s economic growth, thereby placing more upward pressure on the yuan.36 The liquidity injection also led to a record surge of credit in China’s economy, with RMB 2.5 trillion in bank and non-bank credit issuance in
January, higher even than during the financial stimulus in early 2009. In mid-February, the central bank was forced to drain $146 billion from the Chinese banking system through open market operations over a three-day span. That was a record amount of “sterilization”, explicitly designed to counteract inflation.37 China’s heavy intervention in monetary policy illustrates the tensions inherent in further liberalization trends. Even as China faces pressure to let its currency appreciate and loosen capital controls, bad debts and inflationary pressures pose a serious risk to economic stability. Since 2007, the amount of new credit generated annually has more than quadrupled to $2.75 trillion in the 12 months through January this year. At the same time, China's total public and private debt is now estimated by the Financial Times at some 200 percent of GDP—unprecedented for any developing country.38
The U.S.-China Economic and Security Review Commission was created by Congress to report on the national
security implications of the bilateral trade and economic relationship between the United States and the People’s
Republic of China. For more information, visit www.uscc.gov or join the Commission on Facebook!
This report is the product of professional research performed by the staff of the U.S.-China Economic and
Security Review Commission, and was prepared at the request of the Commission to support its
deliberations. Posting of the report to the Commission's website is intended to promote greater public
understanding of the issues addressed by the Commission in its ongoing assessment of U.S.-China economic
relations and their implications for U.S. security, as mandated by Public Law 106-398 and Public Law 108-7.
However, it does not necessarily imply an endorsement by the Commission, any individual Commissioner, or
the Commission’s other professional staff, of the views or conclusions expressed in this staff research report.
36 “China Central Bank Eyes Reform, More Flexible Yuan in 2013,” Reuters, March 6, 2013. Retrieved from
http://www.foxbusiness.com/news/2013/03/06/china-central-bank-eyes-reform-more-flexible-yuan-in-2013/#ixzz2MmYIL0Rz. 37 Simon Rabinovitch, “China Drains Cash to Curb Liquidity,” Financial Times, February 21, 2013. Retrieved from http://www.ft.com/intl/cms/s/0/10aa5b68-7c03-11e2-99f0-00144feabdc0.html#ixzz2LXgGfEP4. 38 Ruchir Sharma, “China Has Its Own Debt Bomb,” Wall Street Journal, February 25, 2013. Retrieved from http://online.wsj.com/article/SB10001424127887324338604578325962705788582.html.