Embed Size (px)
Citation preview
I
China Monetary Policy Report
Quarter One, 2015 (May 8, 2015)
Monetary Policy Analysis Group of
the People’s Bank of China

II
Executive Summary
In the first quarter of 2015, the performance of the Chinese economy
remained within a reasonable range and growth was in line with
expectations. Employment remained stable and household income
increased. Structural adjustments continued, while the share of tertiary
industry rose further. A stream of new industries, new types of business,
and new entities were booming. Those enterprises, industries, and areas
that had begun their structural adjustments were enjoying a tailwind.
Though new engines of growth were forming, endogenous drivers had
not yet been strengthened and downward pressures remained high.
Growth of prices moderated. In the first quarter, GDP growth was 7.0
percent year on year and the Consumer Price Index was up 1.2 percent
year on year.
In accordance with the decisions and overall arrangements of the CPC
Central Committee and the State Council, the PBC has continued its
sound monetary policy. Facing complex situations, including mounting
downward pressures on growth and the large impact of changes in the
RMB equivalent of foreign-exchange purchases on liquidity levels, the
PBC focused on implementing a monetary policy that is neither too tight
nor too loose, conducted timely and appropriate fine-tuning and
preemptive adjustments, created a neutral and proper monetary and
financial environment, and optimized the direction and structure of the
supply of liquidity and credit. Measures were taken to utilize a number of
monetary-policy tools, including open market operations, short-term

III
liquidity operations, and medium-term lending facility to adjust the
liquidity volume in the banking system. PBC branches were authorized to
carry out Standing Lending Facility Operations (SLOs) so as to improve
the channels for regular liquidity supplies to small and medium-sized
financial institutions. The reserve requirement ratio was cut to properly
increase long-term liquidity. Comprehensive use of various monetary-
policy tools helped to fill the liquidity gap caused by changes in the RMB
equivalent of foreign-exchange purchases. At the same time, benchmark
lending and deposit interest rates were cut and interest rates for repo
operations were lowered. Both quantitative and price tools were utilized
to bring down market rates and to reduce the financing costs for the
society as a whole. The PBC also improved the dynamic adjustment
mechanism of the differentiated reserve requirement ratio, lowered the
reserve requirement ratio for some targeted financial institutions,
increased the quotas for central bank lending and discounts, and enhanced
the role of credit policy in adjusting the loan structure. Financial
institutions were encouraged to provide more credit to the agricultural
sector, rural areas, and farmers, small and micro enterprises, important
water conservancy projects, and other key areas and weak links in the
economy. Meanwhile, the home mortgage policy was further improved
and the pilot scheme for credit asset securitization was further expanded.
Various financial reforms progressed in an orderly fashion. The upper
limit of the floating range for deposit interest rates was raised to 1.3 times
the benchmark level. The Regulations on Deposit Insurance were
formally released, and reform of the foreign-exchange management
mechanism was further deepened.

IV
Implementation of a sound monetary policy created a favorable financial
environment for economic and social development, as reflected in the
adequate liquidity in the banking system, the stable growth of money and
credit, the continuous improvement in the loan structure, the substantial
decline in market interest rates, and the enhanced flexibility in the
exchange rate. At end-March 2015, broad money M2 was up 11.6 percent
year on year. Outstanding RMB loans were up 14.0 percent year on year,
registering an increase of 3.68 trillion yuan from the beginning of 2015,
601.8 billion yuan more than the increase during the corresponding
period of the last year. All-system financing aggregates grew by 12.9
percent compared with the same period of the last year. In March, the
weighted average loan interest rate offered to non-financial enterprises
and other sectors was 6.56 percent, a reduction of 0.62 percentage point
from the beginning of the year. At the end of March, the central parity of
the RMB against the US dollar was 6.1422 yuan per dollar, a depreciation
of 0.38 percent from end-2014.
After the global financial crisis, the world economy has been undergoing
a profound rebalancing, with performance diverging across countries and
regions. Against the background of the “new normal,” the Chinese
economy is in the midst of a key transitional period whereby new
industries are replacing old industries and the engine for development is
changing. For the short term, there are still profound conflicts and
problems in terms of economic performance and the economy is still
facing large downward pressures. However, the structural adjustments
will inject energy for mid-term growth. In general, as a big and resilient
economy with a broad market, China has a strong capability to resist risks

V
and it has much room to maneuver. Growth will be shored up by the new
twin engines, namely, the mass entrepreneurship and innovation and the
supply of public goods and services, and the effects of the macro policies
will gradually unfold. The Chinese economy is expected to continue to
maintain sustained and sound growth.
The PBC will follow the strategic arrangements of the CPC Central
Committee and the State Council, adhere to the guidelines of seeking
progress while maintaining stability, take initiatives to adapt to the new
normal in the economy, continue to implement a sound monetary policy
that is neither too tight nor too loose, maintain policy consistency and
stability, and conduct timely and appropriate fine-tunings and preemptive
adjustments to create a neutral and proper monetary and financial
environment for the adjustment, transformation, and upgrading of the
economic structure and to strike a balance between stable growth and
structural adjustments. A combination of quantitative and price-based
monetary-policy instruments will be employed, macro-prudential
regulations will be improved, and the combination of policy measures
will be further optimized to keep liquidity at an appropriate volume and
to realize the appropriate growth of money, credit, and all-system
financing aggregates. There will be continued efforts to mobilize the
stock of credit assets, optimize the structure of new loans, and improve
the financing and credit structures. Numerous coordinated measures will

VI
be taken to address both the symptoms and the root causes of the high
financing costs. At the same time, reform and innovations will be
emphasized and the reform measures will be integrated with the
macro-economic management policies so that monetary policy will work
closely with the reform measures to further tap into the decisive role of
the market in terms of resource allocations. In view of the financial
deepening and the innovations, the macro-economic management system,
including its transmission channels to the real economy, will be improved
further. Efforts will focus on solving the conspicuous problems. The
efficiency and capacity of the financial sector to provide services to the
real sector will be improved. A comprehensive set of measures will be put
in place to safeguard the bottom line so as not to allow the occurrence of
either systemic financial risks or regional financial risks.

VII
Contents
Part 1 Money and Credit Analysis ........................................................................ 10
I. Growth of monetary aggregates close to the expected targets .......................... 10
II. Deceleration in the growth of deposits in financial institutions ....................... 11
III. Loans of financial institutions registered rapid growth .................................... 11
IV. Stocks of all-system financing aggregates grew moderately ............................ 13
V. Interest rates on loans of financial institutions declined .................................. 15
VI. The RMB exchange rate fluctuated in both directions with enhanced flexibility
................................................................................................................................ 16
VII. Cross-border RMB business developed steadily ............................................ 17
Part 2 Monetary Policy Operations ...................................................................... 18
I. Flexible open market operations were conducted ........................................... 18
II. The Standing-Lending Facility (SLF) and the Medium-term Lending Facility
(MLF) were carried out appropriately when necessary ............................................. 19
III. Targeted and universal cuts in the reserve requirement ratio were combined ... 20
IV. The dynamic adjustment mechanism of the differentiated reserve requirements
continued to play an active role ............................................................................... 21
V. Multiple measures were taken to guide financial institutions to optimize their
loan structures ......................................................................................................... 21
VI. Benchmark deposit and lending rates were cut in coordination with the
market-based interest-rate reform ............................................................................ 23
VII. The RMB exchange-rate formation regime was further improved .................. 25
VIII. Reforms of financial institutions were deepened .......................................... 26
IX. Reform of foreign exchange administration was deepened ......................... 2827
Part 3 Financial Market Analysis ......................................................................... 29
I. Financial market analysis .............................................................................. 29
II. Institutional building in the financial markets ................................................. 38
Part 4 Macro-economic Analysis .......................................................................... 41
I. Global economic and financial developments .................................................. 41
II. Analysis of China’s macro-economic performance ......................................... 49

VIII
Part 5 Monetary Policy Stance to be Adopted during the Next Stage .............. 5958
I. Outlook for the Chinese economy ................................................................. 5958
II. Monetary policy during the next stage ........................................................... 6160

IX
Boxes
Box 1 An Analysis of Deposit Interest-Rate Pricing Against the Background of Progress in
the Market-Based Interest-Rate Reform ....................................................................... 23
Box 2 Movements of Market Interest Rates and Related Issues ........................................... 31
Box 3 The ECB Launches a Large-Scale QE Policy ............................................................ 45
Box 4 Communications and Expectations Management by the Central Banks .................... 47
Tables
Table 1 RMB Loans of Financial Institutions in Q1 2015 .................................................... 13
Table 2 The Increment in All-system Financing Aggregates in Q1 2015 ............................. 14
Table 3 Shares of Loans with Rates at, above, or below the Benchmark Rates, January
through March 2015 .................................................................................................... 16
Table 4 Average Interest Rates of Large-value Deposits and Loans Denominated in US
Dollars, January through March 2015 ......................................................................... 16
Table 5 The Trading Volume of the RMB against Foreign Currencies in the Inter-bank
Foreign-Exchange Spot Market in Q1 2015 ........................................................... 2625
Table 6 Fund Flows among Financial Institutions in Q1 2015 ............................................. 29
Table 7 Transactions of Interest-r=Rate Derivatives in Q1 2015 .......................................... 30
Table 8 Bond Issuances in Q1 2015 ...................................................................................... 35
Table 9 Use of Insurance Funds, End-March 2015 ............................................................... 37
Table 10 Macro-economic and Financial Indices in the Major Economies .......................... 42
Figures
Figure 1 Monthly RMB Settlements of Cross-border Trade ................................................. 17
Figure 2 Yield Curves of Government Securities on the Inter-bank Bond Market ............... 35
Figure 3 Export and Import Growth and the Trade Balance ................................................. 51

10
Part 1 Money and Credit Analysis
In the first quarter of 2015 liquidity in the banking sector was sufficient, and money,
credit, and all-system financing aggregates grew in a stable manner. Market interest
rates continued to decline, and the flexibility of the exchange rate improved
significantly.
I. Growth of monetary aggregates close to the expected target
At the end of March 2015, outstanding M2 stood at 127.5 trillion yuan, up 11.6
percent year on year. Outstanding narrow money (M1) stood at 33.7 trillion yuan, up
2.9 percent year on year. Cash in circulation (M0) grew by 6.2 percent, reaching 6.2
trillion yuan. On a net basis, in the first quarter the central bank injected 169 billion
yuan into the economy in cash, an increase of 193.2 billion yuan year on year.
In the first quarter, M2 increased by 4.7 trillion yuan, which, based on the annual
growth target of 12 percent, was estimated to be about one-third of the annual
incremental amount. The increase in monetary aggregates has undergone some
structural changes. Specifically, monetary growth mainly relies on credit supply, and
portfolio investment generates more monetary supply. As efforts are made to
gradually regulate the inter-bank business and borrowing by local government
financing vehicles, growth of the inter-bank business among commercial banks
slowed down markedly, generating less monetary supply. This is a major factor
behind the decline in monetary growth, and it is also a reflection of the structural
adjustments in the monetary supply. Against the backdrop of an already large volume
of base money, weak growth momentum in the traditional capital-intensive industries,
inefficient companies occupying a large amount of funds, and the absence of new
drivers for growth, an objective assessment of the structural slowdown in M2 is
necessary.
At end-March, outstanding base money registered 29.6 trillion yuan, up 7.7 percent
year on year. This represented an increase of 165.8 billion yuan from the beginning of
the year. The money multiplier stood at 4.31, which was 0.13 higher than that at the
end of 2014. The excess reserve ratio of financial institutions was 2.31 percent and
that of rural credit cooperatives was 4.4 percent.
1 In January 2015 the PBC adjusted the coverage of the reserve requirement. Deposits of non-deposit-taking
financial institutions are now to be recorded as “all deposits,” based on which the reserve requirement should be
calculated in line with the applicable legal reserve requirement ratio of 0. The excess reserve requirement ratio
calculated based on the expanded coverage is not comparable with the previous data. If calculated based on the
previous coverage, the excess reserve requirement ratio should be higher than 2.3 percent.
带格式的: 段落间距段前: 1 行

11
II. Deceleration in the growth of deposits in financial institutions
At the end of March, outstanding deposits of domestic and foreign currencies in all
financial institutions (including foreign-funded financial institutions, the same
hereafter) posted 129.1 trillion yuan, up 10.6 percent year on year and a deceleration of
1.8 percentage points from end-2014. This was an increase of 4.7 trillion yuan from the
beginning of the year and a deceleration of 1.4 trillion yuan year on year. Outstanding
RMB deposits registered 124.9 trillion yuan, up 10.1 percent year on year and a
deceleration of 2.0 percentage points from end-2014. This was an increase of 4.2
trillion yuan from the beginning of the year and a deceleration of 1.6 trillion yuan year
on year. The slowdown in deposit growth was mainly due to a significant decrease in
deposits generated from foreign-exchange purchases and inter-bank businesses.
Outstanding deposits in foreign currencies registered USD694 billion, up 27.6 percent
year on year. This was an increase of USD83.5 billion from the beginning of the year
and an acceleration of USD39.8 billion year on year.
Broken down by sector, the growth of household deposits accelerated amidst a
stabilizing trend, and the growth of non-financial corporate sector deposits continued
to moderate, while deposits of non-deposit-taking financial institutions maintained
relatively rapidly growth. At end-March, outstanding household deposits posted 53.8
trillion yuan, up 9.0 percent year on year and an increase of 3.6 trillion yuan from the
beginning of the year. Outstanding deposits in the non-financial corporate sector
registered 37.3 trillion yuan, up 3.2 percent year on year and a decrease of 400.9
billion yuan from the beginning of the year. Outstanding fiscal deposits registered 3.4
trillion yuan, a decline of 101 billion yuan from the beginning of the year.
Outstanding deposits of non-deposit-taking financial institutions registered 10.4
trillion yuan, up 48.6 percent year on year and an increase of 983.5 billion yuan from
the beginning of the year. Supported by a surge in stock market trading, outstanding
deposits of securities and trading settlement accounts grew by 72.4 percent year on
year to reach 3.2 trillion yuan, whereas outstanding deposits of special purpose
vehicles (mainly off-balance-sheet wealth management products, securities
investment funds, and so forth) grew by 131.4 percent year on year to 3.4 trillion
yuan.
III. Loans of financial institutions registered rapid growth
At end-March, outstanding loans in domestic and foreign currencies of all financial
institutions posted 91.5 trillion yuan, up 13.3 percent year on year. This was an
increase of 3.9 trillion yuan from the beginning of the year and an acceleration of
293.9 billion yuan year on year. At end-March, outstanding RMB loans stood at 85.9
trillion yuan, representing growth of 14 percent year on year and an acceleration of
0.2 percentage point from the end of the last year. This was an increase of 3.7 trillion
yuan from the beginning of the year and an acceleration of 601.8 billion yuan year on
year. In general, growth of new loans has been fairly rapid since the beginning of
2015. Financial institutions have reported a strong demand for loans. In particular,

12
in line with national strategies, financial institutions increased credit support to
strategic economic belts, such as the land and marine silk road initiative, the Yangtze
River economic belt, and the Beijing-Tianjin-Hebei coordinated development belt.
However, credit demand differs across industries and regions. Broken down by
industry, growth of loans to sectors that are policy-supported, such as cement,
infrastructure construction, and the real-estate sectors, posted relatively rapid growth,
whereas growth of loans to the manufacturing sector slowed down as the growth of
the sector moderated. Broken down by region, demand for loans was generally strong
in the eastern, central, and western regions, whereas demand for loans in the
northeastern region was relatively weak. There was a gap between the large volume of
credit injections into the real economy and the perception in the real economy because
on the one hand it took time for the effects of the credit supply to pass through to the
real economy and on the other hand poorly-performing enterprises used the new loans
to roll over the old loans, and some of the loans were used to maintain current
operations rather than to increase output. The off-balance-sheet activities declined
somewhat.
Medium- and long-term loans accounted for a large share of loans. Growth of RMB
loans to the household sector remained relatively stable. At end-March, outstanding
RMB loans to the household sector posted 24.0 trillion yuan, up 15.7 percent year on
year. This represented an increase of 889.2 billion yuan from the beginning of the year
and a deceleration of 40.1 billion yuan year on year. In particular, home mortgage
loans increased by 535.3 billion yuan from the beginning of the year, an acceleration
of 85.3 billion yuan year on year. Growth of home mortgage loans registered 17.9
percent at end-March, 3.9 percentage points higher than that of total loans. In general,
home mortgage loans are still regarded by banks as high-quality assets, thus financial
institutions are willing to issue such loans. At end-March, as the policy on mortgage
loans for second homes was adjusted, some financial institutions cut home mortgage
interest rates. The impact of such adjustments will be felt gradually. Outstanding loans
to non-financial businesses and other sectors posted 61.1 trillion yuan, up 13.3 percent
year on year. This represented an acceleration of 0.8 percentage point from the end of
the last year, an increase of 2.7 trillion yuan from the beginning the year and an
acceleration of 629.9 billion yuan year on year. In terms of the maturity brackets of
the RMB loans, new medium- and long-term RMB loans increased 2.2 trillion yuan
from the beginning of the year, an acceleration of 409.5 billion yuan year on year. The
share of new medium- and long-term RMB loans in total new loans was 58.8
percent, an increase of 0.6 percentage point from the same period of the last year. The
relatively rapid growth of medium- and long-term loans provided funding for recently
approved investment projects and will help put into play the key role of investment in
boosting economic growth. It is worth noting that the issuance of loans to finance
fixed-asset investment projects is subject to numerous factors. For example, some
projects suffer from a time lag in the disbursement of supporting funds, whereas some
projects are delayed due to factors such as relocations or environmental appraisals.

13
Outstanding short-term loans (including bill financing) increased by 1.4 trillion yuan
from the beginning of the year, an acceleration of 231 billion yuan year on year.
Broken down by institutions, Chinese-funded large-sized national banks and small-
and medium-sized local banks registered a larger year-on-year acceleration in loan
growth.
Table 1 RMB Loans of Financial Institutions in Q1 2015 Unit: 100 million
New loans Acceleration A
c
c
el
er
at
io
n
Chinese-funded large-sized
banks ① 16924 2753 2
,
2
1
1
Chinese-funded small- and
medium-sized banks② 18176 4080
4
,
5
9
6
Small-sized rural financial
institutions③
5443 160
1
,
7
8
0
Foreign-funded
financial institutions 236 -77
-
3
9
1
Notes: ①Chinese-funded large-sized banks refer to banks with assets (both in domestic and foreign
currencies) of 2 trillion yuan or more (according to the amount of total assets in both domestic and
foreign currencies at end-2008).
②Chinese-funded small- and medium-sized banks refer to banks with total assets (both in domestic
and foreign currencies) of less than 2 trillion yuan (according to the amount of total assets in both
domestic and foreign currencies at end-2008).
③Small-sized rural financial institutions include rural commercial banks, rural cooperative banks,
and rural credit cooperatives.
Source: People’s Bank of China.
Foreign-currency–denominated loans grew steadily. At end-March, outstanding
foreign-currency loans of financial institutions posted USD914.6 billion, up 4.0
percent year on year. This was an increase of USD34.1 billion from the beginning of
the year and a year-on-year deceleration of USD46.2 billion. The deceleration was
mainly due to factors such as expectations of an interest-rate hike by the Federal
Reserve and the rally of the dollar index. In terms of the loan structure, outward loans
increased by a large margin of USD33.6 billion from the beginning of the year, an
acceleration of USD16.3 billion compared to the same period of the last year,
signifying strong support for the “going global” strategy. Loans to non-financial
businesses and other sectors decelerated steeply by USD61.7 billion in year-on-year
terms, though increasing by USD1.1 billion from the beginning of the year, reflecting
the changing expectations of the corporate sector regarding the US dollar exchange
rate.
IV. Stocks of all-system financing aggregates grew moderately

14
According to preliminary statistics, at end-March the stock of all-system financing
aggregates2 reached 127.52 trillion yuan, representing an increase of 12.9 percent
year on year; the flow of all-system financing aggregates in the first quarter posted
4.61 trillion yuan, a decrease of 894.9 billion yuan year on year.
The growth of all-system financing aggregates in the first quarter was characterized
by the following: first, RMB loans to the real economy3 accelerated rapidly compared
with the same period of the last year. During the same period, new RMB loans
accounted for 78.3 percent of the all-system financing aggregates, an increase of 24.1
percentage points from the same period of 2014. Second, foreign-
currency–denominated loans decelerated notably from the same period of the last year.
New loans denominated in foreign currencies accounted for 0.1 percent of the
increment in all-system financing aggregates, down by 6.9 percentage points from the
same period of the previous year. Third, as stock market trading was brisk, equity
financing grew markedly year on year. The combined amount of bond and equity
financing on the domestic market by non-financial enterprises grew by 15.5 billion
yuan year on year to reach 499.5 billion yuan, accounting for 10.8 percent of the
increment in all-system financing aggregates over the same period, and an
acceleration of 2.0 percentage points from the same period of the last year. Among
this figure, equity financing by non-financial enterprises on the domestic market
reached 180.8 billion yuan, up 185 percent from the same period of 2014. Fourth, the
growth of off-balance-sheet financing slowed down. In the first quarter, the combined
amount of new entrusted loans,4 trust loans, and undiscounted bankers’ acceptances
registered 385.9 billion yuan, a decrease of 1.14 trillion yuan year on year, accounting
for 8.3 percent of the increment in all-system financing aggregates, down by 19.4
percentage points from the same period of the last year.
Table 2 The Increment in All-system Financing Aggregates in Q1 2015
Unit: 100 million yuan
All-system Of which:
2 All-system financing aggregates refer to the total volume of financing provided by the financial system to the
real economy during a certain period of time. The flow amount refers to financing that is provided to the real
economy (every month, quarter, or year), whereas the stock amount refers to the outstanding volume of financing
at the end of a certain period (at the end of a month, quarter, or year). 3 Loans denominated in RMB and foreign currencies in the all-system financing aggregates refer to the total
volume of RMB and foreign currency‒ denominated loans provided by the financial system to the real economy
during a certain period of time, excluding funds lent by banking financial institutions to non-banking financial
institutions and to overseas borrowers. 4 Starting from January 2015, the statistical coverage of entrusted loans was adjusted and divided into the two
categories of entrusted loans under cash management operations and general entrusted loans. In the statistics of the
all-system financing aggregates, entrusted loans refer only to general entrusted loans, i.e., loans issued by financial
institutions (lenders or entrusted agents) to specified borrowers in specified volumes on specified terms with
money provided by companies, organizations, individuals, and other principals.

15
financing
aggregates ①
RMB
loans
Foreign
currency
‒
denominat
ed (RMB
equivalent
)
Entrus
ted
loans
Trust
loans
Undiscount
ed bankers’
acceptances
Enterpr
ise
bonds
Financing
by
domestic
institution
s via
domestic
stock
markets
Q1 2015②
46071 36065 61 3242 13 604 3187 1808
Y-o-y change -8949 6253 -3768 -3399 -2865 -5132 -678 833
Notes: ① All-system financing aggregates refer to the total volume of financing provided by the
financial system to the real economy during a certain period of time.
② Data for the current period are preliminary.
Sources: People’s Bank of China, National Development and Reform Commission, China
Securities Regulatory Commission, China Insurance Regulatory Commission, China Government
Securities Depository Trust & Clearing Co., Ltd., National Association of Financial Market
Institutional Investors, and so forth.
V. Interest rates on loans of financial institutions declined
In March, the weighted average loan interest rate offered to non-financial companies
and other sectors was 6.56 percent, down 0.22 percentage point from December 2014.
In particular, the weighted average loan interest rate was 6.78 percent, down 0.15
percentage point from December 2014; the weighted average bill financing rate was
5.40 percent, down 0.27 percentage point from December 2014. The mortgage loan
interest rate generally fell, with the weighted average home mortgage interest rate
posting 6.01 percent in March, down 0.23 percentage point from December 2014.
The share of loans with interest rates lower than the benchmark rates dropped,
whereas the share of loans offered at or above the benchmark rates rose. In March, the
share of loans with interest rates lower than the benchmark rates was 11.30 percent,
down 1.80 percentage points from December 2014, whereas the shares of loans
offered at and above the benchmark rates was 19.77 percent and 68.93 percent
respectively, up 0.14 and 1.66 percentage points respectively from December 2014.
The deposit and lending rates of foreign currencies fluctuated slightly but remained at
low levels due to fluctuations in the interest rates on international markets and
changes in supply and demand for foreign currencies in the domestic market. In
March, the weighted average interest rate of large-value US dollar demand deposits
and large-value US dollar deposits with maturities within 3 months registered 0.15
percent and 0.71 percent respectively, up 0.01 and 0.07 percentage point from
December 2014. The weighted average interest rates of US dollar loans with

16
maturities within 3 months and with maturities between 3 to 6 months (including 3
months) posted 1.73 percent and 2.28 percent respectively, down 0.56 and up 0.06
percentage point respectively from December 2014.
Table 3 Shares of Loans with Rates at, above, or below the Benchmark Rates,
January through March 2015
Unit:%
Month
Lower
than the
benchm
ark
At the
benchma
rk
Higher than the benchmark
Sub-tot
al (1,1.1] (1.1, 1.3] (1.3, 1.5] (1.5, 2.0] Above 2.0
January 10.20 19.93 69.87 19.90 25.31 11.87 9.37 3.42
February 10.83 19.40 69.77 19.18 23.72 12.22 10.89 3.76
March 11.30 19.77 68.93 18.65 23.14 12.55 10.58 4.01
Source: The People’s Bank of China.
Table 4 Average Interest Rates of Large-value Deposits and Loans Denominated in US
Dollars, January through March 2015
Unit: %
Month
Large-value deposits Loans
Dema
nd
deposi
ts
Within
3
months
3–6
months
( includin
g 3
months)
6–12
months
(includin
g 6
months)
1 year
More
than 1
year
Within
3
months
3–6
months
( includin
g 3
months)
6–12
months
(includin
g 6
months)
1 year
More
than 1
year
January 0.14 0.87 1.33 1.75 2.25 1.50 2.06 1.97 2.24 2.50 3.44
Februar
y 0.22 0.64 1.35 1.50 1.92 1.54 1.90 2.08 2.15 2.48 3.50
March 0.15 0.71 1.18 1.45 1.97 1.25 1.73 2.28 1.77 2.42 3.42
Source: The People’s Bank of China.
VI. The RMB exchange rate fluctuated in both directions with
enhanced flexibility
Since the beginning of 2015, the RMB exchange rate moved in both directions with
much stronger flexibility. At the end of March, the central parity of the RMB against
the US dollar was 6.1422 yuan per dollar, representing a depreciation of 0.38 percent
from the end of 2014. From the reform of the RMB exchange-rate regime in 2005 to
the end of March 2015, the RMB registered a cumulative appreciation of 34.75
percent against the US dollar. According to calculations by the BIS, in the first quarter
of 2015 the NEER and the REER of the RMB appreciated by 3.74 percent and 4.20

17
percent respectively, and from the RMB exchange-rate regime reform in 2005 to
December 2014, the NEER and REER of the RMB exchange rate appreciated by
45.76 percent and 57.62 percent respectively.
VII. Cross-border RMB business developed steadily
RMB settlements of cross-border trade and investments continued to grow in a stable
manner. According to preliminary statistics, in the first quarter commercial banks
processed a total of 1.65 trillion yuan in RMB settlements of cross-border trade, at par
with that during the same period of the last year. In particular, settlements of trade in
goods registered 1.496 trillion yuan and settlements of trade in services and other
items under the current account registered 158.6 billion yuan. RMB receipts and
payments from cross-border trade registered 905.54 billion yuan and 749.05 billion
yuan respectively, resulting in a receipt-to-payment ratio of 1:0.83. Bank settlements
of cross-border direct investments in RMB totaled 287.9 billion yuan. Specifically,
outward direct investments settled in RMB totaled 53.4 billion yuan and foreign direct
investments settled in RMB totaled 234.5 billion yuan.
Source: The People’s Bank of China.
Figure 1 Monthly RMB Settlements of Cross-border Trade
0
1000
2000
3000
4000
5000
6000
7000
2010
.05
2010
.08
2010
.11
2011
.02
2011
.05
2011
.08
2011
.11
2012
.02
2012
.05
2012
.08
2012
.11
2013
.02
2013
.05
2013
.08
2013
.11
2014
.02
2014
.05
2014
.08
2014
.11
2015
.02
100 million yuan
Trade in services and other items
Trade in goods

18
Part 2 Monetary Policy Operations
In the first quarter of 2015, the Chinese economy faced substantial downward
pressures because the overall price inflation had moderated and uncertainties had
grown in terms of the changes in the RMB supply as a result of foreign-exchange
purchases. The PBC used a number of monetary-policy tools to increase the supply of
liquidity, which effectively filled the liquidity gaps caused by the dwindling inflows
of foreign exchange and the increased willingness of market participants to hold
foreign exchange, and maintained the total liquidity at adequate levels. At the same
time, benchmark deposit and lending rates and interest rates of repo operations were
lowered to guide market rates down and to keep real interest rates stable. A neutral
and proper monetary environment was achieved by utilizing both quantitative and
price tools. While managing aggregate credit, the PBC also paid more attention to
targeted adjustments. To support the structural adjustments, financial institutions were
guided to optimize the structure of their loans and to provide more credit to the
agricultural sector, rural areas, and farmers, small and micro enterprises, important
water conservancy projects, and other key areas and weak links in the economy.
I. Flexible open market operations were conducted
The PBC closely monitored the movements of liquidity and money-market rates, and
enhanced analysis of trends. Based on the monitoring and analysis, the PBC
conducted open market operations flexibly in line with a sound monetary policy,
supplemented by other monetary tools, such as the reserve requirement ratio, to inject
liquidity in the system in a timely and appropriate manner and to maintain banking
liquidity at adequate levels.
To counter the short-term liquidity shocks caused by the massive supply of cash and
initial public offerings before the Spring Festival, the PBC used 28-day repo
operations as a major tool to fill the liquidity gap and it conducted short-term liquidity
operations (SLO) to make pre-emptive adjustments and fine-tunings for the purpose
of ensuring adequate liquidity and the stable functioning of the money market in the
run-up to the Spring Festival. After the Spring Festival, taking into consideration the
decline in the RMB equivalent of foreign-exchange purchases, the PBC injected
short-term liquidity in the system mainly through 7-day repos to release signals of
continuity in the sound monetary policy and to steadily guide money-market rates
down. In the first quarter of 2015, a total of 793 billion yuan of repo operations was
conducted, and 180 billion yuan of liquidity was injected into the system through SLO
operations. At the end of March, outstanding repos and SLOs posted 50 billion yuan
and zero respectively.
Against the background of downward pressures on the economy and the softening of

19
price growth, the PBC enhanced the flexibility of open market operations when
appropriate as a supplement to the cut in the benchmark deposit and lending rates. In
Q1, 7-day repo rates dropped by 30 basis points to 3.55 percent to anchor market
expectations, enhance the effects of monetary-policy operations, and reduce financing
costs in the entire economy. In April, in view of the trend in market interest-rate
movements, 7-day repo rates decreased by 20 basis points to 3.35 percent.
Central treasury cash management operations were conducted at appropriate times. In
the first quarter of the year, a total of 130.0 billion yuan of treasury funds was
deposited in commercial banks on three separate operations, including 100.0 billion
yuan in six-month deposits and 30.0 billion yuan in nine-month deposits.
II. The Standing-Lending Facility (SLF) and the Medium-term
Lending Facility (MLF) were carried out appropriately when
necessary
In order to improve liquidity management of financial institutions incorporated at
local levels, effectively prevent liquidity risks in small- and medium-sized financial
institutions, and facilitate smooth operations in the money market, at the beginning of
2015 the PBC and its branches expanded the coverage of the pilot SLF program from
10 provinces (municipalities) to the entire country. Meanwhile, interest rates were
adjusted to be in line with the purpose of monetary policy, and the role of the SLF
interest rates as the ceiling for the interest-rate corridor in the money market was
explored. During the Spring Festival, the PBC headquarters provided short-term
liquidity support to eligible large commercial banks through SLF operations, while
PBC branch offices also injected short-term liquidity into eligible small and
medium-sized financial institutions. These measures stabilized market expectations
and facilitated smooth operations of the money market. In the first quarter of the year,
the volume of outstanding SLFs registered 170 billion yuan.
In the first quarter, to maintain stable economic growth and ensure the supply of base
money, the PBC provided a total of 1014.5 billion yuan in medium-term base money
to large commercial banks, policy banks, and joint stock commercial banks through
MLF operations, offering an interest rate of 3.5 percent with a maturity of three
months. At the end of the quarter, the volume of outstanding MLF operations stood at
1014.5 billion yuan. While providing MLFs, the PBC also guided financial
institutions to beef up support to small and micro firms, the agricultural sector, rural
areas, and farmers, and other key areas and weak links in the economy. The interest
rate of MLF operations was used as the medium-term policy rate to lower the lending
interest rates and the social financing costs, and to support the real economy.

20
III. Targeted and universal cuts in the reserve requirement ratio
cuts were combined
In February 2015 the PBC lowered the RMB deposit reserve requirement ratio (RRR)
for financial institutions. First, the RRR for all financial institutions was reduced by
0.5 percentage points; second, the RRR for targeted financial institutions was cut: the
ratio for the Agriculture Development Bank of China was reduced from 18 percent to
13.5 percent. Based on the results of dynamic evaluations of financial institutions
whose RRRs were lowered in June 2014, the PBC cut by an additional 0.5 percentage
point the RMB RRR for some city commercial banks and non-county-level rural
commercial banks that had extended a specific share of loans to small and micro
companies.
In April, the PBC decided to further cut the RMB deposit RRR for financial
institutions. The RRR for all depository financial institutions was cut by 1 percentage
point; furthermore, RRR cuts were carried out for targeted institutions: the RRR for
the Agricultural Development Bank was reduced from 13.5 percent to 10.5 percent
and that for rural cooperative banks, rural credit cooperatives, village and township
banks, financial companies, financial leasing companies, and auto financing
companies were lowered by 1 or 1.5 percentage points to a uniform rate of 11.5
percent.
Since the beginning of 2014, to step up targeted support to the agricultural sector,
rural areas, and farmers, and micro and small enterprises under a sound monetary
stance, the PBC carried out four targeted RRR cuts, which achieved positive results.
The targeted reduction in the RRR for county-level rural financial institutions in April
2014 covered every institution in this category and benefited about 400 county-level
rural commercial banks and rural cooperative banks with legal person status. In June
2014, there was another targeted RRR reduction for state-owned commercial banks,
joint-venture commercial banks, the Postal Savings Bank of China, municipal
commercial banks, non-county-level rural commercial banks, non-county-level rural
cooperative banks, and foreign banks that met the macro-prudential requirements and
extended a certain share of loans to agriculture-related or small and medium-sized
enterprises. Among the 377 financial institutions being evaluated, 302 met the
requirements and enjoyed a required reserve ratio that was 0.5 percentage point lower
than that of comparable institutions. In February 2015, the PBC conducted a dynamic
evaluation of financial institutions that had participated in the review for the targeted
required reserve ratio cut in June 2014 and this time increased the percentage of the
rate cut. A total of 383 institutions were evaluated and 285 met the requirements for
the targeted rate cut. Among the 285 institutions, 45 enjoyed a rate that was 0.5
percentage lower, while the other 240 met the requirements for additional cuts and
thus enjoyed a preferential rate which was 1 percentage lower than that of comparable
institutions. In April 2015, the required reserve ratio for rural cooperatives and village

21
and township banks was reduced by 1 percentage point. The rate for rural cooperative
banks was reduced to the same level of that of rural cooperatives. This time, the
reduction covered almost all county-level financial institutions with legal person
status. The targeted reduction of the reserve requirement ratio provides incentives to
facilitate optimization of the loan structure and to guide commercial banks to increase
the percentage of new or recovered loans for agriculture-related enterprises and SMEs
so that those enterprises can receive more credit resources even though the total
amount of loans does not grow tremendously.
IV. The dynamic adjustment mechanism of the differentiated
reserve requirements continued to play an active role
Macro-prudential management was strengthened. The dynamic adjustment
mechanism of the differentiated reserve requirements was further improved to play an
active role in counter-cyclical management and structural adjustments. The
parameters of the dynamic adjustment mechanism were calibrated according to the
performance of financial institutions in five respects, including: the amount of loans
for micro enterprises and agriculture-related enterprises, the capital adequacy ratio,
internal risk controls, the launch of new branch offices, and regional development, so
that the mechanism can be more differentiated and targeted. Financial institutions
were encouraged to keep the pace of credit extensions in line with real and seasonal
demands, and to increase the proportion of lending to small and micro enterprises, the
agricultureal sector, rural areas, and farmer, businesses in the central/western and
underdeveloped regions, and other key areas and weak links in the economy, so as to
support the appropriate growth of credit and development of the real economy.
V. Multiple measures were taken to guide financial institutions to
optimize their loan structures
By strengthening central bank lending and discounts, timely disbursing the Pledged
Supplementary Lending (PLS), and facilitating innovations in financial services, the
PBC guided financial institutions to step up their credit support to key areas in the
economy, such as the agricultural sector, rural areas, and farmers, small and micro
enterprises,, and financial support for the people’s livelihood. By the end of March,
the central bank’s outstanding agricultural-supporting loans reached 192.8 billion
yuan, up 47.2 billion yuan from the same period of the last year; outstanding micro
enterprise supporting loans registered 61.8 billion yuan, an increase of 61.8 billion
yuan year on year; and the outstanding amount of central bank discounts was 132.2
billion yuan, up 26.8 yuan from the same period of the last year. In accordance with
the timeline of the shantytown renovation project, the PBC issued PLS in the amount
of 1131.8 billion yuan to the China Development Bank; as a result the Bank received
a total of 514.9 billion yuan in PSLs. Banking institutions were encouraged to expand
批注 [N1]: what is this?

22
the scope of collateral in rural areas and to customize financial services to businesses,
such as family farms. Furthermore, commercial banks were encouraged to provide
credit guarantee insurance financing for micro and small firms. Banks meeting certain
requirements were allowed to issue financial bonds for micro and small firms. In
general, these targeted and effective measures produced good results and helped to
encourage financial institutions to increase loans to micro and small firms, and
agriculture-related businesses, lower financing costs for enterprises in economic weak
links, and ease the problems of a lack of access to financing and the high costs of
financing.
Financial institutions were guided to mobilize the stock of credit assets, optimize the
structure of new loans, and support structural adjustments and upgrading. In order to
allow investment to play an important role in stabilizing growth, commercial, policy,
and development financial institutions were urged to provide support to investment
projects in seven large categories, to consumption programs in six areas, to three
kinds of key projects with strategic importance, and to “going global” projects. The
reasonable funding needs of key ongoing and follow-up projects were met and efforts
were made to support major infrastructure and livelihood projects, such as the
reconstruction of shanty dwellings, railway construction, irrigation systems, and
underground pipe networks that both enhance the people’s livelihood and help
improve the quality and efficiency of economic growth. With respect to financial
services for industries with excess capacity, in line with the principle of
“differentiated treatment and no one-size-fits-all approach,” the PBC urged financial
institutions to strengthen and improve credit management by way of absorbing,
relocating, consolidating, and eliminating excess capacity. Innovations in consumer
credit products were facilitated. The housing credit policy was further improved to
facilitate the purchase of owner-occupied or improvement-oriented homes and to
promote the stable and healthy development of the housing market. Assessments of
the effects of credit policy guidance were further refined. Financial institutions were
encouraged to revitalize their stocks of credit assets through credit asset securitization
and by properly using recollected funds, optimizing fund allocations, and increasing
the amount of loanable funds.
As a result, the credit structure was further optimized and credit inputs played a
greater role in promoting stable growth, transformation of the growth model, and
improving the people’s livelihood. First, there was a rapid growth in loans extended to
the industrial sector and to infrastructure construction. By the end of March 2015,
outstanding medium- to long-term loans for the entire industrial sector stood at 30.74
trillion yuan, up 15.8 percent and an increase of 5.7 percentage points compared with
the same period of the last year. Outstanding medium- to long-term loans for
infrastructure construction registered 14.45 trillion yuan, an increase of 11.1 percent
or 4.7 percentage points year on year. Second, medium- and long-term loans for
tertiary industry grew rapidly, whereas those for industries with an over-capacity
dropped by a large margin. At the end of March, outstanding medium- and long-term

23
loans to tertiary industry grew by 18.7 percent, up 3.6 percentage points year on year;
whereas those to industries with an over-capacity went up by 3.2 percent, down 2.9
percentage points from the same period of the last year. Third, loans to SMEs
increased rapidly. At the end of March, outstanding loans to SMEs posted 15.89
trillion yuan, registering a year-on-year increase of 16 percent, which is 2 percentage
points higher than the growth of total loans during the same period.
VI. Benchmark deposit and lending rates were cut in
coordination with the market-based interest-rate reform
Benchmark deposit and loan rates were lowered on November 22, 2014. Since then,
in order to have benchmark rates continuously guide the pricing behavior of banks, to
consolidate the achievements made so far in lowering the financing costs, and to
create a neutral monetary and financial environment for the adjustment,
transformation, and upgrading of the economic structure, the PBC decided to lower
the RMB benchmark loan and deposit interest rates for financial institutions as of
March 1, 2015. The one-year RMB benchmark loan interest rate and the deposit
interest rate were both lowered by 0.25 percentage point, to 5.35 percent and 2.5
percent, respectively. As the benchmark rates released by the central bank play a
significant guiding role, a further reduction in the benchmark loan rate is expected to
reduce the real lending rates of financial institutions. In the meantime, declines in the
benchmark deposit rates will help lower the funding costs of financial institutions,
further reduce market interest rates and the financing costs of the corporate sector, and
play an active role in alleviating the problem of the high financing costs for
enterprises.
At the same time, the upper limit of the floating range for deposit interest rates was
raised from 1.2 to 1.3 times the benchmark level to support the market-oriented
interest-rate reform. With this enlargement, financial institutions will have more space
for independent pricing to help them further improve their interest-rate pricing
mechanism, enhance their independent pricing capacity, accelerate transformation of
the operation model, and improve financial services. The measure will also help
improve the market interest-rate mechanism and enable the market to better play a
role in determining the allocation of resources.
Box 1 An Analysis of Deposit Interest-Rate Pricing Against the Background of
Progress in the Market-Based Interest-Rate Reform
In accordance with the overall arrangements of the State Council, the PBC decided to
further cut the benchmark interest rates of RMB deposits and loans and to raise the
upper ceiling of the floating range of deposit interest rates. Looking at the deposit
interest-rate movements since the rate adjustments, the deposit interest rates have
generally moved downward as a result of the cut in the benchmark rate, and the

24
pricing of deposit interest rates has become further differentiated and case-specific.
Additionally, the deposit interest-rate pricing has become more layered and
competitive.
After the rate cut, deposit interest rates have generally declined and the floating range
of interest rates of different maturities has expanded, but they still have not reached
the upper limit of 1.3 times the benchmark interest rate. In March 2015, the weighted
average interest rates of demand deposits was 0.38 percent, roughly unchanged
compared with the pre rate-cut level (in October 2014); the weighted average interest
rate of time deposits was 3.14 percent, 0.18 percentage points lower than the level
before the rate cut. In particular, the weighted average interest rate of 3-month
deposits and 1-year deposits was 2.54 percent and 3.06 percent respectively, a decline
of 0.28 and 0.20 percentage point from the pre‒ rate-cut level respectively.
Looking at the interest-rate quotations at bank counters, financial institutions can be
divided into three groups. The first group mainly consists of state-owned banks and a
small number of joint stock banks that have offered a small floating margin from the
benchmark deposit interest rates, with a 10 percent upward floating for deposits with a
maturity of within one year; the second group are mainly joint stock commercial
banks and a small number of city commercial banks that have offered an upward
floating margin that is larger than that in the first group but smaller than that in the
third group, with a 20 percent upward floating margin for deposits with a maturity of
within one year, and a 10 percent upward floating margin for demand deposits and
time deposits with a maturity of more than two years; the third group mainly consists
of locally incorporated financial institutions with legal person status that have offered
a large upward floating margin of between 20 to 30 percent from the benchmark
interest rate. In the early days after adoption of the rate adjustment policy, some joint
stock banks and city commercial banks floated deposit interest rates of all maturities
to the upper limit and then adjusted downward the deposit interest-rate quotes based
on their own circumstances and inter-bank competition.
The differentiated approach of deposit interest-rate pricing among financial
institutions is related to the management and operational styles of financial
institutions in a financial system dominated by indirect financing, and it is also
affected by many factors, including the deposit pricing capacity, the pricing strategy,
and inter-bank competition. In terms of the operational style, financial institutions
with a sound governance structure, financial constraints, and a strong pricing capacity
have a diversified customer structure and income sources, and are fairly strong in
terms of cost controls and risk management. Therefore, the pricing of their deposit
interest rates is more differentiated and more case-specific, and their interest-rate
levels are fairly low. Looking at pricing capacity and strategy, large banks have a
strong pricing capacity and large shares in the deposit market. As such, they play a
leading role in pricing the deposit interest rates and they usually offer fair interest
rates; small- and medium-sized banks usually follow market prices and adopt a

25
strategy of following the large banks in terms of pricing, thus their interest rates are
slightly higher those of the large banks. In terms of the market environment, due to
the different financial eco-environments and inter-bank competition, in regions where
the financial institutions vie fierecely for deposits, a larger range of the floating
margin will be offered for deposit interest rates.
In general, as the market-based interest-rate reform progresses and transformation of
the operations and management of financial institutions accelerated, their pricing and
risk management capacities will improve and thus in the long run the deposit interest
rates will be priced in a more differentiated and case-specific manner. During this
process, in order to effectively control risks it is necessary to tap into the role of the
self-regulatory mechanism of market interest-rate pricing in order to guide financial
institutions to rationally and sensibly price their interest rates and to maintain fair and
orderly pricing.
VII. The RMB exchange-rate regime was further improved
The market-based RMB exchange-rate formation regime was further improved in a
self-initiated, controllable, and gradual manner to allow market supply and demand to
play an increasingly important role, to enhance the flexibility of the RMB exchange
rate in both directions, and to keep the exchange rate basically stable at an adaptive
and equilibrium level.
In the first quarter, the highest and lowest central parity of the RMB against the US
dollar were 6.1617 and 6.1188 respectively. Among the 57 trading days, the RMB
appreciated on 24 days and depreciated on 33 days. The largest daily appreciation was
0.17 percent (105 basis points) and the largest daily depreciation was 0.16 percent (96
basis points).
The RMB floated in both directions against other major currencies, including the euro
and the Japanese yen. At the end of March, the central parity of the RMB against the
euro and the Japanese yen was 6.6648 yuan per euro and 5.1272 yuan per 100 yen
respectively, an appreciation of 11.87 percent and a depreciation of 0.19 percent
respectively from the end of the last year. From the start of the reform of the RMB
exchange-rate regime in 2005 until March 2015, the RMB appreciated against the
euro and the yen by 50.3 percent and 42.5 percent respectively. Direct trading
between the RMB and other currencies in the inter-bank foreign-exchange market was
active and market liquidity increased notably, thus helping to lower the costs of
currency conversion for market participants at the micro level.

26
Table 5 The Trading Volume of the RMB against Foreign Currencies in the Inter-bank
Foreign-Exchange Spot Market in Q1 2015
Unit: 100 million yuan
Curre
ncy
USD Euro Japan
ese
yen
HKD GBP Austr
alian
dollar
New
Zeala
nd
dollar
Singa
pore
dollar
Canad
ian
dollar
Malay
sian
ringgi
t
Russi
an
ruble
Thai
baht
Tradi
ng
volum
e
67871 1312.
5
801.2 324 351.4 309.5 59.4 1052.
5
7.1 3.7 11.6 0.2
Source: China Foreign Exchange Trade System.
In the first quarter, under the bilateral local currency swap agreements signed by the
PBC and the relevant foreign monetary authorities, overseas monetary authorities
conducted a total of 44.950 billion yuan in transactions, actually using a total of
16.504 billion yuan in RMB; the PBC conducted transactions equivalent to USD481
million, actually using foreign currency equivalent to USD481 million. At end-March,
the outstanding amount of RMB used by foreign monetary authorities stood at 17.504
billion yuan whereas the amount used by the PBC equaled USD671 million. This has
played an active role in facilitating bilateral trade and investment.
VIII. Reforms of financial institutions were deepened
Institutional arrangements for the deposit insurance scheme were launched. On March
31, 2015, the Regulations on Deposit Insurance were published and they came into
effect on May 1, 2015. On April 1, 2015, the State Council released approval of the
Implementation Program of the Deposit Insurance Scheme, designating the PBC to
manage the deposit insurance fund, with responsibility for carrying out the scheme,
requiring the PBC, together with other relevant government agencies, to carefully
implement the Regulations on Deposit Insurance and related laws and regulations.
Providing sufficient protection for the rights and interests of depositors, deposit
insurance contributes to improving the financial safety net and serves as a long-term
mechanism for safeguarding financial stability. The launch of deposit insurance is
important to maintain financial stability, promote banking reform, boost the
development and competitiveness of the financial industry, and improve the quality of
financial services to the real economy.
The reform of policy and development banks achieved breakthroughs. In December
2014, the State Council approved the reform plan of the Agricultural Development
Bank of China (ADBC) and in March 2015 it approved the plan for deepening the
reform of the China Development Bank (CDB) and the implementation plan for the
reform of the Export-Import Bank of China (Exim Bank). According to these plans,
the ADBC and the Exim Bank will further define and enhance their policy roles,
continue to focus on policy-related businesses, properly define their business scopes,

27
establish an explicit risk compensation mechanism, enhance their capital strength,
establish capital adequacy restraint mechanisms, improve internal controls and
external supervision, and establish a sound governance framework and
decision-making mechanism for the purpose of becoming policy banks with clearly
defined roles and business scopes, specific functions, adequate capital, sound
corporate governance, rigorous internal controls, and safe operations that provide
good services and have a capacity for sustainable development. The CDB shall
continue to define its role as a development financial institution, adapt to the
market-based and globalization context, and make full use of its advantages in serving
national strategies, providing access to credit support, market operations, and a
guaranteed principal with a marginal profit, further improve its operational mode for
development finance, refine its organizational arrangements and governance structure,
clarify the sources of its capital and related supporting policies, replenish capital,
strengthen its capital restraint mechanisms, and enhance internal controls and external
supervision so that it will become a development financial institution with adequate
capital, sound corporate governance, strict internal controls, safe operations, good
services, and high-quality assets. The reform will enhance these banks’ role in
development and policy-related finance, and will enable them to provide sustained
and targeted support to large construction programs, such as reconstruction of
shantytowns, industrial upgrading, the going global strategy of China’s
equipment manufacturing industry, the internationalization of Chinese enterprises,
grain purchases and reserves, oil and cotton, infrastructure building in rural areas, and
water conservancy projects. In addition these banks will make larger contributions to
stabilize growth, promote reform and structural adjustments, and improve the people’s
livelihood.
The reform of the rural credit cooperatives (RCCs) proceeded smoothly, and the
RCCs have continuously improved their operations, financial conditions, and
agro-related financial services. At the end of March, under the five-category
classification of loans, the outstanding amount of NPLs and the average NPL ratio of
RCCs stood at 436.1 billion yuan and 3.9 percent respectively. Their capital adequacy
ratio was 11 percent. Outstanding loans of the RCCs across the country stood at 11.2
trillion yuan, accounting for 13.1 percent of the total loans of all kinds of financial
institutions during the same period, up 0.2 percentage point from the end of 2014.
Outstanding agro-linked loans and loans to farmers posted 7.3 trillion and 3.5 trillion
yuan, up 12.7 percent and 10.9 percent respectively from the end of 2014. At
end-March, there were 1,458 RCCs, 693 rural commercial banks, and 83 rural
cooperative banks with legal-person status at the county (city) level. Some RCCs
explored the possibility of introducing private enterprises as shareholders, which will
not only enhance the role of shareholders in management, but will also improve the
corporate governance of the RCCs.

28
IX. Reform of foreign exchange administration was deepened
Great efforts were made to streamline administrative procedures and delegate powers
for foreign exchange administration. Measures were taken to help enterprises save
costs, including: abolishing the foreign-exchange registration and review under direct
investments and delegating approvals of insurance companies’ foreign-exchange
businesses to branches of the State Administration of Foreign Exchange. Laws and
regulations were streamlined and consolidated. Furthermore, 50 foreign-exchange
regulations were abrogated and revoked. All those measures facilitated rule by law.
Trade and investment were made more convenient. A pilot program of cross-border
foreign-exchange payments was carried out by some payment institutions in the
country, making cross-border e-commerce more convenient. Regulation of RMB
funds derived from the settlement of foreign-exchange capital by foreign-funded
enterprises was reformed to meet the business operations demands of foreign-funded
enterprises. The Guidelines for Foreign-Exchange Management of the
Insurance Business were released to further simplify the processes and procedures of
the foreign-exchange insurance business. Reform of foreign exchange administration
under direct investments was deepened. Procedures for direct investments were
simplified with the abolition of the foreign-exchange filing for overseas reinvestments
and the annual foreign-exchange inspections for direct investments in order to provide
convenient services. A pilot program on macro-prudential regulation of enterprise
self-discipline in terms of the ratio of foreign debts was implemented in some
enterprises, partially easing the financing difficulties and the high financing costs. In
2015 the quotas for outstanding short-term foreign debts of domestic institutions were
lifted considerably from those in 2014, thus boosting the financing of import bills by
domestic financial institutions.
The building of a cross-border receipts and payments monitoring system was
promoted. Data transparency has been improved. Data on international trade in
goods and services were published for the first time on a monthly basis, consistent
with the requirements in the Balance of Payments and International Investment
Position Manual (Sixth Edition). Questions were addressed in a timely manner to
anchor market expectations. Special inspections of important business including retail
foreign currency cash and important players including banks were carried out to
prevent abnormal flows of foreign exchange and to crack down on illegal activities.

29
Part 3 Financial Market Analysis
In Q1 2015,the performance of the financial market was sound. The money market
traded briskly, while market rates were generally stable. The volume of bond
issuances increased significantly, and the yield curve of government securities shifted
downward before moving upward. The Shanghai and Shenzhen stock indices rallied
and trading volume surged.
I. Financial market analysis
1. The money market traded briskly and market interest rates climbed before
declining.
Growth of repo transactions on the inter-bank market surged, while the turnover of
inter-bank borrowing increased rapidly. In Q1, the turnover of bond repos on the
inter-bank market reached 66.4 trillion yuan, representing an average daily turnover of
1.1 trillion yuan, up 70.9 percent year on year and an acceleration of 68.2 percentage
points from Q1 2014. The turnover of inter-bank borrowing reached 8.3 trillion yuan,
with an average daily turnover of 137.6 billion yuan, up 15.8 percent year on year and
representing an acceleration of 46.3 percentage points. In terms of the maturity
structure, overnight products still dominated the bond repos and inter-bank borrowing
transactions, accounting for 75 percent and 73.7 percent of their respective turnovers.
The turnover of government securities repos on the stock exchanges rose 14 percent
year on year to 21.8 trillion yuan.
The flow of funds among financial institutions displayed the following characteristics.
First, the volume of trading increased by a large margin year on year. Net lending of
large commercial banks increased 110 percent year on year to reach 26.85 trillion
yuan. Net borrowing of Chinese-funded small- and medium-sized banks was more
than four times the amount in Q1 2014. Second, large banks became the sole fund
providers, with foreign-funded institutions changing from fund suppliers to fund
borrowers. Third, borrowing by insurance companies decreased year on year by 61
percent to 482.3 billion yuan.
Table 6 Fund Flows among Financial Institutions in Q1 2015
Unit:100 million yuan
Repos Inter-bank borrowing
Q1 2015 Q1 2014 Q1 2015 Q1 2014
Chinese-funded large
banks①
-250,410 -114,858 -18,076 -12,716
Chinese-funded small- 114,535 32,693 -9,005 -7,179

30
and medium-sized banks
②
Securities and fund
management companies 53,937 48,336 15, 268 14,147
Insurance companies 4,805 11,762 18 35
Foreign-funded financial
institutions 14,744 1,589 5,001 -2,147
Other financial
institutions and vehicles
③
62,390 20,478 6,794 7,860
Notes:①Large Chinese-funded banks include the Industrial and Commercial Bank of China, the
Agricultural Bank of China, the Bank of China, the China Construction Bank, the China
Development Bank, the Bank of Communications, and the Postal Savings Bank of China.
②Small- and medium-sized Chinese-funded banks include the China Merchants Bank and sixteen
other medium-sized banks, small-sized city commercial banks, rural commercial banks, rural
cooperative banks, and village and township banks.
③Other financial institutions and vehicles include urban credit cooperatives, rural credit
cooperatives, finance companies, trust and investment companies, financial leasing companies,
asset-management companies, social security funds, investment companies, corporate annuities,
and other investment vehicles. Some of these financial institutions and vehicles do not participate in
the inter-bank funding market.
④ A negative sign indicates net lending and a positive sign indicates net borrowing.
Source: China Foreign Exchange Trade System.
In Q1, 17,000 deals were reached on the RMB interest-rate swap market, with the
total notional principal volume reaching 1.7 trillion yuan, up 105.7 percent year on
year. In terms of the term structure, contracts with maturities of within one year
traded most briskly and their aggregate notional principal posted 1.4 trillion yuan,
accounting for 83.3 percent of the total. In terms of the reference rates, the base rate
of the floating leg of the RMB interest-rate swaps mainly included the 7-day fixing
rate (FR007) and the Shibor, and their notional principal accounted for 91.9 percent
and 7.2 percent of the total respectively. In Q1 2015, a total of 346 standard products
of interest-rate derivatives was traded, with a gross turnover of 129.55 billion yuan.
Table 7 Transactions of Interest-Rate Derivatives in Q1 2015
Interest-rate swaps Bond forwards Forward-rate agreements Standard Interest-rate
derivatives
Number
of deals
(lots)
Amount of
notional
principal
(100 million
yuan)
Transac
tions
(lots)
Amount
(100
million
yuan)
Transactio
ns (lots)
Amount of
notional
principal
(100 million
yuan)
Transactions
(lots)
Amount of
notional
principal
(100
million
yuan)
Q1
2014 8,879 8,067.3 — — — —
—
—
Q1
2015 17,391 16,596.9 — — — —
346
1,295.5

31
Source: China Foreign Exchange Trade System.
The issuance and trading of inter-bank certificates of deposit (CD) were active. By the
end of March, 85 financial institutions had disclosed CD issuance plans. In Q1, 58
financial institutions issued 965 CDs on the inter-bank market, in a total amount of
713.8 billion yuan. The trading volume on the secondary market was 537.5 billion
yuan. The issuance and trading are both priced based on the Shibor. The rapid
development of the CD market has helped enhance the role of the Shibor at the
medium to long ends. In March, the weighted average interest rate for the issuance of
3-month CDs was 5.11 percent, 21 basis points higher than the average rate of the
3-month Shibor in March.
Due to the rally in the capital market and the frequent issuance of new stocks, and as a
result of the decline in the RMB equivalence of foreign-exchange purchases and the
slow progress in disbursements of State Treasury funds, money-market interest rates
moved up in Q1. In March, the inter-bank borrowing and pledged repo rate posted
3.69 percent and 3.61 percent respectively, up 20 and 12 basis points from December
2014, up 1.21 and 1.12 percentage points year on year. Since the second half of
March, as the PBC used various channels to provide liquidity, and moved to reduce
the interest rates of open market operations, and with the unfolding of the impact of
the previous reductions in loan and deposit interest rates, money-market interest rates
declined considerably. At end-March, the overnight and one-week Shibor were 3.18
percent and 3.89 percent respectively, down 35 and 75 basis points from the end of
2014; the 3-month and one-year Shibor were 4.90 percent and 4.78 percent
respectively, down 24 basis points and up 5 basis points respectively. Since the
beginning of April, money-market interest rates have continued to decline. In the
run-up to the end of April, overnight borrowing and bond pledged repo interest rates
were below 2 percent and the 7-day lending and pledged repo interest rates were 3
percent.
Box 2 Movements of Market Interest Rates and Related Issues
In recent years, market interest rates have attracted increasing attention. Looking at
the time-series data, market interest rates (especially short-end interest rates)
fluctuated in larger margins at certain time points, and money-market rates moved up
modestly. Recently, there have been new changes in the market interest rates.
Observing the micro and macro mechanisms behind these phenomena are of great
significance for an understanding of inherent laws based on which the economic and
financial system work and an understanding of the monetary-policy framework.
The first is to observe is the real interest rates. According to economics theory,
monetary policy has no impact on real interest rates in the medium and long run. Real
interest rates are determined by the propensity to save and to invest. In recent years,
the savings rate and the investment rate have both declined, with the latter declining
by a larger margin. This led to a climb in the real interest rates against the background
of a moderation in investment growth, and it reflected the shortage of savings

32
compared with aggregate demand for investment and borrowing. The rapid expansion
of entities with soft financial constraints and the rigidity of bond payments and trust
product payments may have contributed to the excessive expansion of demand for
money. In economics theory, there is an equilibrium (real) interest rate concept.
According to the golden rule, an equilibrium (real) interest rate is equivalent to the
rate of return from investment (the approximation of which is the rate of economic
growth). Interest-rate liberalization is a process of removing financial depressions and
promoting market rates to move back to the equilibrium level. In the process, the
interest-rate level will generally move up, as shown in the experience of many
economies. The above factors are dynamic. When the propensity to save increases,
compared with the propensity to invest, real interest rates may change in the opposite
direction, which is closely related to the performance of the real economy. Therefore,
according to some research the level of the savings rate should be considered when
calculating the equilibrium interest rates.
The next is to observe is the nominal interest rate. In general, nominal interest rates,
especially short-end interest rates, are affected by the central bank. But other factors
also have an impact. In recent years, the monetary-policy environment has changed
considerably. On the supply side, with the BOP position approaching equilibrium, the
passive supply of liquidity (the monetary base) as a result of foreign-exchange
purchases has dwindled and the central bank has taken active measures to supply
liquidity to the market. The liquidity situation has changed from being relatively loose
to becoming normal. On the demand side, with the development of innovative
financing channels, the demand for liquidity and sensitivity toward liquidity have both
increased. During the previous period, financing channels other than traditional
lending, such as off-balance-sheet businesses, wealth management businesses, and
trust and entrusted loans, have expanded rapidly, but these channels are directly or
indirectly supported by the liquidity in the banking system. As such, management of
liquidity has a stronger role to play in the management of the total volume of
financing and monetary conditions. If there is an excessive expansion of money and
credit beyond the intended objective of economic management and the needs of the
macro-economy, the central bank will have to adjust the level of liquidity supply to
maintain appropriate monetary conditions. In this process, there may be a temporary
“conflict” between the excessive market demand and the appropriate liquidity supply,
as reflected in the movements in the market rates. In addition, fiscal deposit
fluctuations, tax payment factors, demands for cash in the run-up to and during the
holidays, the freezing of funds related to new IPOs, and monetary-policy changes in
the major economies may all produce shocks to market interest rates.
During a period of time after June 2014, due to the effects of the monetary-policy
measures and guidance, and affected by the decline in off-balance-sheet financing,
demand for liquidity dwindled and interest rates in the money market declined slightly.
In December, the boom in stock market investments promoted demand for liquidity
and consequently pushed up interest rates in the money market. In the recent period,

33
with the effects of the PBC measures, including liquidity injections through many
channels, reduction of open market interest rates, and benchmark lending and deposit
rate cuts, money-market interest rates have declined notably. In April, the weighted
average interest rate of 7-day pledged repo declined 1.4 percentage points from
December to 2.94 percent. The performance of money and credit has been stable in
the process of increasing the supply of liquidity.
From the above analysis, it can be observed that monetary policy during the transition
period needs to strike a balance between quantity and price. In the cycle of
macro-economic movements, at a certain stage the quantitative and price goals
might conflict with one another, while at another stage such conflicts might ease. Yet,
against the background of financial innovation and the rapid development of the
financial market, it will be increasingly difficult to strike a balance between the
quantitative goals and the price goals. In the cases of the major economies, this is an
important reason for the shift in their monetary-policy frameworks to price-based
adjustments. At present, the conduct of monetary policy is gradually moving from
quantity-based adjustments to price-based adjustments. With the existence of soft
constraints and other institutional issues, reform of the financial sector is progressing,
and thus at this stage it is premature to consider a thorough shift to price-based
adjustments. Quantitative goals still have a role to play in the transition. Thus it is
necessary to coordinate between the quantitative and price instruments and to use a
number of tools to manage overall monetary conditions.
In general, money-market interest rates and their movements reflect the structural
changes in the economy and the interactions among a series of complex factors. In the
future, it will be necessary to strengthen communications and policy coordination, to
reduce the shocks to the money market, to strengthen and improve financial
regulation, to contain the excessive expansion of entities with soft financial
constraints, and to improve the financial eco-environment. Furthermore, the conduct
of monetary policy will gradually move from quantity-based adjustments to
price-based adjustments and the transmission mechanism will be improved.
2. Spot bond trading became increasingly brisk, and bond issuances expanded
rapidly, while coupon rates generally declined.
In Q1, the volume of spot bond trading on the inter-bank market posted 12.6 trillion
yuan, with the daily trading volume averaging 210.2 billion yuan, up 77.8 percent. In
terms of the trading entities, Chinese-funded small- and medium-sized banks were
mainly net bond sellers, with total net spot bond sales of 303.8 billion yuan in Q1;
other financial institutions and vehicles were net bond purchasers, with net spot bond
purchases of 317.2 billion yuan. In terms of traded products, a total of 1.2 trillion
yuan of spot government securities was traded, accounting for 9.8 percent of the total
spot bond transactions on the inter-bank market; the turnover of spot financial bonds
and corporate debenture bonds was 6.7 trillion yuan and 4.7 trillion yuan respectively,
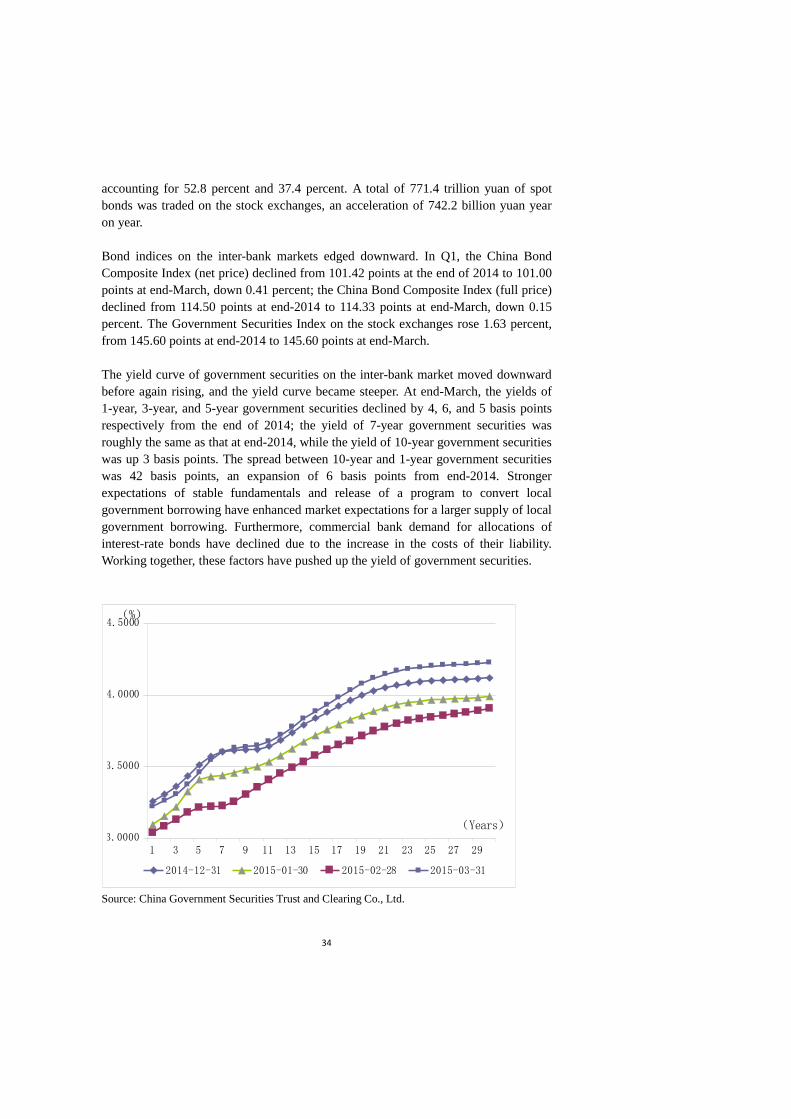
34
accounting for 52.8 percent and 37.4 percent. A total of 771.4 trillion yuan of spot
bonds was traded on the stock exchanges, an acceleration of 742.2 billion yuan year
on year.
Bond indices on the inter-bank markets edged downward. In Q1, the China Bond
Composite Index (net price) declined from 101.42 points at the end of 2014 to 101.00
points at end-March, down 0.41 percent; the China Bond Composite Index (full price)
declined from 114.50 points at end-2014 to 114.33 points at end-March, down 0.15
percent. The Government Securities Index on the stock exchanges rose 1.63 percent,
from 145.60 points at end-2014 to 145.60 points at end-March.
The yield curve of government securities on the inter-bank market moved downward
before again rising, and the yield curve became steeper. At end-March, the yields of
1-year, 3-year, and 5-year government securities declined by 4, 6, and 5 basis points
respectively from the end of 2014; the yield of 7-year government securities was
roughly the same as that at end-2014, while the yield of 10-year government securities
was up 3 basis points. The spread between 10-year and 1-year government securities
was 42 basis points, an expansion of 6 basis points from end-2014. Stronger
expectations of stable fundamentals and release of a program to convert local
government borrowing have enhanced market expectations for a larger supply of local
government borrowing. Furthermore, commercial bank demand for allocations of
interest-rate bonds have declined due to the increase in the costs of their liability.
Working together, these factors have pushed up the yield of government securities.
3.0000
3.5000
4.0000
4.5000
1 3 5 7 9 11 13 15 17 19 21 23 25 27 29
(Years)
(%)
2014-12-31 2015-01-30 2015-02-28 2015-03-31
Source: China Government Securities Trust and Clearing Co., Ltd.
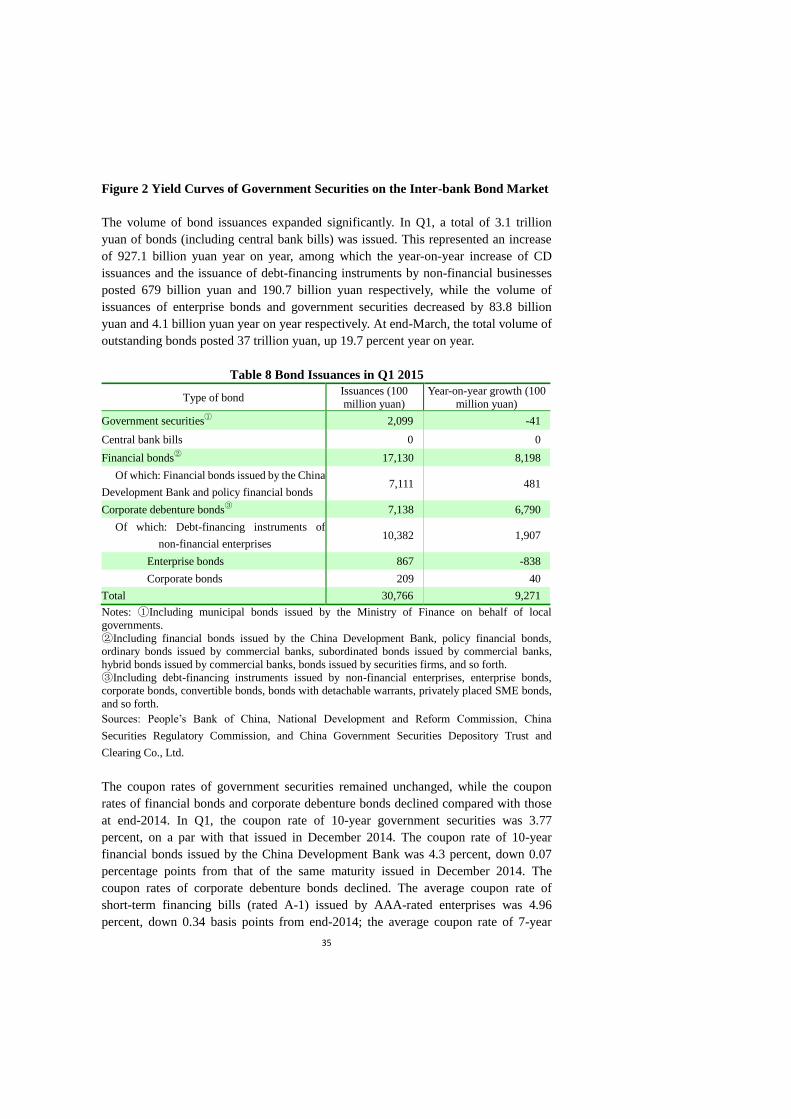
35
Figure 2 Yield Curves of Government Securities on the Inter-bank Bond Market
The volume of bond issuances expanded significantly. In Q1, a total of 3.1 trillion
yuan of bonds (including central bank bills) was issued. This represented an increase
of 927.1 billion yuan year on year, among which the year-on-year increase of CD
issuances and the issuance of debt-financing instruments by non-financial businesses
posted 679 billion yuan and 190.7 billion yuan respectively, while the volume of
issuances of enterprise bonds and government securities decreased by 83.8 billion
yuan and 4.1 billion yuan year on year respectively. At end-March, the total volume of
outstanding bonds posted 37 trillion yuan, up 19.7 percent year on year.
Table 8 Bond Issuances in Q1 2015
Type of bond Issuances (100
million yuan)
Year-on-year growth (100
million yuan)
Government securities①
2,099 -41
Central bank bills 0 0
Financial bonds②
17,130 8,198
Of which: Financial bonds issued by the China
Development Bank and policy financial bonds 7,111 481
Corporate debenture bonds③
7,138 6,790
Of which: Debt-financing instruments of
non-financial enterprises 10,382 1,907
Enterprise bonds 867 -838
Corporate bonds 209 40
Total 30,766 9,271
Notes: ①Including municipal bonds issued by the Ministry of Finance on behalf of local
governments.
②Including financial bonds issued by the China Development Bank, policy financial bonds,
ordinary bonds issued by commercial banks, subordinated bonds issued by commercial banks,
hybrid bonds issued by commercial banks, bonds issued by securities firms, and so forth.
③Including debt-financing instruments issued by non-financial enterprises, enterprise bonds,
corporate bonds, convertible bonds, bonds with detachable warrants, privately placed SME bonds,
and so forth.
Sources: People’s Bank of China, National Development and Reform Commission, China
Securities Regulatory Commission, and China Government Securities Depository Trust and
Clearing Co., Ltd.
The coupon rates of government securities remained unchanged, while the coupon
rates of financial bonds and corporate debenture bonds declined compared with those
at end-2014. In Q1, the coupon rate of 10-year government securities was 3.77
percent, on a par with that issued in December 2014. The coupon rate of 10-year
financial bonds issued by the China Development Bank was 4.3 percent, down 0.07
percentage points from that of the same maturity issued in December 2014. The
coupon rates of corporate debenture bonds declined. The average coupon rate of
short-term financing bills (rated A-1) issued by AAA-rated enterprises was 4.96
percent, down 0.34 basis points from end-2014; the average coupon rate of 7-year

36
corporate bonds was 5.5 percent, down 0.5 percentage point from end-2014. The
Shibor played an increasingly significant role in bond pricing. In Q1, nine
floating-rate bonds were issued based on the Shibor, with a gross issuance volume of
27 billion yuan; 85 fixed-rate enterprise bonds were issued based on the Shibor, with a
gross issuance volume of 87.1 billion yuan; and a total of 171.6 billion yuan of
fixed-rate short-term financing bills was issued based on the Shibor, accounting for 95
percent of all fixed-rate short-term financing bills.
3. The volume of bill financing increased steadily and interest rates declined
The bill acceptance business increased slightly. In Q1 2015, commercial bills issued
by enterprises totaled 5.4 trillion yuan, down 4.8 percent year on year; outstanding
commercial bills posted 10.2 trillion yuan at end of Q1, up 7.2 percent year on year.
At end-March 2015, the balance of bill acceptances increased 295.8 billion yuan from
the beginning of 2015, with decelerated growth year on year. In terms of the
industries of the issuing enterprises, outstanding bankers’ acceptances were mainly
issued by enterprises in the manufacturing, wholesale, and retail industries, with
small- and medium-sized enterprises issuing about two-thirds of the total. The steady
growth in bill acceptances has effectively enhanced financing support to the real
sector, in particular to small- and medium-sized enterprises.
The outstanding balance of bill financing increased rapidly and interest rates on the
bill market showed a downward trend. In Q1, commercial bills discounted by
financial institutions totaled 19.2 trillion yuan, up 77.6 percent year on year; the
outstanding balance of bill discounts stood at 3.1 trillion yuan, up 63.3 percent year
on year. At end-March, the outstanding amount of bill financing increased by 164.3
billion yuan from that at the beginning of 2015, with growth during every month; the
share of outstanding bill financing in the total outstanding loans was 3.6 percent, up
1.1 percentage point year on year. In Q1, as overall liquidity in the banking system
was appropriate, interest rates on the bill market showed a downward trend with fairly
balanced supply and demand.
4. Both the stock indices and equity financing increased notably
The stock indices continued to rally. At end-March, the Shanghai Stock Exchange
Composite Index and the Shenzhen Stock Exchange Component Index closed at 3,748
points and 13,161 points, up 15.9 percent and 19.5 percent respectively from the end
of 2014. The Growth Enterprise Board (GEB) Index (Chinext Price Index) closed at
2,335 points, up 58.7 percent from the end of 2014. The weighted average P/E ratio of
the A-share market on the Shanghai Stock Exchange rose from 16.0 times at end-2014
to 19 times at end-March, while during the same period that of the Shenzhen Stock
Exchange rose from 35.0 times to 46 times.

37
Turnover on the stock markets surged. In Q1, turnover on the Shanghai and Shenzhen
Stock Exchanges totaled 41 trillion yuan, up 238.7 percent year on year, and the daily
turnover averaged 735.4 billion yuan, up 250 percent year on year. Turnover on the
GEM Board totaled 3.8 trillion yuan, up 97.3 percent year on year. At end-2014, the
combined market capitalization of the Shanghai and Shenzhen Exchanges posted 39.3
trillion yuan, up 101.2 percent year on year; the market capitalization of the GEM
Board posted 2.2 trillion yuan, up 141.1 percent year on year.
The amount of equity financing increased rapidly. In Q1, a total of 196.9 billion yuan
was raised by enterprises and financial institutions by way of IPOs, additional
offerings, rights issuances, and warrant exercises, representing an increase of 196.9
billion yuan year on year.
5. Assets in the insurance industry grew rapidly
In Q1, total premium income in the insurance industry amounted to 842.5 billion yuan,
representing year-on-year growth of 20.4 percent and a deceleration of 15.5
percentage points over the last year; total claim and benefit payments amounted to
231.1 billion yuan, representing year-on-year growth of 24.3 percent. Specifically,
total claim and benefit payments in the property-insurance sector increased 9.7
percent, while those in the life-insurance sector increased 36.3 percent.
The growth of insurance assets accelerated. At end-March, total assets in the
insurance industry posted 10.9 trillion yuan, representing year-on-year growth of 21.5
percent and an acceleration of 4.8 percentage points year on year. Among this total,
bank deposits increased 5.4 percent year on year, while investment-linked assets
increased 26.9 percent.
Table 9 Use of Insurance Funds, End-
March 2015
Outstanding balance (100
million yuan) As a share of total assets (%)
End-March
2015
End-March
2014 End-March 2015 End-March 2014
Total assets 108,703 89,459 100 100
Of which: Bank deposits 26,386 25,031 24.2 28.0
Investments 72,555 57,197 66.7 63.9
Source: China Insurance Regulatory Commission.

38
6. Swap and forward transactions on the foreign-exchange market increased
rapidly
In Q1, the turnover of spot RMB/foreign-exchange transactions totaled USD1.2
trillion, up 4.6 percent year on year. The turnover of RMB/foreign-exchange swap
transactions totaled USD1.3 trillion, up 26.2 percent year on year, among which
overnight RMB/USD swap transactions posted USD676.1 billion, accounting for 52.6
percent. The turnover on the RMB/foreign-exchange forward market totaled USD8.5
billion, down 37.1 percent year on year. In Q1, the turnover of foreign currency pair
transactions amounted to USD19.3 billion, up 24.2 percent year on year. In particular,
EUR/USD transactions accounted for the lion’s share, or 40.9 percent, of the total.
The number of participants on the foreign-exchange market increased further. At end-
March, there were 474 members on the foreign-exchange spot market, 104 members
on the foreign-exchange forward market, 103 members on the foreign-exchange swap
market, 90 members on the currency swap market, and 45 members on the foreign-
exchange options market. In addition, there were 30 market-makers on the spot
market and 27 market-makers on the forward and swap markets.
7. Turnover on the gold market surged
The price of gold rallied before declining, but the decline moderated. In Q1, the price
of gold on the international market peaked at USD1,295.75 per ounce and reached a
trough of USD1,147.25 per ounce, closing at USD1,187.00 per ounce at end-March,
representing an increase of USD2.75 per ounce, or 0.23 percent, from the beginning
of this year. The peak price of gold (AU9999) on the Shanghai Gold Exchange was
265.00 yuan per gram, and the lowest price was 230.00 yuan per gram. At end-March,
the price of gold closed at 235.55 yuan per gram, representing a decline of 5.04 yuan
per gram, or 2.09 percent, from the beginning of the year. The differential between
domestic and international gold prices remained stable, averaging 0.89 yuan per gram.
The volume of transactions on the Shanghai Gold Exchange surged. In Q1, the trading
volume of gold was 7,788.4 tons, an increase of 128.9 percent year on year, and the
turnover posted 1.9 trillion yuan, an increase of 118.9 percent year on year. The
trading volume of silver was 200,300 tons, an increase of 116.9 percent year on year,
and the turnover posted 0.7 trillion yuan, up 86.7 percent year on year. The trading
volume of platinum was 12.9 tons, a decline of 35.5 percent year on year, and the
turnover posted 3.25 billion yuan, down 44.9 percent year on year.
II. Institutional building in the financial markets
1. A wider range of participants were given access to regulate the development of

39
the bond market
Rules were released to support the sound development of the bond market. On
January 16, the China Securities Regulatory Commission released the Administrative
Rules on the Issuance and Trading of Corporate Bonds to give access to a wider range
of participants, diversify the modes of issuance and the trading venues, simplify the
issuance approval procedures, strengthen market regulation and protection of the
rights and interests of bond holders, and enhance the bond market’s capacity to
service the real economy.
Insurance companies were allowed to issue supplemental capital bonds on the
inter-bank market. On January 22, the PBC and the China Insurance Regulatory
Commission jointly released a notice allowing insurance companies to issue
supplemental capital bonds on the inter-bank market. This measure will help
broaden the capital channels for insurance firms and enhance their solvency and risk
resilience, broaden the issuer base, and diversify the products on the inter-bank bond
market.
2. A pilot stock option trading program was launched and the Shanghai–Hong
Kong Stock Connect program made further progress.
A pilot stock option trading program was launched. On January 9, the China
Securities Regulatory Commission approved the Shanghai Stock Exchange’s plan for
pilot option trading on the SSE 50ETF and released the Administrative Rules on Stock
Option Trading Pilot Programs to provide the rules for the trading bourse, the
settlement institutions, qualifications, investor protection, and risk control measures.
The launch of the pilot program will help improve the risk management and price
discovery mechanism of the capital market, and will promote the steady and sound
development of the capital market.
The Shanghai–Hong Kong Stock Connect program has made steady progress. On
March 27, the China Securities Regulatory Commission released the Guidelines on
Participation of Publicly Offered Securities Investment Funds in the Shanghai–Hong
Kong Stock Connect Program to provide specific requirements on the qualifications,
procedures, and information disclosure, risk management, and internal control
practices. Participation of publicly offered securities investment funds in the
Shanghai–Hong Kong Stock Connect Program will facilitate product and business
innovation and will promote the Stock Connect business as well as connectivity in the
two financial markets.
3. Reform of the insurance market was gradually furthered
The Solvency II Rules were promulgated for a transitional period. In February, the
China Insurance Regulatory Commission released seventeen regulatory rules for
China’s Risk-Oriented Solvency System (Solvency II), and implementation of these

40
rules have entered a transitional stage. The Solvency II has a three-pillar framework,
the first pillar being quantitative regulatory requirements, including capital
classifications, asset liability assessments, minimum capital calculations, and stress
testing; the second pillar being qualitative regulatory requirements, i.e., establishing a
comprehensive risk classification system to cover the risks that are not measured by
quantitative indicators and to assess the solvency capacity of an insurance firm; the
third pillar being a market discipline mechanism, i.e., through information disclosures
and credit ratings of insurance firms to exercise market discipline. During the
transitional period, the insurance firms will report on solvency based on both
Solvency I and II, with Solvency I continuing to serve as the regulatory criteria.
The market-based premium rate reform continued. With the approval of the State
Council, in February the China Insurance Regulatory Commission began a reform of
the universal life insurance premium rate, in which insurance companies will
determine the minimum guaranteed interest rates in accordance with the features and
risks of the products. The minimum guaranteed interest-rate limit of 2.5 percent was
no longer valid, and the reserve assessment interest-rate ceiling was raised from 2.5
percent to 3.5 percent and reserve and solvency regulation were strengthened. Also in
February, the China Insurance Regulatory Commission released the Opinions on
Deepening the Reform of Commercial Auto Insurance Provisions and the Rate
Regulatory Regime, authorizing the China Insurance Association to regularly release
the automobile insurance risk premium base schedule for insurance companies to
determine the premium rate adjustment standards in view of their own conditions,
with the ultimate goal of forming a highly market-based rate pricing mechanism. In
March, the China Insurance Regulatory Commission released a pilot commercial
automobile insurance premium rate reform program. The pilot areas included
Heilongjiang, Shandong, Guangxi, Chongqing, Shaanxi, and Qingdao.
The scope of overseas investments by insurance funds was broadened. In March, the
China Insurance Regulatory Commission issued the Notice on the Adjustment of
Policies Related to Overseas Investments by Insurance Funds to enlarge the list of
destinations for entrusted overseas investments by insurance asset-management
institutions, with funds from within their own groups from Hong Kong, only to 45
countries and regions, to adjust the credit rating requirements for fixed-income
products from above BBB to above BBB-, and to include, in addition to the main
board in Hong Kong, the Hong Kong Growth Enterprise Board as a market for
investments.
4. Promoting the sound development of the foreign-exchange market
Business innovation was promoted in the foreign-exchange market. Franchised
currency exchange businesses for retail customers were regulated. Standard
foreign-exchange swaps were launched on the inter-bank foreign-exchange market to
diversify the trading of derivatives. Market access management was enhanced over
the franchised currency-exchange business for retail customers and the agency foreign
41
currency-exchange business through stricter reviews of the qualifications in order to
prevent operational risks and to maintain market order.
Part 4 Macro-economic Analysis
I. Global economic and financial developments
In the first quarter of 2015, the global economic situation was complex and in general
growth was stabilized. Affected by the cold weather and other factors, the growth
rate of the U.S. economy slowed down and long-term employment conditions in the
country remain to be observed. The euro area showed signs of recovery, yet the basis
needs to be strengthened. Japan’s economy has returned to positive growth and the
growth of consumer prices in the country has moderated. The growth rates in several
emerging market economies declined, and their financial markets experienced large
fluctuations.
1. Developments in the major economies
The recovery momentum continued in the U.S., but the growth rate slowed down due
to factors such as the cold weather, the export strike on the West Coast, and so forth.
Real GDP increased by only 0.2 percent quarter on quarter (annualized) in the first
quarter. Though growth of investment, consumption, and industrial output all declined,
the Michigan Consumer Sentiment Index and the Sentix Investor Confidence Index
remained high. Due to the impact of the severe weather and the appreciation of the
dollar, U.S. exports declined 7.2 percent year on year in the first quarter, the first
quarterly decline since Q1 2014. Due to the fall in oil prices, inflation faced relatively
large downward pressures. The labor market in general was stable, and in February
the unemployment rate fell to 5.5 percent, the lowest rate in the recent 7 years.
However, the rate of labor force participation remained historically low, and in March
the number of employees newly enrolled in non-agricultural sectors declined
significantly due to the severe weather and other factors. Long-term employment
conditions remain to be observed. In March, the Fed lowered its forecast for U.S.
GDP growth rate in 2015 to 2.3–2.7 percent.
The euro area showed signs of recovery, yet the basis of the recovery needs to be
strengthened. Benefiting from the stimulus policies by the European Central Bank
(ECB) and the weakening of the euro, the downward risks in the euro area were
mitigated. The manufacturing industry showed expansionary dynamics while
consumer and corporate confidence improved. The Purchase Management Index (PMI)
rose to 52.2 in March, the highest level since June 2014. The Harmonized Index of
Consumer Prices (HICP) was -0.1 percent, but the decline narrowed. The labor
market improved modestly, and in January the unemployment rate in the euro area fell
to 11.3 percent, the lowest level since June 2012. In March, the ECB raised its

42
projection for GDP growth in the euro area in 2015 to 1.5 percent. However,
differences among the various countries were obvious. Except for Germany, the level
of industrial output in the major economies was still much lower than that before the
crisis, and the structural reforms still require further progress.
Table 10 Macro-economic and Financial Indices in the Major Economies
Cou
ntry Index
2014Q1 2014Q2 2014Q3 2014 Q4 2015Q1
Jan. Feb. Mar. Apr. May. Jun. Jul. Aug. Sep. Oct. Nov. Dec. Jan. Feb. Mar.
Un
ited S
tates
Real GDP Growth Rate
(annualized quarterly
rate, %)
-2.1 4.6 3.9 2.2 0.2(初值)
Unemployment Rate (%) 6.6 6.7 6.7 6.3 6.3 6.1 6.2 6.1 5.9 5.8 5.8 5.6 5.7 5.5 5.5
CPI (YOY, %) 1.6 1.1 1.5 2 2.1 2.1 2 1.7 1.7 1.7 1.3 0.8 -0.1 0.0 -0.1
DJ Industrial Average
(closing number) 15699 16322 16458 16581 16717 16852 16563 17098 17043 17391 17828 17983 17165 18133 17776
Eu
ro A
rea
Real GDP Growth Rate
(annualized quarterly
rate, %)
1.3 0.3 0.6 0.9 …
Unemployment Rate (%) 11.9 11.8 11.7 11.7 11.6 11.6 11.6 11.6 11.5 11.5 11.5 11.4 11.3 11.3 11.3
HICP (YOY, %) 0.8 0.7 0.5 0.7 0.5 0.5 0.4 0.4 0.3 0.4 0.3 -0.2 -0.6 -0.3 -0.1
EURO STOXX 50
(closing number) 2853 2968 2916 2978 3033 3228 3115 3044 3067 2998 3076 3004 3198 3401 3435
Japan
Real GDP Growth Rate
(annualized quarterly
rate, %)
5.8 -6.7 -1.9 2.2 …
Unemployment Rate (%) 3.7 3.6 3.6 3.6 3.6 3.7 3.7 3.5 3.6 3.5 3.5 3.4 3.6 3.5 3.4
Core CPI (YOY, %) 1.4 1.5 1.6 3.4 3.7 3.6 3.4 3.3 3.2 2.9 2.4 2.4 2.4 2.2 2.3
NIKKEI225 (closing
number) 14915 14841 14828 14304 14632 15162 15621 15425 16174 16414 17460 17451 17674 18847 19207
Sources: Statistical Bureaus and Central Banks of the Relevant Economies.
Japan’s economy returned to positive growth and the growth of consumer prices
slowed down. Since the last quarter of 2014, Japan’s GDP growth rate returned to a
positive trend. The foreign trade situation improved somewhat, and the rate of
expansion of industrial production increased. With better corporate profits, enterprises
invested slightly more in fixed assets. But the downward trend in household
expenditures and retail sales indicated that consumer confidence remained weak. In
addition, inflation in Japan faced downward pressures, with CPI growth declining due
to the shrinking domestic demand as a result of the consumption tax hike and the
falling oil prices.
Growth in the emerging market economies generally slowed down, with several
financial markets experiencing volatile fluctuations. Constrained by long-term
structural problems, such as a single product economic structure, lack of depth in
financial markets, and increasing debt levels, growth momentum in the emerging
market economies weakened. Some major oil-exporting countries continued to face

43
moderated growth due to the large decline in international oil prices. With
uncertainties in the Fed interest-rate hike and intensified geopolitical conflicts,
risk-aversion sentiment built up and some emerging market economies experienced
financial market volatility and a large currency depreciation, especially the Brazilian
real and the Turkish lira.
2. Developments in global financial markets
In the first quarter, overall financial market conditions were positive in the advanced
economies. The US dollar strengthened against other currencies, and the stock
markets in Europe and Japan rallied substantially due to the impact of the QE policies.
The financial markets in the emerging market economies faced increasing
fluctuations.
The USD continued to appreciate against other currencies of the major advanced and
emerging economies. On March 31, the exchange rate of the USD/EUR closed at
1.0730 dollar per euro, a depreciation of 11.3 percent from the end of 2014. The
exchange rate of the GBP/USD and the JPY/USD closed at 1.4816 dollar per pound
and 120.12 yen per dollar respectively, representing a depreciation of 4.9 percent and
0.4 percent respectively from the end of 2014. At the same time, most of the emerging
market currencies weakened. Among them, the Brazilian real and the Turkish lira
depreciated against the USD by 16.8 and 10.1 percent respectively.
The USD Libor rose slightly in the London Inter-bank Market while the Euribor went
in the opposite direction. Due to the stronger economy in the U.S. and enhanced
expectations of an interest-rate hike by the Fed, the USD Libor rose slightly since the
start of the year. At the end of March, the 1-year dollar Libor posted 0.6924 percent,
an increase of 6.5 basis points from the beginning of the year; the 1-year Euribor
registered 0.198 percent, a decrease of 12.7 basis points from the beginning of 2015.
The yield of government securities dropped in the U.S. and Germany, but increased
slightly in Japan, and fluctuated in the emerging market economies. At the end of
March, the yield of 10-year government bonds closed at 1.934 percent, 0.400 percent,
and 0.185 percent respectively in the U.S., Germany, and Japan, down by 24, 7, and
36 basis points respectively from the end of last year. Movement in the yield of
10-year government bonds was mixed and there was diverse volatility in the emerging
market economies. Specifically, the yield of 10-year government bonds in Russia fell
by 197 basis points while that in Brazil rose by 63 basis points.
The stock indices surged in Europe and Japan, while the stock indices fluctuated
wildly in the emerging market economies. On March 31, the Dow Jones Industrial
Average Index, the euro area STOXX50 Index, and the Nikkei 225 Index closed at
17776, 3435, and 19207 points respectively, down by 0.3 percent, up by 14.3 percent,

44
and 10.1 percent respectively from end-2014. The stock markets in most of the
emerging market economies rallied, but with large volatility. The major stock indices
in India, Indonesia, and Johannesburg were up by 1.7 percent, 5.6 percent, and 4.7
percent.
3. Monetary policies in the major economies
The timing of the hike in the federal funds rate by the Fed is not clear and the ECB
has enhanced its easing polices. On March 18, after its regular meeting the Federal
Open Market Committee (FOMC) announced that it would make an effort to adjust
forward guidance. Deleting the expression that "it can be patient in the beginning to
normalize the stance of monetary policy" in its announcement, the FOMC stressed
that “the current 0 to 1/4 percent target range for the federal funds rate remains
appropriate," and it expressed the view that the decision on how long to maintain this
target range will be made by assessing "progress both realized and expected toward
the objectives of maximum employment and 2 percent inflation."
The Bank of England (BOE) maintained the Bank Rate at 0.5 percent and the scale of
asset purchases at GPB375 billion. The Bank of Japan (BOJ) promised to inject 80
trillion yen per year to base money, and to continue its quantitative and qualitative
monetary easing policy until the inflation rate remains at 2 percent.
Meanwhile, the European Central Bank (ECB) started to implement a purchase plan
for public-sector securities, and several small and medium advanced economies began
to ease their monetary policies. Since the beginning of this year, the ECB has not
changed the main refinancing operations (MROs), the marginal lending facility, and
the deposit facility rates.
On March 9, 2015, it started to implement an asset-purchase program to include
bonds issued by the public sector. The combined monthly purchases of public- and
private-sector securities will amount to €60 billion. On January 15, the Swiss National
Bank announced that it would forgo the upper limit of the SRF/EUR at 1.2 franc per
euro. It also lowered the current deposit interest rate to negative 0.75 percent, and on
April 22 it largely reduced the number of institutions that could exempt deposit
accounts with a negative rate. The Danmarks Nationalbank lowered the deposit rate
four times by a total of 70 basis points to negative 0.75 percent. The Riksbank
expanded the asset-purchase plan and lowered the policy rate on two occasions to
negative 0.25 percent. On January 21 the Bank of Canada lowered the benchmark
policy by 25 basis points to 0.75 percent. On February 3 and May 5 respectively, the
Reserve Bank of Australia lowered the benchmark rate twice by a total of 50 basis
points to 2 percent,
More emerging market economies relaxed their monetary policies in order to boost
economic growth. The Reserve Bank of India lowered its repo rate on two occasions,

45
in January and March, by a total of 50 basis points to 7.5 percent. The Central Bank of
the Republic of Turkey lowered the benchmark repo rate on two occasions, in January
and February, by a total of 75 basis points to 7.5 percent. The Central Bank of Russia
lowered its benchmark rate on three occasions, in February, March, and May, by a
total of 450 basis points to 12.5 percent. The Central Bank of Indonesia lowered the
policy rate in February by 25 basis points to 7.5 percent. The Bank of Korea lowered
its benchmark rate in March by 25 basis points to 1.75 percent. However, some other
emerging countries tightened their monetary stance in response to inflationary
pressures and currency depreciation pressures. The Central Bank of Brazil increased
the benchmark interest rate on two occasions, in January and March, by a total
amount of 50 basis points to reach 12.75 percent. The National Bank of Ukraine
raised its policy rate on two occasions, in February and March, by a total of 1600
basis points to reach 30 percent.
Box 3 The ECB Launches a Large-Scale QE Policy
On January 22, 2015, the ECB held its first Governing Council meeting with 19
member countries since Lithuania joined the European Central Bank. During the
meeting, the ECB decided to launch a quantitative easing policy. It also decided to
further expand the size of its asset-purchase plan to purchase 60 billion euro of assets
from March through September 2016, or until the medium-term inflation rate
approaches 2 percent. It is expected that total assets of 1.1 trillion euros will be
purchased. Second, the coverage of the asset-purchase plan will be expanded to
include, in addition to asset-backed securities and covered bonds (with a combined
monthly purchase volume of 11 billion euro), investment-grade government agency
bonds of member countries and bonds issued by recognized agencies, international
organizations, and multilateral development banks located in the euro area (with a
combined purchase value of 49 billion euro every month). Third, the ECB and the
national central banks will participate in the asset purchases. The share of the ECB is
8 percent in the increment of the public-sector purchase program, including 12
percent of bonds issued by European institutions and 80 percent of bonds issued by
government agencies of member countries (to be allocated based on the shareholding
of the national central banks in the ECB). Fourth, the ECB and the national central
banks will share the risks in the purchased assets. The ECB and the national central
banks will share the risks of 8 percent of the assets (i.e., bonds issued by government
agencies) purchased and held by the ECB and 12 percent of the assets (bonds issued
by agencies located in the euro area) purchased and held by the national central banks.
The risks of the remaining purchased assets are to be borne by the national central
banks that have made the purchases. On March 5, 2015, the ECB released the details
of its QE policy and began to implement the program on March 9.
Since the launch of the QE policy, the economic and financial situations have
improved in the euro area. The yields of government securities of various maturities
in most countries in the euro area have declined further, and the prices of stocks and
other assets have climbed. Second, the financing costs and loan interest rates of

46
commercial banks have decreased and credit conditions have relaxed. Third, inflation
expectations have bottomed out and the decline in the HICP has narrowed. Fourth,
there have been early signs of recovery in the euro area, with consumer and business
confidence generally rising.
The ECB’s QE policy has spillover effects on the rest of the world. Before the ECB’s
formal announcement of the QE, Switzerland moved to abandon the cap on the value
of the Swiss franc against the euro. The central banks of Denmark, Canada, Egypt,
Turkey, Peru, and India cut interest rates to respond to potential shocks.
At present, countries in the euro area are debating between austerity or reform and
growth as a priority, and observing the long-term effects of the QE. The
competitiveness of the euro members is varied, and ultimately, the key to recovery
will consist of structural adjustments and reform. In addition, the opinion of some
observers is that although risk sharing will help reduce the risks of the ECB and
strengthen the responsibility of member countries, it might also reduce the appeal of
sovereign bonds to market participants in crisis countries and reduce the credibility
and effects of the ECB’s QE policy.
4. The global economic outlook and major challenges
In its World Economic Outlook released in April 2015, the International Monetary
Fund (IMF) maintained its projection of global growth in 2015 at 3.5 percent, which
was an increase of 0.2 percentage point from the previous year. Projections for growth
in the U.S. were revised downward by 0.3 percentage point to 3.3 percent; projections
for growth in the euro zone and Japan were both revised upward by 0.2 percentage
and 0.4 percentage point to 1.4 percent and 1.0 percent respectively; projections of
growth in the emerging market and developing economies were maintained at 4.3
percent in 2015. Overall, the global economy and CPI movements are expected to be
more stable than previously, but capital flows still will face uncertainties.
First, prospects for the advanced economies have improved to some extent, whereas
structural reforms have yet to be furthered. Affected by seasonal factors, U.S.
economic growth and employment data slowed down in the first quarter, while
consumer and investor confidence remained stable. The credit situation in the euro
area improved with the M3 growth rate accelerating and credit growth stabilizing in
the private sector. Financing costs and loan interest rates of banks have declined, and
the transmission of monetary policy has improved, which could help to bring about an
economic recovery. However, there are still structural obstacles to the recovery
process and ultimately the growth performance of the various economies still hinges
on the future progress of the structural reforms.
Second, commodity prices are at low levels but are generally stable, contributing to

47
the easing of global deflationary pressures. Influenced by supply factors such as
potential shale gas production cuts, the geopolitical incidents in Yemen, and market
expectations of the timing of the Fed rate hike, the downward pressures on
commodity prices have been mitigated, easing global deflationary pressures.
Third, there are uncertainties in the timing of the Fed rate hike and in cross-border
capital flows. Due to lower readings of U.S. economic indicators, market participants
are expecting a later timing of the Fed rate hike. Global capital flows are still facing
uncertainties, as a result of mixed factors, including the ongoing monetary-policy
normalization of the Fed, uncertainties in the timing of the Fed rate hike, trends in the
US dollar index, and the adjustments of monetary policies in other economies.
Box 4 Communications and Expectation Managements by the Central Banks
After the outbreak of the global financial crisis, some unconventional
monetary-policy tools gradually became known to the public, including forward
guidance. Forward guidance is a new word but the economic thinking behind it has a
long history. Related to it are two concepts that have far-reaching implications, i.e.,
expectations and central bank communications. In the recent two decades, with the
increased understanding of expectation management, growing independence, and
accountability of the central banks, the veils covering the central banks have been
gradually removed, and communications have increasingly become an important
monetary-policy instrument.
Developments in theory and practice have improved an understanding of the
importance of central bank communications and expectations guidance. Academic
studies on central bank transparency and communications began in the mid-1990s.
Against the backdrop of the complex monetary conditions, the sophistication of
financial assets, and the expansion of money and financial assets, stable expectations
are playing an increasingly important role in monetary-policy conduct. In 1996, Alan
Blinder wrote that increased communications would help enhance the effects of
central bank policy. In 2001, Michael Woodford wrote that the essence of monetary
policy was to manage expectations. In Interest and Prices: Foundations of a Theory of
Monetary Policy published in 2003, he pointed out that the effectiveness of monetary
policy hinges on not only the level of the current policy interest rate, but also on the
ability to influence market expectations of the future path of policy rates. If market
participants have more knowledge about the monetary-policy intentions and the
possible path of future policy, their behavior may move in the direction anticipated by
the monetary-policy adjustments, thereby enhancing the effects of the policy
adjustments. This means that monetary-policy conduct in modern times not only
depends on monetary-policy operations but also on guiding expectations. There is
some literature that studies expectation management and communications from the
perspective of learning. The point is that due to developments in the economic
environment and policy rules, public expectations may not be entirely rational;
48
furthermore, due to informational asymmetries between the central bank and the
public, it is necessary for the central bank to bridge the gap through communications
and to help the public understand its intentions so that the intended policy effects can
be secured.
As a result of the above-mentioned theoretical and empirical developments, the
central banks have continuously improved communications. They started by
disclosing their general objectives and strategy, and then moved to disclose decisions,
including the goals of the interest rated; later on, they communicated the reasons
behind policy decisions and the outlook for the economy. In recent years, given the
zero lower-bound constraints, some central banks have experimented with forward
guidance, i.e., the central banks communicated the expected future path of interest
rates not as a policy commitment, but as a basis to explain the policy responses based
on the expected situation. In general, the evolution of monetary-policy conduct has
focused more on transparency and rules, which represent stronger communication
arrangements. Through effective communications, the central banks are endeavoring
to help the public have reasonable expectations of the policy path in the future and to
adopt economic decisions on such a basis. Communications by the central banks have
gradually developed. Take the Federal Reserve (the Fed) as an example. In the 1980s
and 1990s, the Federal Reserve experimented in providing specific policy goals and
strategies; in 1994, the Fed started to release statements after its regular FOMC
meetings. The early statements disclosed its policy direction. Later on, more
information was released, including the size of the interest-rate adjustments, the
reasons for the decisions, and the risk assessments. In 2012, the Fed introduced
forward guidance. Some empirical studies on the practice of central bank
communications also show that effective communications have an impact on the
financial market, improve the predictability of monetary policy, and thus help the
monetary authorities realize macro-economic goals.
Overall, there is a consensus on the importance of expectation management and
communications in central bank policy. But several open questions require further
study and discussion.
First, what is the proper degree of transparency in communications? Is more
communications better? Take the disclosure of details about decisions as an example.
Though this may enhance transparency and be an incentive to the decision makers, it
may also prompt them to yield to pressures and to follow the majority vote; when
many details are disclosed, due to the complexity and the development of the
economic situation, information disclosures at a later stage may not be consistent with
the previously disclosed information, or the contents disclosed through various
channels may not be consistent, which may harm the credibility of the central bank.
Moreover, too much information may produce noise. As mentioned above,
transparency is related to central bank independence. In general, the greater the
independence, the more transparency that is required; otherwise the consistency of

49
behavior will be undermined.
Second, how can the effectiveness of communications be improved? Many factors,
including the public’s ability to understand and biased media reports may affect the
effectiveness of communications. Also, in some emerging market economies and
developing countries, due to the gap in institutional building, the central banks may
not have an advantage in guiding market expectations. If useful information is not
communicated, market participants will not be able to benefit from such
communications.
Third, is there a best strategy to communicate? Based on the varying situations across
the different countries, different strategies have been adopted in central bank
communications. Until now, best practices have not yet been established. In particular,
there are many debates on forward guidance, a recently emerging instrument of
communication. Also, the establishment of a single-indicator model and a threshold
value for monetary-policy action may be a convenient way to communicate with the
public. But the macro-economic and market situations may change rapidly, and an
overly simplified approach would affect the continuity of monetary policy. In addition,
forward guidance is an experiment in response to the zero lower-bound constraints
and limited room for the use of the traditional monetary policy, thus countries with
different economic environments should be prudent in applying forward guidance to
their own circumstances.
II. Analysis of China’s macro-economic performance
In Q1 2015, the Chinese economy continued to perform within a reasonable range, with
positive developments in structural adjustments. Expansion of consumption was steady and
and growth of online retail sales remained strong. Growth of investments moderated, while
while investments in infrastructure grew quite rapidly. Private enterprises became major
driving forces for exports, and foreign investment in the service sector maintained
relatively rapid growth. The share of tertiary industry expanded further, and new industries,
industries, new business models, and new market players emerged. Enterprises, industries,
and regions that had begun to restructure early performed relatively well. The employment
employment situation was basically stable, and consumer prices went up moderately. A
study of the various economic indicators and their changing relations reveals that the
economy was at a key juncture of shifting momentum from old to new industries.
According to preliminary statistics, China’s GDP registered 14.1 trillion yuan in Q1,
growing at 7.0 percent year on year and 1.3 percent quarter on quarter in comparable terms.
In Q1, the CPI rose 1.2 percent year on year and the surplus in trade in goods posted 755.3
billion yuan.
1. Consumption registered stable growth, while investment growth moderated and
growth of exports and imports slowed down
批注 [G2]: 中文原文为“经济正处在
新旧产业和发展动能转化的接续关
键期”,建议修改为 of restructuring
from old to new industries and
gear-shifting
50
Income and consumption demands of urban and rural residents registered stable growth. In
Q1, per capita disposable income of urban residents stood at 8572 yuan, gaining 8.3 percent
year on year in nominal terms and 7.0 percent in real terms; per capita disposable income of
rural residents was 3279 yuan, rising by 10.0 percent year on year in nominal terms and 8.9
percent in real terms. As indicated by the Q1 Urban Depositors’ Survey conducted by the
People’s Bank of China, the current income sentiment of urban residents registered 50.8
percent, which was 1.6 percentage points higher than that in the previous quarter; the
residents’ consumption sentiment remained stable, with residents willing to consume 18.5
percent, which was 0.2 percentage point lower than that in the previous quarter, and
residents’ sentiment for travel for the next three months was 29 percent, which was 2.9
percentage points higher than that in the previous quarter. In Q1, retail sales totaled 7.1
trillion yuan, representing growth of 10.6 percentage points from the previous quarter in
nominal terms and 10.8 percent in real terms. Growth of retail sales in the rural areas
continued to exceed that in the urban areas, with urban retail sales posting 6.1 trillion yuan,
which was 10.4 percent higher year on year, and rural retail sales registering 1.0 trillion
yuan, which was 11.6 percent higher year on year. Online retail sales maintained a strong
momentum, with the combined value of goods and service sales reaching 760.7 billion
yuan, up 41.3 percent year on year. Further adjustments have been made in the
consumption structure, with rapid sales growth in telecommunications and new-energy
automobiles, and a stable rebound in the consumption of catering services mainly driven by
the general public. In Q1, sales of telecommunications equipment of statistically large
entities went up 38.5 percent year on year, and the consumption of new-energy automobiles
rose 2.8 times; turnover in the catering sector gained 11.3 percent year on year, which was
1.5 percentage points higher than that in the previous year.
Growth of fixed-asset investments slowed down, while infrastructure investments
registered relatively rapid growth. In Q1, fixed-asset investments (excluding those by rural
residents) reached 7.8 trillion yuan, growing by 13.5 percent year on year in nominal terms
and 14.5 percent in real terms. Among this total, private fixed-asset investments accounted
for 65 percent, growing by 0.2 percentage point. Broken down by industries, investments in
the primary, secondary, and tertiary industries grew 32.8 percent, 11.0 percent, and 14.7
percent respectively. In the tertiary industry, infrastructure investments (excluding
investments in the electric power industry) posted 1.3 trillion yuan, growing by 23.1
percent year on year. Broken down by sector, investments in water management, utilities
management, road transportation, and the railway transportation industries grew by 15.8
percent, 23.5 percent, 23.8 percent, and 14.9 percent respectively year on year. Broken
down by regions, year-on-year growth in the eastern, central, and western regions
registered 12.2 percent, 15.9 percent, and 12.6 percent respectively. Investment in on-going
projects and new projects turned for the better, with planned investments for on-going
projects totaling 55.8 trillion yuan, up by 7.0 percent year on year, while planned
investments for new projects rose 6.1 percent to reach 5.8 trillion yuan.
The surplus in trade in goods widened substantially, with the private sector making larger

51
contributions to export growth. In Q1, the export and import of goods totaled 5.54 trillion
yuan, a decline of 6 percent year on year. Specifically, exports grew by 4.9 percent year on
on year to 3.1 trillion yuan, while imports dropped by 17.3 percent to 2.4 trillion yuan,
resulting in a surplus of 755.3 billion yuan. Exports in general trade grew rapidly by 12.2
percent year on year, 7.3 percentage points higher than that of total exports and
contributing 6.2 percentage points to export growth. Private enterprises became the major
driving force for export growth, with exports by private enterprises rising by 12.5 percent,
contributing 102.7 percent of the increment in export growth. Broken down by product
categories, exports of machinery and traditional labor-intensive products registered more
rapid growth, with the growth of some high-end manufacturing products exceeding 20
percent.
Source: General Administration of Customs.
Figure 3 Export and Import Growth and the Trade Balance
Structural changes in foreign direct investments (FDI) were still underway and outbound
direct investments (ODI) registered fairly rapid growth. In Q1, utilized FDI totaled
USD34.88 billion, up 11.3 percent year on year. ODI by domestic non-financial investors
totaled USD 25.79 billion, up 29.6 percent year on year. Foreign investments in the service
sector continued their rapid growth, while foreign investments in the manufacturing
industry declined. In Q1, the service sector utilized USD 21.59 billion of foreign
investments, up 21.4 percent year on year and accounting for 61.9 percent of the national
total, and the manufacturing industry utilized USD 11.22 billion of foreign investments,
down 3.6 percent.
2. Agricultural production remained stable while industrial production declined
In Q1 2015, the value-added of the primary, secondary, and tertiary industries was 777
billion yuan, 6029.2 billion yuan, and 7260.5 billion yuan respectively, growing by 3.2
percent, 6.4 percent, and 7.9 percent year on year, with the growth of the tertiary industries

52
industries exceeding that of the secondary industries. The value-added of the primary,
secondary, and tertiary industries accounted for 5.5 percent, 42.9 percent, and 51.6 percent
percent of GDP respectively, and the share of the tertiary industries was 2.6 percentage
points higher than that during the same period of the previous year and 8.8 percentage
points more than the share of the secondary industries.
Agricultural production remained stable. The survey of production sentiment among more
than 110,000 rural residents indicated that the planned cultivation area for grains, wheat,
corn, and cotton grew by 0.2 percent, 0.7 percent, 1.9 percent, and -11.2 percent
respectively. At present, plant health in the major production areas is in good shape. In Q1,
the combined output of pork, beef, mutton, and poultry declined 1.4 percent year on year to
23.15 million tons, among which the output of pork dropped by 3.1 percent to 15.57 million
tons.
The growth of industrial production declined, with stable performance in the emerging
industries and heightened pressures in the traditional industries. The value-added of
statistically large enterprises, if calculated at comparable prices, grew by 6.4 percent year
on year, which was 2.3 percentage points lower than the growth in the previous year.
Broken down by sectors, the value-added of the high-tech industry, electronics
manufacturing industry, and medical-care industry increased by 11.4 percent, 12 percent,
and 10.6 percent respectively. In Q1, the sales-to-output ratio of statistically large
enterprises reached 97.2 percent, which was 0.1 percentage point higher than that during
the same period of the previous year. The profits of statistically large enterprises declined
2.7 percent year on year to 1.3 trillion yuan, and the profit margins of their main businesses
registered 5.18 percent. Among the 41 industrial categories, 30 earned more profits than
they did in the same period of the previous year. In particular, gross profits in the computer,
telecommunications, and other electronic machinery manufacturing industries rose by 22.9
percent, and those in the electricity and heat production and supply industries went up by
16.4 percent. Constrained by insufficient demand and overcapacity, profits in the steel,
cement, and plate glass industries declined by 36 percent, 67.6 percent, and 26.6 percent
respectively year on year.
3. Consumer prices rose moderately
Growth in consumer prices remained subdued. In Q1 2015, the CPI rose 1.2 percent year on
year, a decline of 0.3 percentage points compared with that in the previous quarter, and
growth from January through March was 0.8 percent, 1.4 percent. and 1.4 percent
respectively. Broken down, the price of food gained 1.9 percent year on year, which was 0.7
percentage point lower than that in the previous quarter, contributing 0.7 percentage point
to CPI growth, and the price of non-food items rose by 0.8 percent year on year, which was
0.2 percentage point lower compared with the previous quarter, contributing 0.5 percentage
point to CPI growth. Meanwhile, the price of consumer goods went up by 0.9 percent year
on year, which was 0.5 percentage point lower than that in the previous quarter, and the
price of services grew 1.9 percent year on year, which was flat with the previous quarter.

53
The decline in producer prices widened. In Q1 2015, the PPI dropped by 4.6 percent year
on year, representing an acceleration of 1.8 percentage points compared with the decline in
the previous quarter, and the decrease from January through March registered 4.3 percent,
4.8 percent, and 4.6 percent respectively. Among this total, the price of consumer goods
edged down by 0.1 percent, which was flat with that in the previous quarter; the price of
capital goods declined by 5.9 percent, which was 2.3 percentage points more than the
decline in Q4 2014, dragging the PPI down by 4.6 percentage points. Producer purchasing
prices decreased by 5.6 percent year on year, accelerating by 2.4 percentage points
compared with the decline in the previous quarter, and the drop in each month of the first
quarter was 5.2 percent, 5.9 percent, and 5.7 percent respectively. The CGPI went down by
5.6 percent year on year, which was 3.6 percentage points more than the decline in the same
period of the last year. The decline in the price of primary goods was more substantial, with
a deeper drop in investment goods than in consumer goods. The price of agricultural capital
goods declined by 0.9 percent year on year, which was more significant than the 0.7 percent
decrease in producer prices of agricultural products.
As a result of the overall slide in commodity prices in international markets, the decrease in
import prices widened significantly. In Q1 2015, the average price of Brent Crude oil
futures on the Intercontinental Exchange plunged by 48.9 percent year on year, and by 28.5
percent quarter on quarter. The average price of copper on the London Metal Exchange
plummeted by 17.4 percent year on year and by 12.2 percent quarter on quarter. From
January through March, import prices fell by 9.6 percent, 9.3 percent, and 10.5 percent
respectively, averaging 9.8 percent, and this was 4.3 percentage points larger than the fall
during the previous quarter. Export prices grew by 0.4 percent, -3.3 percent, and -0.3
percent respectively, averaging 1.1 percent, as compared to a rise of 0.5 percent in the
previous quarter.
The GDP deflator continued to fall. In Q1 2015, the GDP deflator (the ratio of nominal
GDP to real GDP) was -1.1 percent, down by 1.6 percentage points from the same period of
the last year and by 1.9 percentage points compared with the year 2014.
The price reform continued. On January 21, the National Development and Reform
Commission (NDRC) issued a joint notice with other relevant authorities, stipulating that
there should be a charging standard for polluted water processing and adjusted in a
reasonable way by following the principle of “polluters pay, fair burden-sharing, full cost
coverage, and reasonable profitability,” and by taking into consideration all relevant factors,
factors, including local water pollution prevention, management realities, and affordability.
affordability. On January 29, the NDRC issued a notice on the adjustment of the price of
railway cargo transportation and the establishment of a floating price mechanism. On
February 26, the NDRC issued a notice to streamline the pricing mechanism of natural gas
gas for the non-household sector by consolidating the prices of stocks and the increment in
in natural gas, and launching a pilot program whereby administration of the price for users
users having direct access to gas supplies was lifted, while the pricing mechanism for

54
ordinary residents remained unchanged. On April 8, the Executive Meeting of the State
Council decided that the grid price of coal-fired electricity and the price of electricity for
commercial and industrial use would be adjusted downward so as to lower corporate costs,
stabilize market expectations, promote economic growth, and facilitate structural
adjustments.
4. Fiscal revenue and expenditures maintained subdued growth
In Q1 2015 fiscal revenue rose 2.4 percent in comparable terms5 to 3.6 trillion yuan,
decelerating by 6.9 percentage points year on year. Fiscal expenditures reached 3.3 trillion
trillion yuan, up 6.9 percent year on year in comparable terms, a deceleration of 5.7
percentage points year on year. Fiscal revenue exceeded expenditures by 359.2 billion yuan,
yuan, a decline of 100.14 billion yuan year on year.
In terms of the structure of fiscal revenue, non-tax revenue rose 8.8 percent in comparable
terms year on year to 584.4 billion yuan, and tax revenue went up 1.2 percent year on year
to 3.1 trillion yuan. Among this total, the domestic value-added tax, consumption tax, and
turnover tax went up by 1.9 percent, 9.2 percent, and 4.6 percent respectively year on year,
while the value-added tax and consumption tax of imported goods declined by 13.0 percent
year on year, and the corporate income tax and personal income tax gained 7.7 percent and
12.8 percent year on year respectively. In terms of the structure of fiscal expenditures,
outlays for transportation, environmental protection, and health care and birth control rose
fairly rapidly, by 43.3 percent, 26.4 percent, and 13.3 percent respectively.
5. The employment situation was generally stable
In Q1 2015, total new employment nationwide was 3.24 million, which was 0.2 million less
less year on year. By end-March 2015, the urban registered unemployment rate stood at
4.05 percent, a slight decline year on year and quarter on quarter. In Q1, a statistical
analysis by the China Human Resources Market Information Monitoring Center indicated
that market demand exceeded market supply, and the ratio of job seekers to job vacancies
was 1.12, an increase of 0.01 year on year and a decline of 0.03 quarter on quarter. Broken
Broken down by industry, demand for labor in sectors such as manufacturing, wholesale
and retail, accommodations and the catering industry, household services and other
services registered substantial declines year on year while growing significantly quarter on
on quarter. In terms of job seekers, there were fewer job seekers year on year among young
young people who were unemployed upon entering the labor market, unemployed who
formerly were employed, migrants from other provinces, local rural residents, and so forth.
forth. Broken down by professional or technical qualifications, demand for labor with
beginning and intermediate professional levels declined year on year, that for senior
engineers increased slightly, and the demand gap for senior engineers, technicians, senior
5The Ministry of Finance adjusted the statistical standards for fiscal revenue and expenditures by moving 11 items
of government funds into the category of the general public budget. “Comparable terms” here refer to comparable
growth calculated after the adjustment of the base in the previous year, which is consistent with the statistical
standard of the draft budget in 2015. Growth of other items refers to growth in the absolute value of revenue and
expenditures in 2015, as compared with the same period of the previous year.

55
technicians, and senior workers was large.
6. International payments and expenditures were generally balanced
In 2014 the current account surplus registered USD 219.7, accounting for 2.1 percent as a
share of GDP during the same period, which was within the internationally acknowledged
reasonable range. The capital and financial account surplus stood at USD 38.2 billion,
plunging by 89 percent compared with that in 2013. By end-2014, total reserve assets
increased by USD 117.8 billion to reach USD 3.84 trillion.
The total external debt continued to grow. To further enhance the quality of external debt
statistics and gradually converge with the latest version of international standards, in 2014
China began to disclose its external debt denominated in foreign currencies according to
the Special Data Dissemination Standards of the IMF and included special drawing rights
(SDR) in its external debt statistics. At end-2014, the outstanding value of the external debt
registered USD 895.5 billion, which was a 2.5 percent year-on-year increase in comparable
terms (including the SDR allocation). Among this total, the outstanding value of the
short-term external debt rose 0.4 percent year on year to reach USD 621.1 billion,
accounting for 69.4 percent of the total external debt.
7. Sector analysis
(1) The real-estate sector
In Q1 2015, nationwide turnover of commercial real estate declined year on year while the
decline in Q1 narrowed from that in February and March. Among the major 70 large and
medium-sized cities, more cities reported lower real-estate prices year on year, while fewer
cities reported quarter-on-quarter price declines. The growth of investment in real-estate
development continued to slow down, while the growth in loans in the real-estate sector
rebounded slightly.
The number of cities reporting year-on-year real-estate price declines increased while
fewer cities reported quarter-on-quarter price drops. In March 2015, the price of
newly-built commercial residential housing dropped year on year in all 70 large- and
medium-sized cities, 2 more than in December 2014, and it fell in 50 out of 70 cities quarter
on quarter, 16 less than in December 2014. The price of pre-owned residential housing
declined year on year in 69 cities, 2 more than in December 2014, and dropped quarter on
quarter in 48 cities, 12 less than in December 2014.
The floor area and value of commercial real-estate sales fell year on year, while the decline
decline narrowed compared with that in January and February. In Q1 2015, the nationwide
nationwide floor area of sold commercial real estate posted 183 million square meters,
down 9.2 percent year on year, which was 7.1 percentage points less than the decline in the
the first 2 months of the year and 1.6 percentage points more than the decline in the
previous year. The sales value of commercial real estate declined 9.3 percent year on year
to 1.2 trillion yuan, which was 6.5 percentage points less than the decline during January
and February of 2015, and 3 percentage points more than the decline in 2014. Among this

56
total, the sold floor area and the sales value of commercial residential housing accounted
for 88.1 percent and 83.7 percent of the total sold floor area and the turnover in commercial
commercial real estate respectively.
The growth of investment in real-estate development continued to decline. In Q1 2015,
nationwide investment in real-estate development went up by 8.5 percent year on year to
reach 1.6651 trillion yuan, a deceleration of 2 percentage points compared with the growth
in 2014. In particular, investment in residential housing posted 1.1156 trillion yuan, up 5.9
percent year on year and a deceleration of 3.2 percentage points from 2014, accounting for
67 percent of the total investment in real-estate development. The floor area of newly
started real-estate projects declined 18.4 percent year on year to 240 million square meters,
which was 7.7 percentage points more than the decline in 2014. The floor area of real-estate
projects under construction grew 6.8 percent year on year to 5.84 billion square meters,
representing a deceleration of 2.4 percentage points compared with that in the previous year.
The floor area of completed real-estate projects posted 0.17 billion square meters,
representing a year-on-year decline of 8.2 percent in comparison with year-on-year growth
of 5.9 percent in 2014.
The growth in real-estate loans rebounded slightly. As of end-March 2015, outstanding
real-estate loans of major financial institutions (including foreign-funded financial
institutions) stood at 18.4 trillion yuan, up 19.4 percent year on year, which was 0.5
percentage point more than that at end-2014. Outstanding real-estate loans accounted for
21.4 percent of the total outstanding loans, which was 0.1 percentage point higher than that
at the end of 2014. In particular, outstanding mortgage loans rose 17.9 percent year on year
to 11.2 trillion yuan, an acceleration of 0.3 percentage point from end-2014; outstanding
housing-development loans gained 24.2 percent year on year to 3.5 trillion yuan, a
deceleration of 0.2 percentage point from end-2014; outstanding land-development loans
rose 30.6 percent year on year to 1.5 trillion yuan, an acceleration of 4.9 percentage points
from end-2014. In Q1 2015, new real-estate loans registered 993.5 billion yuan, accounting
for 27 percent of total new loans, which was 0.6 percentage point higher than that during
the same period of the last year.
It was noted in the Report on the Work of the Government for the year 2015 that greater
efforts should be made to renovate the shantytowns in urban areas and the dilapidated
buildings in urban and rural areas by building 7.4 million welfare apartments, among which
5.8 million will be provided for shantytown renovation, an increase of 1.1 million. By
end-March 2015, outstanding loans for welfare-housing development posted 1.3 trillion
yuan, up 64.3 percent year on year, which was 42.1 percentage points higher than the
growth in housing-development loans. In addition, the pilot program of using housing
provident fund loans to support the construction of affordable housing proceeded steadily.
At end-March 2015, 359 welfare-housing projects in 82 cities passed loan approvals and
received 80.2 billion yuan in loan disbursements based on the construction progress, and
33.5 billion yuan of the principal was repaid.

57
(2) New-energy automobile industry
In recent years, in order to mitigate energy consumption and environmental protection
pressures, accelerated efforts have been made to foster and develop the new-energy
automobile industry. After more than a decade of research, development, and pilot
operations, the new-energy automobile industry has developed along a three-pronged
pattern, with pure electric cars, hybrid cars, and fuel battery cars as the major technical
models. Preliminary progress has been made in building a supporting infrastructure and an
intra-city and inter-city charging service network has started to take shape in some cities.
By end-2014, a total of 778 battery-swapping stations had been established, with a total of
31,000 charging posts. In January 2015, the fast charging network for the Beijing-Shanghai
expressway was established.
Driven by policy support and market demand, the new-energy automobile industry in
China achieved leapfrog development, with rapid growth in both production and sales. As
estimated by the China Association of Automobile Manufacturers, a total of 78,000
new-energy automobiles were produced in 2014, among which 75,000 were sold, growing
by 3.5 times and 3.2 times respectively year on year, and with the volume of annual sales
second only to that in the U.S. In Q1 2015, a cumulative total of 25,000 new-energy
automobiles had been produced, growing by 3 times year on year. By end-2014, the total
number of new-energy automobiles owned by Chinese residents exceeded 120,000, which
was second only to the U.S.
Despite its rapid development, the new-energy automobile industry has problems that are
in need of an urgent solution. The key challenge is the gap in basic research and
development. As technological breakthroughs in the production of the entire automobile
and some key parts have yet to be realized, the costs of production and the prices of
new-energy automobiles remain fairly high. Moreover, the supporting system is not yet
fully in place, and mechanisms for the operation and maintenance of the infrastructure is
not well-established. It is imperative that the construction of charging and battery
swapping facilities be accelerated. International experience indicates that favorable
policies, including fiscal subsidies and tax breaks, have greatly promoted the
development of the new-energy automobile industry in various countries. But as the
industry has expanded and become more market-oriented over time, an
incentive-compatible policy mechanism should be designed among the government, the
corporate sector, and consumers. During the next stage, numerous measures should be
taken to promote the healthy development of the new-energy automobile industry. First,
greater efforts should be made to break the bottlenecks in key technologies, so as to
develop technologies, standards, and brand names with indigenous intellectual property
rights. Second, market forces should be combined with government guidance to put in
place an operational mechanism with multiple participants, in particular, to eliminate
departmental and regional fragmentation and to accelerate construction of the supporting
infrastructure, such as charging and battery-swapping stations. Third, a multi-tiered
investment and financing system should be established to provide financial support to the
new-energy automobile industry by attracting greater participation from venture capital

58
and private investments.

59
Part 5 Monetary Policy Stance to be Adopted during
the Next Stage
I. Outlook for the Chinese economy
After the global financial crisis, the world economy has been undergoing a profound
rebalancing, with performance diverging across countries and regions. In general,
economies that underwent rapid market clearing and structural adjustments showed
stronger resilience and recovery. In the context of the global rebalancing, the Chinese
economy is switching gears and undergoing structural adjustments while at the same
time absorbing the effects of the stimulus policy adopted during the previous period.
Evidence indicates that the Chinese economy has entered a “new normal” state, as
reflected in the moderation of the growth rate, the structural adjustments, and the shift
in drivers. The structural adjustments will inject new vitality for medium- and
long-term growth, but the economy will likely face increased downward pressures in
the short term. Therefore, efforts are needed to properly handle relations among
promoting steady growth, making structural adjustments, facilitating reform, and
preventing risks. Although it faces complicated domestic and international conditions,
there are many favorable conditions for China to achieve steady and rapid growth.
First, as a big and resilient economy with a broad market, China has a strong
capability to resist risks and it has much room for maneuver. In terms of the
development of various industries, even though traditional drivers of growth are
slowing down, new businesses and emerging industries are booming. New growth
engines, as represented by the Internet economy, are gathering momentum and
creating new growth points for consumption. In terms of development in the various
regions, the old industrial bases and the resource-based regions are having difficulties
whereas the eastern areas and some of the mid-western provinces are growing steadily
due to their early start of structural adjustments and their swift industrial upgrading.
Second, under the influence of reforms aimed at revitalizing the economy and
measures for structural adjustments, there will be an upsurge in newly registered
enterprises and entrepreneurship, adding to the internal dynamism of economic
development.
With the ongoing land and maritime Silk Road initiative, the coordinated
development in Beijing, Tianjin, and Hebei, and the Yangzi River economic belt
strategies and the launch of a series of infrastructure and key projects, such as
railways, water conservation projects, and shantytown reconstruction, investment, and
growth will be stabilized. Third, macro policies are gradually producing an effect.
Monetary policy is neither too tight nor too loose and it relies more on appropriate
fine-tunings and preemptive adjustments, creating an environment with adequate
60
liquidity, lower market interest rates, and subsequently reducing the costs for social
financing, which is conducive for the financial industry to support the real economy.
By revitalizing the stock of funds in a coordinated manner, fiscal policy will be better
posed to increase support to the real economy. With the combined impacts from the
above-mentioned measures, the national economy is expected to continue to grow
steadily and rapidly.
However, there are still some prominent issues and problems in terms of economic
performance. From a global perspective, under the influence of numerous factors, the
improved external demand has made a limited contribution to exports. During the
global rebalancing, the economic performance and macro policies have been
diverging across countries, leading to increased spillover effects. There will be
substantial uncertainties in the movements of exchange rates of the major currencies
and the cross-border flows of capital. In addition, non-economic factors, such as
geopolitical shocks, will further complicate the environment. From a domestic
perspective, the economy is facing mounting downward pressures and internal
dynamism has yet to be enhanced. With the investment rate already at an elevated
level and stronger constraints from existing debts, government-guided investments,
which used to be a major driver for economic development, are not likely to expand
much further. Furthermore, the build-up of debt means that a lot of resources will be
used to repay or maintain the already existing debts and may lead to an inherent
contraction effect in the macro economy. There will be persistent downward pressures
in the process of structural adjustments and the reduction of overcapacity. Therefore,
serious efforts are needed to ensure steady growth, make structural adjustments,
facilitate reform, improve the people’s livelihood, and prevent risks. We need to adapt
to the changes in the economic structure and in demand, strive to make breakthroughs
in some key areas, speed up the cultivation and strengthening of new growth areas,
unleash economic vitality, improve the quality and efficiency of growth, and explore
areas and sectors where financial resources can be allocated effectively.
With the combined impact of these various factors, price growth remains flat.
Changes in price levels mainly come from the supply and demand side. On the
demand side, economic growth has moderated and on the supply side, a fluctuating
yet stronger dollar and the slow global recovery might lead to price declines and
fluctuations in US-dollar‒ denominated commodities, which will have a steady
impact on price levels. In general, price levels are very likely to remain low.
According to the Urban Depositors’ Survey conducted by the PBC in the first quarter
of 2015, the Future Price Expectations Index stood at 59 percent, down 5.5 percentage
points from the last quarter. It should be noted that downward pressures are inevitable
when the economy is changing gears and undergoing structural adjustments. However,
factors such as a decline in commodity and raw material prices, lower logistics prices
as a result of the flourishing e-commerce, and higher efficiency achieved through
innovations will help to reduce costs and to bring a positive supply shock. According
to the Survey of Entrepreneurs conducted by the People’s Bank of China in the first

61
quarter, the product sales index fell by 1.5 percentage points from the last quarter and
by 3.1 percentage points from the same period of the last year. The raw material
purchase price index fell by 1.6 percentage points from the last quarter and by 6.4
percentage points compared with the same period of the last year. However, if prices
continue to soften, market expectations might be affected and real interest rates might
be pushed up. Therefore, a comprehensive and objective perspective is needed when
judging the movements and impacts of the price levels. Future price movements will
depend on changes in internal and external conditions, while various policies and
measures that were implemented earlier will also gradually have an impact.
Consequently, we should continue to closely observe and monitor movements in the
price levels.
II. Monetary policy during the next stage
The PBC will earnestly implement the decisions of the Eighteenth CPC National
Congress, the Third and Fourth Plenary Sessions of the Eighteenth CPC Central
Committee, the Central Economic Work Conference, and the Report on the Work of
the Government, and will follow the strategic arrangements of the Party Central
Committee and the State Council. The PBC will adhere to the guideline of seeking
progress while maintaining stability and the overall principle of maintaining stable
macro-economic policies while adopting flexible micro policies, take initiatives to
adapt to the new normal in the economy, maintain the consistency and stability of
policies, continue to implement a sound monetary policy that is neither too tight nor
too loose, conduct timely and appropriate fine-tunings and preemptive adjustments,
prevent entrenched structural distortions and a higher debt and leverage level as a
result of an excessive loosening of the policy stance, make appropriate adjustments
according to changes in basic conditions, such as the liquidity supply, price levels,
and the economic outlook, create a neutral and proper monetary and financial
environment for structural adjustments and transformations, and the transformation of
the economic structure, and promote sustainable economic development. Innovation
in reform will be emphasized and reform measures will be integrated with
macro-economic management policies so that monetary policy will work closely with
the reform measures to further tap into the decisive role of the market in resource
allocations. In view of the financial deepening and the innovations in financial
markets, the conduct of policies, including those regarding the transmission
mechanism of monetary policy to the real economy, will be further improved. Efforts
will be focused on solving the salient problems. The efficiency and capacity of the
financial sector to provide services to the real sector will be improved.
First, a combination of various monetary-policy instruments will be employed, the
macro-prudential policy framework will be improved, and the combination of policy
measures will be further diversified and optimized to keep liquidity at an appropriate
volume and to realize the opportune growth of money, credit, and all-system
financing aggregates. In view of the changes in the domestic and international

62
economic and financial conditions, we will flexibly utilize various monetary-policy
tools, improve the central bank collateral management framework, maintain liquidity
at an appropriate level, and preserve stability in the money market. Currently, there is
ample room for the use of all kinds ofvarious
policy tools in order to properly adjust or inject liquidity. It is thus unnecessary to
greatly expand the total volume of liquidity through quantitative easing. We will
continue to guide commercial banks to strengthen liquidity and balance-sheet
management, to properly manage liquidity levels at various time points, and to
sensibly plan the total volume and term structure of assets and liability so as to
enhance liquidity risk management. The dynamic adjustment mechanism of the
differentiated reserve requirement will continue to play a role in counter-cyclical
management and structural adjustments. The parameters for the mechanism will be
adjusted properly and in a timely manner according to five factors, i.e., lending to
small enterprises and the agricultural sector, the capital adequacy ratio, internal risk
controls, the opening of new branches, and regional development, to provide for
differentiated and targeted requirements to guide financial institutions to manage the
pace of credit extensions in line with real and seasonal demands, to enhance credit
support to the agricultural sector, rural areas, and farmers and other key areas and to
the weak links in the economy, and to support the development of the real economy.
Continued efforts will be made to explore and improve the mechanisms and approach
for macro-prudential regulation.
Second, the stock of credit assets will be revitalized and use of new loans will be
optimized to support the structural adjustments, the transformation of the growth
model, and the upgrading of the economy. Measures will be taken to optimize the
direction and structure of the provision of liquidity, properly implement the targeted
reduction in the deposit reserve requirement ratio, and tap into the role of credit policy
to support central bank lending and the central bank discount policy to guide financial
institutions to optimize the credit structure. Efforts will be made to encourage
innovations in financial products and services, support economies of scale in
agricultural activities, give more support to the construction of water conservancy
projects, and provide better financial services to the new type of urbanization. Policies
supporting small and micro enterprises will continue to be implemented and funding
sources for these enterprises will be expanded and diversified so as to facilitate their
healthy growth. Assessments of the effects of credit policy guidance will be further
improved and the results of such assessments will be closely linked with the
utilization of monetary policy and financial market tools to guide financial institutions
to increase credit to the agricultural sector, rural areas, farmers, and small and micro
enterprises. Better financial services will be provided to support the strategy of
innovation-driven development, the design of financing products tailored to the needs
of enterprises in technology innovation, and encouragement of financial institutions to
enhance support to science and technology, culture, the strategic emerging industries,
and other key areas. Efforts will be made to provide financial services for the removal
of excess capacity and for development-oriented poverty reduction, and to facilitate

63
the development of micro-credit for poverty alleviation, and to strengthen
coordination of financial services for large and extremely poverty-stricken areas.
Financial inclusion will be actively promoted and financial support and services
related to the people’s livelihood will be enhanced, such as financial services for
employment, education, ethnic minorities, migrant workers, and
college-graduates-turned-village officials. A differentiated housing mortgage policy
will be implemented to support the building of welfare housing and common
commercial housing with small and medium floor area plans and reasonable home
purchases by households, while regular and market-based financing channels will be
broadened. Development and policy-related financing will continue to play a role in
major and large construction projects, such as reconstruction of shantytowns, water
conservation projects, and railways in the midwest regions. A number of measures
will be taken to reduce the costs of financing in the entire economy, such as
maintaining the reasonable growth of money and credit, improving the corporate
governance of banks, eliminating the unreasonable financial service charges,
improving a multi-tiered capital market, increasing the supply of financial services,
deepening the reforms and structural adjustments, and so forth.
Third, the market-based interest-rate reform and the RMB exchange-rate regime
reform will be deepened to improve efficiency in the allocation of financial resources
and to improve the monetary-policy framework. The self-regulatory market
interest-rate pricing mechanism will be improved to build the independent pricing
capacity of financial institutions. The issuance and trading of inter-bank certificates of
deposit will be promoted and we will explore the introduction of certificates of
deposit for corporate and individual customers to gradually increase the range of
market-priced liability products of financial institutions. Efforts will be made to
develop the Shibor and the Loan Prime Rate to build a fairly complete market
interest-rate system. The central bank interest-rate adjustment framework will be
improved to guide expectations and to strengthen price-based adjustments and the
transmission mechanism. The RMB exchange-rate regime will be further improved to
allow market demand and supply to play a greater role, to enhance two-way flexibility
of the RMB exchange rate, and to keep the exchange rate basically stable at an
adaptive and equilibrium level. Development of the foreign-exchange market will be
accelerated based on the principle of serving the real economy and to provide
exchange-rate risk management services to importers and exporters based on actual
demand. Measures will be taken to support the use of RMB in cross-border trade and
investment activities, and more channels will be made available for the outflow and
inflow reflow of RMB funds. Direct trading of the RMB against other currencies will
be promoted to provide better services for RMB settlements of cross-border trade
activities. The impact of the changing international situation on capital flows will be
carefully watched and effective monitoring of cross-border capital movements will be
strengthened.
Fourth, there will be continued efforts to improve the system of financial markets, to
带格式的: 字体: (中文) +中文正文

64
support the role of financial markets in preserving stable economic growth, supporting
economic structural adjustments and transformation, deepening reform and opening,
and preventing financial risks. The financial infrastructure and the institutional
arrangements will be strengthened to provide a more efficient investment and
financing market for economic structural adjustments and upgrading. Market
innovations will be encouraged to diversify the products and layers in the bond
market and to better meet investor demands. The market-maker mechanism will be
improved to enhance liquidity in the bond market and to lay a solid foundation for an
effective yield curve. The investor base will be expanded and market participants will
be diversified. The diversity of financial markets, financial products, investors, and
financing intermediaries will be further promoted. Qualified overseas and domestic
institutional investors will be welcomed to invest in the inter-bank bond market. The
risk-sharing and market-discipline mechanisms will be strengthened. We will
implement measures to promote direct financing and to develop a multi-tiered capital
market. Market supervision and the role of the corporate debenture bond joint
ministerial coordination mechanism will be enhanced. We will further strengthen
regulatory coordination and facilitate the development of market discipline
mechanisms, such as information disclosures and credit ratings, to regulate the trading
behavior of market participants, to prevent financial risks, and to promote the efficient
operation and sound development of financial markets.
Fifth, the reform of financial institutions will be deepened to improve financial
services by increasing supply and enhancing competition. The reform of large
commercial banks and other large financial institutions will be furthered to continue
to improve corporate governance, build effective mechanisms for decision making,
execution, and checks and balances, and to translate the principle of corporate
governance into daily operations and risk-control behavior. A reform program for
policy and development financial institutions will be implemented to establish capital
constraint mechanisms, improve the governance structure, and support fiscal and
financial policies in order to create a favorable policy environment and foster policy
financial institutions with Chinese characteristics that operate on a sustainable basis
and provide good services to support economic development. The shift to
market-based operations of asset-management companies will be further promoted.
Under the precondition of stronger supervision, the development of various kinds of
financial institutions, financial services organizations, and intermediary agencies will
be encouraged to build a financial eco-environment for fair competition with
participation by all kinds of market participants. The standards and rules for Internet
financing will be further improved to promote fair play, to enhance industry
self-regulation, to build a stronger capacity for risk management, to safeguard the
rights and interests of investors, and to promote the sound development of Internet
financing.
Sixth, effective measures will be adopted to mitigate systemic financial risks and to
preserve stability in the financial system. Macro-prudential regulation will be

65
enhanced to guide financial institutions to operate on a sound basis and to encourage
them to strengthen internal controls, to improve credit and liquidity management, and
to improve their risk-control capabilities. The systemic financial risk early-warning
and assessment mechanism will be improved, and monitoring and analysis of local
government debts, the real-estate sector, industries with an overcapacity, shadow
banking businesses, and mutual guarantees and joint peer guarantees of enterprises
will be enhanced to identify potential risks on a continual basis and to encourage
financial institutions to draft response plans for various scenarios. The Financial
Regulatory Coordination Joint Ministerial Conference will play a role in enhancing
risk monitoring and regulatory coordination of cross-sector and cross-market products,
coordinating development of various financial markets and instruments, and
establishing a system of comprehensive financial statistics and an information-sharing
mechanism. Efforts will be adopted to organize the launch of a deposit insurance
regime. A comprehensive set of measures will be taken to preserve financial stability
and to safeguard the bottom line in preventing systemic and regional financial risks.