Embed Size (px)
Citation preview
1
MONETARY POLICY COMMITTEE STATEMENT FOR
FOURTH QUARTER 2017
Governor’s Presentation to the Media
21st February, 2018
INTRODUCTION
2
The presentation is structured as follows:
1. Decision of the Monetary Policy Committee
2. Overview
3. Global economic developments
4. Domestic economic developments
5. Macroeconomic outlook
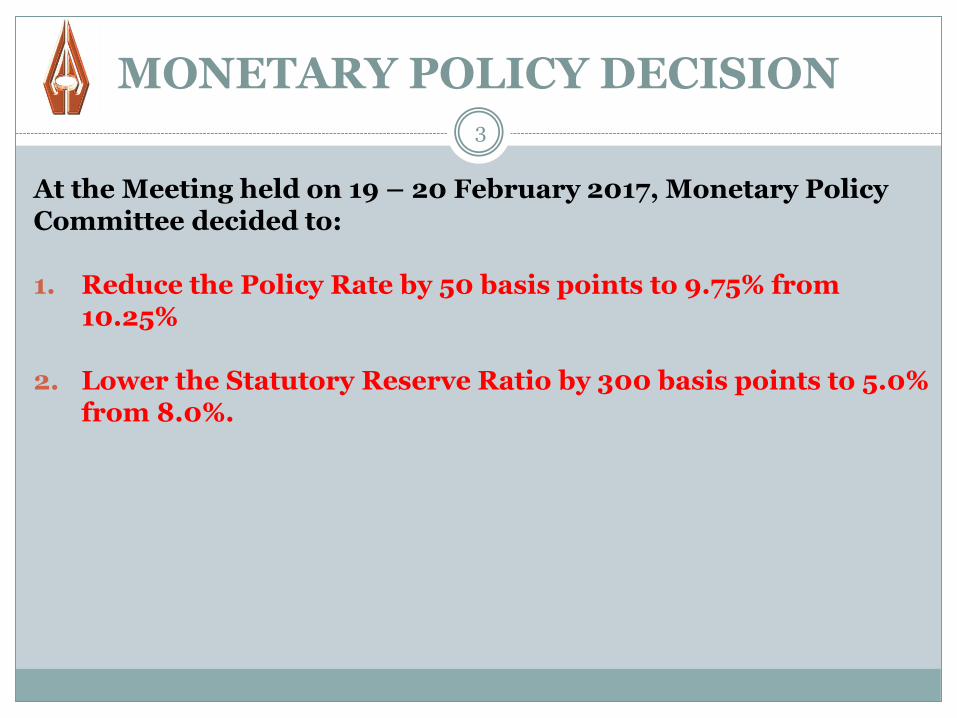
MONETARY POLICY DECISION3
At the Meeting held on 19 – 20 February 2017, Monetary Policy Committee decided to:
1. Reduce the Policy Rate by 50 basis points to 9.75% from 10.25%
2. Lower the Statutory Reserve Ratio by 300 basis points to 5.0% from 8.0%.
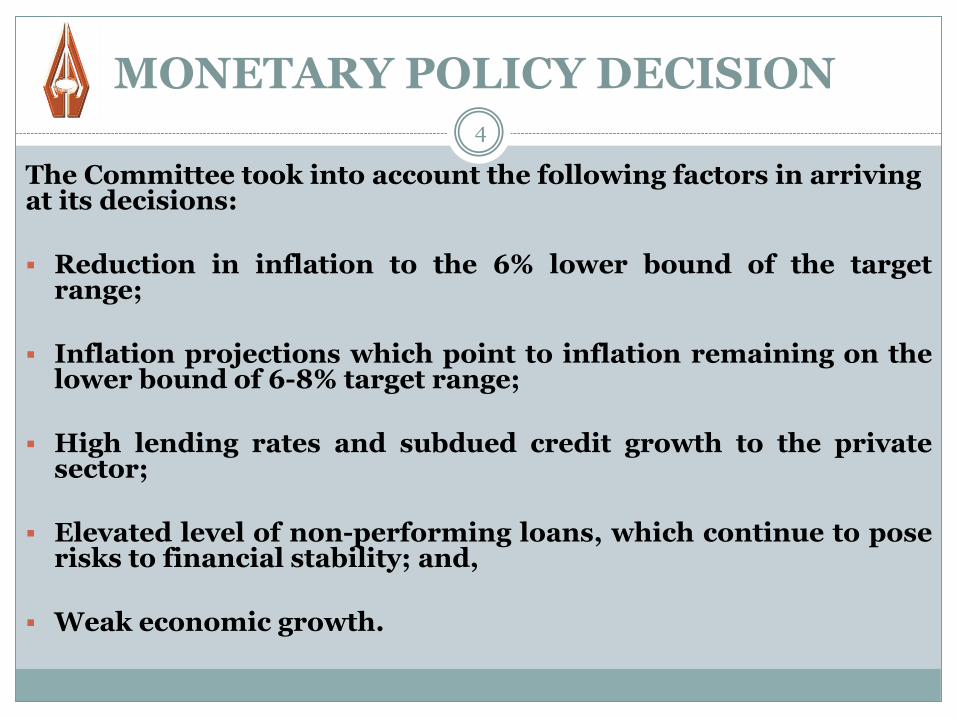
MONETARY POLICY DECISION4
The Committee took into account the following factors in arriving at its decisions:
Reduction in inflation to the 6% lower bound of the targetrange;
Inflation projections which point to inflation remaining on thelower bound of 6-8% target range;
High lending rates and subdued credit growth to the privatesector;
Elevated level of non-performing loans, which continue to poserisks to financial stability; and,
Weak economic growth.
OVERVIEW
5
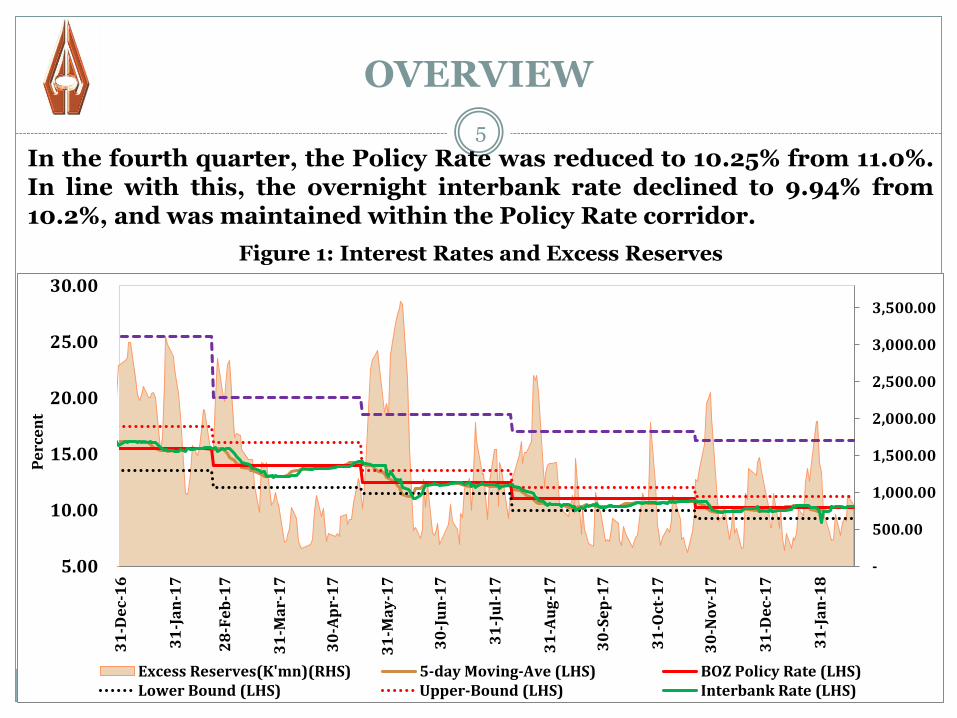
In the fourth quarter, the Policy Rate was reduced to 10.25% from 11.0%.In line with this, the overnight interbank rate declined to 9.94% from10.2%, and was maintained within the Policy Rate corridor.
Figure 1: Interest Rates and Excess Reserves
-
500.00
1,000.00
1,500.00
2,000.00
2,500.00
3,000.00
3,500.00
5.00
10.00
15.00
20.00
25.00
30.00
31
-De
c-1
6
31
-Ja
n-1
7
28
-Fe
b-1
7
31
-Ma
r-1
7
30
-Ap
r-1
7
31
-Ma
y-1
7
30
-Ju
n-1
7
31
-Ju
l-1
7
31
-Au
g-1
7
30
-Se
p-1
7
31
-Oct
-17
30
-No
v-1
7
31
-De
c-1
7
31
-Ja
n-1
8
Pe
rce
nt
Excess Reserves(K'mn)(RHS) 5-day Moving-Ave (LHS) BOZ Policy Rate (LHS)Lower Bound (LHS) Upper-Bound (LHS) Interbank Rate (LHS)
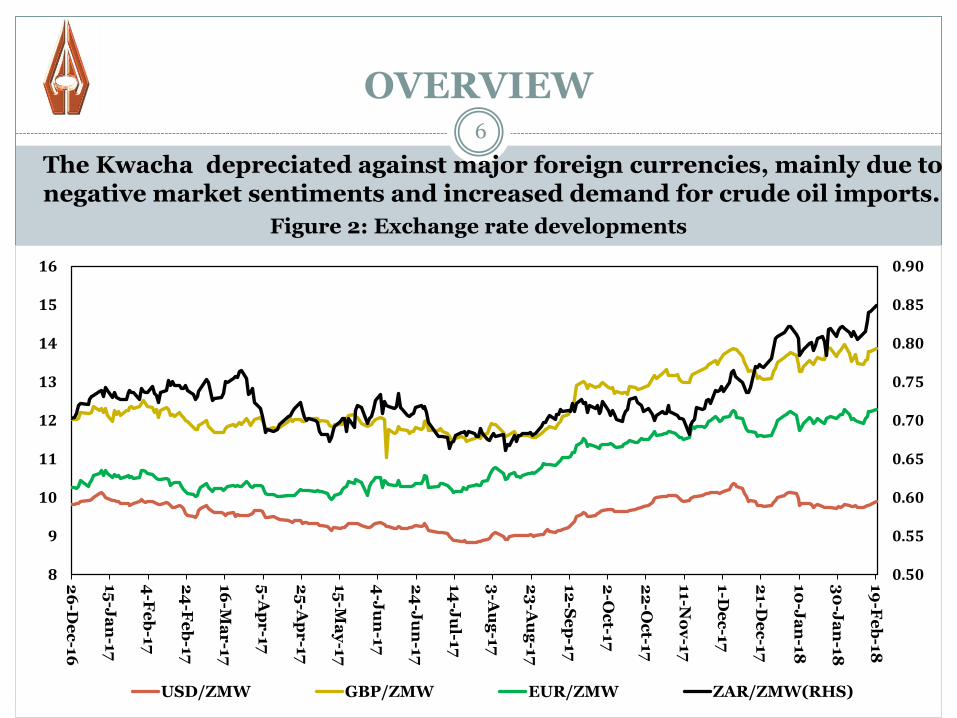
The Kwacha depreciated against major foreign currencies, mainly due to negative market sentiments and increased demand for crude oil imports.
OVERVIEW6
Figure 2: Exchange rate developments
0.50
0.55
0.60
0.65
0.70
0.75
0.80
0.85
0.90
8
9
10
11
12
13
14
15
16
26
-De
c-1
6
15
-Ja
n-1
7
4-F
eb
-17
24
-Fe
b-1
7
16
-Ma
r-1
7
5-A
pr
-17
25
-Ap
r-1
7
15
-Ma
y-1
7
4-J
un
-17
24
-Ju
n-1
7
14
-Ju
l-17
3-A
ug
-17
23
-Au
g-1
7
12
-Se
p-1
7
2-O
ct-1
7
22
-Oc
t-17
11-N
ov
-17
1-D
ec
-17
21-D
ec
-17
10
-Ja
n-1
8
30
-Ja
n-1
8
19
-Fe
b-1
8
USD/ZMW GBP/ZMW EUR/ZMW ZAR/ZMW(RHS)
OVERVIEW
7
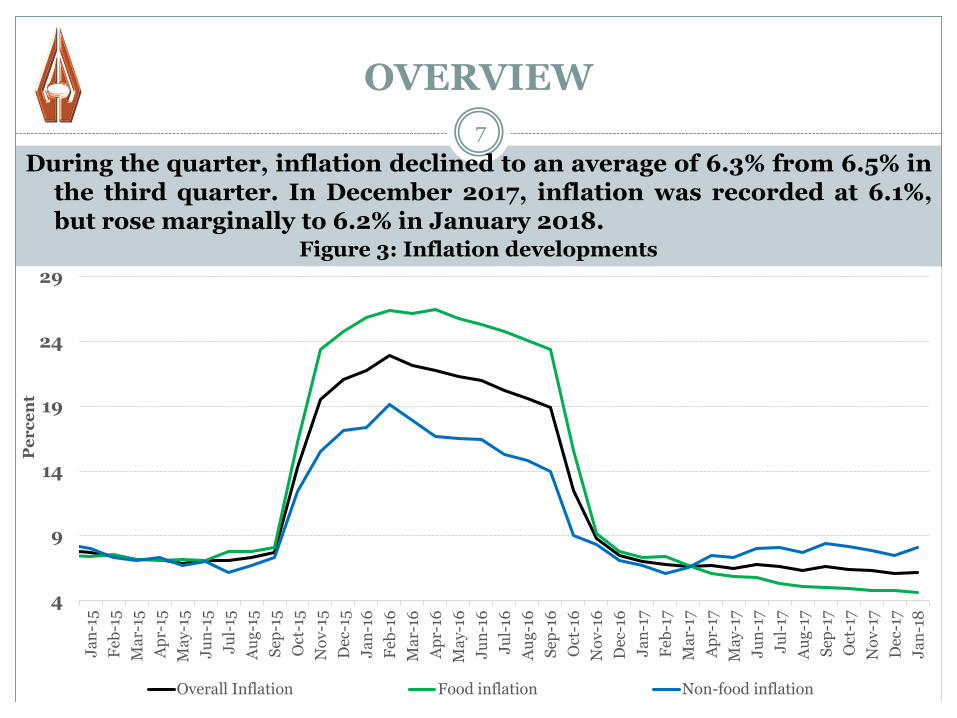
During the quarter, inflation declined to an average of 6.3% from 6.5% inthe third quarter. In December 2017, inflation was recorded at 6.1%,but rose marginally to 6.2% in January 2018.
Figure 3: Inflation developments
4
9
14
19
24
29
Ja
n-1
5
Feb
-15
Ma
r-15
Ap
r-15
Ma
y-1
5
Ju
n-1
5
Ju
l-15
Au
g-1
5
Sep
-15
Oct
-15
No
v-1
5
Dec
-15
Ja
n-1
6
Feb
-16
Ma
r-16
Ap
r-16
Ma
y-1
6
Ju
n-1
6
Ju
l-16
Au
g-1
6
Sep
-16
Oct
-16
No
v-1
6
Dec
-16
Ja
n-1
7
Feb
-17
Ma
r-17
Ap
r-17
Ma
y-1
7
Ju
n-1
7
Ju
l-17
Au
g-1
7
Sep
-17
Oct
-17
No
v-1
7
Dec
-17
Ja
n-1
8
Pe
rc
en
t
Overall Inflation Food inflation Non-food inflation
GLOBAL ECONOMIC DEVELOPMENTS
8
In the fourth quarter, global economic growth continued with the global economy ending 2017 on a strong footing.
Factors explaining continued growth include:
improved global trade and manufacturing output;
continued higher global commodity prices;
increased global demand;
strong growth in the US, driven by robust consumer spending;
strong growth in China; and,
stronger consumer sentiments
Commodity prices were mixed in the fourth quarter of 2017, butcopper and crude oil prices continued to rise (Table 1).
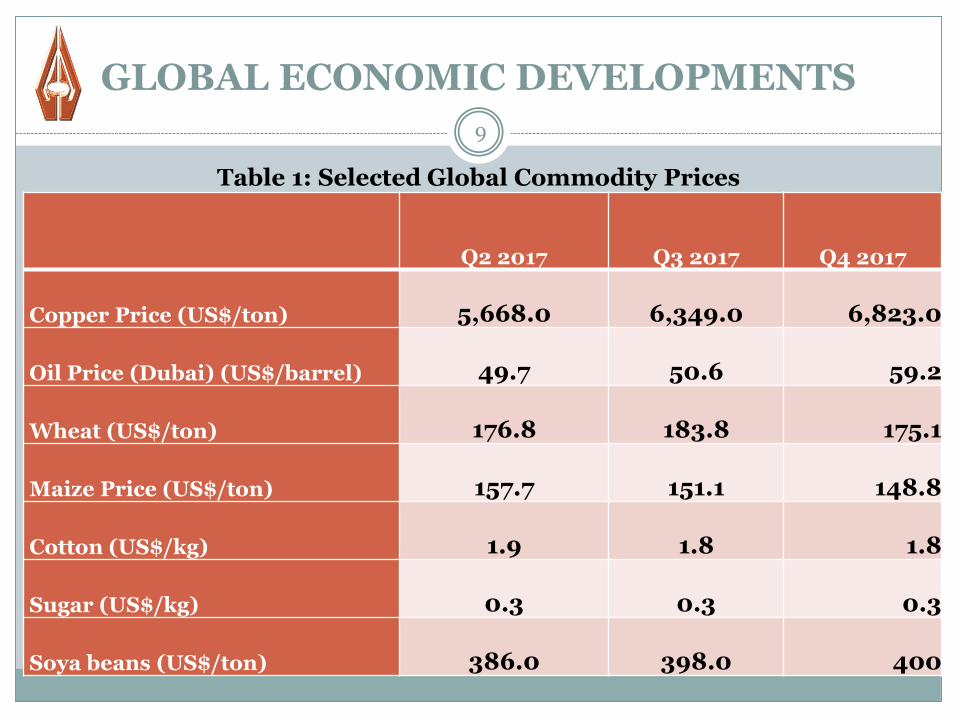
GLOBAL ECONOMIC DEVELOPMENTS
9
Table 1: Selected Global Commodity Prices
Q2 2017 Q3 2017 Q4 2017
Copper Price (US$/ton) 5,668.0 6,349.0 6,823.0
Oil Price (Dubai) (US$/barrel) 49.7 50.6 59.2
Wheat (US$/ton) 176.8 183.8 175.1
Maize Price (US$/ton) 157.7 151.1 148.8
Cotton (US$/kg) 1.9 1.8 1.8
Sugar (US$/kg) 0.3 0.3 0.3
Soya beans (US$/ton) 386.0 398.0 400
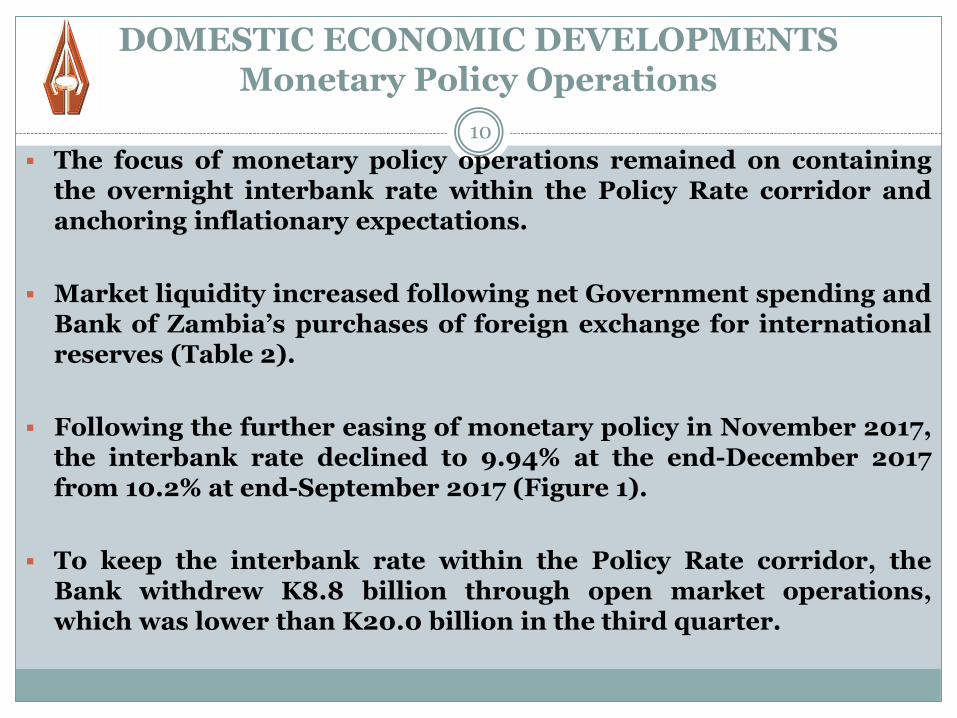
DOMESTIC ECONOMIC DEVELOPMENTSMonetary Policy Operations
10
The focus of monetary policy operations remained on containingthe overnight interbank rate within the Policy Rate corridor andanchoring inflationary expectations.
Market liquidity increased following net Government spending andBank of Zambia’s purchases of foreign exchange for internationalreserves (Table 2).
Following the further easing of monetary policy in November 2017,the interbank rate declined to 9.94% at the end-December 2017from 10.2% at end-September 2017 (Figure 1).
To keep the interbank rate within the Policy Rate corridor, theBank withdrew K8.8 billion through open market operations,which was lower than K20.0 billion in the third quarter.
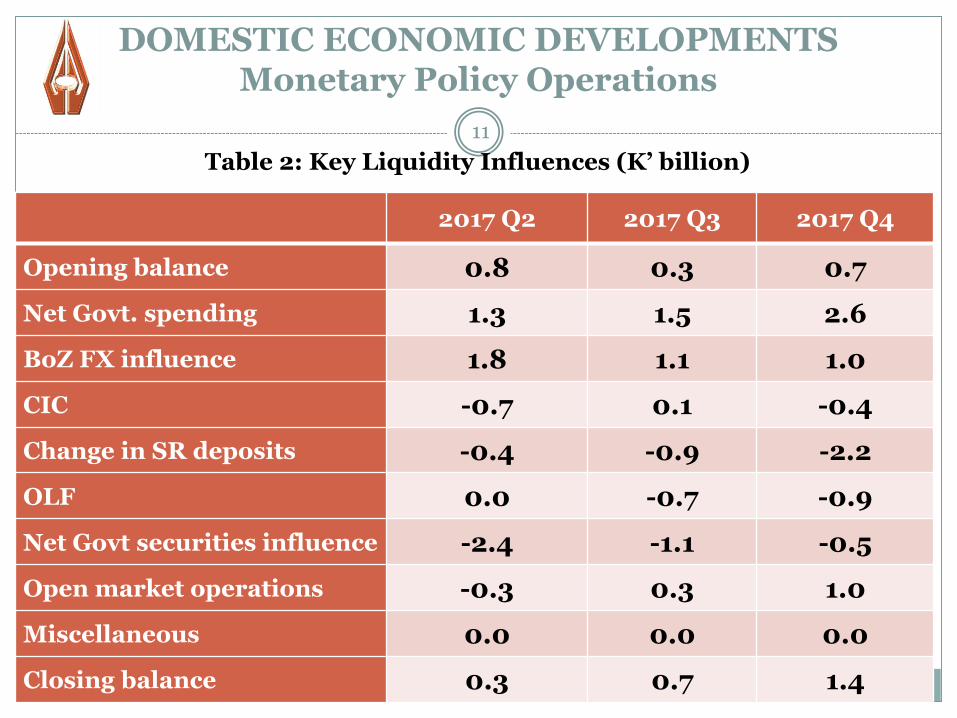
DOMESTIC ECONOMIC DEVELOPMENTSMonetary Policy Operations
11
Table 2: Key Liquidity Influences (K’ billion)
2017 Q2 2017 Q3 2017 Q4
Opening balance 0.8 0.3 0.7
Net Govt. spending 1.3 1.5 2.6
BoZ FX influence 1.8 1.1 1.0
CIC -0.7 0.1 -0.4
Change in SR deposits -0.4 -0.9 -2.2
OLF 0.0 -0.7 -0.9
Net Govt securities influence -2.4 -1.1 -0.5
Open market operations -0.3 0.3 1.0
Miscellaneous 0.0 0.0 0.0
Closing balance 0.3 0.7 1.4
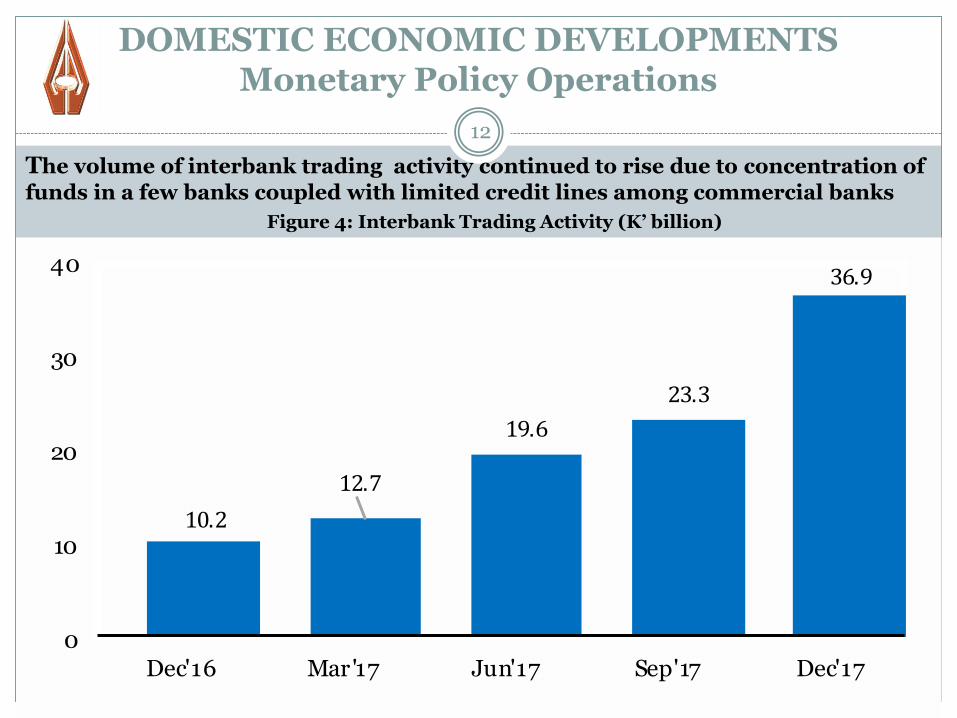
DOMESTIC ECONOMIC DEVELOPMENTSMonetary Policy Operations
12
Figure 4: Interbank Trading Activity (K’ billion)
The volume of interbank trading activity continued to rise due to concentration of
funds in a few banks coupled with limited credit lines among commercial banks
10.2
12.7
19.6
23.3
36.9
0
10
20
30
40
Dec'16 Mar'17 Jun'17 Sep'17 Dec'17
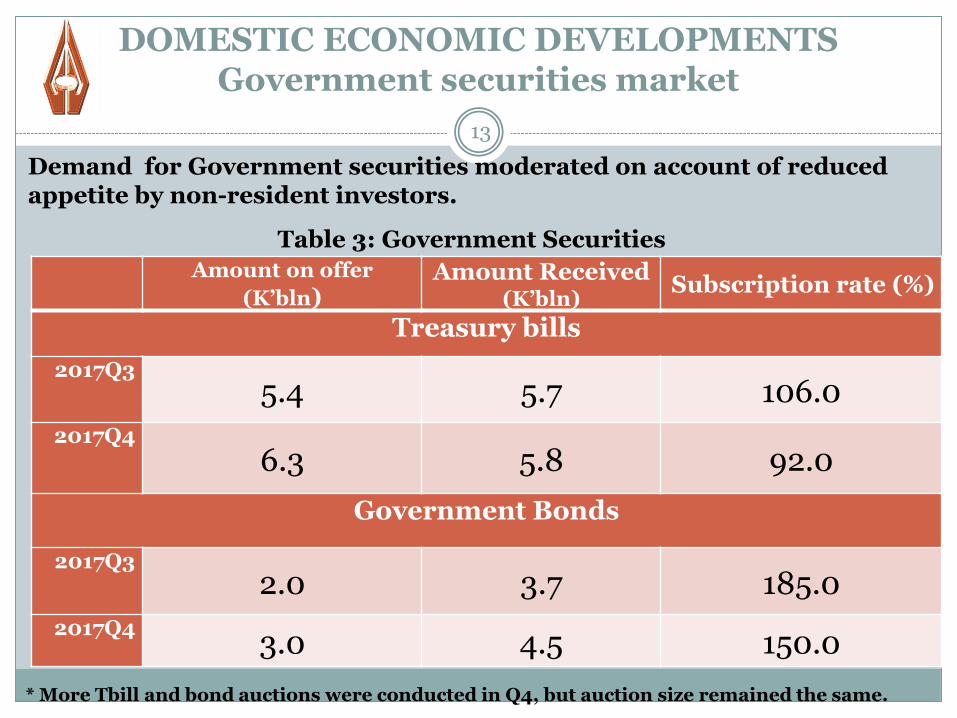
DOMESTIC ECONOMIC DEVELOPMENTSGovernment securities market
13
Table 3: Government Securities Auctions
Demand for Government securities moderated on account of reduced appetite by non-resident investors.
* More Tbill and bond auctions were conducted in Q4, but auction size remained the same.
Amount on offer
(K’bln)Amount Received
(K’bln) Subscription rate (%)
Treasury bills
2017Q35.4 5.7 106.0
2017Q4
6.3 5.8 92.0
Government Bonds
2017Q32.0 3.7 185.0
2017Q43.0 4.5 150.0
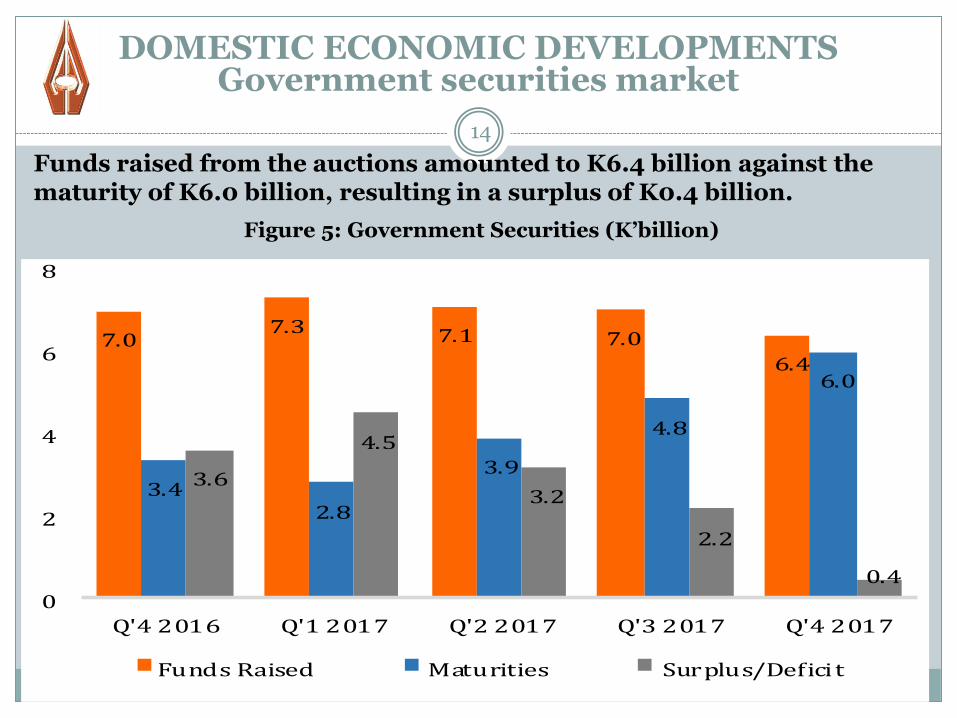
Funds raised from the auctions amounted to K6.4 billion against the maturity of K6.0 billion, resulting in a surplus of K0.4 billion.
14
Figure 5: Government Securities (K’billion)
DOMESTIC ECONOMIC DEVELOPMENTSGovernment securities market
7.07.3 7.1 7.0
6.4
3.42.8
3.9
4.8
6.0
3.6
4.5
3.2
2.2
0.4
0
2
4
6
8
Q'4 2016 Q'1 2017 Q'2 2017 Q'3 2017 Q'4 2017
Funds Raised Maturities Surplus/Deficit
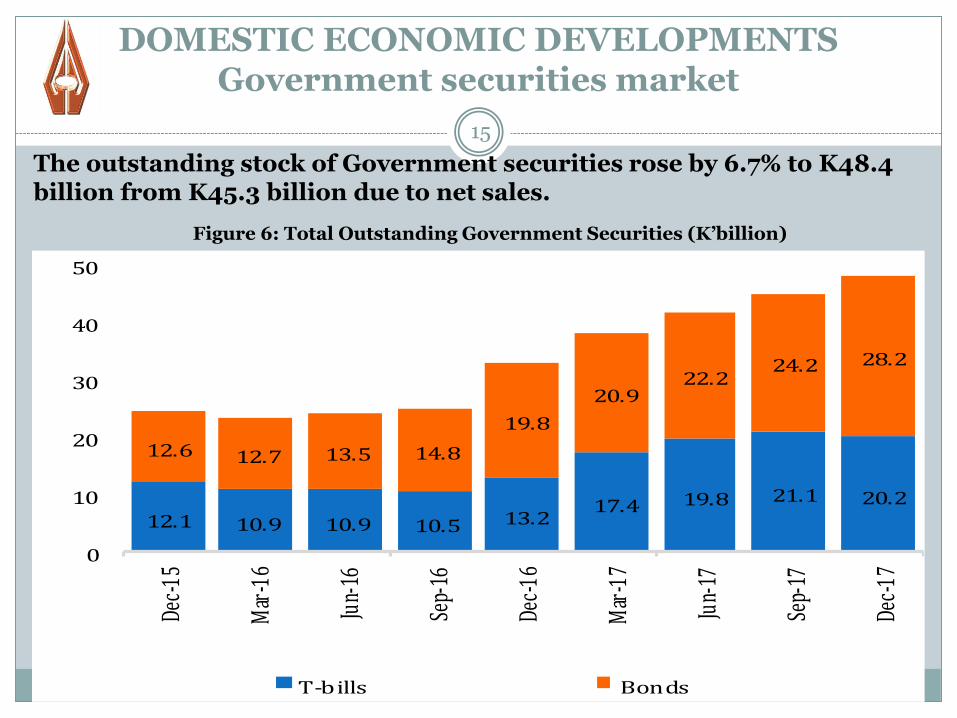
DOMESTIC ECONOMIC DEVELOPMENTSGovernment securities market
15
The outstanding stock of Government securities rose by 6.7% to K48.4 billion from K45.3 billion due to net sales.
Figure 6: Total Outstanding Government Securities (K’billion)
12.1 10.9 10.9 10.5 13.217.4 19.8 21.1 20.2
12.6 12.7 13.5 14.8
19.8
20.922.2
24.2 28.2
0
10
20
30
40
50
Dec-
15
Mar
-16
Jun-
16
Sep-
16
Dec-
16
Mar
-17
Jun-
17
Sep-
17
Dec-
17
T-bills Bonds
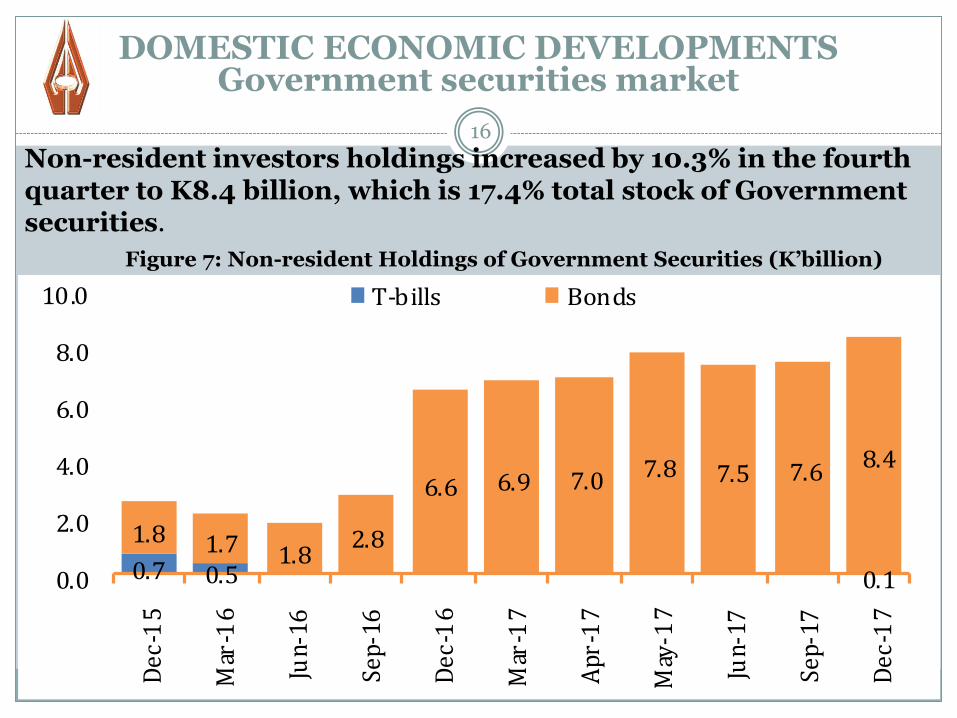
16
Figure 7: Non-resident Holdings of Government Securities (K’billion)
DOMESTIC ECONOMIC DEVELOPMENTSGovernment securities market
Non-resident investors holdings increased by 10.3% in the fourth quarter to K8.4 billion, which is 17.4% total stock of Government securities.
0.7 0.5 0.1
1.8 1.7 1.82.8
6.6 6.9 7.0 7.8 7.5 7.68.4
0.0
2.0
4.0
6.0
8.0
10.0
Dec
-15
Mar
-16
Jun-
16
Sep-
16
Dec
-16
Mar
-17
Apr
-17
May
-17
Jun-
17
Sep-
17
Dec
-17
T-bills Bonds
DOMESTIC ECONOMIC DEVELOPMENTSGovernment securities market
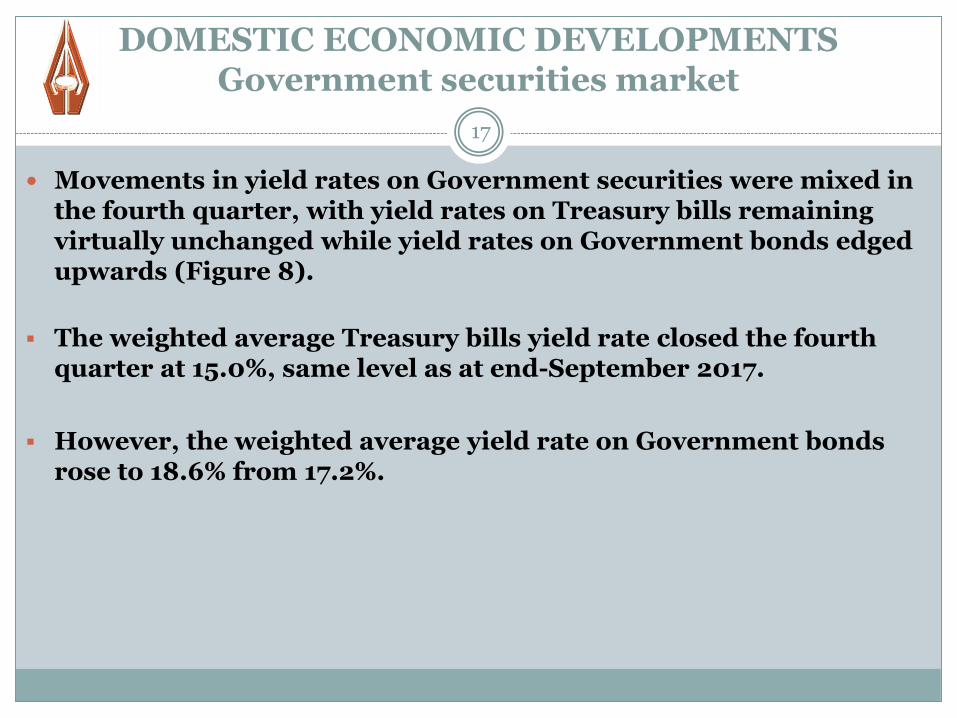
17
Movements in yield rates on Government securities were mixed in the fourth quarter, with yield rates on Treasury bills remaining virtually unchanged while yield rates on Government bonds edged upwards (Figure 8).
The weighted average Treasury bills yield rate closed the fourth quarter at 15.0%, same level as at end-September 2017.
However, the weighted average yield rate on Government bonds rose to 18.6% from 17.2%.
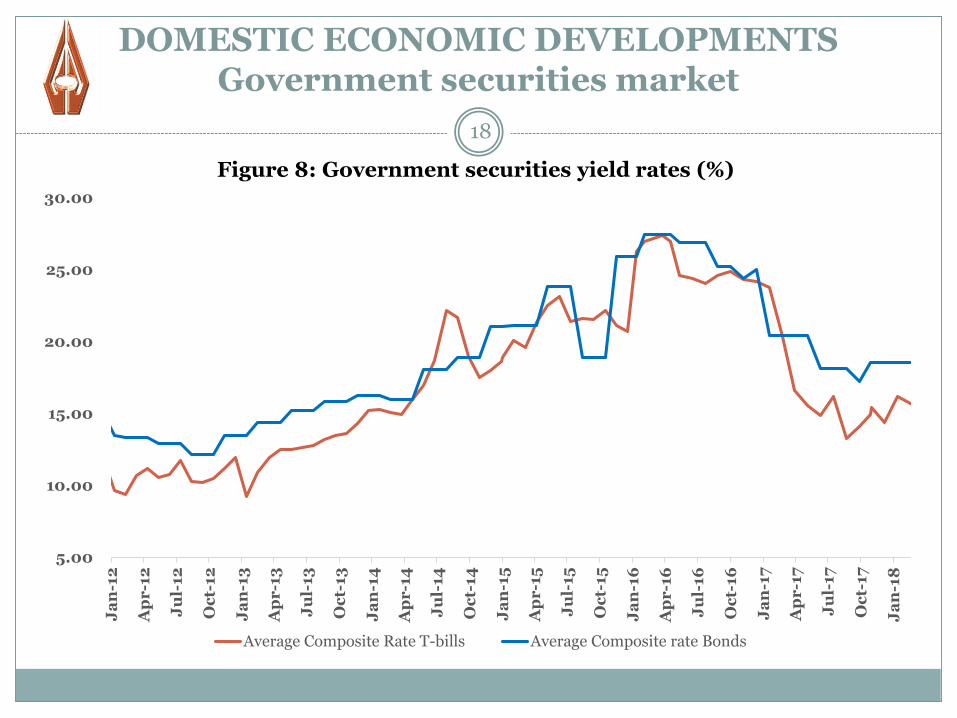
DOMESTIC ECONOMIC DEVELOPMENTSGovernment securities market
18
Figure 8: Government securities yield rates (%)
5.00
10.00
15.00
20.00
25.00
30.00
Ja
n-1
2
Ap
r-1
2
Ju
l-12
Oc
t-12
Ja
n-1
3
Ap
r-1
3
Ju
l-13
Oc
t-13
Ja
n-1
4
Ap
r-1
4
Ju
l-14
Oc
t-14
Ja
n-1
5
Ap
r-1
5
Ju
l-15
Oc
t-15
Ja
n-1
6
Ap
r-1
6
Ju
l-16
Oc
t-16
Ja
n-1
7
Ap
r-1
7
Ju
l-17
Oc
t-17
Ja
n-1
8
Average Composite Rate T-bills Average Composite rate Bonds
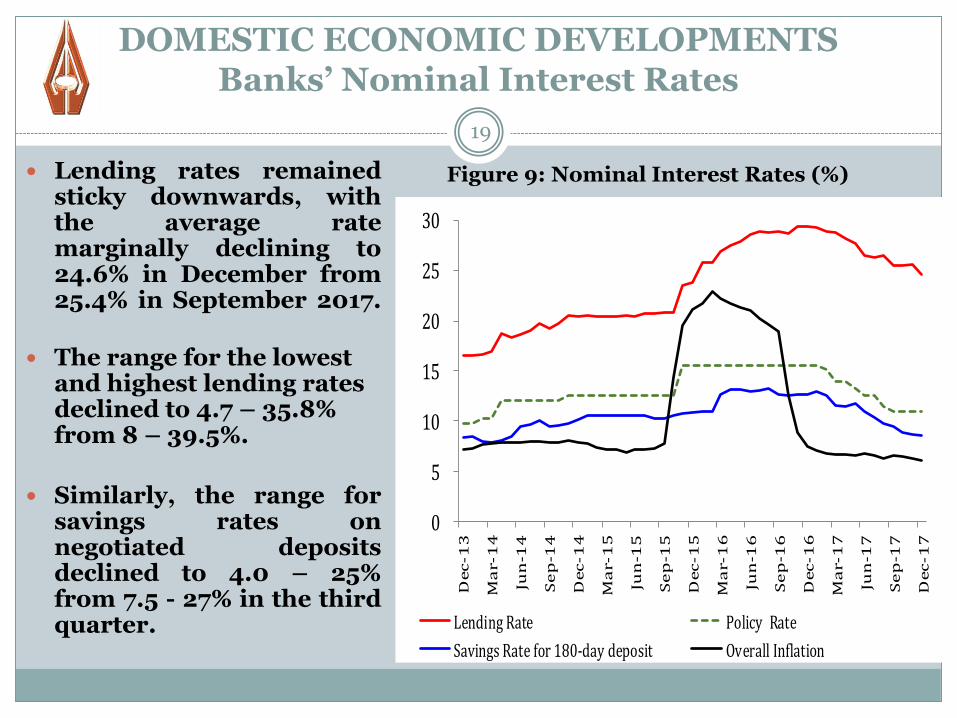
DOMESTIC ECONOMIC DEVELOPMENTSBanks’ Nominal Interest Rates
19
Lending rates remainedsticky downwards, withthe average ratemarginally declining to24.6% in December from25.4% in September 2017.
The range for the lowest and highest lending rates declined to 4.7 – 35.8% from 8 – 39.5%.
Similarly, the range forsavings rates onnegotiated depositsdeclined to 4.0 – 25%from 7.5 - 27% in the thirdquarter.
Figure 9: Nominal Interest Rates (%)
0
5
10
15
20
25
30
Dec-1
3
Ma
r-1
4
Jun
-14
Se
p-1
4
Dec
-1
4
Ma
r-1
5
Jun
-15
Se
p-1
5
Dec
-1
5
Ma
r-1
6
Jun
-16
Se
p-1
6
Dec-1
6
Ma
r-1
7
Jun
-17
Se
p-1
7
Dec
-1
7
Lending Rate Policy Rate
Savings Rate for 180-day deposit Overall Inflation
DOMESTIC ECONOMIC DEVELOPMENTSMoney supply and credit
20
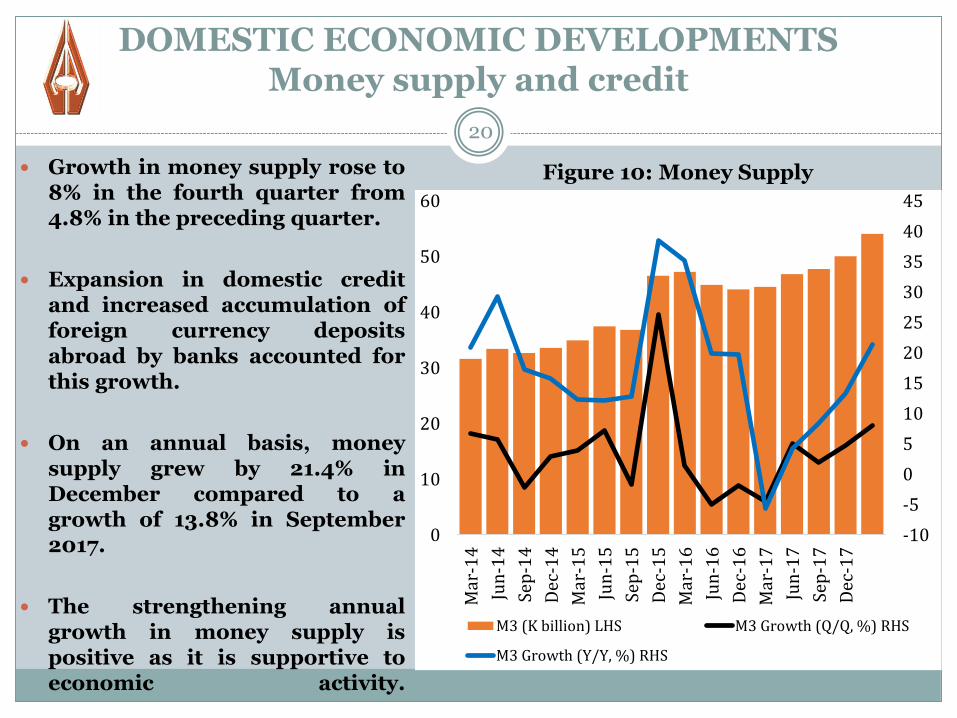
Growth in money supply rose to8% in the fourth quarter from4.8% in the preceding quarter.
Expansion in domestic creditand increased accumulation offoreign currency depositsabroad by banks accounted forthis growth.
On an annual basis, moneysupply grew by 21.4% inDecember compared to agrowth of 13.8% in September2017.
The strengthening annualgrowth in money supply ispositive as it is supportive toeconomic activity.
Figure 10: Money Supply
-10
-5
0
5
10
15
20
25
30
35
40
45
0
10
20
30
40
50
60
Mar
-14
Jun
-14
Sep
-14
Dec
-14
Mar
-15
Jun
-15
Sep
-15
Dec
-15
Mar
-16
Jun
-16
Dec
-16
Mar
-17
Jun
-17
Sep
-17
Dec
-17
M3 (K billion) LHS M3 Growth (Q/Q, %) RHS
M3 Growth (Y/Y, %) RHS
DOMESTIC ECONOMIC DEVELOPMENTSMoney supply and credit
21
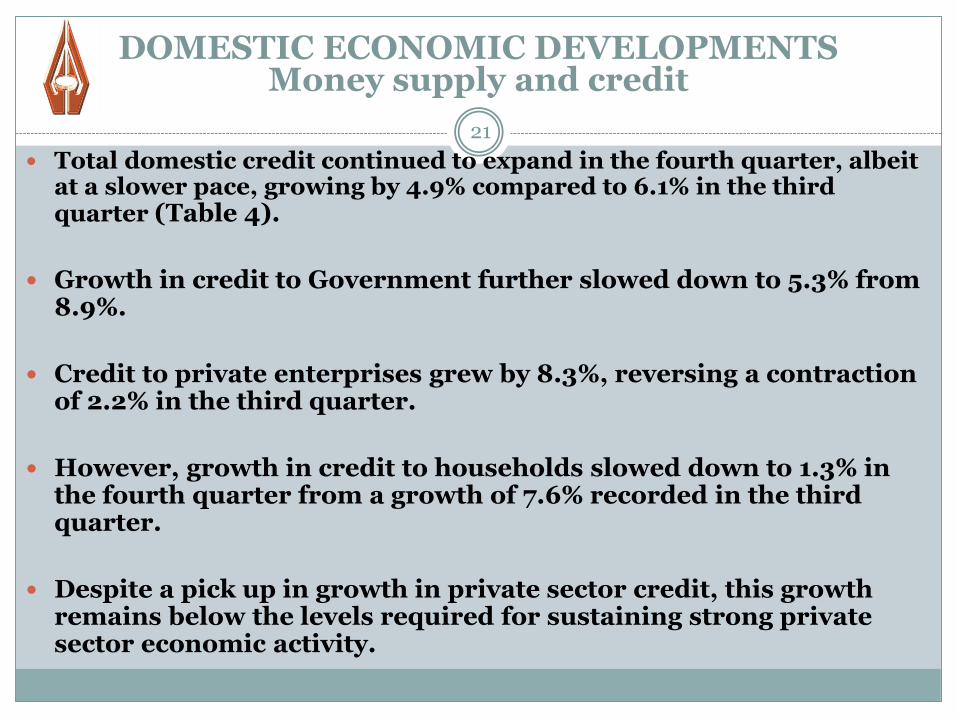
Total domestic credit continued to expand in the fourth quarter, albeit at a slower pace, growing by 4.9% compared to 6.1% in the third quarter (Table 4).
Growth in credit to Government further slowed down to 5.3% from 8.9%.
Credit to private enterprises grew by 8.3%, reversing a contraction of 2.2% in the third quarter.
However, growth in credit to households slowed down to 1.3% in the fourth quarter from a growth of 7.6% recorded in the third quarter.
Despite a pick up in growth in private sector credit, this growth remains below the levels required for sustaining strong private sector economic activity.
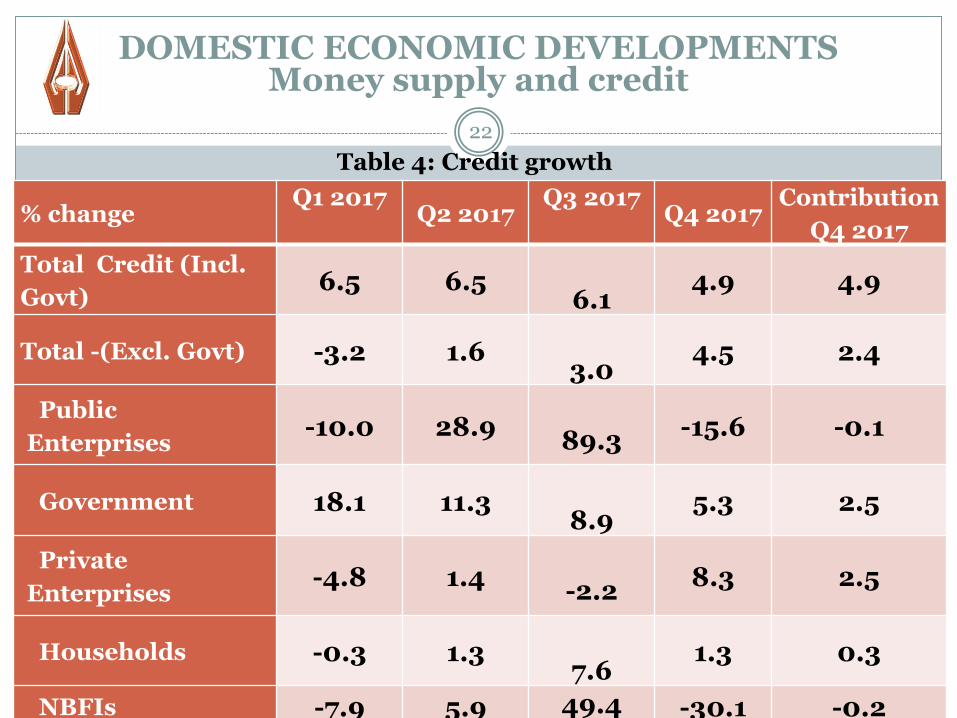
22
Table 4: Credit growth
DOMESTIC ECONOMIC DEVELOPMENTSMoney supply and credit
% changeQ1 2017
Q2 2017Q3 2017
Q4 2017Contribution
Q4 2017
Total Credit (Incl.
Govt)6.5 6.5
6.14.9 4.9
Total -(Excl. Govt) -3.2 1.6 3.0
4.5 2.4
Public
Enterprises-10.0 28.9
89.3-15.6 -0.1
Government 18.1 11.3 8.9
5.3 2.5
Private
Enterprises-4.8 1.4
-2.28.3 2.5
Households -0.3 1.3 7.6
1.3 0.3
NBFIs -7.9 5.9 49.4 -30.1 -0.2
23
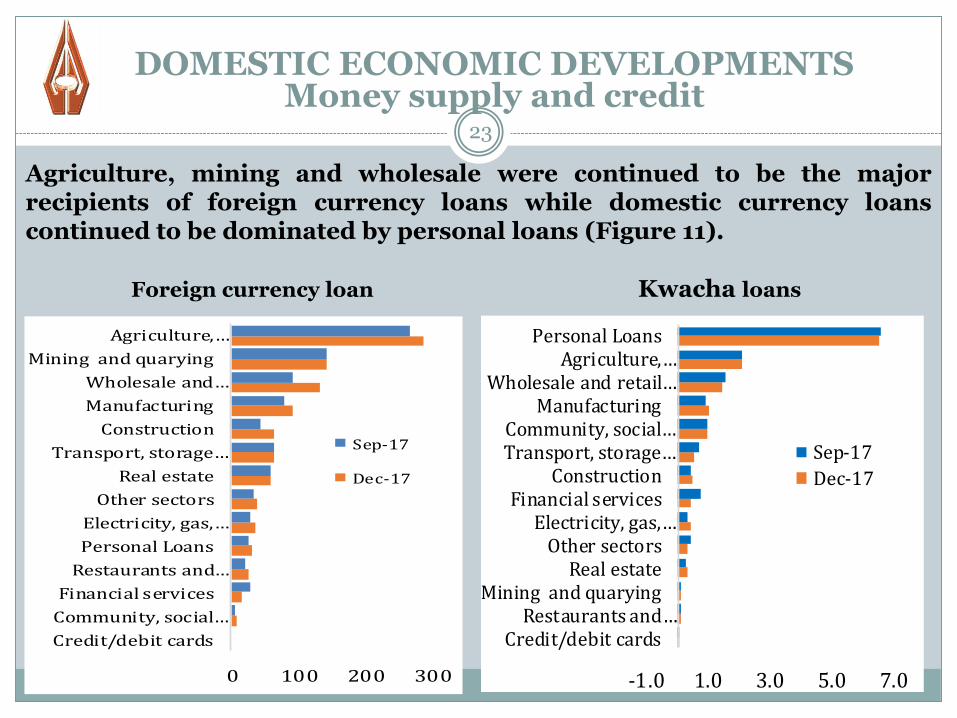
Agriculture, mining and wholesale were continued to be the majorrecipients of foreign currency loans while domestic currency loanscontinued to be dominated by personal loans (Figure 11).
DOMESTIC ECONOMIC DEVELOPMENTSMoney supply and credit
0 100 200 300
Credit/debit cards
Community, social…
Financial services
Restaurants and…
Personal Loans
Electricity, gas,…
Other sectors
Real estate
Transport, storage…
Construction
Manufacturing
Wholesale and…
Mining and quarying
Agriculture,…
Sep-17
Dec-17
-1.0 1.0 3.0 5.0 7.0
Credit/debit cardsRestaurants and…
Mining and quaryingReal estate
Other sectorsElectricity, gas,…
Financial servicesConstruction
Transport, storage…Community, social…
ManufacturingWholesale and retail…
Agriculture,…Personal Loans
Sep-17
Dec-17
Foreign currency loan Kwacha loans
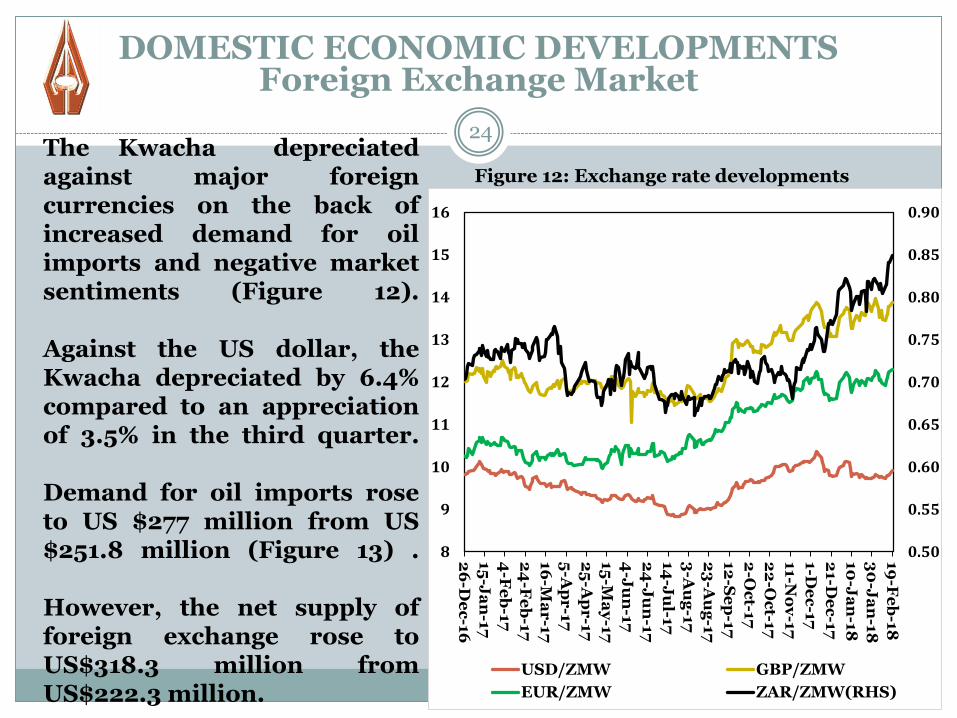
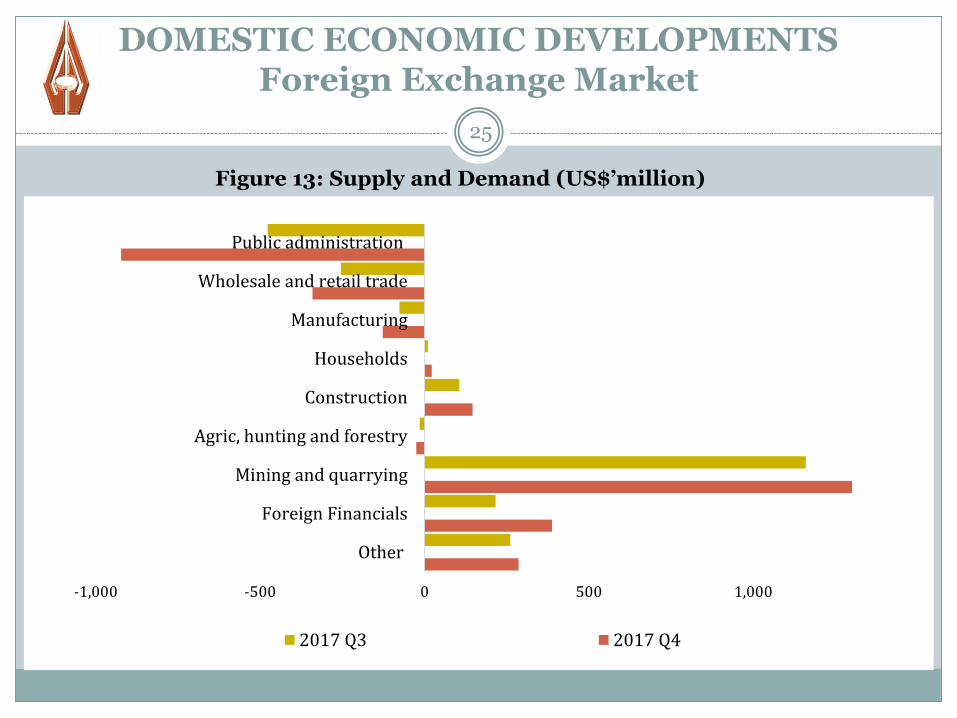
The Kwacha depreciatedagainst major foreigncurrencies on the back ofincreased demand for oilimports and negative marketsentiments (Figure 12).
Against the US dollar, theKwacha depreciated by 6.4%compared to an appreciationof 3.5% in the third quarter.
Demand for oil imports roseto US $277 million from US$251.8 million (Figure 13) .
However, the net supply offoreign exchange rose toUS$318.3 million fromUS$222.3 million.
24
Figure 12: Exchange rate developments
DOMESTIC ECONOMIC DEVELOPMENTSForeign Exchange Market
0.50
0.55
0.60
0.65
0.70
0.75
0.80
0.85
0.90
8
9
10
11
12
13
14
15
16
26
-De
c-1
6
15
-Ja
n-1
7
4-F
eb
-17
24
-Fe
b-1
7
16
-Ma
r-1
7
5-A
pr
-17
25
-Ap
r-1
7
15
-Ma
y-1
7
4-J
un
-17
24
-Ju
n-1
7
14
-Ju
l-17
3-A
ug
-17
23
-Au
g-1
7
12
-Se
p-1
7
2-O
ct-1
7
22
-Oc
t-17
11-N
ov
-17
1-D
ec
-17
21-D
ec
-17
10
-Ja
n-1
8
30
-Ja
n-1
8
19
-Fe
b-1
8
USD/ZMW GBP/ZMW
EUR/ZMW ZAR/ZMW(RHS)
DOMESTIC ECONOMIC DEVELOPMENTSForeign Exchange Market
25
Figure 13: Supply and Demand (US$’million)
-1,000 -500 0 500 1,000
Other
Foreign Financials
Mining and quarrying
Agric, hunting and forestry
Construction
Households
Manufacturing
Wholesale and retail trade
Public administration
2017 Q3 2017 Q4
DOMESTIC ECONOMIC DEVELOPMENTSReal Sector Activity
26
GDP is estimated to have grown by 3.3% in Q3 (3.2% in Q2), drivenby agriculture, education, and construction sectors.
Growth in 2017 has been slower than 2016 largely due to sluggishgrowth in construction and ICT sectors.
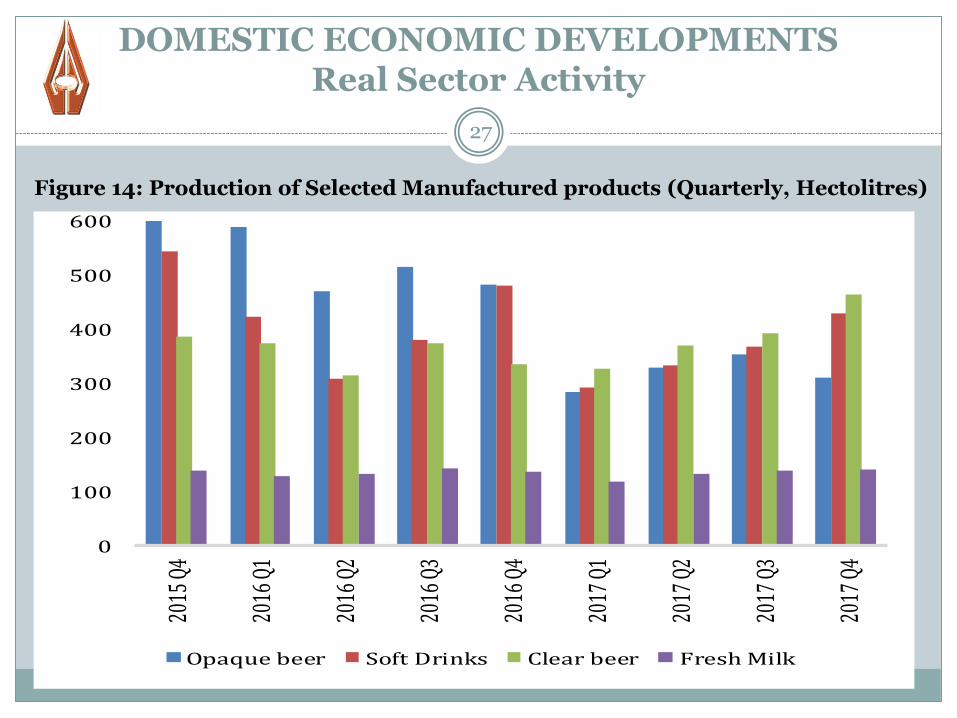
However, production of some manufactured products (food andbeverages, leather, chemicals, plastic and rubber basic andfabricated metals) rose in the fourth quarter (Figure 14).
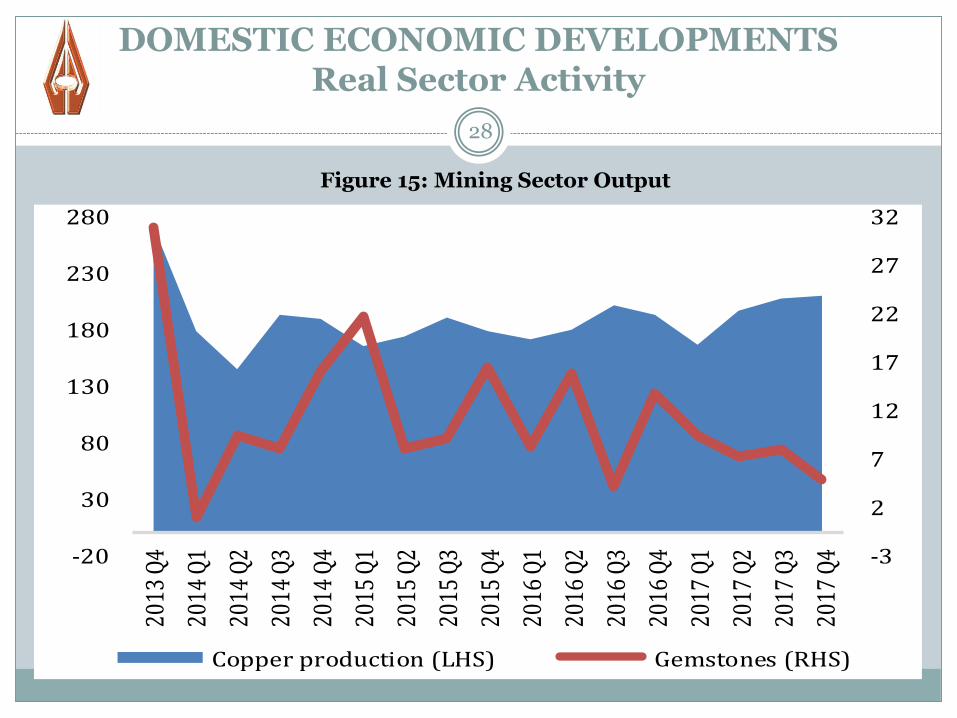
In addition, copper output at 786,731mt is estimated to havebeen 2% higher in 2017 than in 2016 (Figure 15).
27
DOMESTIC ECONOMIC DEVELOPMENTSReal Sector Activity
0
100
200
300
400
500
600
2015
Q4
2016
Q1
2016
Q2
2016
Q3
2016
Q4
2017
Q1
2017
Q2
2017
Q3
2017
Q4
Opaque beer Soft Drinks Clear beer Fresh Milk
Figure 14: Production of Selected Manufactured products (Quarterly, Hectolitres)
DOMESTIC ECONOMIC DEVELOPMENTSReal Sector Activity
28
Figure 15: Mining Sector Output
-3
2
7
12
17
22
27
32
-20
30
80
130
180
230
280
2013
Q4
2014
Q1
2014
Q2
2014
Q3
2014
Q4
2015
Q1
2015
Q2
2015
Q3
2015
Q4
2016
Q1
2016
Q2
2016
Q3
2016
Q4
2017
Q1
2017
Q2
2017
Q3
2017
Q4
Copper production (LHS) Gemstones (RHS)
DOMESTIC ECONOMIC DEVELOPMENTSReal Sector Activity
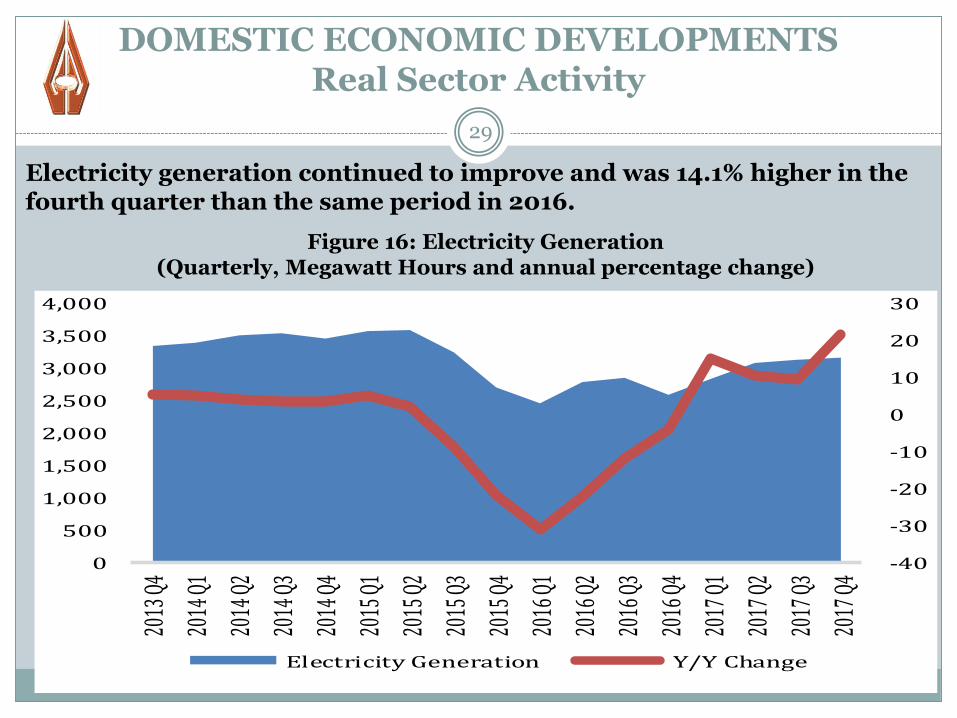
29
Figure 16: Electricity Generation (Quarterly, Megawatt Hours and annual percentage change)
Electricity generation continued to improve and was 14.1% higher in the fourth quarter than the same period in 2016.
-40
-30
-20
-10
0
10
20
30
0
500
1,000
1,500
2,000
2,500
3,000
3,500
4,000
2013
Q4
2014
Q1
2014
Q2
2014
Q3
2014
Q4
2015
Q1
2015
Q2
2015
Q3
2015
Q4
2016
Q1
2016
Q2
2016
Q3
2016
Q4
2017
Q1
2017
Q2
2017
Q3
2017
Q4
Electricity Generation Y/Y Change
30
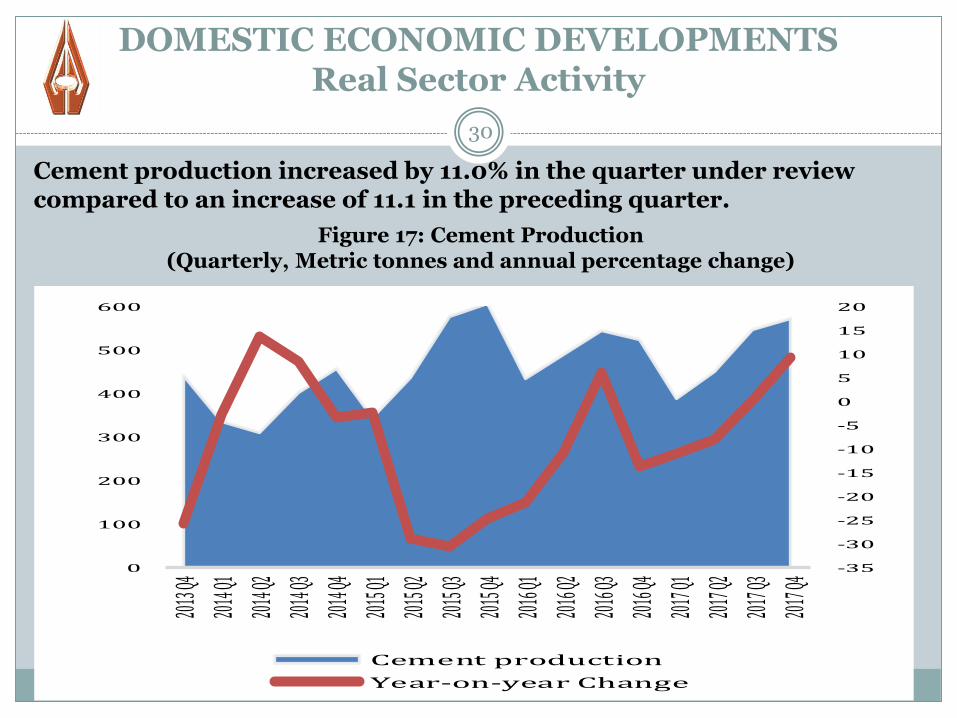
DOMESTIC ECONOMIC DEVELOPMENTSReal Sector Activity
Figure 17: Cement Production (Quarterly, Metric tonnes and annual percentage change)
Cement production increased by 11.0% in the quarter under review compared to an increase of 11.1 in the preceding quarter.
-35
-30
-25
-20
-15
-10
-5
0
5
10
15
20
0
100
200
300
400
500
600
2013 Q
4
2014 Q
1
2014 Q
2
2014 Q
3
2014 Q
4
2015 Q
1
2015 Q
2
2015 Q
3
2015 Q
4
2016 Q
1
2016 Q
2
2016 Q
3
2016 Q
4
2017 Q
1
2017 Q
2
2017 Q
3
2017 Q
4
Cement production
Year-on-year Change
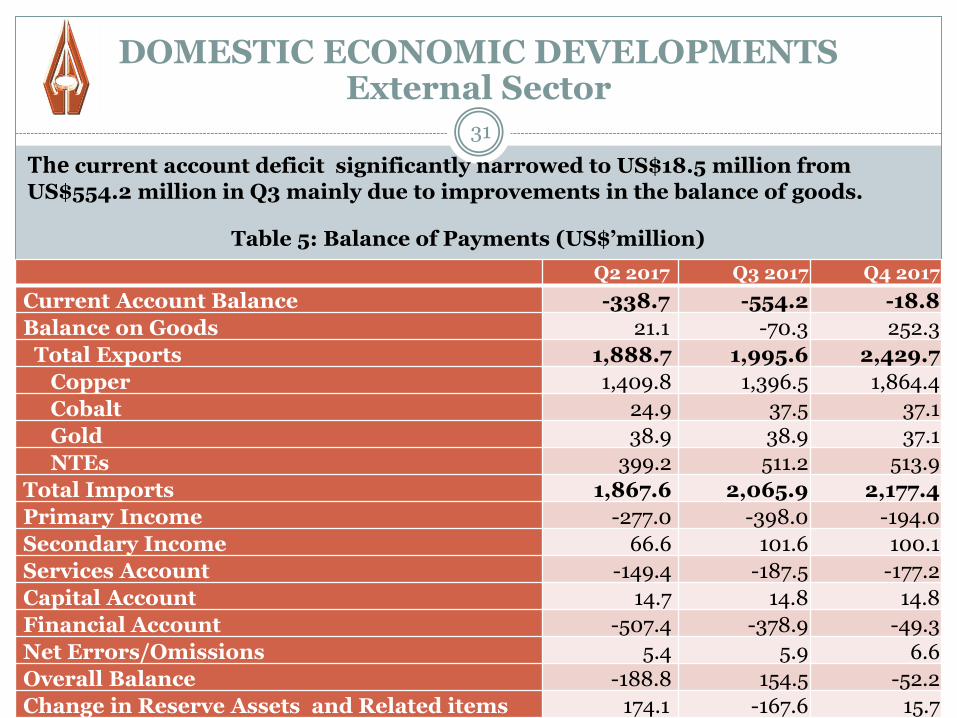
The current account deficit significantly narrowed to US$18.5 million from
US$554.2 million in Q3 mainly due to improvements in the balance of goods.
31
Table 5: Balance of Payments (US$’million)
DOMESTIC ECONOMIC DEVELOPMENTSExternal Sector
Q2 2017 Q3 2017 Q4 2017
Current Account Balance -338.7 -554.2 -18.8
Balance on Goods 21.1 -70.3 252.3
Total Exports 1,888.7 1,995.6 2,429.7
Copper 1,409.8 1,396.5 1,864.4
Cobalt 24.9 37.5 37.1
Gold 38.9 38.9 37.1
NTEs 399.2 511.2 513.9
Total Imports 1,867.6 2,065.9 2,177.4
Primary Income -277.0 -398.0 -194.0
Secondary Income 66.6 101.6 100.1
Services Account -149.4 -187.5 -177.2
Capital Account 14.7 14.8 14.8
Financial Account -507.4 -378.9 -49.3
Net Errors/Omissions 5.4 5.9 6.6
Overall Balance -188.8 154.5 -52.2
Change in Reserve Assets and Related items 174.1 -167.6 15.7
DOMESTIC ECONOMIC DEVELOPMENTSFiscal performance
32
Preliminary data indicate that Government spending remainedlower than budgeted in the fourth quarter due to shortfalls onnet external financing.
The deficit continued to be domestically financed throughGovernment securities.
In the fourth quarter, net domestic financing through issuanceof Government securities amounted to K2.5 billion, a declinefrom K3.0 billion in the third quarter.
DOMESTIC ECONOMIC DEVELOPMENTSInflation
33
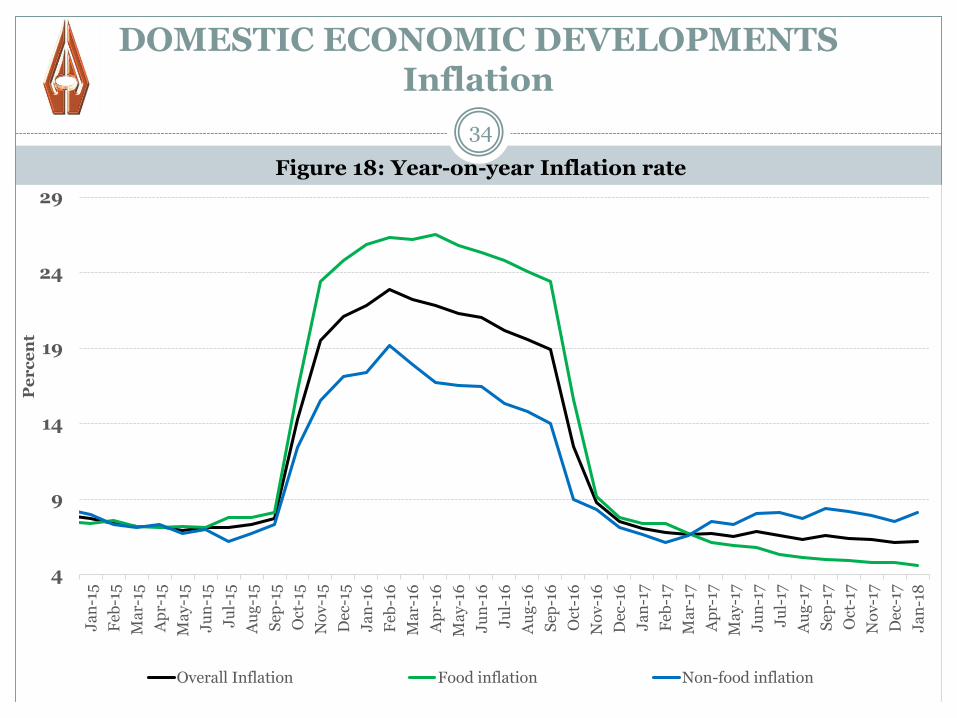
During the fourth quarter, inflation declined to an average of 6.3% from 6.5% in third quarter of 2017.
In December, inflation was 6.1%, 0.5 percentage point lower than the September 2017 outturn of 6.6%. In January 2018, inflation marginally rose to 6.2% (Figure 18).
During the review period, both food and non-food inflationdeclined to averages of 4.8% and 7.8% from 5.1% and 8.1% in thethird quarter.
Abundant supply of food items and subdued demand in theeconomy accounted for the reduction in inflation in the fourthquarter of 2017.
34
DOMESTIC ECONOMIC DEVELOPMENTSInflation
Figure 18: Year-on-year Inflation rate
4
9
14
19
24
29
Ja
n-1
5
Feb
-15
Ma
r-15
Ap
r-15
Ma
y-1
5
Ju
n-1
5
Ju
l-15
Au
g-1
5
Sep
-15
Oct
-15
No
v-1
5
Dec
-15
Ja
n-1
6
Feb
-16
Ma
r-16
Ap
r-16
Ma
y-1
6
Ju
n-1
6
Ju
l-16
Au
g-1
6
Sep
-16
Oct
-16
No
v-1
6
Dec
-16
Ja
n-1
7
Feb
-17
Ma
r-17
Ap
r-17
Ma
y-1
7
Ju
n-1
7
Ju
l-17
Au
g-1
7
Sep
-17
Oct
-17
No
v-1
7
Dec
-17
Ja
n-1
8
Pe
rc
en
t
Overall Inflation Food inflation Non-food inflation
DOMESTIC ECONOMIC DEVELOPMENTSInflation
35
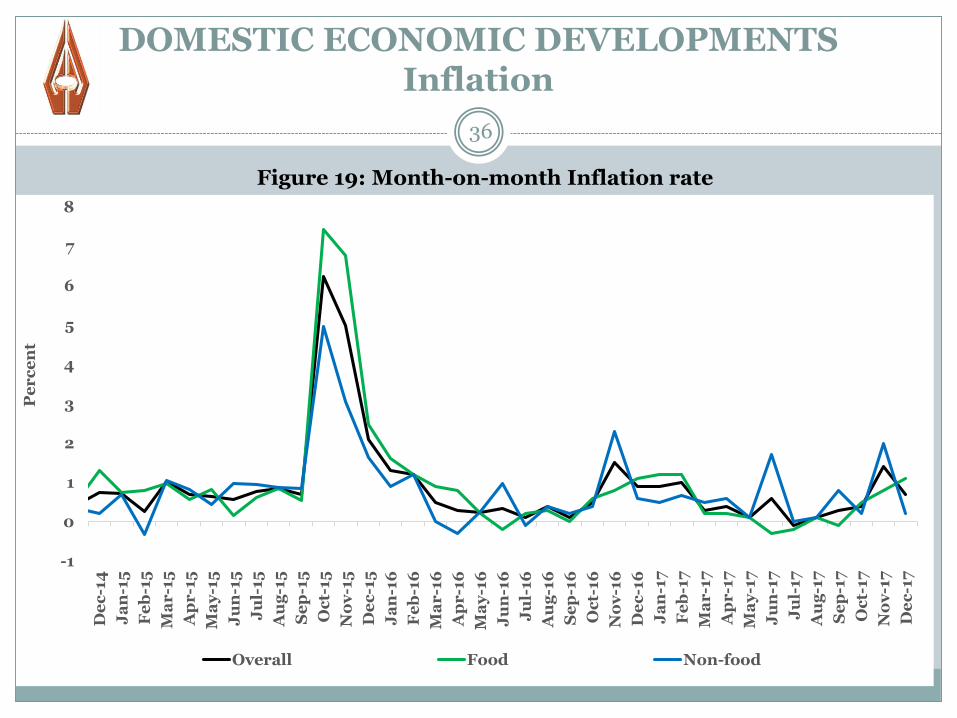
However, month-on-month inflation rose to an average of0.8% from an average of 0.1% in the third quarter of 2017 (seeFigure 19).
In December 2017, monthly inflation was recorded at 0.7%, upfrom 0.3% in September 2017 reflecting a rise in both food andnon-food inflation.
seasonal factors accounted for the increase in food inflationwhile increase in the prices of petroleum products was themain driver of non-food inflation.
DOMESTIC ECONOMIC DEVELOPMENTSInflation
36
Figure 19: Month-on-month Inflation rate
-1
0
1
2
3
4
5
6
7
8
De
c-1
4
Ja
n-1
5
Fe
b-1
5
Ma
r-1
5
Ap
r-1
5
Ma
y-1
5
Ju
n-1
5
Ju
l-15
Au
g-1
5
Se
p-1
5
Oc
t-15
No
v-1
5
De
c-1
5
Ja
n-1
6
Fe
b-1
6
Ma
r-1
6
Ap
r-1
6
Ma
y-1
6
Ju
n-1
6
Ju
l-16
Au
g-1
6
Se
p-1
6
Oc
t-16
No
v-1
6
De
c-1
6
Ja
n-1
7
Fe
b-1
7
Ma
r-1
7
Ap
r-1
7
Ma
y-1
7
Ju
n-1
7
Ju
l-17
Au
g-1
7
Se
p-1
7
Oc
t-17
No
v-1
7
De
c-1
7
Pe
rc
en
t
Overall Food Non-food
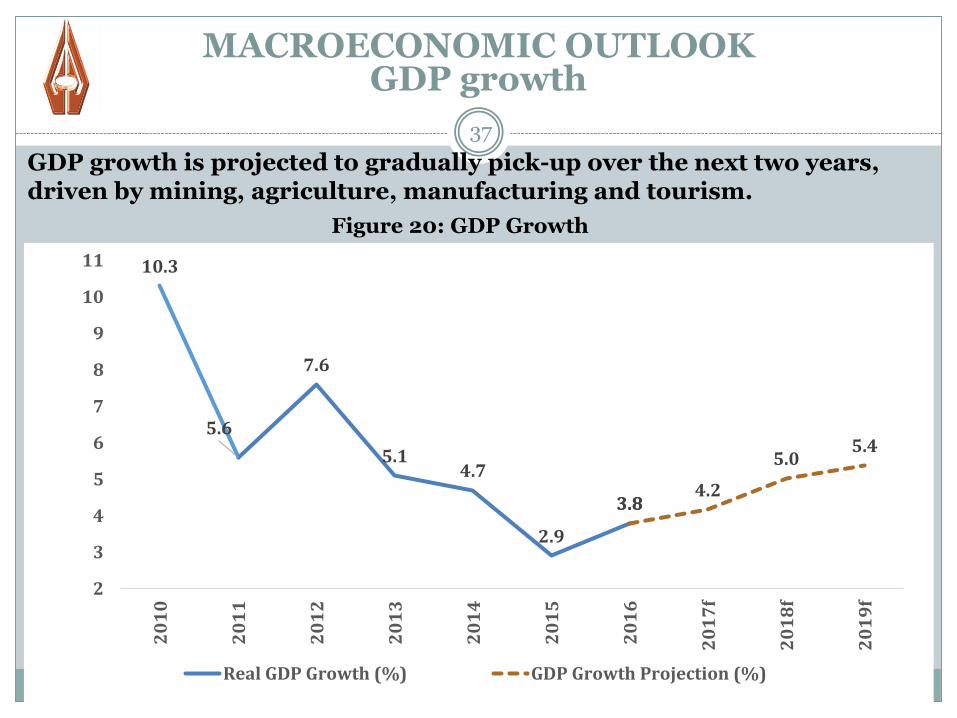
GDP growth is projected to gradually pick-up over the next two years, driven by mining, agriculture, manufacturing and tourism.
37
Figure 20: GDP Growth
MACROECONOMIC OUTLOOKGDP growth
10.3
5.6
7.6
5.14.7
2.9
3.83.84.2
5.05.4
2
3
4
5
6
7
8
9
10
11
20
10
20
11
20
12
20
13
20
14
20
15
20
16
20
17
f
20
18
f
20
19
f
Real GDP Growth (%) GDP Growth Projection (%)
MACROECONOMIC OUTLOOKInflation Outlook
38
Inflation is projected to remain low over the next eightquarters, around the 6% lower bound of the inflation targetrange.
However, risks to inflation are assessed to be on the upside,and these include the projected higher crude oil prices andpotentially lower agriculture production.
Despite these risks, inflation is projected to remain anchoredwithin the target range of 6-8% over the next two years.
39
In closing, the MPC noted that inflation has been decliningsince March 2016 following significant tightening of monetarypolicy in the fourth quarter of 2015.
Inflation projections have consistently been pointing to lowinflation, and this gave an opportunity to the MPC to commencethe loosening of monetary policy in February 2017.
This policy stance was and is still intended to support growthand promote financial stability.
The latest decision to further easy monetary policy should beseen in this context.
MACROECONOMIC OUTLOOKInflation Outlook

40
THANK YOU AND GOD BLESS…