Embed Size (px)
Citation preview

China in Global Value Chains: Implications for Industrial Policy and Development
Chun Jiang
Faculty Advisor: Gary Gereffi Sociology Department
August 2016
This project was submitted in partial fulfillment of the requirements for the degree of Master of Arts in the Graduate Liberal Studies Program in the Graduate School of
Duke University.

Copyright by
Chun Jiang
2016

iii
Abstract
Rapid technological advances and liberal trade regimes permit functional
reintegration of dispersed activities into new border-spanning business networks variously
referred to as global value chains (GVCs). Given that the gains of a country from GVCs depend
on the activities taking place in its jurisdiction and their linkages to global markets, this study
starts by providing a descriptive overview of China’s economic structure and trade profile. The
first two chapters of this paper demonstrate what significant role GVCs have played in China’s
economic growth, evident in enhanced productivity, diversification, and sophistication of
China’s exports, and how these economic benefits have propelled China’s emergence as the
world’s manufacturing hub in the past two decades. However, benefits from GVC participation –
in particular technological learning, knowledge building, and industrial upgrading – are not
automatic. What strategies would help Chinese industries engage with GVCs in ways that are
deemed sustainable in the long run? What challenges and related opportunities China would
face throughout the implementation process? The last two chapters of this paper focus on
implications of GVCs for China’s industrial policy and development. Chapter Three examines
how China is reorienting its manufacturing sector toward the production of higher value-added
goods and expanding its service sector, both domestically and internationally; while Chapter
Four provides illustrative policy recommendations on dealing with the positive and negative
outcomes triggered by GVCs, within China and beyond the country’s borders. To the end, this
study also hopes to shed some light on the lessons and complexities that arise from GVC
participation for other developing countries.

iv
Contents
Abstract ................................................................................................................... iii
List of Acronyms ....................................................................................................... v
Acknowledgements ................................................................................................ vii
Introduction ............................................................................................................ 1
Chapter One: China’s Economic Development ....................................................... 4
Economic Profile
China’s Role in Global Value Chains
Chapter Two: Economic Upgrading in China: a Historical Overview .................... 14
First Phase: 1978-1984
Second Phase: 1984-2001
Third Phase: 2001-2010
Chapter Three: A GVC Perspective on China’s Current Industrial Policy .............. 23
Policy Shifts: 2010-Present
China’s Current GVC-Oriented Industrial Policies
Consolidate Traditional Key Manufacturing Industries
Foster Emerging Strategic Industries
Accelerate the Growth of Services
Chapter Four: The Challenges and Opportunities Posed by GVCs ....................... 45
Conclusion ............................................................................................................. 59
Appendix ............................................................................................................... 61
Bibliography .......................................................................................................... 64

v
List of Acronyms
Abbreviation Terminology Explanation
GVC Global Value Chain
A concept in development literature that describes the full range of activities undertaken to bring a
product or service from its conception to its end use and how these activities are distributed over
geographic space and across international borders
FDI Foreign Direct Investment
An investment made by a company or individual in one country in business interests in another country, in the form of either establishing business operations or acquiring business assets in the other country, such
as ownership or controlling interest in a foreign company
PPP Purchasing Power Parity
A theory in economics that approximates the total adjustment that must be made on the currency
exchange rate between countries that allows the exchange to be equal to the purchasing power of each
country's currency
IP Intellectual Property Creations of the intellect for which a monopoly is
assigned to designated owners by law
SOE State-Owned Enterprise A legal entity that is created by the government in
order to partake in commercial activities on the government's behalf
M&A Mergers and Acquisitions
Transactions in which the ownership of companies, other business organizations or their operating units
are transferred or combined (A merger means a combination of two companies to form a new company. An acquisition is the purchase
of one company by another in which no new company is formed.)
SEI Strategic Emerging Industry
Seven innovative industries (energy efficiency and environmental conservation, next generation
information technology, biotechnology, high-end equipment manufacturing, new energy, new
materials, and new-energy vehicles) that just began to develop in China, whose expansion reflects China's
intent to upgrade its economy away from traditional industries reliant on low-skilled labor

vi
TiS Trade in Services
Trade that covers 1) services supplied from one country to another (e.g. call center services), 2)
consumers or firms making use of a service in another country (e.g. through international tourism), 3) a
foreign company setting up subsidiaries or branches to provide services in another country (e.g. a bank
setting up a branch overseas), 4) individuals travelling from their own country to supply services in another (e.g. a consultant traveling abroad to provide an IT
service)
OBOR One Belt One Road
A development strategy that focuses on connectivity and cooperation among countries primarily between China and the rest of Eurasia, which consists of two
main components, the land-based "Silk Road Economic Belt" and oceangoing "Maritime Silk Road" (The initiative involves 65 countries, representing a
third of the world’s total economy and more than half the global population.)
AIIB Asian Infrastructure Investment
Bank
A China-initiated international financial institution, created to offer finance to infrastructure projects and other productive sectors (e.g. transportation, energy
and power, telecommunications, agriculture development, water supply and sanitation,
environmental protection, urban development and logistics) in Asia.
(The Bank was formally established in December 2015, and signed by 57 Prospective Founding
Members as of September 2016.)

vii
Acknowledgements
This thesis becomes a reality with guidance and assistance from many
individuals. I would like to extend my sincere gratitude to all of them.
Foremost, I would like to express my deepest appreciation to my supervisor,
Prof. Gary Gereffi for imparting his knowledge and expertise in this study. He consistently
encouraged me to do research on my own, but steered me in the right direction whenever
needed. Without his generous advice and persistent support during the course of my study, this
thesis could not have been completed.
I am greatly indebted to Dr. Donna Zapf and Dr. Kent Wicker for serving on my
committee, editing my paper, and most importantly, always showing confidence in my work
throughout the project. I also thank every faculty and staff of Graduate Liberal Studies, Duke
University, for their time and cooperation in the past few years.
I am grateful to the authors of the reprints included in this paper for the
permission they have given for reproduction here, and to authors for allowing me to use figures
from their publications.
Last but not least, I would like to express my special thank you to my family for
the unconditional love and encouragement, which keep me going in this research pursuit, as
well as in years ahead.

1
Introduction
In the early 1980s, when China gradually opened up to global markets, it was an
unknown frontier. The country, however, has witnessed miraculous economic growth over the
past two decades, due to its progressive participation in global value chains (GVCs). Joining GVCs
created a unique opportunity for rapid industrialization in China. Instead of establishing the
entire value chain domestically for an industry, China specialized in tasks where it has
comparative advantages, such as low-cost manufacturing capabilities, a huge and scalable
market, logistics and infrastructure improvements, and a favorable business climate. Today,
known as the world’s factory, and heavily dependent on low value-added processing exports,
China is no longer satisfied with its position in GVCs. Thus, the Chinese government has
implemented extensive industrial policies that guide resource allocation to strengthen
absorptive capacity and leverage GVC dynamics to encourage technology transfers and
knowledge spillovers. Put simply, upgrading to higher value-added segments of the value chain
is central to China’s current development plans. However, it is not an easy task. GVCs could
reinforce power asymmetries between developed and developing countries over time, thereby
locking the latter in low-skilled activities. For China, the absence of adequate innovation
capabilities and the lack of internationally competitive domestic firms have long hindered the
country moving to the head of GVCs. Responding to the challenges, the Chinese government has
made unprecedented investments in research and development (R&D) to promote indigenous
innovation. Meanwhile, the government has increased the country’s prominence in regional
value chains (RVCs) by substantially raising its outward foreign direct investment (ODI), which
provides a fast track to building national champions that could compete regionally, if not
globally.

2
In essence, China stands at a crucial juncture: is it to remain the preferred low-
cost assembly platform or will it become a stronghold of international (and increasingly regional)
competitiveness? At this point, there is no definitive answer as to whether China is able to work
through this stage of development. It is appropriate, however, to examine the process of China’s
economic upgrading and analyze the role and effectiveness of its industrial policies, which will
likely be a source of inspiration for other emerging economies seeking a viable alternative
growth path.
The first section of the paper describes the rise of China as a global economic
power, evident in its growing presence in GVCs, and identifies the critical factors that boosted
China’s brilliant success in attracting offshored manufacturing jobs and foreign direct
investment (FDI). The second section of the paper provides a historical overview of China’s
economic upgrading from 1978 to 2010, and examines the industrial policies that help China
enter GVCs, expand GVC participation, and acquire new competencies through GVCs. The third
section of the paper looks at China’s 12th Five-Year Plan (FYP), and analyzes the country’s
current GVC-oriented industrial policies: consolidating traditional key manufacturing industries,
fostering emerging strategic industries, and accelerating the growth of services both
domestically and internationally. This section also discusses how China strengthens the
absorptive capacity of domestic actors, in order to move up the value chain, in both higher-
value added products (services outsourcing, R&D in high-tech industries), and activities within
existing industries (increasing functional capabilities, establishing backward linkages). The last
section of the paper provides illustrative policy recommendations on dealing with the
opportunities and challenges posed by GVCs, within China and beyond the country’s borders.
The purpose of this paper is to 1) identify China’s development trajectory
through a comprehensive analysis focusing on the country’s export performance and industrial

3
upgrading; 2) assess the effectiveness of the policies and mechanisms deployed by the Chinese
government to improve productive and innovative capacities for better competing in GVCs; and
3) provide Chinese authorities with policy options to ensure that GVC participation helps
accelerate industrialization and development
Thus, the paper should be of interest to policymakers and the public in China
who want to understand the benefits and risks of using GVC-oriented industrial policies to
achieve long-run prosperity. This paper should also be of interest to leading firms in developed
countries who want to understand the effects of China’s industrial policies on international
trade flows and respond to Chinese industrial policies effectively. Last but not least, this paper
should be of interest to international organizations, such as the World Bank (WB) and the World
Trade Organization (WTO), who can provide guidance for other developing countries based on
China’s experience and lessons.
To write this paper, I read and analyzed over 80 policy documents, development
plans, reports, and statistical digests in English and Chinese, to capture the current state of
knowledge and debate. I got accesses to trade data from UN Comtrade, WB’s World
Development Indicators, OECD’s Trade in Value Added (TiVA) database, etc. to demonstrate
China’s increasingly dominant position in GVCs. I also got access to the national yearly statistical
books, which enable me to illustrate the role and effectiveness of Chinese industrial policies.

4
I. China’s Economic Development
A. Economic Profile
Since initiating the Reform and Open-Door Policy in the late 1970s, China has
been on a catch-up growth trajectory. From 1978 to 2014, the country’s gross domestic product
(GDP) increased at an average annual rate of 9.81 percent (see Figure 1), which has made it an
economics superpower. By the end of 2014, accounting for 16.3 percent of global economy,
Figure 1: China's Real GDP Growth (annual %), 1978-2014
Source: Author's illustration with data from the IMF, World Economic Outlook
China surpassed the United States as the world’s largest economy (see Figure 2), although its
annual expansion of 7.4 percent barely undershot Beijing’s target for the first time since 1998,
when the economy was buffeted by the Asian financial crisis.
Figure 3 indicates that as of 2014, a little less than half of China’s GDP originated
in the services sector, while 42.6 percent and 9.2 percent were from manufacturing and
agriculture, respectively.

5
Figure 2: Shares of World GDP based on PPP (%), Major Economies, 1980-2014
Source: Author's illustration with data from Quandl's IMF Database
Figure 3: Sectoral Composition of China's GDP, 2014
Source: National Bureau of Statistics of China

6
By the mid-1980s, primary industry was losing ground, being overtaken by
tertiary industry; the two curves form a virtual mirror image, with agriculture’s share shrinking
as the share of services shoots upward (see Table 1). However, facing the twin issues of rising
market demand and domestic industry limitations, most recently, more Chinese investors are
seeking synergies in the overseas food sectors. This means modern agriculture will feature
prominently in Chinese economy in coming years.
Table 1: China's Distribution of GDP across Economic Sectors, Value Added (%)
Series 1980 1985 1995 2005 2014
Primary Industry1 30.1 28.5 19.8 12.6 9.2
Secondary Industry2 48.5 43.1 47.2 47.5 42.6
Tertiary Industry3 21.4 28.4 33 39.9 48.2
Source: National Bureau of Statistics of China, 2015
China’s rise to manufacturing preeminence has been astonishing. In seventh
place, trailing Italy, as recently as 1980, China displaced the United States, ranking first in
manufacturing value added at $1.92 trillion in 2010,4 and has since steadily widened its lead by
creating $2.74 trillion for 2013.5 The genesis of this sectoral dominance can be traced back to at
least the early 1960s. The Chinese government pursued an autarchic development strategy on
ideological grounds, and this strategy targeted heavy industries (Yusuf and Nabeshima 2010).
During the 1980s, the emerging domestic capabilities, accompanied by external technology
transfers, stimulated the development of the secondary industry with export potential and
1 Primary industry: an industry involved in the extraction and collection of natural resources, such as agriculture, oil and gas extraction, mining, forestry, and fishing. 2 Secondary industry: an industry that converts the raw materials provided by primary industry into products and commodities, such as textiles, steel production, telecommunications, automobile manufacturing. Assembling large items from parts is also part of secondary industries. 3 Tertiary industry: an industry that provides services to the consumer, such as banking, retailing, healthcare, education, and transportation. 4 Source: United Nations National Accounts Main Aggregates Database, available at http://unstats.un.org/unsd/snaama/resQuery.asp, accessed in August 2015 5 The estimate is calculated in U.S. dollars, and China’s rise relative to the United States is partially due to the fact that its currency, the Yuan, strengthened 25% against the dollar between 2003 and 2013.
7
increased the salience of light manufactures, for example, textiles, footwear, toys, and furniture,
where China enjoyed a comparative advantage in cheap labor and geographical proximity. Over
the last two decades, China has experienced a significant transition, diversifying rapidly into the
assembly of high-tech electronics and machinery (see Figure 4), whereas the formal pillar
industries are currently battling overcapacity and environmental challenges.
Figure 4: China’s Manufactured Exports by Technology Intensity, 1985-20146
Source: Author's illustration with data from the UN Comtrade
Compared with the secondary industry, the tertiary industry has maintained
growth at a relative high rate and has become increasingly important as a driver of China’s
economy. It rose by 1.3 percentage points to reach 48.2 percent of total GDP in 2014, leading
the secondary industry by 5.6 percentage points (see Table 1). According to the national
6 Sanjaya Lall (2000) developed a technological classification of goods exports based on 3-digit Standard International Trade Classification (SITC) categories. He divided manufacturing exports into four groupings: resource based manufactures, low technology manufactures, medium technology manufactures, and high technology manufactures. His article provides the detailed list of products under each category (See Appendix I).
8
statistics, 2013 was the first year services (which include manufacturing services on physical
inputs, transportation, traveling, construction, business services and scientific research, among
other things) are poised to become the country’s biggest sector, a major turning point for an
economy long over-dependent on exports and heavy industry, now rebalancing its demand
toward domestic consumption, and betting on intangible tasks to deliver future jobs and returns.
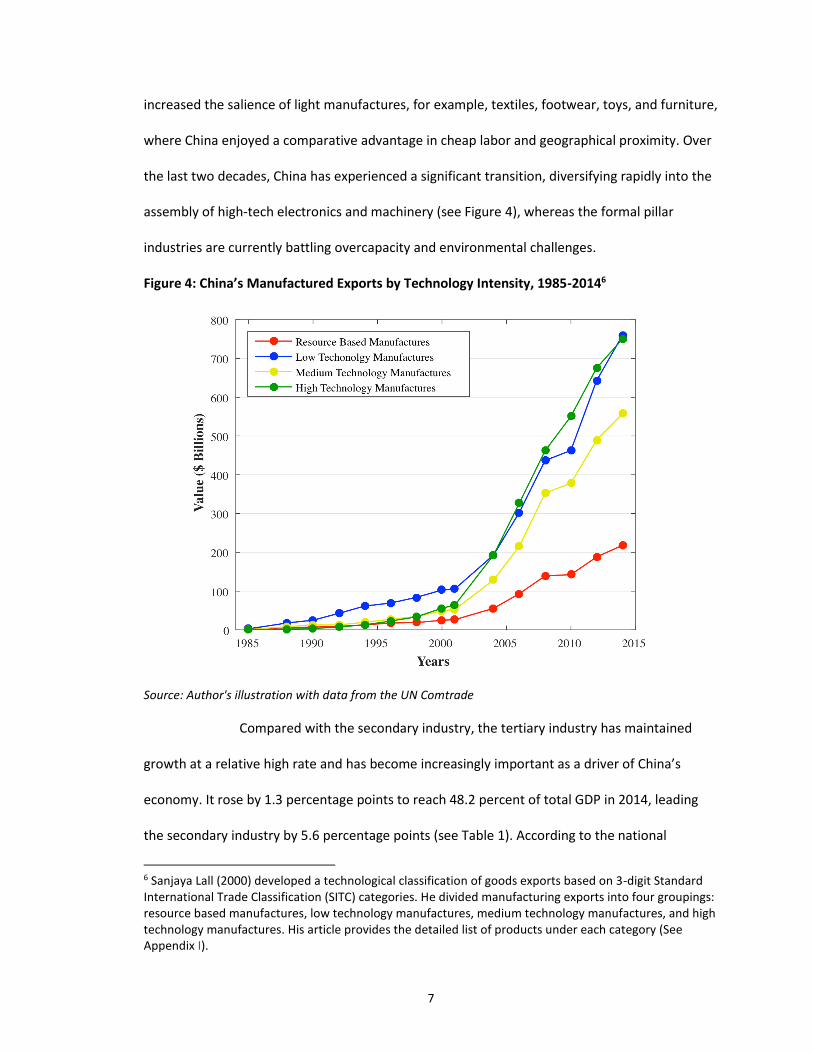
Despite its stable growth, the role of tertiary industry in China’s GDP has lagged
well behind that of developed economies such as the United States, where services generate
78.1 percent of output and approximately 80 percent of employment in 2012 (see Figure 4).
Moreover, other studies found China’s tertiary industry to be low for its own level of
development (Park and Shin 2012).7
Figure 4: Sectoral Composition of United States’ GDP, 2013
Sources: World Development Indicators Database & U.S. Bureau of Labor Statistics
7 An Asian Development Bank study shows that the share of GDP originating in services in China throughout the reform era is below the share predicted based on the relationship between the growth of per capita GDP and the share of services in 12 Asian economies.

9
B. China’s Role in Global Value Chains
Globalization has entered a new phase since the 1970s. Leading firms and
governments have been part of a far-reaching economic transformation, attributed to
accelerated advances in information and communication technology (ICT), and successive
rounds of trade liberalization. More importantly, the differentials between countries with
respect to the cost of input factors (e.g. raw material, infrastructure, competencies in
manufacture, marketing and logistic) have facilitated the spread of global value chains (GVCs).8
For emerging economics, joining GVCs has unlocked the opportunity to participate in
international trade without having to develop the full range of capabilities across the value chain,
essentially “compressing” the development experience and making non-linear catch up possible
(Sturgeon and Memedovic 2010). Furthermore, by opening up access to new and often higher
value markets, these countries have been enabled to acquire skills, technologies and knowledge
– all considered as key factors for productivity enhancement and industrial upgrading.
As GVCs have expanded in scope and complexity, China has clearly benefited
and has experienced a spectacular growth in exports. Although the value of China’s commercial
services exports was only $204.7 billion, in 2013, still falling short of global norms, the country
already surged ahead of the advanced industrial countries in terms of merchandise export
performance. Between 1978 and 2013, the global export market shares of United States and
Japan fell by 2.77 percent and 3.72 percent, respectively. In contrast, China’s merchandise
8 The value chain describes the full range of activities that firms and workers do to bring a product from its conception to its end use and beyond. This includes activities such as design, production, marketing, distribution and support to the final consumer. The activities that comprise a value chain can be contained within a single firm or divided among different firms. Value chain activities can produce goods or services, and can be contained within a single geographical location or spread over wider areas. (The Global Value Chains Initiative, available at http://www.globalvaluechains.org/concepts.html, accessed in August 2015)

10
exports rose from 0.76 percent to 11.74 percent of the world total during the same period.9 In
2014, the value of merchandise exports of China increased moderately to $2.34 trillion, which
was 1.5 times the value of exports of United States, the second largest exporter. Among the
emerging economies, in the same year, China’s gross exports were even more than combined
exports of South Korea ($572.7 billion), Russia ($497.8 billion), Mexico ($397.5 billion), India
($321.6 billion) and Brazil ($225.1 billion).10 Looking closely at China’s major trading partners in
2014 (see Table 2), the roles of East Asian countries, and ASEAN nations have been striking. It
suggests that China’s emergence as a regional leader constitutes an irresistible outcome of its
remarkable trade influence.
Table 2: Top Seven Trading Partners of China in 2014 ($ Billions)
Country Total Trade Chinese Exports Chinese Imports China's Trade Balance
European Union 614.8 370.9 243.9 127
United States 549.2 396.1 153.1 243
ASEAN 479.8 271.7 208.1 63.6
Hong Kong 376.1 362.2 12.9 350.3
Japan 312.2 149.5 162.7 -12.2
South Korea 293.7 100.4 193.3 -92.9
Taiwan 198.6 46.3 152.3 -106
Source: Global Trade Atlas, 2015
However, conventional bilateral trade statistics lead to the double counting
implicit in GVCs, where intermediate products cross boundaries frequently. China’s domestic
value-added content of its exports was merely 67.8 percent in 2011, the second lowest in the
G20. As illustrated in Figure 5, the strong position of China in GVCs, as reflected in export figures,
does not necessarily mean the country is creating a great share of the value generated along
GVCs.
9 Author's calculation with data from World Trade Organization Statistics Database on International Trade in Merchandise and Commercial Services, available at http://stat.wto.org/CountryProfile/WSDBCountryPFReporter.aspx, accessed in September 2015 10 Author's calculation with data from World International Trade Database, accessed in September 2015

11
Figure 5: Domestic Value Added Share of Gross Exports by Countries, 1995-2011
Source: Author's illustration with data from OECD Statistics11
It has long been a central challenge for China to seek more of the higher-value-added functions
that are being hived off into GVCs.
Apart from an enormous growth in trade, Chinese development model is also
associated with its impressive ability to attract foreign direct investment (FDI) and to expand
outward foreign direct investment (ODI). The annual FDI flows to China jumped from $2 billion
in 1985 to $128 billion in 2014 (see Figure 6) as the top destination for FDI, followed by Hong
Kong and the United States. As shown in Table 3, services currently take up a greater share of
FDI than the manufacturing sector. In 2014, services attracted US$66.2 billion in FDI, up 7.8
percent year-on-year. It is worth noting that the growth of service sector FDI reflects an
underlying shift in China’s economy.
11 Source: OECD Trade in Value Added (TiVA) Database, available at https://stats.oecd.org/index.aspx?queryid=66237, accessed in August 2015

12
Figure 6: Annual FDI Inflows to China, 1985-2014
Source: Author's illustration with data from the UN Database12
Table 3: China's FDI Breakdown by Industries, 2010-2014
Year Service Sector Manufacturing Sector Others
2010 46.1 46.9 7.0
2011 47.6 44.9 7.5
2012 48.2 43.7 8.1
2013 52.3 38.7 9.0
2014 55.4 33.4 11.2
Source: MOFCOM, NBS, SAFE13
Note: Others include the sectors of agriculture, forestry, animal husbandry, fishing, etc.
12 Source: United Nations Conference on Trade and Development (UNCTAD) Data: FDI Inflows by Region and Economy, 1985-2014, available at http://unctad.org/Sections/dite_dir/docs/WIR2016/WIR16_tab01.xlsx, accessed in August 2015 13 Source: Ministry of Commerce of the People’s Republic of China, National Bureau of Statistics of the People’s Republic of China, State Administration of Foreign Exchange: 2014 Statistical Bulletin of China’s Outward Foreign Direct Investment, China Statistic Press, 2015.

13
Evidently, China’s ODI has become increasingly influential globally. First,
between 2002 and 2013, China’s total ODI flow increased from to $2.7 billion to $107.8 billion,
as Chinese firms, especially state-owned enterprises (SOEs), which account for 70 percent of
China’s non-financial ODI, have been stepping up their investment spree overseas. Non-financial
ODI in 2014 reached US$102.9 billion, an annual increase of 14.1 percent, albeit at a slightly
slower pace than in previous years (see Table 4). Second, China’ ODI is shifting focus from
Table 4: ODI of China, 2013-2014 ($ Billions)
2013 2014 % Change
Total ODI Flows of China (US$ billion) 107.8 120.0 11.30%
Non-Financial ODI of China (US$ billion) 90.2 102.9 14.10%
Revenue from China’s Overseas Contracting Projects (US$ billion)
137.1 142.4 3.80%
Source: MOFCOM, 201514
acquiring natural resources in regions like sub-Saharan Africa and Latin America. Chinese firms,
instead, are expanding overseas investment in different directions – both sectorally and
geographically, with the intent of moving away from low-margin manufacturing and building
downstream competencies closer to the end-consumer. Third, in 2014, the Chinese government
launched several national strategic initiatives, such as the “One Belt and One Road” and the
Asian Infrastructure Investment Bank (AIIB), that led to massive ODI opportunities in the
infrastructure space, as well as symbolizing China’s leadership in regional integration.
14 Source: Ministry of Commerce of the People’s Republic of China, National Bureau of Statistics of the People’s Republic of China, State Administration of Foreign Exchange: 2014 Statistical Bulletin of China’s Outward Foreign Direct Investment, China Statistic Press, 2015.

14
II. Economic Upgrading in China: a Historical Overview
Economic upgrading is defined as “the process by which economic actors —
nations, firms, and workers — move from low-value to relatively high-value activities in global
production networks” (Gereffi 2005, p.171).
China entered global markets in the 1980s, following a landmark decision by the
government aimed at widening foreign economic relations with the outside world. Initially,
China’s exports were concentrated in primary and resource-based products. The proportion of
those, however, declined steadily, as manufactured exports expanded rapidly. In a very short
period of time, China has been at the center of global value chains, particularly in low-
technology manufacturing sectors, premised on leveraging its comparative advantages given the
abundance of low-cost labor and the facilitating role of government. In the mid-1990s, high-
technology manufactured exports have become the most dynamic part of growth, but the actual
value added in the production of these high-technology manufactures was somewhat negligible,
since China, in many cases, performed only final assembly. Building a national innovation system
(NIS) to induce research and development (R&D), and technical services (including information
service, testing service, training service, etc.) was encouraged by the Chinese government from
the early 2000s. This process enabled China to move its economy decisively beyond assembly to
activities with potentially greater value added.
Most recently, the considerable cost arbitrage provided by cheap labor and
capital has propelled the offshoring of services in much the same way as it did in the
manufacturing sector (Gereffi and Fernandez-Stark 2010). China has thus begun to play a
significant role in providing offshored services to advanced industrial nations. According to its
national strategy (12th Five-Year Plan), the Chinese government commits to a more proactive
opening-up strategy in key services subsectors such as finance, logistics, education, and

15
healthcare, and it aims to rank among the top exporters for tourism and construction, in which
it has revealed a competitive advantage.
To give a better understanding of how China achieved its current position in
GVCs, this chapter will provide a historical overview of the evolution of China’s industrial policies
and development trajectories, from 1978 to 2010 (see Table 8).
A. First Phase: 1978-1985
China’s planned economy strategy was reversed with the launch of the Reform
and Opening-Up Policy at the end of 1978. A series of steps have been taken since then: 1)
Beijing decentralized economic policymaking regarding trade to provincial governments or
regional foreign trade corporations, 2) Four Special Economic Zones (SEZs), Shenzhen, Zhuhai,
Shantou, and Xiamen, near Hong Kong and Macao, were established in 1980 to boost exports, 3)
Administrative restrictions on exports and imports have been replaced by tariffs, quotas, and
licensing (Wei 1993), 4) Fourteen costal cities (including Dalian, Qinhuangdao, Tianjin, Yantai,
Qingdao, Lianyungang, Nantong, Shanghai, Ningbo, Wenzhou, Fuzhou, Guangzhou, Zhanjiang,
and Beihai) were designated in 1984 to attract FDI.
In 1978, China’s share of the world’s exports represented only 0.75 percent.
Although it had grown to 1.25 percent in 1984, almost 78 percent of Chinese exports consisted
of primary products or manufactured items that were based on natural resources. Japan was
China's most natural trading partner15, because China was well endowed with natural
resources that Japan lacked, notably petroleum products, and in return, Japan was expected to
15 Details of the Agreement and the negotiations leading up to it are in JETRO China Newsletter, No. 16, 178. The Agreement led to a second wave of mutual trade expansion, which included the signing of contracts for the Baoshan Steelworks project in Shanghai. But when China implemented the policy of “adjustment” in 1981, most large Japanese contracts were suspended while negotiations were undertaken leading to a 300 billion yen loan to enable China to cover payments on contracts that had been the result of such serious miscalculation. In the short run, the Chinese were able to resolve their problem, but in the longer perspective the contract cancellation of 1981 marked the end of the Japanese business community’s honeymoon with the China market (Howe 1996).
16
balance with exports of plant and machinery. During the same period, the pace of investment
flowing into joint ventures began to increase dramatically, 80 percent of which partnered with
Hong Kong. The transfer of facilities from Hong Kong to SEZs and other cities in the Pearl River
Delta largely contributed to this shift.
B. Second Phase: 1985-2001
Starting out as an exporter of primary and resource-based products in the first
half of the 1980s, China recast itself as the premier producer of low-technology manufactures,
primarily made up of various consumer goods – textiles, garments, footwear, toys, furniture,
and so forth. These products accounted for 60.3 percent of China’s manufactured exports in
1993, before settling to 42.6 percent in 2001 (see Figure 7). In addition, approximately 7 percent
of global manufacturing value added was contributed by China in 2001.16 China’s overwhelming
presence in low-technology manufactured exports may be due to a number of factors, the
deepening interdependence of world economy being one, and the cheap, abundant, and
disciplined labor force another.17 A few more deep-seated causes are briefly outlined below.
First, China’s trade policy has moved toward greater liberalization; the weighted average tariff
slashed from about 40 percent in 1985 to less than 10 percent in 2001 (see Table 5). Foreign
investors likewise enjoyed various privileges granted to SEZs, economic and technological
development zones (ETDZs), and export-processing zones (EPZs), for example, minimal
administrative restrictions, reduction in income taxes, and easier access to global markets.
Thanks to these preferential options, China gradually enhanced its production capacity in low-
technology industries through FDI and out-processing operations from developed countries,
particularly the first tier of Asian newly industrialized economies (NIEs).
16 Author’s calculation with data from UNIDO Scoreboard database, 2001 17 In China, industrial wages are on average 40 cents an hour – less than a third of the average in Mexico and Malaysia, and one quarter of Thailand’s average (Magariños et al 2002).

17
Figure 7: Composition of China’s Manufactured Exports, 1985-2014
Source: Author's Illustration with Data from the UN Comtrade
Table 5: China's Weighted Average Tariffs, 1985-2001
Year Weighted Average
1985 42.1
1992 40.6
1995 26.8
1998 15.7
2001 9.1
Source: Authors’ Compilation from China’s Customs Data,
United Nations Conference on Trade and Development (UNCTAD) Database
Second, many of China’s production networks have operated seamlessly
through firm-specific (Appelbaum 2008) and product-specific (Barboza 2004) supply-chain cities
(Gereffi 2009), facilitated by government incentives to turn scale-driven specialization into a

18
competitive advantage. In the textile and apparel industry,18 for instance, an increasing number
of vertically integrated factories, chiefly located in the Guangdong and Fujian provinces,
acquired responsibility for carrying out full-package production (prototype development, design,
textiles purchase, apparel manufacturing, distribution & package, branding, retail). They also
attracted supporting industries (yarn dealers, sewers, pressers, packager, and freight forwarders)
that can minimize transaction costs and simultaneously foster more flexible supply chain
management (Frederick and Gereffi 2011).
Third, the Chinese government has provided an ongoing growth platform
through high levels of public investment in infrastructure (ranging from transportation,
electricity to storage facilities) and workforce development to bolster the productivity and
quality of manufactured products. Several complementary developments, including
urbanization and the organizational skills forged by the central government, also have made it
possible to translate raw industrial capacity into capability. These explained why a significant
number of investors remained in China, even though the labor cost has been clearly going up,
compared with lower wage courtiers like Vietnam and Bangladesh.
C. Third Phase: 2001-2010
As the global financial crisis hit in 2008, China’s export growth substantially
slipped from an average of 21.9 percent per annum between 2001 and 2007 to under 10
percent per annum in the next three years. Meanwhile, China’s shift in favor of technology-
intensive products became evident from the rising shares of exports of telecommunications
equipment, automatic data processing machines, and electrical machinery, which coincided with
a flow of new electronic products feeding a seemingly insatiable demand worldwide. Since 2001,
the high-technology manufactured exports have sharply grown at an average annual rate of 49
18 The Chinese government started promoting the textile and apparel industry as a key growth sector in the 1980s. It had served as a dominant role in China’s low-technology manufactured exports for decades.
19
percent, amounting to $550 billion in 2010 (see Figure 4 and Figure 8). As a result, China
elbowed out competitors around the world to emerge as the leading exporter of high-
technology manufactures, with a 30 percent share of global exports. Underlying this remarkable
performance were China's accession to the WTO that sparked a greater engagement within
GVCs, and ever-finer specialization of production that allowed China to fit into and evolve along
with specific industries.
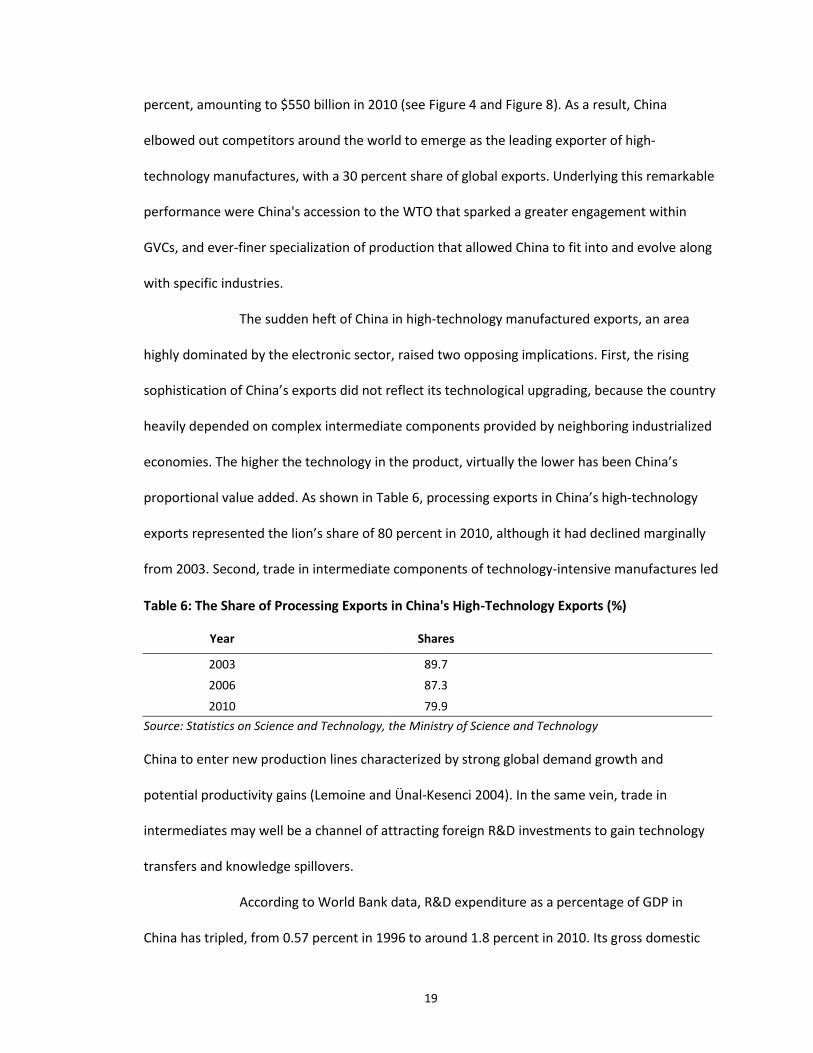
The sudden heft of China in high-technology manufactured exports, an area
highly dominated by the electronic sector, raised two opposing implications. First, the rising
sophistication of China’s exports did not reflect its technological upgrading, because the country
heavily depended on complex intermediate components provided by neighboring industrialized
economies. The higher the technology in the product, virtually the lower has been China’s
proportional value added. As shown in Table 6, processing exports in China’s high-technology
exports represented the lion’s share of 80 percent in 2010, although it had declined marginally
from 2003. Second, trade in intermediate components of technology-intensive manufactures led
Table 6: The Share of Processing Exports in China's High-Technology Exports (%)
Year Shares
2003 89.7
2006 87.3
2010 79.9
Source: Statistics on Science and Technology, the Ministry of Science and Technology
China to enter new production lines characterized by strong global demand growth and
potential productivity gains (Lemoine and Ü nal-Kesenci 2004). In the same vein, trade in
intermediates may well be a channel of attracting foreign R&D investments to gain technology
transfers and knowledge spillovers.
According to World Bank data, R&D expenditure as a percentage of GDP in
China has tripled, from 0.57 percent in 1996 to around 1.8 percent in 2010. Its gross domestic

20
expenditure on R&D jumped from $4.9 billion to $106.3 billion during the same period (See
Figure 10). In order to boost R&D intensity, a combination of subsidies and tax incentives
Figure 10: Gross Domestic Expenditure on R&D in China and the United States, 1996-2012
Source: Author's calculation with data from the World Development Indicators (WDI)
were granted by the Chinese government.19 Simultaneously, policies to support intellectual
property (IP) rights have also been remarkably upgraded. In 2008, the State Council General
Office issued an outline of the national IP strategy, aiming to strengthen the capabilities of
indigenous innovation as well as improve IP rights protection within multinational corporations
(MNCs). In addition to government support and preferential policies, there has also been
sufficient local talent and expertise, strong technological capabilities, and advanced
infrastructure in China, as part of a greater push to attract more foreign R&D. By 2010, at least
19 These incentives include: 1) reduced corporate income tax rates for high and new technology enterprises (HNTEs), 2) a super deduction of eligible R&D expenditures, 3) tax concessions for advanced technology service enterprises, 4) customs duty and value-added tax exemption or refund for purchases of R&D equipment (KPMG 2012).

21
1200 R&D centers were founded by Multinational Companies (MNCs) in China, which
represented 3 percent of developed countries’ global R&D investments (Simon 2010). Most of
them were associated with electronic appliances and software, but lately also chemicals,
telecommunications and pharmaceuticals (see Table 7).
Table 7: Major R&D Centers Founded by MNCs in China, by Industries
Industries MNCs Year Location
Electronic Appliances
Intel 1994 Shanghai
3M 1994 Shanghai
General Electric 2003 Shanghai
Software
IBM 1995 Beijing
Microsoft 1998 Beijing
Hewlett Packard 2002 Shanghai
Chemicals
Dow 2004 Shanghai
DuPont 2005 Shanghai
Proctor & Gamble 2010 Beijing
Telecommunications France Telecom 2004 Beijing
Vodafone 2005 Beijing
Pharmaceuticals
Johnson & Johnson 1994 Shanghai
Pfizer 2005 Shanghai
Novartis 2009 Shanghai
Source: Author’s illustration based on Company Websites

22
Table 8: China’s Role in Global Value Chains, 1978-2015
Time
Period Background Government Policies
Advantages Key Exports Industry (Growth
Rate)
Technology Content of
Exports
New Exports Partners
Disadvantages Benefits Comparative Advantage
Competitive Advantage
First Phase
1978-1985
Growth of North-South Trade (trade
between industrialized and deindustrialized
countries)
The Reform and Opening-Up Policy
A Source of Energy Supplies
Petroleum Resource-
Based Manufactures
Hong Kong; Japan
Short of Natural Resources
1. Growth of Exports;
2. An Initial Rise in Foreign Exchange
Reserves
Second Phase
1985-2001
1. Globalization’s 2nd Unbundling (led by labor cost arbitrage and ICT revolution);
1. Trade & FDI Liberalization;
A Vast Reservoir of Cheap Labor
1. SEZs, ETDZs, EPZs, etc.;
Consumer Goods: Textiles,
Garments, Footwear, Toys, Furniture, etc.
Low-Technology
Manufactures
United States;
European Union
1. Poor Product Quality and Workplace
Safety (compared to international standards);
Accelerated Production
Capacity
2. Asian NIEs 's Concentration Shifted
from Low-Tech to High-Tech Industries;
2. Government Investment in
Infrastructure and Transportation;
2. Great Infrastructure and Logistics;
2. Environmental Degradation;
3. Bilateral Trade Agreements (e.g.
MFA&ATC)
3. Urbanization and Supply-Chain Cities
Strategies
3. Low-cost Manufacturing
Capabilities
3. Social Issues (e.g. artificial urbanization,
income inequality, etc.)
Third Phase
2001-2010
1. China’s Accession to the WTO;
1. Rising Sophistication and Diversification of
China’s Exports; A Hugh Internal Market (scale of
economies)
1. Adequately Skilled Labor;
Electronics
Mid- and High-
Technology Manufactures
Global
1. Low Domestic Value Added;
1. Improved Absorptive Capacity;
2. Growth of GVCs, characterized by
Trade in Tasks
2. Attracting Foreign R&D (through
Workforce Development and IPR
Protection)
2. Advanced Infrastructure
2. Absence of Internationally
Competitive Domestic Industrial Players
2. Technology Transfers
Fourth Phase
2010-present
1. Growth of Regional Value Chains;
1. Promoting Indigenous Innovation
(R&D); Geographical
Proximity
At the Center of GVCs in
Manufacturing
1. Electronics Mid- and
High-Technology
Manufactures
Regional
Lack of Internal Innovation Capability (particularly in basic
research)
Knowledge Spillovers 2. Growth of IT-
Enabled Services Offshoring
2. Seeking Overseas Investment and M&A (e.g. OBOR initiative,
AIIB)
2. Construction
Source: Author

23
III. A GVC Perspective on China’s Current Industrial Policy
A. Policy Shifts
Although China’s economic growth is still the envy of most countries, it has
slowed since 2010. The country’s growth rates have consecutively declined from double-digits
to 6.9 percent in the last quarter of 2015. At least two interpretations of the data are possible.
One is that the Chinese economy has been inevitably spiraling downward, given its explosive
growth in the previous decades. As a rule of thumb, the bigger an economy gets, the harder it is
to keep growing at a fast clip. The other is that the Chinese economy has been undergoing a
long-awaited and welcome structural adjustment. Various policy measures taken by the Chinese
government to reorient its growth model are depressing the figures, but should ultimately lead
to a more inclusive prosperity.
It is widely believed that China’s impressive economic performance depended
heavily on exports and investment; however, as imbalances and vulnerabilities continued
building up, this pattern of growth was considered no longer sustainable. As mentioned earlier,
China was well positioned to capture world export markets by exploiting its comparative
advantages, especially low labor costs and deliberate currency undervaluation. These
advantages are gradually eroded, as evidence suggests that the country’s yearly manufacturing
wages have risen by nearly 170 percent between 2010 and 2015,20 and the Yuan has
appreciated by more than 26 percent against a trade-weighted basket of currencies during the
same period.21 Recently, China is losing its role as the “world’s factory,” as the category of low-
end manufacturing has fled to even cheaper locales in Bangladesh, Vietnam, and Cambodia.
Meanwhile, China’s credit-fueled investment boom is reaching its limits. Responding to the
20 Data from China National Bureau of Statistics, accessed in November 2015 21 Data from Bank of International Settlements Effective Exchange Rate Indices, available at http://www.bis.org/statistics/eer/tables_i.pdf, accessed in November 2015

24
global financial crisis, the Chinese government launched a 4 trillion RMB ($586 billion) stimulus
package, involving direct spending in infrastructure and real estate, and expansion of social
welfare provisions,22 in an attempt to maintain the country’s output and employment growth.
This stimulus elevated China to the world’s largest economy (on a purchasing power parity
basis), but simultaneously caused a host of problems: soaring debt levels, particularly among
local governments and SOEs; massive overcapacity in manufacturing sectors; and a clearly
overstretched financial system.
Having recognized the problems, the Chinese government cut its GDP growth
target to an annual rate of 7 percent, a significant if widely anticipated turning point from the
country’s previous emphasis on headline growth. Furthermore, the Chinese government made
these challenges key reference points for development strategy in the 12th Five-Year Plan (12th
FYP, 2011-2015).23 First, domestic-consumption engines drive economic growth in the homeland.
Second, industrial restructurings are under the guidance of the Chinese government. Specifically,
China devoted unprecedented attention to upgrading traditional industries by consolidation and
overseas expansion, to developing new strategic industries by supporting technology innovation,
and to shifting its core focus of economic activity away from low- and medium-tech
manufacturing toward services. Third, ensuring energy and environmental sustainability,
without compromising the country’s economic development, remains a top priority. Fourth,
physical and social infrastructure projects enjoy the most significant government investment
(see Table 9).
22 The central government committed to directly fund only 1.18 trillion RMB of the investment, about 30 percent of the overall program. Moreover, the program seemed to include some projects and money that in fact had already been committed, particularly the 1 trillion RMB that was earmarked for earthquake reconstruction (Naughton 2009, p.2). 23 The National People's Congress endorsed China’s 12th Five-Year Plan on 14 March 2011. The plan, laying out national social and economic policies for the next five years, focused on promotion of domestic consumption, industrial upgrading, and economy restructuring.

25
Table 9: Selected Domestic Policies in China's 12th Five-Year Plan (2011-2015)
Priorities Policy Summary Policy Goals
Domestic Consumption
Urbanization Urbanization Rate to Increase by around 1 Percent
per Year, up 4 Percentage Points
Increase Income Reduction of Regional Disparities in Economic
Development
Transformation of Industries
Modernize Agriculture
Consolidate Traditional Key Manufacturing Industries
Foster Seven Strategic Emerging Industries (SEIs)
ESIs as a Proportion of GDP to Increase to 8 Percent from 2 Percent
Accelerate the Growth of Services Service Sector as a Proportion of GDP to Account
for 47 Percent, up 4 Percentage Points
Green Development & Environmental
Protection
Carbon Dioxide Standard Carbon Dioxide Emission Per Unit of GDP to Reduce
by 17 Percent
New Energy Structure
Energy Consumption Per Unit of GDP to Reduce by 16 Percent
Non-Fossil Energy of Total Energy Use to Increase to 11.4 Percent
Social Upgrading
Public Service - Healthcare, Education, Housing
Jobs
More than 45 Million Jobs to be Created in Urban Area
Urban Registered Unemployment to be Kept No Higher than 5 Percent
A Stronger Social Safety Net
Transportation and Trade Infrastructure
High-Speed Rail: 40,000 km Set to be Completed
National Expressway Network: 83,000 km Set to be Increased
Port: 2,214 Deep Water Berths Set to be Constructed in Coastal Ports
Source: Author’s illustration based on China's 12th Five-Year Plan, 14 March 201124
24 Available at http://www.britishchamber.cn/content/chinas-twelfth-five-year-plan-2011-2015-full-english-version, accessed in August 2015

26
This chapter will focus on analyzing the role and effectiveness of China’s current
GVC-related industrial policies, which aim at expediting structural transformation of the Chinese
economy, and illustrating the choices and challenges facing the country, which impact China’s
potential economic upgrading trajectory.
B. China’s Current GVC-Related Industrial Policies
1. Consolidate Traditional Key Manufacturing Industries
In January 2012, the State Council released the Industrial Restructuring and
Upgrading Plan (2011-2015).25 The plan specifies quantitative consolidation goals in eight
traditional manufacturing industries, ranging from automotive, steel, cement, shipbuilding,
electrolytic aluminum, rare earths, electronics and information to pharmaceuticals (see Table
10). Chief among them were pillar industries of China as promulgated in the previous five-year
plans, but currently identified as needing consolidation to manage excess capacity and to
increase functional capabilities. The plan also vows to promote strong alliances between
competitive companies through cross-region merger and restructuring, and overseas
acquisitions, aiming to create national manufacturing champions that could better compete
internationally.
Table 10: Selected Policy Goals in Traditional Key Manufacturing Industries by 2015
Industries Policy Goals
Automobile
Concentrating 90% of production in top 10 corporations;
Cultivating 3 to 5 major automobile corporations with core competency;
Supporting large automobile corporations to extend to service business including R&D, modern logistics, automobile finance, and information service;
Conducting cross-border M&A at right timing and developing global production and service network.
25 Available at http://www.gov.cn/zwgk/2012-01/18/content_2047619.htm, accessed in August 2015

27
Steel
Concentrating 60% of production in top 10 corporations;
Cultivating 3 to 5 major steel corporations with core competency and international impact;
Cultivating 6 to 7 steel corporations with regional influence;
Encouraging steel corporations to participate in foreign steel companies’ M&A and reorganization.
Cement
Concentrating 35% of production in top 10 corporations;
Cultivating 3 to 4 corporations with the annual clinker production capacity over 100 million ton, well-developed industrial chains, core competency, and international impact;
Encouraging vertical mergers and integrating businesses in consulting, testing, R&D, engineering and design, installation and project contracting.
Shipbuilding
Concentrating 70% of production in top 10 corporations;
5 corporations entering world top 10 shipbuilding corporations;
Cultivating 5 to 6 major contractors on marine equipment with international influence;
Promoting leading corporations to conduct overseas M&A.
Electrolytic Aluminum
Concentrating 90% of production in top 10 corporations;
Cultivating 3 to 5 corporations with international competency.
Rare Earths
Following the State Council’s “Guideline for the Development of Rare Earths Industry” (issued in May, 2011),26 including industry entry restriction and export control;
Significantly reducing the amount of corporations in mining and refining.
Electronics and Information
Cultivating 5 to 8 corporations with annual sales above 100 billion RMB ($16 billion);
Attempting to build corporations with annual sales above 500 billion RMB ($83 billion);
Developing a number of branded multinationals mastering core technology, strong innovation capability and international competency;
Actively extending business from manufacturing to service, pushing the integration of product manufacturing and software/information service, and the integration of manufacturing and operations.
Pharmaceutical
Concentrating 50% of annual sales in the medicine industry into top 100 corporations;
Concentrating 80% of market share for basic drugs in top 20 companies.
Source: The Industrial Restructuring and Upgrading Plan (2011-2015) The Guiding Opinions on Pushing Forward Enterprise M&A and Reorganization in Key Industries27
26 Available at http://www.gov.cn/zwgk/2011-05/19/content_1866997.htm, accessed in August 2015

28
In the 1990s, China began to facilitate consolidation in the textile and apparel
industry, where the country had had mature processing capacity and enormous market gains
worldwide. Since then, certain drivers, both market pressure and direct government
interventions, have made consolidation one of the central themes in China’s efforts to
restructure its industries and strengthen its position in GVCs.
Overcapacity has been a blight on China’s industrial landscape for years. As of
2015, China’s steel production is nearly triple the next three largest producers – Japan, India,
and the United States.28 Over 60 percent of capacity in China’s aluminum industry is now
suffering negative cash flow.29 Obviously, one of the principle reasons to expect consolidation is
to stem towering overcapacity. In the shipbuilding industry, for example, the Chinese
government has halted approvals of new shipbuilding facilities, tightened lending to shipyards,
and mandated mergers and acquisitions (M&A). As a result, throngs of speculative and less
capable yards filed for bankruptcy. 93.3 percent of China’s total new-building tonnage of
11.97M DWT concentrated in 51 leading shipyards, predominantly state-owned, in the first 5
months of 2016.30 In the other traditional manufacturing industries, similarly, major SOEs are
standing out and then seeking business opportunities abroad, as the phasing-out process has
27 The Guiding Opinions on Pushing Forward Enterprise M&A and Reorganization in Key Industries was jointly issued by China’s Ministry of Industry and Information Technology (MIIT) and China’s National Development and Reform Commission (NDRC) in January 2013. It added instructions on nurturing corporations, state-owned enterprises (SOEs) in particular, with “core competence” and “international influence.” 28 Source: Crude Steel Production Data Jan-Dec 2015 vs. 2014, World Steel Association, available at https://www.worldsteel.org/dms/internetDocumentList/steel-stats/2015/Crude-steel-production-Jan-Dec-2015-vs-2014_/document/Crude%20steel%20production%20Jan-Dec%202015%20vs%202014.pdf, accessed in February 2016 29 China’s Aluminum Smelters Said to Meet to Discuss Cutbacks, Bloomberg, December 9, 2015, available at http://www.bloomberg.com/news/articles/2015-12-09/china-s-aluminum-smelters-said-to-meet-to-discuss-output-cuts, accessed in December 2015 30 Source: China Association of the National Shipbuilding Industry, available at http://www.cansi.org.cn/index.php/Information/detail?id=436&PHPSESSID=aadd4f6ed954e2a8a1689a9760031dd2, accessed in May 2016

29
been hastened.31 These policy measures, however, triggered the concern that China would
redouble efforts to boost SOEs, thereby rolling back the gradual shift in the last two decades
toward a more private sector-led industrial structure.
Functional upgrading, identified as one of the most important channels for
China to build its own brand recognitions, is another driver for consolidation. In Guiding
Opinions on Pushing Forward Enterprise M&A and Reorganization in Key Industries (Opinions)
issued in January 2013, the Chinese government encouraged three of the eight industries —
automobile, cement, and electronics and information — to extend their business into more
intangible value-added activities (see Table 10). Instead of just remaining in specialized niches
(e.g. low value-added assembly), where the country already has a solid grip, China is now
exploiting upstream (e.g. R&D, design, and supply management) or downstream (e.g.
distribution, marketing, and after-sales services) or both, to reduce its vulnerability to external
shocks, and tap its domestic and regional markets with compressed margins.
This is clearly reflected in the Chinese automotive industry: 1) In the 1990s,
there was a veritable flood of foreign investment into China’s automotive market to establish
final assembly lines through joint ventures (JVs) with state-owned automakers.32 2) In 2002,
shortly after China joined the WTO, those JVs were permitted to participate in distribution and
after-sales services in five Special Economic Zones and eight major cities.33 Some of the Chinese
partners have quickly acquired respectable manufacturing capabilities, as well as necessary
knowledge and expertise in distribution, marketing and services. 3) To further achieve
31 Although the central government has been encouraging consolidation for decades, some of the key traditional manufacturing industries are still balkanized, with each province promoting its own local champion to increase employment and tax revenue. 32 During the 1990s, China’s automobile market was dominated by three foreign joint ventures—VW’s joint venture with SAIC, and with FAW, in addition to PSA Peugeot Citroen’s joint venture with Dongfeng (Tang 2009). 33 Five Special Economic Zones: Shenzhen, Zhuhai, Shantou, Xiamen, and Hainan; Eight Major Cities: Beijing, Shanghai, Tianjin, Guangzhou, Dalian, Qingdao, Zhengzhou, and Wuhan

30
technological independence, in March 2009, the Automotive Industry Readjustment and
Revitalization Plan34 calls for 10 billion RMB in special funds to develop indigenous R&D for
engines, key auto parts and components, and alternative energy vehicles (see Figure 11). These
investment and efforts quickly paid off.
Figure 11: Upgrading Stages for Chinese Vehicle Manufacturers, Mid-1990s – Present
Source: Author
China became the world’s leading country in terms of vehicles production and
sales by 2009. Over 21 million passenger cars were produced by Chinese manufacturers in 2015,
up from 1.4 million in 1995,35 representing the epitome of the nation’s industrial sophistication.
Ironically, however, no Chinese car brand has yet won global acclaim; many indigenous
automakers are actually facing hurdles even competing in the domestic market. Part of the
reason is that they have been aggressively attempting to control the entire value chain, which
could be extremely inefficient, especially for an infant industry in the context of GVCs, where
34 The Automotive Readjustment and Revitalization Plan, one of 10 announced by the State Council in addition to 4 trillion RMB stimulus package, released on March 20, 2009 35 Source: OICA, available at http://www.oica.net/category/production-statistics, accessed in February 2016

31
competitive improvements usually come by shifting to more value-added tasks associated with
the industry, rather than capturing all aspects of the industry.
Consolidation is taking place not only within a country, but also across borders.
As a latecomer, China was conspicuously absent from the international M&A scene until 2008.
On the one hand, the global economic crisis triggered a sea change in foreign attitudes toward
Chinese investors. While, on the other hand, the Chinese government has since actively pursued
strategic partnerships with industrialized nations beyond natural resource extraction, on the
other. As shown in the Opinions, the Chinese government explicitly encouraged the firms that
had been well leveraged at home, in the automotive, the steel, and the shipbuilding industries,
to build core competitiveness in technological and commercial capabilities through cooperation
with their counterparts in developed countries (see Table 10). For example, in June 2009,
China’s largest privately owned automaker, Zhejiang Geely Automobile Holding Group (Geely)
acquired Australian company Drivetran Systems International (DSI), the world’s second largest
independent transmission manufacturer.36 Thanks to this M&A, Geely became one of the first
Chinese automakers to develop a six-speed automatic transmission, and has continually
invested in R&D to design a high-torque seven-speed and a dual clutch transmission. Not
surprisingly, plenty of financial incentives offered by central and provincial authorities, and
state-owned banks lie behind this “Go Global” strategy. In December 2010, Geely completed the
acquisition of Swedish-based Volvo from Ford Motor Company (Ford) for $1.8 billion. To finance
the deal, Geely secured $2.1 billion of loans from Bank of China, China Construction Bank,
Export-Import Bank of China, and the government of Gothenburg, where Volvo is
headquartered (Morcillo 2010).
36 Economist Intelligence Unit, “Industry Report: Automotive, July 2009.”

32
Like Geely, a considerable number of Chinese firms have benefited from
overseas M&A transactions by gaining access to established brands, global distribution
networks, best industry practices, and frequently, intellectual property. However, at the same
time, many Chinese enterprises are still facing pitfalls, as they seek global expansion via cross-
border M&A. This is in part because foreign companies normally separate national security
concerns from competition enforcement as a regulatory factor for inbound acquisitions, and
thus are highly skeptical of China’s state-owned capitalism. In addition, foreign companies are
sensitive, and sometimes reluctant, to sharing knowledge and technologies with Chinese
competitors, who might encroach on their core competencies. Aside from these specific risks,
creating synergy between two brands has proven to be arduous in general, due to the
differences in corporate culture, organizational structure, and management style.
2. Foster Strategic Emerging Industries
The notion of fostering strategic emerging industries (SEIs) was first proposed by
China’s State Council in the Decision on Accelerating the Development of Strategic Emerging
Industries (Decision) in October 2010. The Decision identifies seven industries the central
government targets (see Appendix II), and establishes a quantitative objective for SEIs to
generate 8 percent of GDP by 2015 and 15 percent by 2020.37 In May 2015, the State Council
released the Made in China 2025 (MiC2025),38 the first 10-year initiative to comprehensively
drive China’s industries up the value chain. Considered as a successor to the Decision, the
MiC2025 not only reiterates that R&D and innovation must be core features of SEI development,
but also broadens the scope of SEIs further. As illustrated in Table 11, ten priority industries
37 The State Council Decision on Accelerating the Development of Strategic Emerging Industries, officially released on October 18, 2010, available at http://www.gov.cn/zwgk/2010-10/18/content_1724848.htm 38 The Made in China 2025 (MiC2025) was modeled on Germany's "Industry 4.0" plan, the core of which is intelligent manufacturing. The MiC2025, officially released on May 19, 2015, available at http://www.gov.cn/zhengce/content/2015-05/19/content_9784.htm, accessed in March 2016

33
were highlighted for national attention – two of them align with China’s unflinching
determination to pursue green and sustainable growth,39 five of them are consistent with
China’s pragmatic ambition to climb the ladder of manufacturing sophistication and “build an
innovative-type country,”40 and the rest of them reflect China’s intention to occupy higher levels
of GVCs by promoting infrastructure investment both within and outside the country.
Table 11: Strategic Industries Listed by the Decision vs. the MiC2025, with Ultimate Goals
Decision (2010) MiC2025 (2015) Ultimate Goals
Energy Efficiency & Environmental Conservation Energy Saving & Clean-energy
Vehicles Green and Sustainable Growth New-Energy Vehicles
New Energy Power Equipment
Biotechnology Biomedical & High-performance
Medical Devices
Indigenous Innovation41
New Materials New Materials
Next Generation Information Technology
Next Generation Information Technology
/ Computer Numerical Control Tools
& Robotics
/ Agricultural Machinery
High-End Equipment Manufacturing
Aerospace Equipment
Global Competitiveness in Infrastructure
Advanced Rail Equipment
Marine Engineering Equipment & High-tech Ships
Source: Author’s illustration based on the “Made in China 2025”
To translate these goals into actions, the Chinese central and provincial
governments have revamped a slew of incentive policies on issues as broad ranging as taxation,
financial subsides, and human resources.
39 The MiC2025 calls for industrial value-added energy consumption to be reduced by 34 percent, carbon dioxide emissions by 40 percent, and water consumption by 41 percent. 40 The concept was raised in the CPC Central Committee's Proposal on Formulating the 12th Five-Year Program on National and Social Development, adopted on October 18 2010, at the Fifth Plenary Session of the 17th CPC Central Committee. 41 The MiC2025 identifies the goal of raising domestic content of core components and materials to 40 percent by 2020, and 70 percent by 2025.

34
Taxation
China’s High- and New-Technology Enterprises (HNTE) program is one of the
country’s core pro-SEI tax policies. The program offers eligible companies a reduced Corporate
Income Tax (CIT) rate of 15 percent (versus the standard 25 percent rate). To qualify for HNTE
status, according to the Guokefahuo [2016] No. 32 (Circular 32),42 a company shall meet
statutory criteria related to personnel qualifications,43 R&D expenses,44 and most importantly, IP
settlements.45 For foreign enterprises, the requirement of transferring core proprietary IP rights
to their Chinese subsidiaries may prevent them from fully managing their global IP in the ways
that are most appropriate for their business interests. But on the flip side, doing so would help
those subsidiaries quickly benefit from the diffusion of knowledge and technologies through
extraterritorial linkages in GVCs.
In addition to the HNTE program, the Chinese government has a powerful set of
tax incentives designed to bolster SEIs, including Value-added Tax (VAT) refunds, tax exemptions
and reductions, and R&D tax deductions. For example, China’s “predominantly industry-oriented”
tax incentive, which aims at promoting R&D and innovation in the encouraged industries would
allow a majority of SEI-oriented enterprises to enjoy a minimum 2-year exemption, followed by
a minimum 3-year 50 percent reduction (see Table 12). Moreover, in November 2015, China’s
42 The Guokefahuo [2016] No. 32: Administrative Measures for Certification of High and New Technology Enterprises Circular was jointly issued by China’s Ministry of Finance, the State Administration of Taxation (SAT), and the Ministry of Science and Technology, on January 29, 2016. Available at http://www.most.gov.cn/tztg/201602/t20160204_123994.htm, accessed in March 2016 43 A qualified HNTE must engage a minimum 10 percent of employees in R&D. 44 The R&D expense ratio requirement is lowered from 6 percent to 5 percent for small- and medium-sized enterprises (SMEs) with an annual sales revenue less than 50 million RMB. The R&D expense ratios for enterprises with an annual sales revenue between 50 million RMB and 200 million RMB, and enterprises with an annual sales revenue above 200 million RMB, remain unchanged at 4 percent and 3 percent respectively. 45 A qualified HNTE must own the technological intellectual property that is essential to the enterprise's production of products or provision of services. Such ownership may derive from proprietary R&D, purchase, donation, acquisition or other means, but intellectual property made available to an enterprise through an exclusive licensing arrangement would no longer qualify.
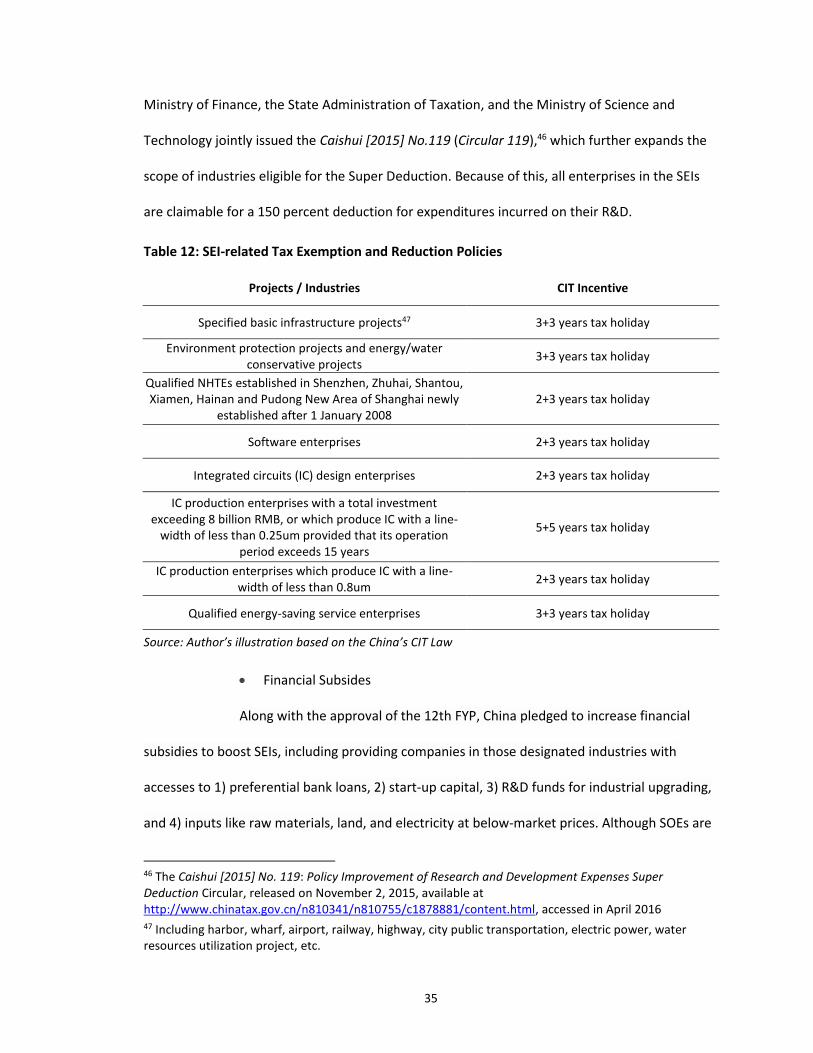
35
Ministry of Finance, the State Administration of Taxation, and the Ministry of Science and
Technology jointly issued the Caishui [2015] No.119 (Circular 119),46 which further expands the
scope of industries eligible for the Super Deduction. Because of this, all enterprises in the SEIs
are claimable for a 150 percent deduction for expenditures incurred on their R&D.
Table 12: SEI-related Tax Exemption and Reduction Policies
Projects / Industries CIT Incentive
Specified basic infrastructure projects47 3+3 years tax holiday
Environment protection projects and energy/water conservative projects
3+3 years tax holiday
Qualified NHTEs established in Shenzhen, Zhuhai, Shantou, Xiamen, Hainan and Pudong New Area of Shanghai newly
established after 1 January 2008 2+3 years tax holiday
Software enterprises 2+3 years tax holiday
Integrated circuits (IC) design enterprises 2+3 years tax holiday
IC production enterprises with a total investment exceeding 8 billion RMB, or which produce IC with a line-
width of less than 0.25um provided that its operation period exceeds 15 years
5+5 years tax holiday
IC production enterprises which produce IC with a line-width of less than 0.8um
2+3 years tax holiday
Qualified energy-saving service enterprises 3+3 years tax holiday
Source: Author’s illustration based on the China’s CIT Law
Financial Subsides
Along with the approval of the 12th FYP, China pledged to increase financial
subsidies to boost SEIs, including providing companies in those designated industries with
accesses to 1) preferential bank loans, 2) start-up capital, 3) R&D funds for industrial upgrading,
and 4) inputs like raw materials, land, and electricity at below-market prices. Although SOEs are
46 The Caishui [2015] No. 119: Policy Improvement of Research and Development Expenses Super Deduction Circular, released on November 2, 2015, available at http://www.chinatax.gov.cn/n810341/n810755/c1878881/content.html, accessed in April 2016 47 Including harbor, wharf, airport, railway, highway, city public transportation, electric power, water resources utilization project, etc.

36
still the main beneficiaries of subsidies, the central government recently decided to double the
amount of venture capital and set up a source of national start-up capital for SEIs,48 in a bid to
better ease the financing difficulties of small innovative enterprises, which have no assets to be
mortgaged. Subsidy contributions from local governments are even more substantial (see
Appendix III). For example, the Beijing municipal government has set aside $6.4 billion in
financial subsidies to upgrade new products and technologies in SEIs, with a focus on aerospace
equipment industry. Certain provinces that may lack a specific SEI funding pool already offer
subsidies through other programs that can be also used for the development of SEIs. The Hubei
Special Fund for Major Science and Technology Projects, and the Jiangsu Special Fund for
Software and Integrated Circuit Industries are examples of pre-existing local funding
mechanisms that could also support SEI-related R&D and innovation.49 However, as these
policies are transformed into measures, one important issue needs to be tracked carefully:
whether some financial subsidies could violate WTO agreements or any other international
trade rules.
Human resources
In June 2010, China unveiled its first national plan on human resources, the
National Medium- and Long-term Talent Development Plan (2010–2020),50 which aims to
expand the country’s pool of highly-skilled workers to 180 million by 2020, from 114 million in
2010 (see Table 13). This huge expansion flows from sustained investments in education. The
48 Source: China’s State Council, Startup fund to allocate assets more widely, Jan 15, 2015, available at http://english.gov.cn/premier/news/2015/01/15/content_281475039641414.htm, accessed in April 2016 49 The US-China Business Council, China’s Strategic Emerging Industries: Policy, Implementation, Challenges, and Recommendations, March 2013, available at https://www.uschina.org/sites/default/files/sei-report.pdf, accessed in April 2016 50 The National Medium- and Long-term Talent Development Plan (2010–2020), jointly issued by the Central Committee of the Chinese Communist Party and the State Council on June 6, 2010, available at http://www.gov.cn/jrzg/2010-06/06/content_1621777.htm, accessed in April 2016

37
Chinese government expenditure on education increased at an average of 23.2 percent per year
between 2005 and 2012,51 and it is expected to reach 4.4 percent of total GDP by 2020.
Table 13: Main Indicators of China’s Human Resource Development, 2008-2020
2008 2015 2020
Aggregate of human resources (10,000) 11385 15625 18025
R&D personnel per 10,000 labor (person/year) 24.8 33.0 43.0
Percent of highly skilled personnel in skilled labor 24.4 27.0 28.0
Percent of mainly working age population receiving tertiary education
9.2 15.0 20.0
Percent of human capital input in GDP 10.8 13.0 15.0
Personnel contribution 18.9 32.0 35.0
Source: Author’s illustration from the National Medium- and Long-term Talent Development Plan
Recognizing that building a competitive position in knowledge-intensive industries requires a
workforce with robust science and technology (S&T) capabilities, the Chinese government has
made great efforts to support STEM (science, technology, engineering and mathematics)
education initiatives across the country. Thus, in 2013, 40 percent of Chinese college graduates
have STEM degrees – more than twice the share of U.S. graduates.52 Understanding that human
capital is the major source of absorptive capacity, which is critical for domestic actors in
participating in and upgrading GVCs, the government has launched a series of talent programs
to attract elite professionals, particularly those who can take on leadership roles in China’s S&T
system. A case in point is the Thousand Talents Plan,53 which offers dedicated R&D funds, a
competitive salary, a housing subsidy and family resettlement to lure overseas talent to work in
51 Author’s calculation based on data from China Statistical Yearbook 2014, National Bureau of Statistics of the People’s Republic of China, available at http://www.stats.gov.cn/tjsj/ndsj/2014/indexeh.htm, accessed in April 2016 52 Source: Schleicher Andreas, OECD Directorate for Education and Skills, China Opens a New University Every Week, BBC News, March 16, 2016, available at http://www.bbc.com/news/business-35776555, accessed in April 2016 53 Details of the program available at http://www.1000plan.org/en/topnotch.html, accessed in April 2016
38
the country. Moreover, the Chinese government is also widening the categories of people
eligible for a Chinese green card, and establishing its first immigration office to encourage
domestic companies to hire directly from the international market.
3. Accelerate the Growth of Services
As demand from global markets declines, slowing exports of manufactured
goods from China means the country must increasingly rely on domestic markets for sustainable
growth. Compared to the manufacturing industry, services that include transportation, real
estate, education, healthcare, etc. – are geared more toward domestic markets. Because of this,
services-led growth, for the first time, is acting as a direct instrument for rebalancing the
Chinese economy. In the 12th FYP, China set out an explicit target of expanding the services
share of GDP from 43 to 47 percent by end-December 2015 (see Table 9), although it remains
short of the 55 percent share that a middle-income economy typically possesses.54 In the 12th
FYP, China also committed to a more proactive opening-up strategy in service sector, aiming to
enlarge the scale of trade in services (TiS) to reach a target of $600 billion in 2015.
No one can deny that increasing the share of output generated from services
can spur China’s development in many ways:
1) Employment Growth: The service sector in China requires roughly 30 percent
more workers per unit of GDP than do manufacturing and construction (Roach 2013), which
would allow the country to achieve its labor-absorption objectives, namely employment,
urbanization, and poverty reduction, even as its economic growth slows. As shown in Table 14,
services contributed 40.6 percent of employment in 2014. Further, the service sector in general
demands higher knowledge and more diversified skills, compared with the agriculture and
54 Source: author’s calculation based on data from World Bank, World Development Indicators, available at: http://data.worldbank.org, accessed in September 2016

39
manufacturing sectors. Therefore, a move to more sophisticated high-end services such as
information technology, business, and finance would benefit a large portion of the surplus
college graduates in China.55
Table 14: China's Distribution of Employment across Economic Sectors (%)
Primary Industry Secondary Industry Tertiary Industry
1978 70.5 17.3 12.2
1985 62.4 20.8 16.8
1995 52.2 23.0 24.8
2005 44.8 23.8 31.4
2010 36.7 28.7 34.6
2014 29.5 29.9 40.6
Sources: National Bureau of Statistics of China, 201556
2) Consumption Boom: Powered by the growth of the upper-middle class in
China, spending on services is projected to increase 11 percent annually through 2020.
Accounting for 51 percent of total incremental consumption, services will overtake goods as the
chief engine by then. Although China is still woefully inadequate on virtually all counts,
compared with quintessential services-based economies, the untapped potential of China’s
embryonic, albeit rapidly growing service sector is huge. This is especially true for the healthcare
industry, where the need to expand is particularly vital for an aging Chinese population.
According to Fulin Chi, the President of the China Institute for Reform and Development, China’s
annual demand of healthcare services for the elderly is estimated to reach 1 trillion Yuan, but
the current annual supply is only 100 billion Yuan, which leaves the market wide open.
55 According to the Ministry of Human Resources and Social Security of the People’s Republic of China, the number of college graduates in China reached a record high of 7.49 million in 2015. And the Chinese government expects to have a total of 195 million college graduates in the labor force by 2020, compared with a total projected labor force of 167 million in the United States. 56 Available at http://www.stats.gov.cn/tjsj/ndsj/2015/indexeh.htm, accessed in December 2015

40
3) Energy and Environmental Sustainability: Services simply require less energy
and resources than does manufacturing – critical for improving energy efficiency, a key objective
on quality agenda of China’s 12th PYP. In addition, services also have a minimal carbon
footprint, helping the Chinese government reduce environmental degradation, and cap
greenhouse gas emissions by 2030,57 eventually winning the “War against Pollution.”
4) More Value-Added: As illustrated in the Stan Shih’s Smiling Curve (see Figure
12), value creation is unevenly distributed among activities, normally concentrating at upstream
and downstream ends. To put it another way, services generate the highest value-added, while
Figure 14: Stan Shih’s Smiling Curve
Source: Author’s illustration based on Baldwin, 201258
57 China formally committed to peaking CO2 emissions by 2030 at the latest, in its “Intended Nationally Determined Contribution” (INDC), submitted on 30 June, 2015. Available at http://www4.unfccc.int/submissions/INDC/Published%20Documents/China/1/China's%20INDC%20-%20on%2030%20June%202015.pdf, accessed in February 2016 58 Richard Baldwin, “Global Supply Chains: Why They Emerged, Why They Matter, and Where They are Going,” Center for Trade and Economic Integration Working Paper, 2012

41
production contributes the least. From a GVC perspective, the share of TiS is higher than
understood on a value-added basis, because services are not just embedded at the point of
merchandise sale (e.g. maintenance, repair, product insurance, and other after-sales services) –
delivered alongside the product, but also integrated across R&D, design, distribution, and
marketing (e.g. training, logistics, communications, and other technical expertise) – delivered
within the product (Stephenson 2013). According to WTO statistics, services account for around
40 percent of world trade, almost double what is presently attributed to them in official
statistical publications (Meng and Miroudot 2011).
In order to create new competitive advantages, as well as, take a higher position
in GVCs, China has devoted great effort to the TiS development: 1) China’s State Council has
designated thirty-one “Service Outsourcing Demonstration Cities” since 2009.59 These cities
have adopted various tax and financial incentives to promote TiS, and will become the country’s
major bases for global outsourcing activities. 2) The central and local governments have
invested heavily in industrial parks, and most recently, free trade zones (FTZ), which allow easier
investment access and greater openness in service sectors. For example, the changes to
Customs regulations (e.g. duty-free imports, storage, and re-exports), combined with financial
reforms (e.g. convertibility of RMB on the capital account, and lower thresholds for the
establishment of foreign banks and financial leasing companies) taking place in the Shanghai FTZ
has shaped the outlook for logistics, finance, and telecommunications services. 3) The Ministry
of Commerce (MOFCOM), the Ministry of Finance (MOF), the General Administration of
Customs (GAC) jointly issued the Guidance Catalogue of Key Development Fields of Service
59 Source: The Shangfumaosi [2016] No. 208: Notification on Increasing Service Outsourcing Demonstration Cities, available at http://chinasourcing.mofcom.gov.cn/policy/47/69490.html, accessed in September 2016

42
Outsourcing Industry (Catalogue)60 in July 2016, aiming to promote China’s competitiveness in
service outsourcing. Among the total twenty-four key development fields specified in the
Catalogue, ten are of Information Technology Outsourcing (ITO) category, six are of Business
Process Outsourcing (BPO) category, and eight are of Knowledge Process Outsourcing (KPO)
category (see Table 15).
Table 15: 24 Key Development Fields of Service Outsourcing Industry, China
Information Technology Outsourcing (ITO)
Business Process Outsourcing (BPO)
Knowledge Process Outsourcing (KPO)
Cloud Computing Service
Professional Service
Industrial Design Service
Integrated Circuit Design Service
Data Processing Service
Data Processing Service
Software Technology Service
E-marketing Service
Pharmaceutical and Biological Technology R&D Service
Software Development Service
Supply Chain Management Service
Inspection and Testing Service
IT System Operation and Maintenance Service
HR Management Service New Energy Technology R&D Service
Fundamental IT Operation and Maintenance Service
Call Center and E-commerce Back-office Service
Culture Creation Service
E-commerce Platform Service
Engineering Technology Service
IT Solution Service
Management Consulting Service
New Energy Technology Solution Service
IT Consulting Service
Source: The Guidance Catalogue of Key Development Fields of Service Outsourcing Industry, 2016
As a result, China's TiS continued to grow in 2015 despite subdued economic
growth, with both onshore and offshore contracts posting remarkable increases in value.
According to the MOFCOM, Chinese companies inked service-outsourcing contracts worth
$130.9 billion, up 22.1 percent from last year. Information technology-related services
accounted for nearly half of the deals.
60 Source: The Joint Announcement [2016] No.29: Guidance Catalogue of Key Development Fields of Service Outsourcing Industry available at http://chinasourcing.mofcom.gov.cn/policy/47/73508.html, accessed in September 2016

43
However, the geographical realities associated with the smiling curve are that
the higher value-added activities, services for example, are largely located in advanced
economies, while low value-added ones have moved or are moving to emerging economies (see
Figure 12 and Table 16). Notwithstanding the growth of the service outsourcing industry, China
Table 16: The Share of Services in Total Exports by Countries, 2009, 2012, 2015
2009 2012 2015
China 9.8% 9.3% 11.8%
Brazil 15.3% 13.9% 15.1%
Mexico 6.0% 4.1% 5.6%
US 31.0% 29.6% 33.8%
Japan 18.1% 15.4% 20.8%
UK 42.5% 39.3% 44.0%
Germany 17.2% 15.5% 16.8%
Source: IMF Balance of Payments61 and World Development Indicators
has been running massive trade deficits in services. The country’s services deficit swelled to
$150,100 million in 2014, hitting a record high. As shown in Table 17, part of the deficit is
attributable to the sectors of insurance services, and royalties and license fees, which is not
surprising given that these are non-labor-intensive activities. The other part of the deficit is
mainly attributable to travel and transportation, due to the improvement of life quality in China.
Table 17: Balance of China’s Trade in Services, 2010-2014 ($ Millions)
Service label Balance in
value in 2010
Balance in value in
2011
Balance in value in
2012
Balance in value in
2013
Balance in value in
2014
Exported Value in
2014
Imported Value in
2014
Manufacturing services on physical
inputs owned by others
16635 18271 39018 23178 21305 21421 116
Other business services
8855 7163 8767 9910 15525 68895 53370
61 IMF Balance of Payments, available at http://data.imf.org/regular.aspx?key=60982819, accessed in September 2016
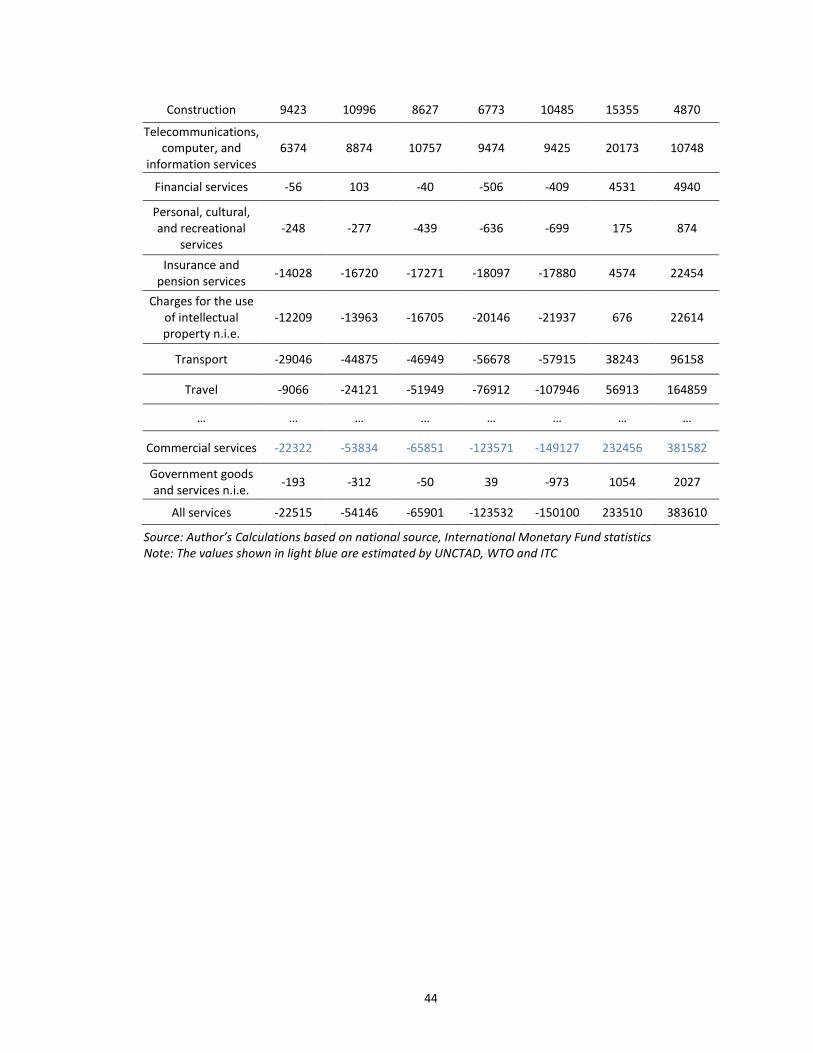
44
Construction 9423 10996 8627 6773 10485 15355 4870
Telecommunications, computer, and
information services 6374 8874 10757 9474 9425 20173 10748
Financial services -56 103 -40 -506 -409 4531 4940
Personal, cultural, and recreational
services -248 -277 -439 -636 -699 175 874
Insurance and pension services
-14028 -16720 -17271 -18097 -17880 4574 22454
Charges for the use of intellectual property n.i.e.
-12209 -13963 -16705 -20146 -21937 676 22614
Transport -29046 -44875 -46949 -56678 -57915 38243 96158
Travel -9066 -24121 -51949 -76912 -107946 56913 164859
… … … … … … … …
Commercial services -22322 -53834 -65851 -123571 -149127 232456 381582
Government goods and services n.i.e.
-193 -312 -50 39 -973 1054 2027
All services -22515 -54146 -65901 -123532 -150100 233510 383610
Source: Author’s Calculations based on national source, International Monetary Fund statistics Note: The values shown in light blue are estimated by UNCTAD, WTO and ITC

45
V. The Challenges and Opportunities Posed by GVCs
Having reformed and opened up for decades, and having experienced the
financial crisis of 2008-2009, China has come to a crossroads with unforeseen challenges and
opportunities. Economic restructuring and upgrading is undoubtedly the most important factor
in changing China’s growth patterns. However, does industrial upgrading mean abandoning the
low-technology manufacturing industries in China? Does the rising sophistication of China’s
exports mirror the country’s technological upgrading? How important is it for the Chinese
government to pursue trade and investment opportunities within RVCs? Such questions have
not been emphasized in the existing literature, but are faced by China as the country is
attempting to turn GVC participation into sustainable development.
In the past decade, China has been abandoning some low-technology
manufacturing industries, such as the garment industry, while moving toward more technology-
intensive industries, such as the automobile industry. It is a common belief that to move up the
value chain a nation must transition out of a focus on unskilled-labor intensive industries to a
stronger emphasis on human-capital intensive industries. However, as the world’s most
populous nation, China needs a far larger upfront investment to assemble an appropriately
skilled workforce than nearly any other country. Additionally, small- and medium-sized
enterprises (SMEs) account for 80 percent of China’s manufacturing employment. But high-
technology manufacturing industries are not necessarily the most profitable or accessible
options for SMEs, because the costs of basic research and branding are much more than they
can afford. Moreover, looking at the current status of traditional manufacturing industry in
China, the steel industry, for instance, overcapacity is widely believed to have peaked; however
the surplus represents low-end crude steel, while high-end refined steel remains in short supply.
In other words, China has become a big manufacturing country, but is still far from a

46
manufacturing power. Granted, the country would achieve economic upgrading to enhance its
technology-intensive manufacturing sector and its service sector, but not at the expense of its
low-end manufacturing sector.
The Chinese government has been vigorously promoting the development of
medium- and high-technology manufacturing industries since the late 1990s. According to the
Asian Development Bank (ADB), China’s share of Asia’s exports of high-technology manufactures
rose to 43.7 percent in 2014 from 9.4 percent in 2000, while Japan’s share slid to 7.7 percent
from 25.5 percent during the same period.62 However, instead of exports values, the domestic
content of exports quantifies the actual value added by each country. In 2011, China’s domestic
value added in exports of high-technology manufactures was merely 46.3 percent, well behind
that of Japan (83.1 percent) and the United States (85.3 percent) (see Figure 15). Likewise,
China’s domestic value added in exports of medium-technology manufactures (65.7 percent)
was much lower than that of Japan (83.8 percent) and the United States (76.2 percent),
although the gap between China and these advanced economies has narrowed (see Figure 16).
The empirical results also indicate that the technological intensity of Chinese exports has been
significantly overestimated due to its high dependency on import content, especially in high-
technology exports.
Selecting the robotics industry as an example, we can better understand this
phenomenon. Robotics is a highly technical subject that requires mechanical engineering and
electrical engineering to design, construct, and operate, as well as, computer systems for
sensory feedback and information processing. In light of this, products from many Chinese
domestic companies can only be considered as automated machines, rather than real robots.
62 Data available at http://www.bloomberg.com/news/articles/2015-12-08/china-surpasses-japan-as-asia-s-top-high-tech-exporter-adb-says, accessed in September 2016

47
Figure 15: China’s Domestic Value Added in Exports of High-Technology Manufactures
Source: Author’s illustration based on OECD Trade in Value-Added (TiVA) indicators Note: Author groups industries listed in TiVA database by technological intensity using the Lall classification (see Appendix III)
Figure 16: China’s Domestic Value Added in Exports of Medium-Technology Manufactures
Source: Author’s illustration based on OECD Trade in Value-Added (TiVA) indicators Note: Author groups industries listed in TiVA database by technological intensity using the Lall classification (see Appendix III)

48
In addition, China remains heavily dependent on the import of core components from foreign
firms, including controller, servomotor, and reducer, which account for 70 percent of the cost. In
2015, about 75 percent of reducer units were imported from Japan, from major suppliers of
Harmonic Drive Systems, while 80 percent of servomotors and drives were mainly imported
from Japan, the European Union and the United States. Such imports are apparently a major
bottleneck restricting China's robot industry, as well as other high-technology manufacturing
industries.
To tackle the problem, the Chinese government has promoted indigenous
innovation through an array of measures in recent years. The indigenous innovation campaign is
enshrined as a national strategy that put science and technology development at the center of
rebalancing China’s development pattern. However, in the past decades, scientific research in
China has been driven by short-term or focused technology projects. Large-scale projects
supported by public funds have to be invested in promising areas for urgent needs, such as the
development of aircraft engines, high-speed trains, solar cells, and drug design, with the
government expecting some sort of return in less than five to ten years. Furthermore, basic
research is less emphasized in China, since it has a lower success rate and its research
achievement takes a much longer time to develop, translate or apply. Although China's share of
research papers worldwide, as counted in Elsevier's Scopus database, grew from 2.5 percent in
1997 to 18.8 percent in 2015, much basic research, such as in pure mathematics or fundamental
physics, is irrelevant to the nation's economy or society in China. Scientific and technological
progress contributed to only 55 percent of economic growth in China in 2015, compared with 88
percent in the United States during the same period. Fortunately, the Chinese government is
trying to reverse the situation. The National Natural Science Foundation of China continues to
serve as the major source for basic research funding. The Chinese Ministry of Science and

49
Technology initiated sixteen major technology and engineering projects, which will run to 2030,
and thirty-six National Key Research Projects in 2014. Examples are the study of “Langlands
program” for mathematics, which involves the understanding of number theory, geometry and
theoretical physics; the detection of dark matter by a deep underground earth-physics
laboratory in Sichuan; and the launch of over twenty satellites in the next five years to advance
the study of astrophysics, cosmology and earth science in China. Moreover, similar to the US
Bayh-Dole Act, recent revisions of the knowledge-transfer laws in China clear the barrier
between research and commercial development to a great extent.
For emerging economics like China, the knowledge and technology flows that
underpin GVCs can help the country achieve catch-up through rapid learning and industrial
upgrading, but they never enable the country to move to the head of GVCs. In the realm of
economic development, GVCs can drive uneven development over time because of the existing
power asymmetries. Companies in developing countries do not have the scale or scope to move
into and occupy high value-added activities, while leading firms in developed countries maintain
control of higher value-added stages along the value chain. As mentioned above, the Chinese
government is, on the one hand, attempting to enhance the economic power and indigenous
innovation of its national champions, especially in SEIs and service sectors. On the other hand,
the Chinese government is actively pursuing trade and investment opportunities within RVCs.
Evidently, a considerable number of global economic entities have benefited
from the idea of localizing the GVCs by either lowering the cost of merchandise transportation
or quickly climbing up the value chain. Without any doubt, Asia is the best testing field for China
to practice building its own RVCs.
The fact that China is an emerging economic leader in Asian is reflected by its
trade and investment performance over the past ten years. The economic data of China can be
50
compared to that of Japan and the United States to demonstrate its success in expanding and
strengthening RVC participation. One cannot deny that the geographic location of China plays a
very important role in the process. China is located along the coastline of the Pacific Ocean. Thus,
it seems the focus of economic development should be the east coast. However, the reality is
there are more challenges than opportunities awaiting if eastward, since China is anticipated to
face much more direct competitions from Japan and the United States, the two super-powers in
the Asia-Pacific region for many decades. Moreover, the recent establishment of the Trans-
Pacific Partnership (TTP) further strengthened the core economic competitiveness of Japan and
the United States. Instead, one of the most significant measurable actions for China to resolve
the difficulty is to look westward. Therefore, the Chinese government proposed One Belt One
Road (OBOR) (see Figure 17), as a major development strategy. This initiative aims at helping
China foster international trade and cooperation among countries primarily in Eurasia.
To better demonstrate, Asian countries are divided into three groups, as shown
in Figure 18. The first group is composed of Asian-Pacific Top ten GDP countries, including Japan,
Australia, India, Indonesia, Turkey, Saudi Arabia, Iran and Thailand. China has been an emerging
economic leader in this group for at least a decade, with respect to its economic performance.
The second group lists Asian-Pacific countries within the TTP, including Japan, Australia, New
Zealand, Malaysia, Singapore and Vietnam. There are only two countries ranked top ten in Asia-
Pacific GDP in this group, but considering the global influence of the United States included in
the group, the challenges to China from TTP can never be underestimated. The third group of
countries is covered by OBOR Initiative, which consists of six Asian-Pacific Top ten GDP countries,
three TTP countries, UAE, Philippines, Pakistan, Iraq, Kazakhstan and Qatar. The per capita GDPs
for these countries are from $1,000 to $6,000 range. It is very likely these countries are deeply
involved in one or two specific division stages in GVCs.

51
Figure 17: China’s One Belt One Road Initiative
Source: Xinhua News Agency
Figure 18: Asian-Pacific Top Ten GDP Countries, One Belt One Road and TTP Members
Source: Author’s illustration

52
Figure 19 and 20 plot China’s imports and exports data with Asian-Pacific top
ten GDP countries between 2006 and 2014. Not surprisingly, China is the major exporter in the
Asia-Pacific region. The steady increases of both imports and exports for the past decade show
good signs of a healthy overall economy in the region. Interestingly, as illustrated in Figure 14,
China has almost equal amount of low-tech, medium-tech and high-tech merchandise in value
for almost ten years to major Asian-Pacific countries. This is good and bad: diversifying the
exports to a wider range of the GVC significantly lowers the risk from global economic crises;
while too much diversifying will weaken the core economic competitiveness of China. At this
stage, China is still practicing different economic strategies in the Asia-Pacific region, trying to
figure out which is better.
Figure 19: China’s Exports to Asian-Pacific Top Ten GDP Countries, 2006-2014
Source: Author’s illustration with data from the UN Comtrade

53
Figure 20: China’s Imports from Asian-Pacific Top Ten GDP Countries, 2006-2014
Source: Author’s illustration with data from the UN Comtrade
Figure 21 and 22 plot the exports data of Japan and the United States to the
Asian-Pacific top ten GDP countries between 2006 and 2014. The emergence of China as an
economic leader in Asia-Pacific has definitely weakened the economic power of Japan and the
United States in the region. As shown in Figure 21, it is obvious that the highest merchandise
export category from Japan to Asian-Pacific top ten GDP countries is that of medium-technology
merchandise, which is dominated by the prominent Japanese automobile industry. As the figure
shows, the exports values in that medium-technology category dropped tremendously from
2012. The values in all other three categories also experienced slight decline at the same time.
The United States’ merchandise exports to Asian-Pacific top ten GDP countries
have been more complicated in the last decade. Figure 22 shows that low-tech merchandise
exported from the United States to major Asian-Pacific countries has remained at low levels for
a long time. Natural resources exports increased from 2006, but reached a plateau from 2010.

54
Figure 21: Japan’s Exports to Asian-Pacific Top Ten GDP Countries, 2006-201
Source: Author’s illustration with data from the UN Comtrade
Medium-tech merchandise exports increased steadily with a little interference from the
financial crisis of 2008-2009. Unfortunately, that financial crisis caused a significant drop of high-
technology merchandise exports from US, which took years to recover.
Compared to Figure 19, although also facing some interference from the
financial crisis of 2008-2009, China’s overall exports to Asian-Pacific top ten GDP countries
performed almost perfectly compared to those of Japan and the United States. All three
technology-based merchandise exports increased steadily with high slopes. This to a certain
extent implies that China has successfully integrated its economy into the Asian-Pacific trading
ring. In order to build its own value chains in the Asia-Pacific region, for the next step, China is
very likely, on the one hand, to invest even more in European and American companies, in order
to learn their advanced technology and value chain configuration capability, and on the other
hand, to transfer many specific production processes into those Asian-Pacific countries.

55
Figure 22: USA’s Exports to Asian-Pacific Top Ten GDP Countries, 2006-2014
Source: Author’s illustration with data from the UN Comtrade
OBOR is a major development strategy proposed by the Chinese government to
emphasize the influence of economic, production and trading power of China to Eurasian
countries, in turn fostering multi-level international trade and cooperation among those
countries. There are 65 countries along the “Road,” whose average foreign trade and
investment inflows reached annual growth rates of 13.9 percent and 6.2 percent in 2012, higher
than the global average of 4.6 percent and 3.4 percent. Figure 23 and 24 demonstrate China’s
imports and exports data from and to major OBOR countries between 2006 and 2014. Not
surprisingly, China’s exports to major OBOR countries increased steadily with high slopes for ten
years, while the imports remained almost flat, mainly relying on natural resource and high-
technology commodities.
One successful example of One Belt One Road is a $2.1 billion high-speed
railway project in Iran being constructed by both Chinese and Iranian companies over a span of

56
Figure 23: China’s Export to Major One Belt One Road Countries, 2006-2014
Source: Author’s illustration with data from the UN Comtrade
four years. The major responsibilities for Chinese companies are railroad electrification, track
and signal system improvements, while the major construction work will be completed by Iran
Infrastructure & Engineering Group. In addition, Chinese companies will subsequently provide a
five-year maintenance service after the completion. The project is expected to shrink the travel
time from Tehran to Mashad from the existing twelve hours to six hours, and increase the
annual cargo capacity by 10 million tons.
Clearly, in this project, the Chinese company has upgraded to higher levels of
the value chain by providing medium to high technology products and maintenance service.
With many examples like this, the success of OBOR will definitely help build China’s own value
chain in East Asia. While OBOR brings more opportunities for China to become a regional leader,
the high standards of trade and investment rules of the TTP puts forward new challenges in
terms of building its own RVCs.

57
Figure 24: China’s Import from Major One Belt One Road Countries, 2006-2014
Source: Author’s illustration with data from the UN Comtrade
Figure 25: China’s Export to TTP Countries, 2006-2014
Source: Author’s illustration with data from the UN Comtrade

58
Figure 26: China’s Import from TTP Countries, 2006-2014
Source: Author’s illustration based on data from UN Comtrade

59
IV. Conclusion
The rise of GVCs have become a central force driving structural change in many
economies, and it has triggered both positive and negative outcomes in developing and
industrialized nations.
Enjoying a sufficiently large internal market, should China pursue developing
fully independent national industries, separate from GVCs? As the most significant beneficiary in
the current wave of globalization, should China continually target specialized niches where it
already has a solid grip, or find avenues to tame supply-chain complexity? If moving ahead in the
value chain becomes an imperative, should China leverage GVC linkages and dynamics arising
from knowledge spillovers, or devote greater effort to indigenous innovation, allowing vigorous
higher value-added manufacturing to play the more important role of driving growth?
Still, the fragmentation of global industries in GVCs complicates industrial policy
debates. Domestic industries in both industrialized and developing countries no longer stand
alone and compete mainly through arms-length trade; instead, they have become deeply
intertwined through complex, overlapping global-scale business networks created through the
recurrent waves of FDI and global sourcing that comprise GVCs.
For China, Identifying an entry point into vertically specialized industries and
upgrading towards higher value added activities within global value chains have become a major
priority for Chinese policy makers. Stimulated by supportive government policies, China
accelerates its industrialization in a sustainable way that not just relying on abundant raw
materials, and inexhaustible reserve of low-wage workers, but also bolstering productivity,
promoting industrial upgrading, fostering innovation capacities, including human capital and
other recourses. However, global value chains are not a panacea for development. They enable
greater diversification of risk resulting from macro-and product-level variations in demand, and

60
enhance the potential for propagation of economic shocks from one nation to another.
Responding to these challenges, China has reoriented production to its large internal market,
and diversified its export partners, leaning more extensively on RVCs. Another controversy is
that economic upgrading is a necessary but not sufficient condition for long-term sustainable
growth. Very compressed GVC-driven development can exacerbate existing pressures and
create new challenges in the realm of social development.

61
Appendix I: Lall’s Technological Classification of Exports
CATEGORY EXAMPLES SITC a/
A. COMMODITIES
Fresh fruit, meat, rice, cocoa, tea, coffee, timber, coal, crude petroleum,
gas, ore concentrates and scrap.
001, 011, 022, 025, 034, 036, 041, 042, 043, 044, 045, 054, 057, 071, 072, 074, 075, 081, 091, 121, 211, 212, 222, 223, 232, 244, 245, 246, 261, 263, 268, 271, 273, 274, 277, 278, 281, 286, 287, 289, 291, 292, 322, 333, 341.
B. MANUFACTURES
Natural resource-based manufactures
Prepared meats/fruits, beverages, wood products, vegetable oils, base
metals (except steal), petroleum products, cement, gems, and glass.
012, 014, 023, 024, 035, 037, 046, 047, 048, 056, 058, 061, 062, 073, 098, 111, 112, 122, 233, 247, 248, 251, 264, 265, 269, 423, 424, 431, 621, 625, 628, 633, 634, 635, 641, 282, 288, 323, 334, 335, 411, 511, 514, 515, 516, 522, 523, 531, 532, 551, 592, 661, 662, 663, 664, 667, 681, 682, 683, 684, 685, 686, 687, 688, 689.
Low-technology manufactures
Textile fabrics, clothing, footwear, leather manufactures, travel goods
pottery, simple metal structures, furniture, jewelry, toys, plastic
products.
611, 612, 613, 651, 652, 654, 655, 656, 657, 658, 659, 831, 842, 843, 844, 845, 846, 847, 848, 851, 642, 665, 666, 673, 674, 675, 676, 677, 679, 691, 692, 693, 694, 695, 696, 697, 699, 821, 893, 894, 895, 897, 898, 899.
Medium-technology manufactures
Passenger vehicles and parts, commercial vehicles, motorcycles and parts, synthetic fibers, chemicals and
paints, fertilizers, plastics, iron and steel, pipes and tubes, engines,
motors, industrial machinery, pumps, ships, watches.
781, 782, 783, 784, 785, 266, 267, 512, 513, 533, 553, 554, 562, 572, 582, 583, 584, 585, 591, 598, 653, 671, 672, 678, 786, 791, 882, 711, 713, 714, 721, 722, 723, 724, 725, 726, 727, 728, 736, 737, 741, 742, 743, 744, 745, 749, 762, 763, 772, 773, 775, 793, 812, 872, 873, 884, 885, 951.
High-technology manufactures
Data processing and telecommunications equipment,
television sets, transistors, turbines, power generating equipment,
pharmaceuticals, aerospace, optical and instruments, cameras.
716, 718, 751, 752, 759, 761, 764, 771, 774, 776, 778, 524, 541, 712, 792, 871, 874, 881.
C. OTHER TRANSACTIONS
Electricity, cinematographic film, printed matter, special transactions,
gold, coins, pets, works of art.
351, 883, 892, 896, 911, 931, 941, 961, 971.
Source: Lall, S, (2000), The technological structure and performance of developing country manufactured exports, 1985-98, Oxford development studies, 28(3), 337-69

62
Appendix II: Seven Strategic Emerging Industries and Selected Subsectors
Energy Efficiency and Environmental Conservation
· Research, develop, and promote energy-efficient technology products in order to make technology breakthroughs and raise overall energy efficiency;
· Accelerate the R&D and production of broadly applicable technology that can be used for resource recycling and remanufacturing industrialization;
· Test and promote advanced environmental technologies and products;
· Promote a market-oriented service system for environmental protection and energy efficiency;
· Employ advanced technology to create a recycling system for waste commodities; and
· Promote clean coal and seawater use.
Next Generation Information Technology
· Accelerate the construction of vast, integrated, and safe information network facilities, promote the R&D and production of new-generation mobile communication, as well as core equipment and intelligent terminals for next-generation Internet;
· Accelerate the convergence of telecom, broadcasting, and Internet networks; promote R&D in the "Internet of things" and cloud computing;
· Focus on developing core and basic sectors such as integrated circuits, new-mode displays, high-end software, and high-end servers;
· Upgrade software and value-added Internet services; promote smart renovation of infrastructure; and
· Develop digital and virtual technologies to promote creative industries.
Biotechnology
· Develop biotech-derived pharmaceuticals, new vaccines, diagnostic reagents, chemical drugs, modern Chinese medicine, and innovative drugs that prevent major critical diseases;
· Accelerate the R&D, production, and large-scale development of biological and medical engineering products such as medical equipment and medical materials;
· Promote bio-agriculture development, including the biological breeding industry, green agriculture, and biological production;
· Advance the exploration, demonstration, and application of core technologies in biological manufacturing; and
· Accelerate the R&D and production of marine biology technologies and products.
High-End Equipment Manufacturing
· Strengthen and expand the aviation industry, focusing on the development of key aviation equipment for trunk line and regional flights as well as utility aircraft;
· Promote aerospace infrastructure construction to develop satellites and related industries;
· Develop rail equipment used during the construction of passenger lines and urban metro systems;
· Develop marine engineering equipment to develop marine resources; and
· Develop intelligent manufacturing equipment with digitally integrated systems as core components.
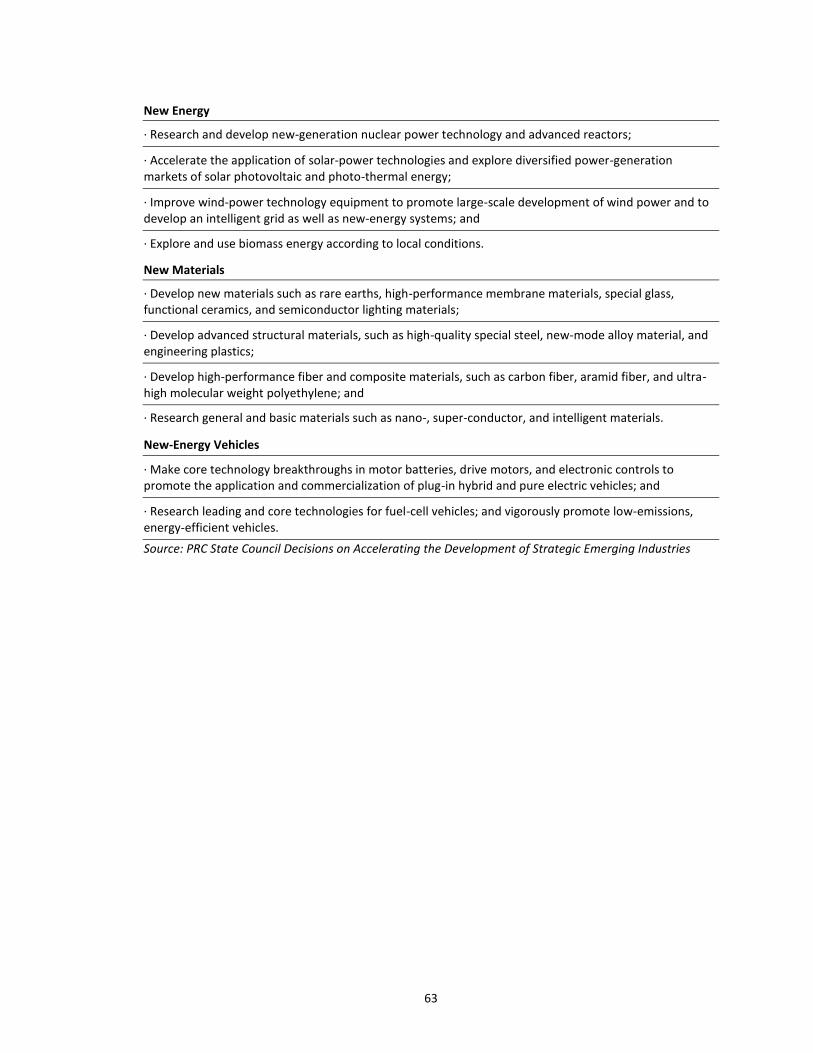
63
New Energy
· Research and develop new-generation nuclear power technology and advanced reactors;
· Accelerate the application of solar-power technologies and explore diversified power-generation markets of solar photovoltaic and photo-thermal energy;
· Improve wind-power technology equipment to promote large-scale development of wind power and to develop an intelligent grid as well as new-energy systems; and
· Explore and use biomass energy according to local conditions.
New Materials
· Develop new materials such as rare earths, high-performance membrane materials, special glass, functional ceramics, and semiconductor lighting materials;
· Develop advanced structural materials, such as high-quality special steel, new-mode alloy material, and engineering plastics;
· Develop high-performance fiber and composite materials, such as carbon fiber, aramid fiber, and ultra-high molecular weight polyethylene; and
· Research general and basic materials such as nano-, super-conductor, and intelligent materials.
New-Energy Vehicles
· Make core technology breakthroughs in motor batteries, drive motors, and electronic controls to promote the application and commercialization of plug-in hybrid and pure electric vehicles; and
· Research leading and core technologies for fuel-cell vehicles; and vigorously promote low-emissions, energy-efficient vehicles.
Source: PRC State Council Decisions on Accelerating the Development of Strategic Emerging Industries

64
Appendix III: OECD TiVA database converted into Lall’s Technological Classification
High-Technology Manufactures
C30 Manufacture of office, accounting and computing machinery
C31 Manufacture of electrical machinery and apparatus n.e.c.
C32 Manufacture of radio, television and communication equipment and apparatus
C33 Manufacture of medical, precision and optical instruments, watches and clocks
C40 Electricity, gas, steam and hot water supply
C41 Collection, purification and distribution of water
Medium-Technology Manufactures
C24 Manufacture of chemicals and chemical products
C29 Manufacture of machinery and equipment n.e.c.
C34 Manufacture of motor vehicles, trailers and semi-trailers
C35 Manufacture of other transport equipment
Source: Author’s illustration

65
Bibliography Appelbaum, R. (2008), Giant Transnational Contractors in East Asia: Emergent Trends in Global Supply Chains, Competition and Change, Vol. 12, No. 1, pp. 69-87.
Baldwin, R. (2012), Global Supply Chains: Why They Emerged, Why They Matter, and Where They are Going, Center for Trade and Economic Integration Working Paper.
Backer, K. D. and S. Miroudot (2013), Mapping Global Value Chains, OECD Trade Policy Papers, No.159, OECD Publishing.
Barboza, D. (2004), In Roaring China, Sweaters are West of Sock City, New York Times.
Cattaneo, O., G. Gereffi and C. Staritz (2010), Global Value Chains in a Postcrisis World: Resilience Consolidation and Shifting End Markets, in Global Value Chains in a Postcrisis World: A Development Perspective, The World Bank, Washington DC, pp. 3–20.
Chatterjee, S., M. Lubatkin, D. Schweiger, and Y. Weber (2010), A brave new world: The climate for Chinese M&A abroad, available at https://china.ucsd.edu/_files/odi-2013/09232013_Paper_Liu_Brave%20New%20World.pdf
Frederick, S and G. Gereffi (2011), Upgrading and restructuring in the global apparel value chain: why China and Asia are outperforming Mexico and Central America, Int. J. Technological Learning, Innovation and Development, Vol. 4, Nos. 1/2/3, 2011 p67-95.
Gereffi, G. (2005), The Global Economy: Organization, Governance and Development, pp. 160-182, Handbook of Economic Sociology, 2nd edition, pp. 171.
Gereffi, G. (2009), Development Models and Industrial Upgrading in China and Mexico, European Sociological Review, Vol. 25, No. 1, pp. 37-51.
Gereffi, G. and T. Sturgeon (2013), Global Value Chain Oriented Industrial Policy: The Role of Emerging Economies, In Deborah Elms and Patrick Low (eds.), Global Value Chains in a Changing World, Geneva: World Trade Organization, 329-360.
Howe, C. (1996), China and Japan: History, Trends, and Prospects, Clarendon Press.
International Monetary Fund (2015), Consultation with the People’s Republic of China, Article IV.
KPMG (2012), Securing R&D tax incentives in China, available at http://www.kpmg.com/CN/en/IssuesAndInsights/ArticlesPublications/Pages/Securing-Research-Development-Tax-Incentives-in-China-201210.aspx
Lall, S. (2000), The technological structure and performance of developing country manufactured exports, 1985-98, Oxford Development Studies, 28(3), pp. 337– 369.
Lemonie, F. and D. Unal-Kesenci (2004), Assembly Trade and Technology Transfer: The Case of China, World Development 32(5), pp. 829-850.
Magariños, A. C., L. Yongtu and F. C. Sercovich, eds. (2002), China in the WTO, The Birth of a New Catching-Up Strategy, Palgrave McMillan, Houndmills, United Kingdom and New York, United States.

66
Meng, B. and S. Miroudot (2011), Towards measuring trade in value added and other indicators of global value chains: current OECD work using I/O tables, presentation held at the Global Forum on Trade Statistics, organized by Eurostat, UNSD and WTO, Geneva, Switzerland.
Milberg, W. and D. Winkler (2010). Trade Crisis and Recovery, Restructuring of Global Value Chains. The World Bank. WPS5294.
Ministry of Commerce of the People’s Republic of China, National Bureau of Statistics of the People’s Republic of China (2014), State Administration of Foreign Exchange: 2014 Statistical Bulletin of China’s Outward Foreign Direct Investment, Beijing, China, China Statistic Press.
Morcillo, E. (2010), Geely’s Volvo Gamble, Harvard Business Review, available at http://www.businessweek.com/managing/content/apr2010/ca20100416_353527.htm
Naughton, B. (2009) Understanding the Chinese Stimulus Package, China Leadership Monitor, no. 28, available at http://www.hoover.org/sites/default/files/uploads/documents/CLM28BN.pdf
Park, D. and K. Shin (2012), The Service Sector in Asia: Is it an Engine of Growth?, Background Paper prepared for Asian Development Outlook 2012, pp. 7.
Roach, S. (2015), Chinese Rebalancing: Transitioning from the 12th to the 13th Five-Year Plan, available at http://www.uscc.gov/sites/default/files/Roach%20-%20Written%20Testimony%20Part%20I.pdf
Simon, D. (2010), China’s Emerging Technological Trajectory Critical Issues and Implications, Pennsylvania State University.
Sturgeon, T and O. Memedovic (2010), Measuring global value chains: intermediate goods trade, structural change and compressed development. Vienna, UNIDO working paper.
Tang, R. (2009), The Rise of China’s Auto Industry and Its Impact on the U.S. Motor Vehicle Industry, Analyst in Industrial Organization and Business, available at https://www.fas.org/sgp/crs/row/R40924.pdf
The US-China Business Council (2015), ADVANCING INNOVATION: Recommendations for China's High- and New-. Technology Enterprise (HNTE) Tax Incentive Program, available at https://www.uschina.org/sites/default/files/USCBC%20Recommendations%20for%20China's%20HNTE%20Program%20(English).pdf
The US-China Business Council (2013), China’s Strategic Emerging Industries: Policy, Implementation, Challenges, and Recommendations, available at https://www.uschina.org/sites/default/files/sei-report.pdf
UCTAD (2014), World investment Report, available at http://unctad.org/en/PublicationsLibrary/wir2014_en.pdf
Wei, SJ. (1993), Open Door Policy and China's Rapid Growth: Evidence from City-Level Data, NBER Working Paper No. 4602.
Yusuf, S and K. Nabeshima (2010), Changing the Industrial Geography in Asia: The Impact of China and India, Washington DC, World Bank, pp. 31.