Embed Size (px)
Citation preview
1
Education Investment in China and its Implications
for China and East Asia
Peter E. Robertson University of New South Wales
Jessica Y. Xu*
University of New South Wales
3 December 2008
Abstract
What are the implications of China’s rapid development for East Asia? A number of studies have emphasised the competitive effects of China’s low skill-intensive manufacturing sector on East Asian exports. China, however, has recently embarked on a large scale investment in higher education with the aim of addressing skill shortages and the problem of growing wage inequality. This paper provides an analytical perspective on the implications of this policy for China and the East Asian economies. Using a computable multi-sector growth model of China and East Asia, we find that the planned spending on tertiary education generates a long run increase in skilled labour of 33 percent and a strong decline in wage inequality. Nevertheless, we find that in the short run, adjustment costs rise – due to constraints on resources for on-the-job training – wage inequality rises and income falls. The education plan also has significant effects on the structure of trade for China and East Asia, with a shift of East Asia’s exports towards less skill-intensive sectors. However, the aggregate effects on East Asia are small and the adjustment in trade patterns is gradual and involves an expansion of agricultural and low-tech manufacturing exports, with only minimal adjustments for other sectors.
Keywords Human Capital, Economic Growth, China, Computable General Equilibrium
Models
JEL: F11, J24, C68, O10
______________________
*Corresponding author: Jessica Xu, The Treasury, Langton Crescent, PARKES ACT 2600.
Email: [email protected]. Phone: (02) 6263 3748.

2
1. Introduction
In the Tenth Five-Year Plan, covering the period 2001 to 2005, the Chinese government
set a target to have 16 million students enrolled in tertiary institutions. That goal was
surpassed in 2004 with 18.9 million students.1 The current Eleventh Five-Year Plan sets
an even more ambitious target for China’s education sector with an aim to increase
government spending on education from the 1995 level of 2.4 percent of GDP to 4
percent of GDP. This represents not only a very large increase in total education spending
in China but also a significant change in the world endowment of skilled labour (Freeman,
2005; Li et al., 2008).
The projected expansion in China’s supply of skilled labour raises a host of issues
regarding the effect on China and China’s trading partners. The aim of this paper is to
evaluate the impact of this potential change in China’s skilled labour endowment on
China and its East Asian neighbours. The focus on East Asia is germane given what Lall
and Albaladejo (2004) describe as a “heightened fear of competition from China” among
the East Asian countries. Likewise, the growing literature on the effects of China’s
growth on East Asia is reflective of the intense interest in this issue. This includes, for
example, Weiss and Shanwen (2003), Lall and Albaladejo (2004), Roland-Holst and
Weiss (2004), Ravenhill (2006) and Coxhead (2007).
Whereas the recent literature focuses on China’s rapid export expansion on East Asia,
and especially on the manufactured export sectors of low wage Asian economies, the
planned up-skilling of the labour force in China is now raising protectionist sentiments in
the more industrialised economies such as South Korea (The Economist, 2008). In
addition, it may frustrate middle income countries, such as Indonesia, where policy
advice has been to avoid competition with China by investing in skills themselves
(Coxhead and Li, 2008).
1 This number includes students from regular higher education institutions, adult higher education
institutions and private institutions.
3
The implications of China’s education plan for East Asia are not obvious. On one hand,
skill-intensive industries may lose comparative advantage to resource or low skill-
intensive sectors. On the other hand, the rising endowment of skilled labour in China may
create greater trade opportunities with China, for example through increased
opportunities for specialization and trade in intermediate goods. Furthermore, given the
large mass of unskilled labour in China, it is not clear whether even this ambitious
planning response will have a significant impact on the composition of China’s labour
force or trade patterns.
To bring some quantitative perspective on these issues we consider the impact of the
expansion of tertiary education plan on China and its implications for East Asia using a
multi-sector, multi-region growth model. The model features optimal education
investment decisions and human capital dynamics allowing us to consider not only how
agents’ education decisions respond to the new government incentives in China but also
how they respond in East Asia through changes in international trade.
We find that the increase in tertiary education investment in China, as implied by the
Eleventh Five-Year Plan, generates a 33 percent increase in skilled labour in the long run
and causes a strong decline in wage inequality. Although the reduction in inequality
fulfils one of the stated objectives of the plan, there is also a substantial short term rise in
wage inequality as demand for skilled labour and adjustment costs rise.
The education plan shifts the structure of China’s production towards skill-intensive
sectors such as durables and traded services. The impact on East Asia is very small at the
aggregate level but significant changes are observed in the composition and direction of
East Asia’s trade, these changes are found to be quite gradual.
2. Background
2.1 Enrolments of Students and Supply of Skilled Labour
The legacy of the Cultural Revolution meant that, by the mid 1980s, the proportion of
skilled labour in China was well below other countries with similar income levels. During
the Cultural Revolution, from 1966 to 1976, higher education in China was essentially
4
stopped (Tsang, 2000; Chow, 2002). The national examination system for admissions
was ceased. Regular admissions of undergraduates stopped for six years and graduate
admissions also ceased for 12 years from 1966. In 1971, a quarter of the higher education
institutions were closed and the educational managers were removed from their positions
(Tsang, 2000; Hannum et al., 2007; Zhang, 2006). With students being sent to rural areas
for re-education there was also a large misallocation of skills (Hannum et al., 2007).
Deng and Treiman (1997) show that the Cultural Revolution severely depleted the stock
of educated labour in China. Since the early 1980s, enrolment rates have risen - and this
trend has accelerated in the last decade. Table 1 shows that the absolute number of
students enrolled in tertiary institutions has increased steadily since the end of the
Cultural Revolution until the late 1990s when the current education boom began. 2
Between 1997 and 2001, the number of tertiary students increased by 98 percent. The
tertiary gross enrolment ratio, which was merely 1 percent in 1985 and 3 percent in 1991,
soared to 19 percent in 2004.
Likewise, as shown in Figure 1, the ratio of tertiary students relative to the labour force
has also grown very rapidly - from 0.6 percent in 1990 to 2.3 percent in 2004.
Consequently, the proportion of skilled labour to the total labour force has risen from 1.9
percent in 1990 to 3.6 percent in 2002.
However, China’s tertiary gross enrolment rate of 19.1 percent in 2004 remains below the
world average of 24.8 percent. Table 2 shows this enrolment ratio is considerably lower
than most of its Asian neighbours and even lower than that of countries with a lower
income per capita such as Jordan (39.3 percent), Egypt (32.6 percent) and Armenia (26.2
2 The enrolments refer to students in regular higher education institutions and adult higher education
institutions.
5
percent). 3 This suggests that, in relative terms, the education plan is an accelerated
programme of catch-up to “normal” levels.
2.2 Reforms to Promote Higher Education
The rise in the enrolment rate reflects the effects of several stages of reform in the
education sector and in the labour market. A programme to implement nine years of
compulsory education was introduced in 1985. In 1999, a second reform programme, the
“Action Plan for Revitalizing Education in the 21st Century” was carried out. This set a
target on the tertiary enrolment rate (to raise the enrolment rate from 9 to 15 percent) with
the objective of providing greater access to higher education. According to Tsang (2000),
the motivation for such a large increase was that skill shortage was adversely affecting
economic growth in China. Chaudhuri and Ravillion (2007) note that skill shortage is due
to the failure in the delivery of education services and thus has led to a substantial rise in
wage inequality in China.
To supplement the expansion in public higher education, the government permitted social
organisations and private citizens to operate and finance private higher education
institutions, known as “minban” institutions. 4 The private institutions of higher education
were made possible and legally established by a succession of legislations in the 1990s.
3 For tertiary education, the gross enrolment rate is defined as the ratio of the total enrolment in higher
education to the population aged 18 to 24. National income is measured in terms per capita, purchasing
power parity from the World Development Indicators Database.
4 There are currently two types of higher education institutions in China, regular public institutions and
other institutions. The regular institutions of higher education are educational establishments that enrol
graduates straight from senior secondary schools and offer higher education training and programs. The
other institutions include both adult public higher education institutions and private institutions. The
institutions of higher education for adults refer to the establishments that usually enrol students who are in
the labour force and provide higher education courses in several forms whether full time, part time or
distance learning (Zhang, 2006). Students trained in these institutions receive a qualification equivalent to
students studying at the regular higher institutions. Privately-run tertiary institutions are a new phenomenon
and growing sector, established to support higher education development in China.

6
A new law in 2002 gave private institutions the same legal status as public institutions
and guarantees their autonomy. In 2004, private institutions numbered 226 and enrolled
1.4 million students (Zhang, 2006; Min, 2005).
The increases in education spending have been procured through non-budgetary sources
such as tuition and fees. Until 1990, universities did not charge students tuition (Zhang,
2006). After 1990, reforms in the financing of higher education meant that universities
were able to charge tuition and fees. The fees grew from 4.4 percent of educational
expenditures in 1991 to 18.6 percent in 2004 (Min, 2005; Hannum et al., 2007). Student
loan and scholarship programmes were launched by the government at the same time to
support students from low income families (Zhang, 2006).
Reforms in the labour market have also complemented the liberalisation policy in higher
education. Historically, the wage policy in China forced a low rate of return to skilled
labour and there are still distortions on the wage setting in the labour markets (Heckman,
2005). From the initiation of economic reform in 1978 to the early 1990s, wage
differences by level of schooling were very narrow. Fleisher and Wang (2004) and
Fleisher et al. (2006) suggest that these wage differences understate the return to
education by 30 to 40 percent.
The low rate of return for skilled workers is likely to have a negative effect on
individuals’ incentives to invest in education. Indeed prior to the mid 1990s, university
graduates were assigned jobs upon graduation by the government (Min, 2005). With the
gradual transition of China from a centrally planned to a market economy, the
occupational prospects and the wage structure of the graduates and skilled workers are
increasingly shaped by the labour market and recent evidence suggests that the return to
education has been rising.5
5 Chen et al. (2004) estimate that the return to tertiary education had reached 8.23 percent in 1996.
Heckman and Li (2004) use Chinese micro data to identify the return to college education and find that the
rate of return has risen to 11 percent in 2000.

7
2.3 Government Expenditure and the Eleventh Five-Year Plan
Having achieved a large degree of deregulation in the education sector in the Tenth Five-
Year Plan, the current Eleventh Five-Year Plan aims to provide the tertiary education
sector with a large injection of public funds. China’s aggregate expenditure as a
percentage of GDP grew from 3.4 percent in 1991 to 5.3 percent in 2004 as shown in
Figure 2. Of this, public spending on overall education was 2.4 percent of GDP in the
mid 1990s. As a result of the increased non-government funding in education, as
described above and by Hannum et al. (2007), the proportion of funds for education
coming from government has fallen from 85 percent in 1991 to 62 percent in 2004. This
can be seen in Figure 2 with the government spending on education relative to GDP
remaining at about 3 percent in 2004.
The Eleventh Five-Year Plan sets an explicit target to raise the public education
expenditure as a proportion of GDP to 4 percent. This represents a 66 percent increase in
public spending over the 2.4 percent level in the mid 1990s. Data from the 1990s suggest
that higher education accounts for approximately 20 percent of all education funding,
both private and public sources. The Eleventh Five-Year Plan, however, stipulates
priorities for universities and research, which suggests that the target for tertiary
education spending will be at least as ambitious, if not more so, as the target for
aggregate education spending.
3. The Model
3.1 Structure
The model used in this paper is a multi-sector, multi-region growth model developed by
Harris and Robertson (2007, 2008). The model focuses on the real side of the economy
with substantial details on sectoral output, trade flows, factor supplies and accumulation,
including human capital accumulation. In this paper we have adapted the Harris and
Robertson model (2007, 2008) to a model of China, East Asia and the Rest of the World
(ROW). The East Asian region is an aggregate of Japan and the four Asian Newly
8
Industrialised Economies of Hong Kong, Singapore, South Korea and Taiwan. The ROW
is an aggregate of all other regions.
In this section we provide a brief overview of the model’s structure.6 East Asia and China
are modelled as small open economies facing exogenous world prices. The ROW
supplies and purchases the traded commodities. Within each region, commodities are
homogenous in use irrespective of their origins but on the production side the
commodities are distinguished by market destination. The model resembles a traditional
Heckscher-Ohlin model with homogenous goods as opposed to the common Armington
assumption of differentiated good by import source.
The gross outputs of the firms are classified into eleven traded and non-traded goods.
The five non-traded goods are produced for the domestic market only. For the six traded
goods, the output is the aggregation of the three destination specific goods, one for the
home market and the other two for the foreign markets. Firms maximise revenue by
producing the optimal mix of destination specific goods. The revenue functions are
assumed to be constant elasticity of transformation functions of the prices in each market.
The seven factors of production are: the three reproducible physical capital goods
(machinery and equipment, structures, and residential housing); skilled labour; unskilled
labour; land and; natural resources. The firms’ value added technologies are specified as
nested constant elasticity of substitution unit cost functions allowing for capital-skill
complementarity. Physical capital and labour are mobile across sectors but immobile
across regions. Labour is distinguished between skilled and unskilled labour depending
on the educational level of the workers. A skilled worker possesses a tertiary degree or
comparable post-secondary qualification. To account for the differences in labour
productivity between the East Asian economies and China, labour is measured in terms of
efficiency units.
6 An appendix containing a detailed description of the model is available online at
http://www.economics.unsw.edu.au/PeterRobertson
9
The education sector transforms unskilled workers into skilled workers. The relative
supply of skilled and unskilled labour is endogenous to the model and is based on
households’ decision to invest in education with respect to the cost of the education and
the forward looking view on the return to becoming skilled. There are costs involved in
making the skilled labour useful once available; these costs can be viewed as job
matching and on-the-job training costs. Households choose the optimal current and
planned future level of schooling subject to Mincerian on-the-job training costs and a
labour time constraint, to maximise the present value of their total skilled and unskilled
labour income.7 Therefore, the costs of producing skilled labour include foregone income
from unskilled labour, training and costs of purchasing education services. The on-the-
job training costs are similar to adjustment or installation costs in the standard
neoclassical model of investment. A larger flow of graduates entering the labour force,
relative to the steady state flow, will use up unskilled labour resources.
Households own the physical capital and derive the demand for investment on these
assets to maximise the present value of the capital rental steams. The accumulation
pattern of physical capital is influenced by the endogenously determined prices of capital,
the depreciation rate and the capital adjustment costs. The adjustment costs are the units
of capital used in the installation and utilisation of the capital. The two remaining factors,
land and natural resources evolve exogenously.
An equilibrium in the model is a sequence of static competitive equilibria which satisfy
zero profits in all sectors, factor market clearing in all regions and commodity market
clearing in the world economy and the perfect foresight paths for investment, education
and consumption plans. For the education and investment plans, the perfect foresight path
of the economy is a time path of asset prices consistent with the first order conditions for
the households’ investment and education decisions, which reaches the steady state
solution in the limit as time approached infinity. In practice this is approximated by
7 See Mincer (1962) for a discussion of training costs and Mincer (1994) for some evidence on the size of
these costs.
10
requiring the path to reach the steady state after a long but finite period, usually in excess
of 100 years.8
3.2 Calibration
In assembling the benchmark data, the main data source is the GTAP database
(Dimaranan, 2006). A considerable amount of additional data was supplemented from
other sources. The GTAP dataset was re-aggregated in such a way to be consistent with
the regional and sectoral classifications used in this study. The model was calibrated to
the year 1995 as the benchmark and the initial steady state condition. The database
includes labour by skill level, as described in Liu et al. (1998) and this occupational
classification broadly corresponds with our concept of a skilled worker, as someone who
has completed a degree in higher education.
The original commodity sectors in the GTAP database are aggregated into 10 sectors
with 6 homogenous traded commodities and 4 homogenous non-traded commodities. The
traded service sector is treated differently from the other traded sectors as it consists of
both domestically supplied and imported business and recreation services and a
proportion of the public, trade, transport and utility services which is tradeable. For the
education sector, the data on the intermediate input purchase and the value added shares
for the sector was obtained separately from the Japanese and Chinese Input-Output (I-O)
tables. The data on education for Japan is used to represent the values for the East Asian
region.
The GTAP data was scaled using the Penn World Tables (PWT) version 6.2 such that the
income in each region is expressed in terms of purchasing power parity. The national
aggregate expenditure shares are derived from PWT augmented with each country’s
respective statistical yearbook for China and Japan but for the rest of the East Asian
economies, the data was gathered from the Asian Development Bank Key Indicators.
The data on capital from GTAP is disaggregated into 3 capital stocks of machinery and
8 The model is solved using numerical methods described in Wilcoxen (1988).

11
equipment, structures and residential housing. The value added flows for the sectors are
reconciled with the investment spending for the physical capital.9 The trade flows data
was adjusted to ensure a hypothetical equilibrium steady state with balanced trade.
The private and public expenditure data on higher education were used to infer the
aggregate education expenditure. Total spending on higher education is 1.4 percent of
GDP for East Asia and 0.6 percent of GDP for China in 1995. The bulk of the spending
in the education sector for the East Asian economies is on the wage incomes of skilled
and unskilled labour while in China it is spent mostly on intermediate commodities.
Given that the concept of skilled labour is a worker with a university or comparable post-
secondary education, the ratio of students to working population is taken to be 5 percent
for East Asia, which is based on the data for Japan in 1995 and 1 percent for China,
which is the average for the period 1994 to 2002. The ratio of students to skilled labour is
around 20 percent for Japan in the mid 1990s, which was taken as the ratio for East Asia.
A stylised fact regarding China’s stock of university and college graduates is that it is not
on a steady state. The stock of skilled labour is growing with more young aged workers
having higher education degrees than their older counterparts. With retirement of older
workers, China could reach a steady state similar to that of East Asian economies in the
long run. This means that the current ratio of students to skilled labour in China should
fall as the stock of skilled labour is accumulated. Thus, in the benchmark the steady state
ratio of students to skilled labour for China is calibrated to that of the East Asian region.
Table 3 summarises the relevant parameters for the education sector in the model.
The trade flow data are taken from the GTAP database and are presented in Table 4. It
can be seen that East Asia accounts for a large fraction of China’s total trade - 26 percent
of China’s imports and 31 percent of China’s exports. With respect to the East Asian
9 The factor income shares are rescaled to ensure that the relationship between factor incomes and
investment spending for the capital holds. This means that the total value added by each sector is
proportional to total investment spending. In practice, this only required a small adjustment to the value
added shares.

region, it can be seen that China has a substantial trade deficit in durables and has trade
surpluses in the less skill-intensive sectors of agriculture, low-tech manufacturing and
minerals.
4. Simulation Results
4.1 Experiment Design
As discussed above, the Eleventh Five-Year Plan includes a large increase in tertiary
education spending in order to raise the number of skilled workers and address the
concerns regarding the effects of skill shortages on longer term economic growth. 10
Under the Plan, public tertiary education spending is to rise from the 1995 level of 0.47
percent of GDP to 0.79 percent of GDP – which is a 66 percent increase in public tertiary
education spending. Private sector spending on tertiary education represented
approximately 21 percent of total spending in 1995. Hence, the 66 percent increase in
government spending represents a 52.7 percent increase in total tertiary education
spending.
We assume that this public spending is introduced through education subsidies. The value
of this subsidy is set to be equal to the change in government spending on education
divided by total education spending. That is,
eee yggss /)( −′=−′
where is total spending on education and and ey eg eg ′ are respectively the base and the
planned levels of government spending on tertiary education.
The experiment we consider, therefore, is the effect of an increase in education subsidies
of 52 cents per dollar of education spending. For parsimony, we introduce the full
10 According to the Eleventh Five-Year Plan, the benchmark for the percentage of public spending on total
education to GDP should be 4 percent. Assuming that the share of government spending on higher
education to total education and the share of private spending to public spending on higher education
remains the same, this implies that the proportion of higher education expenditure to GDP is 1.4 percent.
12
13
subsidy in the first year, though clearly other assumptions are possible.11 The subsidy is
funded through increases in lump sum taxes such that the government budget is balanced
in every period.
4.2 Steady State Results
Table 5 reports the response for various aggregate economic indicators for China. It can
be seen that the effect of the subsidy is to raise the stock of skilled workers in China by
33 percent in the long run. The expansion induces capital accumulation with long run
stocks rising by about 4 percent and real GDP rising by 4.7 percent. The accumulation
generates increasing returns for unskilled labour and the fixed factors of natural resources
and land. The increase in the supply of skilled labour causes real wages for skilled labour
to decline by 17.9 percent. Real wages for unskilled labour, however, rise by 3 percent. In
the long run, the education plan addresses concerns over wage inequality.
The steady state sectoral and trade results are given in Table 6. It can be seen that the
output of durables, traded services and public sectors rise significantly while the low
skill-intensive sectors of agriculture and low-tech manufacturing experience a more
modest increase in China. In contrast to what might be expected from a standard
Heckscher-Ohlin model with fixed endowments, the expansion of the stock of skilled
labour causes all sectors to experience growth in the long run.
The exports of the more skill-intensive industries of durables and traded service sectors
expand the most. Interestingly, agricultural exports fall by 6 percent and imports rise,
despite the increase in agricultural output. There is a strong long run shift in comparative
advantage away from agriculture and a large substitution in domestic production toward
domestic market rather than exports.
11 An alternative approach would be to introduce the changes gradually, which allows for anticipation
effects. We have experimented with gradual introduction of the subsidy payments so that this target is met
by the tenth year. Though this delays the onset of the transition it does not change any of the qualitative
results.
14
For East Asia, the changes on the macroeconomic aggregates are very small at around
one tenth of a percent. The simulations clearly show that the main effects of the education
plan are on China itself. However, there is a large effect on the structure of trade for East
Asia. Overall, the value of East Asia’s exports to China rise by 2.5 percent. Aggregate
exports of low-tech manufacturing rise by 2.2 percent and agriculture rise by 1.8 percent
in the long run. These changes in the total export bundle mainly reflect the increased
sales to China.
These aggregate trade figures appear to suggest that China’s increase in skill intensity has
led to an expansion of less skill-intensive exports from East Asia. This, however, hides
some interesting composition effects in East Asia’s trade patterns that are shown in Table
6. Although China’s exports of durables to East Asia rise by 4.4 percent, there is also a
rise in East Asia’s exports of durables to China of 1.5 percent. A similar pattern is
observed in intermediate manufacturing. The loss of market share of the East Asian
economies in export sales to the rest of the world in these manufacturing sectors is
approximately balanced by rising exports to China.
The long run results indicate that China’s intended programme of higher education
investment will have significant implications for East Asia’s trade patterns. In particular,
the changes in China tend to favour unskill-intensive sectors in East Asia. Nevertheless,
the increased demand growth in China also creates new export markets for durables and
intermediate manufacturing goods with East Asia’s exports markets shifting toward
China.
4.3 Transition Dynamics
The steady state results reflect changes in the economy that have occurred after the
education investment has been realised. In the short run, during the period of education
investment, the results may be very different. Table 5 also reports some of the key
variables over the transition. On impact it can be seen that the main effect is a large 8
percent rise in the return to skilled labour. Over the initial years the student enrolments
and the flow of graduates, as shown by the output of the education sector in Table 7, rises
15
rapidly, jumping by 24 percent initially and rising to 28 percent by year 10.12 Although
the education plan drives down wage inequality in the long run, the increased education
subsidies generates a short run increase in wage inequality.
The principal cause of the rise in the skilled wage premium is the loss of available skilled
labour services due Mincerian on-the-job training costs. Specifically, all investment plans
in the model are based on the standard neoclassical model of investment with installation
costs. The human capital equivalent is the costs of bringing graduates into the work force
through training programmes and internships (Mincer, 1994). Over the transition, the
increased flow of graduates reduces the effective supply of skilled labour available for
production due to these training costs. The 8 percent rise in the skill premium is
associated with a 9 percent fall in the stock of skilled labour available for production,
which in turn, is due to the 25 percent increase in the stock of students and the flow of
graduate entrants into the labour market.13
A second interesting aspect of the transition path is that, due to the stock-flow
relationship between education output (graduates) and the stock of skilled labour, the
stock of skilled labour evolves relatively slowly. After 10 years of subsidies, the skilled
labour stock has only risen by 9.7 percent. Thus, even though we have assumed that the
subsidy is fully paid in the first year, the results emphasise that there is a long delay
between the onset of subsidies and the realisation of a more skilled labour force.14
12 Alternatively if we assume that the subsidy is phased in over 10 years, then enrolments fall initially but
rise to 21 percent by year 10.
13 Mincer (1994) finds that on-the-job training costs are associated with very significant falls in labour
productivity. See Harris and Robertson (2008) for a further discussion of these on-the-job training costs and
their impact on wage inequality.
14 This result will depend crucially on the size of the adjustment costs parameter on the skilled labour on-
the-job-training cost parameters. A smaller parameter would mean that the half life of adjustment is faster.
However it would also mean that adjustment is more rapid, so that the initial jump in skilled wages is even
larger.

16
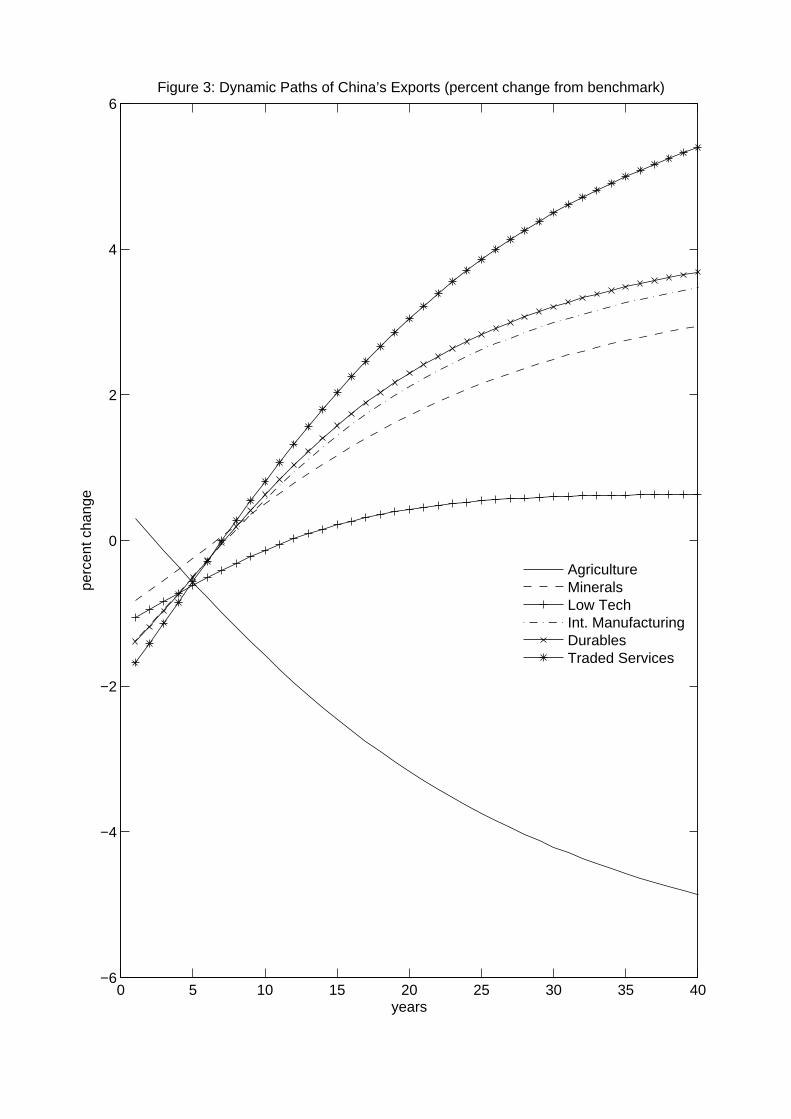
Table 7 shows the changes in sectoral outputs over the transition. The changes in the
sectoral composition of output are quite gradual and in many cases, both in China and
East Asia the effect on impact has the opposite sign to the long run impact. Figures 3 and
4 give a more detailed picture of the changes in the exports for China and East Asia.
Again it can be seen that adjustment is gradual. For example, although China’s exports of
traded services eventually rise by 7 percent but they fall initially and only rise by less
than 1 percent after ten years. For East Asia, it can be seen there is some moderate
growth in the exports of agriculture, minerals and low-tech manufacturing. The more
skill-intensive sectors in East Asia are largely unaffected by China’s education expansion.
Therefore, China’s education policy promotes East Asia’s exports in low skill-intensive
sectors but interestingly this is not at the expense of the other more skill-intensive export
sectors.
5. Conclusion
We have examined the implications of a large increase in higher education subsidies in
China, as set out in the Eleventh Five-Year Plan. In particular, we have attempted to
provide some insights into how such a radical plan might affect relative endowment
structures in China and how these changes will affect trade patterns in China and the East
Asian region. The implications for East Asia are of interest given the heightened concerns
in that region over the implications of China’s export expansion for their own export led
industrialisation policies.
We stress that the aim of this modelling exercise is not to provide a forecast but simply to
help organize our ideas about the effects of China’s education expansion and the
interactions for other countries through trade flows. Thus, many other factors are held
constant – most notably the relative productivity growth rates of the different regions.15
15 Moreover, we want to explore the implications of standard neoclassical trade and growth theory.
Therefore, no attempt has been made to improve the fit of the model by adding in ad-hoc adjustment
parameters.
17
Subject to these caveats and the usual data limitations of calibrated models, the results
indicate that the education subsidies may have large long term effect on the supply of
skilled labour - raising the stock by 33 percent and per capita income by 4.7 percent.
There is a significant shift in China’s trade patterns with durables and traded service
sectors benefiting from the increased endowment of skilled labour. The plan also
substantially reduce wage inequality in the long run but the adjustment costs associated
with large flows of graduates mean that wage inequality rises in the short run.
For the East Asian economies, the increase endowment of skilled labour in China leads to
significant changes in the structure of trade. It was shown, however, that for some sectors
that tend to lose export markets to the rest of the world, such as durables and intermediate
manufacturing, increasing sales to China largely counteract the loss of sales to the rest of
the world. Moreover, sectors which benefit in the longer term such as East Asia’s
agricultural exports do not experience significant growth in the medium term. Because
the stock of China’s skilled labour only changes slowly, the trade patterns also adjust
gradually.
Overall then, the results suggest that the expansion of education subsidies has a positive
effect on growth in China in the longer term, and will substantially reduce wage
inequality. In this sense, the policy effectively addresses concerns that have been raised
regarding skill shortages and wage inequality in China. Nevertheless, we also find that, in
the short-run, there are substantial adjustment costs due to constraints on the on-the-job
training, falling incomes and a rise in inequality. Finally, the results show that the East
Asian economies may face some structural adjustment as a result of the policy, but the
adjustment is slow and mainly involves the expansion of agricultural and low-tech
manufacturing export sectors without significant contraction of other sectors.

Appendix: Sensitivity of Trade Elasticities
To model trade costs we consider the revenue function faced by firms. Let
denote the three regions, where region 3 refers to the ROW region, 2 refers to China and
1 refers to East Asia. The unit revenue function describes the maximum revenue that
firms can generate by varying their supply of goods to each market at given prices,
. We assume that the unit revenue function is a constant elasticity of
transformation type and for a firm in sector i, in region R is given by:
}3,2,1{∈R
},,{ 3,2,1,Ri
Ri
Ri ppp
( ) φφδμ
13
1,, ⎥
⎦
⎤⎢⎣
⎡= ∑
=jji
Rjii
Ri pr (A1.)
By the envelope theorem, the derivative of the unit revenue function gives the firms
export and domestic supply decisions, per unit of gross output:
1
,,
−
⎥⎥⎦
⎤
⎢⎢⎣
⎡=
φ
δμ Ri
jiRjii
Ri r
px (A2.)
From which it can be seen that the elasticity of export supply with respect to the export
market price is φ−1. In the base case we use the values of φ−1=3.9 for Agriculture, 0.7
for traded services and 2.9 for all other sectors, which are taken from de Melo and Tarr
(1992).
Tables 8 and 9 report the steady state results for the trade elasticity cases, where the value
of these elasticities is doubled and a low case where they are halved. It can been seen
firstly the change in the stock of skilled labour in relatively insensitive to changes in the
trade elasticities and likewise, the change in GDP for China is similar across these
scenarios. The magnitude of the trade flows is moderately sensitive to this parameter.
Nevertheless, the qualitative results remain valid. In particular, even in the high trade
elasticity case, the increased skill formation in China leads to a much larger expansion of
low-tech manufacturing and agriculture from East Asia, but only very modest falls in
exports for the other manufacturing sectors.
18
19
References
Chaudhuri, S. and Ravallion, M. (2007), ‘Partially Awakened Giants: Uneven Growth in
China and India’, in Dancing With Giants: China, India, And The Global Economy,
Winters, L. A. and Yusuf, S. (eds), The World Bank, Washington DC.
Chen, X., Ran, C. and Chen, L. (2004), Change of Rate of Return to Education in Recent
Years, paper presented at the International Conference on Economics of Education,
Beijing, China, May, 2001.
Chow, G. C. (2002), China’s Economic Transformation, Malden, MA, Blackwell
Publishers.
Coxhead, I. and Li, M. (2008), ‘Prospects For Skills-Based Export Growth In A Labour-
Abundant, Resource-Rich Developing Economy’, Bulletin of Indonesian Economic
Studies, 44, 2, 209–38.
Coxhead, I. (2007), ‘A New Resource Curse? Impacts of China’s Boom on Comparative
Advantage and Resource Dependence in Southeast Asia’, World Development, 35, 7,
1099-1119.
De Melo, J. and Tarr, D. (1992), ‘A General Equilibrium Analysis of US Foreign Trade
Policy’, MIT Press, Cambridge.
Deng, Z. and Donald J. T. (1997), ‘The Impact of the Cultural Revolution on Trends in
Educational Attainment in the People’s Republic of China’, American Journal of
Sociology, 103, 2, 391–428.
Dimaranan, B. V. (2006), Global Trade, Assistance, and Production: The GTAP 6 Data
Base, Center for Global Trade Analysis, Purdue University.

20
Fleisher, B. M. and Wang, X. (2004), ‘Skill differentials, return to schooling, and market
segmentation in a transition economy: the case of Mainland China’, Journal of
Development Economics, 73, 1, 315-328.
Fleisher, B. M., Hu, Y. and Li, H. (2006), Economic transition, higher education and
worker productivity in China, Working Paper.
Hannum, E., Jere B., Meiyan W., and Jihong L. (2007), ‘Education in the Reform Era’,
Forthcoming in China’s Great Economic Transformation, edited by Loren Brandt and
Thomas Rawski, Cambridge University Press.
Harris, R. G. and Robertson, P. E. (2007), ‘Dynamic adjustments to terms of trade shocks:
The USA Productivity Boom and Australia’, Economic Record, 83, s1, S35-S45.
Harris, R. G. and Robertson, P. E. (2008), Trade Skills and Wages in the Emerging
Giants, Mimeo, School of Economics, University of New South Wales.
Heckman, J. J. and Li, X. (2004), “Selection bias, comparative advantage and
heterogeneous returns to education: evidence from China in 2000’, Pacific Economic
Review, 9, 3, 155-171.
Heckman, J. J. (2005), ‘China’s human capital investment’, China Economic Review, 16,
50-70.
Freeman, R. B. (2005), ‘Does Globalization of The Scientific/Engineering Workforce
Threaten U.S. Economic Leadership?’, NBER Working Paper 11457.
Islam, N. and Dai, E. (2004), Role of TFP in mainland China’s growth: An investigation
using the dual approach, presented at 9th International Convention of the East Asian
Economic Association.
Kreuger, A. B. and Lindahl, M. (2001), ‘Education for growth: Why and for whom?’,
Journal of Economic Literature, 39, 4, 1101-1136.

21
Lall, S. and Manuel A. (2004), ‘China’s Competitive Performance: A Threat to East
Asian Manufactured Exports?’, World Development, 32, 9, 1441–1466.
Li, Y., Whalley, J., Zhang, S. and Zhao, X. (2008), ‘The Higher Educational
Transformation Of China And Its Global Implications’, NBER Working Paper 13849
Liu, J., van Leeuwen, N., Vo, T. T., Tyers, T. and Hertel, T. (1998), ‘Disaggregating
labour payments by skill level’, Chapter 18 in R. McDougall, A. Elbehri and T.P. Truong
(eds.), Global Trade, Assistance and Protection: The GTAP 4 Database, Purdue
University: Centre for Global Trade Analysis, December 1998.
Min, Y. (2005), Historical Perspectives and Contemporary Challenges: The Case of
Chinese Universities, unpublished manuscript, Centre of Chinese Education, University
of Columbia.
Mincer, J. (1962), ‘On-the-Job Training: Costs, Returns, and Some Implications’ The
Journal of Political Economy, 70, S5, 50-79.
Mincer, J. (1994), ‘Investment in U.S. Education and Training’, NBER Working Paper
4844.
OECD (2002), Indicators of internationalisation and trade in post secondary education,
Paris, Center for Education Research and Innovation, May.
Ravenhill, J. (2006) ‘Is China an Economic Threat to Southeast Asia?’, Asian Survey, 46,
5, 653–674.
Roland-Holst, D. and Weiss, J. (2004), ‘ASEAN and China: Export Rivals or Partners in
Regional Growth?’, World Economy, 27, 8, 1255 – 1274.
The Economist (2008), ‘The Export Juggernaut’, Sep 27, 388, 8599.
Tsang, M.C. (2000), ‘Education and National Development in China since 1949:
Oscillating Policies and Enduring Dilemmas’, China Review- an Interdisciplinary
Journal on Greater China, 579-618.
22
Weiss, J. and Gao S. (2003), ‘People’s Republic of China’s export threat to ASEAN:
Competition in the US and Japanese markets’, ADB Institute Discussion Paper No. 2,
Asian Development Bank.
Wilcoxen, P. J. (1988), The effects of environmental regulation and energy prices on US
economic performance, PhD Thesis, Harvard University.
World Education Indicator Programme (WEIP) (2002), Financing education –
investments and returns: Analysis of the world education indicators, UNESCO Institute
for Statistics and OECD.
Zhang, W. (2006), China’s higher education trade and the impact of the WTO/GATT
liberalisation, PhD thesis, University of Columbia.
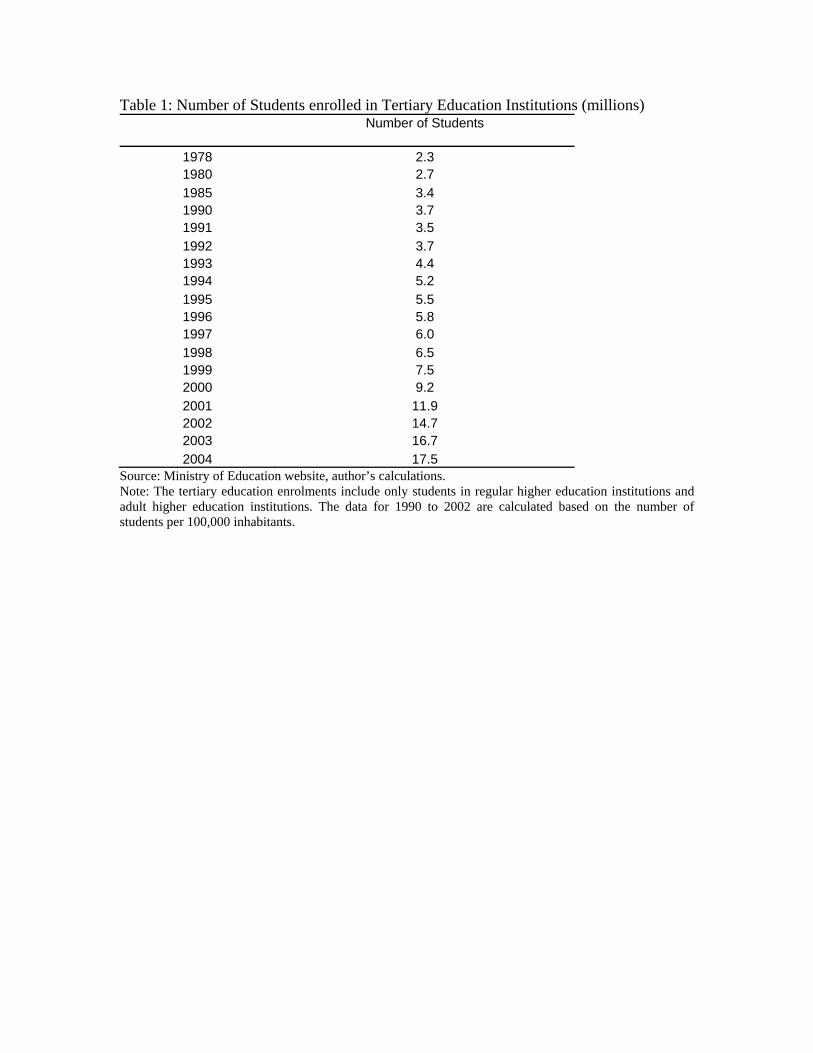
Table 1: Number of Students enrolled in Tertiary Education Institutions (millions)
Number of Students
1978 2.3 1980 2.7 1985 3.4 1990 3.7 1991 3.5 1992 3.7 1993 4.4 1994 5.2 1995 5.5 1996 5.8 1997 6.0 1998 6.5 1999 7.5 2000 9.2 2001 11.9 2002 14.7 2003 16.7 2004 17.5
Source: Ministry of Education website, author’s calculations. Note: The tertiary education enrolments include only students in regular higher education institutions and adult higher education institutions. The data for 1990 to 2002 are calculated based on the number of students per 100,000 inhabitants.
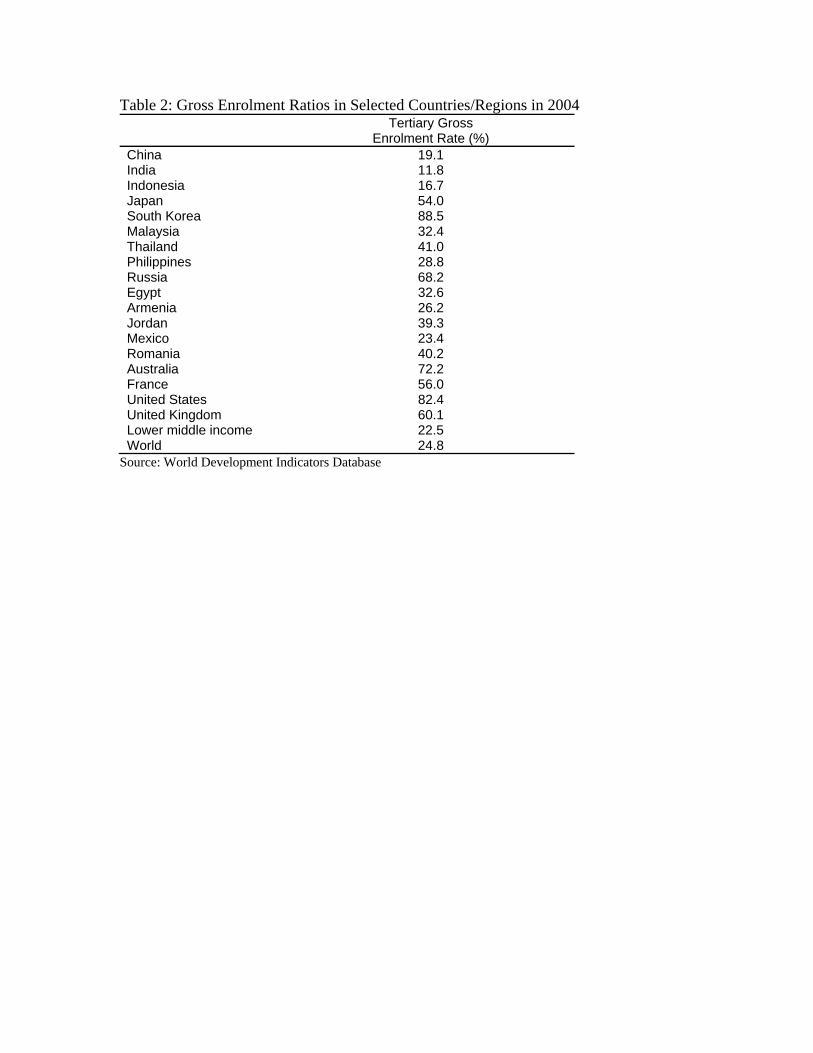
Table 2: Gross Enrolment Ratios in Selected Countries/Regions in 2004
Tertiary Gross
Enrolment Rate (%) China 19.1 India 11.8 Indonesia 16.7 Japan 54.0 South Korea 88.5 Malaysia 32.4 Thailand 41.0 Philippines 28.8 Russia 68.2 Egypt 32.6 Armenia 26.2 Jordan 39.3 Mexico 23.4 Romania 40.2 Australia 72.2 France 56.0 United States 82.4 United Kingdom 60.1 Lower middle income 22.5 World 24.8
Source: World Development Indicators Database
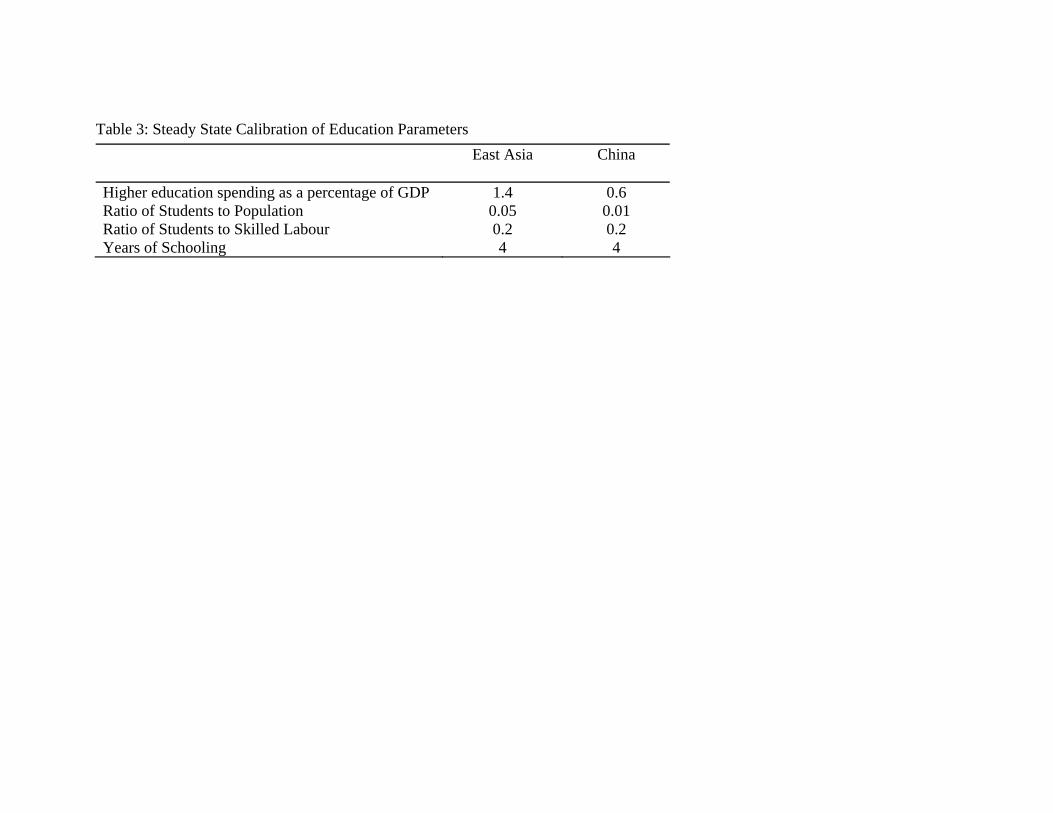
Table 3: Steady State Calibration of Education Parameters East Asia China
Higher education spending as a percentage of GDP 1.4 0.6 Ratio of Students to Population 0.05 0.01 Ratio of Students to Skilled Labour 0.2 0.2 Years of Schooling 4 4
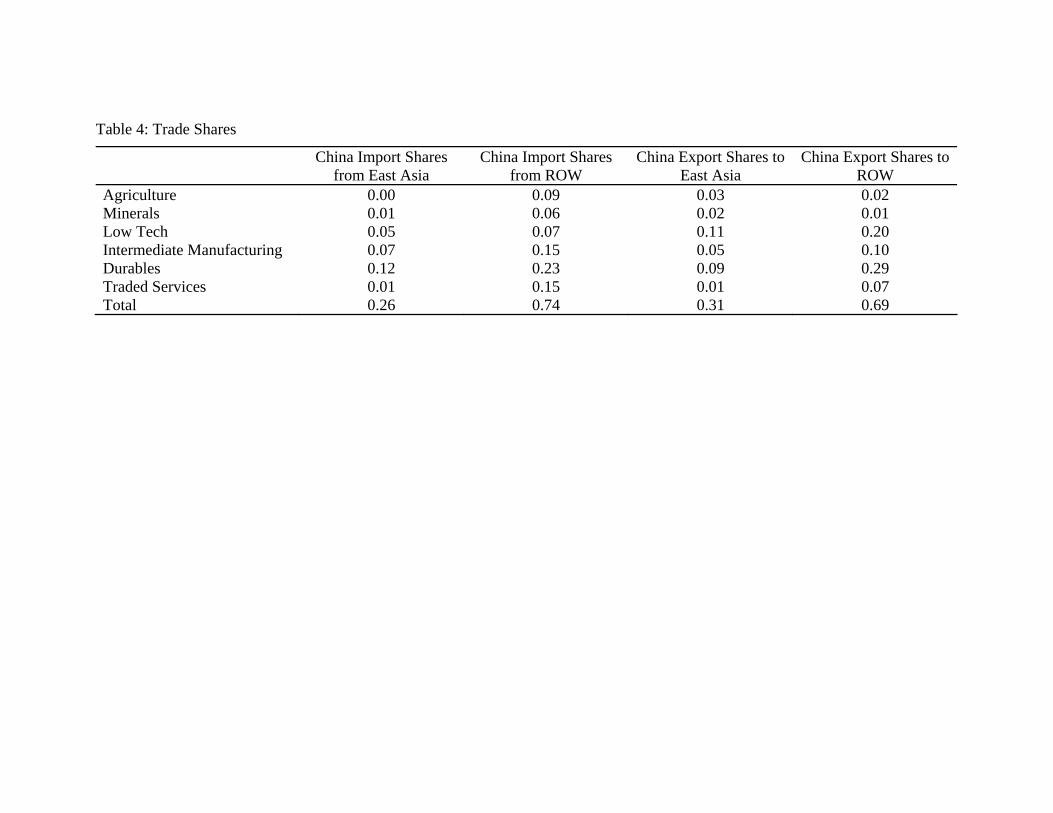
Table 4: Trade Shares
China Import Shares from East Asia
China Import Shares from ROW
China Export Shares to East Asia
China Export Shares to ROW
Agriculture 0.00 0.09 0.03 0.02 Minerals 0.01 0.06 0.02 0.01 Low Tech 0.05 0.07 0.11 0.20 Intermediate Manufacturing 0.07 0.15 0.05 0.10 Durables 0.12 0.23 0.09 0.29 Traded Services 0.01 0.15 0.01 0.07 Total 0.26 0.74 0.31 0.69
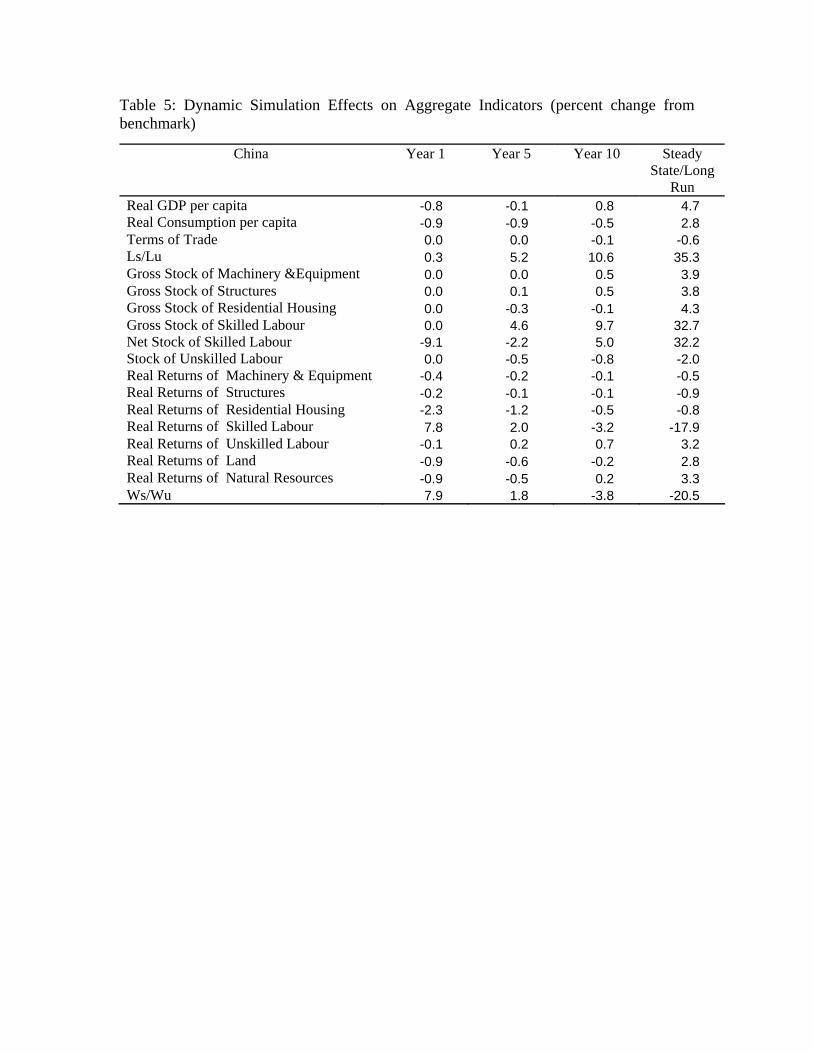
Table 5: Dynamic Simulation Effects on Aggregate Indicators (percent change from benchmark)
China Year 1 Year 5 Year 10 Steady State/Long
Run Real GDP per capita -0.8 -0.1 0.8 4.7 Real Consumption per capita -0.9 -0.9 -0.5 2.8 Terms of Trade 0.0 0.0 -0.1 -0.6 Ls/Lu 0.3 5.2 10.6 35.3 Gross Stock of Machinery &Equipment 0.0 0.0 0.5 3.9 Gross Stock of Structures 0.0 0.1 0.5 3.8 Gross Stock of Residential Housing 0.0 -0.3 -0.1 4.3 Gross Stock of Skilled Labour 0.0 4.6 9.7 32.7 Net Stock of Skilled Labour -9.1 -2.2 5.0 32.2 Stock of Unskilled Labour 0.0 -0.5 -0.8 -2.0 Real Returns of Machinery & Equipment -0.4 -0.2 -0.1 -0.5 Real Returns of Structures -0.2 -0.1 -0.1 -0.9 Real Returns of Residential Housing -2.3 -1.2 -0.5 -0.8 Real Returns of Skilled Labour 7.8 2.0 -3.2 -17.9 Real Returns of Unskilled Labour -0.1 0.2 0.7 3.2 Real Returns of Land -0.9 -0.6 -0.2 2.8 Real Returns of Natural Resources -0.9 -0.5 0.2 3.3 Ws/Wu 7.9 1.8 -3.8 -20.5
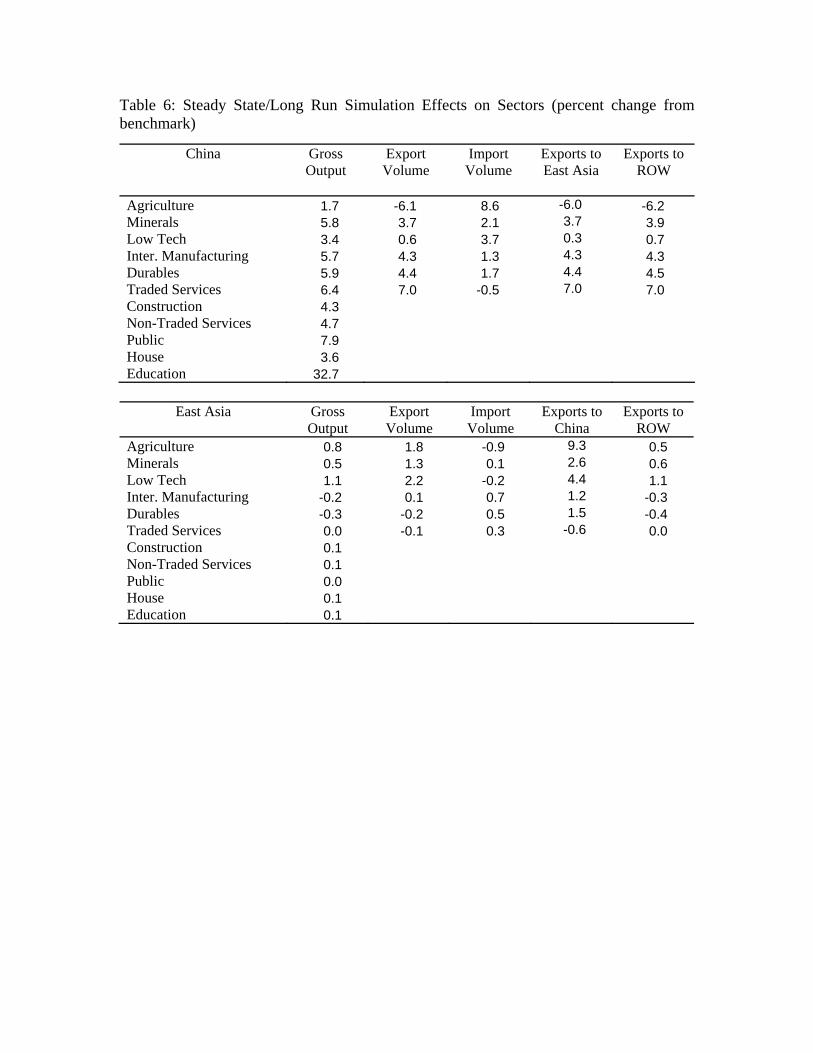
Table 6: Steady State/Long Run Simulation Effects on Sectors (percent change from benchmark)
China Gross Output
Export Volume
Import Volume
Exports to East Asia
Exports to ROW
Agriculture 1.7 -6.1 8.6 -6.0 -6.2 Minerals 5.8 3.7 2.1 3.7 3.9 Low Tech 3.4 0.6 3.7 0.3 0.7 Inter. Manufacturing 5.7 4.3 1.3 4.3 4.3 Durables 5.9 4.4 1.7 4.4 4.5 Traded Services 6.4 7.0 -0.5 7.0 7.0 Construction 4.3 Non-Traded Services 4.7 Public 7.9 House 3.6
East Asia Gross
Output Export Volume
Import Volume
Exports to China
Education 32.7
Exports to ROW
Agriculture 0.8 1.8 -0.9 9.3 0.5 Minerals 0.5 1.3 0.1 2.6 0.6 Low Tech 1.1 2.2 -0.2 4.4 1.1 Inter. Manufacturing -0.2 0.1 0.7 1.2 -0.3 Durables -0.3 -0.2 0.5 1.5 -0.4 Traded Services 0.0 -0.1 0.3 -0.6 0.0 Construction 0.1 Non-Traded Services 0.1 Public 0.0 House 0.1 Education 0.1

Table 7: Transitions on Gross Output (percent change from benchmark) China
Year 1 Year 5 Year 10 Steady State
Agriculture -0.8 -0.8 -0.6 1.7 Minerals -1.3 -0.4 0.8 5.8 Low Tech -1.2 -0.5 0.3 3.4 Inter. Manufacturing -1.3 -0.4 0.8 5.7 Durables -1.4 1.1 -0.5 5.9 Traded Services -1.5 -0.5 0.7 6.4 Construction -0.6 0.2 1.0 4.3 Non-Traded Services -1.1 -0.4 0.5 4.7 Public -2.2 -0.7 1.0 7.9 House -0.3 -0.5 -0.2 3.6
East Asia
Year 1 Year 5 Year 10
Education 24.5 26.4 28.1 32.7
Steady State
Agriculture -0.1 0.0 0.2 0.8 Minerals -0.3 -0.2 0.0 0.6 Low Tech 0.4 0.3 0.3 1.1 Inter. Manufacturing 0.1 0.0 0.0 -0.2 Durables -0.1 -0.1 -0.1 -0.3 Traded Services 0.0 0.0 0.0 0.0 Construction 0.0 0.0 0.0 0.1 Non-Traded Services 0.0 0.0 0.0 0.1 Public 0.0 0.0 0.0 0.0 House 0.0 0.0 0.0 0.1 Education 0.0 0.0 0.0 0.1

Table 8: Sensitivity of Trade Elasticities on Aggregate Indicators at Steady State (percent change from benchmark)
China Low Medium (Base Case)
High
Real GDP per capita 3.9 4.7 5.4 Real Consumption per capita 2.2 2.8 3.5 Terms of Trade 0.3 -0.6 -0.3 Ls/Lu 35.0 35.3 36.4 Gross Stock of Machinery &Equipment 2.4 3.9 5.0 Gross Stock of Structures 2.8 3.8 4.7 Gross Stock of Residential Housing 3.5 4.3 5.1 Gross Stock of Skilled Labour 32.3 32.7 33.7 Net Stock of Skilled Labour 32.2 32.2 32.2 Stock of Unskilled Labour -2.0 -2.0 -2.0 Real Returns of Machinery & Equipment -0.2 -0.5 -0.5 Real Returns of Structures -0.9 -0.9 -0.8 Real Returns of Residential Housing -0.9 -0.8 -0.8 Real Returns of Skilled Labour -18.4 -17.9 -17.8 Real Returns of Unskilled Labour 2.7 3.2 3.5 Real Returns of Land 2.7 2.8 2.3 Real Returns of Natural Resources 2.9 3.3 3.3
Ws/Wu -20.5 -20.5 -20.6
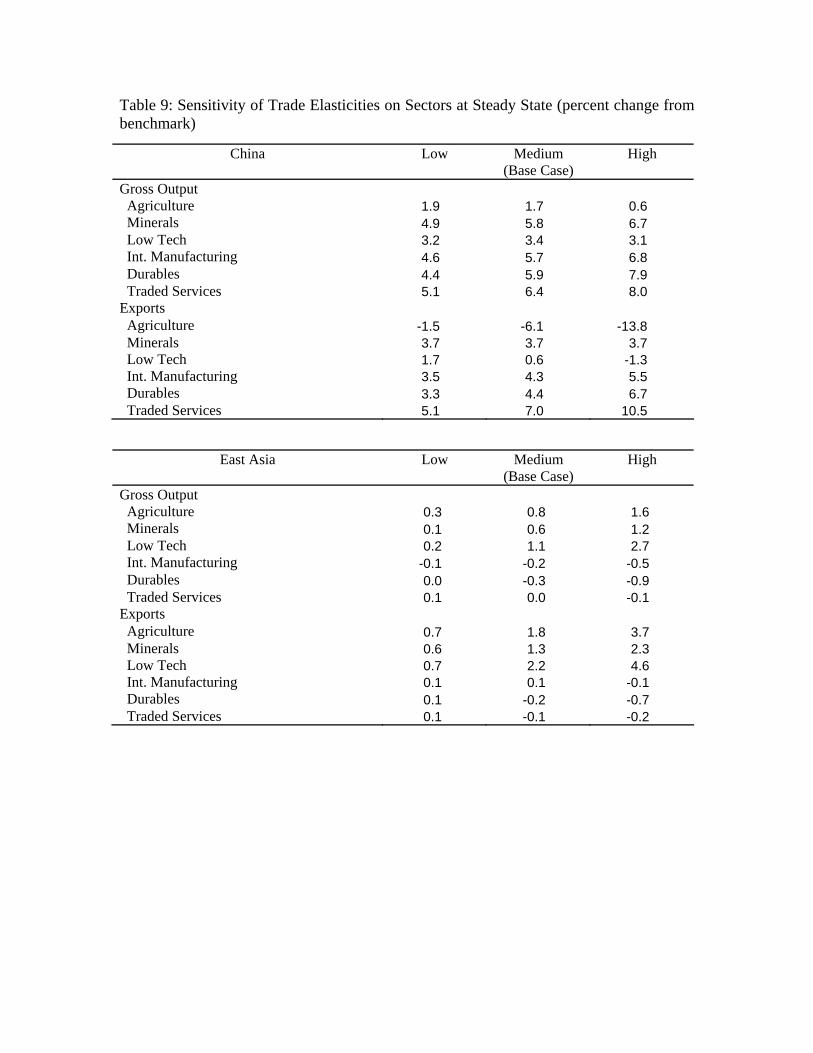
Table 9: Sensitivity of Trade Elasticities on Sectors at Steady State (percent change from benchmark)
China Low Medium (Base Case)
High
Gross Output Agriculture 1.9 1.7 0.6 Minerals 4.9 5.8 6.7 Low Tech 3.2 3.4 3.1 Int. Manufacturing 4.6 5.7 6.8 Durables 4.4 5.9 7.9 Traded Services 5.1 6.4 8.0 Exports Agriculture -1.5 -6.1 -13.8 Minerals 3.7 3.7 3.7 Low Tech 1.7 0.6 -1.3 Int. Manufacturing 3.5 4.3 5.5 Durables 3.3 4.4 6.7
Traded Services 5.1 7.0 10.5
East Asia Low Medium (Base Case)
High
Gross Output Agriculture 0.3 0.8 1.6 Minerals 0.1 0.6 1.2 Low Tech 0.2 1.1 2.7 Int. Manufacturing -0.1 -0.2 -0.5 Durables 0.0 -0.3 -0.9 Traded Services 0.1 0.0 -0.1 Exports Agriculture 0.7 1.8 3.7 Minerals 0.6 1.3 2.3 Low Tech 0.7 2.2 4.6 Int. Manufacturing 0.1 0.1 -0.1 Durables 0.1 -0.2 -0.7
Traded Services 0.1 -0.1 -0.2
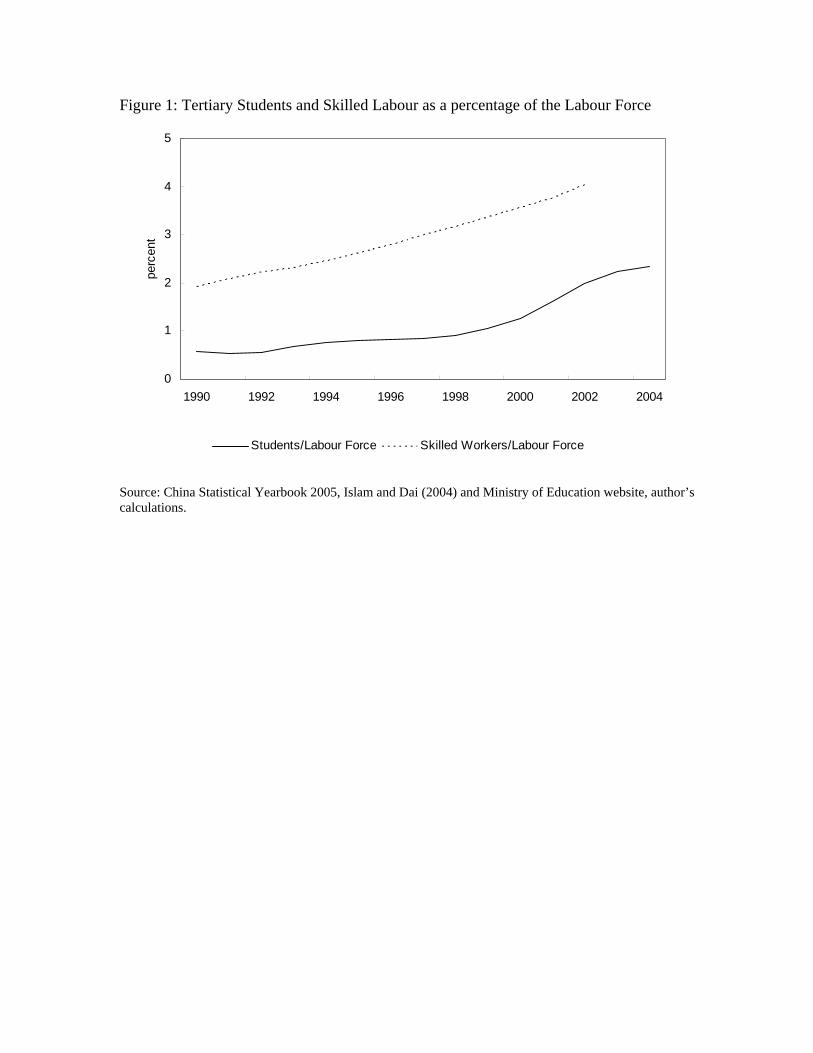
Figure 1: Tertiary Students and Skilled Labour as a percentage of the Labour Force
0
1
2
3
4
5
1990 1992 1994 1996 1998 2000 2002 2004
perc
ent
Students/Labour Force Skilled Workers/Labour Force
Source: China Statistical Yearbook 2005, Islam and Dai (2004) and Ministry of Education website, author’s calculations.

Figure 2: Total Expenditure and Public Expenditure on Education as a percentage of GDP
0
1
2
3
4
5
6
1991 1992 1993 1994 1995 1996 1997 1998 1999 2000 2001 2002 2003 2004
perc
ent
Total Education/GDP Government Spending/GDP
Source: China Educational Finance Statistical Yearbook 2003, China Statistical Yearbook (various years)
0 5 10 15 20 25 30 35 40−6
−4
−2
0
2
4
6Figure 3: Dynamic Paths of China’s Exports (percent change from benchmark)
years
perc
ent c
hang
e
AgricultureMineralsLow TechInt. ManufacturingDurablesTraded Services

0 5 10 15 20 25 30 35 40−6
−4
−2
0
2
4
6Figure 4: Dynamic Paths of East Asia’s Exports (percent change from benchmark)
years
perc
ent c
hang
e
AgricultureMineralsLow TechInt. ManufacturingDurablesTraded Services