Embed Size (px)
Citation preview
China Forum
SEMICON Europa
Nov 17,2017
2
China Forum Agenda
• 10:15-10:30 Registration
• 10:30-10:50 Introduction – Laith Altimime, President of SEMI Europe
• 10:50-11:20 The Rise of China IC Industry, Overview – Lung Chu,
President of SEMI China
• 11:20-11:30 SEMI innovation Investment Platform (SIIP) – EU/China
Collaboration
• 11:30-12:00 China Opportunity in an AI Era – Emon Wang, GM of
Techcode Germany
• 12:00-12:30 Q&A Session
The Rise of China IC Industry
- As A Global Ecosystem Partner
Lung Chu 居龙
President, SEMI China
Nov 17,2017 ITPC
4
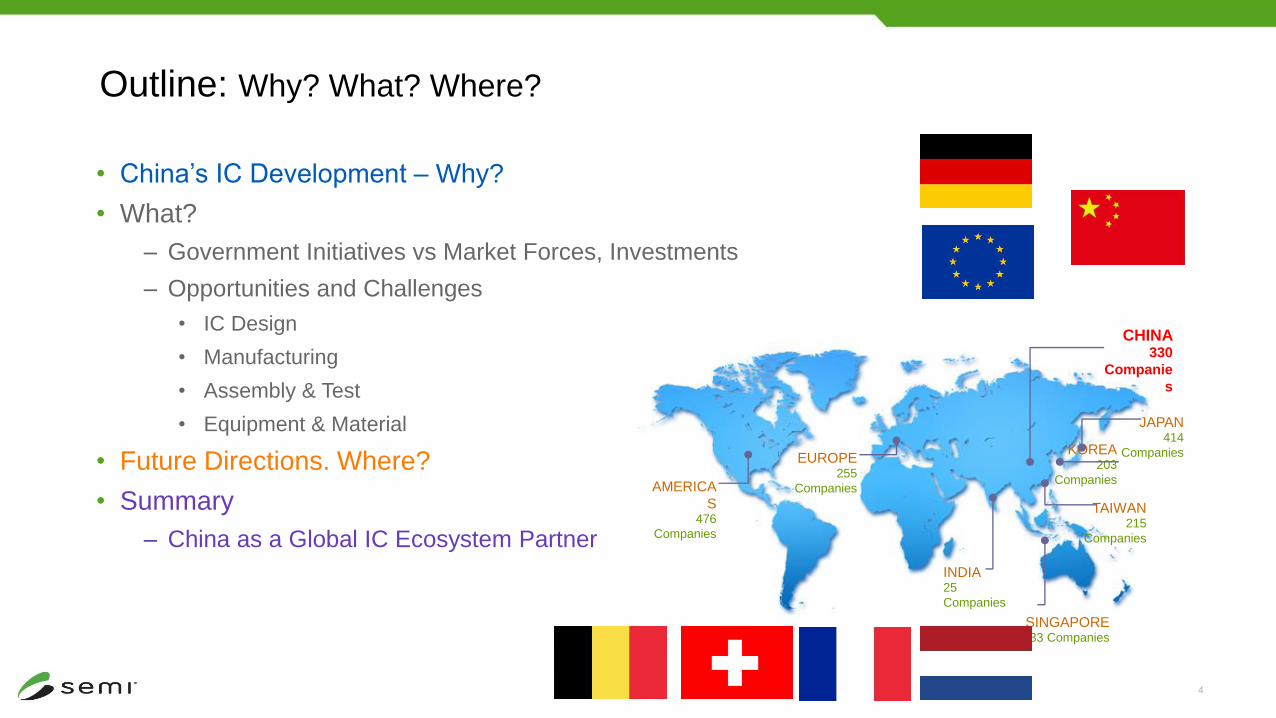
Outline: Why? What? Where?
• China’s IC Development – Why?
• What?
– Government Initiatives vs Market Forces, Investments
– Opportunities and Challenges
• IC Design
• Manufacturing
• Assembly & Test
• Equipment & Material
• Future Directions. Where?
• Summary
– China as a Global IC Ecosystem Partner
CHINA330
Companie
s
EUROPE255
Companies
INDIA25
Companies
JAPAN414
CompaniesKOREA203
CompaniesAMERICA
S476
Companies
SINGAPORE33 Companies
TAIWAN215
Companies
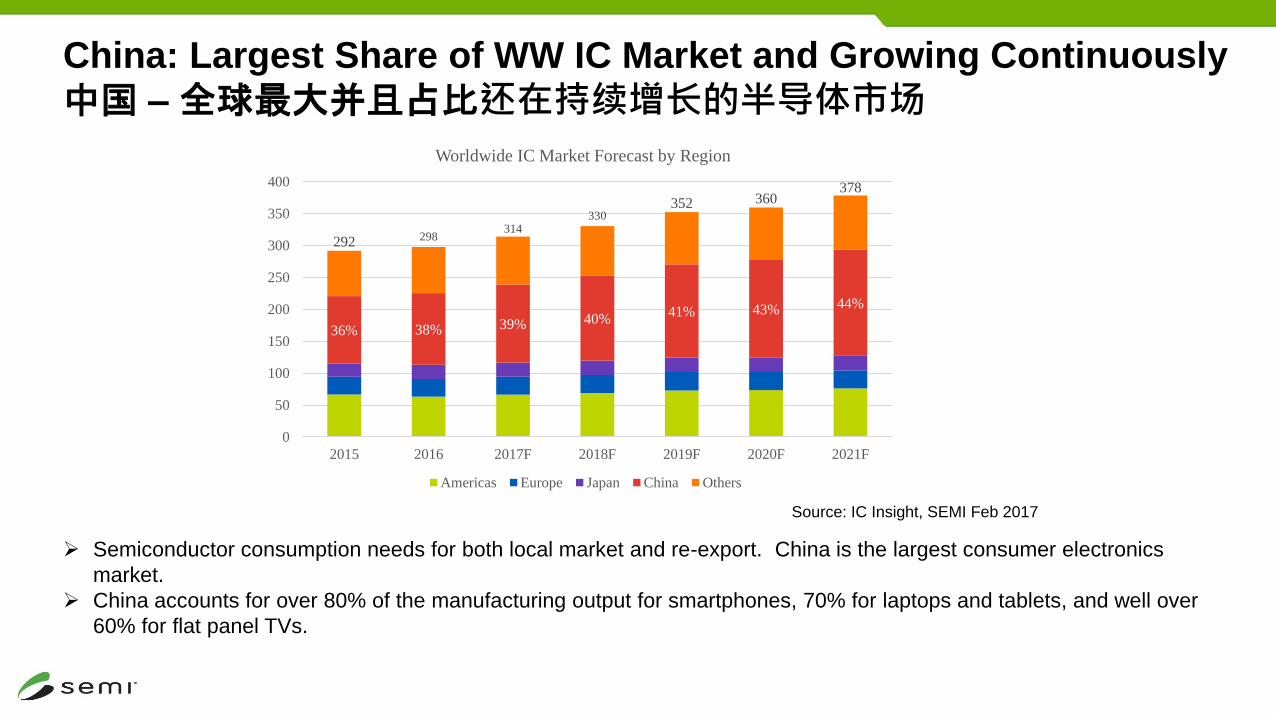
China: Largest Share of WW IC Market and Growing Continuously
中国 – 全球最大并且占比还在持续增长的半导体市场
Semiconductor consumption needs for both local market and re-export. China is the largest consumer electronics
market.
China accounts for over 80% of the manufacturing output for smartphones, 70% for laptops and tablets, and well over
60% for flat panel TVs.
Source: IC Insight, SEMI Feb 2017
36% 38% 39% 40%41% 43% 44%
292 298314
330352 360
378
0
50
100
150
200
250
300
350
400
2015 2016 2017F 2018F 2019F 2020F 2021F
Worldwide IC Market Forecast by Region
Americas Europe Japan China Others
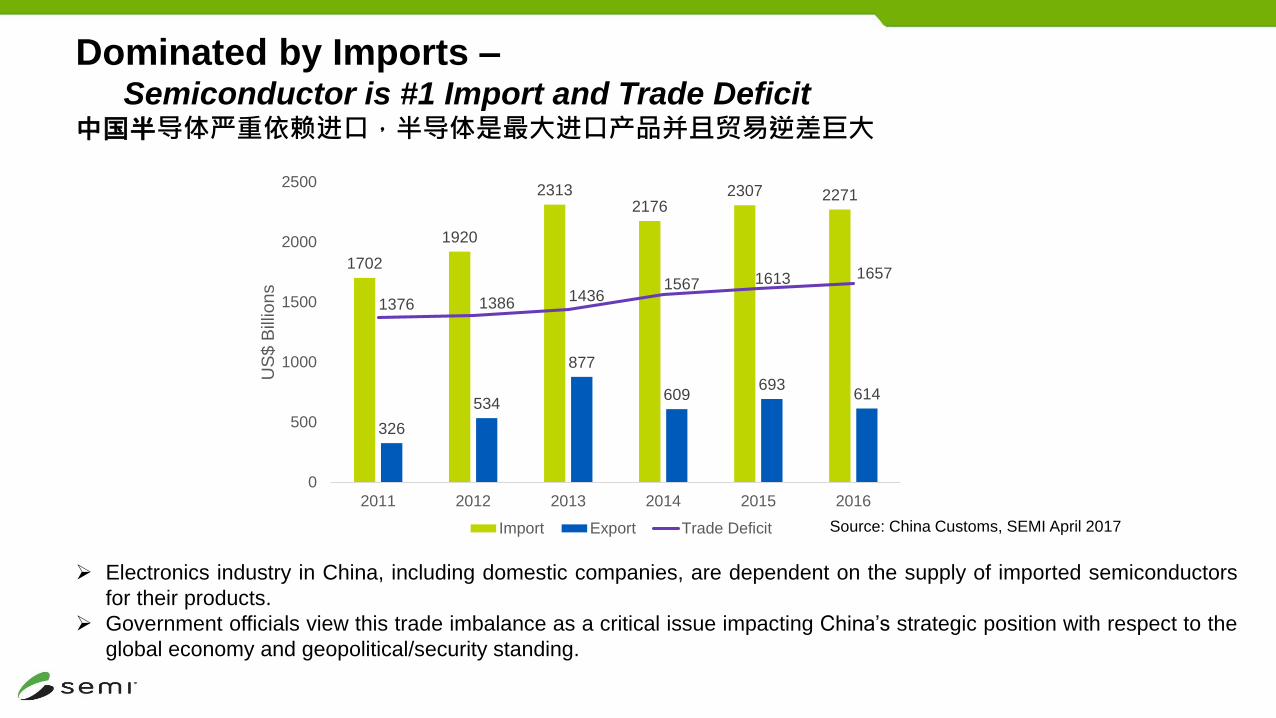
Dominated by Imports –Semiconductor is #1 Import and Trade Deficit
中国半导体严重依赖进口,半导体是最大进口产品并且贸易逆差巨大
Source: China Customs, SEMI April 2017
Electronics industry in China, including domestic companies, are dependent on the supply of imported semiconductors
for their products.
Government officials view this trade imbalance as a critical issue impacting China’s strategic position with respect to the
global economy and geopolitical/security standing.
1702
1920
23132176
2307 2271
326
534
877
609693
614
1376 1386 14361567 1613 1657
0
500
1000
1500
2000
2500
2011 2012 2013 2014 2015 2016
US
$ B
illio
ns
Import Export Trade Deficit
7
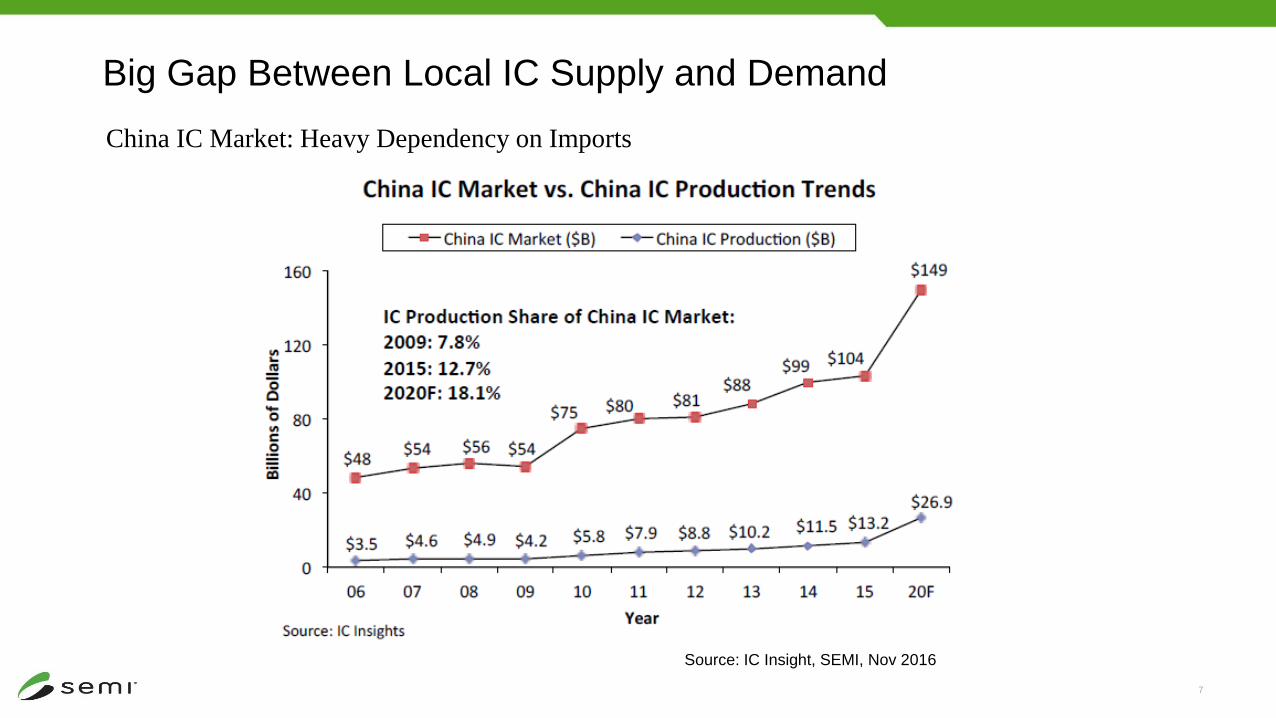
Big Gap Between Local IC Supply and Demand
China IC Market: Heavy Dependency on Imports
Source: IC Insight, SEMI, Nov 2016
9
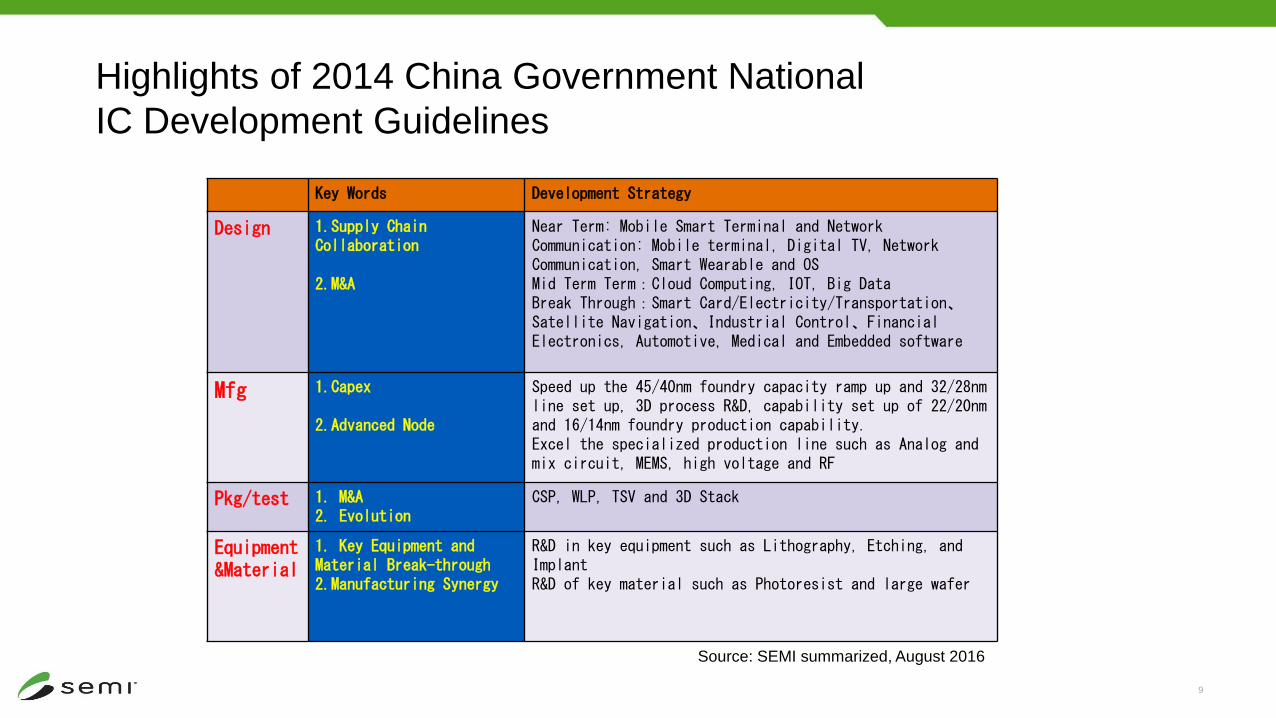
Key Words Development Strategy
Design 1.Supply Chain Collaboration
2.M&A
Near Term: Mobile Smart Terminal and Network Communication: Mobile terminal, Digital TV, Network Communication, Smart Wearable and OSMid Term Term:Cloud Computing, IOT, Big DataBreak Through:Smart Card/Electricity/Transportation、Satellite Navigation、Industrial Control、FinancialElectronics, Automotive, Medical and Embedded software
Mfg 1.Capex
2.Advanced Node
Speed up the 45/40nm foundry capacity ramp up and 32/28nmline set up, 3D process R&D, capability set up of 22/20nmand 16/14nm foundry production capability.Excel the specialized production line such as Analog and mix circuit, MEMS, high voltage and RF
Pkg/test 1. M&A2. Evolution
CSP, WLP, TSV and 3D Stack
Equipment &Material
1. Key Equipment and Material Break-through2.Manufacturing Synergy
R&D in key equipment such as Lithography, Etching, and ImplantR&D of key material such as Photoresist and large wafer
Highlights of 2014 China Government National
IC Development Guidelines
Source: SEMI summarized, August 2016
10
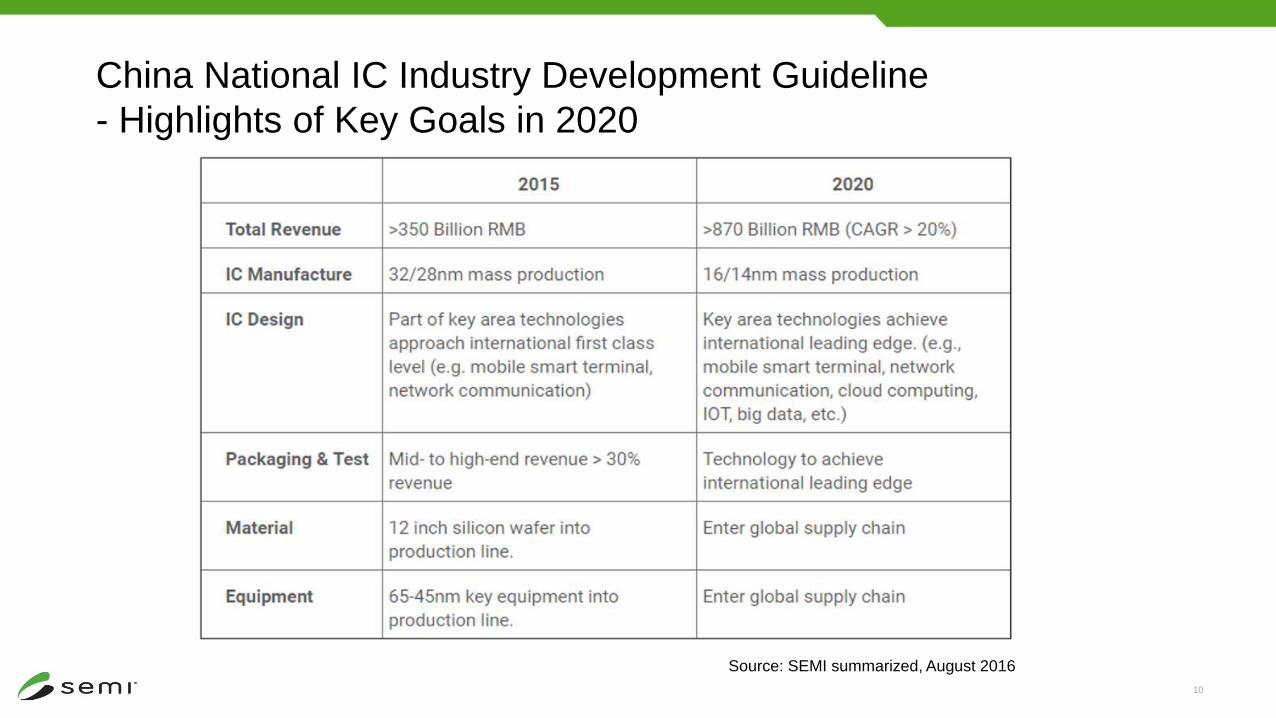
China National IC Industry Development Guideline
- Highlights of Key Goals in 2020
Source: SEMI summarized, August 2016
11
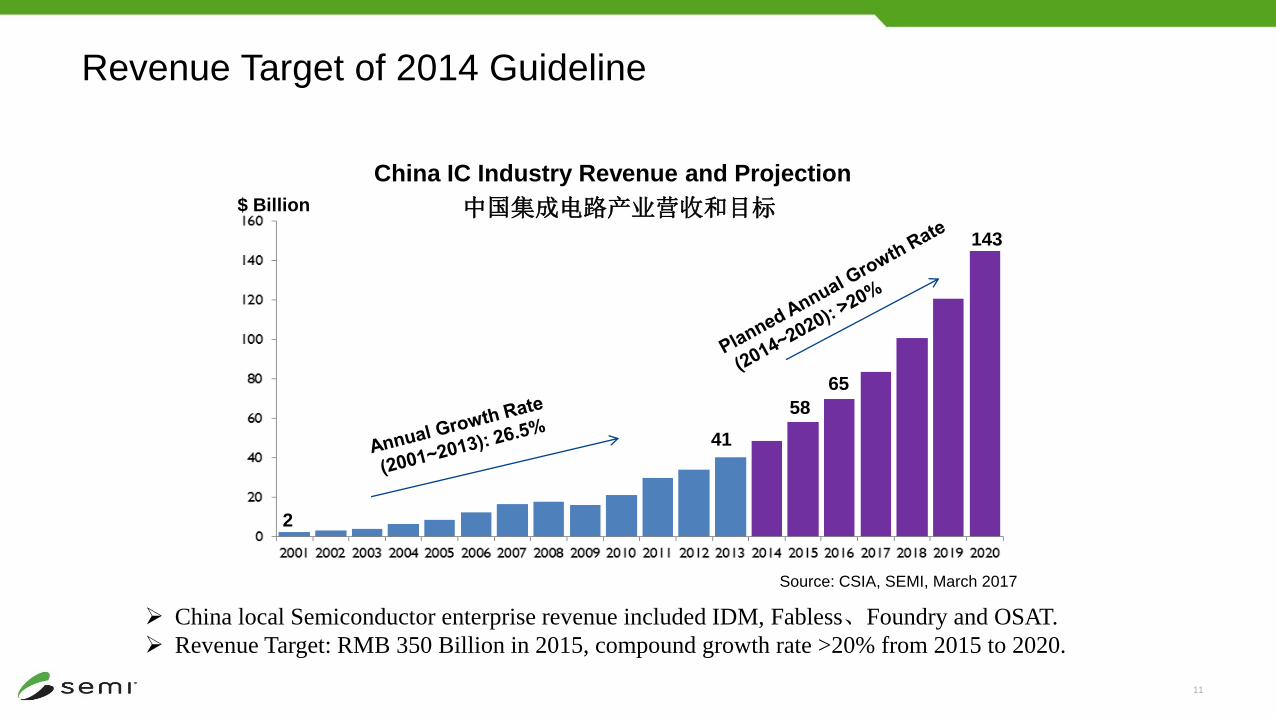
Revenue Target of 2014 Guideline
China IC Industry Revenue and Projection
41
65
143
$ Billion
2
58
Source: CSIA, SEMI, March 2017
中国集成电路产业营收和目标
China local Semiconductor enterprise revenue included IDM, Fabless、Foundry and OSAT.
Revenue Target: RMB 350 Billion in 2015, compound growth rate >20% from 2015 to 2020.
12
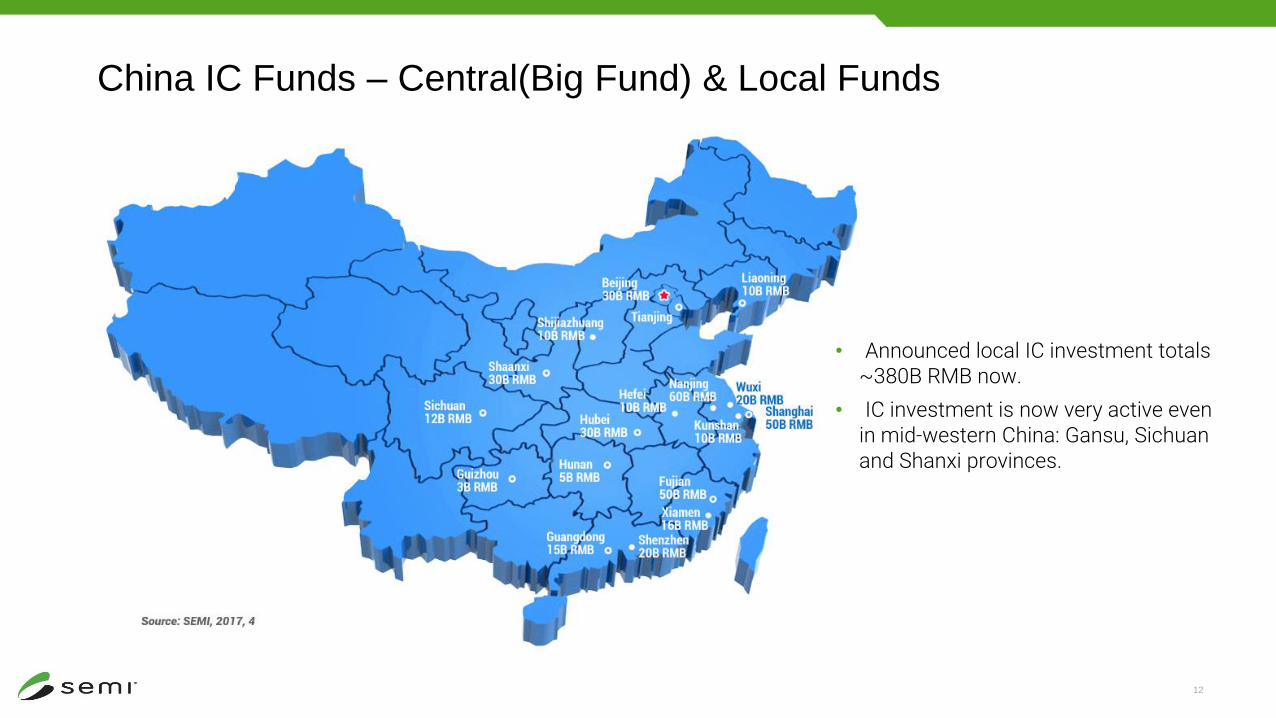
China IC Funds – Central(Big Fund) & Local Funds
About• Announced local IC investment totals
~380B RMB now.
• IC investment is now very active even in mid-western China: Gansu, Sichuan and Shanxi provinces.
14
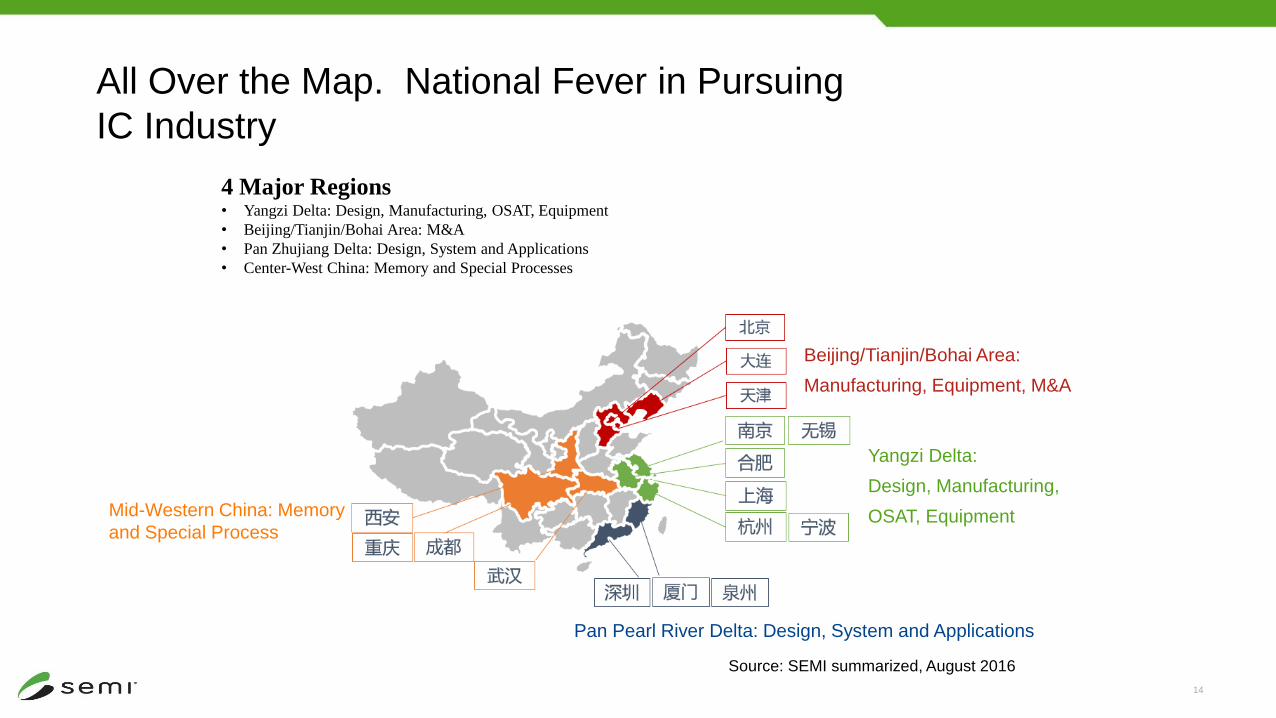
All Over the Map. National Fever in Pursuing
IC Industry
4 Major Regions• Yangzi Delta: Design, Manufacturing, OSAT, Equipment
• Beijing/Tianjin/Bohai Area: M&A
• Pan Zhujiang Delta: Design, System and Applications
• Center-West China: Memory and Special Processes
Beijing/Tianjin/Bohai Area:
Manufacturing, Equipment, M&A
Yangzi Delta:
Design, Manufacturing,
OSAT, EquipmentMid-Western China: Memory
and Special Process
Pan Pearl River Delta: Design, System and Applications
Source: SEMI summarized, August 2016
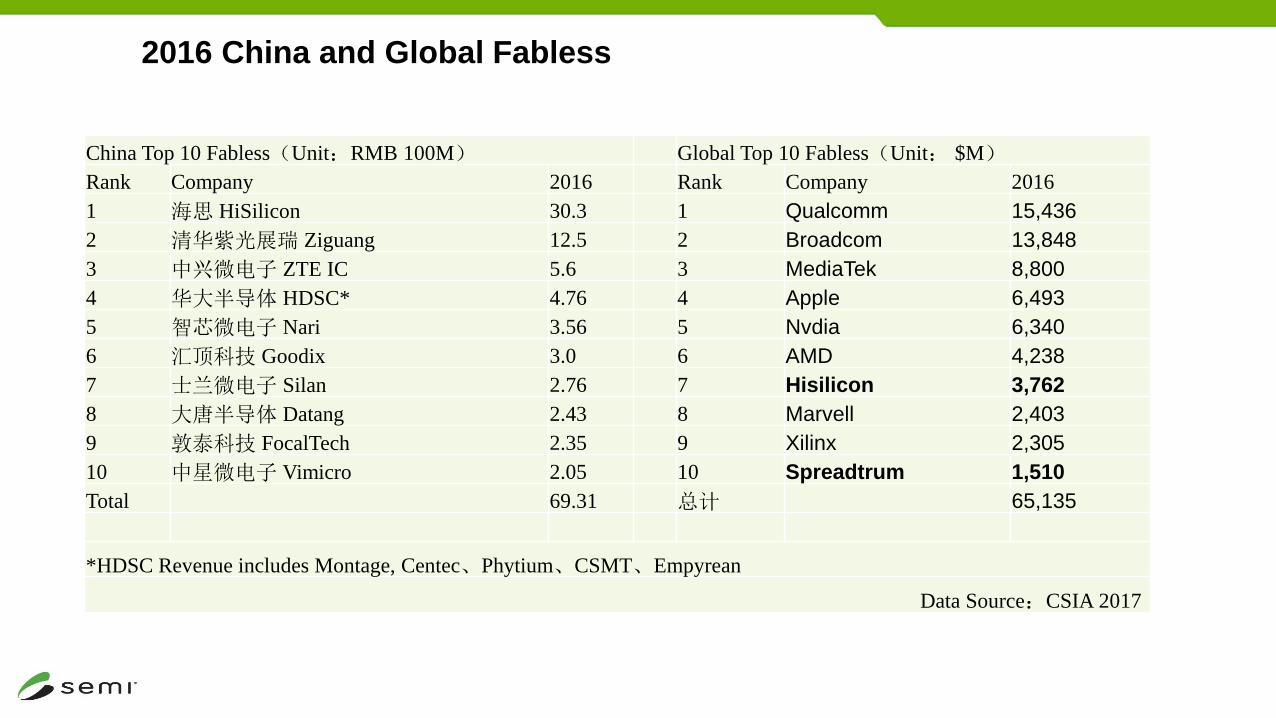
2016 China and Global Fabless
China Top 10 Fabless(Unit:RMB 100M) Global Top 10 Fabless(Unit: $M)
Rank Company 2016 Rank Company 2016
1 海思 HiSilicon 30.3 1 Qualcomm 15,436
2 清华紫光展瑞 Ziguang 12.5 2 Broadcom 13,848
3 中兴微电子 ZTE IC 5.6 3 MediaTek 8,800
4 华大半导体 HDSC* 4.76 4 Apple 6,493
5 智芯微电子 Nari 3.56 5 Nvdia 6,340
6 汇顶科技 Goodix 3.0 6 AMD 4,238
7 士兰微电子 Silan 2.76 7 Hisilicon 3,762
8 大唐半导体 Datang 2.43 8 Marvell 2,403
9 敦泰科技 FocalTech 2.35 9 Xilinx 2,305
10 中星微电子 Vimicro 2.05 10 Spreadtrum 1,510
Total 69.31 总计 65,135
*HDSC Revenue includes Montage, Centec、Phytium、CSMT、Empyrean
Data Source:CSIA 2017
16
99 97 125 134 143 161
534 569632 681
736
1362
0
200
400
600
800
1000
1200
1400
1600
2011 2012 2013 2014 2015 2016
Nu
mb
er
of C
om
pa
nie
s
Sales >100M RMB Other Fabless
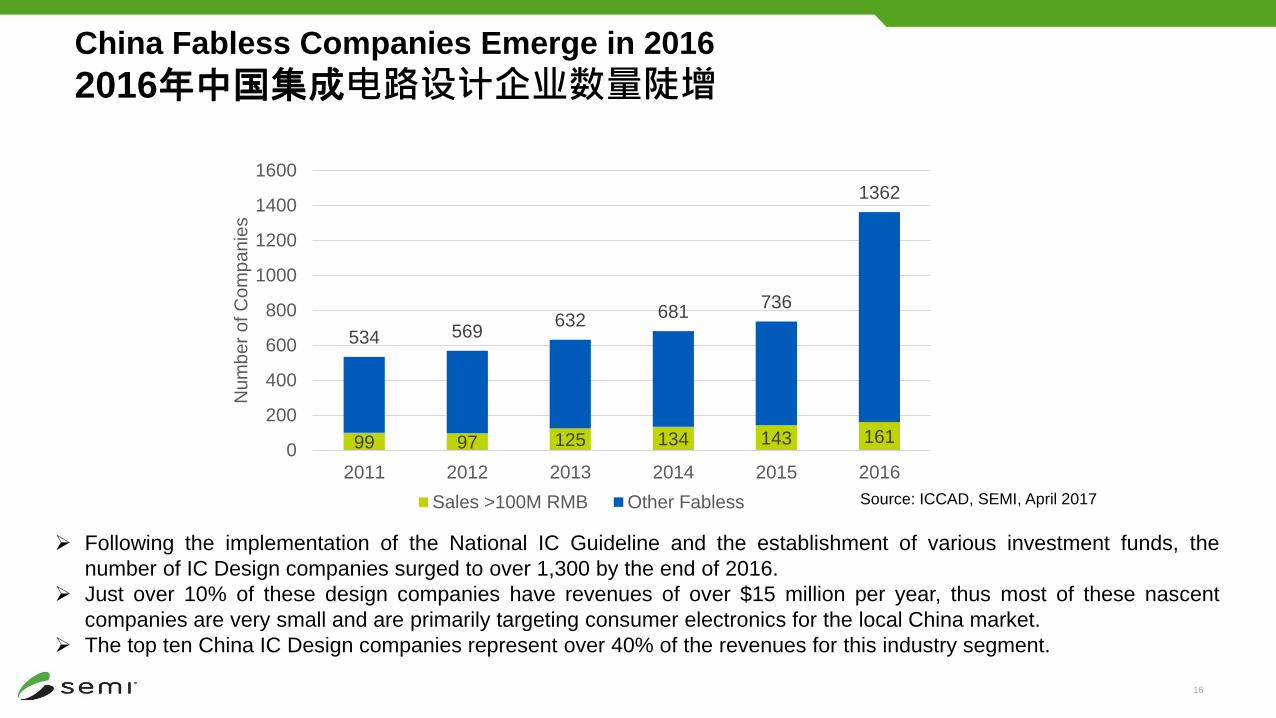
China Fabless Companies Emerge in 2016
2016年中国集成电路设计企业数量陡增
Source: ICCAD, SEMI, April 2017
Following the implementation of the National IC Guideline and the establishment of various investment funds, the
number of IC Design companies surged to over 1,300 by the end of 2016.
Just over 10% of these design companies have revenues of over $15 million per year, thus most of these nascent
companies are very small and are primarily targeting consumer electronics for the local China market.
The top ten China IC Design companies represent over 40% of the revenues for this industry segment.
17
18
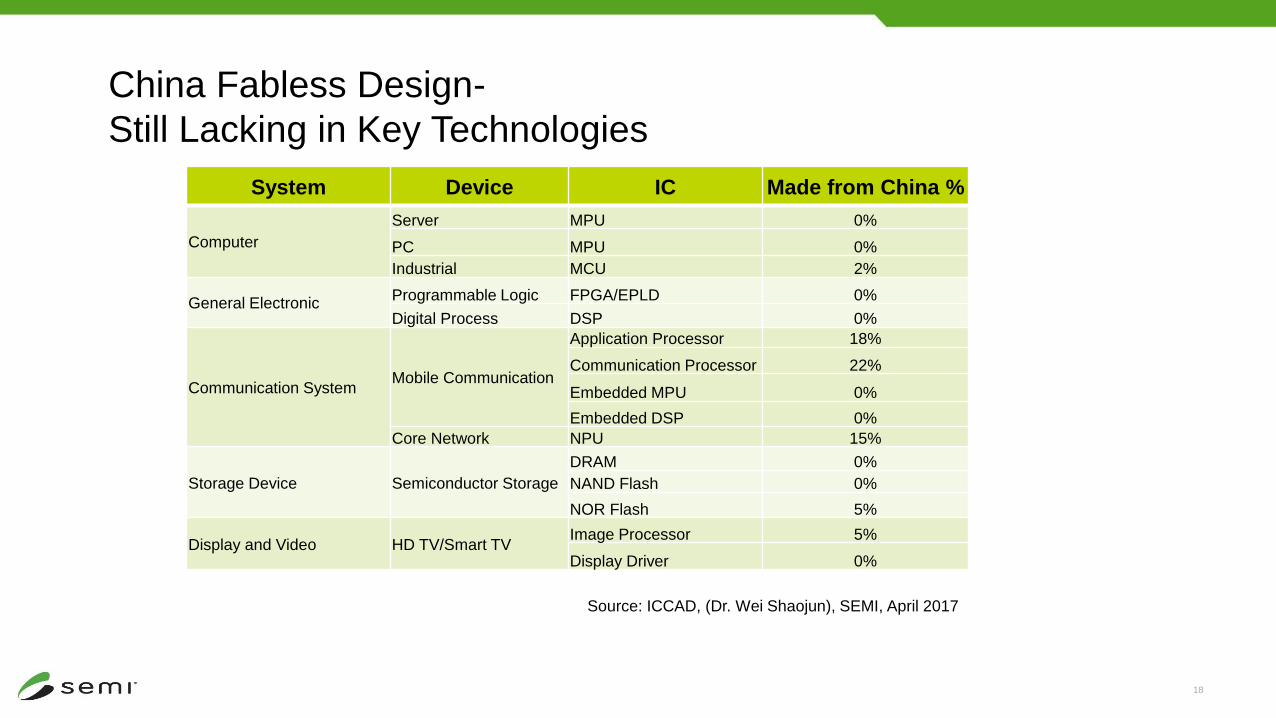
China Fabless Design-
Still Lacking in Key Technologies
System Device IC Made from China %
Computer
Server MPU 0%
PC MPU 0%
Industrial MCU 2%
General ElectronicProgrammable Logic FPGA/EPLD 0%
Digital Process DSP 0%
Communication SystemMobile Communication
Application Processor 18%
Communication Processor 22%
Embedded MPU 0%
Embedded DSP 0%
Core Network NPU 15%
Storage Device Semiconductor Storage
DRAM 0%
NAND Flash 0%
NOR Flash 5%
Display and Video HD TV/Smart TVImage Processor 5%
Display Driver 0%
Source: ICCAD, (Dr. Wei Shaojun), SEMI, April 2017
0
500.000
1.000.000
1.500.000
2.000.000
2.500.000
3.000.000
3.500.000
4.000.000
4.500.000
Americas China Europe &Mideast
Japan Korea SE Asia Taiwan
<= 150mm 200mm 300mm
27%
19
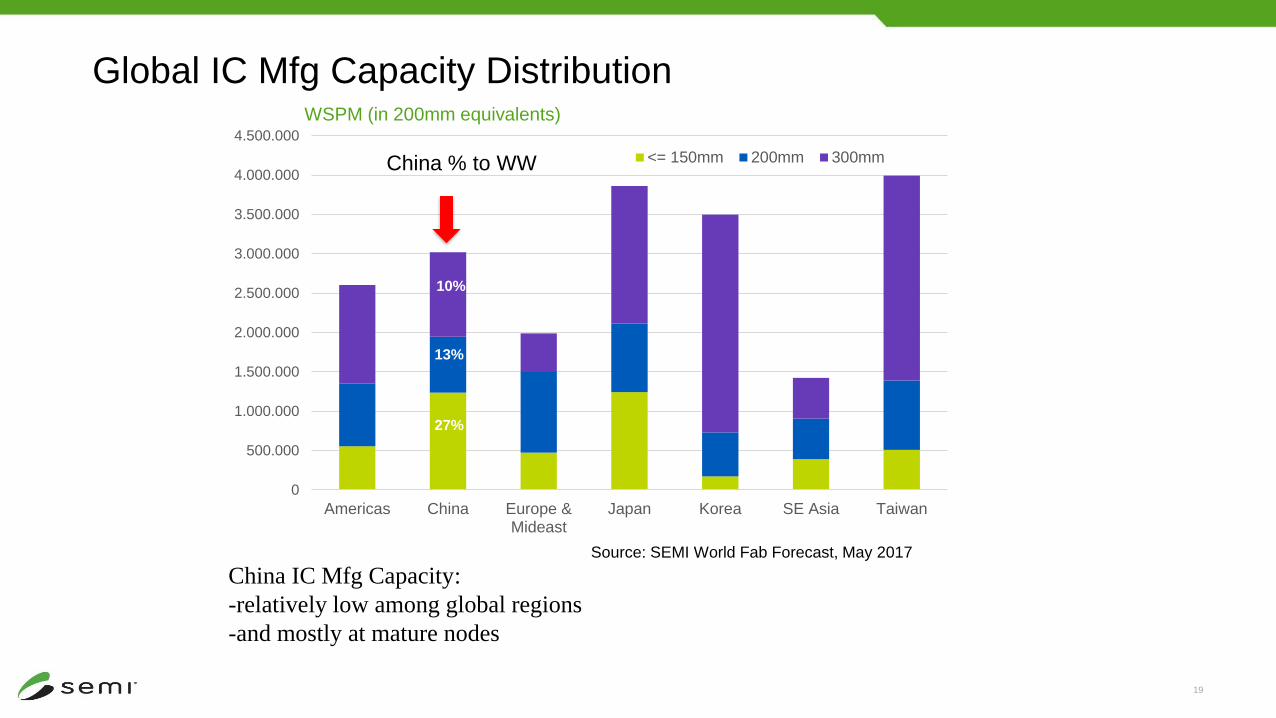
Global IC Mfg Capacity Distribution
Source: SEMI World Fab Forecast, May 2017
China IC Mfg Capacity:
-relatively low among global regions
-and mostly at mature nodes
WSPM (in 200mm equivalents)
China % to WW
10%
13%
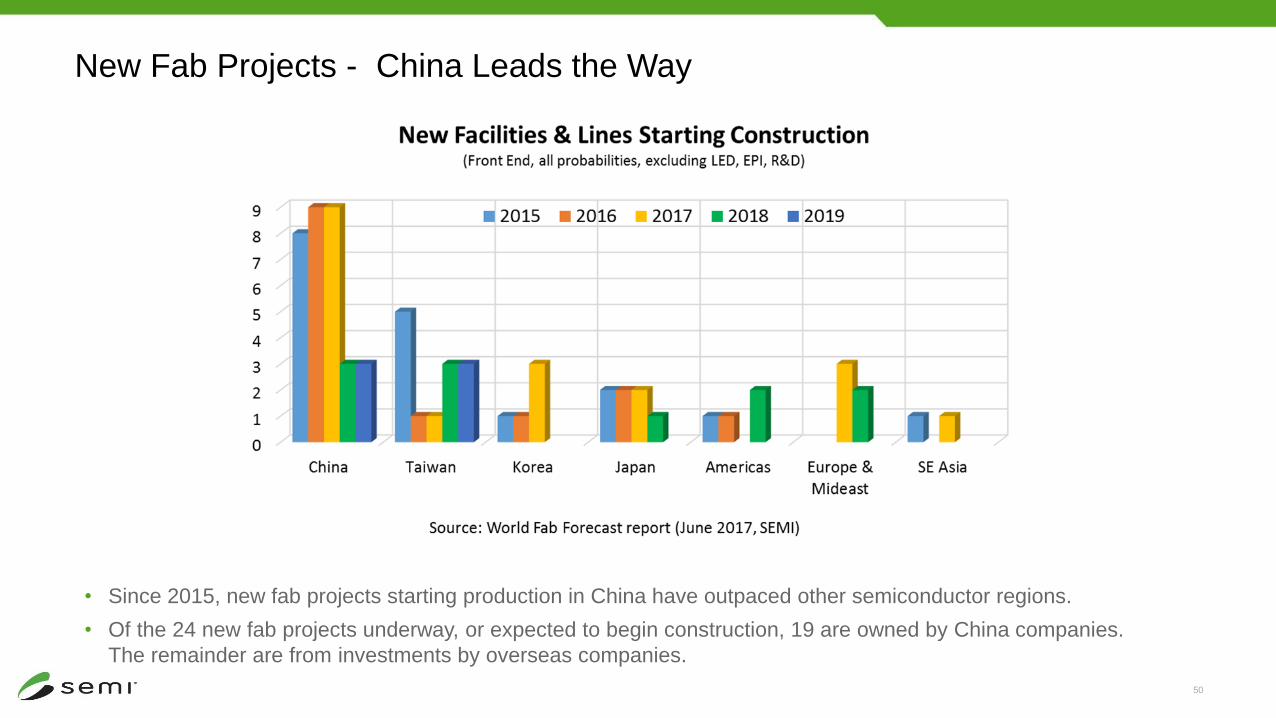
New Fab Projects - China Leads the Way
• Since 2015, new fab projects starting production in China have outpaced other semiconductor regions.
• Of the 24 new fab projects underway, or expected to begin construction, 19 are owned by China companies.
The remainder are from investments by overseas companies.
50
21
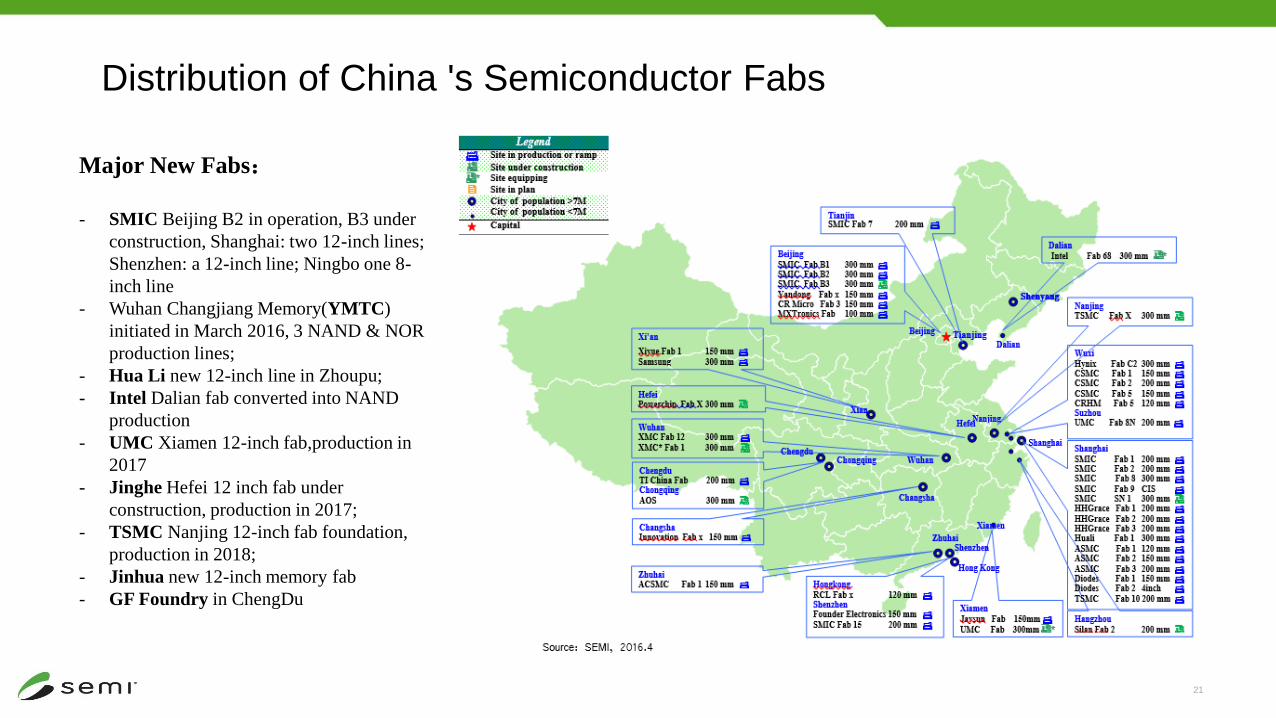
Distribution of China 's Semiconductor Fabs
Major New Fabs:
- SMIC Beijing B2 in operation, B3 under
construction, Shanghai: two 12-inch lines;
Shenzhen: a 12-inch line; Ningbo one 8-
inch line
- Wuhan Changjiang Memory(YMTC)
initiated in March 2016, 3 NAND & NOR
production lines;
- Hua Li new 12-inch line in Zhoupu;
- Intel Dalian fab converted into NAND
production
- UMC Xiamen 12-inch fab,production in
2017
- Jinghe Hefei 12 inch fab under
construction, production in 2017;
- TSMC Nanjing 12-inch fab foundation,
production in 2018;
- Jinhua new 12-inch memory fab
- GF Foundry in ChengDu
22
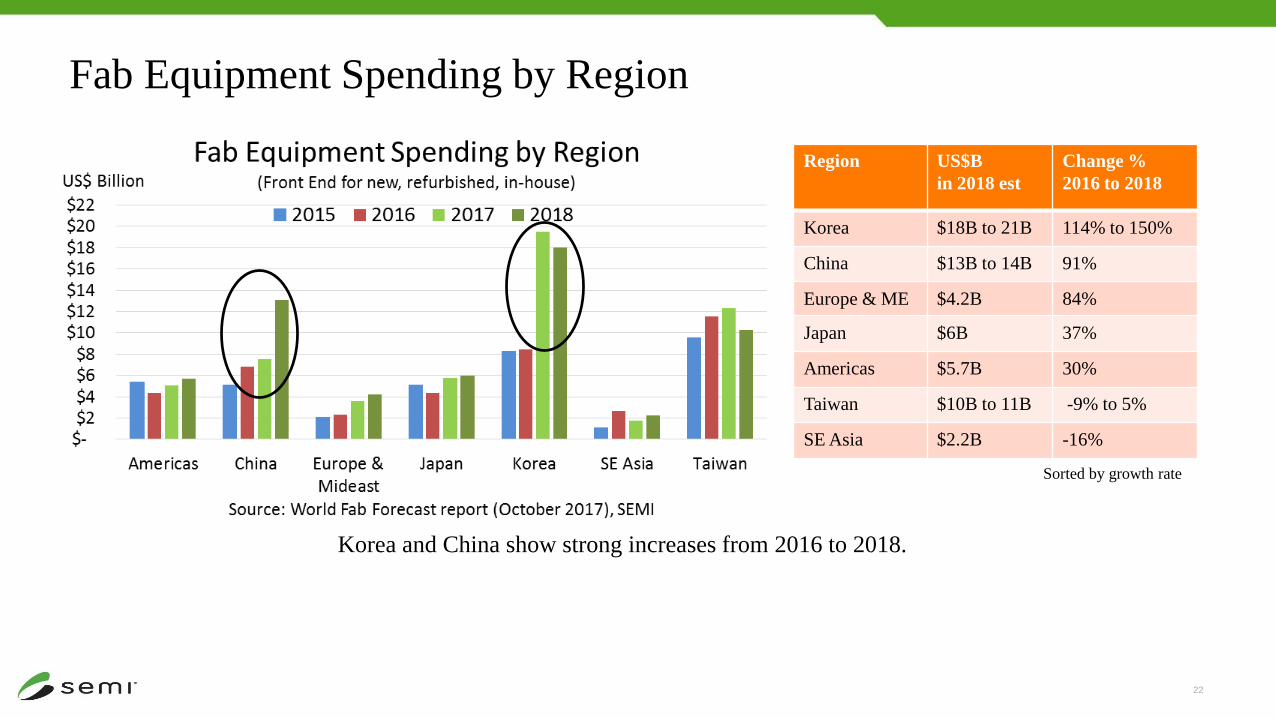
Fab Equipment Spending by Region
Region US$B
in 2018 est
Change %
2016 to 2018
Korea $18B to 21B 114% to 150%
China $13B to 14B 91%
Europe & ME $4.2B 84%
Japan $6B 37%
Americas $5.7B 30%
Taiwan $10B to 11B -9% to 5%
SE Asia $2.2B -16%
Korea and China show strong increases from 2016 to 2018.
Sorted by growth rate
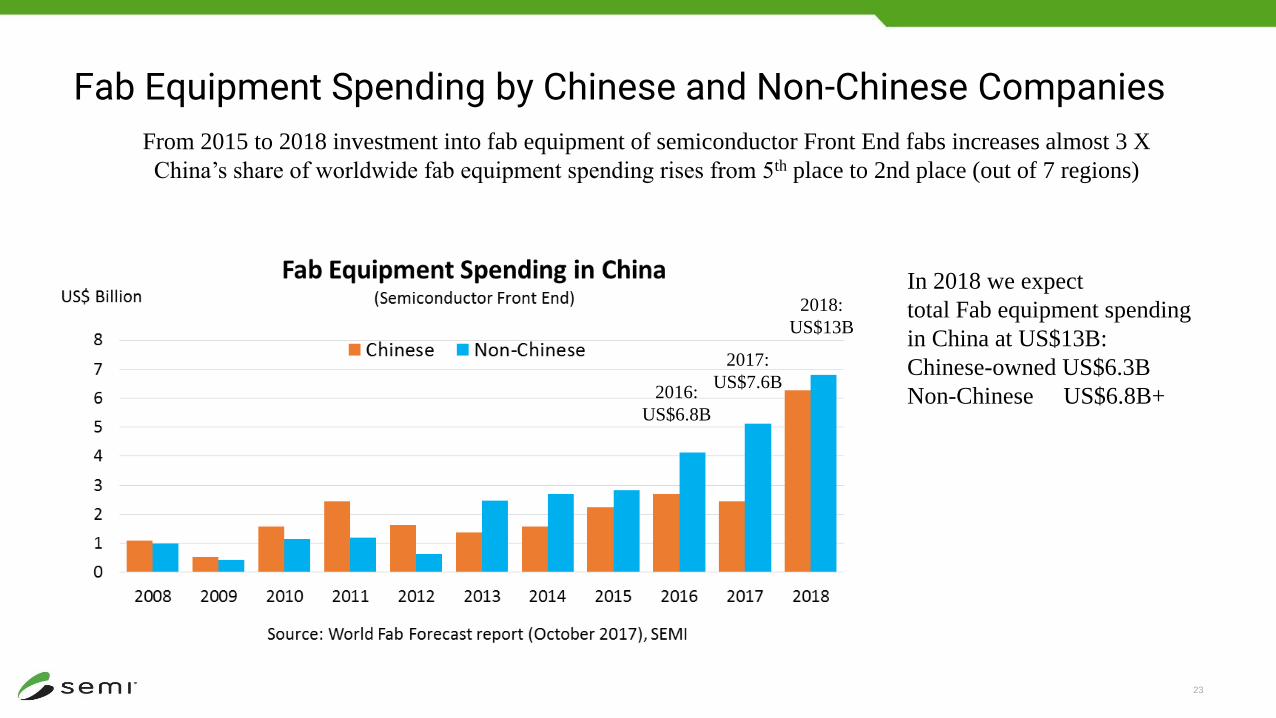
Fab Equipment Spending by Chinese and Non-Chinese Companies
23
From 2015 to 2018 investment into fab equipment of semiconductor Front End fabs increases almost 3 X
China’s share of worldwide fab equipment spending rises from 5th place to 2nd place (out of 7 regions)
In 2018 we expect
total Fab equipment spending
in China at US$13B:
Chinese-owned US$6.3B
Non-Chinese US$6.8B+2016:
US$6.8B
2017:
US$7.6B
2018:
US$13B
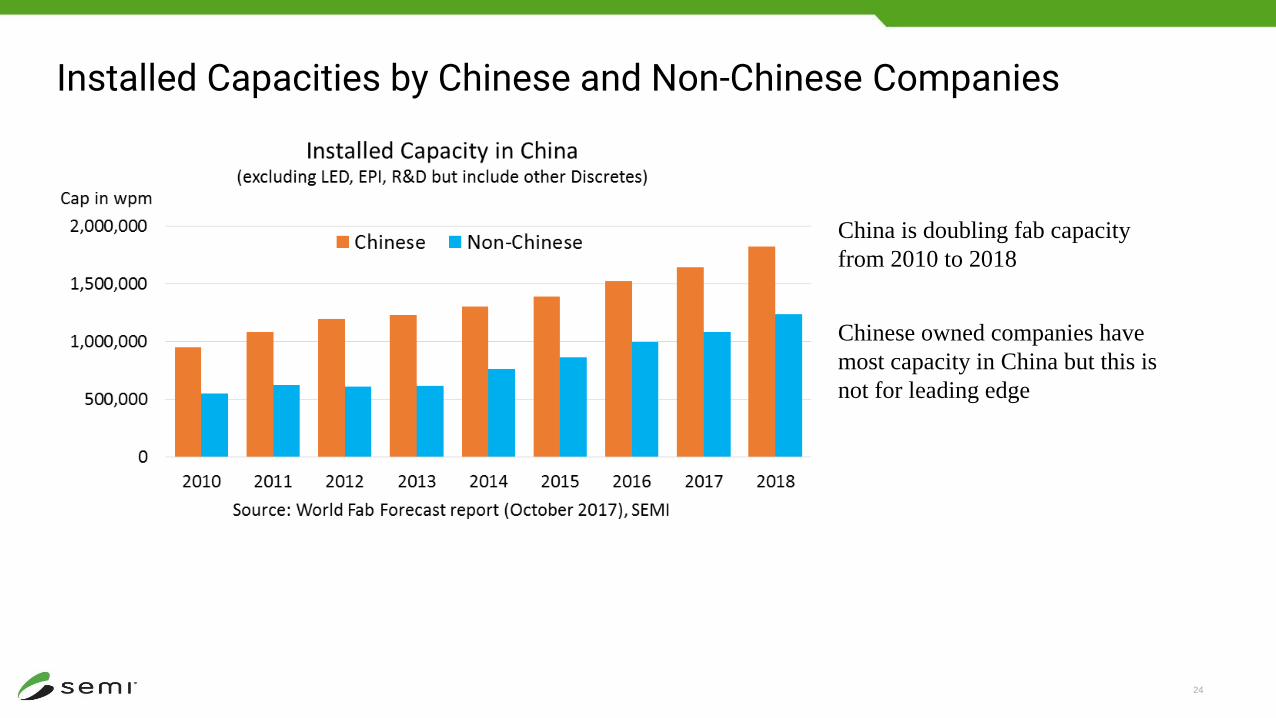
Installed Capacities by Chinese and Non-Chinese Companies
24
Chinese owned companies have
most capacity in China but this is
not for leading edge
China is doubling fab capacity
from 2010 to 2018
25
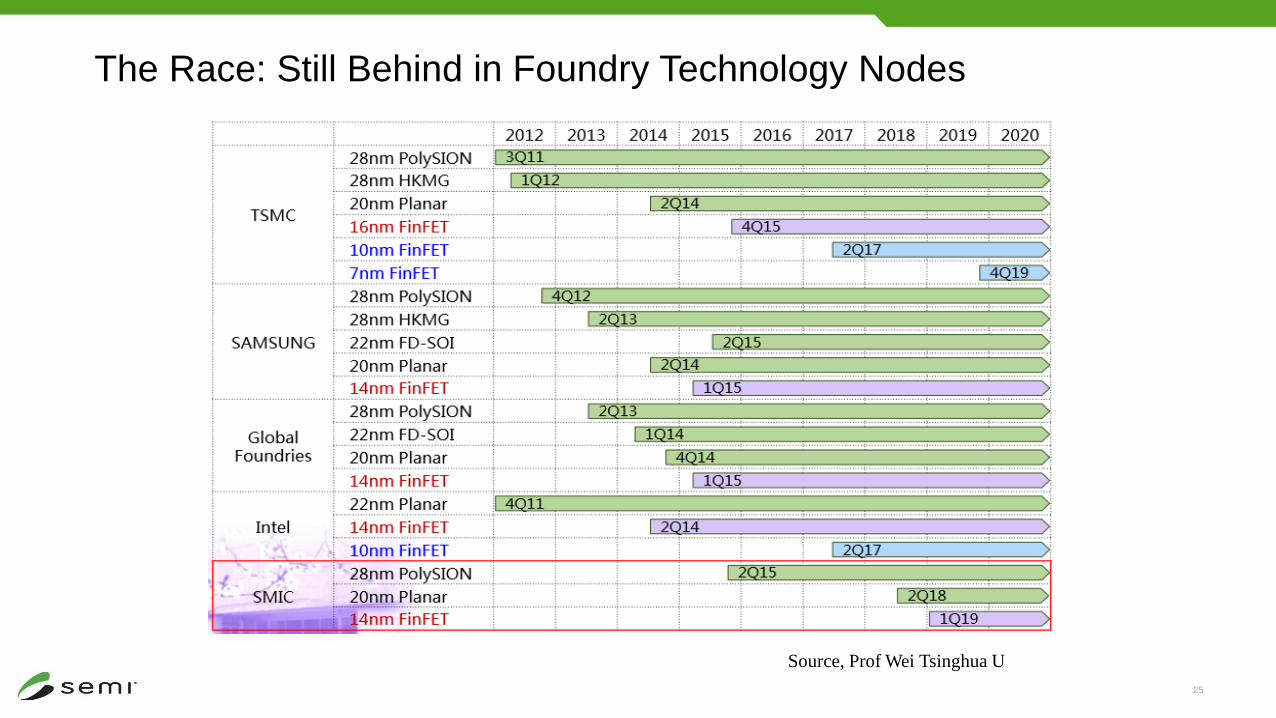
The Race: Still Behind in Foundry Technology Nodes
Source, Prof Wei Tsinghua U
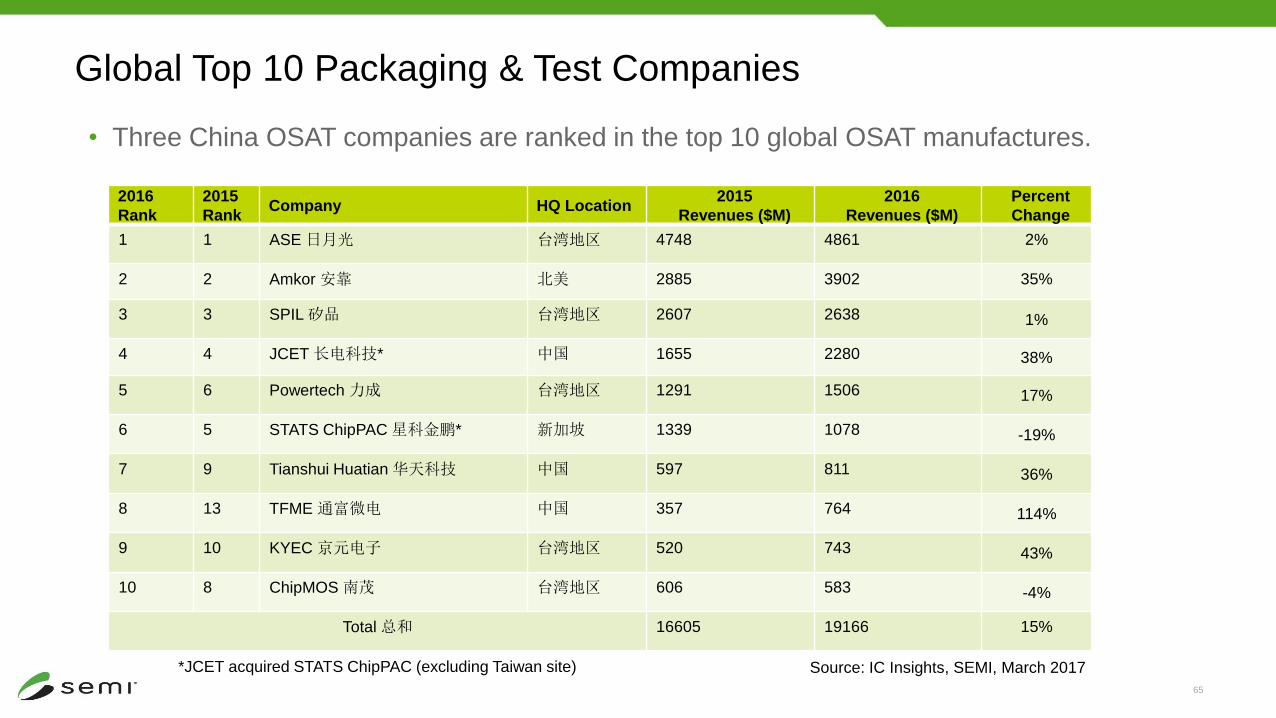
Global Top 10 Packaging & Test Companies
• Three China OSAT companies are ranked in the top 10 global OSAT manufactures.
2016
Rank
2015
RankCompany HQ Location
2015
Revenues ($M)
2016
Revenues ($M)
Percent
Change
1 1 ASE 日月光 台湾地区 4748 4861 2%
2 2 Amkor 安靠 北美 2885 3902 35%
3 3 SPIL 矽品 台湾地区 2607 2638 1%
4 4 JCET 长电科技* 中国 1655 2280 38%
5 6 Powertech 力成 台湾地区 1291 1506 17%
6 5 STATS ChipPAC 星科金鹏* 新加坡 1339 1078 -19%
7 9 Tianshui Huatian 华天科技 中国 597 811 36%
8 13 TFME 通富微电 中国 357 764 114%
9 10 KYEC 京元电子 台湾地区 520 743 43%
10 8 ChipMOS 南茂 台湾地区 606 583 -4%
Total 总和 16605 19166 15%
Source: IC Insights, SEMI, March 2017*JCET acquired STATS ChipPAC (excluding Taiwan site)
65
27
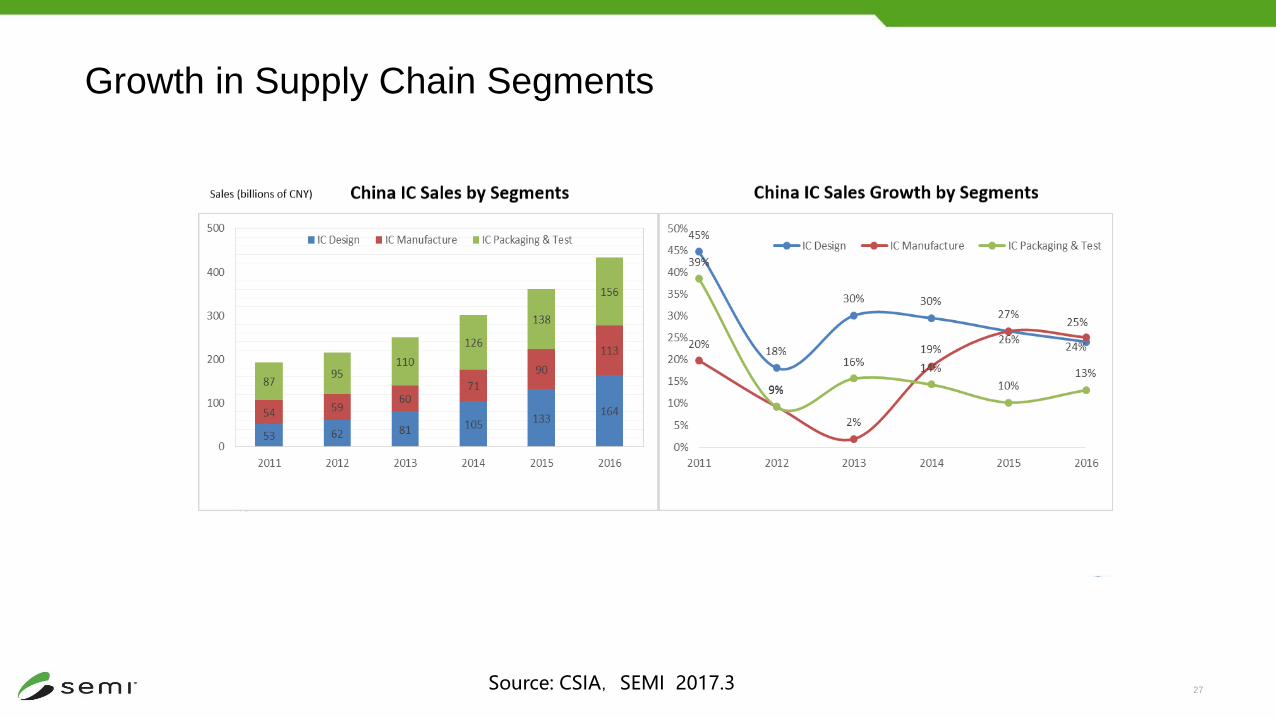
Growth in Supply Chain Segments
Source: CSIA,SEMI 2017.3
$0
$10
$20
$30
$40
$50
$60
2013 2014 2015 2016 2017F 2018F
Europe Japan North America Korea Taiwan China Rest of World
$31.79
$36.53$41.24
$54.33
$37.50
$56.18
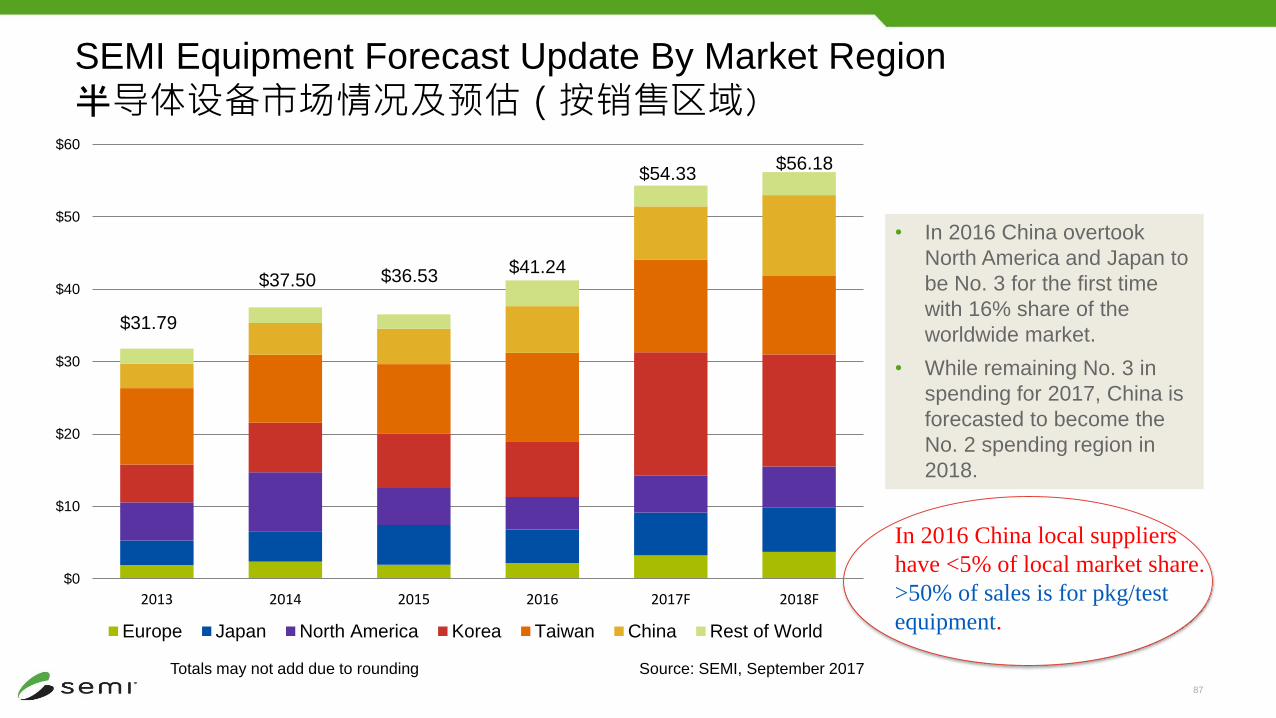
SEMI Equipment Forecast Update By Market Region
半导体设备市场情况及预估(按销售区域)
Source: SEMI, September 2017Totals may not add due to rounding
• In 2016 China overtook
North America and Japan to
be No. 3 for the first time
with 16% share of the
worldwide market.
• While remaining No. 3 in
spending for 2017, China is
forecasted to become the
No. 2 spending region in
2018.
87
In 2016 China local suppliers
have <5% of local market share.
>50% of sales is for pkg/test
equipment.

29
2016 Global Top10 IC Equipment Suppliers
China Local Supplier: <1-2% Market Share
2016 RankingCompany 2016 Revenue 2016/2015 Growth
Rate (%)In English ($ 100B)
1 Applied Materials 77.4 20.5
2 Lam Research 52.1 8.4
3 ASML 50.9 7.6
4 Tokyo Electron 48.6 12.4
5 KLA-Tencor 24.1 41.5
6Screen Semiconductor
Solutions13.7 17.8
7 Hitachi High-Technologies 9.8 24.3
8 Nikon 7.3 1
9 Hitachi Kokusai 5.3 -16.6
10 ASM International 5.0 -14.7
其它 0.0 22.5
Source: Gartner, SEMI summarized, March 2017
72
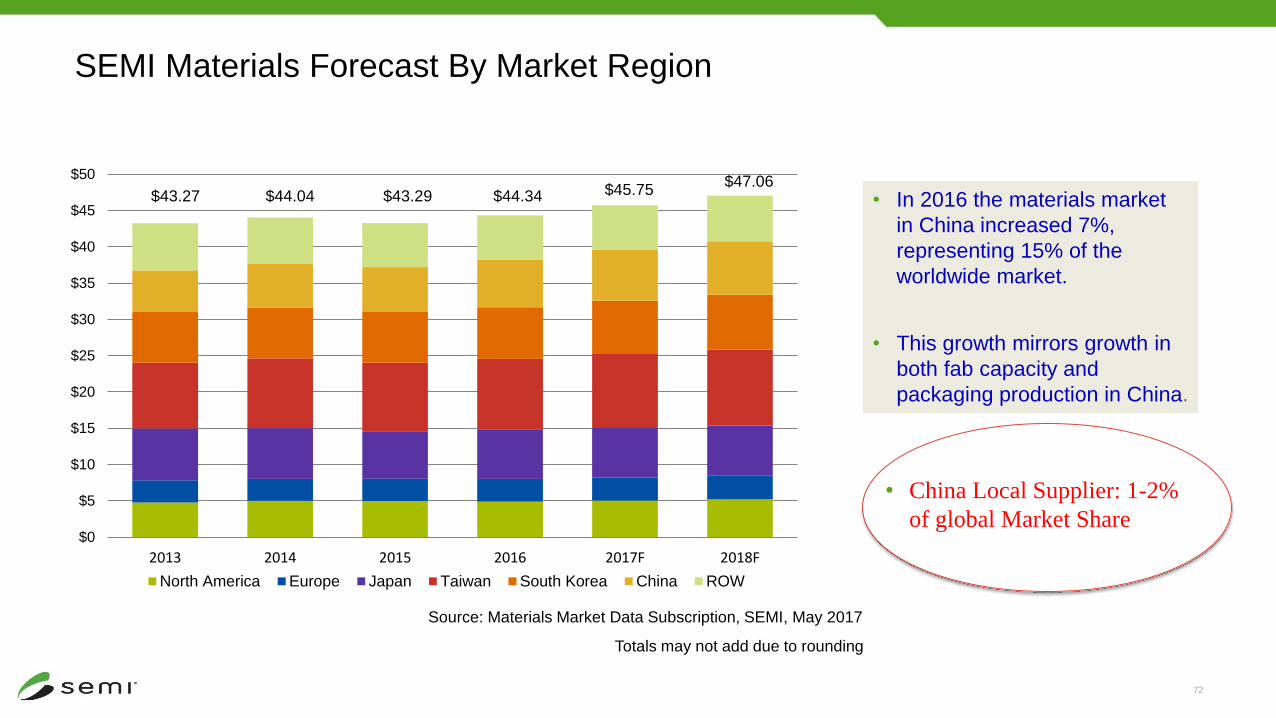
SEMI Materials Forecast By Market Region
Source: Materials Market Data Subscription, SEMI, May 2017
Totals may not add due to rounding
• In 2016 the materials market
in China increased 7%,
representing 15% of the
worldwide market.
• This growth mirrors growth in
both fab capacity and
packaging production in China.
$0
$5
$10
$15
$20
$25
$30
$35
$40
$45
$50
2013 2014 2015 2016 2017F 2018F
North America Europe Japan Taiwan South Korea China ROW
$43.27 $43.29 $44.34 $45.75$44.04$47.06
• China Local Supplier: 1-2%
of global Market Share
31
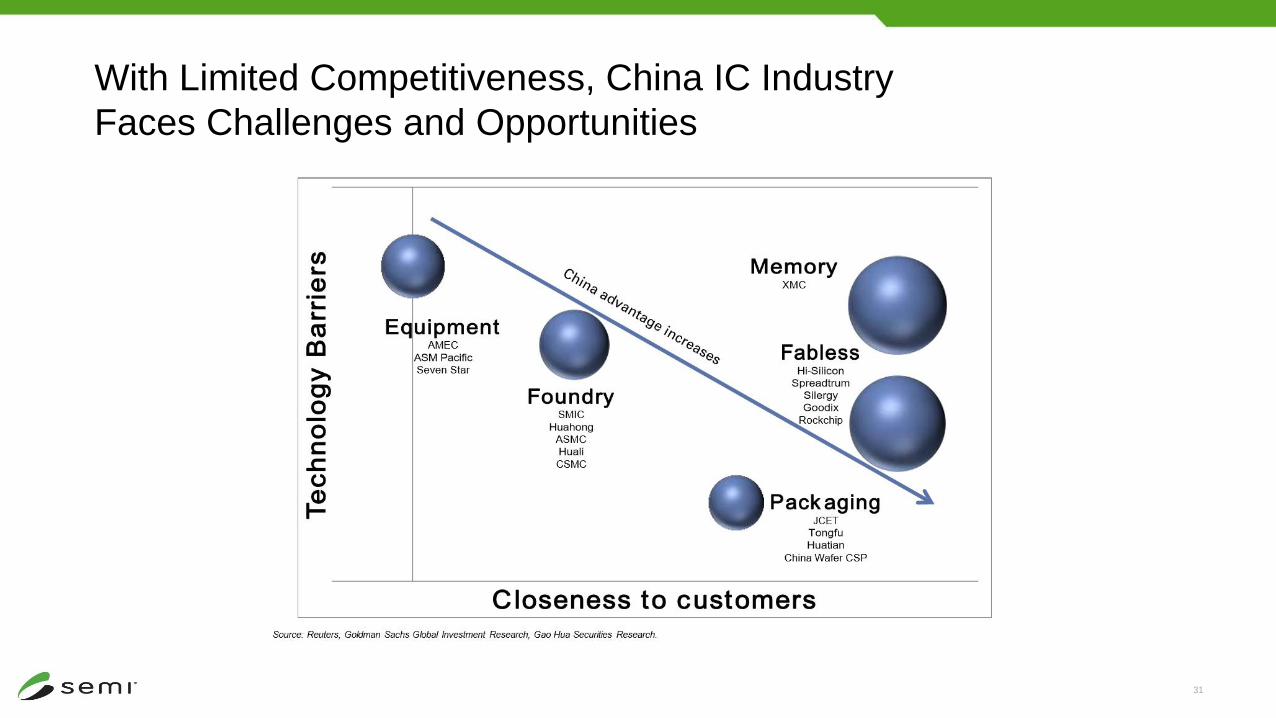
With Limited Competitiveness, China IC Industry
Faces Challenges and Opportunities
32
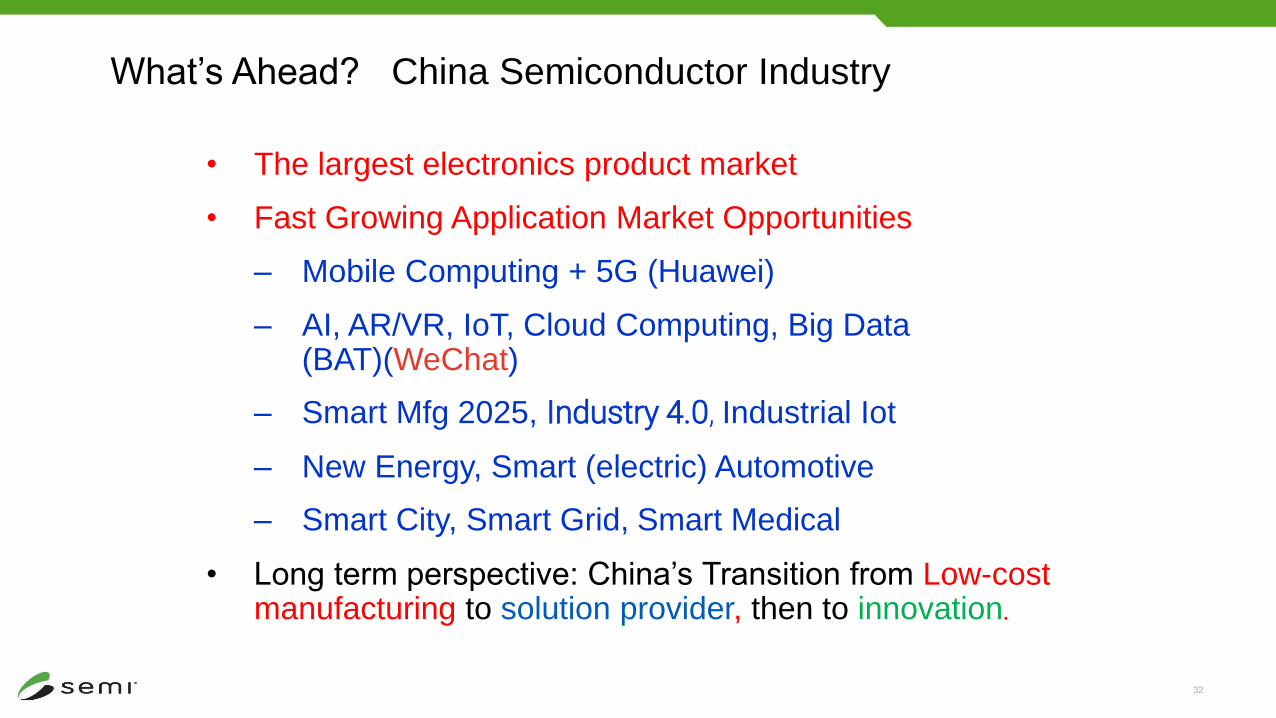
What’s Ahead? China Semiconductor Industry
• The largest electronics product market
• Fast Growing Application Market Opportunities
– Mobile Computing + 5G (Huawei)
– AI, AR/VR, IoT, Cloud Computing, Big Data (BAT)(WeChat)
– Smart Mfg 2025, Industry 4.0, Industrial Iot
– New Energy, Smart (electric) Automotive
– Smart City, Smart Grid, Smart Medical
• Long term perspective: China’s Transition from Low-cost manufacturing to solution provider, then to innovation.
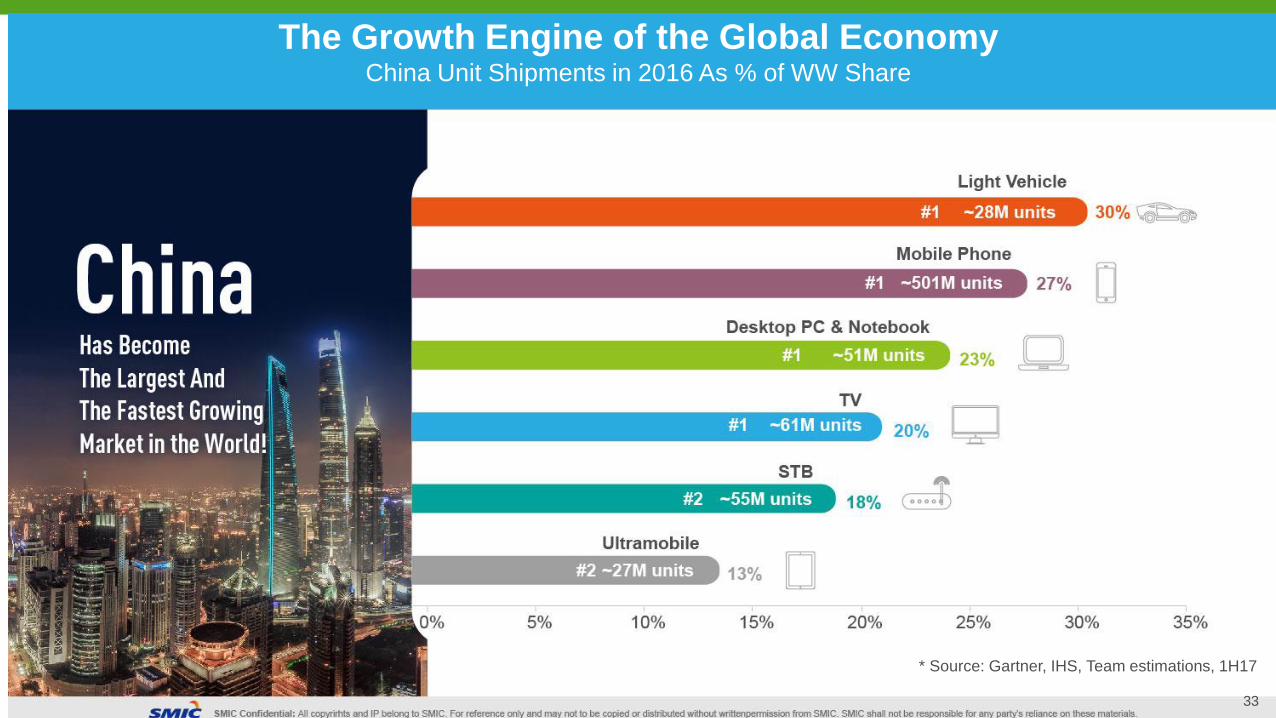
The Growth Engine of the Global EconomyChina Unit Shipments in 2016 As % of WW Share
* Source: Gartner, IHS, Team estimations, 1H17
33
34
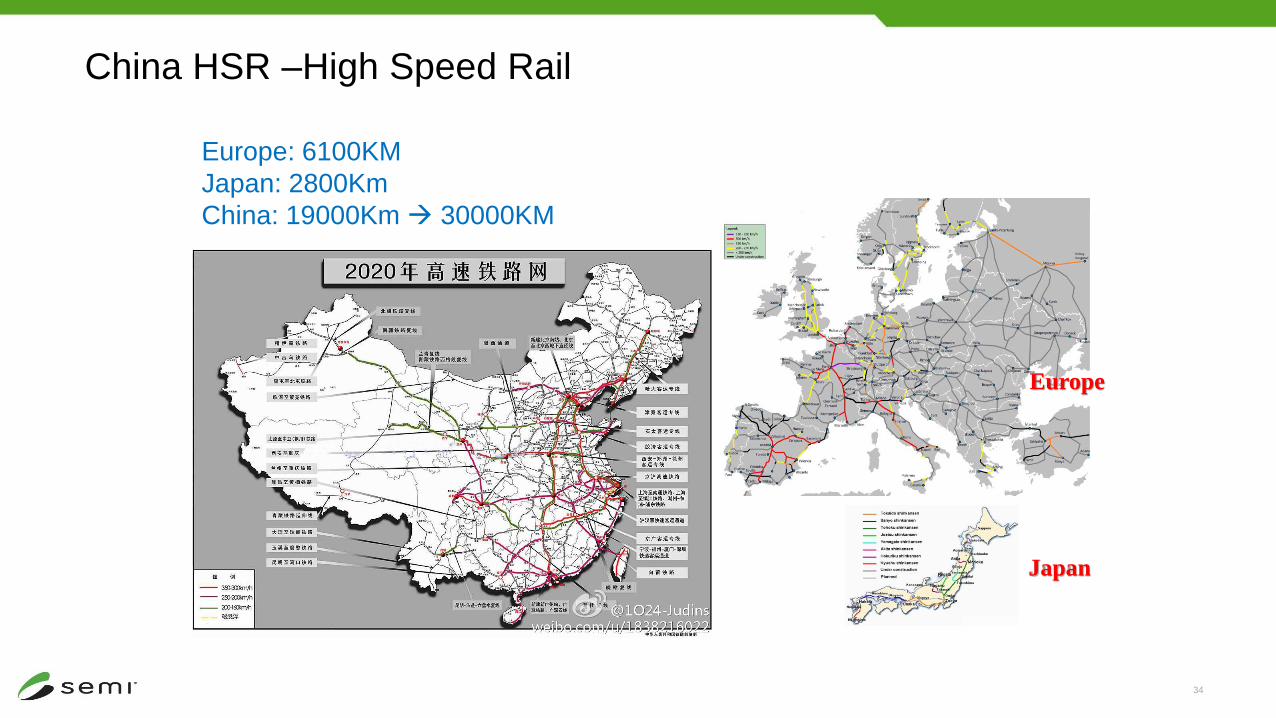
China HSR –High Speed Rail
Japan
Europe
Europe: 6100KM
Japan: 2800Km
China: 19000Km 30000KM
35
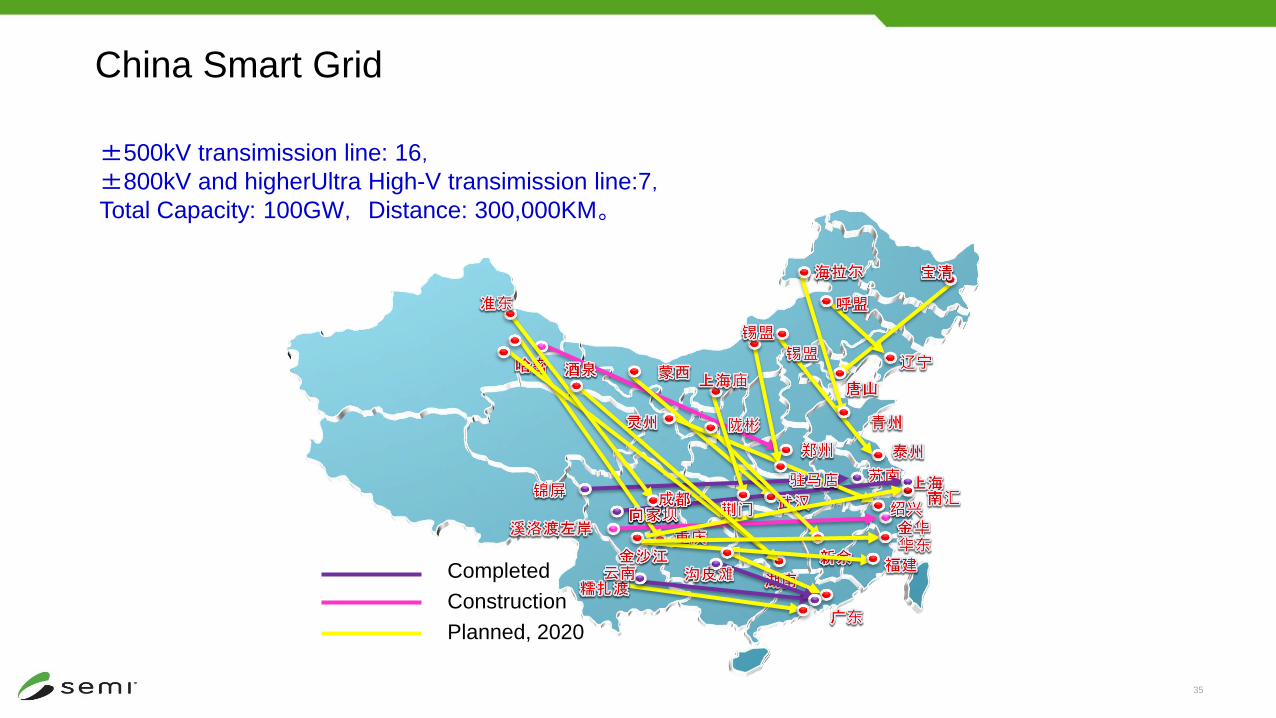
Completed
Construction
Planned, 2020
±500kV transimission line: 16,±800kV and higherUltra High-V transimission line:7,Total Capacity: 100GW,Distance: 300,000KM。
China Smart Grid
36
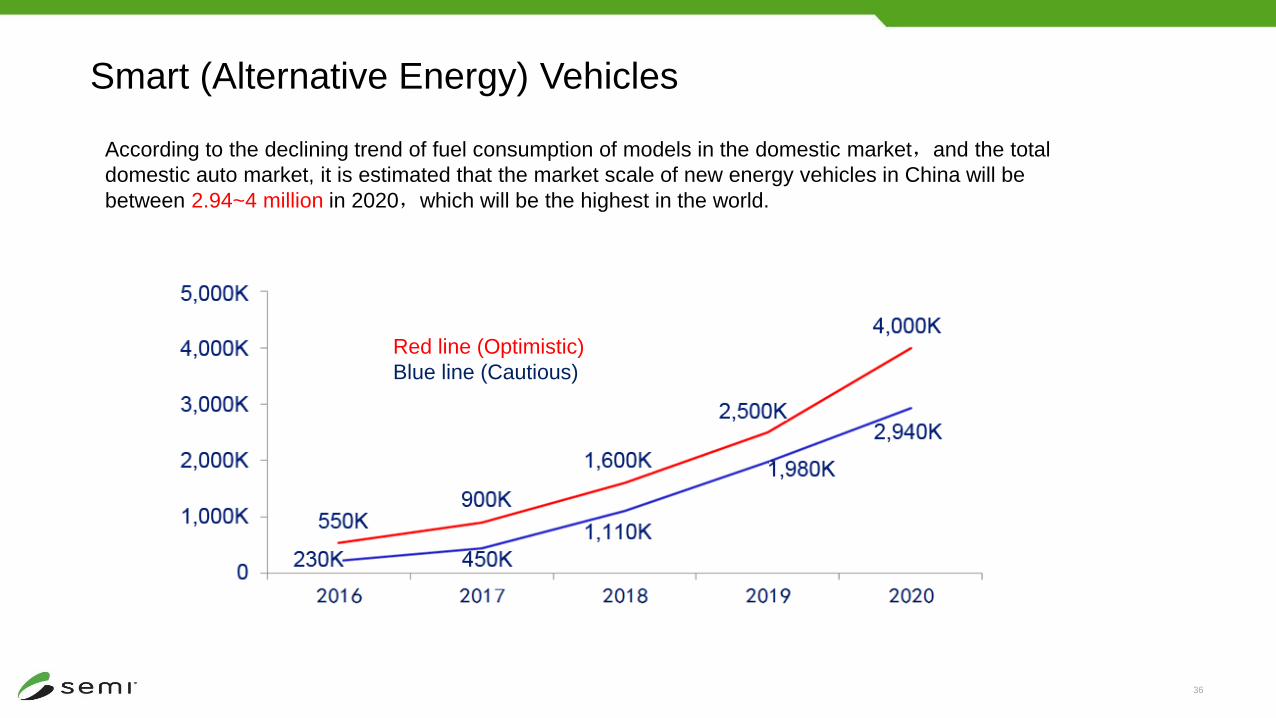
Smart (Alternative Energy) Vehicles
According to the declining trend of fuel consumption of models in the domestic market,and the total
domestic auto market, it is estimated that the market scale of new energy vehicles in China will be
between 2.94~4 million in 2020,which will be the highest in the world.
Red line (Optimistic)
Blue line (Cautious)
37
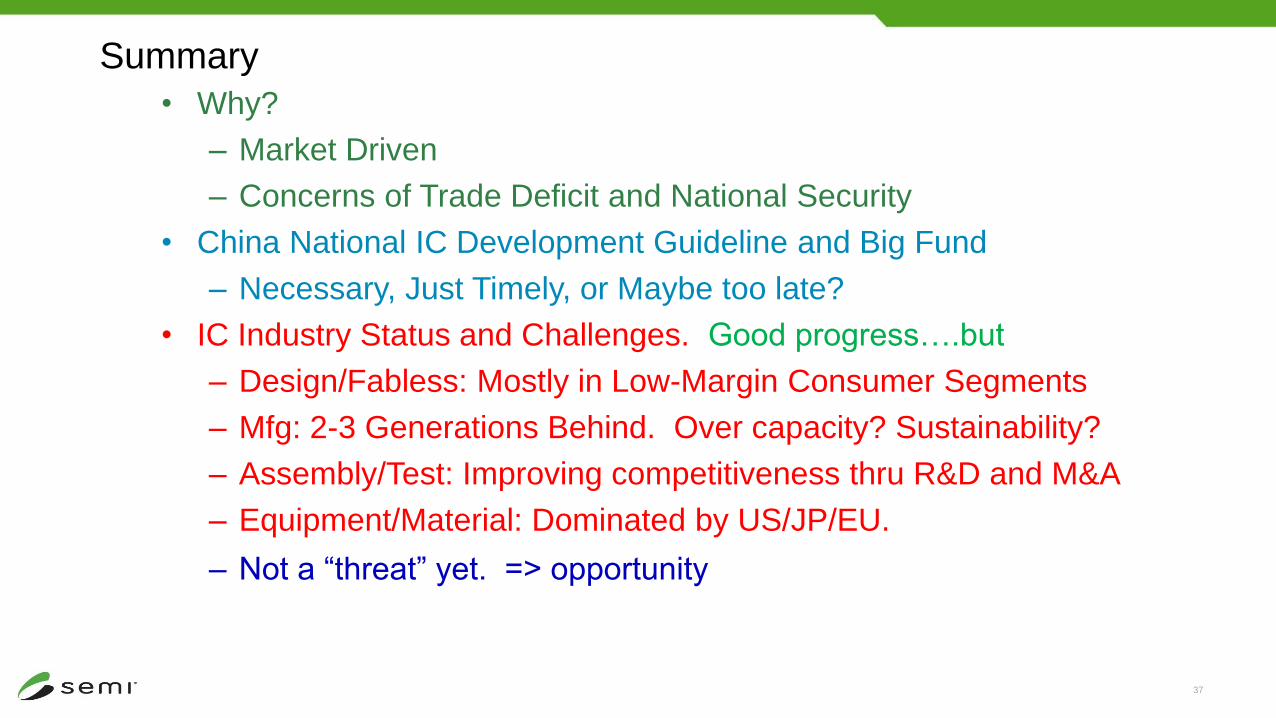
Summary
• Why?
– Market Driven
– Concerns of Trade Deficit and National Security
• China National IC Development Guideline and Big Fund
– Necessary, Just Timely, or Maybe too late?
• IC Industry Status and Challenges. Good progress….but
– Design/Fabless: Mostly in Low-Margin Consumer Segments
– Mfg: 2-3 Generations Behind. Over capacity? Sustainability?
– Assembly/Test: Improving competitiveness thru R&D and M&A
– Equipment/Material: Dominated by US/JP/EU.
– Not a “threat” yet. => opportunity
38
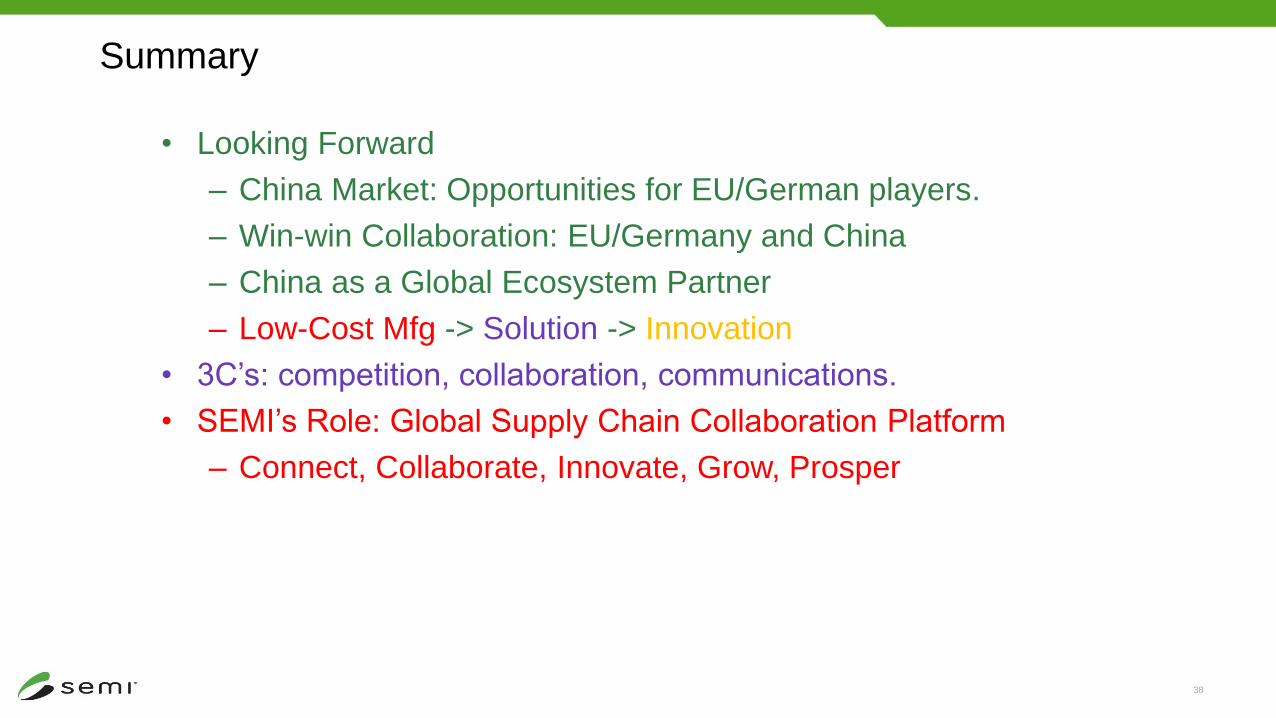
Summary
• Looking Forward
– China Market: Opportunities for EU/German players.
– Win-win Collaboration: EU/Germany and China
– China as a Global Ecosystem Partner
– Low-Cost Mfg -> Solution -> Innovation
• 3C’s: competition, collaboration, communications.
• SEMI’s Role: Global Supply Chain Collaboration Platform
– Connect, Collaborate, Innovate, Grow, Prosper
39
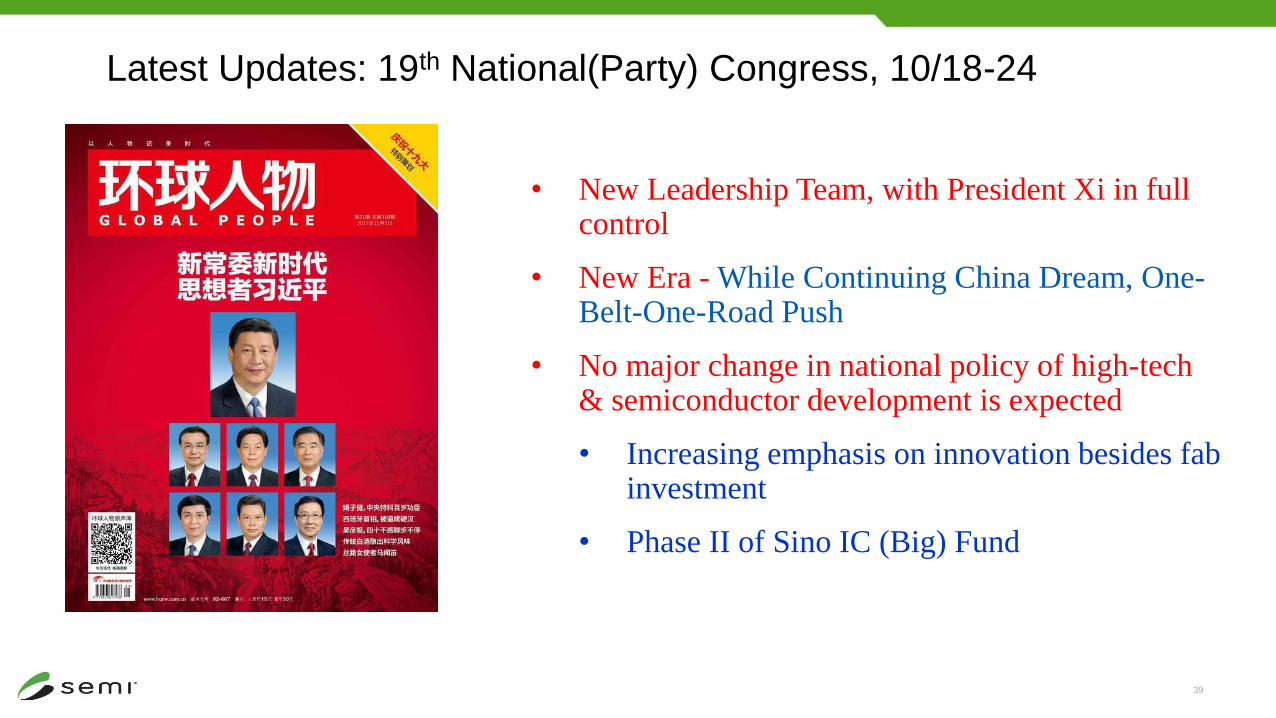
Latest Updates: 19th National(Party) Congress, 10/18-24
• New Leadership Team, with President Xi in full control
• New Era - While Continuing China Dream, One-Belt-One-Road Push
• No major change in national policy of high-tech & semiconductor development is expected
• Increasing emphasis on innovation besides fab investment
• Phase II of Sino IC (Big) Fund
SEMICON China 2018
March 14-16, 2018


![SEMI CAST TEMS Overview 2017Mayprod7.semi.org/en/sites/semi.org/files/data17/docs... · 7(06 0hvvdjh 7\shv 0hvvdjh 1dph 0hvvdjh 1dph &rpphqw 7&6 ,qlwldol]dwlrq 7&6 6kxwgrzq 6\vwhp](https://img.pdfslide.us/doc/110x75/5e7c1dbaa1720b189f44faf7/semi-cast-tems-overview-706-0hvvdjh-7shv-0hvvdjh-1dph-0hvvdjh-1dph-rpphqw.jpg)