Embed Size (px)
Citation preview

China Economic Outlook Second quarter 2018
Asia Unit
China Economic Outlook – Second quarter 2018 2
Index
1. Growth rate holds firm, but risks of protectionism intensify 3
2. Robust growth in the first quarter of 2018 4
3. Will Trump’s trade war disturb the domestic reforms set by
“Two Sessions”? 12
4. External risks are on the rise 16
Closing date: 12 April 2018

China Economic Outlook – Second quarter 2018 3
1. Growth rate holds firm, but risks of protectionism intensify
The global economy is currently being subject to divergent forces. The new fiscal stimulus measures approved by the US administration will prolong the favourable phase of the world economic cycle, which has so far been
supported by high levels of confidence and the positive tone of industrial activity and international trade, which also
benefit China and Europe. On the other hand, the increased vulnerability of the US public accounts brought about
by these fiscal stimulus measures, combined with the prospect of financial markets facing greater volatility than in
2017, make this scenario more uncertain. Added to this is the ratcheting up of protectionist rhetoric in the US,
which has started to find expression in specific measures. All these are in a context of normalisation of monetary policies following years of exceptional stimulus measures, which may also give rise to additional doubts.
Data available for the first two months of the year suggests that global growth in the first quarter will show a
similar rate to the average for 2017 (1% QoQ). Specifically, our BBVA-GAIN model predicts that world GDP
growth in 1Q will have reached 0.97% QoQ, meaning that activity will have resumed its trend following the stumble
recorded at year-end 2017 due to slowing growth in the three main regions (China, the euro zone and more particularly the US).
This growth is favoured firstly by the good performance of world trade. According to our BBVA-Trade indicator in
January1, and especially during February, trade in real terms grew significantly, regaining the dynamism seen in
2016 after the moderation observed last year. The main contributor to this development was export growth in the
emerging economies, and in particular - in February - in the Asian countries (mainly China and India). A second factor underpinning 1Q growth is the sustained solid expansion of industrial output. Here too, the emerging
countries stand out, led by China and India, with Latin America also showing acceptable growth despite the hiccups
in its two biggest economies, Mexico and Brazil. In the developed countries, the US gained traction, though this
was partly offset by the weakness of the euro zone.
However, retail sales measured in real terms weakened in December and January, in both developed and
emerging countries, undoing the fledgling recovery of the previous two months 2 and confirming the scenario of a slow recovery in consumption. As for the more leading indicators of confidence, PMIs, both manufacturing and
services, are close to their all-time highs, although we are starting to see signs of limitations to further
expansion, mainly in the manufacturing sector. This scenario plays out in a context in which inflation, especially
the core measure, has increased very gradually. We are likely to see greater pressures, though still contained,
in the next few months.
As for commodities, oil prices paused their rising trend in the face of both higher volatility on the financial
markets and higher expectations for production in the US , although they recently settled in a range of US$60
to US$65 a barrel. Despite the foregoing, market fundamentals do not suggest significant changes, so we are
holding our forecasts for the average price of oil at US$60 a barrel for WTI and US$65 for Brent, for this year and
next. On the demand side, global economic growth will continue to support higher prices; but against this, the expected increase in non-OPEC production will make it difficult to keep prices above US$60 a barrel for too long.
In the medium term, uncertainty comes mainly from the impact of reduced investment in the sector and its
effect on future supply capacity, which might likely provide greater support for prices.
1: This is also v erif ied by the CPB World Trade Monitor, January 2018, prepared by CPB Netherlands Bureau f or Economic Policy Analy sis - https://www.cpb.nl/en/f igure/cpb-world-trade-monitor-january -2018 2: The limited data av ailable for February suggest that retail sales in developed countries will have held steady or f allen again, whereas emerging markets could show some growth since China and the rest of emerging Asia show signs of a slight uptick during the month.
China Economic Outlook – Second quarter 2018 4
2. Robust growth in the first quarter of 2018
Q1 economic indicators are robust. In particular, the outturns of trade, industrial production and investment are
better than expected. However, growth headwinds remain in place, mainly from domestic tightening policy
initiatives and trade skirmishes with the US, which, in our baseline scenario, is unlikely to evolve into a full-blown trade war between the largest country economies in the world. That being said, the growth is most likely to
moderate through the rest of the year. Thus, we maintain our 2018 growth projection of 6.3% y/y, compared with
the official target growth rate at 6.5% and the Bloomberg consensus at 6.5%.
The NPC and CPPCC (also known as “two sessions”) were concluded in the middle of March. The meetings set up
a series of economic targets of this year. In addition, it announced the authorities’ monetary and fiscal policy stance. Some government agency reform agenda, together with the new appointments of government officials, was
also promulgated during the meeting.
Regarding the policy side, monetary policy will continue to be prudent with some tightening bias this year and the
authorities will continue to push forward financial deleveraging in order to prevent systematic financial risks. Fiscal
policy will remain expansionary to offset the financial tightening and capacity reduction. However, the government announced to reduce fiscal budget to a certain degree so that fiscal budget to GDP ratio will be around 2.6%, which
is 0.4% lower than the previous arrangement in 2017.
Fears of a trade-war between the US and China are escalating, as the US President Trump has implemented a
series of restrictive measures on China’s exports to the US since the beginning of the year and China also stroke
back with levying tariff on imports from the US. A ‘tit for tat’ protectionist trade rhetoric between the two countries
has unnerved investors and rattled financial markets amid concerns that the current trade skirmish, if it escalates into a full-blown trade war could upend global growth momentum and threaten financial stability.
The risk of full-blown trade war with the US is not in our base scenario although trade skirmishes between two
largest country economies could linger for quite a while. Based on our estimation of value-added exports of China
to the US, these skirmishes should not have a large impact on China’s growth and even its gigantic export sector.
But a more worrisome situation is Trump’s trade war might disturb the domestic reform progress. As re-emphasized in the “two sessions”, the authorities will continue to push forward the financial deleveraging and de-capacity in the
real sector. The market worries that if the authorities might change their policy stance and stimulate domestic
demand again if they exaggerate the change of a full-blown trade war.
All in all, we expect China and the US will eventually reach an agreement to avert a trade war despite recently
escalated rhetoric. Moreover, China needs to push forward deleveraging in over-capacity industries as well as other important items on its reform agenda including SOE reforms, financial regulatory framework etc. to strengthen
the domestic demand in the long term.
Q1 Activity indicators point to a robust start of the year
Q1 economic indicators are robust. In particular, the outturns of trade, industrial production and investment are
much better than expected. Our MICA model yields a monthly GDP estimate of 6.8% y/y, in line with the Q4 GDP outturn which was 6.9% y/y. (Figure 2.1) However, growth headwinds remain in place, mainly from domestic
tightening policy initiatives and trade skirmishes with the US, which, in our baseline scenario, is unlikely to evolve
into a full-blown trade war between the largest country economies in the world. That being said, the growth is most

China Economic Outlook – Second quarter 2018 5
likely to moderate through the rest of the year. Thus, we maintain our 2018 growth projection of 6.3% y/y,
compared with the official target growth rate at 6.5% and the Bloomberg consensus at 6.5%.
Meanwhile, our China vulnerability sentiment index remains stable in Q1, as the recently held NPC and CPPCC
meetings (known as “two sessions”) in Beijing helped to settle the political uncertainties. In addition, the better-than-expected 2017 growth and the ongoing policy conduct to avoid financial risks also helped to anchor investors’
sentiment. (Figure 2.2)
Chart 2.1 BBVA MICA model for GDP forecasting Chart 2.2 China vulnerability sentiment remains stable
Source: BBVA Research and CEIC Source: BBVA Research and CEIC
On the supply side, activity indicators indicted a robust momentum in growth during January -February (as the NBS reports the data outturns of the first two months combined). Industrial production significantly picked up to 7.2% y/y
from 6.6% y/y of the last December (consensus: 6.2% y/y). Meanwhile, the different indicators of producers’
sentiment of March were mixed. China’s official manufacturing PMI significantly increased to 51.5 in March from
50.3 in the previous month (Consensus: 50.6). While the Caixin China Manufacturing PMI, which includes a survey
sample tilting toward SMEs and exporters, slowed down to 51 in March (versus consensus 51.7) from 51.6 in the
previous month (Figure 2.3). The divergence between the official PMI and Caixin PMI could reflect some headwinds to China’s export sector including the unexpectedly sharp RMB appreciation in Q1 and trade skirmishes
with the US.
The demand side has mixed signals. Retail sales growth slowed to 9.7% y/y
in January-February from 10.2% y/y in the previous month (consensus: 9.8%
y/y). (Figure 2.4) The slowdown was led by auto sales, which grew by 1% y/y in February compared to a 5.2% y/y growth in July before the expiration
of fiscal subsidy for passenger car purchase. The silver lining is the rapid
growth of online sales, surging 35.6% y/y in the first two months of this year,
substantially surpassing the aggregate retail sales growth at 9.7%, indicating
that the rising new economy leads growth.
Meanwhile, fixed Asset Investment increased to 7.9% ytd y/y from 7.2% ytd y/y (consensus: 7% ytd y/y), indicating
investment regains its momentum at the beginning of the year. (Figure 2.5) In addition, the growth of private
investment increased to 8.1% ytd y/y in January-February from 6% ytd y/y previously. (Figure 2.6).
3%
4%
5%
6%
7%
8%
9%
10%
11%
Ju
n-1
4
Sep
-14
De
c-1
4
Mar-
15
Ju
n-1
5
Sep
-15
De
c-1
5
Mar-
16
Ju
n-1
6
Sep
-16
De
c-1
6
Mar-
17
Ju
n-1
7
Sep
-17
De
c-1
7
Mar-
18
Hu
nd
red
s
Actual GDP Growth
BBVA-MICA GDP Growth (Monthly)
-3
-2
-1
0
1
2
3
3/1
/20
15
4/1
/20
15
5/1
/20
15
6/1
/20
15
7/1
/20
15
8/1
/20
15
9/1
/20
15
10
/1
/2
01
5
11
/1
/2
01
5
12
/1
/2
01
5
1/1
/20
16
2/1
/20
16
3/1
/20
16
4/1/20
16
5/1
/20
16
6/1
/20
16
7/1
/20
16
8/1
/20
16
9/1
/20
16
10
/1
/2
01
6
11
/1
/2
01
6
12
/1
/2
01
6
1/1
/20
17
2/1
/20
17
3/1/20
17
4/1
/20
17
5/1
/20
17
6/1
/20
17
7/1
/20
17
8/1
/20
17
9/1
/20
17
10
/1
/2
01
7
11
/1
/2
01
7
12
/1
/2
01
7
1/1
/20
18
Chinese Vulnerability Sentiment Index
(Lower values indicate a deterioration of sentiment and higher vulnerability)
Both supply and demand
sides sent some mixed
signals of the economy

China Economic Outlook – Second quarter 2018 6
Chart 2.3 Decoupling betw een PMIs and industrial
production Chart 2.4 Both real and nominal retail sales declined in
December
Source: BBVA Research and CEIC Source: BBVA Research and CEIC
Chart 2.5 Infrastructure investment has Softened due to
the end-year budget constraint Chart 2.6 Private and Public investment display the trend
of converging
Source: BBVA Research and CEIC Source: BBVA Research and CEIC
CPI up and PPI down
Headline CPI inflation picked up significantly to 2.9% y/y in February from 1.5% in the previous month, above market consensus of 2.5%.The uptick in CPI inflation was driven by food prices as their negative contribution to
year-on-year price increase narrowed, mainly due to Chinese New Year (CNY) effect (the Chinese New Year of
2018 fell in February while the CNY of 2017 was in January) and bad weather. (Figure 2.7) In March, the CPI is
expected to drop after the dissipation of the seasonal effect.
On the other hand, PPI decreased significantly to 3.7% y/y in February from 4.3% in the previous month (Consensus: 3.8%), as the shock from supply-
side disruption eased off. (Figure 2.8) That being said, CPI and PPI were
converging in February. In the future, we predict the convergence of PPI
0
5
10
15
20
35
40
45
50
55
Sep
-12
De
c-1
2M
ar-
13
Ju
n-1
3S
ep
-13
De
c-1
3M
ar-
14
Ju
n-1
4S
ep
-14
De
c-1
4M
ar-
15
Ju
n-1
5S
ep
-15
De
c-1
5M
ar-
16
Ju
n-1
6S
ep
-16
De
c-1
6M
ar-
17
Ju
n-1
7S
ep
-17
De
c-1
7M
ar-
18
% yoyIndex
NBS PMI (LHS)
Markit PMI (LHS)
Industrial Production(RHS)
0
5
10
15
20
25
Aug
-11
No
v-1
1F
eb
-12
May-1
2A
ug
-12
No
v-1
2F
eb
-13
May-1
3A
ug
-13
No
v-1
3F
eb
-14
May-1
4A
ug
-14
No
v-1
4F
eb
-15
May-1
5A
ug
-15
No
v-1
5F
eb
-16
May-1
6A
ug
-16
No
v-1
6F
eb
-17
May-1
7A
ug
-17
No
v-1
7F
eb
-18
% yoy
Nominal Retail Sales Real retail sales
.0000
2.0000
4.0000
6.0000
8.0000
10.0000
12.0000
14.0000
16.0000
18.0000
20.0000
Feb
-14
Ma
y-1
4
Aug
-14
No
v-1
4
Feb
-15
Ma
y-1
5
Aug
-15
No
v-1
5
Feb
-16
Ma
y-1
6
Aug
-16
No
v-1
6
Feb
-17
Ma
y-1
7
Aug
-17
No
v-1
7
Feb
-18
ytd y/y %
FAI ytd growth
.00
5.00
10.00
15.00
20.00
25.00
30.00
35.00
40.00
Feb
-12
Ju
n-1
2
Oct-
12
Feb
-13
Ju
n-1
3
Oct-
13
Feb
-14
Ju
n-1
4
Oct-
14
Feb
-15
Ju
n-1
5
Oct-
15
Feb
-16
Ju
n-1
6
Oct-
16
Feb
-17
Ju
n-1
7
Oct-
17
Feb
-18
Public FAI Private FAI Total FAI
% ytd y/y
Convergence of CPI and PPI
is set to continue this year

China Economic Outlook – Second quarter 2018 7
and CPI will continue this year. CPI is expected to trend up gradually after the food-prices rebound from the
previous low level. Meanwhile, the PPI will gradually slow its pace as the supply-side reform dissipates. Thus,
supply-side shocks caused by overcapacity elimination are likely to have diminishing marginal impact on price
levels as investors have already factored it into their expectations.
Chart 2.7 CPI picked up signif icantly mainly driven by
seasonal effect
Chart 2.8 PPI and CPI started to converge
Source: BBVA Research and CEIC Source: BBVA Research and CEIC
Monetary prudence continues with nuanced changes in regulatory tightening
The continuing prudent monetary policy with tightening bias has maintained the effect to contain credit boom. M2
growth marginally increased to 8.8% y/y from 8.6% y/y in January (consensus: 8.7% YoY), which remains at a
comparatively low level. (Figure 2.9).
Meanwhile, the growth of new loans and total social financing also
decreased significantly in February from the January readings. This is partly due to the seasonal effect, as the new yuan loans and total social financing
always picked in January as banks release the lending quota at the
beginning of the year. But they are still lower than the last year February
readings. In particular, total social financing declined to RMB 1,170 billion (prior: RMB 3,060 billion; consensus:
RMB 1,066.5 billion) in February and New yuan loans also dropped to RMB 839.3 bn (prior: RMB 2,900 billion;
consensus: RMB 900 billion). (Figure 2.10)
The low credit data in February also reflected the effect of financial sector deleveraging as banks were forced to
reduce their shadow banking activities off their balance sheets. (Figure 2.10) Meanwhile, enterprises and
household also had lower capital demand due to the ongoing corporate deleveraging and housing market
tightening. We predict M2 growth will maintain at a moderated level in 2018 as the financial tightening continues
this year as indicated by the recently closed “two sessions”.
Some nuanced changes emerged at the front of regulatory tightening as the authorities sought to ensure the
smoothness through the course of financial deleveraging. In particular, the authorities continued to keep high
pressure on bank-related shadow banking activities while enhance banks’ capacity to withstand shocks from
-2
-1
0
1
2
3
4
5
6
7
Feb
-11
May-1
1A
ug
-11
No
v-1
1F
eb
-12
May-1
2A
ug
-12
No
v-1
2F
eb
-13
May-1
3A
ug
-13
No
v-1
3F
eb
-14
May-1
4A
ug
-14
No
v-1
4F
eb
-15
May-1
5A
ug
-15
No
v-1
5F
eb
-16
May-1
6A
ug
-16
No
v-1
6F
eb
-17
May-1
7A
ug
-17
No
v-1
7F
eb
-18
% yoy
Food Non-food CPI Inflation
-10
-8
-6
-4
-2
0
2
4
6
8
10
No
v-1
2
Feb
-13
Ma
y-1
3
Aug
-13
No
v-1
3
Feb
-14
Ma
y-1
4
Aug
-14
No
v-1
4
Feb
-15
Ma
y-1
5
Aug
-15
No
v-1
5
Feb
-16
Ma
y-1
6
Aug
-16
No
v-1
6
Feb
-17
Ma
y-1
7
Aug
-17
No
v-1
7
Feb
-18
Producer Price Index Consumer Price Index
% yoy
Credit data outturn dropped
significantly in February

China Economic Outlook – Second quarter 2018 8
regulatory tightening by applying certain forbearance and encouraging banks to replenish their capital. Those
measures include: (i) The “two sessions” did not set any figure target for M2, as the ongoing financial deleveraging
might make the M2 more volatile. (ii) CBRC deployed regulatory forbearance by easing rules requiring lenders to
set aside provisions against losses on bad loans and reducing the minimum NPL coverage ratio from 150% to 120%; in addition, CBRC also reduced the minimum LLR cover of total loans from 2.5% to 1.5%. (iii) PBoC
encouraged banks to issue CoCo bonds to supplement capital ahead of the tighter international regulatory
standards of TLAC that will come into effect from January 1st ,2019.
Chart 2.9 M2 grow th marginally picked up in February Chart 2.10 Shadow banking activities shrank
Source: BBVA Research and CEIC Source: BBVA Research and CEIC
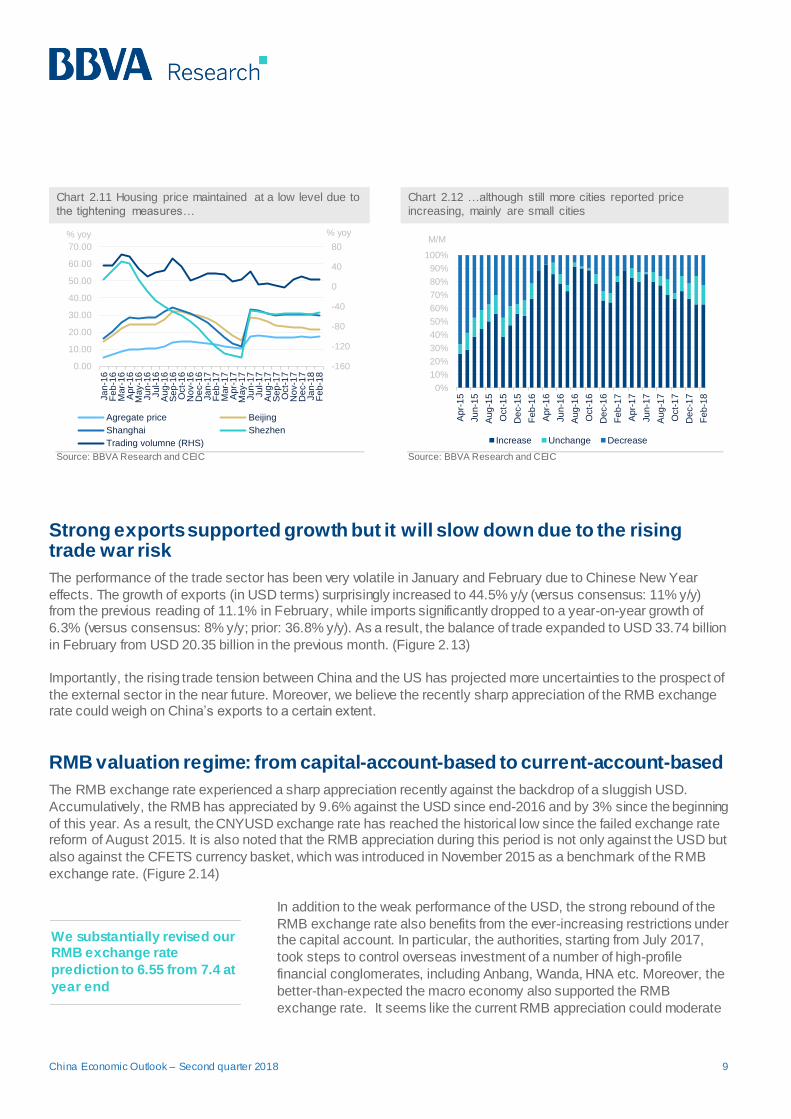
Housing markets continued to be sluggish due to the tightening measures
The tightening measures on the property market have effectively moderated price increases and frozen the trading
volume in Tier 1 cities3 (Figure 2.11). Although the housing price seems like to pick up a bit from the regional trough starting from mid-2017, it still remains at a sluggish level. On the other hand, there are still much more cities
reporting housing price increasing than the cities reporting decreasing, mainly are smaller cities. (Figure 2.12)
However, as more local authorities started to deploy tightening measures in cities other than tier 1, housing
bubbles seem to ease further. We predict that housing price will be staying in the moderation region this year.
On top of imposing home purchase restrictions, the authorities also use financial tools to contain housing bubbles, such as increasing the interest rate of mortgage loans. Moreover, the authorities particularly forbid home buyers
from borrowing short-term loans to pay for their down payment, in a bid to keep household leverage at a
manageable level. Altogether, although the housing market tightening measures helped to ease housing bubble
and maintain financial stability, we believe that housing market cooling down will drag on growth this year.
3: Starting f rom January 2018, NBS has cancelled the statistical indicators for the sales price of affordable housing and only compiled and released the sales price index f or newly constructed commercial residential buildings. No sales price index for newly constructed residential buildings was compiled.
0
5
10
15
20
25
30
35
40
45
Sep
-00
Aug
-01
Ju
l-02
Ju
n-0
3
Ma
y-0
4
Apr-
05
Mar-
06
Feb
-07
Ja
n-0
8
De
c-0
8
No
v-0
9
Oct-
10
Sep
-11
Aug
-12
Ju
l-13
Ju
n-1
4
Ma
y-1
5
Apr-
16
Mar-
17
Feb
-18
Money Supply M1 Money Supply M2
y/y %
6
8
10
12
14
16
18
-0.5
0.0
0.5
1.0
1.5
2.0
2.5
3.0
3.5
4.0
Oct-
15
De
c-1
5
Feb
-16
Apr-
16
Ju
n-1
6
Aug
-16
Oct-
16
De
c-1
6
Feb
-17
Apr-
17
Ju
n-1
7
Aug
-17
Oct-
17
De
c-1
7
Feb
-18
RMB trn
Other Non-financial enterprise equity
Net corporate bond Bank acceptance
Trust loan Entrusted loan
New loan (FX) New loan (RMB)
Bank credit growth (RHS)
% yoy
China Economic Outlook – Second quarter 2018 9
Chart 2.11 Housing price maintained at a low level due to
the tightening measures… Chart 2.12 …although still more cities reported price
increasing, mainly are small cities
Source: BBVA Research and CEIC Source: BBVA Research and CEIC
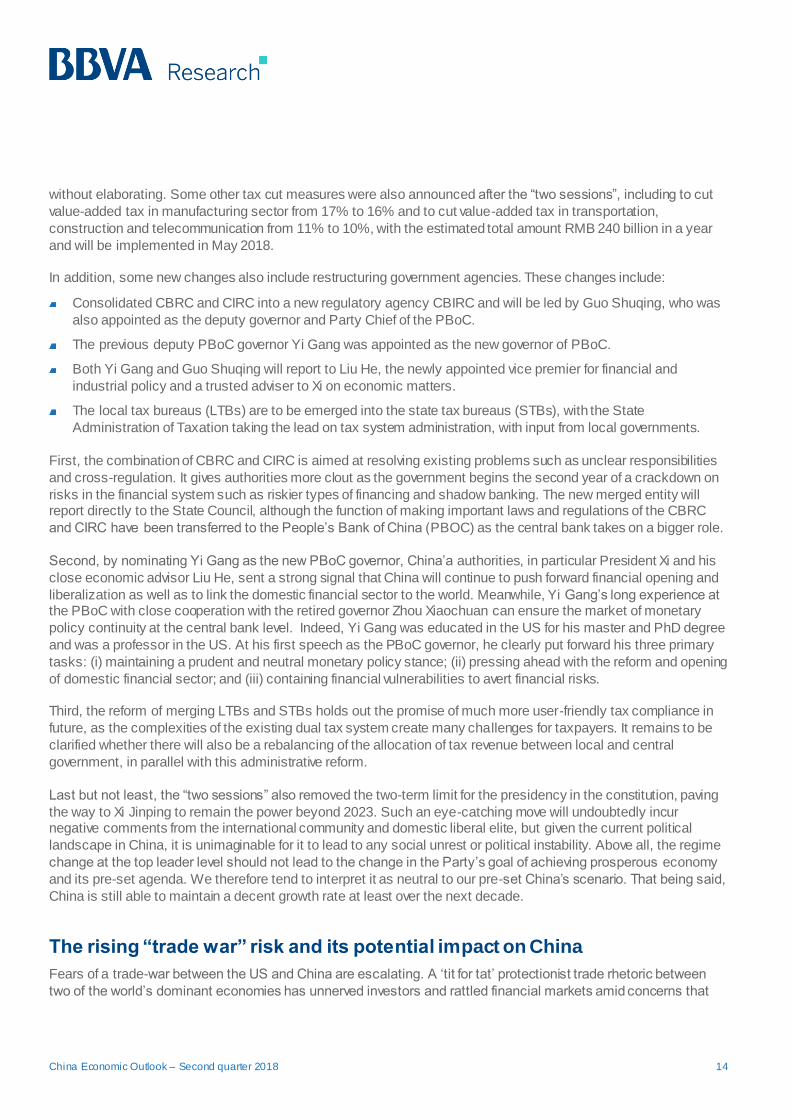
Strong exports supported growth but it will slow down due to the rising trade war risk
The performance of the trade sector has been very volatile in January and February due to Chinese New Year
effects. The growth of exports (in USD terms) surprisingly increased to 44.5% y/y (versus consensus: 11% y/y) from the previous reading of 11.1% in February, while imports significantly dropped to a year-on-year growth of
6.3% (versus consensus: 8% y/y; prior: 36.8% y/y). As a result, the balance of trade expanded to USD 33.74 billion
in February from USD 20.35 billion in the previous month. (Figure 2.13)
Importantly, the rising trade tension between China and the US has projected more uncertainties to the prospect of
the external sector in the near future. Moreover, we believe the recently sharp appreciation of the RMB exchange rate could weigh on China’s exports to a certain extent.
RMB valuation regime: from capital-account-based to current-account-based
The RMB exchange rate experienced a sharp appreciation recently against the backdrop of a sluggish USD.
Accumulatively, the RMB has appreciated by 9.6% against the USD since end-2016 and by 3% since the beginning
of this year. As a result, the CNYUSD exchange rate has reached the historical low since the failed exchange rate reform of August 2015. It is also noted that the RMB appreciation during this period is not only against the USD but
also against the CFETS currency basket, which was introduced in November 2015 as a benchmark of the RMB
exchange rate. (Figure 2.14)
In addition to the weak performance of the USD, the strong rebound of the
RMB exchange rate also benefits from the ever-increasing restrictions under the capital account. In particular, the authorities, starting from July 2017,
took steps to control overseas investment of a number of high-profile
financial conglomerates, including Anbang, Wanda, HNA etc. Moreover, the
better-than-expected the macro economy also supported the RMB
exchange rate. It seems like the current RMB appreciation could moderate
-160
-120
-80
-40
0
40
80
0.00
10.00
20.00
30.00
40.00
50.00
60.00
70.00
Ja
n-1
6F
eb
-16
Mar-
16
Apr-
16
May-1
6Ju
n-1
6Ju
l-16
Aug
-16
Sep
-16
Oct-
16
No
v-1
6D
ec-1
6Ja
n-1
7F
eb
-17
Mar-
17
Apr-
17
May-1
7Ju
n-1
7Ju
l-17
Aug
-17
Sep
-17
Oct-
17
No
v-1
7D
ec-1
7Ja
n-1
8F
eb
-18
Agregate price Beijing
Shanghai Shezhen
Trading volumne (RHS)
% yoy % yoy
0%
10%
20%
30%
40%
50%
60%
70%
80%
90%
100%
Apr-
15
Ju
n-1
5
Aug
-15
Oct-
15
De
c-1
5
Feb
-16
Apr-
16
Ju
n-1
6
Aug
-16
Oct-
16
De
c-1
6
Feb
-17
Apr-
17
Ju
n-1
7
Aug
-17
Oct-
17
De
c-1
7
Feb
-18
M/M
Increase Unchange Decrease
We substantially revised our RMB exchange rate
prediction to 6.55 from 7.4 at
year end

China Economic Outlook – Second quarter 2018 10
the flare-up tension of the trade war between the US and China to a certain extent, while some market experts also
interpret it as the authorities’ strategy to compromise to the US in order to avoid the escalation of the trade war.
With the capital account under tight grip, the recent movements of RMB mainly reflect current account changes.
Based on the above, we revise our end-year RMB exchange rate projection to 6.40 from 6.75 previously, reflecting both recent strong CNY exchange rate and the new policy tendency.
Chart 2.13 RMB to USD appreciated signif icantly in the
recent months Chart 2.14 Divergence of exports and imports at the year
end
Source: BBVA Research and CEIC Source: BBVA Research and CEIC
Temporary decline of foreign reserve could not be over-interpreted
Foreign reserves decreased to USD 3,134.48 billion in February, down from USD 3,161.46 billion in the previous
month, the first time of declining from 12-month growth in a row. (Figure 2.15) In particular, we estimate that capital outflows amounted to USD 41.7 billion in February, up from USD 25.14
billion in the previous month. (Figure 2.16).
However, there is no need to over-interpret the temporary foreign reserve
decline in February. One possible reason might be that the authorities have
steadily relaxed OFDI in order to support the “One Belt One Road” initiatives. Altogether, we believe the “two –way” change of foreign reserve
and capital outflow will be the main pattern in the future.
-40
-30
-20
-10
0
10
20
30
40
50
60
-30
-20
-10
0
10
20
30
40
50
De
c-1
4
Feb
-15
Apr-
15
Ju
n-1
5
Aug
-15
Oct-
15
De
c-1
5
Feb
-16
Apr-
16
Ju
n-1
6
Aug
-16
Oct-
16
De
c-1
6
Feb
-17
Apr-
17
Ju
n-1
7
Aug
-17
Oct-
17
De
c-1
7
Feb
-18
USD bn% yoy
Trade balance Exports growth Imports growth
0.13
0.135
0.14
0.145
0.15
0.155
0.16
0.165
88
90
92
94
96
98
100
102
104
Ju
l-16
Sep
-16
No
v-1
6
Ja
n-1
7
Mar-
17
May-1
7
Ju
l-17
Sep
-17
No
v-1
7
Ja
n-1
8
Mar-
18
CFETS Currency Basket(LHS) USD/CNY(RHS)
Under the strong RMB
exchange rate, we expect foreign reserve will revert to
increase in the future

China Economic Outlook – Second quarter 2018 11
Chart 2.15 RMB to USD appreciated signif icantly in the
recent months Chart 2.16 Divergence of exports and imports at the year
end
Source: BBVA Research and CEIC Source: BBVA Research and CEIC
6.00
6.100
6.200
6.300
6.400
6.500
6.600
6.700
6.800
6.900
7.000
500
1,000
1,500
2,000
2,500
3,000
3,500
4,000
4,500
Feb
-15
May-1
5
Aug
-15
No
v-1
5
Feb
-16
May-1
6
Aug
-16
No
v-1
6
Feb
-17
May-1
7
Aug
-17
No
v-1
7
Feb
-18
Foreign Reserves Exchange Rate against US$(RHS)
USD bn
-200
-150
-100
-50
0
50
100
150
2/2
010
8/2
010
2/2
011
8/2
011
2/2
012
8/2
01
2
2/2
013
8/2
013
2/2
014
8/2
014
2/2
015
8/2
015
2/2
01
6
8/2
016
2/2
017
8/2
017
2/2
018
China's capital outflow
USD bn

China Economic Outlook – Second quarter 2018 12
3. Will Trump’s trade war disturb the domestic reforms set by “Two Sessions”?
We maintain our forecasting for GDP growth while rising CPI prediction
China’s 6.9% growth in 2017 was actually better-than-expected, although the market predicts growth moderation
under the framework of financial deleveraging and industrial de-capacity. However, we continue our forecast that
signs of moderation will emerge this year due the authorities’ continuing policy tightening, including monetary
prudence and regulatory efforts to curb shadow banking activities and overheating property market, together with
the de-capacity in the real sector.
Accordingly, we maintain our 2018 growth forecast at 6.3% and 2019 forecast at 6%, reflecting the strong 2017
growth and mitigated financial risks. However, they are still somewhat lower than the market consensus
(Bloomberg consensus: 6.5% for 2018 and 6.2% for 2019) and the authorities’ growth target of 2018 is 6.5% as
well. Nevertheless, we anticipate that the authorities broadly maintain the policy mix this year over the concern of
financial stability, in particular, a prudent monetary policy and a comparatively easing fiscal policy.
By categories, we predict consumption will contribute to around 4.5% (versus: 4.1% in 2017) for GDP growth,
dominating investment’s contribution of 1.6% (versus: 2.2% in 2017) and net export’s contribution at 0.2% (versus:
0.5% in 2017) in this year.
Regarding inflation, we marginally increase our 2018 monthly average projection of CPI to 2.3% in 2018 and 2.5%
in 2019 (Bloomberg: 2.3% for 2018 and 2.3% for 2019) mainly due to food prices pick up (Figure 3.2). Looking
ahead, the CPI and PPI will finally converge in the long term. CPI is expected to trend up gradually after the food-
prices rebound from the current low level. Meanwhile, the PPI will gradually slow its pace as the supply -side reform
dissipates. That being said, supply-side shocks caused by overcapacity elimination are likely to have diminishing
marginal impact on price levels as investors gradually factor it into their expectations.
Chart 3.1 We maintain our 2018 GDP forecast at 6.3%
and 2019 GDP at 6% Chart 3.2 We marginally raise our CPI forecast to 2.3% for
2018 and to 2.5% for 2019
Source: BBVA Research and CEIC Source: BBVA Research and CEIC
Forecast
4%
5%
6%
7%
8%
9%
10%
De
c-1
2
Ju
n-1
3
De
c-1
3
Ju
n-1
4
De
c-1
4
Ju
n-1
5
De
c-1
5
Ju
n-1
6
De
c-1
6
Ju
n-1
7
De
c-1
7
Ju
n-1
8
De
c-1
8
Ju
n-1
9
De
c-1
9
Ju
n-2
0
De
c-2
0
Ju
n-2
1
De
c-2
1
Baseline GDP growth
y/y %
Forecast
0.0
0.5
1.0
1.5
2.0
2.5
3.0
3.5
4.0
4.5
5.0
De
c-1
2
Ju
n-1
3
De
c-1
3
Ju
n-1
4
De
c-1
4
Ju
n-1
5
De
c-1
5
Ju
n-1
6
De
c-1
6
Ju
n-1
7
De
c-1
7
Ju
n-1
8
De
c-1
8
Ju
n-1
9
De
c-1
9
Ju
n-2
0
De
c-2
0
Ju
n-2
1
De
c-2
1
Baseline CPI growth
y/y %

China Economic Outlook – Second quarter 2018 13
Table 3.1 Economic indicators forecasting
2016 2017 2018 (F) 2019 (F) 2020 (F) 2021 (F)
GDP (%, YoY) 6.7 6.9 6.3 6 5.8 5.5
Inflation (average, %) 2 1.7 2.3 2.5 3 3
Fiscal balance (% of GDP) -3 -3 -3 -4 -4 -4
Current account (% of GDP) 2.5 1.4 1.3 1.3 1.2 1.2
Policy rate (%) 4.35 4.35 4.35 4.1 3.6 3.6
Exchange rate (CNY/USD) 6.95 6.5 6.4 6.55 6.6 6.7
Source: BBVA Research and CEIC
“Two Sessions” and policy outlook of 2018
On March 5th, 3,000 newly elected Chinese lawmakers convened at Beijing for about 10 days of parliamentary
pageantry, the National People’s Congress (NPC). The NPC runs alongside a meeting of China’s top political
advisory body, the Chinese People’s Political Consultative Conference (CPPCC). Together they’re known as “two
sessions”. The “two sessions” were concluded in the middle of March. The meetings set up a series of economic targets of this year, in addition, it announced the authorities’ monetary and fiscal policy stance this year. Some
government agency reform agenda, together with the new appointments of government officials, was also
promulgated during the meeting.
First, the authorities set a series of economic targets for 2018, including:
Growth rate: Around 6.5 percent this year, the same as in 2017.
Income growth per capita will be almost together with the GDP growth rate.
CPI: Around 3%, which is the same as of the previous target which should be treated as a cap as in the past.
M2: No specific target figure announced this year as the ongoing financial deleveraging could make M2 growth
more volatile.
Unemployment rate: below 5.5% for the urban survey unemployment rate; below 4.5% for registered urban
unemployment.
Capacity cut: China to cut steel capacity by 30 million tons this year; to remove 150 million tons coal capacity
Regarding the policy side, monetary policy will continue to be prudent with some tightening bias this year and the
authorities will continue to push forward financial deleveraging in order to prevent systematic financial risks. Fiscal
policy will remain expansionary to offset the financial tightening and capacity reduction. However, the government
announced to reduce fiscal budget to a certain degree so that fiscal budget to GDP ratio will be around 2.6%, which is 0.4% lower than the previous arrangement in 2017.
Moreover, China will implement some tax cut and will steadily push forward the legislative procedures of property
tax. In addition, the authorities will lower import tariffs for vehicles and some consumer goods; will cut taxes for
enterprises by 800 billion yuan (120 billion USD) this year and will lift thresholds for levying personal income taxes,
China Economic Outlook – Second quarter 2018 14
without elaborating. Some other tax cut measures were also announced after the “two sessions”, including to cut
value-added tax in manufacturing sector from 17% to 16% and to cut value-added tax in transportation,
construction and telecommunication from 11% to 10%, with the estimated total amount RMB 240 billion in a year
and will be implemented in May 2018.
In addition, some new changes also include restructuring government agencies. These changes include:
Consolidated CBRC and CIRC into a new regulatory agency CBIRC and will be led by Guo Shuqing, who was
also appointed as the deputy governor and Party Chief of the PBoC.
The previous deputy PBoC governor Yi Gang was appointed as the new governor of PBoC.
Both Yi Gang and Guo Shuqing will report to Liu He, the newly appointed vice premier for financial and
industrial policy and a trusted adviser to Xi on economic matters.
The local tax bureaus (LTBs) are to be emerged into the state tax bureaus (STBs), with the State
Administration of Taxation taking the lead on tax system administration, with input from local governments.
First, the combination of CBRC and CIRC is aimed at resolving existing problems such as unclear responsibilities
and cross-regulation. It gives authorities more clout as the government begins the second year of a crackdown on
risks in the financial system such as riskier types of financing and shadow banking. The new merged entity will report directly to the State Council, although the function of making important laws and regulations of the CBRC
and CIRC have been transferred to the People’s Bank of China (PBOC) as the central bank takes on a bigger role.
Second, by nominating Yi Gang as the new PBoC governor, China’a authorities, in particular President Xi and his
close economic advisor Liu He, sent a strong signal that China will continue to push forward financial opening and
liberalization as well as to link the domestic financial sector to the world. Meanwhile, Yi Gang’s long experience at the PBoC with close cooperation with the retired governor Zhou Xiaochuan can ensure the market of monetary
policy continuity at the central bank level. Indeed, Yi Gang was educated in the US for his master and PhD degree
and was a professor in the US. At his first speech as the PBoC governor, he clearly put forward his three primary
tasks: (i) maintaining a prudent and neutral monetary policy stance; (ii) pressing ahead with the reform and opening
of domestic financial sector; and (iii) containing financial vulnerabilities to avert financial risks.
Third, the reform of merging LTBs and STBs holds out the promise of much more user-friendly tax compliance in
future, as the complexities of the existing dual tax system create many challenges for taxpayers. It remains to be
clarified whether there will also be a rebalancing of the allocation of tax revenue between local and central
government, in parallel with this administrative reform.
Last but not least, the “two sessions” also removed the two-term limit for the presidency in the constitution, paving
the way to Xi Jinping to remain the power beyond 2023. Such an eye-catching move will undoubtedly incur negative comments from the international community and domestic liberal elite, but given the current political
landscape in China, it is unimaginable for it to lead to any social unrest or political instability. Above all, the regime
change at the top leader level should not lead to the change in the Party’s goal of achieving prosperous economy
and its pre-set agenda. We therefore tend to interpret it as neutral to our pre-set China’s scenario. That being said,
China is still able to maintain a decent growth rate at least over the next decade.
The rising “trade war” risk and its potential impact on China
Fears of a trade-war between the US and China are escalating. A ‘tit for tat’ protectionist trade rhetoric between
two of the world’s dominant economies has unnerved investors and rattled financial markets amid concerns that

China Economic Outlook – Second quarter 2018 15
the current trade skirmish, if it escalates into a full-blown trade war could upend global growth momentum and
threaten financial stability.
The US President Trump has implemented a series of restrictive measures on China’s exports to the US since the
beginning of the year. On top of imposing the tariffs on China’s exported solar panels, washing machines, aluminium foil, steel and aluminium in the previous months, the US also announced a list of 1,333 Chinese
products exported to the US on which the US administration plans to levy 25% punitive tariff. Total value of these
Chinese exports amounted to USD 50 billion in 2017.
China stroke back swiftly by announcing its retaliatory list of US exports with the same value of USD 50 billion and
vowed to take “whatever it takes” to defend national interest.
Although both sides still appeared to play tough at the current stage, we deem that the chance of them to reach
some agreement to avert a full-blown trade is still large. In particular, China has offered to buy more
semiconductors from the US by diverting some purchases from South Korean and Taiwanese manufacturers, in an
effort to help reduce annual USD 375 billion merchandise trade surplus with the US. Moreover, China also
promised to further open China’s financial services sector and reduce Chinese tariffs on imported cars.
That being said, the risk of full-blown trade war with the USD is not in our base scenario although trade skirmishes between two largest country economies could linger for quite a while. In theory, these skirmishes should not have a
large impact on China’s growth and even its gigantic export sector. For example, direct steel export from China to
the US is not large, taking around 3.2% of the US total steel imports.
A more worrisome situation is Trump’s trade war might disturb the domestic reform progress. As re-emphasized in
the “two sessions”, the authorities will continue to push forward the financial deleveraging and de-capacity in the real sector. The market worries that if the authorities might change their policy stance and stimulate domestic
demand again if they exaggerate the change of a full-blown trade war. Fortunately, the authorities haven’t shown
any sign in this respect.
All in all, we expect China and the US will eventually reach an agreement to avert a trade war despite recently
escalated rhetoric. Moreover, China needs to push forward deleveraging in over-capacity industries as well as other important items on its reform agenda including SOE reforms, financial regulatory framework etc.

China Economic Outlook – Second quarter 2018 16
4. External risks are on the rise
External risks are on the rise recently. The external demand is subject to headwinds from rising trade protectionism
from the US. Although till now there is still no specific clue whether the trade war will actually happen, market
sentiments have already turned negative regarding China’s exports and exchange rate etc.
At the current stage, although the moves have fuelled fears that the situation could escalate into a full -blown trade
war between the world's two largest economies, Chinese authorities, together with their US counterparts, have
been actively seeking for solutions to avoid the trade war with the US. The current negotiations are surrounding the
following perspectives: the US wants Beijing to reduce tariffs on American cars, increase spending on US
semiconductors and provide greater access to the Chinese financial sector; also, the US wants China to do a lot more to open up its vast economy to US businesses and bring down the massive trade deficit between the two
countries; in addition, Trump has set a target of cutting the deficit in goods with China by USD 100 billion. Thus, the
probability of the trade war is actually depending on the negotiation result of the two sides.
By calculating the value-added part of China’s exports to the US, we estimate that among the USD 50 billion
amount of China’s exports to the US which are subject to Trump’s tariff imposing, around USD 30 billion are value-added production in China (other USD 20 billion are from the upstream countries which have supply chain with
China). This will lead to around 0.45% GDP decreasing with a rough assumption that net exports to the US will
decrease by tariff-subjective amount.
We expect China will respond the trade protectionist measures in a relatively limited fashion which would limit the
scope of the conflict of the two largest economies, although we need to cautiously watch the progress of this issue
these days.
In addition, the large-scale US tax cuts have enhanced the U.S. position against other industrialized economies.
And the US FED interest rate hike, although most part of which has been priced in among the market participants,
might trigger rebalancing of the global monetary policy stance and a following-up interest rate hike globally as
widely discussed in the market.
Risks regarding on growth are also from the domestic policy side. The on-going deleveraging in the real economy and financial sector, with its original intention of mitigating the over-capacity and financial instability respectively,
might drag on growth in the medium term. These policy measures mainly include supply -side deleveraging as well
as cooling down the housing market and shadow banking. Altogether, the authorities need to find a balance and
choose an appropriate pace between pushing forward the deleveraging progress and maintaining a sustainable
growth momentum. In this respect, market participants should guard against the risk of over-tightening stemming from the overconfidence of policymakers or the uncoordinated policy conduct among monetary, fiscal and supply-
side policy initiatives.

China Economic Outlook – Second quarter 2018 17
IMPORTANT DISCLOSURES
The BBVA Group companies that have participated in preparing or contributed information, opinions, estimates,
forecasts or recommendations to this report are identified by the location(s) of the author(s) listed on the first page as follows: 1) Madrid, London or Europe = Banco Bilbao Vizcaya Argentaria, S.A., including its E.U. branches
(hereinafter called ‘BBVA’); 2) Mexico City = BBVA Bancomer, S.A. Institución de Banca Múltiple, Grupo Financiero
BBVA Bancomer (hereinafter called ‘BBVA Bancomer’); 3) New York = BBVA Securities, Inc. (hereinafter called
"BBVA Securities"); 4.) New York Branch = BBVA, New York branch; 5.) Lima = BBVA Continental; 6.) Bogota =
BBVA Colombia S.A.; 7.) Santiago = BBVA Chile S.A.; 8.) Hong Kong = BBVA, Hong Kong branch, 9.) Istanbul = Garanti Securities.
For recipients in the European Union, this document is distributed by BBVA, a bank supervised by Banco de
España and by Spain’s Stock Exchange Commission (CNMV), and registered with Banco de España with number
0182.
For recipients in Hong Kong, this document is distributed by BBVA, which Hong Kong branch is supervised by
the Hong Kong Monetary Authority.
For recipients in Mexico, this document is distributed by BBVA Bancomer, a bank supervised by the Comisión
Nacional Bancaria y de Valores (Mexico’s SEC).
For recipients in Peru, this document is distributed by BBVA Continental, a bank supervised by the
Superintendencia de Banca, Seguros y Administradoras Privadas de Fondos de Pensiones.
For recipients in Singapore, this document is distributed by BBVA, which Singapore branch is supervised by the Monetary Authority of Singapore.
For recipients in the USA, research on products other than swaps, or equity securities and equity derivatives
prepared by BBVA, is distributed by BBVA Securities, a subsidiary of BBVA registered with and supervised by the
U.S. Securities and Exchange Commission and a member of the Financial Industry Regulatory Authority (“FINRA”)
and the Securities Investor Protection Corporation. U.S. persons wishing to execute any transactions should do so only by contacting a representative of BBVA Securities in the U.S. Unless local regulations provide otherwise, non-
U.S. persons should contact and execute transactions through a BBVA branch or affiliate in their home jurisdiction.
Research on swaps is distributed by BBVA, a swaps dealer registered with and supervised by the Commodity
Futures Trading Commission (“CFTC”). U.S. persons wishing to execute any transactions should do so only by
contacting a representative of BBVA. Unless local regulations provide otherwise, non-U.S. persons should contact
and execute transactions through a BBVA branch or affiliate in their home jurisdiction.
Research prepared by BBVA on equity securities and equity derivatives is distributed by BBVA to “major U.S.
institutional investors” based on an exemption from registration provided by Rule 15a-6 of the U.S. Securities
Exchange Act of 1934, as amended (the “Exchange Act”). BBVA is not a registered broker-dealer in the United
States and is not subject to U.S. rules on preparing research or independence of research analysts.
BBVA and BBVA Group companies or affiliates (art. 42 of the Royal Decree of 22 August 1885 Code of Commerce), are subject to the BBVA Group Policy on Conduct for Security Market Operations which establishes
common standards for activity in these entities’ markets, but also specifically for analysis and analysts. This BBVA
policy is available for reference on the following website: www.bbva.com.

China Economic Outlook – Second quarter 2018 18
Analysts residing outside the U.S. who have contributed to this report may not be registered with or qualified as
research analysts by FINRA or the New York Stock Exchange and may not be considered “associated persons” of
BBVA Securities (as such term is construed by the rules of FINRA). As such, they may not be subject to FINRA
Rule 2241 or 2242 restrictions on communications with subject companies, public appearances and trading of securities held in research analysts’ accounts.
BBVA is subject to Internal Standards of Conduct on the Security Markets, which detail the standards of
the above-mentioned overall policy for the EU. Among other regulations, they include rules to prevent and
avoid conflicts of interests with the ratings given, including information barriers. These Internal Standards
of Conduct on the Security Markets are available for reference in the ‘Corporate Governance’ section of the following website: www.bbva.com.
BBVA Bancomer is subject to a Code of Conduct and to Internal Standards of Conduct for Security Market
Operations, which details the standards of the above-mentioned overall policy for Mexico. Among other
regulations, it includes rules to prevent and avoid conflicts of interests with the ratings given, including
information barriers. This Code and the Internal Standards are available for reference in the ‘Grupo BBVA
Bancomer’ subsection of the ‘Conócenos’ menu of the following website : www.bancomer.com.
BBVA Continental is subject to a Code of Conduct and to a Code of Ethics for Security Market Operations,
which details the standards of the above-mentioned overall policy for Peru. Among other regulations, it
includes rules to prevent and avoid conflicts of interests with the ratings given, including information
barriers. Both Codes are available for reference in the ‘Nuestro Banco’ menu of the following website:
https://www.bbvacontinental.pe/meta/conoce-bbva/.
BBVA Securities is subject to a Capital Markets Code of Conduct, which details the standards of the above-
mentioned overall policy for USA. Among other regulations, it includes rules to prevent and avoid conflicts
of interests with the ratings given, including information barriers.
Exclusively for Recipients Resident in Mexico
BBVA Bancomer acts as a market maker/specialist in: MexDer Future Contracts (US dollar [DEUA], 28-day TIIEs [TE28], TIIE Swaps, 91-day CETES [CE91]), Bonos M, Bonos M3, Bonos M10, BMV Price and Quotations
Index (IPC), Options Contracts (IPC, shares in América Móvil, Cemex, CPO, Femsa UBD, Gcarso A1, Telmex L)
and Udibonos.
BBVA Bancomer, and, as applicable, its affiliates within BBVA Bancomer Financial Group, may hold from time to
time investments in the securities or derivative financial instruments with underlying securities covered in this
report, which represent 10% or more of its securities or investment portfolio, or 10% or more of the issue or underlying of the securities covered.

China Economic Outlook – Second quarter 2018 19
DISCLAIMER
This document has been prepared by BBVA Research Department, it is provided for information purposes only and
expresses data, opinions or estimations regarding the date of issue of the report, prepared by BBVA or obtained from or based on sources we consider to be reliable, and have not been independently verified by BBVA.
Therefore, BBVA offers no warranty, either express or implicit, regarding its accuracy, integrity or correctness.
Estimations this document may contain have been undertaken according to generally accepted methodologies and
should be considered as forecasts or projections. Results obtained in the past, either positive or negative, are no
guarantee of future performance.
This document and its contents are subject to changes without prior notice depending on variables such as the
economic context or market fluctuations. BBVA is not responsible for updating these contents or for giving notice of
such changes.
BBVA accepts no liability for any loss, direct or indirect, that may result from the use of this document or its
contents.
This document and its contents do not constitute an offer, invitation or solicitation to purchase, divest or enter into any interest in financial assets or instruments. Neither shall this document nor its contents form the basis of any
contract, commitment or decision of any kind.
In regard to investment in financial assets related to economic variables this document may cover, readers should
be aware that under no circumstances should they base their investment decisions in the information contained in
this document. Those persons or entities offering investment products to these potential investors are legally required to provide the information needed for them to take an appropriate investment decision.
The content of this document is protected by intellectual property laws. It is forbidden its reproduction,
transformation, distribution, public communication, making available, extraction, reuse, forwarding or use of any
nature by any means or process, except in cases where it is legally permitted or expressly authorized by BBVA.

CONTACT DETAILS:
BBVA Research: Azul Street. 4. La Vela Building – 4th and 5th floor. 28050 Madrid (Spain). Tel.:+34 91 374 60 00 and +34 91 537 70 00 / Fax: +34 91 374 30 25 - [email protected] www.bbvaresearch.com
This report has been produced by the China Unit
Chief Economist for Asia Le Xia [email protected]
Jinyue Dong
Betty Huang
Sumedh Deorukhkar
BBVA Research
Chief Economist BBVA Group Jorge Sicil ia Serrano
Macroeconomic Analysis Rafael Doménech
Digital Economy
Alejandro Neut
Global Macroeconomic
Scenarios
Miguel Jiménez [email protected]
Global Financial Markets
Sonsoles Castil lo s.castil [email protected]
Long-Term Global Modelling and
Analysis Julián Cubero
Innovation and Processes Oscar de las Peñas
Financial Systems and Regulation Santiago Fernández de Lis
Digital Regulation and Trends
Álvaro Martín
Regulation
Ana Rubio
Financial Systems
Olga Cerqueira
Spain and Portugal Miguel Cardoso
United States Nathaniel Karp
Mexico Carlos Serrano
Middle East, Asia and
Big Data Álvaro Ortiz
Turkey
Álvaro Ortiz
Asia
Le Xia
South America Juan Manuel Ruiz
Argentina
Gloria Sorensen
Chile
Jorge Selaive
Colombia
Juana Téllez
Peru
Hugo Perea
Venezuela
Julio Pineda